Impact Evaluation of the Cambodia Integrated Nutrition ...
122
IMPACT EVALUATION OF THE CAMBODIA INTEGRATED NUTRITION, HYGIENE,AND SANITATION PROJECT EVALUATION REPORT MAY 2020 This publication was produced for review by the United States Agency for International Development. T It hi wa s pu s bli pr cat e io p n a w r a e s d pr by odu T ced et f r o a r r T ev ec iew h. by the United States Agency for International Development. It was prepared by Tetra Tech.
Transcript of Impact Evaluation of the Cambodia Integrated Nutrition ...

IMPACT EVALUATION OF THE CAMBODIA INTEGRATED NUTRITION, HYGIENE,AND SANITATION PROJECT EVALUATION REPORT
MAY 2020
This publication was pr oduced for review by the United States Agency for I nternational Development. TIt h iwas pus b liprcateiopna wraesd p rby oduTcedet froa r rTeveciewh . b y the United States Agency for International Development. It was prepared by Tetra Tech.


ABSTRACT
This impact evaluation consists of a factorial randomized controlled trial to evaluate the impact of integrating sanitation and hygiene interventions along with nutrition programming on child growth in rural Cambodia. Following randomized assignment of communes (clusters) to intervention and control groups, a baseline survey, and intervention delivery, we enrolled 4,124 randomly selected children aged one to 28 months from the four study groups: (1) communes receiving a nutrition intervention to support caregivers to provide adequate nutrition for young children [n=817]; (2) communes receiving a sanitation intervention to encourage construction and use of latrines [n=792]; (3) communes receiving both the sanitation and the nutrition interventions [n=1,055]; and (4) control communes receiving no intervention [n=1,460]. The primary outcome was height-for-age z-score (HAZ), measured on a continuous scale. Secondary outcome measures included prevalence of caregiver-reported diarrhea and other growth measures: weight-for-height z-score (WHZ), weight-for-age z-score (WAZ), and prevalence of stunting. Enrolled children were born after the delivery of interventions across the study area.
We found meaningful gains in child growth attributable to the nutrition intervention when delivered alone or in combination with sanitation programming. The sanitation interventions did not significantly increase sanitation coverage over the strong secular trend in the control group and had no effect on child growth or diarrhea. We found no evidence that combining these sanitation and nutrition interventions resulted in increases in child growth over the nutrition programming alone.
COVER PHOTO: The anthropometry specialist with a young child during the household visit for endline data
collection in Battambang province. Credit: Krisna Seng, Tetra Tech.
Prepared for the United States Agency for International Development by the Water, Sanitation, and Hygiene Partnerships and Learning for Sustainability (WASHPaLS) project under Task Order number AID-OAA-TO-16-00016 of the Water and Development Indefinite Delivery Indefinite Quantity Contract (WADI IDIQ), contract number AID-OAA-I-14-00068.
Tetra Tech Contacts: Morris Is rael, Project Director [email protected]
Jeff Albert, Deputy Project Director [email protected]
Lucia Henry, Project Manager [email protected]
Tetra Tech 1320 North Courthouse Road, Suite 600, Arlington, VA 22 201 Tel: 703 387 2100, Fax: 703 414 5593 www.tetratech.com/intdev

IMPACT EVALUATION OF THE CAMBODIA INTEGRATED NUTRITION, HYGIENE, AND SANITATION PROJECT
EVALUATION REPORT
May 2020
Prepared by:
Dr. Joe Brown (Principal Investigator, Georgia Institute of Technology) Irene Velez (Evaluation Manager, MSI, A Tetra Tech Company) Oliver Cumming (Nutrition and WASH Expert, London School of Hygiene and Tropical Medicine) Amanda Lai (Researcher, Georgia Institute of Technology)
DISCLAIMER
The author’s views expressed in this publication do not necessarily reflect the views of the United States Agency for International Development or the United States Government.

CONTENTS
ACKNOWLEDGEMENTS .................................................................................... i
ACRONYMS ......................................................................................................... ii
EXECUTIVE SUMMARY .................................................................................... iii
1 INTRODUCTION ...................................................................................... 1
2 NOURISH PROJECT BACKGROUND .................................................... 2
3 EVALUATION PURPOSE, AUDIENCE, AND USES ............................ 7
4 EVALUATION QUESTIONS ................................................................... 8
5 EVALUATION DESIGN AND METHODOLOGY ............................... 11
6 DATA COLLECTION ............................................................................. 15
7 DATA ANALYSIS METHODS ............................................................... 19
8 BALANCE BETWEEN TREATMENT AND CONTROL GROUPS AT BASELINE ................................................................................................ 20
9 FINDINGS ................................................................................................ 22
9.1 SUMMARY OF FINDINGS ...................................................................... 22
9.2 HOUSEHOLD CHARACTERISTICS AT ENDLINE .......................... 23
9.3 FIDELITY AND UPTAKE OF INTERVENTIONS .............................. 25
9.4 SANITATION COVERAGE AND PREVALENCE OF OPEN DEFECATION ............................................................................................. 27
9.5 ENVIRONMENTAL HYGIENE ............................................................... 29
9.6 NUTRITION INTERMEDIATE OUTCOMES ..................................... 30
9.7 ALL-CAUSE CHILD MORTALITY AND ILLNESSES ........................ 32
9.8 EFFECT ON CHILD HEALTH OUTCOMES ...................................... 33
10 CONCLUSIONS ...................................................................................... 39
11 RECOMMENDATIONS .......................................................................... 46
ANNEX A: SCOPE OF WORK ......................................................................... 48
ANNEX B: LITERATURE REVIEW .................................................................. 53
ANNEX C: ENDLINE SURVEY INSTRUMENTS ........................................... 57
ANNEX D: DATA CO LLECTION PROCESS AND QUALITY ASSURANCE ........................................................................................... 96
ANNEX E: ANTHROPOMETRY PROTOCOLS ............................................. 99
ANNEX F: EVALUATION TEAM MEMBERS ............................................... 101
ANNEX G: CONFLICT OF INTEREST DISCLOSURE FORMS ................. 103
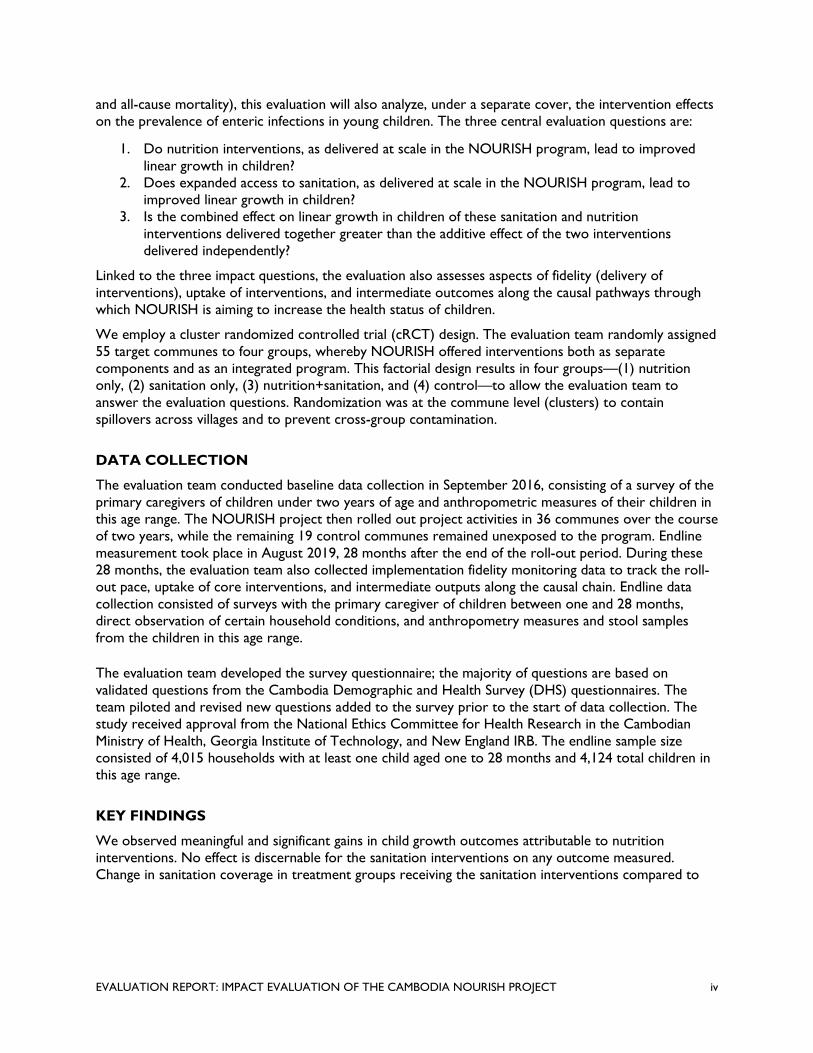
LIST OF TABLES
Table 1: Key Outcome Measures .................................................................................................................................. 9
Table 2: NOURISH Implementation Design for the Impact Evaluation ............................................................. 11
Table 3: Trial Design Timeline ...................................................................................................................................... 12
Table 4: Threshold Exposure Points ........................................................................................................................... 12
Table 5: Data Collection Matrix................................................................................................................................... 15
Table 6: Required Sample .............................................................................................................................................. 17
Table 7: Survey Questionnaire Modules .................................................................................................................... 17
Table 8: Endline Sample Distribution .......................................................................................................................... 18
Table 9: Baseline Characteristics ................................................................................................................................. 20
Table 10: Summary of Key Findings ............................................................................................................................ 22
Table 11: Household Characteristics AT ENDLINE.............................................................................................. 24
Table 12: Intervention Uptake .................................................................................................................................... 26
Table 13: Sanitation Intermediate Outcomes .......................................................................................................... 27
Table 14: Village-Level Sanitation Coverage and Open Defecation ................................................................... 28
Table 15: Environmental Hygiene Outcomes .......................................................................................................... 30
Table 16: Child Nutrition Outcomes .......................................................................................................................... 32
Table 17: All-Cause Mortality ....................................................................................................................................... 33
Table 18: Other Child Illness Symptoms ................................................................................................................... 33
Table 19: Impact Estimates - Mean Differences in Anthropometry between Single Intervention,
Combined Intervention, and Control Groups ........................................................................................... 37
Table 20: Impact Estimates – Prevalence Ratios in Child Growth Measures between Single Intervention,
Combined Intervention, and Control Groups ........................................................................................... 38
LIST OF FIGURES
Figure 1: Grow Together Campaign Focus ................................................................................................................. 4
Figure 2: NOURISH Theory of Change ....................................................................................................................... 6
Figure 3: Measuring Impact along the Causal Chain ................................................................................................ 10
Figure 4: HAZ Mean Difference Between Groups .................................................................................................. 34
Figure 5: WAZ and WHZ Mean Difference Between Groups ............................................................................ 35
Figure 6: Prevalence Ratios of Key Child Health Outcomes in Intervention Groups Compared with
Control Group .................................................................................................................................................. 36
Figure 7: Prevalence Ratios of Key Child Health Outcomes in Single Intervention Groups C ompared
with Combined Intervention Group ............................................................................................................ 36

ACKNOWLEDGEMENTS
The evaluation team would like to first thank the Cambodian families, especially caregivers and young children, who shared their time to participate in this study. The team gives special thanks to KHANA Center for Population Health Research for conducting the surveys and collecting anthropometry measures, and to NOURISH staff, especially Laura Cardinal, Inna Sacci, Srales Math, and Lisa Sherburne, for their collaboration and guidance throughout the study. The team would also like to thank Krisna Seng for providing quality oversight during data collection and local coordination with the National Ethics Committee for Health Research. The evaluation team benefited from external peer reviews of the evaluation design from Wolf-Peter Schmidt and Francis Ngure, and from technical reviews of this report by Jeff Albert and Miriam Otoo at WASHPaLS. Finally, the evaluation team would like to thank Sopheanarith Sek (USAID/Cambodia), Elizabeth Jordan (USAID/RFS/CW), Jesse Shapiro (USAID/GH/MCHN), and Jeff Goldberg (USAID/RFS/CW) for their continued support of this study.
EVALUATION REPORT: IMPACT EVALUATION OF THE CAMBODIA NOURISH PROJECT i

ACRONYMS
CCT
CCWC
CI
CLTS
cRCT
DHS
ECD
EED
FANTA
FTF
HARVEST
HAZ
HH
ICC
ITT
JMP
MDES
MSG
MSI
NUTR
NUTR+SAN
OD
PR
RCT
SAN SBCC SD
SOW UNICEF USAID
VHSG WASH WASHPaLS
WAZ
WHO
WHZ
Conditional Cash Transfer
Commune Councils for Women and Children
Confidence Interval
Community-Led Total Sanitation
Cluster Randomized Controlled Trial
Demographic and Health Survey
Early Childhood Development
Environmental Enteric Dysfunction
Food and Nutrition Technical Assistance Project
Feed the Future
Cambodia Helping Address Rural Vulnerabilities and Ecosystem Stability
Height-for-Age Z-score
Household (used only in tables and figures)
Intra-cluster Correlation Coefficient
Intention-to-Treat Analysis
Joint Monitoring Program (WHO/UNICEF)
Minimum Detectable Effect Size
Mother Support Group
Management Systems International
Nutrition only Group (used only in tables and figures)
Nutrition and Sanitation Group (used only in tables and figures)
Open Defecation
Prevalence Ratio
Randomized Controlled Trial
Bureau for Resilience and Food SecuritySanitation only Group (used only in tables and figures)
Social and Behavior Change Communication
Standard Deviation
Statement of Work
United Nations Children’s Fund
United States Agency for International Development
Village Health Support Group
Water, Sanitation, and Hygiene
Water, Sanitation, and Hygiene Partnerships and Learning for
Sustainability Project
Weight-for-Age Z-score
World Health Organization
Weight-for-Height Z-score
EVALUATION REPORT: IMPACT EVALUATION OF THE CAMBODIA NOURISH PROJECT ii
RFS

EXECUTIVE SUMMARY
This is the final report of the impact evaluation of the Cambodia Integrated Nutrition, Hygiene, and Sanitation NOURISH project commissioned by the Center for Water Security, Sanitation and Hygiene in the United States Agency for International Development’s Bureau for Resilience and Food Security (USAID/RFS). The evaluation incorporates a cluster randomized controlled trial (cRCT) with a factorial design to rigorously test the effectiveness of integrating sanitation programming with nutrition services to improve child linear growth and related child health outcomes, as well as whether this integrated approach is more effective than stand-alone nutrition or sanitation interventions.
The findings show that the nutrition interventions, when delivered alone or in combination with sanitation programming, improved child growth. The sanitation interventions did not significantly increase sanitation coverage over the strong secular (non-intervention) trend in the control group and had no effect on child growth or diarrhea. There is no evidence that combining these sanitation and nutrition interventions resulted in increases in child growth over the nutrition programming alone. The evaluation team will also examine the impacts of the interventions on the prevalence of enteric infections (secondary measure) in the target children, the results of which will be submitted under a separate cover.
NOURISH PROJECT DESCRIPTION
Despite strong economic growth and rising living standards in the last two decades, high prevalence of undernutrition persists in Cambodia. Tackling childhood undernutrition requires a broad range of ‘nutrition specific’ and ‘nutrition sensitive’ interventions that act to ensure adequate dietary intake and address the multiple underlying or enabling determinants of child growth. However, when rigorously evaluated, interventions to improve dietary intake alone are not successful in reducing stunting. Acute and persistent infections associated with unsafe water, poor sanitation, and inadequate hygiene may impact gut health and therefore overall nutrition and growth. Thus, complementary water, sanitation and hygiene (WASH) interventions aimed at reducing diarrheal disease and exposure to fecal bacteria may be an important means to securing optimal nutritional outcomes for children.
NOURISH promoted essential WASH and nutrition behaviors with the aim of reducing stunting in children under two years old and improving the nutritional status of mothers in the poorest households in rural areas. Save the Children implemented the project (in collaboration with two international organizations, SNV and the Manoff Group, as well as three local partners) in three provinces (Battambang, Pursat, and Siem Reap) from June 2014 to June 2020. NOURISH focused on women and children during the first 1,000 days, from the start of pregnancy until the child’s second birthday. The WASH interventions consisted primarily of community-led total sanitation (CLTS), coupled with supply-side support for sanitation and hygiene products, and social and behavior change communication (SBCC). The nutrition interventions included complementary feeding activities and education through community-based growth promotion sessions, caregiver groups, and home visits, as well as conditional cash transfers (CCT) linked to the utilization of key health and nutrition services focusing on the first 1,000 days of a child’s life.
EVALUATION DESIGN
The NOURISH impact evaluation is based on the development hypothesis that integrated nutrition and sanitation interventions can lead to improved child linear growth that is greater than what is achieved when either intervention is delivered individually. In addition to the primary outcome (child linear growth) and secondary outcomes (stunting and other growth outcomes, self-reported diarrheal disease,
EVALUATION REPORT: IMPACT EVALUATION OF THE CAMBODIA NOURISH PROJECT iii
and all-cause mortality), this evaluation will also analyze, under a separate cover, the intervention effects on the prevalence of enteric infections in young children. The three central evaluation questions are:
1. Do nutrition interventions, as delivered at scale in the NOURISH program, lead to improved linear growth in children?
2. Does expanded access t o sanitation, as d elivered at scale in the NOURISH program, lead to improved linear g rowth in children?
3. Is t he combined effect on linear growth in children of these sanitation and nutritioninterventions delivered together greater than the additive effect of the two interventions delivered independently?
Linked to the three impact questions, the evaluation also assesses aspects of fidelity (delivery of interventions), uptake of interventions, and intermediate outcomes along the causal pathways through which NOURISH is aiming to increase the health status of children.
We employ a cluster randomized controlled trial (cRCT) design. The evaluation team randomly assigned 55 target communes to four groups, whereby NOURISH offered interventions both as separate components and as an integrated program. This factorial design results in four groups—(1) nutrition only, (2) sanitation only, (3) nutrition+sanitation, and (4) control—to allow the evaluation team to answer the evaluation questions. Randomization was at the commune level (clusters) to contain spillovers across villages and to prevent cross-group contamination.
DATA COLLECTION
The evaluation team conducted baseline data collection in September 2016, consisting of a survey of the primary caregivers of children under two years of age and anthropometric measures of their children in this age range. The NOURISH project then rolled out project activities in 36 communes over the course of two years, while the remaining 19 control communes remained unexposed to the program. Endline measurement took place in August 2019, 28 months after the end of the roll-out period. During these 28 months, the evaluation team also collected implementation fidelity monitoring data to track the roll-out pace, uptake of core interventions, and intermediate outputs along the causal chain. Endline data collection consisted of surveys with the primary caregiver of children between one and 28 months, direct observation of certain household conditions, and anthropometry measures and stool samples from the children in this age range.
The evaluation team developed the survey questionnaire; the majority of questions are based on validated questions from the Cambodia Demographic and Health Survey (DHS) questionnaires. The team piloted and revised new questions added to the survey prior to the start of data collection. The study received approval from the National Ethics Committee for Health Research in the Cambodian Ministry of Health, Georgia Institute of Technology, and New England IRB. The endline sample size consisted of 4,015 households with at least one child aged one to 28 months and 4,124 total children in this age range.
KEY FINDINGS
We observed meaningful and significant gains in child growth outcomes attributable to nutrition interventions. No effect is discernable for the sanitation interventions on any outcome measured. Change in sanitation coverage in treatment groups receiving the sanitation interventions compared to
EVALUATION REPORT: IMPACT EVALUATION OF THE CAMBODIA NOURISH PROJECT iv

the strong secular t rend resulted in only a modest increase in improved sanitation coverage 1. Open defecation (OD) and any sanitation coverage was not different across groups, limiting our ability to measure the impact of sanitation coverage specifically on growth outcomes.
SUMMARY OF KEY FINDINGS
Key Result
Treatment Groups Compared to the Control Group
NUTR+SAN Group Compared to Single Intervention Group
NUTR SAN NUTR+SAN vs. NUTR vs. SAN
Fidelity (delivery) High High High --- ---
Intervention Uptake High
Low relative to the strong
secular trend in the control
group
High uptake for nutrition
activities. Low uptake (relative to secular trend)
for sanitation activities
--- ---
Linear Growth (HAZ)ǂ Positive effect * No effect Positive effect * No effect Positive effect ***
WAZǂǂ
WHZǂǂ
Positive effect **
No effect
No effect
No effect
Positive effect **
No effect
No effect
No effect
Positive effect **
No effect
Stuntingǂǂ
Diarrheaǂǂ
Positive effect *
No effect
No effect
No effect
No effect
No effect
No effect
No effect
Positive effect *
No effect
All-cause mortalityǂǂ No effect No effect No effect No effect No effect
Note: Analysis is adjusted f or covariates: field staff who collected data, child age (months), child sex, maternal age (years), maternal education (binary, based on completion of primary school), number of HH members, wealth index quintile, and baseline village-level prevalence of improved sanitation.
*** p<0.01, ** p<0.05, * p<0.1, following statistical tests described in Section 0
ǂ Pre-specified primary outcome ǂǂ Pre-specified secondary outcome
CONCLUSIONS
The sanitation interventions did not significantly increase sanitation coverage over the strong secular trend and had no discernable effect on measured child health outcomes. Gains in sanitation coverage may lead to improved growth outcomes in children via reductions in the transmission of enteric infection and disease, though links bet ween sanitation coverage and specific outcomes are poorly understood. In our study, changes in sanitation coverage from baseline in the intervention groups were not meaningfully g reater than the increase observed in the control group.
An improved sanitation facility, as classified by the WHO/UNICEF JMP, includes a flush/pour flush toilet to a piped sewer system, septic tank or pit latrine; a ventilated improved pit latrine; a pit latrine with slab; or a composting toilet. It does not include a shared facility; a flush/pour flush toilet depositing elsewhere that is not a piped sewer system septic tank or pit latrine; a pit latrine without a slab; a bucket toilet; or a hanging toilet.
EVALUATION REPORT: IMPACT EVALUATION OF THE CAMBODIA NOURISH PROJECT
1
v

Study groups receiving the sanitation interventions did experience statistically meaningful increases in improved sanitation coverage (27 percent increase from baseline), over the control and nutrition-only groups (mean 18 percent increase from baseline). Prevalence of OD decreased across all groups to a similar degree, including in the control group. These increases suggest broad investment by households, government, NGOs, and other actors expanding access to sanitation. The pace of development in WASH generally in rural Cambodia means that measuring the impact of specific programs can be challenging. Because of the lack of clear sanitation coverage increases in the study groups receiving the sanitation intervention compared with the nutrition and control groups, this trial is limited in determining the effects of such changes on outcomes. In epidemiological terms, there was no change in exposure across groups. We observed no differences in linear growth, other growth outcomes, diarrhea, or all-cause mortality associated with the sanitation interventions delivered either alone (compared to control) or bundled in the nutrition+sanitation group (compared to nutrition-only).
Nutrition interventions had a clear and consistent effect on child growth. We found that children in the nutrition+sanitation group experienced a 7.3 percent increase in height-for-age z-scores (HAZ) compared to the control group and a 12.6 percent increase in HAZ compared to the sanitation-only group. Children in the nutrition-only group experienced a 9.2 percent increase in HAZ compared to the control group. Nutrition programming also led to reductions in stunting. Children in the nutrition-only group were 17.3 percent less likely to be stunted compared to the children in the control group. Children in the nutrition+sanitation group are 20.9 percent less likely to be stunted compared to the sanitation-only group. All of these differences are statistically meaningful and represent clear evidence that NOURISH programming resulted in growth improvements in children. Uptake of nutrition programming appeared to be high, though we observed no apparent differences in intermediate outcomes across study groups—like measures of dietary diversity or breastfeeding—that could fully explain why these differences in outcomes occurred.
These evaluation results are consistent with those from other similar sanitation trials. In particular, three recent efficacy trials with factorial designs examining impacts of combined nutrition+sanitation and single interventions (the SHINE and WASH-Benefits trials) report improvements in child linear growth from the nutrition interventions, however, none demonstrate advantages of integrating nutrition and WASH programming in terms of supporting increased growth in very young children. These were efficacy trials, intended to measure benefits for interventions carefully delivered under controlled conditions, ensuring that fidelity and compliance were relatively high, representing ideal conditions for real-world programming. The NOURISH impact evaluation is an effectiveness trial of a real-world set of interventions, under typical conditions. Results are consistent across these studies, with one exception: sanitation coverage gains in our control group meant that our ability to measure sanitation’s specific contributions—if any—to study outcomes is limited, because exposure did not change differentially across groups. To date, trial results suggest that rural sanitation interventions delivered at scale under a range of conditions fail to reliably contribute to increasing linear growth or reducing stunting in children. In contrast, nutrition programing seems to consistently deliver expected gains on these outcomes, even when delivered at-scale in typical (i.e., non-ideal) development conditions.
RECOMMENDATIONS
USAID should scale up nutrition interventions so more children can benefit from these effective interventions. NOURISH early childhood nutrition interventions resulted in clear improvements in child linear growth and other anthropometric outcomes. These impacts are consistent with other nutrition interventions in recently conducted factorial randomized controlled trials and with
EVALUATION REPORT: IMPACT EVALUATION OF THE CAMBODIA NOURISH PROJECT vi

the wider literature.2 Results fr om this s tudy also indicate widespread uptake of nutrition interventions by participants, though we are unable to attribute observed growth increases to specific elements of the intervention packages.
USAID should pursue sanitation programming that can reduce children’s exposure to excreta. The results of this evaluation suggest that sanitation programming achieving modest increases (relative to the strong secular trend) in sanitation coverage and reduction of OD may not consistently translate to improved child growth. Although some gains in sanitation coverage and reductions in OD occurred in the sanitation intervention groups compared with the control group, it is possible that exposure to enteric pathogens was not reduced or that community-level sanitation coverage was insufficient to achieve an effect on growth. The impact of sanitation on child growth is thought to follow from reductions in exposure to enteric pathogens in early development, potentially achievable where community-level coverage of sanitation is high and excreta are effectively contained. Further evidence of secondary outcomes—including the planned analysis of stool samples for a range of enteric pathogens— will allow for an analysis of whether interventions modified exposures in the treatment groups receiving the sanitation intervention.
USAID should n ot abandon CLTS promotion because of this study’s finding of no effect, but s hould more selectively invest in CLTS in s ettings where there is not a lready strong secular growth in sanitation coverage. A lack of impact on child growth outcomes attributable to rural sanitation programming in NOURISH is consistent with a number of recent t rials a lso showing no effect,3,4,5,6 but also contrasts with others finding an effect.7,8 Although sanitation coverage level, prevalence of OD, contact with animal waste, type of latrines, and other variables are hypothesized to explain the disparities i n the existing evidence, there are too few studies t o propose a synthesis o f the evidence explaining why an effect is r ealized in some contexts and not others.9 As community-level
2 Panjwani, A., & Heidkamp, R. (2017). Complementary feeding interventions have a small but significant impact on linear and ponderal growth of children in low-and middle-income countries: a systematic review and meta-analysis. The Journal of Nutrition, 147, no. 11: 2169S-2178S.
3 Patil, S. R., et al. (2014). The effect of India's total sanitation campaign on defecation behaviors and child health in rural Madhya Pradesh: a cluster randomized controlled trial. PLoS Medicine, 11, no. 8.
4 Clasen, T., et al. (2014). Effectiveness o f a rural sanitation programme on diarrhoea, soil-transmitted helminth infection, and child malnutrition in Odisha, India: a cluster-randomised trial. The Lancet Global Health, 2, no. 11 e645-e653.
5 Null, C., et al. (2018). Effects of water q uality, sanitation, handwashing, and nutritional interventions on diarrhoea and child growth in rural Kenya: a cluster-randomised controlled trial. The Lancet Global Health, 6, no. 3: e316-e329.
6 Luby, S. P., et al. (2018). Effects of water quality, sanitation, handwashing, and nutritional interventions on diarrhoea and child growth in rural Bangladesh: a cluster r andomised controlled trial. The Lancet Global Health, 6, no. 3: e302-e315.
7 Pickering, A. J., et al. (2015). Effect of a community-led sanitation intervention on child diarrhoea and child growth in rural Mali: a cluster-randomised controlled trial. The Lancet Global Health, 3, no.11 (2015): e701-e711.
8 Hammer, J. & Spears, D. (2016). Village sanitation and child health: effects and external validity in a randomized field experiment in rural India. Journal of Health Economics, 48:135-148.
9 Brown, J., Albert, J., & Whittington, D. (2019). Community-led total sanitation moves the needle on ending open defecation in Zambia. The American Journal of Tropical Medicine and Hygiene,100, no. 4: 767-769.
EVALUATION REPORT: IMPACT EVALUATION OF THE CAMBODIA NOURISH PROJECT vii

coverage of sanitation is thought to be an important factor in supporting growth outcomes,10,11,12 efforts to increase sanitation coverage and achieve open defecation-free status for c ommunities, districts and countries may support efforts to eliminate chronic childhood undernutrition in the long term. Critically, in this study, we observed increases in sanitation coverage and reductions in OD that were dramatic across all groups, including in the control group, reflecting rapid secular trends in rural Cambodia. This limits our ability to measure an effect of sanitation changes o n study outcomes, because the trial design is conditioned on the exposure (in this case, sanitation) changing across groups. A f inding that sanitation has no effect on growth does not mean that sanitation gains d id not contribute to improved growth in children in this s tudy: only that similar progress realized in the control group precludes a n analysis o f effects attributable to the intervention. More broadly, CLTS is a ssociated with other benefits that may well justify its continued promotion as a public he alth intervention.13,14 USAID should, however, consider investing in CLTS and other s anitation programming where such investments can lead to a meaningful divergence from the secular trend: sanitation impacts may be realized in settings w here progress is l acking.
10 Fuller, J. A., & Eisenberg, J. NS. (2016). Herd protection from drinking water, sanitation, and hygiene interventions. The American Journal of Tropical Medicine and Hygiene 95, no. 5: 1201-1210.
11 Fuller, J. A., Villamor, E., Cevallos, W., Trostle, J. & Eisenberg, J. NS. (2016). I get height with a little help from my friends: herd protection from sanitation on child growth in rural Ecuador. International Journal of Epidemiology, 45, no. 2: 460-469.
12 Harris, M., Alzua, M. L., Osbert, N. & Pickering, A. (2017). Community-level sanitation coverage more strongly associated with child growth and household drinking water quality than access to a private toilet in rural Mali. Environmental Science & Technology, 51, no. 12: 7219-7227.
13 Whittington, D., Radin, M. & Jeuland, M. (2020). Evidence-based policy analysis? The strange case of the randomized controlled trials of community-led total sanitation. Oxford Review of Economic Policy, 36, no 1 (2020): 191–221.
14 Brown et al. (2019).
EVALUATION REPORT: IMPACT EVALUATION OF THE CAMBODIA NOURISH PROJECT viii

1.0 INTRODUCTION
This is the final evaluation report for the impact evaluation of the Cambodia Integrated Nutrition, Hygiene, and Sanitation NOURISH Project commissioned by the Center for Water Security, Sanitation and Hygiene in the United States Agency for International Development’s Bureau for Resilience and Food Security (USAID/RFS) in August 2014. Management Systems International (MSI) under the RFS Analytics and Evaluation Project, designed the impact evaluation and conducted the baseline and implementation fidelity monitoring. Tetra Tech then assumed management of the evaluation and the existing technical team under the Water, Sanitation, and Hygiene Partnerships and Learning for Sustainability (WASHPaLS) Project. The core evaluation team remained the same throughout the entire study.
The evaluation incorporates a cluster randomized controlled trial (cRCT) with a factorial design to rigorously test how effective integrating sanitation and hygiene along with nutrition services is in improving child linear growth, as well as whether this integrated approach is more effective than stand-alone nutrition or sanitation interventions. Annex A provides USAID’s statement of work (SOW) for the evaluation.
EVALUATION REPORT: IMPACT EVALUATION OF THE CAMBODIA NOURISH PROJECT 1

2.0 NOURISH PROJECT BACKGROUND
CONTEXT
Despite strong economic growth and rising living standards in the last two decades, high levels of undernutrition persist in Cambodia. The most recent national estimates from 2014 show that up to 32 percent of children under five years a re stunted and 9 percent are severely stunted.15 Nutrition interventions that aim to ensure adequate dietary intake alone have not been successful in eliminating stunting,16 suggesting the need for additional complementary interventions—such as water, sanitation, and hygiene (WASH)—that might act synergistically to accelerate progress i n nutrition.17 This nutrition and sanitation nexus was a lso recognized by current U SAID strategies, including the Water and Development Strategy and the Multi-Sectoral Nutrition Strategy, which emphasize the relevance of WASH to nutrition and call on Missions to add WASH as key elements to their health and nutrition activities.
NOURISH PROJECT DESCRIPTION
To help identify how nutrition and sanitation interventions c an best be mobilized together, in 2014 USAID/Cambodia awarded the NOURISH project to Save the Children.18 This $16.3 million project addresses several Global Health Initiative and Feed the Future (FTF) initiative priorities by focusing on the key causal factors of chronic undernutrition specific to Cambodia: poverty, lack of access to quality nutrition services, unsanitary environments, and social norms and practices that work against optimal growth and development. It promotes e ssential nutrition and sanitation behaviors with the aim of reducing stunting in children under 2 years o ld and improving the nutritional status o f mothers in rural areas. NOURISH implementation was fr om June 2014 to June 2020 in three of the four FTF zone of influence provinces (Battambang, Pursat, and Siem Reap). It phased into approximately 70 communes in these provinces, targeting women and children during the first 1,000 days, from the start of pregnancy until the child’s second birthday. This evaluation started after NOURISH’s first year o f piloting activities in 12 communes; pilot activities are excluded from this evaluation.
NOURISH I NTERVENTIONS
NOURISH interventions focused on four key strategies: (1) improving community delivery platforms to support improved nutrition; (2) creating demand for nutrition/health- and sanitation-related practices, services, and products through the use of conditional cash transfers (CCTs), community-led total sanitation (CLTS), vouchers, and social and behavior change communication (SBCC); (3) using the private sector to advance supply of sanitation and nutritious products; and (4) building the capacity of government and civil society in nutrition.
15 National Institute of Statistics, Directorate General for Health, and ICF International. (2015). Cambodia demographic and health survey 2014.
16 Dewey, K. G. & Adu-Afarwuah, S. (2008). Systematic review of the efficacy and effectiveness of complementary feeding interventions in developing countries. Maternal & Child N utrition, 4, no. S1.
17 Ruel, M. T. & Alderman, H. (2013). Nutrition-sensitive interventions and programmes: how can they help to accelerate progress in improving maternal and child nutrition? The Lancet, 382, no. 9891.
18 Save the Children is implementing NOURISH in collaboration with two international organizations (SNV and the Manoff Group) and three local partners (Partners in Compassion, Operations Enfants du Cambodge, and Wathnakpheap).
EVALUATION REPORT: IMPACT EVALUATION OF THE CAMBODIA NOURISH PROJECT 2

The WASH interventions consisted primarily of community-led total sanitation (CLTS), coupled with supply-side support for sanitation and hygiene products, and SBCC. The nutrition interventions included complementary feeding activities and education through community-based growth promotion sessions, caregiver groups, and home visits, as well as CCTs linked to the utilization of key health and nutrition services focusing on first 1,000 days of life. The SBCC materials in both the nutrition and sanitation interventions included information on hygiene practices.
NUTRITION INTERVENTIONS:
The Community Nutrition component used evidence-based integrated nutrition interventions for the “first 1,000 days” of life. NOURISH strengthened existing community structures, specifically the Village Health Support Groups (VHSGs), to deliver the community nutrition activities. VHSGs, supervised by health workers and Commune Councils for Women and Children (CCWC), sought to improve childcare and development at multiple levels: individual, family, and community. Five core activities comprised the community initiative designed to prevent malnutrition:
Community D ialogues: The Village Chief and VHSGs l ed this quarterly activity. The community gathered to talk, decide, and take action together to support all children’s h ealthy growth. Communities reviewed progress in creating a healthy environment, discussed one key action to jointly address challenges, and decided together h ow everyone could come together to achieve this action.
Caregiver Group Education Sessions: Caregiver Gr oups were peer-led groups of women who used a 13-session experiential learning manual discussing each of the key behaviors pr omoted by NOURISH. NOURISH trained two members p er group to facilitate monthly sessions with support from elder wo men in the community and trained Community Agents.
Growth Monitoring and Promotion: VHSGs monitored every child every month. The VHSG referred children who were sick or not growing well to health centers or r eferral hospitals, as appropriate, and followed up at home after treatment.
Home visits: VHSGs and Mother Support Group (MSG) members provided tailored interpersonal communication during home visits to promote childcare and feeding practices, home hygiene, and proper use of latrines and handwashing stations. Several categories of women received home visits: pregnant w omen, caregivers of children nine- to11-months-old and caregivers o f children not growing well.
Village Fairs: Semi-annual village fairs o ffered women and their families ha nds-on learning experiences o n health/nutrition, WASH and agriculture using games, demonstrations and practice sessions, interactive discussions and latrine marketing and sales by local participating sanitation suppliers.
CCT acted as a social safety net mechanism for poor “first 1,000 days” families, serving as an incentive for women to access nutrition and early childhood development (ECD) services, practice specific behaviors, and overcome constraints related to poverty. Eligible families (based on poverty status) could receive up to six payments, for a total of $65 over the first 1,000 days of a child’s life. NOURISH transferred the payments directly into women’s bank accounts after they used health and nutrition services.
First transfer: $12.50 at one month postpartum. Conditions: At least four antenatal care visits, delivery in a health center, and at least two postnatal care visits.
Remaining five transfers: $10 for the second to fifth transfers a nd $12.50 for the last transfer over the next 23 months postpartum. Conditions: Monthly monitoring of child’s growth through
EVALUATION REPORT: IMPACT EVALUATION OF THE CAMBODIA NOURISH PROJECT 3

Growth Monitoring and Promotion (GMP) at the health centers or in the community, and handwashing station at home.
Vouchers served as another mechanism to encourage demand and overcome access constraints related to poverty. NOURISH distributed vouchers to poor “first 1,000 days” families in communes where the CCT is implemented and is redeemable for discounts on water filters ($5 co-payment) and two food baskets ($5 co-payment).
SBCC consisted of media and materials to promote key behaviors in health/nutrition, sanitation/hygiene, and agriculture. The project's SBCC framework was grounded in evidence of what works in social and behavior change and foundational work done by NOURISH in its first year. On the nutrition side, SBCC supported all the Community Nutrition activities, described above, and was implemented by community change agents (VHSGs and caregiver peer groups).
Grow Together: The campaign focused on 13 key stunting prevention behaviors spanning health, nutrition, WASH, and agriculture to stimulate relevant actions for children to grow and reach their f ull potential (Figure 1). It was not possible to exclude the WASH messaging from the Grow Together campaign, so caregivers r eceived information on all 13 behaviors as part of the nutrition programming. The campaign included print m aterials, audio sound-bites (2-3 minutes e ach), an advocacy package for local leaders, and more than 20 print materials carrying the same “look and feel” to link to core values and motivations to take action.
FIGURE 1: GROW TOGETHER CAMPAIGN FOCUS
To complement the print materials, the SBCC media plan included three television spots including the foundational Grow Together T V spot, latrine construction and Small Fish Powder. Unlike the rest of the Grow Together campaign materials, the TV spots were not limited as pa rt of the nutrition programming and were broadcasted across the entire study area.
The “first 1,000 days” family SBCC package was centered on a Family Commitment Card enumerating the critical practices and allowing families to prioritize behaviors and visualize successes a nd gaps. As t he Family Card filled with accomplishments, the family was recognized
EVALUATION REPORT: IMPACT EVALUATION OF THE CAMBODIA NOURISH PROJECT 4

as a growth champion with a child book and other incentives to mark its accomplishment. A behavior wheel checklist to guide home visits showing health/nutrition and sanitation/hygiene practices supplemented the Family Card.
SANITATION INTERVENTIONS:
CLTS aimed to achieve sustained behavior change through the process of community “triggering” leading to spontaneous and long-term abandonment of open defecation (OD) practices. This one-time triggering event was conducted in collaboration with the Ministry of Rural Development and provincial and district departments of rural development. In alignment with national Open Defecation Free certification guidelines, CLTS covered entire villages to minimize the risk of fecal-oral contamination for all children. Following CLTS triggering, NOURISH used door-to-door visits to monitor family and community commitment while also raising awareness and creating demand for sanitation/latrines. Teams conducted at least five visits per village.
Latrine vouchers were a targeted subsidy to poor households in villages that reached 75% sanitation coverage. Vouchers were redeemable for a discount on latrine materials ($15 co-payment). In the nutrition+sanitation villages, latrine vouchers were initially linked to the CCT program, and so were only offered to those beneficiaries. However, this requirement was phased out and NOURISH eventually made latrine vouchers available to all poor households in eligible villages.
Supply-side support consisted of collaborating with private and public sector actors to develop locally sensitive market-oriented approaches for the integrated business service centers around “first 1,000 days” products and services. NOURISH encouraged knowledge sharing across small- and medium-sized enterprises (SMEs) as well as utilized existing resource centers and agencies to develop the capacity of SMEs for effective service delivery and to increase their outreach to poor and relatively remote areas. NOURISH identified a number of successful businesses within or outside the project area and organized interfaces between new and existing businesses to give mutual learning opportunities between SMEs and develop linkages for possible collaboration. In addition, the project linked suppliers to communes after CLTS triggering so they could follow up with households that committed to purchasing or building latrines.
SBCC on the sanitation side consisted of sanitation campaigns in primary schools to ensure children become agents of change and carry new behaviors home. As change agents, children have the potential to convince their families to construct latrines or purchase a handwashing station, and to use them.
These interventions are the inputs of the project’s theory of change laid out in Figure 2.
EVALUATION HYPOTHESES
The NOURISH theory of change, above, describes the key hypothesized pathways of impact for NOURISH interventions. The three evaluation hypotheses are:
1. Hypothesis #1: NOURISH nutrition interventions lead to improved linear growth in children. 2. Hypothesis #2: NOURISH sanitation interventions l ead to improved linear growth in children. 3. Hypothesis #3: Integrated nutrition and sanitation interventions lead to greater improved linear
growth in children than stand-alone nutrition or s anitation interventions.
EVALUATION REPORT: IMPACT EVALUATION OF THE CAMBODIA NOURISH PROJECT 5

FIGURE 2: NOURISH THEORY OF CHANGE
EVALUATION REPORT: IMPACT EVALUATION OF THE CAMBODIA NOURISH PROJECT 6

3.0 EVALUATION PURPOSE, AUDIENCE, AND USES
This impact evaluation comes at an opportune time, as the previously noted USAID strategies c all for more integration of WASH and nutrition activities while also recognizing that additional research is needed to strengthen the evidence base for the nutrition linkages to WASH. While USAID and other actors i n international development are exploring different approaches for integrating WASH and nutrition interventions on the basis of the emerging understanding of the link between enteric infections and nutrient uptake,19 limited evidence exists on the potential health impacts of combining improved WASH and nutrition interventions under real-world conditions. See Annex B for a review of the existing evidence.
The primary audience for this evaluation is USAID, particularly the Center for Water Security, Sanitation and Hygiene, as well as USAID/Cambodia, with secondary audiences in the Global Health Bureau and the rest of the Bureau for Resilience and Food Security. It will also provide supporting evidence to the Government of Cambodia, given the overlap with its National Strategy for Food Security and Nutrition and its collaboration with NOURISH. Findings and lessons learned from this evaluation are also of interest to Save the Children, SNV, and other practitioners in these sectors who are seeking ways of accelerating health benefits by integrating cross-sectorial interventions. Finally, this impact evaluation serves the global audience by adding to the evidence base on the link between sanitation and undernutrition.
The findings from this impact evaluation will be used to further USAID’s commitment to evidence-based programming in these sectors and will contribute to global knowledge on the nutrition and sanitation nexus.
19 Cumming, O. & Cairncross, S. (2016). Can water, sanitation and hygiene help eliminate stunting? Current evidence and policy implications. Maternal & Child Nutrition, 12, no. S1.
EVALUATION REPORT: IMPACT EVALUATION OF THE CAMBODIA NOURISH PROJECT 7

4.0 EVALUATION QUESTIONS
Two groups of evaluation questions guide this evaluation. The first set of questions focuses on causality, or the attribution of detected effects to these specific nutrition and sanitation interventions on child growth outcomes. The second set of evaluation questions focuses on process, or whether project activities and the incentive schemes used by NOURISH resulted in the intended intermediate outcomes.
4.1 IMPACT QUESTIONS (CAUSAL LINKAGES)
USAID’s c entral questions for this impact evaluation are:
1. Do nutrition interventions, as delivered at scale in the NOURISH program, lead to improved linear growth in children?
2. Does expanded access t o sanitation, as d elivered at scale in the NOURISH program, lead to improved linear g rowth in children?
3. Is t he combined effect on linear growth in children of these sanitation and nutrition interventions delivered together greater than the effect of the two interventions delivered independently?
Rigorously exa mining these questions requires a “factorial design” whereby the intervention components can be assessed separately a nd together. Table 1 below describes the outcome measures for the evaluation.
4.2 PROJECT PROCESS QUESTIONS
Linked to the three impact questions are several subordinate questions that require the evaluation to look closely a t the project implementation process (fidelity and uptake) and its intended results. These questions provide insights on the intermediate outcomes from the different causal pathways t hrough which NOURISH aimed to increase child linear g rowth (see Figure 2). Given that the NOURISH interventions comprised multiple sanitation and nutrition components, these additional questions provide important i nsights into the relative contribution of these various components to improving child linear growth. The project process evaluation questions are:
1. Did sanitation interventions increase improved sanitation coverage and usage? 2. Did nutrition interventions increase uptake of nutrition and early childhood development
services? 3. Did the nutrition and sanitation interventions change behavior related to nutrition, hygiene, and
infant and young children feeding practices? 4. Did the sanitation interventions lead to more sanitary conditions of the home environment?
4.3 OUTCOME MEASURES
The outcome measures for the evaluation not only appropriately address the evaluation questions, but also provide insights into the causal pathways through which children’s health status can improve. The three impact questions are answered by collecting endline data on key health outcome measures, divided into primary and secondary outcomes. Including the secondary outcome measures adds explanatory value to the expected primary outcome (improved child linear growth). The prevalence of enteric pathogens in the target children is also a secondary outcome measure of the evaluation, which will be submitted under separate cover and is therefore not part of the discussion in this report.
EVALUATION REPORT: IMPACT EVALUATION OF THE CAMBODIA NOURISH PROJECT 8

TABLE 1: KEY OUTCOME MEASURES
INDICATOR MEASUREMENT INTERPRETATION
Primary Outcome
Height-for-age z-score (HAZ)
Standardized measure of child’s height for his/her
age, as compared to the mean of the 2006 WHO
reference population. Mean of 0 and standard deviation of 1.
This is an indicator of linear growth. Children with a HAZ score below minus two standard deviations from the mean
of the reference population are considered stunted and are chronically undernourished. Chronic undernutrition carries
long-term developmental risks. Stunting is frequently found to be associated with poor overall economic conditions,
especially mild to moderate, chronic, or repeated infections, as well as long periods of inadequate nutrient intake.
Secondary Outcomes
Weight-for- height z-score
(WHZ)
Standardized measure of child’s weight for his/her
height, as compared to the mean of the 2006 WHO
reference population. Mean of 0 and standard deviation of 1.
This is an indicator of body mass in relation to body length and describes current nutritional status. Children with a
WHZ score below minus two standard deviations from the mean of the reference population are considered thin
(wasted) for their height and are acutely malnourished. Acute undernutrition carries an immediate increased risk of
morbidity and mortality. Wasting is often associated with variations either in food supply or in disease prevalence. One
of the main characteristics of wasting is that it can develop very rapidly, and under favorable conditions can be reversed
rapidly.
Weight-for-age z-score (WAZ)
Composite index of HAZ and WHZ. Mean of 0 and
standard deviation of 1.
This reflects a combination of chronic and acute undernutrition. Children with a WAZ score below minus
two standard deviations from the mean of the reference populations are considered underweight.
Self-reported diarrheal disease
Caregiver reported child had diarrhea in 7 days
preceding the survey. Diarrhea is defined as three or more loose or liquid stools in a 24-hour period
or any stool with blood. A visual aid card pointing to
the two types of stool classified as diarrhea was
used during each survey interview.
Diarrheal disease is thought to be the primary mediating pathway between sanitation and stunting. It is both a cause
and an effect of undernutrition: children with diarrhea eat less and are less able to absorb the nutrients from their food,
and in turn malnourished children are more susceptible to diarrhea and other infections. This poor nutrient absorption
may lead to stunted linear growth.
All-cause mortality
Caregiver reported child death from any cause.
Child mortality is linked with undernutrition and poor WASH conditions.
In addition, the evaluation includes different aspects of intervention delivery (fidelity) and their use among the target population (uptake), as well as relevant intermediate outcomes which require changes in behavior. These measures provide insights into the causal mechanism through which change occurs and identify remaining barriers that need to be tackled to improve the implementation of integrated nutrition and sanitation interventions.
EVALUATION REPORT: IMPACT EVALUATION OF THE CAMBODIA NOURISH PROJECT 9

FIGURE 3: MEASURING IMPACT ALONG THE CAUSAL CHAIN
Fidelity
• Timely roll-out of interventions in their respective treatment arms
• No interventions rolled out in the control group
Uptake
• Extent to which households with target children participate in the respective interventions
Intermediate Outcomes
• Sanitation coverage and usage
• Environmental hygiene
• Uptake of nutrition and ECD services
• Nutrition and feeding practices
•Child illness symptoms
Outcomes
• Primary outcome: Child linear growth (HAZ)
• Secondcary outcomes: WHZ, WAZ, stunting, self-reported diarrhea, all-cause mortality
• Prevalence of enteric infections (under separate cover)
EVALUATION REPORT: IMPACT EVALUATION OF THE CAMBODIA NOURISH PROJECT 10

5.0 EVALUATION DESIGN AND METHODOLOGY
This impact evaluation consists of a cRCT design. Before the start of the interventions during Year 2 of the project, the evaluation team randomly assigned 55 target communes to treatment and control groups; the treatment groups received exposure to the relevant NOURISH component (or components), and the control group remained unexposed to NOURISH programming. Assignment to treatment and control groups was randomized at the commune level (clusters) to contain spillovers across villages and to prevent cross-group contamination. Under this design, all villages within each treatment commune received the assigned NOURISH component for their respective commune.
To assess t he independent and combined effects of the NOURISH interventions and to test whether an integrated approach leads to greater improvements in child linear g rowth beyond the stand-alone nutrition and sanitation/hygiene bundles, the evaluation team implemented a controlled factorial design. Thus, there are four groups—(1) nutrition only, (2) sanitation only, (3) nutrition+sanitation, and (4) control—to allow the evaluation team to answer the main impact evaluation questions. Table 2 shows t he NOURISH implementation design.
Control Group:
No project activities*
Treatment 1:
Nutrition interventions:
Community nutrition (growth monitoring, community education, caregiver groups, and home visits)
SBCC package CCT and vouchers (food basket and
water f ilter)
Treatment 2:
Sanitation interventions:
Treatment 3:
Nutrition and sanitation interventions
CLTS Door-to-door f ollow-up visits Latrine vouchers Supply-side support SBCC package
TABLE 2: NOURISH IMPLEMENTATION DESIGN FOR THE IMPACT EVALUATION
* The SBCC strategy includes three television spots, so communes in the control group may have been exposed to some information via these television spots. However, beyond the television spots and visible campaign branding in neighboring communes, these control communes do not receive direct SBCC messaging from the village health support group (VHSG) or any other NOURISH-related activities.
Given the two-year phased roll-out of NOURISH activities into all treatment communes (during Years 2 and 3 of project implementation), the evaluation decided ex ante, in consultation with USAID, to collect endline data 24 months after the end of the two-year roll-out. However, NOURISH roll-out activities ended four months earlier than scheduled, so endline data collection actually took place 28 months after all treatment communes were “exposed” to their respective project components. Thus, the evaluation team collected measurements from young children exposed to the project activities throughout their
EVALUATION REPORT: IMPACT EVALUATION OF THE CAMBODIA NOURISH PROJECT 11

entire lifetimes (born from 28 months to one month before the endline) in all 55 communes. TABLE 3 illustrates the implementation roll-out plan and evaluation timeline.
TABLE 3: TRIAL DESIGN TIMELINE
Communes
Year 2
(2015 –
2016)
Year 3
(cumulative)
(2016 –
2017)
Control 19 19
Nutrition Only 2 11
Sanitation Only 4 13
Nutrition + Sanitation 6 12
Total receiving any
NOURISH intervention: 12 36
First eligible Endline at 28 months
children born post-intervention
Following the initial roll-out of activities into all treatment c ommunes, the NOURISH project continued to deliver these activities throughout the period of performance. During this t ime, the evaluation team monitored implementation fidelity along hypothesized causal pathways (FIGURE 3), linking the interventions to the primary outcomes, with a focus on the delivery and uptake of core interventions. Beginning in October 2016, the NOURISH project compiled monitoring data quarterly in accordance with the threshold exposure points (Table 4) agreed to ex ante. The project integrated the exposure points into its internal monitoring plan. When these criteria were met, the interventions were considered delivered (communes “exposed”) and children born on or a fter these points were eligible to be included in the endline evaluation at 28 months post-intervention delivery. In addition, monitoring data on the change in improved sanitation20 coverage was a lso collected quarterly in the communes receiving the sanitation interventions.
TABLE 4: THRESHOLD EXPOSURE POINTS
EVALUATION REPORT: IMPACT EVALUATION OF THE CAMBODIA NOURISH PROJECT 12
Nutrition Sanitation
All community agents and caregiver group facilitators trained CLTS triggering event completed
Three consecutive months of community nutrition services Village sanitation committees established and trained
Three consecutive months of active caregivers groups
Three months of regular follow-up and monitoring through village sanitation committees
First 50 CCT beneficiaries enrolled
20 An improved sanitation facility, as classified by the WHO/UNICEF JMP, includes a flush/pour flush toilet to a piped sewer sy stem, septic tank or p it latrine; a ventilated improved pit latrine; a pit latrine with slab; or a composting toilet. It does not include a shared facility; a flush/pour f lush toilet depositing elsewhere that is not a piped sewer system septic tank or p it latrine; a pit latrine without a slab; a bucket toilet; or a hanging toilet.

5.1 STUDY SAMPLING FRAME AND RANDOMIZATION
The universe of communes targeted by NOURISH was s elected based on the following criteria: (1) communes wher e at least 30 percent o f the population lives below the poverty line,21 and (2) communes wher e latrine subsidies are not currently in place. From this list of eligible communes, 12 were excluded from pilot activities during Year 1 and an additional 12 communes were excluded due to prior commitments with the provincial governments regarding intervention delivery. The remaining 58 communes were part of the initial universe that the evaluation team randomized in September 2015 into three treatment groups ( 39 communes) and a control group (19 communes) using Stata13. NOURISH and USAID/Cambodia agreed to roll out project activities based on this randomized assignment.
In June 2016, NOURISH notified the evaluation team that it was excluding three communes from the original list of 58 randomized communes: one commune from the nutrition+sanitation group and two communes from the nutrition-only group. These communes we re excluded due to objections by local government and a perceived overlap with other c urrent development pr ogramming. Thus, the final evaluation design included 55 communes (see TABLE 3).
5.2 SAMPLE SIZE AND POWER CALCULATIONS
The evaluation team conducted initial power calculations to estimate the minimum detectable effect sizes ( MDES) and then revisited the power calculations using the baseline data22 to get a more precise estimate of the MDES. The team used the following assumptions:
Power: 80%. Significance level: 95% (using a two-sided test). Baseline HAZ: Mean of -0.96 with a standard deviation of 1.187. Intra-cluster correlation coefficient (ICC): 0.014 on the HAZ o utcome variable at the commune
level. Increase in allocation of eligible communes to the control group to 19 communes (one-third of
the total), to enhance statistical efficiency of multiple hypothesis testing.23
Given the limited number of available clusters (55 communes), the team chose the final sample to balance the size of the study (a key determinant of cost) and the detectable difference between groups, resulting in a total of 4,015 households (consisting of 73 observations per cluster).
These sample size calculations indicate that this study has sufficient power to detect a MDES of 0.19 for differences in HAZ scores between treatment groups and a MDES of 0.18 for differences between each treatment group and the control group. While empirical evidence to serve as an adequate basis for the MDES is l imited, the WASH-Benefits efficacy trial set its sample size to detect a similar HAZ MDES of 0.18 between treatment groups and a MDES of 0.15 in mean HAZ scores bet ween treatment and control groups. Using the baseline HAZ mean of -0.96 and standard deviation of 1.187, this translates to a 23.4 percent change in HAZ scores bet ween treatment groups, and a 22.2 percent change in HAZ scores between treatment and control groups. The evaluation is well-positioned to measure changes anticipated by the NOURISH project.
21 According to the Cambodia Ministry of Planning’s Commune Database (2011). 22 The Evaluation Design Proposal assumed an ICC of 0.01 on the HAZ outcome variable at the commune level,
relying on baseline data from the USAID-funded HARVEST project. The actual ICC, using our o wn baseline data, is 0.014, which results in a slightly larger MDES.
23 Fleiss, J. L. (1986). The design and analysis of clinical experiments. New York: Wiley.
EVALUATION REPORT: IMPACT EVALUATION OF THE CAMBODIA NOURISH PROJECT 13
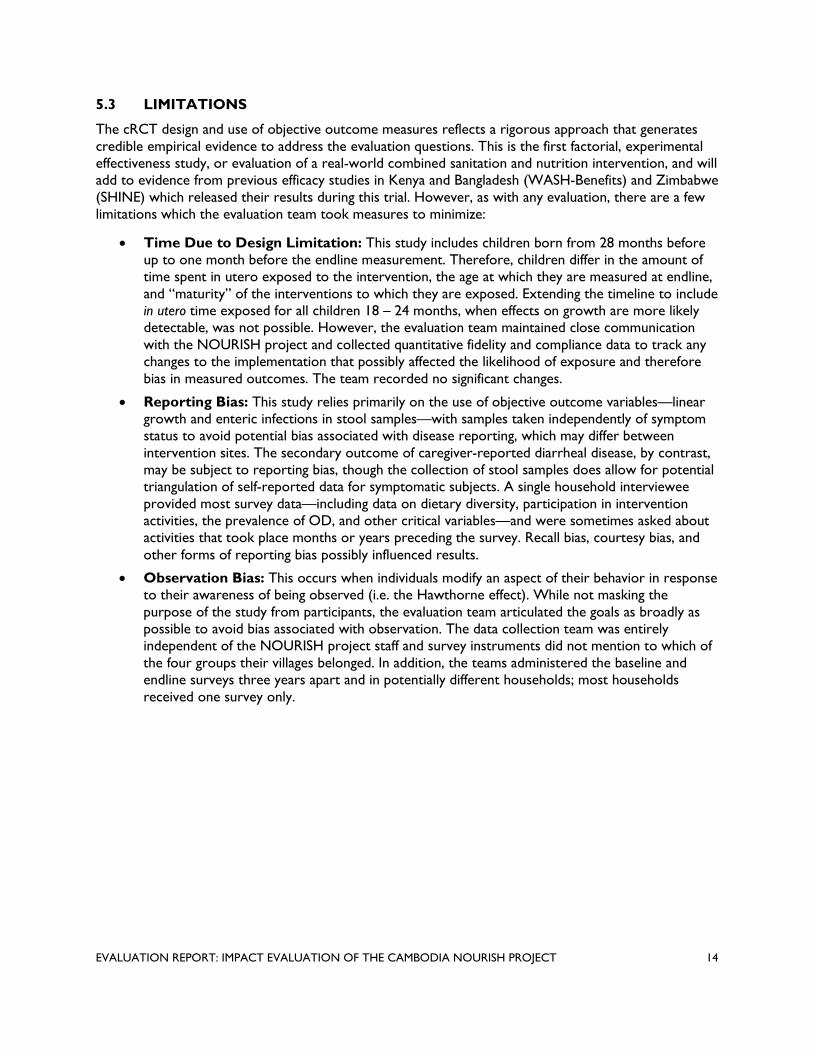
5.3 LIMITATIONS
The cRCT design and use of objective outcome measures reflects a rigorous approach that generates credible empirical evidence to address the evaluation questions. This is the first factorial, experimental effectiveness study, or evaluation of a real-world combined sanitation and nutrition intervention, and will add to evidence from previous efficacy studies in Kenya and Bangladesh (WASH-Benefits) and Zimbabwe (SHINE) which released their results during this trial. However, as with any evaluation, there are a few limitations which the evaluation team took measures to minimize:
Time Due to Design Limitation: This study includes children born from 28 months before up to one month before the endline measurement. Therefore, children differ in the amount o f time spent in utero exposed to the intervention, the age at which they are measured at endline, and “maturity” of the interventions to which they are exposed. Extending the timeline to include in utero time exposed for all children 18 – 24 months, when effects on growth are more likely detectable, was not possible. However, the evaluation team maintained close communication with the NOURISH project and collected quantitative fidelity and compliance data to track any changes to the implementation that possibly affected the likelihood of exposure and therefore bias i n measured outcomes. The team recorded no significant changes.
Reporting Bias: This study relies primarily on the use of objective outcome variables—linear growth and enteric inf ections in stool samples—with samples taken independently of symptom status to avoid potential bias a ssociated with disease reporting, which may differ between intervention sites. The secondary outcome of caregiver-reported diarrheal disease, by contrast, may be subject to reporting bias, though the collection of stool samples does allow for po tential triangulation of self-reported data for symptomatic subjects. A single household interviewee provided most survey data—including data on dietary diversity, participation in intervention activities, the prevalence of OD, and other critical variables—and were sometimes a sked about activities t hat took place months or years p receding the survey. Recall bias, courtesy bias, and other forms of reporting bias po ssibly i nfluenced results.
Observation Bias: This occurs when individuals modify an aspect of their b ehavior in response to their a wareness of being observed (i.e. the Hawthorne effect). While not masking the purpose of the study from participants, the evaluation team articulated the goals as broadly as possible to avoid bias associated with observation. The data collection team was entirely independent of the NOURISH project staff and survey instruments did not mention to which of the four g roups their villages bel onged. In addition, the teams administered the baseline and endline surveys t hree years a part and in potentially different households; most households received one survey only.
EVALUATION REPORT: IMPACT EVALUATION OF THE CAMBODIA NOURISH PROJECT 14

6.0 DATA COLLECTION
The evaluation team collected baseline data in September 2016, which consisted of anthropometric measures of children under 24 months of age and an approximately 20-minute survey t o the primary caregiver t o collect data on key factors associated with stunting in Cambodia. This data was used to confirm balance across the four study groups.24
Extensive endline data was collected in August 2019 to estimate the treatment effects across the key outcomes, in addition to data on fidelity, uptake, and intermediate outcomes.
A household visit and survey that covers the entire study area was conducted at endline to gather data on the impact and intermediate outcome measures described earlier. Data collection was implemented by a local survey research firm, with close collaboration and supervision provided by the evaluation team to ensure high-quality data. The survey targeted households with children between one-to 28-months-old to ensure they were exposed to the project throughout their entire lifetime. The evaluation team conducted the endline survey 28 months after all treatment communes were “exposed” to their relevant project activities to measure differences in the primary and secondary outcomes. The survey was administered face-to-face at the eligible respondents’ household, with the primary caregiver of the target children. In addition, the team collected stool samples from children to measure the prevalence of enteric infections; the analysis and findings will be presented under separate cover.
Table 5 summarizes the different data collection tools used for this evaluation.
TABLE 5: DATA COLLECTION MATRIX
Indicators Baseline Monitoring
Endline
Household Survey
Direct Observation
Anthro-pometry
Stool Sample
Height, weight, age X X
Enteric infections X
Self-reported diarrhea X X
All-cause child mortality and illness symptoms
X X
Nutrition and feeding practices
X X
Use of nutrition and ECD services
X
Environmental hygiene X X
Sanitation coverage X X
Uptake of interventions X X
Fidelity (delivery) of interventions
X X
HH characteristics X X
24 Brown, J., Cumming, O. & Velez, I. (2017). Baseline report: Impact evaluation of the Cambodia integrated nutrition, hygiene, and sanitation project. USAID Development Experience Clearinghouse. https://pdf.usaid.gov/pdf_docs/PA00N1R7.pdf
EVALUATION REPORT: IMPACT EVALUATION OF THE CAMBODIA NOURISH PROJECT 15

6.1 SAMPLING METHODOLOGY
The endline sampling frame consists of households within the 491 villages in the 55 evaluation communes. We collected data from two different samples within these same communes. The main sample was randomly selected from households with at least one child aged one to 28 months. The secondary sample, which was used to estimate village-level WASH indicators, consisted of any household within these communes.
The resulting sample size from the power calculations described above was a total of 4,015 children (consisting of 73 observations per cluster) from eligible households selected randomly across the study area. Eligible households include those that have at least one child aged one- to 28-months-old who lived in that commune his/her entire life. A two-stage cluster sampling method was used to select a random sample. In the first stage, the total sample in each province was divided by the number of villages in each province to select a number of households in each village. After dividing the calculated 4,015 sample size by the 491 villages, the rounded average number of households per village is eight. For the remaining balance of 87 surveys, one additional survey was added randomly to 87 villages in the sample, for a total of nine surveys in those villages. Before data collection for the second stage, the team, in consultation with the village chief and the VHSG, developed a list of households with eligible children in each village. If the number of eligible households in the village was equal to or less than eight, then the team surveyed all households. If the number was greater than eight, the total number of households in the village with a child one- to 28-months-old was entered into a random number generator app to generate 12 numbers; the team surveyed the first eight households and the last four served as replacement households if three visits to a selected household were unsuccessful.
For t he secondary sample, in order to collect reliable point-estimates of sanitation coverage at the group level, the required sample size was c alculated based on a conventional approach for proportions, at the 95% confidence level with a margin of error of +/-5%.
N = (1 − ) ∗ [ ]∗ 4 = 0.393(1 − 0.393) ∗ [ME
1.96 ] ∗ 4 = 1,467 0.05
where:
= proportion of sanitation coverage of 0.393, estimated using baseline data = 1.96 (for 95% confidence level) ME = margin of error of +/-5%
Given the 491 villages, sample size was rounded up to three additional randomly selected households per village, for a target total of 1,473 additional households. Required sample sizes stratified by province is summarized in TABLE 6. To select households for the secondary sample, the enumerators did not randomly draw from a complete list of all households within each village because of logistical and budgetary constraints to obtain full village lists and to displace the enumerators over widely dispersed geographic areas. Instead, enumerators used the third, fifth, and seventh households from the main sample as anchors for the secondary sample. From the third household in the main sample, they walked clockwise until reaching the third household from their starting point, and they selected this household for the secondary sample. They followed the same process from the fifth and seventh households in the main sample, walking clockwise until reaching the third household from their starting point. This resulted in three randomly selected households for the secondary sample. Since the eligibility criterion for the households in the main sample (i.e., having a child one to 28 months) is not correlated to the latrine situation of the other households, and the main sample included randomly selected households, this household selection process results in an unbiased sample. The enumerators visited all selected households at least three times before replacing them with another randomly selected household.
EVALUATION REPORT: IMPACT EVALUATION OF THE CAMBODIA NOURISH PROJECT 16
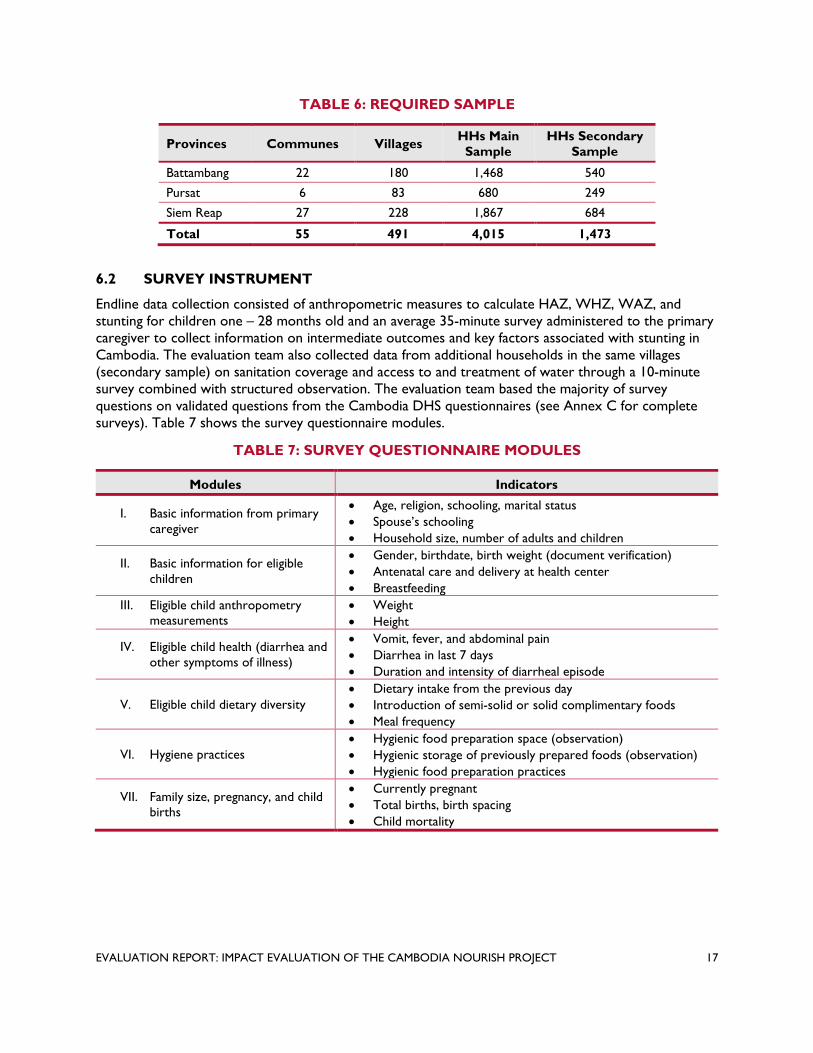
TABLE 6: REQUIRED SAMPLE
Provinces Communes Villages HHs Main
Sample HHs Secondary
Sample
Battambang 22 180 1,468 540
Pursat 6 83 680 249
Siem Reap 27 228 1,867 684
Total 55 491 4,015 1,473
6.2 SURVEY INSTRUMENT
Endline data collection consisted of anthropometric measures to calculate HAZ, WHZ, WAZ, and stunting for children one – 28 months old and an average 35-minute survey administered to the primary caregiver to collect information on intermediate outcomes and key factors associated with stunting in Cambodia. The evaluation team also collected data from additional households in the same villages (secondary sample) on sanitation coverage and access to and treatment of water through a 10-minute survey combined with structured observation. The evaluation team based the majority of survey questions on validated questions from the Cambodia DHS questionnaires (see Annex C for complete surveys). Table 7 shows the survey questionnaire modules.
TABLE 7: SURVEY QUESTIONNAIRE MODULES
EVALUATION REPORT: IMPACT EVALUATION OF THE CAMBODIA NOURISH PROJECT 17
Modules Indicators
I. Basic information from primary caregiver
Age, religion, schooling, marital status Spouse’s schooling
Household size, number of adults and children
II. Basic information for eligible children
Gender, birthdate, birth weight (document verification) Antenatal care and delivery at health center
Breastfeeding
III. Eligible child anthropometry Weight measurements Height
IV. Eligible child health (diarrhea and other symptoms of illness)
Vomit, fever, and abdominal pain Diarrhea in last 7 days Duration and intensity of diarrheal episode
Dietary intake from the previous day V. Eligible child dietary diversity Introduction of semi-solid or solid complimentary foods
Meal frequency
Hygienic food preparation space (observation) VI. Hygiene practices Hygienic storage of previously prepared foods (observation)
Hygienic food preparation practices
VII. Family size, pregnancy, and child births
Currently pregnant Total births, birth spacing
Child mortality

Modules Indicators
VIII. Exposure to nutrition and sanitation/hygiene interventions in last 24 months
Receipt of different nutrition and sanitation/hygiene related products and vouchers
Enrollment in conditional cash transfer program Participation in nutrition or sanitation education activities Home health visits from VHSG Attitudes and perceptions from CLTS activity and building a
latrine
IX. Household WASH conditions
Drinking water source, access, and treatment Handwashing station (observation) Handwashing at critical times Sanitation facility (observation) Privacy, access and functioning use of sanitation facility
(observation) Perceptions on open defecation Disposal of child’s stool Safe play environment for children
X. Household characteristics
Asset inventory Fuel source Floor, roof, and wall material (observation) Number of rooms IDPoor cardholder (document verification)
The National Ethics Committee for Health Research in the Cambodian Ministry of Health reviewed and approved the protocols ( NECHR #110) prior to the start of data collection. The study also received approvals from the Institutional Review Board at Georgia Institute of Technology (Ref: H19286) and from New England IRB (IRB#: 120190186). The study is r egistered in the ISRCTN registry (ISRCTN77820875)
The evaluation team carried out endline data collection in August 2019 with a team of 40 paired enumerators, five supervisors, an anthropometry specialist, a data manager, a field manager, and the Tetra Tech local coordinator. Additional data collection and data quality assurance protocols are provided in Annex D and the anthropometry protocols in Annex E.
6.3 ENDLINE SAMPLE
The sampling process resulted in the final sample sizes displayed in Table 8: 4,015 households with at least one child aged one to 28 months and 4,124 children total in this age range. The team surveyed an additional 1,473 households (secondary sample) regarding their WASH conditions.
TABLE 8: ENDLINE SAMPLE DISTRIBUTION
Sample NUTR Only
SAN Only
NUTR + SAN
Control Total
Communes 11 13 12 19 55
Villages 95 93 128 175 491
Total HHs surveyed 1,070 1,050 1,416 1,949 5,485
Total HHs with child 1 to 28 months old 786 771 1,034 1,424 4,015
Total children 1 to 28 months old 817 792 1,055 1,460 4,124
EVALUATION REPORT: IMPACT EVALUATION OF THE CAMBODIA NOURISH PROJECT 18
7.0 DATA ANALYSIS METHODS
The analysis o n the impacts of the interventions consists of an intention-to-treat (ITT) analysis, which included all eligible children. The analysis covers all anthropometric outcomes as well as dia rrhea. We used Poisson regression with robust standard errors using a Huber-White Sandwich estimator25 to estimate effect sizes and confidence intervals of anthropometry measures (HAZ, WAZ, WHZ on a continuous scale), child health outcomes (stunting, wasting, underweight), and prevalence of self-reported diarrhea (7-day recall). Effect sizes include mean differences for a nthropometry scores a nd prevalence ratios of child health outcomes and diarrhea, adjusted for village-level clustering with robust standard errors.26
25 Rogers, W. H. (1993). Regression standard errors in clustered samples. Stata Technical Bulletin 13:19–23. Reprinted in Stata Technical Bulletin Reprints, vol. 3: 88–94.
26 Williams, R. L. (2000). A note on robust variance estimation for cluster-correlated data. Biometrics 56: 645– 646.
EVALUATION REPORT: IMPACT EVALUATION OF THE CAMBODIA NOURISH PROJECT 19

8.0 BALANCE BETWEEN TREATMENT AND CONTROL GROUPS AT BASELINE
Balance between the treatment a nd control groups across key characteristics is necessary to show that the groups are the same, on average, prior to the start of the interventions (TABLE 9). Since the evaluation team randomly assigned communes to each study group, then households in communes across these four g roups are expected to have similar characteristics p revious to the interventions. The team did not perform significance tests on baseline differences27. TABLE 9 shows the characteristics o f households across groups at baseline. Baseline household characteristics a re balanced for all variables except spouse education, household size, number of children in the household, and access to electricity. Caregivers in the nutrition only group were more likely to have spouses who attended primary school. Households in the combined intervention group had slightly fewer h ousehold members c ompared to households in the nutrition only group. Households in the combined intervention group and control group had slightly f ewer children compared to households in the nutrition only group. Households in the control group were less l ikely t o have access to electricity.
There was also an imbalance in WASH-related factors. Households in the combined-intervention group and control group were more likely to have an improved source of drinking water, and fewer households in the sanitation-only group reported always treating their drinking water. Fewer households in the sanitation-only group and combined-intervention group reported having access to an improved sanitation facility, and more households in the sanitation-only group reported practicing OD. The team considered these variables in the adjusted analyses described in Section 0.
TABLE 9: BASELINE CHARACTERISTICS
NUTR SAN NUTR+SAN Control
Mean 95% CI Mean 95% CI Mean 95% CI Mean 95% CI
Mother’s age (years) 27.7 (27.2, 28.1) 27.5 (27.0, 28.0) 27.7 (27.3, 28.1) 27.8 (27.4, 28.1)
Buddhist 0.98 (0.97, 1.00) 0.97 (0.94, 1.00) 0.96 (0.94, 0.99) 0.99 (0.97, 1.00)
Married or living together 0.96 (0.95, 0.98) 0.97 (0.95, 0.98) 0.97 (0.96, 0.99) 0.97 (0.96, 0.98)
Primary caregiver attended
primary school 0.89 (0.86, 0.92) 0.85 (0.82, 0.88) 0.88 (0.85, 0.90) 0.83 (0.8, 0.86)
Spouse attended primary
school 0.91 (0.89, 0.93) 0.85 (0.82, 0.88) 0.88 (0.85, 0.90) 0.83 (0.81, 0.86)
Household size 5.61 (5.45, 5.76) 5.47 (5.30, 5.64) 5.19 (5.05, 5.33) 5.42 (5.31, 5.54)
Number of children in HH 2.64 (2.54, 2.75) 2.53 (2.42, 2.64) 2.33 (2.24, 2.43) 2.42 (2.34, 2.49)
Has electricity 0.59 (0.52, 0.65) 0.51 (0.46, 0.56) 0.53 (0.49, 0.58) 0.41 (0.37, 0.45)
Owns a mobile phone 0.86 (0.83, 0.89) 0.86 (0.83, 0.88) 0.82 (0.80, 0.85) 0.85 (0.83, 0.87)
Has a finished floor [1] 0.93 (0.91, 0.95) 0.94 (0.93, 0.96) 0.96 (0.95, 0.97) 0.96 (0.95, 0.97)
27 de Boer, M. R., Waterlander, W. E., Kuijper, L. D. et al. (2015). Testing for b aseline differences in randomized controlled trials: an unhealthy research behavior that is hard to e radicate. Int J Behav Nutr Phys Act 12: 4.
EVALUATION REPORT: IMPACT EVALUATION OF THE CAMBODIA NOURISH PROJECT 20

NUTR SAN NUTR+SAN Control
Mean 95% CI Mean 95% CI Mean 95% CI Mean 95% CI
Ever breastfed 0.98 (0.96, 0.99) 0.99 (0.98, 1.00) 0.99 (0.98, 0.99) 0.98 (0.97, 0.99)
Improved drinking water
source [2] 0.65 (0.61, 0.69) 0.69 (0.65, 0.73) 0.75 (0.72, 0.79) 0.80 (0.78, 0.83)
Always treats drinking water 0.54 (0.50, 0.58) 0.47 (0.43, 0.51) 0.53 (0.49, 0.56) 0.52 (0.49, 0.55)
Handwashing station with
soap and water 0.56 (0.51, 0.60) 0.54 (0.49, 0.58) 0.57 (0.53, 0.61) 0.57 (0.54, 0.60)
Improved sanitation facility[3] 0.45 (0.40, 0.49) 0.36 (0.32, 0.40) 0.37 (0.33, 0.40) 0.40 (0.37, 0.43)
Uses shared toilet facility 0.23 (0.20, 0.27) 0.23 (0.19, 0.27) 0.30 (0.27, 0.33) 0.25 (0.22, 0.28)
Open defecation 0.31 (0.27, 0.36) 0.41 (0.36, 0.46) 0.33 (0.29, 0.37) 0.34 (0.31, 0.38)
Adequate stool disposal [4] 0.64 (0.60, 0.68) 0.64 (0.60, 0.68) 0.67 (0.64, 0.71) 0.64 (0.61, 0.66)
Means are reported proportions unless otherwise specified.
[1] The following floor materials are classified as finished floor: bamboo, wood, vinyl, tile, and c ement. [2] Improved s ources of drinking water include piped water into dwelling/yard/plot, public tap or standpipe, tubewell or borehole, protected d ug well, protected spring, bottled water, and r ainwater. [3] Improved s anitation facilities include flush/pour flush toilet to a piped sewer system, septic tank or pit latrine; a ventilated improved p it latrine; a pit latrine with slab; or a composting toilet. Does not include shared facilities. [4] Adequate stool disposal is defined as child u sed to ilet/latrine, put/rinsed feces into toilet/latrine, or buried feces.
EVALUATION REPORT: IMPACT EVALUATION OF THE CAMBODIA NOURISH PROJECT 21
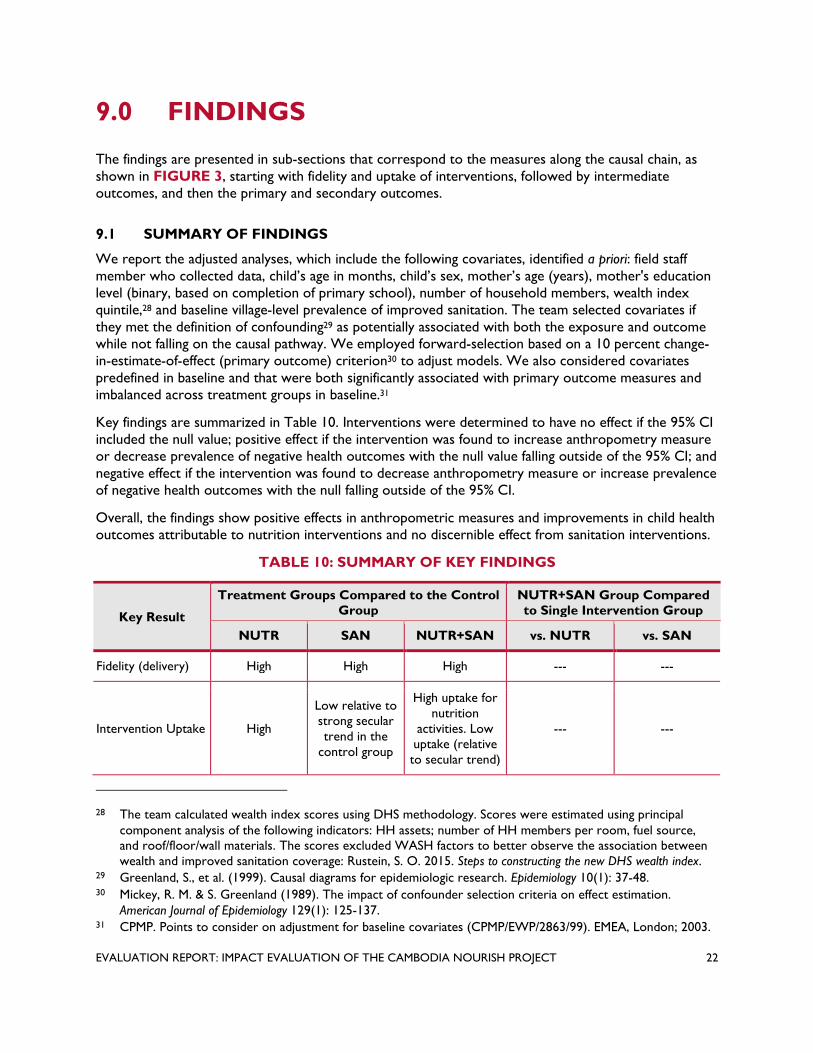
9.0 FINDINGS
The findings are presented in sub-sections that correspond to the measures along the causal chain, as shown in FIGURE 3, starting with fidelity and uptake of interventions, followed by intermediate outcomes, and then the primary and secondary outcomes.
9.1 SUMMARY OF FINDINGS
We report the adjusted analyses, which include the following covariates, identified a priori: field staff member wh o collected data, child’s a ge in months, child’s sex, mother’s a ge (years), mother's education level (binary, based on completion of primary school), number of household members, wealth index quintile,28 and baseline village-level prevalence of improved sanitation. The team selected covariates i f they met the definition of confounding29 as potentially associated with both the exposure and outcome while not falling on the causal pathway. We employed forward-selection based on a 10 percent change-in-estimate-of-effect (primary outcome) criterion30 to adjust models. We also considered covariates predefined in baseline and that were both significantly associated with primary outcome measures and imbalanced across treatment groups in baseline.31
Key findings are summarized in Table 10. Interventions were determined to have no effect if the 95% CI included the null value; positive effect if the intervention was found to increase anthropometry measure or decrease prevalence of negative health outcomes with the null value falling outside of the 95% CI; and negative effect if the intervention was found to decrease anthropometry measure or increase prevalence of negative health outcomes with the null falling outside of the 95% CI.
Overall, the findings show positive effects in anthropometric measures and improvements in child health outcomes attributable to nutrition interventions and no discernible effect from sanitation interventions.
TABLE 10: SUMMARY OF KEY FINDINGS
Key Result
Treatment Groups Compared to the Control Group
NUTR+SAN Group Compared to Single Intervention Group
NUTR SAN NUTR+SAN vs. NUTR vs. SAN
Fidelity (delivery) High High High --- ---
Intervention Uptake High
Low relative to strong secular trend in the
control group
High uptake for nutrition
activities. Low uptake (relative to secular trend)
--- ---
28 The team calculated wealth index scores using DHS methodology. Scores were estimated using principal component analysis of the following indicators: HH assets; number o f HH members per room, fuel source, and roof/floor/wall materials. The scores excluded WASH factors to better o bserve the association between wealth and improved sanitation coverage: Rustein, S. O. 2015. Steps to constructing the new DHS wealth index.
29 Greenland, S., et al. (1999). Causal diagrams for epidemiologic research. Epidemiology 10(1): 37-48. 30 Mickey, R. M. & S. Greenland (1989). The impact of confounder selection criteria on effect estimation.
American Journal of Epidemiology 129(1): 125-137. 31 CPMP. Points to consider on adjustment for baseline covariates (CPMP/EWP/2863/99). EMEA, London; 2003.
EVALUATION REPORT: IMPACT EVALUATION OF THE CAMBODIA NOURISH PROJECT 22
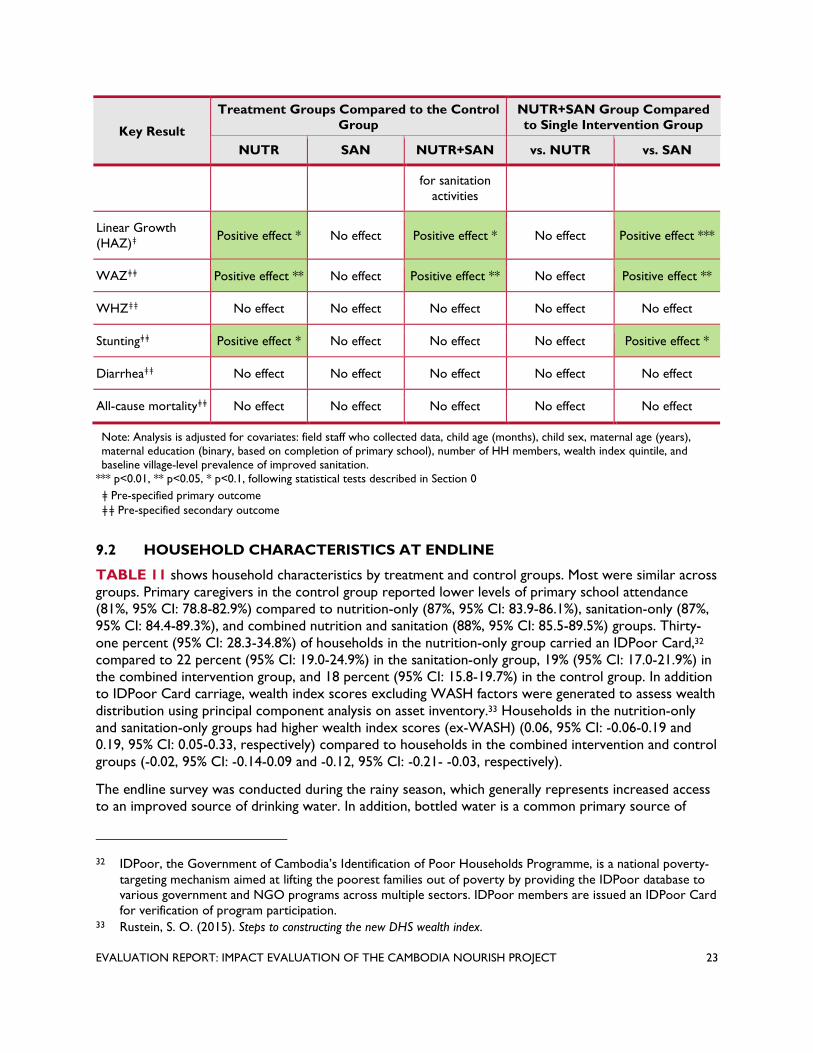
Key Result
Treatment Groups Compared to the Control Group
NUTR+SAN Group Compared to Single Intervention Group
NUTR SAN NUTR+SAN vs. NUTR vs. SAN
for sanitation activities
Linear Growth (HAZ)ǂ Positive effect * No effect Positive effect * No effect Positive effect ***
WAZǂǂ
WHZǂǂ
Positive effect **
No effect
No effect
No effect
Positive effect **
No effect
No effect
No effect
Positive effect **
No effect
Stuntingǂǂ
Diarrheaǂǂ
Positive effect *
No effect
No effect
No effect
No effect
No effect
No effect
No effect
Positive effect *
No effect
All-cause mortalityǂǂ No effect No effect No effect No effect No effect
Note: Analysis is adjusted f or covariates: field staff who collected data, child age (months), child sex, maternal age (years), maternal education (binary, based on completion of primary school), number of HH members, wealth index quintile, and baseline village-level prevalence of improved sanitation.
*** p<0.01, ** p<0.05, * p<0.1, following statistical tests described in Section 0
ǂ Pre-specified primary outcome ǂǂ Pre-specified secondary outcome
9.2 HOUSEHOLD CHARACTERISTICS A T ENDLINE
TABLE 11 shows household characteristics by treatment and control groups. Most were similar across groups. Primary caregivers in the control group reported lower levels o f primary school attendance (81%, 95% CI: 78.8-82.9%) compared to nutrition-only (87%, 95% CI: 83.9-86.1%), sanitation-only (87%, 95% CI: 84.4-89.3%), and combined nutrition and sanitation (88%, 95% CI: 85.5-89.5%) groups. Thirty-one percent (95% CI: 28.3-34.8%) of households in the nutrition-only group carried an IDPoor Ca rd,32
compared to 22 percent (95% CI: 19.0-24.9%) in the sanitation-only group, 19% (95% CI: 17.0-21.9%) in the combined intervention group, and 18 percent (95% CI: 15.8-19.7%) in the control group. In addition to IDPoor Ca rd carriage, wealth index scores excluding WASH factors were generated to assess w ealth distribution using principal component analysis on asset inventory.33 Households in the nutrition-only and sanitation-only groups had higher wealth index scores (ex-WASH) (0.06, 95% CI: -0.06-0.19 and 0.19, 95% CI: 0.05-0.33, respectively) compared to households in the combined intervention and control groups (-0.02, 95% CI: -0.14-0.09 and -0.12, 95% CI: -0.21- -0.03, respectively).
The endline survey was conducted during the rainy season, which generally represents increased access to an improved source of drinking water. In addition, bottled water is a common primary source of
32 IDPoor, the Government of Cambodia’s Identification of Poor Households Programme, is a national poverty-targeting mechanism aimed at lifting the poorest families out of poverty by providing the IDPoor database to various government and NGO programs across multiple sectors. IDPoor members are issued an IDPoor Card for verification of program participation.
33 Rustein, S. O. (2015). Steps to constructing the new DHS wealth index.
EVALUATION REPORT: IMPACT EVALUATION OF THE CAMBODIA NOURISH PROJECT 23

drinking water for households in the study area. All households that reported bottled water as their primary drinking water source also had access to handwashing stations for domestic us e, observed by field staff, so were classified as h aving an improved water s ource per WHO/UNICEF Joint Monitoring Program (JMP) for Water Supply and Sanitation guidelines.34 There were no differences in prevalence of improved water source as their main source of drinking water, with 59 percent in the nutrition group (95% CI: 56-62%); 56 percent in the sanitation-only group (95% CI: 52-59%); 61percent in the combined-intervention group (95% CI: 58-64%); and 70 percent in control group (95% CI: 68-72%).
TABLE 11: HOUSEHOLD CHARACTERISTICS AT ENDLINE
NUTR SAN NUTR+SAN Control
Mean 95% CI Mean 95% CI Mean 95% CI Mean 95% CI
Buddhist 0.98 (0.97, 0.99) 0.97 (0.96, 0.98) 0.96 (0.95, 0.97) 0.99 (0.98, 0.99)
Married or living together 0.95 (0.93, 0.96) 0.94 (0.92, 0.95) 0.94 (0.92, 0.95) 0.95 (0.94, 0.96)
Maternal age (years) 32.0 (31.2, 32.7) 31.1 (30.4, 31.9) 31.9 (31.2, 32.5) 31.0 (30.5, 31.5)
Primary caregiver attended primary school
0.87 (0.85, 0.89) 0.87 (0.84, 0.89) 0.88 (0.85, 0.89) 0.81 (0.79, 0.83)
Spouse attended primary school
0.90 (0.88, 0.92) 0.86 (0.83, 0.88) 0.87 (0.85, 0.89) 0.87 (0.85, 0.89)
Household size 5.63 (5.48, 5.78) 5.54 (5.40, 5.69) 5.36 (5.24, 5.47) 5.52 (5.42, 5.62)
Number of children in HH 2.61 (2.52, 2.70) 2.61 (2.51, 2.70) 2.43 (2.36, 2.50) 2.43 (2.37, 2.49)
Has electricity 0.73 (0.70, 0.76) 0.74 (0.71, 0.77) 0.76 (0.73, 0.78) 0.75 (0.72, 0.77)
Owns a mobile phone 0.93 (0.92, 0.95) 0.90 (0.88, 0.92) 0.87 (0.85, 0.89) 0.90 (0.89, 0.92)
Has a finished floor [1] 0.92 (0.90, 0.94) 0.93 (0.91, 0.95) 0.96 (0.94, 0.97) 0.96 (0.95, 0.97)
Has IDPoor Card 0.31 (0.28, 0.35) 0.22 (0.19, 0.25) 0.19 (0.17, 0.22) 0.18 (0.16, 0.20)
Wealth index score (ex-WASH) [2] 0.06 (-0.06, 0.19) 0.19 (0.05, 0.33) -0.02 (-0.14, 0.09) -0.12 (-0.21, -0.03)
Improved drinking water source [3] 0.59 (0.56, 0.62) 0.56 (0.52, 0.59) 0.61 (0.58, 0.64) 0.70 (0.68, 0.72)
Has water source on site 0.68 (0.64, 0.71) 0.58 (0.55, 0.61) 0.60 (0.57, 0.63) 0.65 (0.62, 0.67)
Water source is <5 min, roundtrip
0.20 (0.16, 0.25) 0.23 (0.19, 0.28) 0.24 (0.19, 0.29) 0.34 (0.29, 0.39)
Minutes to fetch water, roundtrip
12.42 (10.6, 14.2) 14.14 (12.5, 15.8) 14.50 (13.1, 15.9) 13.56 (12.3, 14.8)
Means are reported proportions unless otherwise specified.
[1] The following floor materials are classified as finished floor: bamboo, wood, vinyl, tile, and c ement. [2] Wealth index scores were calculated using DHS methodology. Scores were estimated using principal component analysis of the following indicators: HH assets; number of HH members per room, fuel source, and r oof/floor/wall materials. The scores excluded WASH factors to better observe the association between wealth and improved s anitation coverage: Shea O. Rustein, “Steps to constructing the new DHS wealth index”, (2015) [3] Improved s ources of drinking water include: piped wa ter into dwelling/yard/plot, public tap or standpipe, tubewell or borehole, protected d ug well, protected spring, bottled water, and r ainwater.
34 World Health Organization. (2006). Core questions on drinking water and sanitation for household surveys.
EVALUATION REPORT: IMPACT EVALUATION OF THE CAMBODIA NOURISH PROJECT 24

9.3 FIDELITY AND UPTAKE O F INTERVENTIONS
NURTURE successfully delivered the nutrition interventions per the evaluation design timeline. Implementation fidelity monitoring data shows that nutrition interventions first rolled out across the respective communes between 28 and 34 months before the endline and continued being delivered through endline data collection. The eight key nutrition interventions include: “First 1,000 Days” community dialogues, held quarterly; “First 1,000 Days” caregiver group education course, held monthly; “First 1,000 Days” village fairs, held bi-annually; growth monitoring program, held monthly; home health visits from VHSG, held monthly; CCT with rolling enrollment which disbursed payments as participants met the various conditions; food vouchers delivered once to CCT participants; and water filter vouchers delivered once to CCT participants.
Table 12 shows that the nutrition interventions were delivered to the nutrition-only and nutrition+sanitation groups, whereas the sanitation-only and control groups report minimal to no exposure to these interventions. The uptake of these key nutrition intervention activities was also measured in ordered outcome groups: none (0 activities), low (1-3 activities), medium (4-6 activities), high (7-8 activities). Caregivers in the nutrition-only and combined intervention groups reported mostly low to medium participation, while caregivers in the sanitation-only and control groups reported mostly no to low participation.
Sanitation interventions were also successfully delivered per the evaluation design timeline. Implementation fidelity monitoring data also shows that sanitation interventions were first rolled-out across the respective communes between 28 and 34 months b efore the endline. The key sanitation interventions include: 1) CLTS triggering event, occurring once in each village; 2) door-to-door f ollow-up visits in each village occurring five times per year after the triggering event to those without latrines to encourage households to buy and build latrines; and 3) latrine vouchers d elivered once to households in villages that reached 75% sanitation coverage.
However, unlike the nutrition interventions, the self-reported data on the uptake of the sanitation interventions does not illustrate clean containment of these interventions to the sanitation-only and nutrition+sanitation groups. There were statistically meaningful differences observed in self-reported CLTS participation across treatment groups. Nutrition-only and combined intervention groups reported higher prevalence of self-reported CLTS participation (14% (95% CI: 11.8-16.6%) and 25% (95% CI: 22.1-27.4%), respectively) compared to sanitation-only and control groups (6% (95% CI: 4.3-7.7%) and 6% (95% CI: 4.4-6.8%), respectively). This could be due to several reasons. First, CLTS campaigns and latrine subsidies were and continue to be active in rural Cambodia, evident in the self-reported survey data and from conversations with NOURISH province coordinators, although analysis o f other programming was beyond the study’s scope and capacity. Second, the survey asked about participation in nutrition and sanitation interventions in the past 24 months. However, the sanitation interventions were not as frequently delivered as the nutrition interventions. Instead, the CLTS triggering event o ccurred once per village and it took place 28 to 34 months before the endline. Thus, the actual timeframe was longer so the survey d id not accurately capture the timeframe when the NOURISH CLTS activity actually took place in these communes. Third, the respondents in the communes receiving nutrition programming possibly confused the description of the CLTS event with other community-level activities t hat included SBCC about l atrines and hygiene. While the survey used visual aids to correctly i dentify the nutrition interventions (i.e. the CCT card, the caregiver group education manual, etc.), there was no visual aid specific to the CLTS activity to make identification easier. NOURISH staff reports t hat latrine vouchers were only distributed to households in villages reaching 75 percent sanitation coverage in the sanitation-only and nutrition+sanitation communes, but that other latrine subsidies existed in the rest of the study area.
EVALUATION REPORT: IMPACT EVALUATION OF THE CAMBODIA NOURISH PROJECT 25

TABLE 12: INTERVENTION UPTAKE
NUTR SAN NUTR+SAN Control
Mean 95% CI Mean 95% CI Mean 95% CI Mean 95% CI
Nutrition:
Participated in any "First 1,000 Days" type activity [1] 0.75 (0.72, 0.78) 0.18 (0.16, 0.21) 0.77 (0.74, 0.80) 0.26 (0.24, 0.29)
Participated in a NOURISH "First 1,000 Days" activity [1] 0.42 (0.38, 0.46) 0.01 (0.00, 0.05) 0.44 (0.41, 0.48) 0.00 (0.00, 0.00)
Participated in any Growth Monitoring Program (GMP)
0.78 (0.76, 0.81) 0.23 (0.20, 0.26) 0.89 (0.87, 0.90) 0.33 (0.31, 0.35)
Participated in a NOURISH GMP
0.77 (0.73, 0.80) 0.02 (0.01, 0.06) 0.73 (0.70, 0.75) 0.02 (0.01, 0.04)
VHSG 0.63 (0.60, 0.67) 0.29 (0.26, 0.32) 0.63 (0.60, 0.66) 0.34 (0.31, 0.36)
Enrolled in any CCT program for health and nutrition [2] 0.27 (0.24, 0.30) 0.02 (0.01, 0.03) 0.22 (0.19, 0.24) 0.02 (0.01, 0.03)
Enrolled in NOURISH CCT [2] 0.90 (0.86, 0.94) 0.05 (0.00, 0.16) 0.90 (0.87, 0.94) 0.00 (0.00, 0.00)
Received any voucher for food basket
0.54 (0.50, 0.57) 0.00 (0.00, 0.00) 0.53 (0.49, 0.56) 0.00 (0.00, 0.01)
NOURISH voucher for food basket [3] 0.87 (0.84, 0.90) 0.00 (0.00, 0.00) 0.86 (0.84, 0.89) 0.01 (0.00, 0.07)
Received any voucher for water filter
0.05 (0.04, 0.07) 0.05 (0.04, 0.07) 0.14 (0.12, 0.16) 0.07 (0.06, 0.08)
NOURISH voucher for water filter [3] 0.32 (0.19, 0.48) 0.10 (0.04, 0.24) 0.76 (0.68, 0.82) 0.01 (0.00, 0.07)
Aware of Grow Together campaign [4] 0.43 (0.40, 0.47) 0.12 (0.09, 0.14) 0.45 (0.42, 0.48) 0.10 (0.09, 0.12)
Nutrition intervention uptake:
None (0 of 8 activities) 0.08 (0.06, 0.10) 0.51 (0.48, 0.54) 0.04 (0.03, 0.06) 0.40 (0.38, 0.43)
Low (1-3 of 8 activities) 0.32 (0.29, 0.35) 0.45 (0.42, 0.49) 0.35 (0.32, 0.38) 0.55 (0.53, 0.58)
Medium (4-6 of 8 activities) 0.47 (0.44, 0.51) 0.04 (0.03, 0.05) 0.47 (0.44, 0.51) 0.04 (0.04, 0.06)
High (7-8 of 8 activities) 0.13 (0.10, 0.15) 0.00 (0.00, 0.00) 0.14 (0.12, 0.16) 0.00 (0.00, 0.00)
Sanitation:
Any CLTS participation [5] 0.14 (0.12, 0.17) 0.06 (0.04, 0.08) 0.25 (0.22, 0.27) 0.06 (0.04, 0.07)
Received any voucher to build latrine
0.08 (0.06, 0.10) 0.06 (0.05, 0.08) 0.12 (0.10, 0.14) 0.06 (0.05, 0.07)
NOURISH voucher to build latrine [6] 0.15 (0.08, 0.26) 0.14 (0.07, 0.26) 0.46 (0.37, 0.54) 0.01 (0.00, 0.08)
Means are reported as proportions unless otherwise specified. [1] "First 1,000 Days" activities include: community dialogues, caregiver group education sessions, and village fairs. NOURISH "First 1,000 Days" activities administered in Nutrition-only and NUTR+SAN communes only. [2] NOURISH CCT program ended in Jan 2019 and the Government of Cambodia started a new CCT program in July 2019 across study area. NOURISH CCT program administered in Nutrition and N UTR+SAN communes only.
[3] NOURISH vouchers for water filter and f ood baskets were targeted subsidies distributed to CCT participants in Nutrition-only and NUTR+SAN communes.
EVALUATION REPORT: IMPACT EVALUATION OF THE CAMBODIA NOURISH PROJECT 26

[4] Grow T ogether campaign was part of the nutrition programming (Nutrition-only and N UTR+SAN communes). However, three TV spots were seen across all four groups. [5] In Sanitation-only and NUTR+SAN communes, the Ministry of Rural Development confirmed that NOURISH was the only CLTS campaign active in those areas. [6] NOURISH latrine vouchers were targeted s ubsidies given to households in villages that reached 75 percent sanitation coverage in Sanitation-only and N UTR+SAN communes.
9.4 SANITATION COVERAGE AND PREVALENCE O F OPEN DEFECATION
While self-reported information on the uptake of sanitation interventions may not be reliable due to the issues discussed above, we did collect information on intermediate outcomes, specifically the type of toilet facility in each household. The reported response was confirmed through direct observation of the toilet facility by the enumerator who also took two photographs of the latrine (one from above the drop hole and another one from the outside to capture any superstructure). The evaluation team audited a random sub-sample (5 percent) of the photographs to ensure correct categorization of the type of toilet facility.
The combined intervention group was found to have greater access to improved sanitation facilities (60.5%, 95% CI: 57.4-63.4%) compared to the nutrition-only (55.3%, 95% CI: 51.8-58.8%), sanitation-only (50.5%, 95% CI: 47.0-54.0%), and control (52.0%, 95% CI: 49.4-54.6%) groups. Prevalence of OD was lower in the combined intervention group (6.9%, 95% CI: 5.5-8.6%) compared to the nutrition-only (13.7%, 95% CI: 11.4-16.3%), sanitation-only (15.9%, 95% CI: 13.4-18.7%), and control (15.8%, 95% CI: 14.0-17.8%) groups. Conversations with NOURISH staff confirmed that households receiving nutrition interventions benefitted from more frequent SBCC regarding sanitation and hygiene practices which possibly contributed to greater improved sanitation coverage in these areas.
TABLE 13: SANITATION INTERMEDIATE OUTCOMES
NUTR SAN NUTR+SAN Control
Mean 95% CI Mean 95% CI Mean 95% CI Mean 95% CI
Improved sanitation facility [1] 0.55 (0.52, 0.59) 0.51 (0.47, 0.54) 0.60 (0.57, 0.63) 0.52 (0.49, 0.55)
Any sanitation facility [2] 0.86 (0.84, 0.88) 0.84 (0.81, 0.86) 0.93 (0.91, 0.94) 0.84 (0.82, 0.86)
Open defecation [3] 0.14 (0.12, 0.16) 0.16 (0.14, 0.19) 0.07 (0.06, 0.09) 0.16 (0.14, 0.18)
Shared toilet 0.31 (0.28, 0.34) 0.34 (0.30, 0.37) 0.33 (0.30, 0.35) 0.32 (0.30, 0.35)
Caregiver reported adults in HH openly defecating
0.13 (0.11, 0.16) 0.18 (0.15, 0.21) 0.12 (0.10, 0.14) 0.18 (0.16, 0.20)
Time to get to toilet, one way (minutes)
4.22 (3.61, 4.84) 3.92 (3.33, 4.50) 3.93 (3.40, 4.46) 4.47 (3.95, 5.00)
Latrine built as result of CLTS activity (self-reported)
0.44 (0.35, 0.54) 0.33 (0.21, 0.47) 0.35 (0.29, 0.41) 0.35 (0.25, 0.46)
Latrine built using latrine voucher (self-reported)
0.20 (0.11, 0.34) 0.27 (0.10, 0.55) 0.41 (0.31, 0.51) 0.43 (0.26, 0.62)
Main reason for not constructing latrine (for those who did not have an existing latrine):
Lack of funds 0.85 (0.61, 0.95) 0.78 (0.52, 0.92) 0.92 (0.81, 0.97) 1.00 n/a
Main reason for constructing latrine:
Privacy 0.14 (0.07, 0.26) 0.40 (0.19, 0.66) 0.07 (0.03, 0.14) 0.25 (0.12, 0.44)
Security 0.20 (0.11, 0.33) 0.13 (0.03, 0.42) 0.22 (0.15, 0.32) 0.14 (0.05, 0.33)
EVALUATION REPORT: IMPACT EVALUATION OF THE CAMBODIA NOURISH PROJECT 27

NUTR SAN NUTR+SAN Control
Mean 95% CI Mean 95% CI Mean 95% CI Mean 95% CI
Hygiene 0.33 (0.22, 0.47) 0.33 (0.14, 0.60) 0.47 (0.37, 0.58) 0.36 (0.20, 0.55)
Open defecation is harmful 0.10 (0.04, 0.22) 0.07 (0.01, 0.37) 0.10 (0.05, 0.18) 0.18 (0.07, 0.37)
Means are reported as proportions unless otherwise specified.
[1] Improved s anitation facilities include: flush/pour flush toilet to a piped s ewer system, septic tank or pit latrine, a ventilated improved p it latrine, a pit latrine with slab, and a composting toilet. [2] Any sanitation includes any flush toilet, any pit latrine, composting toilet, bucket toilet, hanging toilet, and shared facility. [3] Disposal of human feces in fields, forests, bushes, open bodies of water, beaches and o ther open spaces or with solid waste.
We also measured village-level sanitation coverage and OD prevalence by supplementing the primary households surveys (of households with eligible children) with the secondary household surveys (three additional random households from each of the 491 villages), summarized in Table 14. This combined data was used to estimate village-level WASH indicators using the methodology described in Sections 6 and 7. Villages with any sanitation intervention made modest gains in overall sanitation coverage (25 versus 22 percentage points, respectively) and in improved sanitation coverage (27 versus 18 percentage points) compared to control villages from baseline to endline.
TABLE 14: VILLAGE-LEVEL SANITATION COVERAGE AND OPEN DEFECATION
Baseline Endline Change from Baseline to
Endline (% pt.) N
Mean prevalence
95% CI N Mean
95% CI prevalence
Open defecation
NUTR 95 32% (26%, 37%) 95 14% (9%, 19%) -18% pt.
SAN 93 41% (35%, 47%) 93 16% (11%, 20%) -25% pt.
NUTR+SAN 128 33% (28%, 38%) 128 10% (6%, 13%) -23% pt.
Control 175 34% (30%, 39%) 175 12% (9%, 15%) -22% pt.
Any sanitation intervention 221 36% (33%, 40%) 221 12% (9%, 15%) -24% pt.
Any sanitation coverage
NUTR 95 68% (65%, 72%) 95 86% (81%, 91%) 18% pt.
SAN 93 58% (55%, 62%) 93 84% (80%, 89%) 26% pt.
NUTR+SAN 128 67% (64%, 70%) 128 90% (87%, 94%) 23% pt.
Control 175 66% (63%, 68%) 175 88% (84%, 91%) 22% pt.
Any sanitation intervention 221 63% (61%, 65%) 221 88% (85%, 91%) 25% pt.
Improved sanitation coverage [1]
NUTR 95 45% (40%, 50%) 95 61% (55%, 67%) 16% pt.
SAN 93 36% (31%, 41%) 93 59% (53%, 65%) 23% pt.
NUTR+SAN 128 36% (33%, 40%) 128 66% (60%, 71%) 30% pt.
Control 175 40% (37%, 44%) 175 58% (53%, 63%) 18% pt.
Any sanitation intervention 221 36% (33%, 40%) 221 63% (59%, 67%) 27% pt.
EVALUATION REPORT: IMPACT EVALUATION OF THE CAMBODIA NOURISH PROJECT 28

Baseline Endline Change from Baseline to
Endline (% pt.) N
Mean prevalence
95% CI N Mean
95% CI prevalence
Shared sanitation facility (not classified as improved)
NUTR 95 23% (20%, 27%) 95 25% (20%, 30%) 2% pt.
SAN 93 23% (19%, 27%) 93 25% (20%, 30%) 2% pt.
NUTR+SAN 128 30% (27%, 33%) 128 24% (20%, 29%) -6% pt.
Control 175 25% (22%, 28%) 175 29% (25%, 34%) 4% pt.
Any sanitation intervention 221 27% (25%, 29%) 221 24% (21%, 28%) -3% pt.
N = number of villages
[1] Improved sanitation facilities include: flush/pour flush toilet to a piped sewer system, septic tank or pit latrine, a ventilated improved pit latrine, a pit latrine with slab, and a composting toilet.
9.5 ENVIRONMENTAL HYGIENE
We assessed four key caregiver behaviors related to environmental hygiene: drink and use clean water, handwashing with soap and water at critical times, proper disposal of children’s stools, and provision of safe play environments for children.
Implementation programming encouraged these environmental hygiene behaviors in the “First 1,000 Days” activities and the CCT that were part of the nutrition interventions. Those in the nutrition-only group (6.8%, 95% CI: 5.2-8.8%) and combined-intervention group (8.5%, 95% CI: 6.9-10.3%) had greater awareness o f critical handwashing times35 compared to those in the sanitation-only group (4.0%, 95% CI; 2.8-5.7%) and control group (3.6%, 95% CI: 2.7-4.6%), though levels are still low. In addition, there was slightly higher prevalence of soap and water observed at handwashing stations in the combined-intervention (72.4%, 95% CI: 69.6-75.1%) and control (75.5%, 95% CI: 73.2-77.7%) groups than the nutrition-only (68.9%, 95% CI: 65.6-72.1%) and sanitation-only (69.4%, 95% CI: 66.1-72.6%) groups.
Proper disposal of children’s stools i s defined as us ing a toilet/latrine or b urying feces. Discarding feces into a drain, garbage or o ther solid waste, or le ft in the open are classified as "unsanitary" disposal practices. There were statistically m eaningful differences in reported proper d isposal practices o f child feces between treatment groups. Nutrition-only and combined intervention groups were found to have higher prevalence of reported proper d isposal (71.1% (95% CI: 67.9-74.2%) and 74.0% (95% CI: 71.3-76.7%), respectively) compared to the sanitation-only and control groups (65.0% (95% CI: 61.6-68.3%) and 68.0% (95% CI: 65.5-70.4%), respectively). This is due to the fact that “First 1,000 Days” nutrition activities en couraged proper disposal of child feces as part of the key behaviors.
Few households had safe play environments (Table 15), defined as bein g free of observed human feces, animal feces, garbage/household waste, and sharp objects/other harms.36 Twenty-five percent ( 95% CI: 22.4-27.6%) of households in the combined intervention group had child play environments free of feces
35 Defined as the ability to identify at least five of the seven critical handwashing times: before preparing/cooking food; before eating, before breastfeeding or f eeding children under 28 months, after defecating, after changing diapers/cleaning child feces, after c leaning animal feces, and after c leaning the toilet/potty.
36 Wodnik, B. K., et al. (2018). Development and application of novel caregiver hygiene behavior measures relating to food preparation, handwashing, and play environments in Rural Kenya. International Journal of Environmental Research and Public Health, 15, no.9: 1994.
EVALUATION REPORT: IMPACT EVALUATION OF THE CAMBODIA NOURISH PROJECT 29

observed by enumerators a t the time of the household visit, compared to 21.2 percent (95% CI: 18.5-24.1%), 20.5 percent (95% CI: 17.9-23.5%), and 21.2 percent (95% CI: 19.2-23.4%) in the nutrition-only, sanitation-only, and control groups, respectively.
TABLE 15: ENVIRONMENTAL HYGIENE OUTCOMES
NUTR SAN NUTR+SAN Control
Mean 95% CI Mean 95% CI Mean 95% CI Mean 95% CI
Water
Improved source of drinking water
0.59 (0.56, 0.62) 0.56 (0.52, 0.59) 0.61 (0.58, 0.64) 0.70 (0.68, 0.72)
Adequate treatment before drinking water
0.67 (0.64, 0.70) 0.59 (0.56, 0.63) 0.73 (0.70, 0.75) 0.71 (0.69, 0.73)
Hygiene
Awareness of critical handwashing times
0.07 (0.05, 0.09) 0.04 (0.03, 0.06) 0.08 (0.06, 0.09) 0.03 (0.03, 0.05)
Presence of water and soap at handwashing station
0.69 (0.66, 0.72) 0.69 (0.66, 0.73) 0.72 (0.70, 0.75) 0.75 (0.73, 0.78)
Safe play environment for children [1] 0.21 (0.19, 0.24) 0.21 (0.18, 0.24) 0.25 (0.22, 0.28) 0.21 (0.19, 0.23)
Play environment free of or separate from animals
0.22 (0.20, 0.25) 0.24 (0.21, 0.27) 0.25 (0.22, 0.27) 0.20 (0.18, 0.22)
Sanitation
Safe disposal of child stool 0.71 (0.68, 0.74) 0.65 (0.62, 0.68) 0.74 (0.71, 0.77) 0.68 (0.66, 0.70)
Pit/toilet overflows/floods during year
0.16 (0.14, 0.19) 0.16 (0.13, 0.19) 0.14 (0.12, 0.16) 0.20 (0.17, 0.22)
Means are reported proportions unless otherwise specified.
[1] A play environment was considered “safe” if it was observed to be free of feces, household wa ste, and sharp objects.
9.6 NUTRITION INTERMEDIATE OUTCOMES
We surveyed use of health services and feeding behaviors to assess nutritional outcomes. The rates of antenatal care check-ups during pregnancy are high (approximately 90%) across the four groups; however bringing children for monthly growth monitoring was more widely done by caregivers in communes where this activity was promoted by NOURISH (79% in the nutrition-only group and 89% in the combined intervention group) than where it was not promoted (23% in the sanitation-only group and 33% in the control group).
There are no differences in breastfeeding behaviors be tween intervention and control groups, with 64.6 percent (95% CI: 61.2-67.9%) of nutrition-only, 69.0 percent (95% CI: 65.6-72.3%) of sanitation-only, 67.2 percent (95% CI: 64.2-70.0%) of combined-intervention, and 63.1 percent ( 95% CI: 60.5-65.6%) of control group participants reporting continuous breastfeeding for c hildren for the first two years (Table 16: Child Nutrition Outcomes).
The endline survey also collected data about the target children’s dietary intake in the previous 24 hours, including questions on breastfeeding, introduction of solids and semi-solid foods, meal frequency, and consumption of a variety of liquids (formula, milk, juice, soup, and borbor) and solids (eggs, organ
EVALUATION REPORT: IMPACT EVALUATION OF THE CAMBODIA NOURISH PROJECT 30
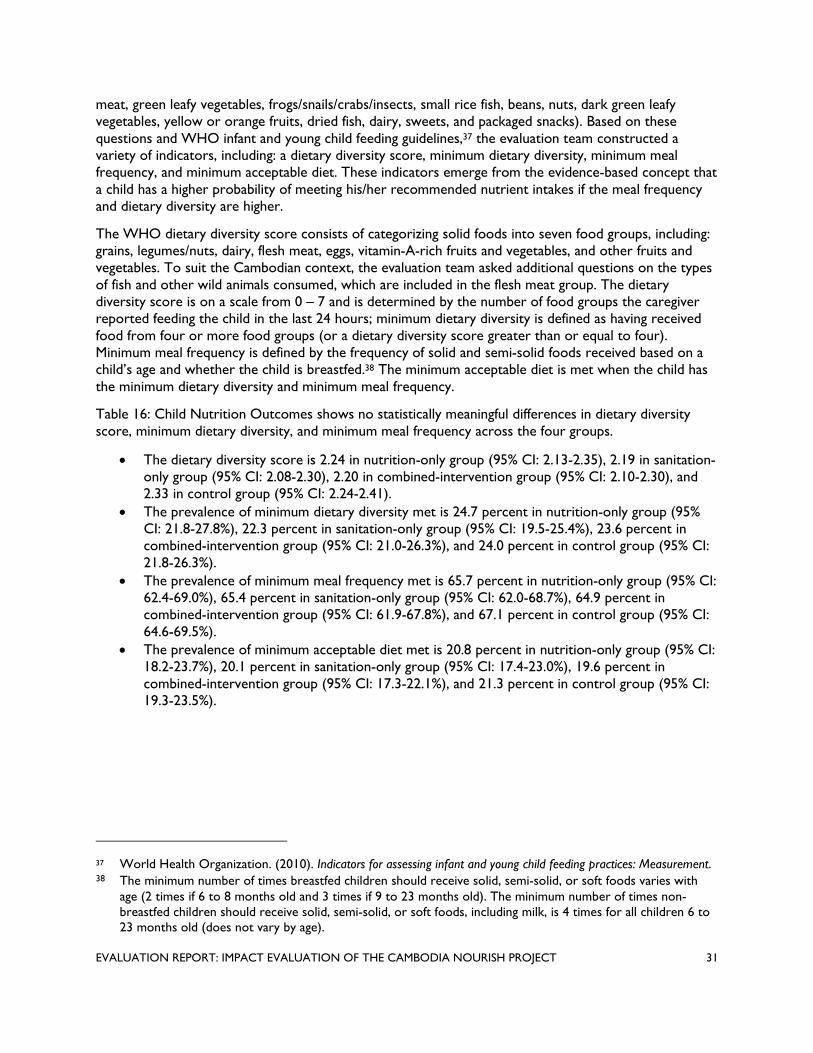
meat, green leafy vegetables, frogs/snails/crabs/insects, small rice fish, beans, nuts, dark green leafy vegetables, yellow or o range fruits, dried fish, dairy, sweets, and packaged snacks). Based on these questions and WHO infant and young child feeding guidelines,37 the evaluation team constructed a variety of indicators, including: a dietary diversity score, minimum dietary diversity, minimum meal frequency, and minimum acceptable diet. These indicators em erge from the evidence-based concept that a child has a higher pr obability of meeting his/her recommended nutrient intakes if the meal frequency and dietary diversity are higher.
The WHO dietary diversity score consists of categorizing solid foods into seven food groups, including: grains, legumes/nuts, dairy, flesh meat, eggs, vitamin-A-rich fruits and vegetables, and other fruits and vegetables. To suit the Cambodian context, the evaluation team asked additional questions on the types of fish and other wild animals c onsumed, which are included in the flesh meat group. The dietary diversity score is on a scale from 0 – 7 and is determined by the number of food groups the caregiver reported feeding the child in the last 24 hours; minimum dietary diversity is d efined as having received food from four or more food groups (or a dietary diversity score greater than or equal to four). Minimum meal frequency is defined by the frequency of solid and semi-solid foods received based on a child’s age and whether the child is br eastfed.38 The minimum acceptable diet is met when the child has the minimum dietary diversity and minimum meal frequency.
Table 16: Child Nutrition Outcomes shows no statistically meaningful differences in dietary diversity score, minimum dietary diversity, and minimum meal frequency across the four groups.
The dietary diversity score is 2.24 in nutrition-only group (95% CI: 2.13-2.35), 2.19 in sanitation-only group (95% CI: 2.08-2.30), 2.20 in combined-intervention group (95% CI: 2.10-2.30), and 2.33 in control group (95% CI: 2.24-2.41).
The prevalence of minimum dietary diversity met is 24.7 percent in nutrition-only group (95% CI: 21.8-27.8%), 22.3 percent in sanitation-only group (95% CI: 19.5-25.4%), 23.6 percent in combined-intervention group (95% CI: 21.0-26.3%), and 24.0 percent in control group (95% CI: 21.8-26.3%).
The prevalence of minimum meal frequency met is 6 5.7 percent in nutrition-only group (95% CI: 62.4-69.0%), 65.4 percent in sanitation-only group (95% CI: 62.0-68.7%), 64.9 percent in combined-intervention group (95% CI: 61.9-67.8%), and 67.1 percent in control group (95% CI: 64.6-69.5%).
The prevalence of minimum acceptable diet met is 20.8 percent in nutrition-only group (95% CI: 18.2-23.7%), 20.1 percent in sanitation-only group (95% CI: 17.4-23.0%), 19.6 percent in combined-intervention group (95% CI: 17.3-22.1%), and 21.3 percent in control group (95% CI: 19.3-23.5%).
37 World Health Organization. (2010). Indicators for assessing infant and young child feeding practices: Measurement. 38 The minimum number of times breastfed children should receive solid, semi-solid, or soft foods varies with
age (2 times if 6 to 8 months old and 3 times i f 9 to 2 3 months old). The minimum number o f times non-breastfed children should receive solid, semi-solid, or soft foods, including milk, is 4 times for all children 6 to 23 months old (does not vary by age).
EVALUATION REPORT: IMPACT EVALUATION OF THE CAMBODIA NOURISH PROJECT 31

TABLE 16: CHILD NUTRITION OUTCOMES
NUTR SAN NUTR+SAN Control
Mean 95% CI Mean 95% CI Mean 95% CI Mean 95% CI
Use of health services
Visited health facility for at least four antenatal care check-ups during pregnancy
0.91 (0.88, 0.93) 0.91 (0.88, 0.93) 0.90 (0.88, 0.92) 0.89 (0.87, 0.90)
Brings child for monthly GMP at community or health center
0.78 (0.76, 0.81) 0.23 (0.20, 0.26) 0.89 (0.87, 0.90) 0.33 (0.31, 0.35)
Nutrition
Breastfeeding exclusively for children <6 months
0.64 (0.56, 0.71) 0.68 (0.61, 0.75) 0.68 (0.62, 0.74) 0.67 (0.61, 0.72)
Breastfed continuously for up to 2 years
0.68 (0.64, 0.71) 0.72 (0.69, 0.75) 0.68 (0.64, 0.70) 0.65 (0.63, 0.68)
Ever breastfed 0.98 (0.96, 0.98) 0.97 (0.95, 0.98) 0.97 (0.96, 0.98) 0.97 (0.97, 0.98)
Solid and semi-solid foods eaten for children >6 months old
0.94 (0.92, 0, 96) 0.97 (0.95, 0.98) 0.94 (0.92, 0.95) 0.96 (0.94, 0.97)
Dietary diversity score (0-7) 2.24 (2.13, 2.35) 2.19 (2.08, 2.30) 2.20 (2.10, 2.30) 2.33 (2.24, 2.41)
Minimum dietary diversity 0.25 (0.22, 0.28) 0.22 (0.20, 0.25) 0.24 (0.21, 0.26) 0.24 (0.22, 0.26)
Minimum meal frequency 0.66 (0.62, 0.69) 0.65 (0.62, 0.69) 0.65 (0.62, 0.68) 0.67 (0.65, 0.69)
Minimum acceptable diet 0.21 (0.18, 0.24) 0.20 (0.17, 0.23) 0.20 (0.17, 0.22) 0.21 (0.19, 0.23)
Means are reported proportions unless otherwise specified.
9.7 ALL-CAUSE CHILD MORTALITY AND ILLNESSES
The endline survey also included questions on the number of pregnancies a nd child births to assess all-cause child mortality. Table 17: All-Cause Mortality shows no discernable differences i n mortality, but there were significant differences in age of death across g roups attributable to the nutrition programming. In the nutrition-only group, the mortality rate was 2.5 percent (95% CI: 1.8-3.3%), and mean age of death was 3 0.2 months (95% CI: 12.6-47.8). In the sanitation-only group, the mortality rate was 2. 8 percent (95% CI: 2.0-3.5%), and mean age of death was 12.0 months (95% CI: 6.3-17.6). In the combined-intervention group, the mortality rate was 2.6 percent ( 95% CI: 1.9-3.4%) and mean age of death was 32.7 months (95% CI: 16.1-49.2). In the control group, the mortality rate was 2. 6 percent (95% CI: 2.0-3.2%), and the mean age of death was 11.2 months (95% CI: 4.4-18.0). Mean age of death in groups that received any nutrition programming (nutrition-only and combined intervention groups) was 31.6 months (95% CI: 19.7-43.4), significantly higher than the mean age of death in groups that received no nutrition programming (sanitation-only and control groups) which was 11.5 months (95% CI: 6.9-16.1). Although this observation does not affect our interpretation of the mortality prevalence data – which shows no overall difference between groups – this finding merits further a nalysis to determine whether there are household or c aregiver c haracteristics, behaviors, practices, or o ther c ovariates that may explain increased age at time of death in the groups receiving nutrition interventions.
EVALUATION REPORT: IMPACT EVALUATION OF THE CAMBODIA NOURISH PROJECT 32

TABLE 17: ALL-CAUSE MORTALITY
N n Mean 95% CI
Child deaths (%)
Nutrition 1574 40 2.5% (1.76%, 3.32%)
Sanitation 1636 45 2.8% (1.96%, 3.54%)
Nutrition+Sanitation 1932 51 2.6% (1.92%, 3.36%)
Control 2687 69 2.6% (1.97%, 3.17%)
Any nutrition 3506 91 2.6% (2.07%, 3.12%)
No nutrition 4323 114 2.6% (2.16%, 3.11%)
Mean age of child at death (months)
Nutrition 1574 40 30.19 (12.62, 47.76)
Sanitation 1636 45 11.95 (6.29, 17.61)
Nutrition+Sanitation 1932 51 32.65 (16.10, 49.20)
Control 2687 69 11.20 (4.43, 17.98)
Any nutrition 3506 91 31.57 (19.73, 43.41)
No nutrition 4323 114 11.50 (6.89, 16.11)
The interventions had no discernable effect on caregiver-reported symptoms of gastrointestinal illnesses when compared against the control group. Prevalence of vomit and fever was similar across all groups (TABLE 18). There was a lower prevalence of abdominal pain in the combined intervention group (12.9%, 95% CI: 10.9-15.0%) and the nutrition-only, sanitation-only, and control groups (15.2% (95% CI: 12.8-17.8%), 15.9% (95% CI: 13.4-18.6%), and 15.8% (95% CI: 13.9-17.7%), respectively).
TABLE 18: OTHER CHILD ILLNESS SYMPTOMS
NUTR SAN NUTR+SAN Control
Mean 95% CI Mean 95% CI Mean 95% CI Mean 95% CI
Vomit, self-reported, 7-day recall
0.09 (0.07, 0.11) 0.12 (0.10, 0.15) 0.10 (0.08, 0.12) 0.11 (0.10, 0.13)
Fever, self-reported, 7-day recall
0.43 (0.40, 0.47) 0.45 (0.41, 0.48) 0.45 (0.42, 0.48) 0.45 (0.42, 0.47)
Abdominal pain, self-reported, 7-day recall
0.15 (0.13, 0.18) 0.16 (0.14, 0.19) 0.13 (0.11, 0.15) 0.16 (0.14, 0.18)
Means are reported proportions unless otherwise specified.
9.8 EFFECT ON CHILD HEALTH O UTCOMES
The mean height-for-age (HAZ) in the control group was - 1.05 HAZ (95% CI: -1.11 - -0.99). Children in the nutrition+sanitation group experienced increases in linear g rowth (HAZ) compared to the control group at the margin of significance39 ( +0.08 HAZ, 95% CI: -0.01-0.17), an increase of 7.3 percent in HAZ, and when compared with the sanitation-only group (+0.14 HAZ, 95% CI: 0.04-0.24), an increase of 12.6 percent in HAZ. Children in the nutrition-only group also experienced increased linear growth
39 Margin of significance determined by p<0.10 and 95% CI that does not cross (or just barely crosses) the null.
EVALUATION REPORT: IMPACT EVALUATION OF THE CAMBODIA NOURISH PROJECT 33
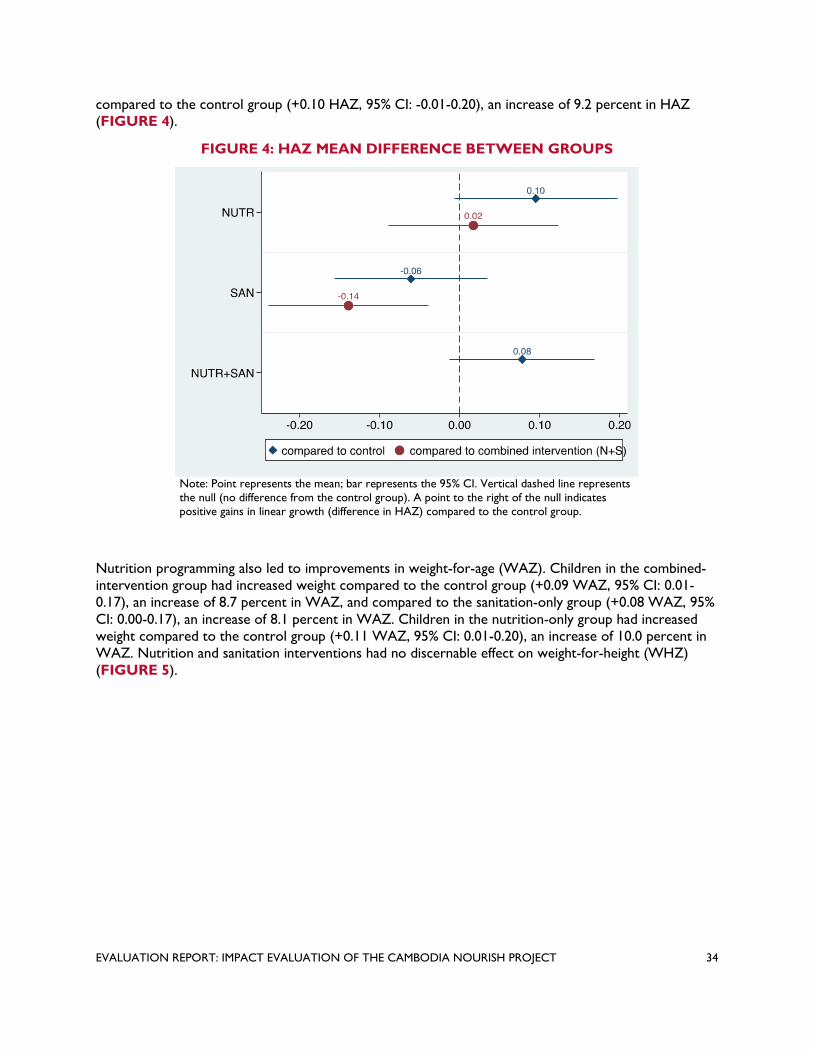
compared to the control group (+0.10 HAZ, 95% CI: -0.01-0.20), an increase of 9.2 percent in HAZ (FIGURE 4).
FIGURE 4: HAZ MEAN DIFFERENCE BETWEEN GROUPS
Note: Point represents the mean; bar represents the 95% CI. Vertical dashed line represents the null (no difference from the control group). A point to the right of the null indicates positive gains in linear growth (difference in HAZ) compared to the control group.
Nutrition programming also led to improvements in weight-for-age (WAZ). Children in the combined-intervention group had increased weight compared to the control group (+0.09 WAZ, 95% CI: 0.01-0.17), an increase of 8.7 percent in WAZ, and compared to the sanitation-only group (+0.08 WAZ, 95% CI: 0.00-0.17), an increase of 8.1 percent in WAZ. Children in the nutrition-only group had increased weight compared to the control group (+0.11 WAZ, 95% CI: 0.01-0.20), an increase of 10.0 percent in WAZ. Nutrition and sanitation interventions had no discernable effect on weight-for-height (WHZ) (FIGURE 5).
EVALUATION REPORT: IMPACT EVALUATION OF THE CAMBODIA NOURISH PROJECT 34
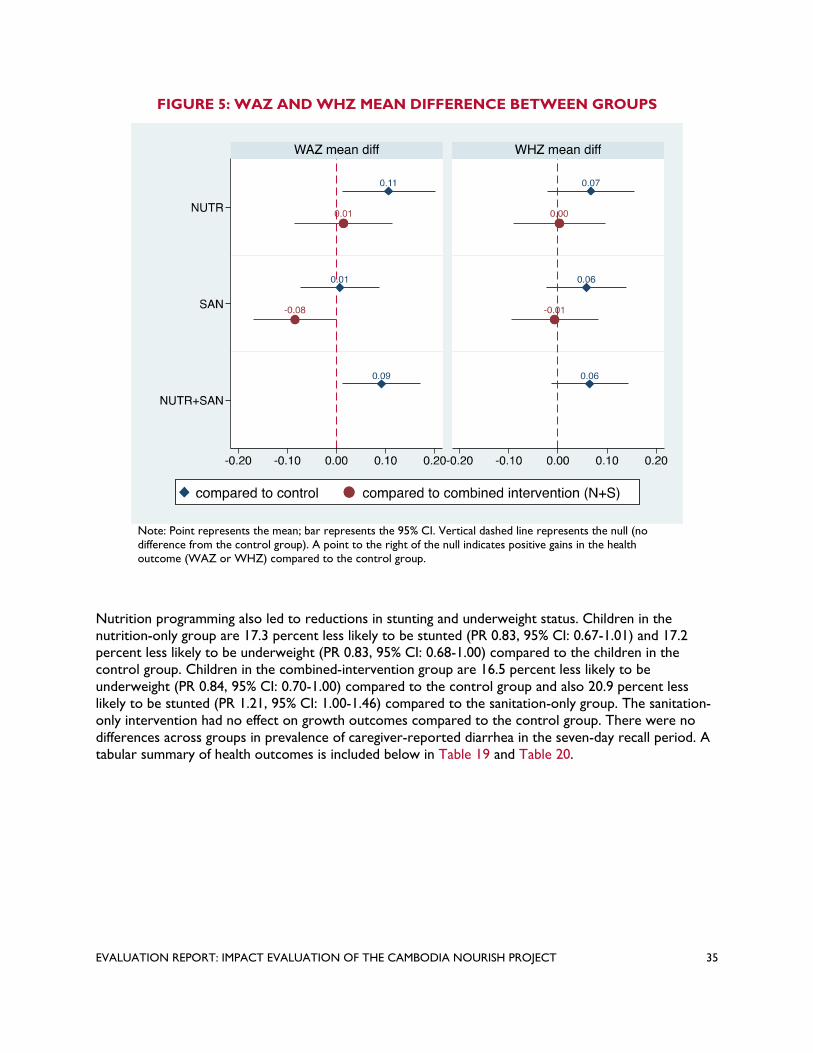
FIGURE 5: WAZ AND WHZ MEAN DIFFERENCE BETWEEN GROUPS
Note: Point represents the mean; bar represents the 95% CI. Vertical dashed line represents the null (no difference from the control group). A point to the right of the null indicates positive gains in the health outcome (WAZ or WHZ) compared to the control group.
Nutrition programming also led to reductions i n stunting and underweight status. Children in the nutrition-only group are 17.3 percent less li kely to be stunted (PR 0.83, 95% CI: 0.67-1.01) and 17.2 percent less l ikely to be underweight (PR 0. 83, 95% CI: 0.68-1.00) compared to the children in the control group. Children in the combined-intervention group are 16.5 percent less likely to be underweight ( PR 0.84, 95% CI: 0.70-1.00) compared to the control group and also 20.9 percent less likely t o be stunted (PR 1.21, 95% CI: 1.00-1.46) compared to the sanitation-only group. The sanitation-only intervention had no effect on growth outcomes c ompared to the control group. There were no differences a cross g roups in prevalence of caregiver-reported diarrhea in the seven-day recall period. A tabular summary of health outcomes is included below in Table 19 and Table 20.
EVALUATION REPORT: IMPACT EVALUATION OF THE CAMBODIA NOURISH PROJECT 35

FIGURE 6: PREVALENCE RATIOS OF KEY CHILD HEALTH OUTCOMES IN
INTERVENTION GROUPS COMPARED WITH CONTROL GROUP
Note: Point represents the mean; bar represents the 95% CI. Vertical line represents the null (no difference from the control group). A point to the right of the null indicates positive gains in the health outcome compared to the control group.
FIGURE 7: PREVALENCE RATIOS OF KEY CHILD HEALTH OUTCOMES IN SINGLE
INTERVENTION GROUPS COMPARED WITH COMBINED INTERVENTION GROUP
Note: Point represents the mean; bar represents the 95% CI. Vertical line represents the null (no difference from the control group). A point to the right of the null indicates positive gains in the health outcome compared to the combined intervention group.
EVALUATION REPORT: IMPACT EVALUATION OF THE CAMBODIA NOURISH PROJECT 36

TABLE 19: IMPACT ESTIMATES - MEAN DIFFERENCES IN ANTHROPOMETRY BETWEEN SINGLE INTERVENTION,
COMBINED INTERVENTION, AND CONTROL GROUPS
Difference from Control Difference fr om NUTR+SAN
Mean Unadjusted Adjustedƚ Unadjusted Adjustedƚ
(unadjusted) Mean Mean Mean Mean
95% CI 95% CI 95% CI 95% CI diff diff diff diff
HAZ ǂ
NUTR -0.96 (-1.04, -0.87) * 0.09 (-0.02, 0.20) * 0.10 (-0.01, 0.20) -0.01 (-0.12, 0.10) 0.02 (-0.09, 0.13)
SAN -1.11 (-1.20, -1.03) -0.06 (-0.17, 0.04) -0.06 (-0.16, 0.03) *** -0.16 (-0.28, -0.05) *** -0.14 (-0.24, -0.04)
NUTR+SAN -0.95 (-1.02, -0.88) ** 0.10 (0.01, 0.19) * 0.08 (-0.01, 0.17) -- -- -- -- -- --
Control -1.05 (-1.11, -0.99) -- -- -- -- -- -- -- -- -- -- --
WAZ ǂǂ
NUTR -0.95 (-1.03, -0.88) ** 0.10 (0.01, 0.19) ** 0.11 (0.01, 0.20) -0.02 (-0.11, 0.08) 0.01 (-0.09, 0.11)
SAN -1.04 (-1.11, -0.98) 0.01 (-0.08, 0.10) 0.01 (-0.07, 0.09) ** -0.10 (-0.20, -0.01) ** -0.08 (-0.17, -0.00)
NUTR+SAN -0.94 (-1.00, -0.88) *** 0.11 (0.03, 0.20) ** 0.09 (0.01, 0.17) -- -- -- -- -- --
Control -1.05 (-1.11, -1.00) -- -- -- -- -- -- -- -- -- -- --
WHZ ǂǂ
NUTR -0.60 (-0.67, -0.52) 0.06 (-0.03, 0.15) 0.07 (-0.02, 0.15) -0.02 (-0.11, 0.08) -0.00 (-0.09, 0.09)
SAN -0.59 (-0.66, -0.53) 0.06 (-0.03, 0.15) 0.06 (-0.02, 0.14) -0.02 (-0.11, 0.07) -0.01 (-0.09, 0.08)
NUTR+SAN -0.58 (-0.64, -0.51) * 0.08 (0.00, 0.16) 0.07 (-0.01, 0.14) -- -- -- -- -- --
Control -0.65 (-0.71, -0.60) -- -- -- -- -- -- -- -- -- -- --
*** p<0.01, ** p<0.05, * p<0.1, following statistical tests described in Section 0 Clustering at the village level ƚ Adjusted f or covariates: field staff who collected data, child age (months), child sex, mother’s age (years), mother’s education (binary, based o n completion of primary school), HH size, and wealth index score (quintile). ǂ Pre-specified primary outcome ǂǂ Pre-specified secondary outcome
EVALUATION REPORT: IMPACT EVALUATION OF THE CAMBODIA NOURISH PROJECT 37

TABLE 20: IMPACT ESTIMATES – PREVALENCE RATIOS IN CHILD GROWTH MEASURES BETWEEN SINGLE
INTERVENTION, COMBINED INTERVENTION, AND CONTROL GROUPS
NUTR 0.15 (0.13, 0.18) * 0.84 (0.69, 1.03) * 0.83 (0.68, 1.01) 0.93 (0.75, 1.15) 0.91 (0.73, 1.13)
SAN 0.21 (0.18, 0.24) 1.12 (0.94, 1.34) 1.10 (0.93, 1.31) ** 1.23 (1.01, 1.50) * 1.21 (1.00, 1.46)
NUTR+SAN 0.17 (0.15, 0.19) 0.91 (0.76, 1.09) 0.91 (0.77, 1.10) -- -- -- -- -- --
Control 0.18 (0.16, 0.21) -- -- -- -- -- -- -- -- -- -- -- --
Wasting ǂǂ
NUTR 0.07 (0.06, 0.09) 0.87 (0.65, 1.17) 0.86 (0.64, 1.15) 1.12 (0.80, 1.57) 1.11 (0.80, 1.55)
SAN 0.07 (0.05, 0.09) 0.84 (0.62, 1.14) 0.81 (0.60, 1.10) 1.08 (0.77, 1.52) 1.05 (0.74, 1.48)
NUTR+SAN 0.07 (0.05, 0.08) * 0.77 (0.57, 1.03) 0.77 (0.58, 1.04) -- -- -- -- -- --
Control 0.08 (0.07, 0.10) -- -- -- -- -- -- -- -- -- -- -- --
Underweightǂǂ
NUTR 0.15 (0.12, 0.17) 0.85 (0.70, 1.04) * 0.83 (0.68, 1.00) 1.04 (0.83, 1.30) 1.00 (0.80, 1.24)
SAN 0.17 (0.15, 0.20) 1.00 (0.83, 1.22) 0.99 (0.84, 1.17) * 1.22 (0.99, 1.51) * 1.18 (0.98, 1.43)
NUTR+SAN 0.14 (0.12, 0.16) ** 0.82 (0.68, 0.99) * 0.83 (0.70, 1.00) -- -- -- -- -- --
Control 0.17 (0.15, 0.19) -- -- -- -- -- -- -- -- -- -- -- --
Diarrhea,ǂǂ caregiver-reported, 7-day recall
NUTR 0.19 (0.16, 0.22) 0.89 (0.74, 1.06) 0.90 (0.75, 1.08) 0.95 (0.78, 1.14) 0.97 (0.81, 1.17)
SAN 0.21 (0.19, 0.24) 0.99 (0.83, 1.17) 0.99 (0.84, 1.16) 1.05 (0.87, 1.26) 1.07 (0.89, 1.27)
NUTR+SAN 0.20 (0.18, 0.23) 0.94 (0.80, 1.10) 0.93 (0.79, 1.09) -- -- -- -- -- --
Control 0.21 (0.19, 0.24) -- -- -- -- -- -- -- -- -- -- -- --
Mean (unadjusted)
Difference from Control Difference from NUTR+SAN
Unadjusted Adjustedƚ Unadjusted Adjustedƚ
PR 95% CI PR 95% CI PR 95% CI PR 95% CI
Stunting ǂǂ
*** p<0.01, ** p<0.05, * p<0.1, following statistical tests described in Section 0. Clustering at the village level ƚ Adjusted f or covariates: field staff who collected data, child age (months), child sex, mother’s age (years), mother’s education (binary, based o n completion of primary school), HH size, and wealth index score (quintile). ǂǂ Pre-specified secondary outcome
EVALUATION REPORT: IMPACT EVALUATION OF THE CAMBODIA NOURISH PROJECT 38

10.0 CONCLUSIONS
10.1 SANITATION
Gains in sanitation coverage may lead to improved growth outcomes in children via reductions in the transmission of enteric infection and disease, though links between sanitation coverage and specific outcomes are poorly understood. The identification of threshold effects—proof that meeting a certain level of sanitation coverage or OD can lead to transformative change and reduction in community-level exposures to enteric pathogens—so far remains elusive. Expanding on the theory of change reflected in Figure 2, CLTS may impact growth outcomes in children if: 1) sanitation coverage increases, leading to greater access; 2) new latrines are used consistently by those with access to them; and 3) OD is reduced. A further criterion—measured as a secondary outcome and to be reported separately—is that exposures to enteric pathogens are reduced in communities receiving sanitation interventions.
We observed no differences in child linear growth, other growth outcomes, diarrhea, or all-cause mortality associated with the sanitation interventions delivered either alone (compared to the control group) or bundled in the nutrition+sanitation group (compared to the nutrition-only group) (Table 10). While we did observe increases in sanitation coverage and reductions in OD, these changes were not meaningfully different from similar trends observed in the control group. Increases in the coverage of improved sanitation could be attributed to the sanitation intervention groups, however.
10.1.1 OBSERVED INCREASES IN SANITATION COVERAGE We measured changes in sanitation coverage (any sanitation facility and improved sanitation facilities between our pre-intervention baseline survey and the endline, observing meaningful increases in coverage for improved sanitation facilities only. These figures are summarized in TABLE 14. While increases are variable between villages and communes, a mean increase in coverage for any sanitation was 26 percent in the sanitation group and 23 percent in the nutrition+ sanitation group between baseline and endline. We also observed mean increases of 18 percent in the nutrition group and 22 percent in the control group, however, reflecting rapid growth in sanitation coverage even in the absence of the NOURISH sanitation interventions. While the mean increases in the groups containing the sanitation programming exceeded the gains in sanitation coverage observed in the other groups (a mean of 25% versus 22%), the difference was marginal and may not be attributable to the intervention activities. The primary gains in sanitation access attributable to the sanitation interventions appears to be increasing improved sanitation, where increases in improved sanitation facilities coverage were substantially higher in the sanitation and nutrition+sanitation groups (23% and 30%, respectively) compared with the nutrition and control groups (16% and 18%, respectively) (TABLE 14).
Attribution of sanitation gains t o specific pr ogramming is especially challenging in Cambodia, given the strong secular trend of rapid growth in sanitation coverage. The percentage of all children younger than five years of age with access to an improved sanitation facility, from nationally representative Demographic and Health Survey (DHS) survey data, was 4.5 percent (95% CI: 3.6-5.6) in 2000, 16.5 percent (95% CI: 14.3-19.0) in 2005, 28.6 percent (95% CI: 26.0-31.3) in 2010,40,41 and 53.5 percent (95%
40 Ikeda, N., Irie, Y. & Shibuya, K. (2013). Determinants of reduced child stunting in Cambodia: analysis of pooled data from three demographic and health surveys. Bulletin of the World Health Organization 91: 341-349.
41 National Institute of Statistics, Directorate General for Health, and ICF International. (2011). Cambodia demographic and health survey 2010.
EVALUATION REPORT: IMPACT EVALUATION OF THE CAMBODIA NOURISH PROJECT 39
CI: 52.4-54.7) in the most recent DHS survey from 2014.42 These percentage point i ncreases r eflect a mean annual rise in overall sanitation access f rom 2.4 percentage points to over 6.2 percentage points in the most recent period. Corresponding increases i n rural areas were also rapid. From 2010 to 2014, access t o any sanitation facility increased from 30.0 percent (95% CI: 29.4-30.4) to 43.6 percent (95% CI: 42-44.9), improved sanitation coverage increased from 26.9 percent (95% CI: 26.4– 27.4%) to 42.5 percent (95% CI: 41.1-43.8), and the prevalence of OD decreased from 70.0 percent (95% CI: 69.6-70.6) to 56.4 percent (95% CI: 55.1-57.7). These estimates suggest an annual increase in coverage of nearly 4 percentage points. These increases s uggest broad investment by households, government, NGOs, and other actors e xpanding access t o sanitation. The pace of development in WASH generally i n rural Cambodia means that measuring the impact of specific programs can be challenging. Because of the lack of clear s anitation coverage increases in the study groups receiving the sanitation intervention compared with the nutrition and control groups, this trial is l imited in determining the effects of such changes on outcomes. In epidemiological terms, there was n o change in exposure across g roups.
10.1.2 UPTAKE AND ADHERENCE OF SANITATION PROGRAMMING: SELF-REPORT We further ex plored uptake of and adherence to sanitation interventions by asking about self-reported CLTS participation, including participation in activities, construction of latrines, and OD (TABLE 12). We consider these data less reliable than the observed increases in sanitation coverage between our baseline and endline surveys—based in part on enumerator observation and not self-report—because of the likely influence of recall bias43 and the significant time since delivery of the CLTS programming, which was 28 to 34 months preceding the endline survey.
Self-report data from household respondents would suggest CLTS participation and uptake was variable but low across groups, reflecting either actual limited participation, recall bias, or respondent confusion about which activities were NOURISH CLTS programming (n.b.: no visual aids on CLTS triggering activities were shown to respondents to prompt recall). The difference between groups is significant, with respondents in the nutrition+sanitation and nutrition-only groups reporting significantly higher prevalence of CLTS participation, 25 percent and 14 percent, respectively, compared to those in the sanitation-only and control groups, both about six percent. The high percentage of self-reported CLTS participation in the nutrition-only group compared to the control group may reflect biases embedded in the self-reporting process, especially considering how long ago the CLTS interventions took place (28+ months preceding the endline) and how infrequently CLTS contact occurred relative to nutrition programming. Households that already had access to sanitation may not have engaged with the CLTS programming, the survey respondent may not have been aware of or may not recall specific activities, or other reporting biases could have played a role. The greater frequency and intensity of contact between the NOURISH interventions and the respondents in the nutrition groups may have resulted in greater apparent recall of programming of any kind in these groups.
10.1.3 ACCESS TO LATRINES: SELF-REPORT To measure whether the intervention increased access to latrines, we asked households about receiving latrine vouchers specifically, though this is an imperfect measure that applies only to a subset of households across groups: latrine vouchers were a targeted subsidy only offered to households in villages that reached 75 percent sanitation coverage. Based on the survey responses about receiving latrine vouchers (TABLE 12), it appears that nutrition+sanitation programming was significantly more effective in delivering vouchers compared to the sanitation-only programming (46% versus 14%), and
42 National Institute of Statistics, Directorate General for Health, and ICF International. (2015). Cambodia demographic and health survey 2014.
43 Coughlin, S. S. (1990). Recall bias in epidemiologic studies. Journal of Clinical Epidemiology 43(1): 87-91.
EVALUATION REPORT: IMPACT EVALUATION OF THE CAMBODIA NOURISH PROJECT 40

that any sanitation programming was effective compared to the control group (1% of control respondents indicated receiving such vouchers). Respondents in the nutrition-only group reported similar levels of latrine voucher access, at 15 percent, compared to the sanitation-only group, suggesting that respondents may be conflating the different intervention elements; no latrine vouchers were issued by NOURISH programming in the nutrition-only group, so respondents’ recall appears unreliable, despite careful description of what was being asked in our survey. Again, it is possible that these responses were reflective primarily of the nutrition groups’ programming intensity and contact frequency. Additionally, water filter and food basket vouchers, which were provided in the nutrition groups, looked similar to the latrine voucher and so respondents were possibly confused when responding to this question.
We also asked the minority of households reporting participation in CLTS about whether they built a latrine following CLTS activities; few households constructed latrines (<5% of households in all groups). Among this group, there were a significant number of households already reporting access to an existing latrine (85% in the nutrition-only group, 80% in the sanitation-only group, 84% in the nutrition+sanitation group, and 81% in the control group). It is possible that any potential effect of newly-constructed latrines was obscured because of the high number of existing private latrines among respondents, or that OD continued to persist despite sanitation improvements directly related to CLTS, according to self-reported participation in CLTS by respondents. Sanitation coverage was relatively high at baseline in this group, so the impact of CLTS programming may not have been dramatic in terms of increasing coverage overall.
Our survey further represented an opportunity to gauge respondents’ perceptions surrounding latrine construction and use. Among the minority of households that reported constructing latrines, 40 percent of those in the sanitation-only group cited privacy as the primary reason, compared to 14 percent of the nutrition-only, seven percent in the nutrition+sanitation group, and 25 percent in the control group (TABLE 13). Additionally, 47 percent of those in the nutrition+sanitation group identified hygiene as the primary motivation for latrine construction, compared to 33 percent in nutrition-only, 33 percent in sanitation-only, and 36 percent in control groups. Eighteen percent of households in the control group identified the harm of OD as the primary motivation for latrine construction, compared to 10 percent in nutrition-only, seven percent in sanitation-only, and 10% in the nutrition+sanitation group. When asked about the main reason for not constructing latrines, 45 percent of those in the sanitation-only group cited lack of funds, compared with 27 percent in the nutrition-only, 32 percent in the nutrition+sanitation group, and 26 percent in the control groups, perhaps suggesting that latrines were valued differently across groups or that there were differences in the ability or willingness to pay for latrines across groups. Conversely, only 42 percent of those in the sanitation-only group cited an existing latrine as the primary reason for not constructing a latrine, compared to 69 percent in the nutrition-only, 65 percent in the nutrition+sanitation, and 74 percent in the control groups. These differences are notable considering the relatively similar prevalence of latrines across all groups.
10.1.4 REALIZED BEHAVIOR CH ANGE: SELF-REPORTED CHANGES IN OD CLTS is intended to reduce OD, so our survey included questions to respondents about OD behavior (TABLE 14). Those in the nutrition+sanitation group reported significantly lower prevalence of OD (7% among household members with no recall period specified) compared with those in the nutrition-only (14%), sanitation-only (16%), and control (16%) groups. Interestingly, these apparent differences appeared reduced when caregivers were asked whether other adults in the household practiced OD (13% in the nutrition-only group; 18% in the sanitation-only group; 12% in the nutrition+sanitation group; and 18% in the control group), suggesting that perceptions of household members’ sanitation practices were different than personal sanitation practices, and the difference was most pronounced in
EVALUATION REPORT: IMPACT EVALUATION OF THE CAMBODIA NOURISH PROJECT 41

the nutrition+sanitation group. These differences may reflect evolution of social norms around OD and could be related to CLTS programming; more analysis is needed to interrogate this possible connection.
10.2 NUTRITION
We sought to assess the impact of the bundle of nutrition interventions on child linear growth and other health outcomes (Table 19 and Table 20). We found that children in the nutrition+sanitation group experienced a 7.3 percent increase in height-for-age z-scores (HAZ) compared to the control group and a 12.6 percent increase in HAZ compared to the sanitation-only group. Children in the nutrition-only group experienced a 9.2 percent increase in HAZ compared to the control group. Nutrition programming also led to reductions in stunting. Children in the nutrition-only group are 17.3 percent less likely to be stunted compared to the children in the control group. Children in the nutrition+sanitation group are 20.9 percent less likely to be stunted compared to the sanitation-only group.
Realizing the intended health outcomes of nutrition programming requires: 1) uptake and adherence of nutrition programming through effective communication and support to households; 2) access to nutritional foods; and 3) shifting community and social behavioral norms around feeding practices. These key elements of NOURISH’s nutrition programming are reflected in our hypotheses and theory of change (Figure 2). The causal chain of the intended health outcomes of nutrition programming is complex and includes many intermediate variables that may not be captured in our survey or could not be measured longitudinally over time to capture the full experience of households. Additionally, many of the nutrition indicators captured at the single time point of the endline survey were for self-reported participation in activities months (and years) preceding the survey. It is also important to note that the nutrition programming includes some WASH-related interventions, such as water filter vouchers and SBCC on five key WASH behaviors as part of the Grow Together campaign (drink and use clean water, construct an improved latrine, adequate handwashing at critical times, separating animals from children, and proper disposal of child feces). While findings from this study suggest overall child growth increases resulting from nutrition programming, we cannot fully explain the mechanisms by which these interventions led to improved child linear growth, and we cannot disaggregate elements of the intervention programming to identify which contributed to the overall improvements in growth outcomes.
10.2.1 UPTAKE AND ADHERENCE OF NUTRITION PROGRAMMING To capture the first step in the causal chain, we asked households about their participation in eight NOURISH nutrition interventions (TABLE 12). Households in the nutrition-only and nutrition+sanitation intervention groups reported mostly low to medium participation (defined as participating in 1 to 6 activities), while sanitation-only and control groups reported mostly no to low participation (defined as participating in 0-3 activities). Households were also asked if they were visited by a district agricultural officer for recommendations on nutritional foods to grow in their home gardens, to which a significantly higher proportion of those in the nutrition-only (52%) and nutrition+sanitation (57%) groups reported being visited by an agricultural officer, compared to those in the sanitation-only and control groups (15% and 22%, respectively).
Caregivers in the nutrition-only and nutrition+sanitation groups participated in “first 1,000 days” education activities significantly more than caregivers from the other two groups that did not receive nutrition programming (i.e. 59-62% versus 10-11% for the community dialogues). While enrollment rates in the conditional cash transfer (CCT) program were not as high as participation in the education activities, caregivers from the two groups receiving nutrition programming were more likely to be enrolled in the CCT program than caregivers from the two groups not receiving nutrition programming
EVALUATION REPORT: IMPACT EVALUATION OF THE CAMBODIA NOURISH PROJECT 42

(22-27% versus 2%). In addition, caregivers from the nutrition-only and nutrition+sanitation group took their young children to growth monitoring promotion (GMP) sessions at 2.4 to 4.0 times the rate that caregivers in the sanitation-only and control groups participated in other GMP sessions not offered by NOURISH (79% and 89% versus 23% and 33%). Reported home health visits from VHSG were also more prevalent in nutrition groups (63% for both) compared to the sanitation-only group (29%) and the control group (34%) where NOURISH did not support the VHSG.
These self-reported measures suggest that the nutrition programming had high fidelity and was effective in delivering appropriate nutrition messaging to targeted villages. Moreover, respondents were able to recall these specific elements of the programming, possibly reflecting the greater intensity of contact between respondents and programming staff over long periods of time.
10.2.2 ACCESS TO NUTRITIONAL FOODS We included household survey questions on access to and use of food vouchers and growing recommended foods as recommended in NOURISH programming. More than half of the caregivers in communes targeted by nutrition interventions received vouchers for food baskets (53% and 54%) while essentially no caregivers in the sanitation-only and control groups received these vouchers. More than half of caregivers in the nutrition groups also received home garden support from an agriculture officer (52% and 57%) while only about one-fifth of caregivers in the sanitation-only and control groups reported receiving support (15% and 22%). However, the differences across groups of households growing at least one of the five vegetables promoted by NOURISH is only marginally meaningful (63% and 65% in the two nutrition groups versus 55% and 59% in the other two groups).
There are no discernable differences between children in nutrition groups and control groups eating small fish powder—a focus of previous intervention efforts—in the last 24 hours and households consuming foods grown at home, part of NOURISH’s programming. Notably, child consumption of small fish powder was low across all groups (less than 2%), and consumption of home-grown foods was high across all groups (88 to 91%). The low prevalence of households reporting consumption of small fish powder in the 24 hours preceding the survey and high uptake of growing recommended foods may, as much as anything, be a function of the way these questions were asked: one is about a behavior that is undertaken intermittently and the other is about an ongoing household practice.
10.2.3 REALIZED BEHAVIOR CH ANGE Translating nutrition programming to stronger impacts requires shifting social norms and realized behavior change. This was captured in the household surveys through questions related to uptake of good nutrition practices, including dietary diversity and feeding frequencies. Across all groups, there was no discernable difference in mean dietary diversity scores, percentage of children who met the recommended minimum dietary diversity, mean feeding frequencies, percentage of children who met minimum recommended meal frequency, and percentage of children who met minimum acceptable diet. Additionally, there were no differences across groups in breastfeeding behaviors. This suggests that while there was high fidelity of nutrition programming, this did not translate into improved dietary scores by our measures. We further note that our cross-sectional survey was possibly unable to capture these complex behaviors well, especially as most questions concern household and caregiver practices over time.
While these metrics capture some intermediate outcome measures that may precede realized health outcomes, they do not capture all such variables that may be important in explaining observed results. The findings from this study suggest that nutrition programming works to improve linear growth of children, though this cannot be explained by this study’s findings on dietary diversity and feeding practices.
EVALUATION REPORT: IMPACT EVALUATION OF THE CAMBODIA NOURISH PROJECT 43

10.3 HEALTH OUTCOMES C OMPARED TO SIMILAR STUDIES
The potential for r ural sanitation improvements alone to improve child health is plausible but experimental results are mixed. Among a broad emerging evidence base examining similar interventions44,45,46,47,48,49,50, three trials are notable in terms of rigor a nd use of CLTS or CLTS-like programs. In a cluster randomized trial intended to measure the impact of India’s T otal Sanitation Campaign in 80 rural villages from 2009 to 2011,51 increases in improved sanitation coverage (average 19 percentage point increase) and reductions in OD (reduction of 10% overall) had no effect on any outcome measure including diarrhea, helminth infections, anemia, or growth in children. Another RCT conducted in India between 2010 and 2013 reported no effect on diarrhea or linear growth outcomes attributable to a sanitation intervention that increased mean household latrine coverage from nine percent t o 63 percent of households in 50 intervention villages c ompared to an increase from eight percent t o 12 percent in 50 control villages.52 A CLTS RCT in Mali reported no effect on diarrhea prevalence, but a significant effect on linear growth (+0.18 HAZ, 95% CI: 0.03-0.32).53
44 Cameron, L., et al. (2019). Scaling up sanitation: Evidence from an RCT in Indonesia. Journal of Development Economics 138: 1-16
45 Hammer, J. & Spears D. (2016). Village sanitation and child health: Effects and external validity in a randomized field experiment in rural India. Journal of Health Economics 48: 135-148.
46 Gimaiyo, G., et al. (2019). Can child-focused sanitation and nutrition programming improve health practices and outcomes? Evidence from a randomised controlled trial in Kitui County, Kenya. BMJ Global Health 4(1): e000973.
47 Belizario, V. Y., et al. (2015). Parasitological and nutritional status of school-age and preschool-age children in four villages in Southern Leyte, Philippines: Lessons for monitoring the outcome of Community-Led Total Sanitation. Acta Tropica 141: 16-24.
48 Gough, E. K., et al. (2020). Effects of improved water, sanitation, and hygiene and improved complementary feeding on environmental enteric dysfunction in children in rural Zimbabwe: A cluster-randomized controlled trial. PLOS Neglected Tropical Diseases 14(2): e0007963.
49 Shrestha, Akina et al. Nutritional and health status of children 15 months after integrated school garden, nutrition, and water, sanitation and hygiene interventions: a cluster-randomised controlled trial in Nepal. BMC Public Health vol. 20,1 158. 3 Feb. 2020,
50 Taneja, S., et al. & Women and Infants Integrated Growth Study (WINGS) Group. (2020). Impact of an integrated nutrition, health, water sanitation and hygiene, psychosocial care and support intervention package delivered during the pre- and peri-conception period and/or during pregnancy and early childhood on linear growth of infants in the first two years of life, birth outcomes and nutritional status of mothers: study protocol of a factorial, individually randomized controlled trial in India. Trials, 21(1), 127.
51 Patil, S. R., et al. (2014). The effect of India's total sanitation campaign on defecation behaviors and child health in rural Madhya Pradesh: a cluster randomized controlled trial. PLoS Medicine, 11, no. 8.
52 Clasen, Thomas, et al. (2014). Effectiveness o f a rural sanitation programme on diarrhoea, soil-transmitted helminth infection, and child malnutrition in Odisha, India: a cluster-randomised trial. The Lancet Global Health, 2, no. 11: e645-e653.
53 Pickering, A. J., et al. (2015). Effect of a community-led sanitation intervention on child diarrhoea and child growth in rural Mali: a cluster-randomised controlled trial. The Lancet Global Health, 3, no.11: e701-e711.
EVALUATION REPORT: IMPACT EVALUATION OF THE CAMBODIA NOURISH PROJECT 44

Two recent large factorial trials, the Sanitation Hygiene Infant N utrition Efficacy (SHINE) RCT in Zimbabwe54 and the WASH Benefits trials in Kenya and Bangladesh55,56 greatly influence current thinking around integrating nutrition and WASH programming, and their fi ndings were published whilst NOURISH was underway. Both of these trials inc luded basic rural sanitation improvements alongside promoting household water treatment and handwashing with soap, including provision of soap and water treatment products. Both trials also included nutrition-only and nutrition+WASH groups.
The SHINE trial reported a significant increase in linear growth (+0.16 HAZ, 95% CI: 0.08-0.23) and reduction in stunting (-8 percentage points) in their nu trition intervention group. Both WASH Benefits trials reported improvements in linear growth for all groups that included a nutrition intervention (+0.16 HAZ, 95% CI: 0.05-0.27; +0.13 HAZ, 95% CI: 0.02-0.24). Neither trial found any marginal gain in growth outcomes of standalone WASH groups, nor from adding WASH components to the nutrition groups.57
These trials were described as efficacy or proof-of-concept trials, intended to measure benefits for interventions that were carefully delivered under controlled conditions, ensuring that fidelity and compliance was relatively high, representing ideal or even unattainable changes for real-world programming. By contrast, the research team in the NOURISH trial had no influence over the delivery of interventions nor any role on intervention delivery, quality, or other variables. NOURISH represents an effectiveness trial, of a real-world set of interventions, under typical conditions. Results are consistent across these studies, with one exception: sanitation coverage gains in our control group meant that our ability to measure sanitation’s specific contributions—if any—to study outcomes is limited, because exposure did not change differentially across groups. Further description of the evidence base supporting the potential of sanitation in contributing to child growth outcomes—including the theory for why synergies might be expected for effective interventions that consistently reduce exposure to enteric pathogens—is summarized in Annex B. To date, trial results suggest that rural sanitation interventions delivered at scale under a range of conditions fail to reliably contribute to increasing linear growth or reducing stunting in children, even where sanitation coverage increases are observed in intervention groups. In contrast, nutrition programing seems to consistently deliver expected gains on these outcomes, even when delivered at-scale in typical (i.e., non-ideal) development conditions.
54 Humphrey, J. H., et al. (2019). Independent and combined effects of improved water, sanitation, and hygiene, and improved complementary feeding, on child stunting and anaemia in rural Zimbabwe: a cluster-randomised trial. The Lancet Global Health, 7, no.1: e132-e147.
55 Null, C., et al. (2018). Effects of water quality, sanitation, handwashing, and nutritional interventions on diarrhoea and child growth in rural Kenya: a cluster-randomised controlled trial. The Lancet Global Health, 6, no. 3: e316-e329.
56 Luby, S. P., et al. (2018). Effects of water quality, sanitation, handwashing, and nutritional interventions on diarrhoea and child growth in rural Bangladesh: a cluster r andomised controlled trial. The Lancet Global Health, 6, no. 3: e302-e315.
57 Cumming, O. & Curtis, V. (2018). Implications of WASH benefits trials for water and sanitation. The Lancet Global Health, 6, no.6: e613-e614.
EVALUATION REPORT: IMPACT EVALUATION OF THE CAMBODIA NOURISH PROJECT 45

11.0 RECOMMENDATIONS
USAID should s cale up nutrition interventions so more children can benefit from these effective interventions. NOURISH early childhood nutrition interventions resulted in clear improvements in child linear g rowth and other anthropometric outcomes. These impacts are consistent with other nutrition interventions in recently conducted factorial randomized controlled trials and with the wider literature.58 Results fr om this study also indicate widespread uptake of nutrition interventions by participants, though we are unable to attribute observed growth increases to specific elements of the intervention packages.
USAID should pursue sanitation programming that can reduce children’s exposure to excreta. The results of this evaluation suggest that CLTS programming achieving modest increases (relative to the secular trend) in sanitation coverage and reductions of open defecation may not consistently translate to improved child growth. Although some gains in sanitation coverage and reductions in OD were observed in the sanitation intervention groups compared with the control group, it is possible that exposure to enteric pathogens was not reduced or that community-level sanitation coverage was insufficient to achieve an effect on linear growth. The impact of sanitation on child growth are thought to follow from reductions in exposure to enteric pathogens in early development, potentially achievable where community-level coverage of sanitation is high and excreta are effectively contained. Further evidence of secondary outcomes—including the planned analysis of stool samples for a range of enteric pathogens—will allow for an analysis of whether interventions modified exposures in the groups receiving the sanitation intervention.
USAID should n ot abandon CLTS promotion because of this trial’s finding of no effect, but should mo re selectively invest i n CLTS in s ettings where there is not already strong secular growth in sanitation coverage. A lack of impact on child growth outcomes attributable to rural sanitation programming in NOURISH is consistent with a number of recent t rials a lso showing no effect,59,60,61,62 but also contrasts with others finding an effect.63,64 Although some hypothesize that the level of sanitation coverage, prevalence of open defecation, contact with animal waste, type of latrines, and other v ariables explain the disparities i n the existing evidence, there are too few studies to propose a synthesis of the evidence on why an effect is realized in some contexts and not others.65 As community-level coverage of sanitation is t hought to be an important factor in supporting growth
58 Panjwani, A. & Heidkamp, R. (2017). Complementary feeding interventions have a small but significant impact on linear and ponderal growth of children in low-and middle-income countries: a systematic review and meta-analysis. The Journal of Nutrition, 147, no. 11: 2169S-2178S.
59 Patil et al. (2014). 60 Clasen et al. (2014). 61 Null et al. (2018). 62 Luby et al. (2018). 63 Pickering et al. (2015). 64 Hammer & Spears. (2016). 65 Brown, J., Albert, J. & Whittington, D. (2019). Community-led total sanitation moves the needle on ending
open defecation in Zambia." The American Journal of Tropical Medicine and Hygiene,100, no. 4: 767-769.
EVALUATION REPORT: IMPACT EVALUATION OF THE CAMBODIA NOURISH PROJECT 46

outcomes,66,67,68 efforts to increase sanitation coverage and achieve open defecation-free status for communities, districts and countries may support efforts to eliminate chronic childhood undernutrition in the long term. Critically, in this study, we observed increases in sanitation coverage and reductions in OD that were dramatic a cross a ll groups, including in the control group, reflecting rapid secular (non-intervention) trends in rural Cambodia. This limits our ability to measure an effect of sanitation changes on study outcomes, because the trial design is conditioned on the exposure (in this case, sanitation) changing across g roups. The finding of no effect of sanitation on child growth in this study does not mean that sanitation gains did not contribute to improved growth in children: only that similar progress realized in the control group precludes a n analysis of effects attributable to the intervention. More broadly, CLTS is associated with other ben efits that may well justify its continued promotion as a public health intervention.69,70 USAID should, however, consider investing in CLTS and other sanitation programming where such investments can lead to a meaningful divergence from the secular t rend: impacts of sanitation may be realized in settings where current progress is l acking.
66 Fuller, J. A. & Eisenberg, J. NS. (2016). Herd protection from drinking water, sanitation, and hygiene interventions. The American Journal of Tropical Medicine and Hygiene 95, no. 5: 1201-1210.
67 Fuller, J. A., Villamor, E., Cevallos, W., Trostle, J. & Eisenberg, J. NS. (2016). I get height with a little help from my friends: herd protection from sanitation on child growth in rural Ecuador. International Journal of Epidemiology, 45, no. 2: 460-469.
68 Harris, M., Alzua, M. L., Osbert, N. & Pickering, A. (2017). Community-level sanitation coverage more strongly associated with child growth and household drinking water quality than access to a private toilet in rural Mali. Environmental Science & Technology, 51, no. 12: 7219-7227.
69 Whittington et al. (2020). 70 Brown et al. (2019).
EVALUATION REPORT: IMPACT EVALUATION OF THE CAMBODIA NOURISH PROJECT 47

ANNEX A: SCOPE OF WORK
WASHPALS TA: Scope of Work71
Date: 26 July 2017 USAID Office: USAID/E3/Water OfficeJob: Completion of NOURISH Impact Evaluation
Summary
USAID has partnered with Save the Children (in collaboration with SNV and the Manoff Group) to implement the Cambodia Integrated Nutrition, Hygiene, and Sanitation (NOURISH) project. This five-year, $16.3 million project will address several Global Health Initiative (GHI) and Feed the Future (FTF) and Water and Development Strategy priorities by focusing on the key causal factors of chronic undernutrition specific to Cambodia: poverty, lack of access to quality nutrition services, unsanitary environments, and social norms and practices that work against optimal growth and development. It will promote essential WASH and nutrition actions with the aim of reducing stunting in children under two and improving the nutritional status of mothers in rural areas. NOURISH will be implemented in three of the four provinces where FTF is already active (Battambang, Pursat, and Siem Reap) from September 2014 to September 2019. It is planned to be phased into approximately 70 communes in these provinces and will target the enrollment of women early in their pregnancy or with a child under the age of six months, and those women will continue to participate until the child is two years old.
To understand the effectiveness of integrated nutrition and WASH interventions, USAID’s Water Office commissioned an impact evaluation of NOURISH. The evaluation incorporates a cluster randomized controlled trial (cRCT) with a factorial design to rigorously test how effective integrating sanitation and hygiene along with nutrition services is in reducing stunting and improving related key child health outcomes, as well as whether this integrated approach is more effective than standalone nutrition or sanitation/hygiene interventions. The impact evaluation is currently being designed and implemented by the E3 Analytics and Evaluation Project (under MSI with Joe Brown as the Principle Investigator), which has an end date of September 2018. A baseline survey has been completed, and a report produced. NOURISH is currently in the process of rolling out interventions across target communes, and the evaluation team is monitoring implementation fidelity. Once all communes have been exposed to the intervention for a period of 24 months, an endline survey will be carried out. WASHPALS is being requested to support this evaluation by undertaking the fidelity monitoring, endline data collection and data analysis tasks that will be required from October 2018 onwards. Further details of the NOURISH interventions and impact evaluation design can be found in the Evaluation Design Proposal, prepared under the E3 Analytics and Evaluation contract.
71 The original scope of work for this impact evaluation was undertaken by the E3 Analytics and Evaluation Project. In October 2018, Tetra Tech assumed management of the evaluation and the existing technical team under the WASHPaLS Project. This is the scope of work for t he evaluation under t his current mechanism, which was put in place after t he evaluation was designed and baselined data was collected,.
EVALUATION REPORT: IMPACT EVALUATION OF THE CAMBODIA NOURISH PROJECT 48

NOURISH Background
NOURISH interventions are focused on four key strategies: (1) improving community delivery platforms to support improved nutrition through the Baby-Friendly Community Initiative (BFCI), (2) creating demand for health and sanitation-related practices, services, and products through the use of conditional cash transfers (CCTs), community-led total sanitation (CLTS), vouchers, and SBCC, (3) using the private sector to advance supply of sanitation and nutrition products, and (4) building the capacity of government and civil society in nutrition.
These interventions form the inputs of the NOURISH theory of change, which has t hree development hypotheses:
Hypothesis #1: Nutrition interventions increase the practice of key feeding behaviors and consumption of more nutritious foods, which lead to improved child linear growth.
Hypothesis #2: Sanitation and hygiene interventions reduce diarrhea and enteric infections and promote gut health, which lead to improved child linear growth.
Hypothesis #3: Integrated nutrition and sanitation/hygiene interventions lead to improved child linear growth that is g reater than what is a chieved when either intervention is delivered individually.
Further details of the NOURISH interventions are available in the Evaluation Design Proposal and Fidelity Monitoring Reports.
Impact Evaluation Design
USAID’s central questions for this impact evaluation, which encompass the three development hypotheses above, are:
4. Do nutrition interventions, as delivered at scale, lead to improved linear growth in children? 5. Does expanded access t o sanitation lead to improved linear g rowth in children? 6. Is t he combined effect on linear growth in children of sanitation and nutrition interventions
delivered together greater than the additive effect of the two interventions delivered independently?
Monitoring of project implementation through process questions is also critical to understanding the results of the evaluation. Therefore, the following project process evaluation questions are included in the evaluation design:
Did sanitation interventions increase improved sanitation coverage and usage? Did nutrition interventions increase uptake of nutrition and early childhood development
services? Did the nutrition and sanitation interventions change knowledge, attitudes, and practices on
nutrition, hygiene, and infant and young children feeding practices? Did the sanitation interventions lead to more sanitary conditions of the home environment?
The NOURISH impact evaluation consists of a cRCT design, with randomization at the commune level to contain spillovers across villages and to prevent contamination across groups. The IE uses a factorial design that allows the NOURISH interventions to be offered both as separate components and as an integrated program. Furthermore, a control group that is not exposed to any intervention components is also be included. The following groups are included in the study:
EVALUATION REPORT: IMPACT EVALUATION OF THE CAMBODIA NOURISH PROJECT 49

Control Treatment 1 Treatment 2 Treatment 3
No project activities* Nutrition interventions:
Community Nutrition activities SBCC package CCT & Integrated Vouchers
Sanitation/Hygiene interventions:
CLTS Supply-side support SBCC package
Nutrition and Sanitation/Hygiene
* Given that part of the SBCC strategy consists of a media campaign, the communes in the Control Group may be exposed to some information via television spots. However, beyond the television spot and visible campaign branding, these communes will not receive direct SBCC messaging via the VHSG and caregiver groups.
Exposure to the interventions will be measured by the following criteria: Nutrition
All community agents a nd caregiver group facilitators trained Three consecutive months of community nutrition services Three consecutive months of active caregivers g roups First 50 CCT benefi ciaries enrolled
Sanitation CLTS triggering event completed Village sanitation committees established and trained Three months of regular m onitoring through village sanitation committees 20% increase in improved sanitation coverage
Twenty-four months after all treatment communes are deemed “exposed” to their respective project components, the evaluation team would collect measurements from children in the same age range in all 55 communes via one cross-sectional survey. The study is not expected to be sized to disaggregate effects of interventions based on children’s exposure to them in utero due to study timeline restrictions. Also, because the intervention rolls out over a period of time, changes both to the intervention programming and to the effects the programming has on communities is uncertain: interventions could become more effective or less effective over time. One goal of measuring intermediate outcomes is to evaluate fidelity and compliance of interventions to account for these changes during data analysis.
The outcome measures of interest for the evaluation appropriately address the evaluation questions, and will also provide insights into the causal pathways through which children’s health status can improve.
Primary outcome measure: Height-for-age (HAZ), weight-for-height (WHZ), and weight-for-age (WAZ) Z-scores i n children born from the point of intervention up to 18 months before endline. While these continuous variables a re the primary outcomes, the prevalence of stunting, wasting, and underweight will also be calculated (the next section provides a complete description of each). Children who are at least 18 months old at endline who were born in the same month or any month following delivery of the intervention will be measured at endline.
Secondary outcome measures: One probable interdependent pathway that links enteric infections (both symptomatic and asymptomatic) to stunting prevalence will be included as secondary outcome measures. This secondary outcome is m ore proximal than stunting (primary outcome) on the causal chain, and is a lso an objective measure that is m ore reliable than self-reported diarrhea (tertiary outcome). Given budget considerations, two other secondary
EVALUATION REPORT: IMPACT EVALUATION OF THE CAMBODIA NOURISH PROJECT 50

outcomes, measures of environmental enteropathy dysfunction (EED) and soil-transmitted helminth infections, will only be conducted if additional funds are secured in the future.
Tertiary outcome measures: Self-reported diarrheal disease and all-cause child mortality will also provide answers t o improvements in health outcomes, and achievement of gross motor s kills will provide insights into early childhood development.
Twenty-four months after all treatment communes are deemed “exposed” to their respective project components, the evaluation team would collect measurements from children in the same age range in all 55 communes via one cross-sectional survey.
Activities
WASHPALS is being requested to support this evaluation by undertaking the fidelity monitoring, endline data collection and data analysis t asks that will be required from October 2018 onwards. Endline data collection will include:
A household visit and survey to gather data on the impact and intermediate outcome measures. The surveys will be administered face-to-face at the eligible respondents’ household, to the primary caregiver of the target children.
Stool samples to test for enteric infections in a sub-sample from each group.
It is ex pected that WASHPALS will identify a local survey firm to undertake data collection, with close collaboration and supervision provided by the evaluation team to ensure high-quality data. WASHPALS will also identify appropriate expertise (including a Principle Investigator) to undertake the required analyses72.
H1: Nutrition interventions increase the practice of key feeding behaviors and consumption of more nutritious foods, which lead to improved child linear growth.
The mean outcomes of the nutrition only group will be compared to the mean outcomes in the control group. The null hypothesis is that there is n o difference between treatment and control group.
H2: Sanitation and hygiene interventions reduce diarrhea, enteric infections, and gut health, which lead to improved child linear growth.
The mean outcomes of the sanitation/hygiene only group will be compared to the mean outcomes in the control group. The null hypothesis is that there is no difference between treatment and control group.
H3: Integrated nutrition and sanitation/hygiene interventions lead to improved child linear growth that is greater than what is achieved when either intervention is delivered individually.
The mean outcomes of the combined group (Nutrition+Sanitation/Hygiene) will be compared to the mean outcomes in the control group. The null hypothesis is that there is no difference between treatment and control group. Then, the combined group (Nutrition+Sanitation/Hygiene) treatment effect on each of the outcome measures will be compared to the individual sanitation/hygiene-only and nutrition-only treatment effects to determine whether the combined effect is larger than the individual effects. The null hypothesis is that the treatment effect in the combined group is equal to the individual groups, and the parameters of interest are the differences in means between the combined treatment group and the individual treatment groups.
72 The Evaluation Design Report contains details of planned analysis methods, which should be used as the starting point for t he WASHPALS evaluation support.
EVALUATION REPORT: IMPACT EVALUATION OF THE CAMBODIA NOURISH PROJECT 51

Throughout this process, WASHPALS will ensure appropriate data quality assurance and data management procedures. Finally, WASHPALS will be responsible for documenting the results of this evaluation in a report, presentation and a journal article to be submitted to a peer-reviewed journal.
Deliverables & Schedule
WASHPALS will be responsible for the preparation of the following deliverables:
Deliverable Deadline
Implementation Fidelity and Progress Report o/a November 30, 2018
Draft Evaluation Report o/a May 31, 2020
Oral Presentation(s) of Draft Evaluation Report to USAID and invited stakeholders
within 60 days of draft report submission
Final Evaluation Report Within 30 days of receiving USAID comments on draft report
Draft Article for Journal Submission within 60 days of final report submission
It is expected that WASHPALS will begin preparations for this work in August 2018, and undertake full management of the evaluation by October 2018. Endline data collection is expected to begin in 2019; however this is pending the start of the exposure period.
EVALUATION REPORT: IMPACT EVALUATION OF THE CAMBODIA NOURISH PROJECT 52

ANNEX B: LITERATURE REVIEW
There are at least three pathways by which WASH interventions might plausibly improve childhood nutritional status: by reducing diarrheal disease infections, by preventing intestinal worm infections, and by reducing the risk of sub-clinical damage to the gut.73 Diarrhea – the majority of which is attributed to inadequate WASH74 – is both a cause and an effect of undernutrition: children with diarrhea eat less and are less able to absorb the nutrients from their food, and in turn, malnourished children are more susceptible to diarrhea and other infections.75 Analysis of longitudinal data spanning two decades and across five countries found that the risk of stunting for a child increased multiplicatively f or ea ch case of diarrhea experienced before 24 months of age.76 In addition, intestinal worm infections associated with poor s anitation are associated with both growth and cognitive development deficits.77 Lastly, there is growing evidence that chronic exposure to fecal bacteria may result in changes to gut structure and function without manifesting as diarrhea.78 This condition, Environmental Enteric Dysfunction (EED), also called Environmental Enteropathy or Tropical Enteropathy, is a n asymptomatic syndrome characterized by chronic inflammation, reduced nutrient absorption of the intestine, and a weakened barrier function of the small intestine, is hypothesized as o ne of the principle pathways by which poor sanitation affects growth in children.79, 80, 81 Thus, WASH interventions that effectively reduce exposure to fecal pathogens may be an important means to securing optimal nutritional outcomes for children.82
There is s trong evidence suggesting the potential for synergies bet ween WASH and nutrition interventions on the outcome of early c hildhood growth. On the WASH side, unsafe water, inadequate sanitation, and poor hygiene conditions enable the transmission of enteric pathogens f rom infected individuals to new susceptible hosts. Moreover, WASH-related enteric inf ections result in diarrheal diseases and may contribute to chronic inflammation of the gut,83 leading to reduced absorption of
73 Dangour, A. D., et al, (2011). Interventions to improve water quality and supply, sanitation and hygiene practices, and their effects on the nutritional status of children. Cochrane Database of Systematic Reviews, Issue 8.
74 Prüss‐Ustün, A., et al., (2014). Burden of disease from inadequate water, sanitation and hygiene in low‐and middle‐income settings: a retrospective analysis of data from 145 countries. Tropical Medicine & International Health, 19, no. 8.
75 Guerrant, Richard L., et al., (1992). Diarrhea as a cause and an effect of malnutrition: diarrhea prevents catch-up growth and malnutrition increases diarrhea frequency and duration. The American Journal of Tropical Medicine and Hygiene, 47, no. 1 Pt 2.
76 Checkley, William, et al. (2008). Multi-country analysis of the effects of diarrhea on childhood stunting,” International Journal of Epidemiology, 37, no. 4.
77 Bethony, J., et al. (2006). Soil-transmitted helminth infections: ascariasis, trichuriasis, and hookworm. The Lancet, 367, no. 9521.
78 Humphrey, J. H. (2009). Child undernutrition, tropical enteropathy, toilets, and handwashing. The Lancet, 374, no. 9694.
79 Campbell, D. I., et al. (2003). Chronic T cell-mediated enteropathy in rural West African children: relationship with nutritional status a nd small bowel function. Pediatric Research, 54, no. 3.
80 Humphrey, (2009). 81 Solomons, N. W. (2003). Environmental contamination and chronic inflammation influence human growth
potential. The Journal of Nutrition, 133, no. 5. 82 Dangour et al., (2013). 83 Humphrey, (2009).
EVALUATION REPORT: IMPACT EVALUATION OF THE CAMBODIA NOURISH PROJECT 53

nutrients and undernutrition,84 EED,85 growth faltering and stunting,86 and death.87 These risks a re borne predominantly by children. On the nutrition side, systematic r eviews estimate the effects of nutrition interventions on stunting and death.88 The Lancet series on Maternal and Child Undernutrition concluded that existing interventions that were designed to improve nutrition and prevent related disease could reduce stunting at 36 months by 36% and mortality between birth and 36 months by about 25%, and that in populations with sufficient food, education about complementary feeding increased height-for-age Z-score (HAZ) by 0.15 (95% confidence interval [CI] 0.01–0.49). However, it also showed that even ideal nutritional interventions are insufficient to prevent m ore than a third of stunting, an insight t hat generated increased interest in nutrition-sensitive interventions, including WASH.
Therefore, WASH interventions alone may also reduce stunting in children, though the strength of association is weak and few studies measure this directly.89 Evidence for the associations between improvements in sanitation and gut function, stunting, and death is l acking, with estimates of impact mostly theoretical, following from the observation that diarrhea90 and persistent enteric infe ctions91 lead to enteric dysfunction and stunting in children over time as we ll as a limited number of recently published trials.92,93
Despite systematic reviews o f sanitation suggesting reductions in diarrhea94 and impacts on other outcomes95, recent large, rigorous, controlled trials o f rural sanitation yielded findings o f no effect on
84 Ngure, F. M., et al. (2014). Water, sanitation, and hygiene, environmental enteropathy, nutrition, and early child development: making the links. Annals of the New York Academy of Sciences, 1308, no. 1.
85 McKay, S., et al. (2010). Environmental enteropathy: new targets for nutritional interventions. International Health, 2, no. 3.
86 McCormick, B. J. (2014). Frequent symptomatic or asymptomatic infections may have long-term c onsequences on growth and cognitive development. In Old Herborn University Seminar Monographs.
87 Cairncross, S., et al. (2010). Water, sanitation and hygiene for t he prevention of diarrhea. International Journal of Epidemiology, 39, suppl 1.
88 Bhutta, Z. A. et al. (2008). What works? Interventions for maternal and child undernutrition and survival. The Lancet, 371, no. 9610.
89 Dangour et al., (2013). 90 Checkley et al. (2008). 91 Lunn, P. G. (2002). Growth retardation and stunting of children in developing countries. British Journal of
Nutrition, 88, no. 2. 92 Hammer, J. & Spears, D. (2013). Village sanitation and children's human capital: evidence from a randomized
experiment by the Maharashtra government. World Bank Policy Research W orking Papers, #6580. 93 Cameron, L., Shah, M. & Olivia, S. (2013). Impact evaluation of a large-scale rural sanitation project in
Indonesia,” World Bank Policy Research Working Papers, #6360. 94 Wolf, J., et al. (2018). Impact of drinking water, sanitation and handwashing with soap on childhood diarrhoeal
disease: updated meta‐analysis and meta‐regression. Tropical Medicine & International Health, 23, no. 5: 508-525. 95 Freeman, M. C., et al. (2017). The impact of sanitation on infectious disease and nutritional status: A
systematic review and meta-analysis. International Journal of Hygiene and Environmental Health, 220, no. 6: 928-949.
EVALUATION REPORT: IMPACT EVALUATION OF THE CAMBODIA NOURISH PROJECT 54

most outcomes96,97,98,99 including growth. One demonstrated a reduction in diarrheal prevalence from 5.7% to 3.5%.100 With respect to CLTS and CLTS-like interventions specifically, three controlled trials reported an impact on child growth101,102,103 (one of these with a marginal effect on diarrhea) and another showed a reduction in prevalence of roundworm infection104 (but no effect on either diarrhea or g rowth). Six trials fo und no health effects of any kind.105 Several factors c onstrain the task of synthesizing these inconsistent findings, including high heterogeneity in trial contexts a cross imp ortant variables infl uencing these associations; intervention scale and effectiveness; baseline coverage and changes in coverage, time, behaviors, which may often allow for continued and significant open defecation; enteric infec tions circulating in the population; and routes of transmission, including from non-human sources.106,107,108 It is hypothesized that achieving complete or near-complete coverage of
96 Null, C., et al. (2018). Effects of water q uality, sanitation, handwashing, and nutritional interventions on diarrhoea and child growth in rural Kenya: a cluster-randomised controlled trial. The Lancet Global Health, 6, no. 3: e316-e329.
97 Patil, S. R., et al. (2014). The effect of India's total sanitation campaign on defecation behaviors and child health in rural Madhya Pradesh: a cluster randomized controlled trial. PLoS Medicine, 11, no. 8.
98 Clasen, T., et al. (2014). Effectiveness o f a rural sanitation programme on diarrhoea, soil-transmitted helminth infection, and child malnutrition in Odisha, India: a cluster-randomised trial. The Lancet Global Health, 2, no. 11: e645-e653.
99 Humphrey, J. H., et al. (2019). Independent and combined effects of improved water, sanitation, and hygiene, and improved complementary feeding, on child stunting and anaemia in rural Zimbabwe: a cluster-randomised trial. The Lancet Global Health, 7, no.1: e132-e147.
100 Luby, S. P., et al. (2018). Effects of water quality, sanitation, handwashing, and nutritional interventions on diarrhoea and child growth in rural Bangladesh: a cluster r andomised controlled trial. The Lancet Global Health, 6, no. 3: e302-e315.
101 Pickering, A J., et al. (2015). Effect of a community-led sanitation intervention on child diarrhoea and child growth in rural Mali: a cluster-randomised controlled trial. The Lancet Global Health, 3, no.11: e701-e711.
102 Hammer, J. & Spears, D. (2016). Village sanitation and child health: effects and external validity in a randomized field experiment in rural India." Journal of Health Economics, 48: 135-148.
103 Dickinson, K. L., et al. (2015). Nature’s c all: impacts of sanitation choices in Orissa, India. Economic Development and Cultural Change, 64, no.1: 1-29.
104 Cameron, L, Olivia, S. & Shah, M. (2019). Scaling up sanitation: evidence from an RCT in Indonesia. Journal of Development Economics, 138: 1-16.
105 Venkataramanan, V., et al. (2018). Community-led total sanitation: a mixed-methods systematic review of evidence and its quality. Environmental Health Perspectives, 126, no.2: 026001.
106 Eldridge, S., et al. (2008). Internal and external validity of cluster randomised trials: systematic review of recent trials. BMJ, 336, no.7649: 876-880.
107 Cumming, O. & Curtis, V. (2018). Implications of WASH benefits trials for water and sanitation. The Lancet Global Health, 6, no.6: e613-e614.
108 Wolf, J., et al. (2019). A Faecal Contamination Index for interpreting heterogeneous diarrhoea impacts of water, sanitation and hygiene interventions and overall, regional and country estimates of community sanitation coverage with a focus on low-and middle-income countries. International Journal of Hygiene and Environmental Health, 222, no.2: 270-282.
EVALUATION REPORT: IMPACT EVALUATION OF THE CAMBODIA NOURISH PROJECT 55

effective sanitation can yield herd-protective effects,109,110,111 but a demonstration of CLTS’s ability to consistently produce such effects remains elusive. Notably, in the SHINE and WASH-Benefits trials, effects of nutrition programming were consistently p ositive with respect to anthropometric measures, in agreement with nutrition literature broadly o n the effects of improved child nutrition and feeding and growth outcomes.112 Sanitation’s r ole as a valuable and potentially synergistic a djunct to nutrition programming—well supported in theory—is so far not observed in trials designed to measure this directly, possibly due to limitations of WASH interventions that may not meaningfully r educe enteric pathogen exposures sufficiently t o support gut health over the time scales of trials.
109 Fuller, J. A. & Eisenberg, J. NS. (2016). Herd protection from drinking water, sanitation, and hygiene interventions. The American Journal of Tropical Medicine and Hygiene, 95, no. 5: 1201-1210.
110 Fuller, James A., et al. (2016). I get height with a little help from my friends: herd protection from sanitation on child growth in rural Ecuador. International Journal of Epidemiology, 45, no.2: 460-469.
111 Harris, M., et al. (2017). Community-level sanitation coverage more strongly associated with child growth and household drinking water q uality than access to a private toilet in rural Mali. Environmental Science & Technology, 51, no. 12: 7219-7227.
112 Cumming, O., et al. (2019). The implications of three major new trials for t he effect of water, sanitation and hygiene on childhood diarrhea and stunting: a consensus statement. BMC Medicine, 17, no.1: 1-9.
EVALUATION REPORT: IMPACT EVALUATION OF THE CAMBODIA NOURISH PROJECT 56
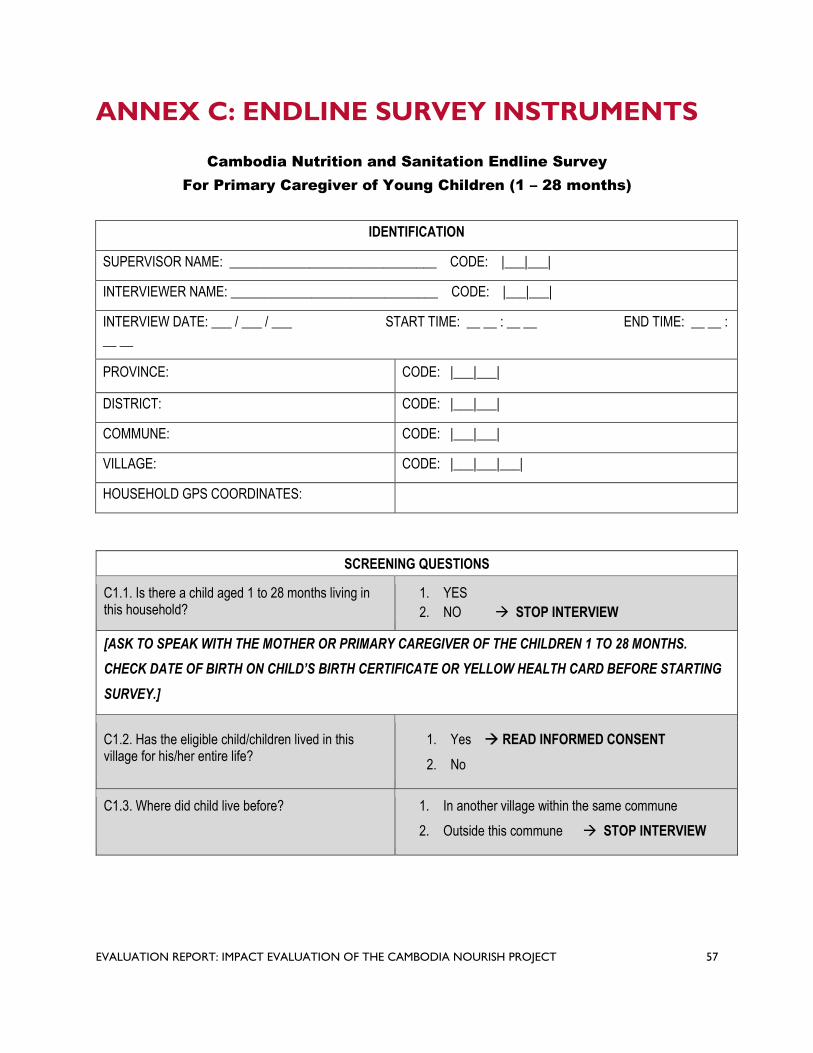
ANNEX C: ENDLINE SURVEY INSTRUMENTS
Cambodia Nutrition and Sanitation Endline Survey
For Primary Caregiver of Young Children (1 – 28 months)
IDENTIFICATION
SUPERVISOR NAME: _______________________________ CODE: |___|___|
INTERVIEWER NAME: _______________________________ CODE: |___|___|
INTERVIEW DATE: ___ / ___ / ___ START TIME: __ __ : __ __ END TIME: __ __ :
__ __
PROVINCE: CODE: |___|___|
DISTRICT: CODE: |___|___|
COMMUNE: CODE: |___|___|
VILLAGE: CODE: |___|___|___|
HOUSEHOLD GPS COORDINATES:
SCREENING QUESTIONS
C1.1. Is there a child aged 1 to 28 months living in this household?
1. YES
2. NO STOP INTERVIEW
[ASK TO SPEAK WITH THE MOTHER OR PRIMARY CAREGIVER OF THE CHILDREN 1 TO 28 MONTHS.
CHECK DATE OF BIRTH ON CHILD’S BIRTH CERTIFICATE OR YELLOW HEALTH CARD BEFORE STARTING
SURVEY.]
C1.2. Has the eligible child/children lived in this village for his/her entire life?
C1.3. Where did child live before?
1. Yes READ INFORMED CONSENT
2. No
1. In another village within the same commune
2. Outside this commune STOP INTERVIEW
EVALUATION REPORT: IMPACT EVALUATION OF THE CAMBODIA NOURISH PROJECT 57

__________________________________________ ________________________
__________________________________________ ________________________
QID: | __ | __ | __ | __ |__ |
Informed Consent Form
Hello. My name is _______________________________________. I am working with KHANA Center for Population
Health Research, a research firm based in Phnom Penh, with approval from the Ministry of Health and the Provincial
Health Department. We are gathering data for a research project conducted by Georgia Institute of Technology.
1. We are conducting a study about child nutrition in Battambang, Pursat, and Siem Reap. The information we
collect will help inform development of targeted activities to improve child nutrition in your area.
2. Your household was randomly selected to participate in the survey.
3. We will ask you some questions about your household and your young children.
4. We would also like to weigh and measure all the eligible children in your household.
5. At the end of our visit, we will leave a plastic container for your child’s next stool and will come back
tomorrow to collect it.
6. Your participation in this study is expected to last no more than 1 hour today and a brief visit (10 minutes)
when we come back to collect the sample.
7. All of the answers you give will be confidential and your name will not be shared with others outside our
research team.
8. Your participation in the study is completely voluntary, but we hope you will agree to answer the questions
since your views are important.
9. If I ask you any question you don't want to answer, just let me know and I will go on to the next question or
you can stop the interview at any time.
In case you need more information about the survey, you may contact the person listed on this information sheet.
[AFTER READING THIS FORM, GIVE PARTICIPANT THE INFORMATION SHEET]
Do you have any questions?
C1.4. Do you understand and agree to participate in this study?
1. YES 2. NO STOP INTERVIEW
Signature of Respondent Date
Signature of Enumerator Date
EVALUATION REPORT: IMPACT EVALUATION OF THE CAMBODIA NOURISH PROJECT 58

I. BASIC INFORMATION FROM PRIMARY CAREGIVER
W
.
e will start this interview with a few questions to get basic information about you.
Q1.1. In what month and year were you born? |___|___| Gregorian Month
[ASK FOR IDENTIFICATION CARD OR OTHER 88. Don’t Know Month
DOCUMENT TO CONFIRM DATE OF BIRTH] |___|___|___|___| Gregorian Year
8888. Don’t Know Year
Q1.2. How old were you at your last birthday? |___|___| Years
Q1.3. What is your religion? 1. Buddhist
2. Muslim
3. Christian
4. Other (Specify: ______________________)
Q1.4. What is the highest level of school you 1. Never attended school attended? 2. Primary (1 – 6)
3. Lower Secondary (7 – 9)
4. Upper Secondary (10 – 12)
5. Higher
6. Other (Specify: ______________________)
88. Don’t Know
Q1.5. What is your current marital status? 1. Married or living together
2. Divorced or separated
3. Widow SKIP TO Q6b 4. Never married
Q1.6.a What is the highest level of school your 1. Never attended school (spouse/partner) ever attended? 2. Primary (1 – 6)
3. Lower Secondary (7 – 9)
4. Upper Secondary (10 – 12)
5. Higher
6. Other (Specify: ______________________)
88. Don’t Know
Q6.b In the past 24 months, have you lived outside of this commune?
1. Yes
2. No SKIP TO Q1.7
EVALUATION REPORT: IMPACT EVALUATION OF THE CAMBODIA NOURISH PROJECT 59

Q6.c For how many months did you live outside of this commune?
[IF MORE THAN ONE TIME, ADD THE TOTAL TIME]
|___|___| Months
Q1.7. How many people currently live in this household, including yourself, other adults and all children who regularly sleep and eat in this household?
|___|___| People
Q1.8. Of the people who currently live in this household, how many are….:
a) Children under 18 years old?
b) Adults 18 years or older?
|___|___| Children
|___|___| Adults
Q1.9. How many eligible children aged 1 to 28 months live in this household? |___|___| Children
ELIGIBLE CHILDREN ARE AGED 1 TO 28 MONTHS LIVING IN THE SAME COMMUNE THEIR ENTIRE LIFE
EVALUATION REPORT: IMPACT EVALUATION OF THE CAMBODIA NOURISH PROJECT 60

. II. BASIC INFORMATION FOR ALL CHILDREN 1 TO 28 MONTHS
I would now like to ask you questions about these children aged 1 to 28 months. Let’s start with the order of
the children, starting with the youngest.
CHILD 1 CHILD 2 CHILD 3
Q1.10. What is the order of (CHILD NAME) |___|___| |___|___| |___|___| (youngest = 01, second youngest = 02, etc.)?
Q1.11. What is (CHILD NAME)’s gender?
1. Male
2. Female
1. Male
2. Female
1. Male
2. Female
Q1.12. Are you (CHILD NAME)’s mother?
1. Yes
2. No SKIP TO
Q1.13
1. Yes
2. No
1. Yes
2. No
Q12a. Did you receive antenatal care while you were pregnant with (CHILD NAME)?
1. Yes
2. No SKIP TO Q12c
1. Yes
2. No SKIP TO Q12c
1. Yes
2. No SKIP TO Q12c
Q12b. How many times did you receive antenatal care while you were |___|___| # of Times |___|___| # of Times |___|___| # of Times pregnant with (CHILD NAME)?
Q12c. Where did you 1. Home, with traditional 1. Home, with traditional 1. Home, with traditional give birth to (CHILD birth attendant birth attendant birth attendant NAME)? 2. Home, with trained
midwife
3. Public health center, clinic or hospital
4. Private clinic/hospital
5. Other (specify)
2. Home, with trained midwife
3. Public health center, clinic or hospital
4. Private clinic/hospital
5. Other (specify)
2. Home, with trained midwife
3. Public health center, clinic or hospital
4. Private clinic/hospital
5. Other (specify)
Q1.13. Was (CHILD NAME) ever breastfed?
1. Yes
2. No SKIP TO
Q1.15
1. Yes
2. No SKIP TO
Q1.15
1. Yes
2. No SKIP TO
Q1.15
Q1.14. Is (CHILD NAME) still being breastfed?
1. Yes
2. No
1. Yes
2. No
1. Yes
2. No
EVALUATION REPORT: IMPACT EVALUATION OF THE CAMBODIA NOURISH PROJECT 61

Q1.15.1 What is (CHILD NAME)’s birth date?
Day |___|___|
Month |___|___|
Year |___|___|___|___|
Day |___|___|
Month |___|___| Year |___|___|___|___|
Day |___|___|
Month |___|___| Year |___|___|___|___|
Q15.2 [DOUBLE ENTER BIRTH DATE]
Day |___|___|
Month |___|___|
Year |___|___|___|___|
Day |___|___|
Month |___|___|
Year |___|___|___|___|
Day |___|___|
Month |___|___|
Year |___|___|___|___|
Q15.3 [SOURCE OF 1. Official document (birth 1. Birth certificate or yellow 1. Birth certificate or yellow BIRTH DATE] certificate / yellow card)
2. Self-reported, no birth
certificate / card
card
2. Self-reported, no birth
certificate / card
card
2. Self-reported, no birth
certificate / card
Q1.16.1 What was (CHILD NAME)’s weight at birth?
KG |___| . |___|
88. Don’t Know
KG |___| . |___|
88. Don’t Know
KG |___| . |___|
88. Don’t Know
Q16.2 [SOURCE OF WEIGHT AT BIRTH]
1. From yellow card
2. Self-reported, yellow
available birth weight
not recorded
3. Self-reported, no
yellow card SKIP
TO NEXT CHILD or
Section III
1. From yellow card
2. Self-reported, yellow
available but no
recorded weight at birth
3. Self-reported, no yellow
card SKIP TO NEXT
CHILD or Section III
1. From yellow card
2. Self-reported, yellow
available but no
recorded weight at birth
3. Self-reported, no yellow
card SKIP TO
Section III
Q16.3 [WHAT IS THE LAST MONTH THE CHILD’S WEIGHT WAS PLOTTED ON THE CHILD’S YELLOW HEALTH CARD?]
Month |___|___| Month |___|___| Month |___|___|
GO TO CHILD 2 OR IF
NO MORE CHILDREN
SKIP TO SECTION III.
GO TO CHILD 3 OR IF NO
MORE CHILDREN SKIP
TO SECTION III.
EVALUATION REPORT: IMPACT EVALUATION OF THE CAMBODIA NOURISH PROJECT 62

. III. ANTHROPOMETRY MEASURES FOR SAME CHILDREN 1 TO 28 MONTHS
Now I would like to take the height and weight measurements of all of these children aged 1 to 28 months. Let’s
start with the youngest child (CHILD 1).
Q17. SELECT TYPE OF SCALE 1. Type A 2. Type B
CHILD 1 CHILD 2 CHILD 3
[RECORD SAME CHILD ORDER (youngest = 01, second youngest = 02, etc.)]
|___|___| |___|___| |___|___|
[USE THIS WEIGHT VERSION FOR SCALE TYPE A ONLY]
Q1.17.1 [FIRST TIME: RECORD WEIGHT IN KILOGRAMS]
KG |___|___| . |___|___| KG |___|___| . |___|___| KG |___|___| . |___|___|
Q1.17.2 [SECOND TIME: RECORD WEIGHT IN KILOGRAMS]
KG |___|___| . |___|___| KG |___|___| . |___|___| KG |___|___| . |___|___|
[USE THIS WEIGHT VERSION FOR SCALE TYPE B ONLY]
Q1.17.1.1 [FIRST TIME: RECORD WEIGHT IN KILOGRAMS]
KG |___|___| . |___|___|
[MOTHER AND CHILD]
KG |___|___| . |___|___|
[MOTHER ONLY]
KG |___|___| . |___|___|
[MOTHER AND CHILD]
KG |___|___| . |___|___| [MOTHER ONLY]
KG |___|___| . |___|___|
[MOTHER AND CHILD]
KG |___|___| . |___|___| [MOTHER ONLY]
Q1.17.2.1 [SECOND TIME: RECORD WEIGHT IN KILOGRAMS]
KG |___|___| . |___|___|
[MOTHER AND CHILD]
KG |___|___| . |___|___|
[MOTHER ONLY]
KG |___|___| . |___|___|
[MOTHER AND CHILD]
KG |___|___| . |___|___| [MOTHER ONLY]
KG |___|___| . |___|___|
[MOTHER AND CHILD]
KG |___|___| . |___|___| [MOTHER ONLY]
[CONTINUE WITH HEIGHT MEASUREMENT BELOW]
Q1.18.1 [FIRST TIME: RECORD HEIGHT IN CENTIMETERS]
CM |___|___|___| . |___| CM |___|___|___| . |___| CM |___|___|___| . |___|
Q1.18.2 [SECOND TIME: RECORD HEIGHT IN CENTIMETERS]
CM |___|___|___| . |___| CM |___|___|___| . |___| CM |___|___|___| . |___|
ONLY IF DIFFERENCE BETWEEN
CM |___|___|___| . |___| CM |___|___|___| . |___| CM |___|___|___| . |___|
EVALUATION REPORT: IMPACT EVALUATION OF THE CAMBODIA NOURISH PROJECT 63
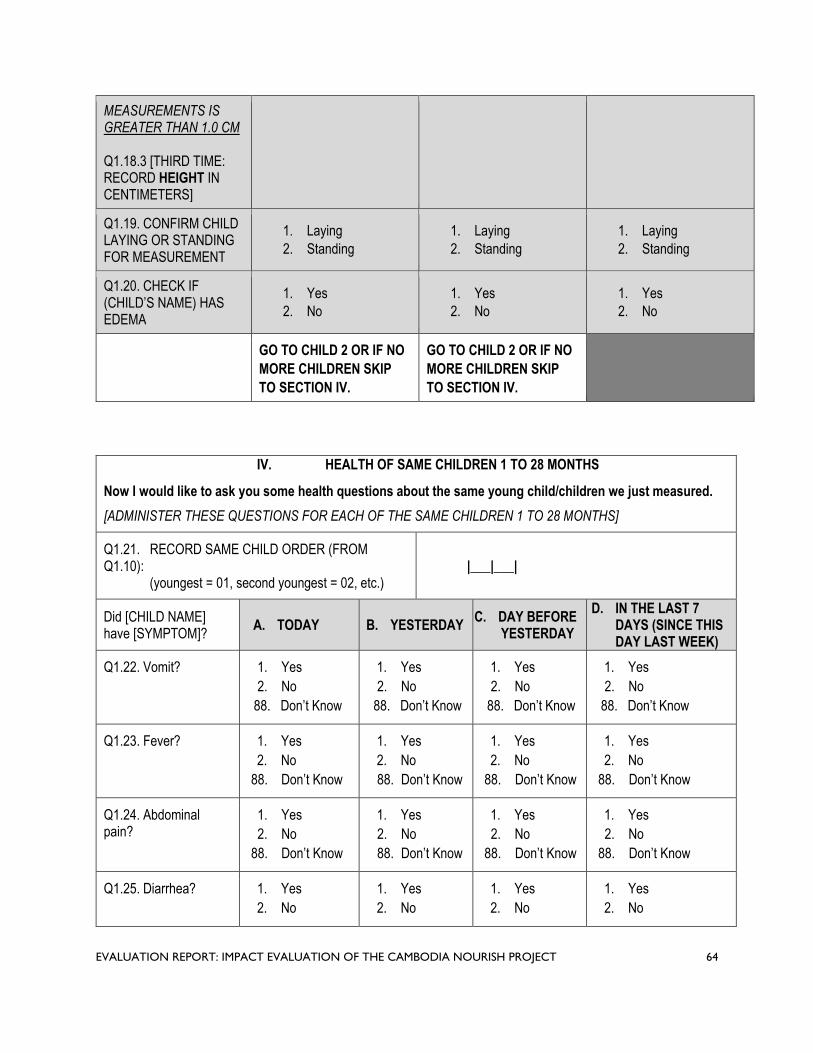
MEASUREMENTS IS GREATER THAN 1.0 CM
Q1.18.3 [THIRD TIME: RECORD HEIGHT IN CENTIMETERS]
Q1.19. CONFIRM CHILD LAYING OR STANDING FOR MEASUREMENT
Q1.20. CHECK IF (CHILD’S NAME) HAS EDEMA
1. Laying 2. Standing
1. Yes 2. No
GO TO CHILD 2 OR IF NO
1. Laying 2. Standing
1. Yes 2. No
GO TO CHILD 2 OR IF NO
1. Laying 2. Standing
1. Yes 2. No
MORE CHILDREN SKIP MORE CHILDREN SKIP
TO SECTION IV. TO SECTION IV.
IV. HEALTH OF SAME CHILDREN 1 TO 28 MONTHS
Now I would like to ask you some health questions about the same young child/children we just measured.
[ADMINISTER THESE QUESTIONS FOR EACH OF THE SAME CHILDREN 1 TO 28 MONTHS]
Q1.21. RECORD SAME CHILD ORDER (FROM Q1.10):
(youngest = 01, second youngest = 02, etc.) |___|___|
Did [CHILD NAME] have [SYMPTOM]?
A. TODAY B. YESTERDAY C. DAY BEFORE
YESTERDAY
D. IN THE LAST 7 DAYS (SINCE THIS DAY LAST WEEK)
Q1.22. Vomit? 1. Yes
2. No
88. Don’t Know
1. Yes
2. No
88. Don’t Know
1. Yes
2. No
88. Don’t Know
1. Yes
2. No
88. Don’t Know
Q1.23. Fever? 1. Yes
2. No
88. Don’t Know
1. Yes
2. No
88. Don’t Know
1. Yes
2. No
88. Don’t Know
1. Yes
2. No
88. Don’t Know
Q1.24. Abdominal pain?
1. Yes
2. No
88. Don’t Know
1. Yes
2. No
88. Don’t Know
1. Yes
2. No
88. Don’t Know
1. Yes
2. No
88. Don’t Know
Q1.25. Diarrhea? 1. Yes
2. No
1. Yes
2. No
1. Yes
2. No
1. Yes
2. No
EVALUATION REPORT: IMPACT EVALUATION OF THE CAMBODIA NOURISH PROJECT 64

Q1.32.
88. Don’t Know 88. Don’t Know 88. Don’t Know 88. Don’t Know
IF ANSWERED “YES” TO Q1.25 (DIARRHEA):
Q25a. For how many days did (CHILD NAME) have diarrhea? |___|___| Days 88. Don’t Know
Did [CHILD NAME] have [SYMPTOM]?
A. TODAY B. YESTERDAY C. DAY BEFORE
YESTERDAY
D. IN THE LAST 7 DAYS (SINCE THIS DAY LAST WEEK)
Q1.26. Three or more bowel movements in one day?
1. Yes
2. No
88. Don’t Know
1. Yes
2. No
88. Don’t Know
1. Yes
2. No
88. Don’t Know
1. Yes
2. No
88. Don’t Know
Q1.27. Number of bowel movements each day
|___|___|
88. Don’t Know
|___|___|
88. Don’t Know
Q1.28. Watery or soft stool (unformed)?
1. Yes
2. No
88. Don’t Know
1. Yes
2. No
88. Don’t Know
1. Yes
2. No
88. Don’t Know
1. Yes
2. No
88. Don’t Know
Q1.29. Blood in the stool?
1. Yes
2. No
88. Don’t Know
1. Yes
2. No
88. Don’t Know
1. Yes
2. No
88. Don’t Know
1. Yes
2. No
88. Don’t Know
Q1.30. Bruising, scrapes or cuts that occurred…?
1. Yes
2. No
88. Don’t Know
1. Yes
2. No
88. Don’t Know
1. Yes
2. No
88. Don’t Know
1. Yes
2. No
88. Don’t Know
Q1.31. Toothache / teething
1. Yes
2. No
88. Don’t Know
1. Yes
2. No
88. Don’t Know
1. Yes
2. No
88. Don’t Know
1. Yes
2. No
88. Don’t Know
Q1.33. Since (CHILD NAME) was born, has he/she ever been given antibiotics as treatment for any illness?
ENUMERATOR: SOME EXAMPLES OF COMMON ANTIBIOTICS ARE AMOXICILLIN, CLAMOXIL, PENICILLIN, TETRACYCLINE, AMPICILLIN, COTRIMOXAZOLE.
PARACETAMOL AND PANADOL ARE NOT AN ANTIBIOTIC.
1. Yes
2. No
88. Don’t Know SKIP TO SECTION V
Q1.34. For what reason(s)? 1. Respiratory inflammation (difficulty
breathing)
EVALUATION REPORT: IMPACT EVALUATION OF THE CAMBODIA NOURISH PROJECT 65

MARK ALL THAT APPLY 2. Cold or flu
3. Sore throat or cough
4. Diarrhea
5. Vomiting
6. Pain relief
7. Heal skin wound, burn, cuts, injuries
8. Intestinal inflammation or ulcer
9. Fever or high temperature
10. Dengue
11. Malaria
12. Other (specify) _________
88. Don’t know
ADD NEXT ELIGIBLE CHILD OR IF NO MORE CHILDREN SKIP TO SECTION VI
EVALUATION REPORT: IMPACT EVALUATION OF THE CAMBODIA NOURISH PROJECT 66

V. CHILD DIETARY DIVERSITY OF SAME CHILDREN 1 TO 28 MONTHS
[ADMINISTER THESE QUESTIONS FOR EACH OF THE SAME CHILDREN 1 TO 28 MONTHS]
RECORD SAME CHILD ORDER (FROM Q1.10): (youngest = 01, second youngest = 02, etc.)
|___|___|
Q1.35. Now I would like you to please describe everything that your (CHILD NAME), ate and drank yesterday, during the day or night.
MARK ALL THAT APPLY
A. Think about when (CHILD NAME) first woke up yesterday. Did (he/she) eat anything at that time?
IF YES: Please tell me everything (he/she) ate at that time. PROBE: Anything else?
B. What did (CHILD NAME) eat next?
IF YES: Please tell me everything (he/she) ate at that time. PROBE: Anything else?
[CONTINUE UNTIL SHE SAYS NOTHING ELSE. DO THIS FOR THE ENTIRE DAY.
AS THE RESPONDENT RECALLS FOODS, CIRCLE THE “1” BY THE CORRESPONDING FOOD.]
A. Plain water?
B. Instant formula?
C. Milk such as tinned, powdered or fresh animal milk?
D. Breastmilk?
E. Fresh juice?
F. Plain soup broth?
G. Borbor?
H. Juice drinks or carbonated drinks?
I. Any other liquids? (Specify: _________________________)
J. Food made from rice, noodles, or other grains?
K. Beans?
L. Nuts and seeds such as peanut, cashew nut
M. Pumpkin, carrots, squash, or sweet potatoes that are yellow or orange inside?
N. White potatoes, white yams, or any other foods from roots?
O. Long beans?
P. Any dark green, leafy vegetables like amaranth leaves, moringa, morning glory, water spinach?
Q. Ripe mangoes, ripe papayas, jackfruit?
R. Any other fruits or vegetables? (Specify: _________________)
S. Liver, kidney, heart, or other organ meats?
T. Flesh foods like beef, pork, lamb, goat, chicken, or duck?
U. Wild animals like frogs, snails, crabs, insects?
V. Duck or chicken eggs?
W. Fresh or dried fish?
X. Small rice field fish?
Y. Small fish powder?
Z. Any foods made from beans, nuts, or seeds?
EVALUATION REPORT: IMPACT EVALUATION OF THE CAMBODIA NOURISH PROJECT 67

AA. Cheese, yogurt, or other milk products?
BB. Any oil, fats, butter, or foods made with any of these?
CC. Non-sugary traditional snacks, such as banana coconut sticky rice, bean pork sticky rice, etc?
DD. Any sugary foods such as sweets, candies, cakes, or biscuits?
EE. Any packaged snacks such as chips?
FF. Condiments for flavor, such as soy sauce or prahok?
[ONLY IF SELECTED “Y. SMALL FISH POWDER” IN Q35:
MARK ALL THAT APPLY 1. Bought it
2. Made it at home
Q35.Y1 You mentioned your child ate small fish powder, did 3. Received as gift
you buy it or make it at home? 88. Don’t know
Q1.36. Did (CHILD NAME) eat any solid, semi-solid, or soft
foods yesterday during the day or at night?
[IF ‘YES’ PROBE]: What kind of solid, semi-solid or soft
foods did he/she eat yesterday?
1. Yes GO BACK TO Q1.35
TO RECORD FOOD
2. No SKIP TO SECTION VI
Q1.37. How many times did (CHILD NAME) eat solid, semi-
solid, or soft foods yesterday, during the day or at night? |___|___| Number of Times
88. Don’t know
ADD NEXT ELIGIBLE CHILD OR IF NO MORE CHILDREN SKIP TO SECTION VI
EVALUATION REPORT: IMPACT EVALUATION OF THE CAMBODIA NOURISH PROJECT 68

VI. HYGIENE PRACTICES
Can you show me the space where you usually prepare food for cooking?
Q1.38. OBSERVE WHETHER SURFACE FOR PREPARING FOOD (CHOPPING, CUTTING, ETC) IS A CLEANABLE MATERIAL
(WOOD, BAMBOO, GRASS MATS, PLASTIC MATS, OR ANOTHER POROUS MATERIAL IS NOT CLEANABLE)
RECORD OBSERVATION
1. Yes, surface for preparing food is a cleanable material
2. No
Q1.39. OBSERVE WHETHER FOOD PREPARATION SURFACE IS ELEVATED OFF THE FLOOR
RECORD OBSERVATION
1. Yes, elevated off the floor
2. No
Q1.40. OBSERVE WHETHER FOOD PREPARATION AREA IS CLEAN OF VISIBLE DIRT
RECORD OBSERVATION
1. Yes, clean of visible dirt
2. No
Q1.41. OBSERVE WHETHER THERE ARE FLIES ON FOOD
OR ON FOOD PREPARATION AREA
RECORD OBSERVATION
1. Yes, flies observed
2. No flies observed
Q1.42. OBSERVE WHETHER A HANDWASHING STATION CAN BE FOUND WITHIN 10 METERS OF THE FOOD PREPARATION AREA
RECORD OBSERVATION
1. Yes, handwashing station within 10 meters
2. No
Q1.43. Do you clean your cooking utensils before using them? 1. Yes
2. No SKIP TO Q1.45
Q1.44. What do you clean your cooking utensils with? 1. Water and soap
2. Water and ash/mud/sand
3. Water only
4. No water, dry cloth or towel only
Q1.45.a Do you clean food preparation surfaces ?
ENUMERATOR: THIS IS THE SAME SURFACE OBSERVED
PREVIOUSLY
1. Yes
2. No SKIP TO Q1.46
EVALUATION REPORT: IMPACT EVALUATION OF THE CAMBODIA NOURISH PROJECT 69

Q45.b What do you clean the food preparation surfaces with? 1. Water and soap
2. Water and ash/mud/sand
3. Water only
4. No water, dry cloth or towel only
Q1.46. Do you have a container to store food? 1. Yes
2. No SKIP TO Q1.50
Q1.47. Is the container you use to store food covered?
[CONFIRM BY OBSERVATION]
1. Yes
2. No
Q1.48. Do you clean the container used for food storage
between uses?
1. Yes
2. No SKIP TO Q1.50
Q1.49. What do you clean it with? 1. Water and soap
2. Water and ash/mud/sand
3. Water only
4. No water, dry cloth or towel only
Q1.50. Do you cook the food until boiling? 1. Yes
2. No
ASK Q51 – Q54 ONLY IF Q1.36=YES FOR ANY ELIGIBLE CHILD. OTHERWISE SKIP TO SECTION VII.
(CHILD WHO IS NO LONGER EXCLUSIVELY BREASTFEEDING)
Q1.51. Do you reheat the food before feeding your young child
again?
REFER TO ANY ONE OF THE ELIGIBLE CHILDREN NOT
EXCLUSIVELY BREASTFEEDING
1. Yes
2. No
Q1.52. Do you clean the utensil/s used to feed your young 1. Yes
child? 2. No SKIP TO Q1.54
REFER TO SAME ELIGIBLE CHILD FROM PREVIOUS
QUESTION
Q1.53. What do you clean these utensil/s with? 1. Water and soap
2. Water and ash/mud/sand
3. Water only
4. Dry cloth or towel
Q1.54. Do you prepare your young child’s food separately from
the other food?
REFER TO SAME ELIGIBLE CHILD FROM PREVIOUS
QUESTION
1. Yes, always
2. Yes, sometimes
3. No
EVALUATION REPORT: IMPACT EVALUATION OF THE CAMBODIA NOURISH PROJECT 70

VII. PREGNANCY AND CHILD BIRTHS
[IS RESPONDENT THE MOTHER OF ANY OF THE CHILDREN AGED 1 TO 28 MONTHS THAT YOU MEASURED? CHECK IF ANSWERED “YES” TO ANY CHILD ON Q1.12]
1. Yes
2. No SKIP TO Q1.68
Q1.55. Are you pregnant now? 1. Yes
2. No
88. Don’t Know SKIP TO Q1.58
Q1.56. How many months pregnant are you? [RECORD COMPLETED MONTHS] |___|___| Months
Q1.57. SOURCE OF PREGNANCY LENGTH
[PROBE WHETHER SHE ESTIMATED THE PREGNANCY LENGTH ON HER OWN OR WITH THE HELP OF A HEALTH PRACTITIONER (WITH OR WITHOUT AN ULTRASOUND].
1. Estimated by respondent only
2. Estimated by respondent and health
practitioner, no ultrasound
3. Estimated by respondent and health
practitioner, using ultrasound
CONTINUE TO Q1.60
Q1.58. Have you been pregnant in the past 24 months? 1. Yes
2. No SKIP TO Q1.60 88. Don’t Know
Q1.59. Did the pregnancy result in the child being born alive?
ANSWER IS NO FOR MISCARRIAGE, ABORTION, OR IF CHILD WAS BORN DEAD (STILL BIRTH).
1. Yes
2. No
Q1.60.a How many total births have you had in your life?
[THIS INCLUDES BIRTHS TO CHILDREN WHO WERE BORN ALIVE BUT LATER DIED AND THOSE WHO CURRENTLY LIVE ELSEWHERE].
|___|___| Total Births
Q60.b From those births, how many total children were born? |___|___| Total Children
EVALUATION REPORT: IMPACT EVALUATION OF THE CAMBODIA NOURISH PROJECT 71
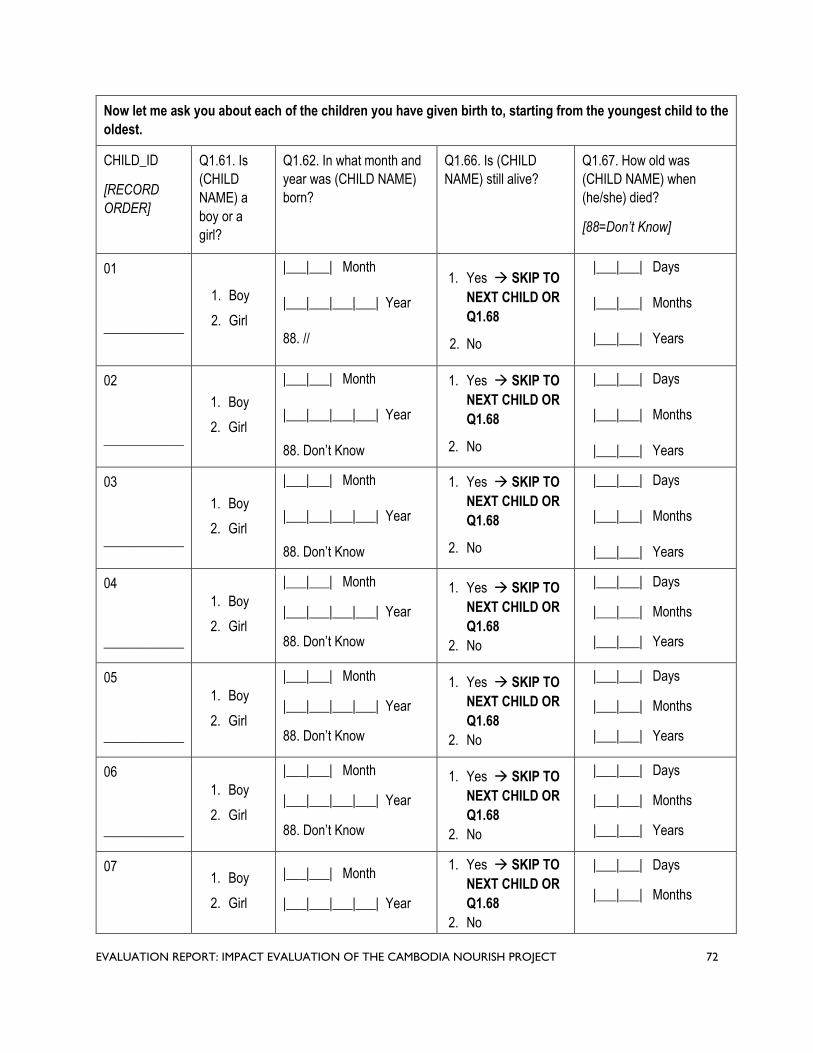
Q1.63. 1.64. 1.65.
Now let me ask you about each of the children you have given birth to, starting from the youngest child to the
oldest.
CHILD_ID
[RECORD
ORDER]
Q1.61. Is
(CHILD
NAME) a
boy or a
girl?
Q1.62. In what month and
year was (CHILD NAME)
born?
Q1.66. Is (CHILD
NAME) still alive?
Q1.67. How old was
(CHILD NAME) when
(he/she) died?
[88=Don’t Know]
01
1. Boy
2. Girl
|___|___| Month
|___|___|___|___| Year
1. Yes SKIP TO
NEXT CHILD OR
Q1.68
|___|___| Days
|___|___| Months
____________ 88. // 2. No |___|___| Years
02
1. Boy
2. Girl
|___|___| Month
|___|___|___|___| Year
1. Yes SKIP TO
NEXT CHILD OR
Q1.68
|___|___| Days
|___|___| Months
____________ 88. Don’t Know 2. No |___|___| Years
03
1. Boy
2. Girl
|___|___| Month
|___|___|___|___| Year
1. Yes SKIP TO
NEXT CHILD OR
Q1.68
|___|___| Days
|___|___| Months
____________ 88. Don’t Know 2. No |___|___| Years
04 1. Boy
2. Girl
|___|___| Month
|___|___|___|___| Year
1. Yes SKIP TO
NEXT CHILD OR
Q1.68
|___|___| Days
|___|___| Months
____________ 88. Don’t Know 2. No |___|___| Years
05 1. Boy
2. Girl
|___|___| Month
|___|___|___|___| Year
1. Yes SKIP TO
NEXT CHILD OR
Q1.68
|___|___| Days
|___|___| Months
____________ 88. Don’t Know 2. No |___|___| Years
06 1. Boy
2. Girl
|___|___| Month
|___|___|___|___| Year
1. Yes SKIP TO
NEXT CHILD OR
Q1.68
|___|___| Days
|___|___| Months
____________ 88. Don’t Know 2. No |___|___| Years
07 1. Boy
2. Girl
|___|___| Month
|___|___|___|___| Year
1. Yes SKIP TO
NEXT CHILD OR
Q1.68
2. No
|___|___| Days
|___|___| Months
EVALUATION REPORT: IMPACT EVALUATION OF THE CAMBODIA NOURISH PROJECT 72

____________ 88. Don’t Know |___|___| Years
08
____________
1. Boy
2. Girl
|___|___| Month
|___|___|___|___| Year
88. Don’t Know
1. Yes SKIP TO
NEXT CHILD OR
Q1.68
2. No
|___|___| Days
|___|___| Months
|___|___| Years
EVALUATION REPORT: IMPACT EVALUATION OF THE CAMBODIA NOURISH PROJECT 73

VIII. EXPOSURE AND PARTICIPATION
Q1.68.a In the last 24 months, have you received:
A. [LOCAL NAME: MULTIPLE MICRONUTRIENT 1. Yes 2. No POWDER]?
[SHOW CARD]
B. [LOCAL NAME: READY TO USE 1. Yes 2. No THERAPEUTIC FOOD LIKE PLUMPY'NUT]? [SHOW CARD]
C. [LOCAL NAME: READY TO USE 1. Yes 2. No SUPPLEMENTAL FOOD LIKE PLUMPY'DOZ]?
[SHOW CARD]
D. Voucher or other form of subsidy to purchase 1. Yes water filter? 2. No SKIP TO E
D2. Was it NOURISH or other program? 1. NOURISH [SHOW CARD] 2. Other programMARK ALL THAT APPLY 88. Don’t know
E. Voucher or other form of subsidy to purchase 1. Yes latrine or materials for latrine? 2. No SKIP TO F
E2. Was it NOURISH or other program? 1. NOURISH [SHOW CARD] 2. Other program MARK ALL THAT APPLY 88. Don’t know
F. Voucher for food basket? 1. Yes 2. No SKIP TO Q68b
F2. Was it NOURISH or other program? 1. NOURISH [SHOW CARD] 2. Other program MARK ALL THAT APPLY 88. Don’t know
Q68b. In the last 24 months, have you enrolled in a conditional cash transfer program for health and nutrition?
1. Yes
2. No SKIP TO Q1.69
Q68c. With which bank or program?
MARK ALL THAT APPLY
PROBE WHERE THEY ENROLLED OR RECEIVED CASH TRANSFER. IF VILLAGE FAIR SELECT NOURISH
1. AMK / NOURISH (SHOW CCT CARD TO CONFIRM)
2. WING / AT HEALTH CENTER
3. ACLEDA
4. Other (specify:________________)
88. Don’t Know
CONTINUE TO
Q1.70
Q1.69. Do you have your own bank account, Wing account, or other money account?
1. Yes
2. No
Q1.70. In the last 24 months, have you:
EVALUATION REPORT: IMPACT EVALUATION OF THE CAMBODIA NOURISH PROJECT 74

A. Heard or seen Grow Together campaign messages, or 1. Yes 2. No materials on TV, radio, or in print? [SHOW LOGO]
B. Participated in a “first 1,000 days” community dialogue? 1. Yes 2. No SKIP TO C
B2. Was it NOURISH or other program? 1. NOURISH [SHOW CARD] 2. Other program MARK ALL THAT APPLY 88. Don’t know
C. Participated in a “first 1,000 days” caregiver group education sessions? 1. Yes 2. No SKIP TO D
C2. Was it NOURISH or other program? 1. NOURISH [SHOW CARD] 2. Other program MARK ALL THAT APPLY 88. Don’t know
D. Participated in a “first 1,000 days” village fair? 1. Yes 2. No SKIP TO E
D2. Was it NOURISH or other program? 1. NOURISH [SHOW CARD] 2. Other program MARK ALL THAT APPLY 88. Don’t know
E. Participated in a community activity where VSHG weighs young children? 1. Yes 2. No SKIP TO Q70b
E2. Was it NOURISH or other program? 1. NOURISH MARK ALL THAT APPLY 2. Other program
88. Don’t know
Q70b. In the last 24 months, have you received home health visits from a village health support group?
1. Yes
2. No SKIP TO Q1.71
Q70c. Was this visit(s) for you when you were pregnant, for your child’s health, or for both?
1. Caregiver during pregnancy
2. Child’s health
3. Both
88. Don’t know
Q1.71. In the last 24 months, have you received home garden support by a district agriculture officer?
1. Yes
2. No
Q71b. Does your household grow any food that you consume at home?
1. Yes
2. No SKIP TO Q1.72
Q71c. What do you grow throughout the year?
MARK ALL GROWN AT DIFFERENT TIMES OF THE YEAR
1. Ptee (Amaranth)
2. Moringa
3. Pumpkin
4. Sweet potato
5. Long bean
6. Eggplant
7. Jackfruit
EVALUATION REPORT: IMPACT EVALUATION OF THE CAMBODIA NOURISH PROJECT 75
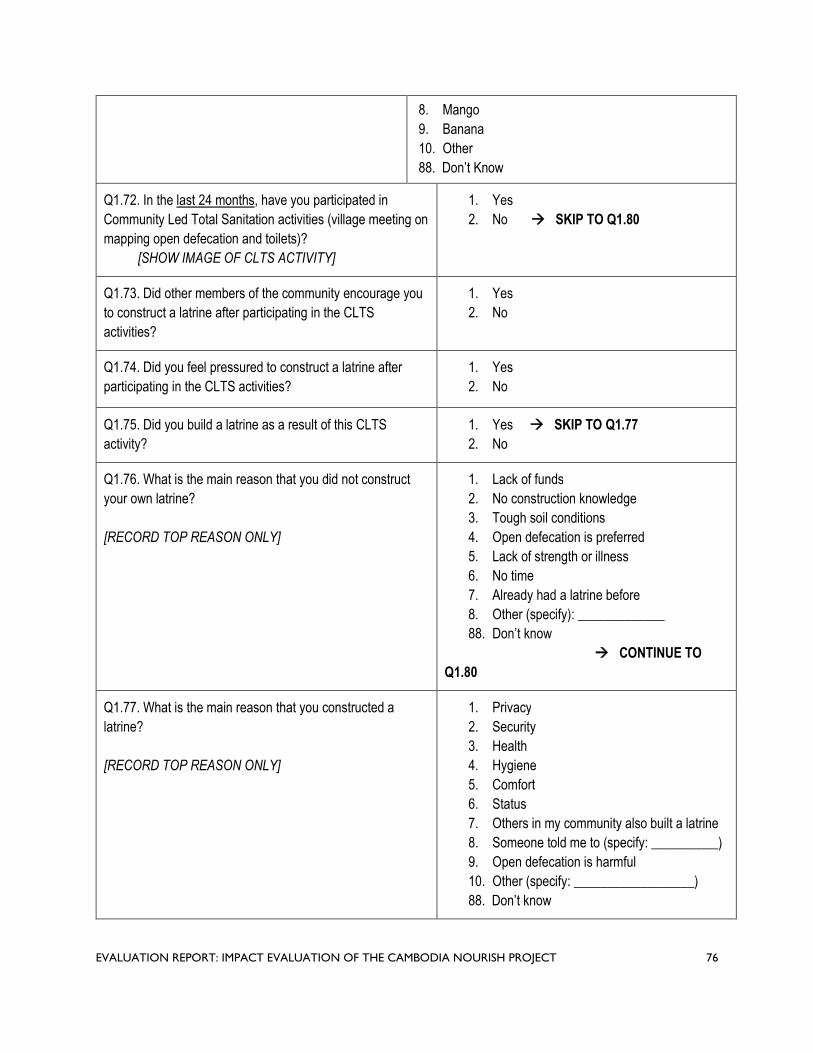
8. Mango
9. Banana
10. Other
88. Don’t Know
Q1.72. In the last 24 months, have you participated in
Community Led Total Sanitation activities (village meeting on
mapping open defecation and toilets)?
[SHOW IMAGE OF CLTS ACTIVITY]
1. Yes
2. No SKIP TO Q1.80
Q1.73. Did other members of the community encourage you
to construct a latrine after participating in the CLTS
activities?
1. Yes
2. No
Q1.74. Did you feel pressured to construct a latrine after
participating in the CLTS activities?
1. Yes
2. No
Q1.75. Did you build a latrine as a result of this CLTS
activity?
1. Yes SKIP TO Q1.77
2. No
Q1.76. What is the main reason that you did not construct
your own latrine?
[RECORD TOP REASON ONLY]
1. Lack of funds
2. No construction knowledge
3. Tough soil conditions
4. Open defecation is preferred
5. Lack of strength or illness
6. No time
7. Already had a latrine before
8. Other (specify): _____________
88. Don’t know
CONTINUE TO
Q1.80
Q1.77. What is the main reason that you constructed a
latrine?
[RECORD TOP REASON ONLY]
1. Privacy
2. Security
3. Health
4. Hygiene
5. Comfort
6. Status
7. Others in my community also built a latrine
8. Someone told me to (specify: __________)
9. Open defecation is harmful
10. Other (specify: __________________)
88. Don’t know
EVALUATION REPORT: IMPACT EVALUATION OF THE CAMBODIA NOURISH PROJECT 76
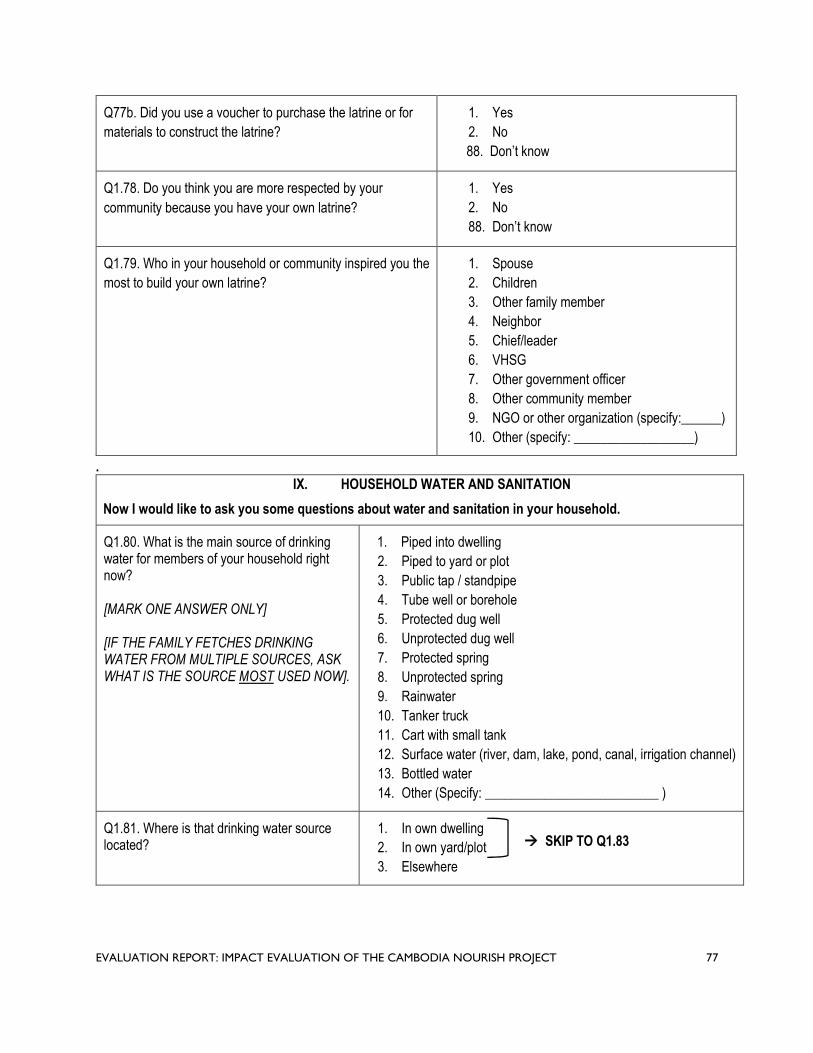
Q77b. Did you use a voucher to purchase the latrine or for
materials to construct the latrine?
1. Yes
2. No
88. Don’t know
Q1.78. Do you think you are more respected by your
community because you have your own latrine?
1. Yes
2. No
88. Don’t know
Q1.79. Who in your household or community inspired you the
most to build your own latrine?
1. Spouse
2. Children
3. Other family member
4. Neighbor
5. Chief/leader
6. VHSG
7. Other government officer
8. Other community member
9. NGO or other organization (specify:______)
10. Other (specify: __________________)
. IX. HOUSEHOLD WATER AND SANITATION
Now I would like to ask you some questions about water and sanitation in your household.
Q1.80. What is the main source of drinking water for members of your household right now?
[MARK ONE ANSWER ONLY]
[IF THE FAMILY FETCHES DRINKING WATER FROM MULTIPLE SOURCES, ASK WHAT IS THE SOURCE MOST USED NOW].
1. Piped into dwelling
2. Piped to yard or plot
3. Public tap / standpipe
4. Tube well or borehole
5. Protected dug well
6. Unprotected dug well
7. Protected spring
8. Unprotected spring
9. Rainwater
10. Tanker truck
11. Cart with small tank
12. Surface water (river, dam, lake, pond, canal, irrigation channel)
13. Bottled water
14. Other (Specify: __________________________ )
Q1.81. Where is that drinking water source located?
1. In own dwelling SKIP TO Q1.83 2. In own yard/plot
3. Elsewhere
EVALUATION REPORT: IMPACT EVALUATION OF THE CAMBODIA NOURISH PROJECT 77

Q1.82. How long does it take to go there, wait, get the drinking water, and come back?
|___|___|___| Minutes 888. Don’t know
Q1.83. Do you do anything to the water to make it safer to drink?
1. Yes
2. No
88. Don’t know SKIP TO Q1.86
Q1.84. What do you usually do to make the water safer to drink? Anything else?
[RECORD ALL ANSWERS MENTIONED]
[IF YES]
Q1.85. How often do you [METHOD] your water to
drink?
1. Boil
2. Add bleach or chlorine
3. Strain through cloth
4. Use water filter (ceramic sand/composite/etc.)
5. Solar disinfection
6. Let it stand and settle
7. Buy purified water
8. Other (Specify: ______ )
1. Always 2. Sometimes 3. Rarely
1. Always 2. Sometimes 3. Rarely
1. Always 2. Sometimes 3. Rarely
1. Always 2. Sometimes 3. Rarely
1. Always 2. Sometimes 3. Rarely
1. Always 2. Sometimes 3. Rarely
1. Always 2. Sometimes 3. Rarely
1. Always 2. Sometimes 3. Rarely
Q1.86. We would like to learn about the places that households use to wash their hands. Can you please show me where members of your household most often wash their hands?
1. Observed, fixed place
2. Observed, mobile
3. Not observed, not in dwelling/yard/plot
4. Not observed, no permission to see SKIP TO 5. Not observed, other reason
Q1.87. PRESENCE OF WATER AT THE PLACE FOR HANDWASHING.
RECORD OBSERVATION
1. Yes, water is available
2. No, water is not available
Q1.88. PRESENCE OF SOAP, DETERGENT, OR OTHER CLEANSING AGENT AT THE PLACE FOR HANDWASHING.
RECORD OBSERVATION
1. Soap or detergent (bar, liquid, powder, paste)
2. Ash, mud, sand
3. None
Q1.89. When do you wash your hands?
[RECORD ALL ANSWERS MENTIONED]
1. Before preparing or cooking food
2. Before eating
3. Before breastfeeding or feeding young child under 28
months
4. After defecating
EVALUATION REPORT: IMPACT EVALUATION OF THE CAMBODIA NOURISH PROJECT 78

5. After changing diapers / cleaning child feces
6. After cleaning animal feces
7. After cleaning toilet or potty
8. None of the above
Q1.90. What kind of toilet facility do members of your household usually use?
Flush or Pour Flush Toilet
1. Flush or pour flush to piped sewer system
2. Flush or pour flush to septic tank
3. Flush or pour flush to pit latrine
4. Flush our pour flush to somewhere else
Pit Latrine
5. Ventilated improved pit latrine
6. Pit latrine with slab
7. Pit latrine without slab / open pit
8. Composting toilet
9. Bucket toilet
10. Hanging toilet / hanging latrine
11. No facility / bush / field SKIP TO Q1.102
12. Use another household’s latrine SKIP TO Q1.97
13. Other (Specify: _________________ )
ASK FOR PERMISSION TO TAKE A PHOTO OF Photo 1 Upload: _______________________ THE TOILET FACILITY USED IN THE HOUSEHOLD. [PHOTO TAKEN]
Q1.91.TAKE A PICTURE OF LATRINE 1. Yes SUPERSTRUCTRE FROM THE OUTSIDE, 2. No CAPTURING SEPTIC TANK IF PRESENT
Q1.92.TAKE A PICTURE OF THE LATRINE DROP HOLE
Photo 2 Upload: _______________________
[PHOTO TAKEN]
1. Yes
2. No
Q1.93. OBSERVE WHETHER THERE IS A SUPER-STRUCTURE THAT PROVIDES PRIVACY
[PRIVACY: DOOR OR CURTAIN THAT CAN BE CLOSED AND A NO-SEE THROUGH SUPERSTRUCTURE]
RECORD OBSERVATION
1. Yes, there is a super-structure provides privacy
2. No super-structure
EVALUATION REPORT: IMPACT EVALUATION OF THE CAMBODIA NOURISH PROJECT 79
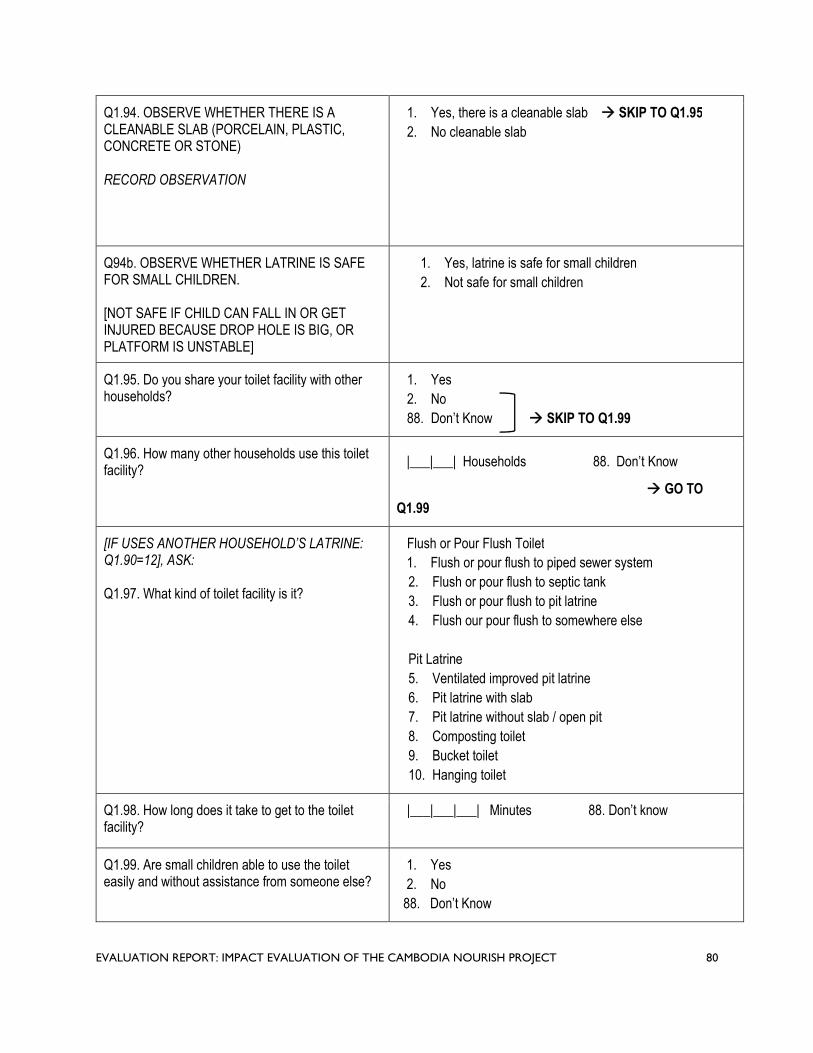
Q1.94. OBSERVE WHETHER THERE IS A CLEANABLE SLAB (PORCELAIN, PLASTIC, CONCRETE OR STONE)
RECORD OBSERVATION
1. Yes, there is a cleanable slab SKIP TO Q1.95
2. No cleanable slab
Q94b. OBSERVE WHETHER LATRINE IS SAFE FOR SMALL CHILDREN.
[NOT SAFE IF CHILD CAN FALL IN OR GET INJURED BECAUSE DROP HOLE IS BIG, OR PLATFORM IS UNSTABLE]
1. Yes, latrine is safe for small children
2. Not safe for small children
Q1.95. Do you share your toilet facility with other households?
1. Yes
2. No
88. Don’t Know SKIP TO Q1.99
Q1.96. How many other households use this toilet facility?
|___|___| Households 88. Don’t Know
GO TO
Q1.99
[IF USES ANOTHER HOUSEHOLD’S LATRINE: Q1.90=12], ASK:
Q1.97. What kind of toilet facility is it?
Flush or Pour Flush Toilet
1. Flush or pour flush to piped sewer system
2. Flush or pour flush to septic tank
3. Flush or pour flush to pit latrine
4. Flush our pour flush to somewhere else
Pit Latrine
5. Ventilated improved pit latrine
6. Pit latrine with slab
7. Pit latrine without slab / open pit
8. Composting toilet
9. Bucket toilet
10. Hanging toilet
Q1.98. How long does it take to get to the toilet facility?
|___|___|___| Minutes 88. Don’t know
Q1.99. Are small children able to use the toilet easily and without assistance from someone else?
1. Yes
2. No
88. Don’t Know
EVALUATION REPORT: IMPACT EVALUATION OF THE CAMBODIA NOURISH PROJECT 80

Q1.100.a Does the pit or toilet leak, overflow or flood at any time of the year?
1. Yes
2. No
88. Don’t Know SKIP TO Q1.101
Q100.b How often does the pit or toilet leak, 1. It happened once overflow or flood? 2. Rarely
3. Often
4. Always
88. Don’t know
Q1.101. Thinking of yourself and your household members, excluding small children unable to use the toilet, has anyone defecated in the bush or field in the last 7 days?
1. Yes
2. No
88. Don’t Know SKIP TO Q1.103
Q1.102. Why didn’t you or members of your household use the latrine?
IF RESPONDENT SAYS THEY DO NOT HAVE ONE, ASK WHY THEY DO NOT USE ANOTHER HOUSEHOLD’S LATRINE
1. Smell
2. Heat inside latrine
3. Too dirty/no hygiene
4. Fear of animals
5. Taboo
MARK ALL THAT APPLY
6. Flies
7. Fear of falling inside
8. Fear of infection
9. Harassment
10. Queue of people
11. Too far away
12. Latrine is damaged
13. Full pit
14. Open defecation is preferred
15. Other (specify): ______________________
88. Don’t Know
Q1.103. Do you think there are community members from this village who have defecated in the bush or field in the last 7 days?
1. Yes
2. No
88. Don’t Know
Q1.104. The last time your youngest child passed 1. Child used toilet or latrine stools in the past 24 hours, what was done to 2. Put / rinsed into toilet or latrine dispose of the stools? 3. Put / rinsed into drain or ditch
4. Thrown into garbage
5. Buried
6. Left in the open
7. Other (Specify:___________________ )
EVALUATION REPORT: IMPACT EVALUATION OF THE CAMBODIA NOURISH PROJECT 81

Can you show me the space where the young children we measured usually play?
Q1.105. OBSERVE WHETHER ANIMALS ARE KEPT AWAY FROM WHERE CHILD PLAYS
RECORD OBSERVATION
1. Animals are kept separate from play space
2. Animals are not kept separate from play space
3. No animals observed
Q1.106. OBSERVE WHETHER THERE IS GARBAGE OR HOUSEHOLD WASTE WHERE CHILD PLAYS
RECORD OBSERVATION
1. Yes, Garbage or household waste observed
2. No garbage or household waste observed
Q1.107. OBSERVE WHETHER THERE ARE SHARP OBJECTS THAT CAN CAUSE HARM WHERE CHILD PLAYS
RECORD OBSERVATION
1. Yes, Sharp objects that can cause harm are observed
2. No sharp objects observed
Q1.108. OBSERVE WHETHER THERE IS FECES AROUND THE HOUSEHOLD (animal or humans-children)
RECORD OBSERVATION
1. Yes, Animal or human/child feces observed
2. No feces observed
Q1.109. Does your household have an ID Poor Card?
[REQUEST TO SEE THE CARD]
1. Yes, observed card
2. Yes, not observed card
3. Yes, expired card
4. No
88. Don’t know
EVALUATION REPORT: IMPACT EVALUATION OF THE CAMBODIA NOURISH PROJECT 82

. X. HOUSEHOLD CHARACTERISTICS
We are almost done. I will now ask you a few additional questions about your household.
Q1.110. Does your household have:
A. Electricity? 1. Yes 2. No
B. A radio? 1. Yes 2. No
C. A television? 1. Yes 2. No
D. A mobile telephone? 1. Yes 2. No
E. A non-mobile telephone? 1. Yes 2. No
F. A refrigerator? 1. Yes 2. No
G. A wardrobe? 1. Yes 2. No
H. A sewing machine or loom? 1. Yes 2. No
I. A CD/DVD player? 1. Yes 2. No
J. A generator / battery / solar panel? 1. Yes 2. No
Q1.111. What type of fuel does your household mainly use for cooking?
1. Electricity
2. LPG
3. Biogas
4. Kerosene
5. Coal, lignite
6. Charcoal
7. Wood
8. Straw / shrubs / grass
9. Agricultural crop
10. Animal Dung
11. No food cooked in household
12. Other (Specify: _______________________ )
Q1.112. MAIN MATERIALS OF THE FLOORS 1. Earth / Sand / Clay
2. Dung RECORD OBSERVATION 3. Wood planks
4. Palm / bamboo
5. Parquet or polished wood
6. Vinyl or asphalt strips
7. Ceramic tiles
8. Cement
9. Other (Specify: _______________________ )
EVALUATION REPORT: IMPACT EVALUATION OF THE CAMBODIA NOURISH PROJECT 83

Q1.113. MAIN MATERIAL OF THE ROOF 1. No Roof
2. Bamboo / thatch / palm leaf RECORD OBSERVATION 3. Rustic mat
4. Wood planks
5. Cardboard
6. Plastic sheet
7. Metal
8. Finished wood
9. Calamine / cement fiber
10. Ceramic tiles
11. Clay tiles
12. Cement
13. Other (Specify: _______________________)
Q1.114. MAIN MATERIAL OF EXTERIOR WALLS 1. No walls
2. Palm / bamboo / thatch RECORD OBSERVATION 3. Dirt
4. Bamboo with mud
5. Straw with mud
6. Stone with mud
7. Uncovered adobe
8. Plywood
9. Cardboard
10. Reused wood
11. Metal
12. Cement
13. Stone with lime/cement
14. Bricks
15. Cement blocks
16. Covered adobe
17. Wood planks / shingles
18. Other (Specify: _______________________ )
Q1.115. How many rooms in this household are used for sleeping?
|___|___| Rooms
88. Don’t Know
Q1.116. Does any member of this household own:
A. Watch? 1. Yes 2. No
B. Bicycle or cyclo? 1. Yes 2. No
C. Motorcycle or motor scooter? 1. Yes 2. No
D. Motorcycle cart? 1. Yes 2. No
EVALUATION REPORT: IMPACT EVALUATION OF THE CAMBODIA NOURISH PROJECT 84

E. Oxcart or horsecart? 1. Yes 2. No
F. Car, truck, tractor, or van? 1. Yes 2. No
G. Boat with a motor? 1. Yes 2. No
H. Boat without a motor? 1. Yes 2. No
EVALUATION REPORT: IMPACT EVALUATION OF THE CAMBODIA NOURISH PROJECT 85

XI. INSTRUCTIONS FOR STOOL SAMPLE COLLECTION
That concludes our interview. Thank you for participating in this survey and for your time and attention.
As I mentioned earlier, we would like to collect a stool sample from your children ages 1 to 28 months. This will help us
to better understand the health of children in this area and to improve programming.
Q1.117. For the children aged 1 to 28 months, may we collect a sample of their stool?
1. YES 2. NO STOP INTERVIEW
I will leave this labelled bag with supplies for you to collect your child’s stool and our team will return tomorrow to pick it
up. When your child is going to defecate, please help your child to defecate into this plastic bowl. Then use the plastic
spoon to collect the stool from the bowl and put into the plastic container. Then close the cap tightly and place the filled
container in the bag and seal it.
[ENUMERATOR DEMONSTRATES HOW TO USE THE PLASTIC CONTAINER AND PUT IT IN BAG AND SEAL IT]
Q1.118. SCAN BARCODE OF PLASTIC CONTAINER
[ENUMERATOR: LABEL THE LID WITH CHILD NUMBER AND EXPLAIN WHICH CONTAINER
CORRESPONDS TO WHICH CHILD]
CHILD 1: |___|___|___|___|___|
CHILD 2: |___|___|___|___|___|
CHILD 3: |___|___|___|___|___|
XII. CONTACT INFORMATION FOR STOOL SAMPLE PICK-UP
Q1.119. At what time(s) will you likely be home tomorrow so our team can pick up the sealed bag with the stool
sample?
1. FROM |___|___| : |___|___| AM / PM
2. TO |___|___| : |___|___| AM / PM
May I please get your contact information for our team to contact you tomorrow? This information will not be shared
with anyone outside our team and it will only be used for the purpose of picking-up the stool sample container.
Q1.120. Respondent Name:
Q1.121. Telephone Number:
May I please get the contact information from a relative who lives nearby or a neighbor in case we cannot reach you?
Q1.122. Name of Relative or Neighbor:
Q1.123. Relationship to You:
Q1.124. Telephone Number of Relative/Neighbor:
That concludes our visit. Thank you once again for your time and participation.
EVALUATION REPORT: IMPACT EVALUATION OF THE CAMBODIA NOURISH PROJECT 86

Cambodia Nutrition and Sanitation Endline Survey
For General Households
IDENTIFICATION
SUPERVISOR NAME: _______________________________ CODE: |___|___|
INTERVIEWER NAME: _______________________________ CODE: |___|___|
INTERVIEW DATE: ___ / ___ / ___ START TIME: __ __ : __ __ END TIME: __ __ : __ __
PROVINCE: CODE: |___|___|
DISTRICT: CODE: |___|___|
COMMUNE: CODE: |___|___|
VILLAGE: CODE: |___|___|___|
HOUSEHOLD GPS COORDINATES:
[ASK TO SPEAK WITH THE HEAD OF HOUSEHOLD OR THE SPOUSE. IF NEITHER IS AVAILABLE ASK TO SPEAK WITH SOMEONE OVER 18 WHO IS KNOWELDGEABLE ABOUT THE WATER AND SANITATION CONDITION OF THE HOUSHEOLD]
NAME OF RESPONDENT:
PHONE NUMBER OF HOUSEHOLD CONTACT: |___|___|___|___|___|___|___|___|___|
EVALUATION REPORT: IMPACT EVALUATION OF THE CAMBODIA NOURISH PROJECT 87

__________________________________________ ________________________
__________________________________________ ________________________
QID: | __ | __ | __ | __ |___|
Informed Consent Form
Hello. My name is _______________________________________. I am working with KHANA Center for Population Health Research, a research firm based in Phnom Penh, with approval from the Ministry of Health and the Provincial Health Department. We are gathering data for a research project conducted by Georgia Institute of Technology.
We are conducting a survey about access to water and sanitation facilities in your community and across Battambang, Pursat, and Siem Reap. The information we collect will help inform development of targeted activities to improve child nutrition in your area.
Your household was randomly selected to participate in the survey. I would like to ask you some questions about your household. The questions usually take about 10
minutes. All of the answers you give will be confidential and will not be shared with anyone other than members of
our survey team. Your participation is voluntary, but we hope you will agree to answer the questions since your views are
important. If I ask you any question you don't want to answer, just let me know and I will go on to the next question or
you can stop the interview at any time.
In case you need more information about the survey, you may contact the person listed on this information sheet.
[GIVE PARTICIPANT INFORMATION SHEET]
Do you have any questions?
C1.125. Do you understand and agree to participate in this survey?
1. YES 2. NO STOP INTERVIEW
Signature of Respondent Date
Signature of Enumerator Date
EVALUATION REPORT: IMPACT EVALUATION OF THE CAMBODIA NOURISH PROJECT 88

I will start this interview by asking you a few questions on your household’s water and sanitation situation.
XIII. HOUSEHOLD WATER AND SANITATION
Q1.1. What is the main source of drinking water for members of your household right now?
[MARK ONE ANSWER ONLY]
[IF THE FAMILY FETCHES DRINKING WATER FROM MULTIPLE SOURCES, ASK WHAT IS THE SOURCE MOST USED NOW].
1. Piped into dwelling 2. Piped to yard or plot 3. Public tap / standpipe 4. Tube well or borehole 5. Protected dug well 6. Unprotected dug well 7. Protected spring 8. Unprotected spring 9. Rainwater 10. Tanker truck 11. Cart with small tank 12. Surface water (river, dam, lake, pond, canal, irrigation channel) 13. Bottled water 14. Other (Specify: __________________________ )
Q1.2. Where is that drinking water source located?
1. In own dwelling SKIP TO Q1.4 2. In own yard/plot
3. Elsewhere
Q1.3. How long does it take to go there, wait, get the drinking water, and come back?
|___|___|___| Minutes 88. Don’t know
Q1.4. Do you do anything to the water to make it safer to drink?
1. Yes 2. No 89. Don’t know SKIP TO Q1.7
Q1.5. What do you usually do to make the water safer to drink? Anything else?
[RECORD ALL ANSWERS MENTIONED]
[IF YES]:
Q1.6. How often do you [METHOD] your water to drink?
1. Boil 2. Add bleach or chlorine 3. Strain through cloth 4. Use water filter (ceramic sand/composite/etc.) 5. Solar disinfection 6. Let it stand and settle 7. Buy purified water 8. Other (Specify: ______ )
1. Always 2. Sometimes 3. Rarely 1. Always 2. Sometimes 3. Rarely 1. Always 2. Sometimes 3. Rarely 1. Always 2. Sometimes 3. Rarely 1. Always 2. Sometimes 3. Rarely 1. Always 2. Sometimes 3. Rarely 1. Always 2. Sometimes 3. Rarely 1. Always 2. Sometimes 3. Rarely
Q1.7. We would like to learn about the places that households use to wash their hands. Can you please show me where members of your household most often wash their hands?
1. Observed, fixed place 2. Observed, mobile 3. Not observed, not in dwelling/yard/plot 4. Not observed, no permission to see SKIP TO Q1.10 5. Not observed, other reason
EVALUATION REPORT: IMPACT EVALUATION OF THE CAMBODIA NOURISH PROJECT 89

Q1.8. PRESENCE OF WATER AT THE PLACE FOR HANDWASHING.
RECORD OBSERVATION
1. Yes, water is available 2. No, water is not available
Q1.9. PRESENCE OF SOAP, DETERGENT, OR OTHER CLEANSING AGENT AT THE PLACE FOR HANDWASHING.
RECORD OBSERVATION
1. Soap or detergent (bar, liquid, powder, paste) 2. Ash, mud, sand 3. None
Q1.10. What kind of toilet facility do members of your household usually use?
Flush or Pour Flush Toilet 1. Flush or pour flush to piped sewer system 2. Flush or pour flush to septic tank 3. Flush or pour flush to pit latrine 4. Flush our pour flush to somewhere else
Pit Latrine 5. Ventilated improved pit latrine 6. Pit latrine with slab 7. Pit latrine without slab / open pit
8. Composting toilet 9. Bucket toilet 10. Hanging toilet / hanging latrine 11. No facility / bush / field SKIP TO
Q1.221.103 12. Use another household’s latrine SKIP TO Q1.17 13. Other (Specify: _________________ )
ASK FOR PERMISSION TO TAKE A PHOTO OF THE TOILET FACILITY USED IN THE HOUSEHOLD.
Q1.11. TAKE A PICTURE OF LATRINE SUPERSTRUCTRE FROM THE OUTSIDE
Photo 1 Upload: _______________________
[PHOTO TAKEN] 1. Yes 2. No
Q1.12. TAKE A PICTURE OF THE LATRINE Photo 2 Upload: _______________________ DROP HOLE
[PHOTO TAKEN] 1. Yes 2. No
Q1.13. OBSERVE WHETHER THERE IS A SUPER-STRUCTURE THAT PROVIDES PRIVACY
[PRIVACY: DOOR OR CURTAIN THAT CAN BE CLOSED AND A NO-SEE THROUGH SUPERSTRUCTURE]
1. Yes, there is a super-structure provides privacy 2. No super-structure
EVALUATION REPORT: IMPACT EVALUATION OF THE CAMBODIA NOURISH PROJECT 90

RECORD OBSERVATION
Q1.14. OBSERVE WHETHER THERE IS A CLEANABLE SLAB (PORCELAIN, PLASTIC, CONCRETE OR STONE)
RECORD OBSERVATION
1. Yes, there is a cleanable slab SKIP TO Q1.15 2. No cleanable slab
Q14b. OBSERVE WHETHER LATRINE IS SAFE FOR SMALL CHILDREN
[NOT SAFE IF CHILD CAN FALL IN OR GET INJURED BECAUSE DROP HOLE IS BIG, OR PLATFORM IS UNSTABLE]
1. Yes, latrine is safe for small children 2. Not safe for small children
Q1.15. Do you share your toilet facility with other households?
1. Yes 2. No 89. Don’t Know SKIP TO Q1.99
Q1.16. How many other households use this toilet facility?
|___|___| Households 88. Don’t Know
GO TO Q1.99
[IF USES ANOTHER HOUSEHOLD’S LATRINE: Q1.10=12], ASK:
Q1.17. What kind of toilet facility is it?
Flush or Pour Flush Toilet 1. Flush or pour flush to piped sewer system 2. Flush or pour flush to septic tank 3. Flush or pour flush to pit latrine 4. Flush our pour flush to somewhere else
Pit Latrine 5. Ventilated improved pit latrine 6. Pit latrine with slab 7. Pit latrine without slab / open pit 8. Composting toilet 9. Bucket toilet 10. Hanging toilet
Q1.18. How long does it take to get to the toilet facility?
|___|___|___| Minutes 88. Don’t know
Q1.19. Are small children able to use the toilet easily and without assistance from someone else?
1. Yes 2. No 88. Don’t know
EVALUATION REPORT: IMPACT EVALUATION OF THE CAMBODIA NOURISH PROJECT 91
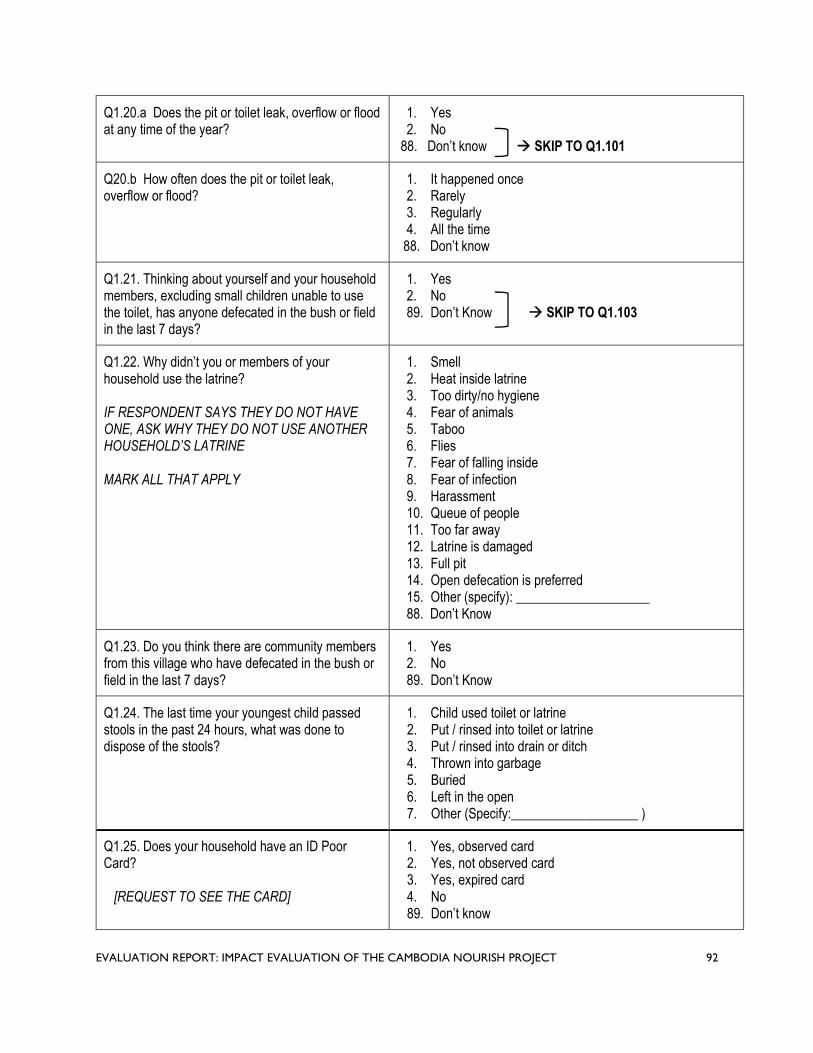
Q1.20.a Does the pit or toilet leak, overflow or flood at any time of the year?
1. Yes 2. No
88. Don’t know SKIP TO Q1.101
Q20.b How often does the pit or toilet leak, overflow or flood?
1. It happened once 2. Rarely 3. Regularly 4. All the time
88. Don’t know
Q1.21. Thinking about yourself and your household members, excluding small children unable to use the toilet, has anyone defecated in the bush or field in the last 7 days?
1. Yes 2. No 89. Don’t Know SKIP TO Q1.103
Q1.22. Why didn’t you or members of your household use the latrine?
IF RESPONDENT SAYS THEY DO NOT HAVE ONE, ASK WHY THEY DO NOT USE ANOTHER HOUSEHOLD’S LATRINE
MARK ALL THAT APPLY
1. Smell 2. Heat inside latrine 3. Too dirty/no hygiene 4. Fear of animals 5. Taboo 6. Flies 7. Fear of falling inside 8. Fear of infection 9. Harassment 10. Queue of people 11. Too far away 12. Latrine is damaged 13. Full pit 14. Open defecation is preferred 15. Other (specify): ____________________ 88. Don’t Know
Q1.23. Do you think there are community members from this village who have defecated in the bush or field in the last 7 days?
1. Yes 2. No 89. Don’t Know
Q1.24. The last time your youngest child passed stools in the past 24 hours, what was done to dispose of the stools?
1. Child used toilet or latrine 2. Put / rinsed into toilet or latrine 3. Put / rinsed into drain or ditch 4. Thrown into garbage 5. Buried 6. Left in the open 7. Other (Specify:___________________ )
Q1.25. Does your household have an ID Poor Card?
[REQUEST TO SEE THE CARD]
1. Yes, observed card 2. Yes, not observed card 3. Yes, expired card 4. No 89. Don’t know
EVALUATION REPORT: IMPACT EVALUATION OF THE CAMBODIA NOURISH PROJECT 92
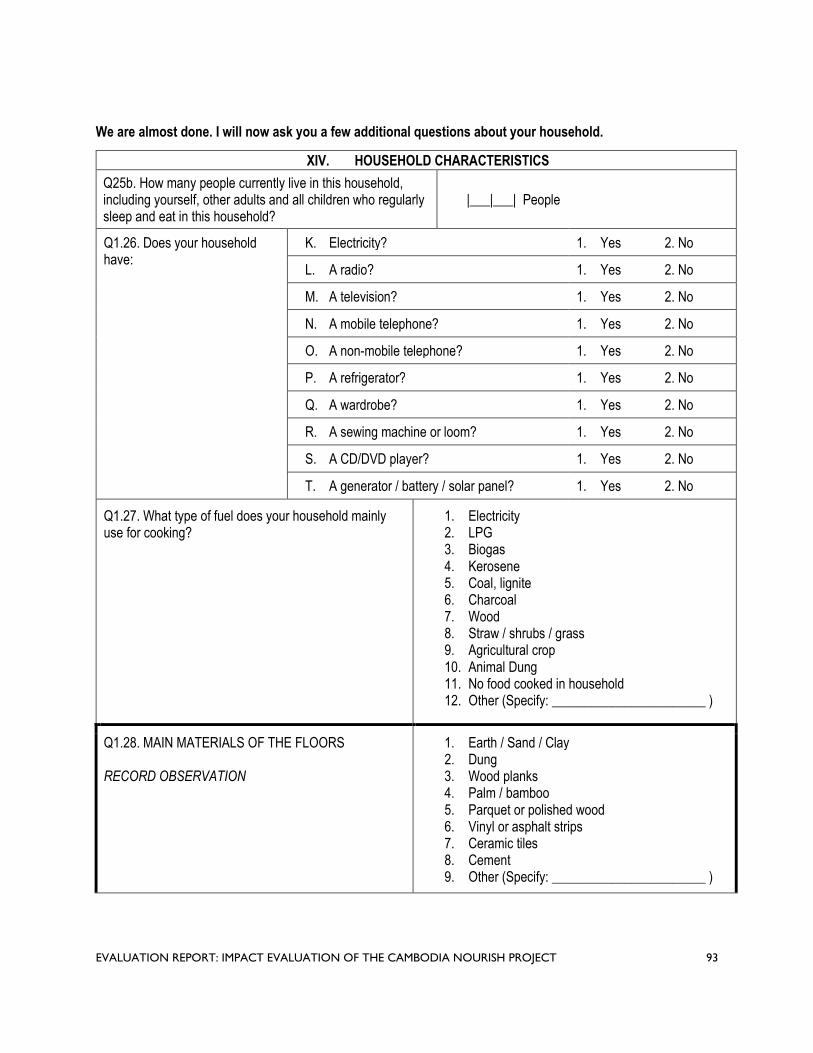
We are almost done. I will now ask you a few additional questions about your household.
XIV. HOUSEHOLD CHARACTERISTICS
Q25b. How many people currently live in this household, including yourself, other adults and all children who regularly sleep and eat in this household?
|___|___| People
Q1.26. Does your household have:
K. Electricity? 1. Yes 2. No
L. A radio? 1. Yes 2. No
M. A television? 1. Yes 2. No
N. A mobile telephone? 1. Yes 2. No
O. A non-mobile telephone? 1. Yes 2. No
P. A refrigerator? 1. Yes 2. No
Q. A wardrobe? 1. Yes 2. No
R. A sewing machine or loom? 1. Yes 2. No
S. A CD/DVD player? 1. Yes 2. No
T. A generator / battery / solar panel? 1. Yes 2. No
Q1.27. What type of fuel does your household mainly use for cooking?
1. Electricity 2. LPG 3. Biogas 4. Kerosene 5. Coal, lignite 6. Charcoal 7. Wood 8. Straw / shrubs / grass 9. Agricultural crop 10. Animal Dung 11. No food cooked in household 12. Other (Specify: _______________________ )
Q1.28. MAIN MATERIALS OF THE FLOORS
RECORD OBSERVATION
1. Earth / Sand / Clay 2. Dung 3. Wood planks 4. Palm / bamboo 5. Parquet or polished wood 6. Vinyl or asphalt strips 7. Ceramic tiles 8. Cement 9. Other (Specify: _______________________ )
EVALUATION REPORT: IMPACT EVALUATION OF THE CAMBODIA NOURISH PROJECT 93

Q1.29. MAIN MATERIAL OF THE ROOF 1. No Roof 2. Bamboo / thatch / palm leaf
RECORD OBSERVATION 3. Rustic mat 4. Wood planks 5. Cardboard 6. Plastic sheet 7. Metal 8. Finished wood 9. Calamine / cement fiber 10. Ceramic tiles 11. Clay tiles 12. Cement 13. Other (Specify: _______________________)
Q1.30. MAIN MATERIAL OF EXTERIOR WALLS 1. No walls 2. Palm / bamboo / thatch
RECORD OBSERVATION 3. Dirt 4. Bamboo with mud 5. Straw with mud 6. Stone with mud 7. Uncovered adobe 8. Plywood 9. Cardboard 10. Reused wood 11. Metal 12. Cement 13. Stone with lime/cement 14. Bricks 15. Cement blocks 16. Covered adobe 17. Wood planks / shingles 18. Other (Specify: _______________________ )
Q1.31. How many rooms in this household are used for sleeping?
|___|___| Rooms 88. Don’t Know
Q1.32. Does any member of this household own:
A. Watch? 1. Yes 2. No
B. Bicycle or cyclo? 1. Yes 2. No
C. Motorcycle or motor scooter? 1. Yes 2. No
D. Motorcycle cart? 1. Yes 2. No
E. Oxcart or horsecart? 1. Yes 2. No
F. Car, truck, tractor, or van? 1. Yes 2. No
G. Boat with a motor? 1. Yes 2. No
H. Boat without a motor? 1. Yes 2. No
EVALUATION REPORT: IMPACT EVALUATION OF THE CAMBODIA NOURISH PROJECT 94

Q1.33. Do you have your own bank account, Wing account, or other money account?
1. Yes 2. No
That concludes our interview. Thank you for your time and participation.
EVALUATION REPORT: IMPACT EVALUATION OF THE CAMBODIA NOURISH PROJECT 95

ANNEX D: DATA COLLECTION PROCESS AND QUALITY ASSURANCE
Study Registration
The study is registered in the ISRCTN registry (ISRCTN77820875). The study received approval from the Institutional Review Board at Georgia Institute of Technology (Ref: H19286), from New England IRB (IRB#: 120190186), and from the National Ethics Committee for Health Research in the Cambodian Ministry of Health (NECHR#: 110).
Ethics Considerations
The evaluation team explained the objective and process of the study to all participants in Khmer language using a consent script, which explained the purpose of the study, risks and benefits, confidentiality, and the voluntary nature of participation; each person could refuse to participate or withdraw at any time without any negative consequence or penalty. Each respondent provided written informed consent prior to the start of the survey, to confirm that she was willing to participate and to consent to anthropometry measures and stool sample collection of her child.
Face-to-face interviews were kept confidential and done in a private location. Each participant was assigned a unique code number to ensure anonymity in the questionnaire and database. Personally identifiable information was collected for the sole purpose of locating the household for the pick-up of stool sample containers the following day. All data is password protected, and only key staff have access to this information.
Data Collection Process
The evaluation team subcontracted KHANA Center for Population Health Research to collect the baseline and endline survey data and anthropometry measures, with close collaboration, supervision, and quality oversight provided by the evaluation team. The team used the same data collection process and quality assurance for both data collection rounds.
Survey Translation and Pre-Test
All survey instruments, including informed consent scripts, were prepared in both English and Khmer prior to use in the evaluation. A certified translator translated the scripts from English to Khmer and the local coordinator back-translated them. The questionnaire was then programmed into the tablet devices using KoBo Toolbox software and pre-tested for accurate format, capture, and data processing. Survey questions were also pre-tested to ensure comprehensibility and appropriateness.
Enumerator Training
Prior to the start of data collection, the evaluation manager and local coordinator instructed the survey firm’s supervisors and field manager on study procedures and survey content and also co-led the enumerator training. The training lasted five days and focused on reviewing and understanding the questionnaire, the survey methodology, tablet use, and surveying techniques both in the classroom and in the field. It also included mock interviews and a one-day practical component training enumerator teams to record direct observation of hygiene conditions in the dwelling and how to accurately measure and weigh children for the anthropometry module, following standard WHO protocols. The training also included one day for a field pilot test. The enumerator team consisted of individuals with prior
EVALUATION REPORT: IMPACT EVALUATION OF THE CAMBODIA NOURISH PROJECT 96

experience conducting in-person surveys and collecting anthropometric data, and who were fluent in Khmer.
Field Work
Baseline data collection was carried out in September 2016 and endline data collection was carried out in August 2019, with a team of 40 paired enumerators, five supervisors, an anthropometry specialist, a field coordinator, a data manager, and the MSI local coordinator.
The endline survey took, on average, 35 minutes to complete and was administered face to face at the eligible households using tablet devices. The enumerators obtained written informed consent from each respondent, prior to the start of the survey, to confirm that she was willing to participate and to consent to anthropometry measures of her child. KHANA provided a small gift (equivalent of USD $1.50) to respondents after the survey was completed as a token of appreciation. Prior to the start of data collection, the survey was pre-tested and then piloted and enumerators were trained over the course of four days. Data quality assurance processes were put in place internally by KHANA, and also independently by the evaluation team.
Data Quality Assurance
KHANA followed standard operating procedures for data collection, including verification procedures conducted at the site and data query by the data manager. The survey firm employed the following set of quality control procedures during each data collection round:
The field manager and supervisors constantly managed the workflow to ensure all enumerators followed the agreed timeline and procedures. The field manager was in consistent contact with the supervisors to find proper solutions to any unexpected challenges.
Supervisors a ccompanied at least 10% of the interviews c onducted. The anthropometry specialist was pr esent in the field during the entire baseline phase,
accompanying enumerators to ensure proper technique measuring and recording height and weight.
Completed surveys were uploaded to a secured server where the data manager conducted continuous data quality checks. Any discrepancies in the data were communicated to the individual enumerator and used in the refresher training sessions during field work.
Datasets and progress reports were submitted to the evaluation team on a weekly basis. The progress report included a number of completed surveys a nd reasons for replacement.
The evaluation team provided additional oversight and monitoring during each data collection round:
Accompaniments of enumerators during interviews a t regular i ntervals. The local coordinator on the evaluation team observed the enumerators’ familiarity with and comprehension of the questionnaire and clarity in asking questions. The local coordinator a lso ensured that enumerators followed the protocols for random selection of households.
The local coordinator also conducted back-checks on 10% of completed surveys f or each round. Surveys t o be back checked were selected randomly and stratified by enumerator to ensure each one was c hecked on an equal basis. During the back-check call, several validation questions were asked, including confirmation of enumerator’s visit, presence of eligible child, confirmation that length and weight m easurements were taken, receipt of token, friendliness of the enumerator, respondent’s level of school attendance, number of household members, total births, participation in CLTS activities, main source of drinking water, number of rooms in the
EVALUATION REPORT: IMPACT EVALUATION OF THE CAMBODIA NOURISH PROJECT 97

dwelling, and ownership of a motorcycle or motor s cooter. Only a few minor discrepancies were found. No back check resulted in significant variance from the reported data.
The local coordinator and anthropometry specialist also re-visited households to repeat the anthropometry measures from a random sample (5%). This audit showed no meaningful measurement errors and provided the opportunity to fix measurements that were not taken correctly t he first time.
Photographs of the household latrines were taken by each enumerator and tagged with the unique household identification number. A random sample (20%) of the photographs were cross-checked with the recorded survey answer to ensure proper classification. No discrepancies were found.
Each week, the evaluation team conducted additional checks to compare each enumerator’s average performance to the total sample averages i n terms of interview length, number of completed codes, number of “do not knows,” scale usage, section skips, and ranges of numerical values. No significant outliers we re found.
EVALUATION REPORT: IMPACT EVALUATION OF THE CAMBODIA NOURISH PROJECT 98

ANNEX E: ANTHROPOMETRY PROTOCOLS
Anthropometric measurement is comprised of weight and length. The team measured weight using a Uniscale (UNICEF recommended scale) in Kilograms with precision to one decimal point. It measured length using a length board (UNICEF / WFP recommended) in Centimetre with precision to one decimal point. Two data measurements were required, one from the measurement taker and another one from an assistant.
The team measured all children ages o ne – 28 months that lived in the household and that had been living in that commune their entire life. The measurement procedure followed FANTA Guidelines:113
Weight measurement:
Preparation: Ensure enough material is a vailable for measurement (scale, battery, pen, tissue, record form, and age calculation form) with proper function. Ensure that the scale is po sitioned in a plate and smooth surface. Measurement taker i s o n the right hand of mother/caregiver while assistant is in front of mother/caregiver. Ensure that children dress light c lothes with no cap or shoes. Assistant helps mother/caregiver in carrying the child and asks m other/caregiver to go on to the scale after proper functioning.
Measurement: o If the child is l ess t han 24 months old, do tared weighing:
Request mother/caregiver to remove her shoes and stand on the scale (without the child) with head held high and standing still; read the measurement result loudly; press button to tare scale; hand the child to mother/caregiver a fter scale functioning; read weight of child out loud so that assistant can record the measurement.
o If the child is 24 – 28 months o ld, and will stand still, weight t he child alone: Ask the mother to help the child remove shoes a nd outer clothing; talk with the
child about the need to stand still; ask the child to stand in the middle of the scale, feet slightly apart, and to remain still until you say so; read weight of child out loud so that assistant can record the measurement.
Second Measurement: Request mother/caregiver t o step off the scale. Repeat the measurement steps. Record second measurement.
Height measurement:
Depending on a child’s age and ability to stand, measure the child’s length or height.
If the child is less than 24 months, measure the child’s length lying down:
Preparation: Prepare length board on a hard, flat surface. Ensure length board stability; take off shoe and cap from child. Check measurement level on the length board, and ensure the record form is nea rby. The assistant should kneel with both knees behind the base of the board; the measurer should kneel with both knees on the right side of the child to hold the foot piece with their r ight hand.
Measurement: With the caregiver’s he lp, lay child on their back on the board. The assistant should cup their ha nds over t he child’s ea rs t o place child’s hea d against base of board so that
113 Kristen C. & Oot, L. (2018). Guide to Anthropometry: A Practical Tool for Program Planners, Managers, and Im plementers.
Washington, DC: Food and Nutrition Technical Assistance III Project (FANTA)/ FHI 360. https://www.fantaproject.org/sites/default/files/resources/FANTA-Anthropometry-Guide-May2018.pdf
EVALUATION REPORT: IMPACT EVALUATION OF THE CAMBODIA NOURISH PROJECT 99

the child is l ooking straight up . The measurer should make sure the child is laying flat and in the center of the board; place their left hand over the child’s s hins or over the knees and press them firmly a gainst the board; with their right hand make sure the feet are perpendicular to the floor a nd place the sliding foot piece firmly again the child’s heels; check head, eye, shoulder, hand, buttock, knees and heel for pr oper positioning. Measurement must be read to the nearest of 0.1 cm; assistant should record the measurement.
Second Measurement: Remove the sliding foot piece and release left hand from the shins or knees. Make sure body is in proper position and still. Repeat the measurement one more time to ensure accuracy of reading. If the two measurements are different by more than 1.0 cm, then a third measurement is taken.
If the child is 24 – 28 months old, measure standing height unless the child is unable to stand:
Preparation: Place the measuring board at a right angle between a level floor a nd against a straight, hard vertical surface such as a wall or pillar. Make sure the board is not moving. Ask the caregiver t o walk the child to the board and to kneel in front of the child. The assistant should place record form nearby on the ground and kneel with both knees on the right side of the child. The measurer should kneel on their right knee on the child’s left side.
Measurement: The assistant should place the child’s feet flat and together in the center of and against the back and base of the board; place right hand just above the child’s ankles on the shins, left hand on the child’s knee s a nd push against the board; make sure the child’s legs a re straight and the heels a nd calves a re against the board. The measurer will ask the child to look straight ahead at the mother who should stand in front of the child; place left hand under the child’s chin; make sure the shoulders are level, and the head, shoulder blades and buttocks a re against the board. With right hand, lower the headpiece on top of the child’s he ad. Measurement m ust be read to the nearest of 0.1 cm; assistant should record the measurement.
Second Measurement: Remove the sliding head piece and release hands from chin, shins or knees. Make sure body is in proper position and still. Repeat the measurement one more time to ensure accuracy of reading. If the two measurements are different by more than 1.0 cm, then a third measurement i s taken.
Following the weighing and length measurements, any child who is classified as severely malnourished is referred to the health clinic.
EVALUATION REPORT: IMPACT EVALUATION OF THE CAMBODIA NOURISH PROJECT 100

ANNEX F: EVALUATION TEAM MEMBERS
The core team for this evaluation consists of the principal investigator, a nutrition and WASH specialist, researcher, evaluation manager, and local coordinator.
PRINCIPAL INVESTIGATOR – JOE BROWN, PHD
Joe Brown holds a Ph.D. in Environmental Sciences and Engineering and is currently a professor in Environmental Engineering at the Georgia Institute of Technology. Dr. Brown brings global experience conducting evaluations of WASH interventions, including an impact evaluation of water filters to reduce diarrheal disease in Cambodia and a USAID-funded evaluation to study health impacts of an urban sanitation project in Mozambique. He also published several academic papers with respect to the intersection of environmental engineering and public health, and applied advanced econometric and quantitative evaluation techniques to data collected in developing country contexts. As principal investigator of this study, Dr. Brown is primarily responsible for the overall design and implementation of the evaluation and ensuring that all expected tasks and deliverables are achieved on time and of high quality.
EVALUATION MANAGER – IRENE VELEZ
Irene Velez holds a Master’s Degree in International Development Policy and has over nine years of global work experience in survey design, quantitative analysis, and designing and implementing impact and performance evaluations. She has technical knowledge of different experimental and quasi-experimental evaluation methods, as well as practical expertise managing the execution of these evaluations. Previously, Ms. Velez served as team leader for the performance evaluation of a human rights program in Colombia, served as a consultant for a study on counter-trafficking in persons in Guatemala, and conducted research on the impact of microcredit in Mexico. Ms. Velez is primarily responsible for overseeing and coordinating the execution of the evaluation design particularly data collection efforts, monitoring implementation fidelity of the evaluation design, and ensuring efficient and timely reporting. She is also the main technical point of contact on the evaluation team for USAID/Cambodia and NOURISH implementing partner staff.
SENIOR RESEARCHER / NUTRITION AND WASH SPECIALIST – OLIVER CUMMING
Oliver Cumming is a Lecturer in Environmental Health at the London School of Hygiene and Tropical Medicine and holds a Master’s Degree in Public Health. He has previous experience with research at the intersection between nutrition and sanitation and programs that aim to tackle child nutrition and stunting prevalence in developing countries. He also previously served as lead/co-lead for multiple impact evaluation(s) that include a counterfactual and is familiar with a range of impact evaluation designs and with USAID evaluation guidance. As senior researcher, Mr. Cumming is responsible for supporting the principal investigator in the design and implementation of the evaluation, providing technical input on the nutrition outcome measures and study design, and will help ensure that the evaluation provides a well-grounded and technically sound assessment of the integration of nutrition and sanitation programming.
RESEARCHER – AMANDA LAI
Amanda Lai is currently a PhD student in Environmental Engineering at the Georgia Institute of Technology and recently worked on projects evaluating impacts of fecal contamination in the environment. She is also a licensed Professional Engineer in the state of California with over five years of
EVALUATION REPORT: IMPACT EVALUATION OF THE CAMBODIA NOURISH PROJECT 101

consulting experience as a practicing engineer. Ms. Lai She is responsible for analyzing the endline survey data and stool samples.
LOCAL COORDINATOR – KRISNA SENG
Krisna Seng holds a Master’s Degree in Business Administration and a Bachelor’s Degree in Anthropology and Ethnography. He has more than 10 years of experience managing projects, leading research, and in doing monitoring and evaluation work. He has comprehensive knowledge of qualitative and quantitative data collection. Based in Phnom Penh, Mr. Seng serves as the local study liaison interacting directly with NOURISH’s implementing partner staff when needed, assisting with the submission of required national ethics applications and securing other necessary local approvals, as well as overseeing local survey research partners to ensure that data collection proceeds according to agreed-upon quality assurance standards.
EVALUATION REPORT: IMPACT EVALUATION OF THE CAMBODIA NOURISH PROJECT 102

ANNEX G : CONFLICT OF INTEREST DISCLOSURE FORMS
EVALUATION REPORT: IMPACT EVALUATION OF THE CAMBODIA NOURISH PROJECT 103

EVALUATION REPORT: IMPACT EVALUATION OF THE CAMBODIA NOURISH PROJECT 104
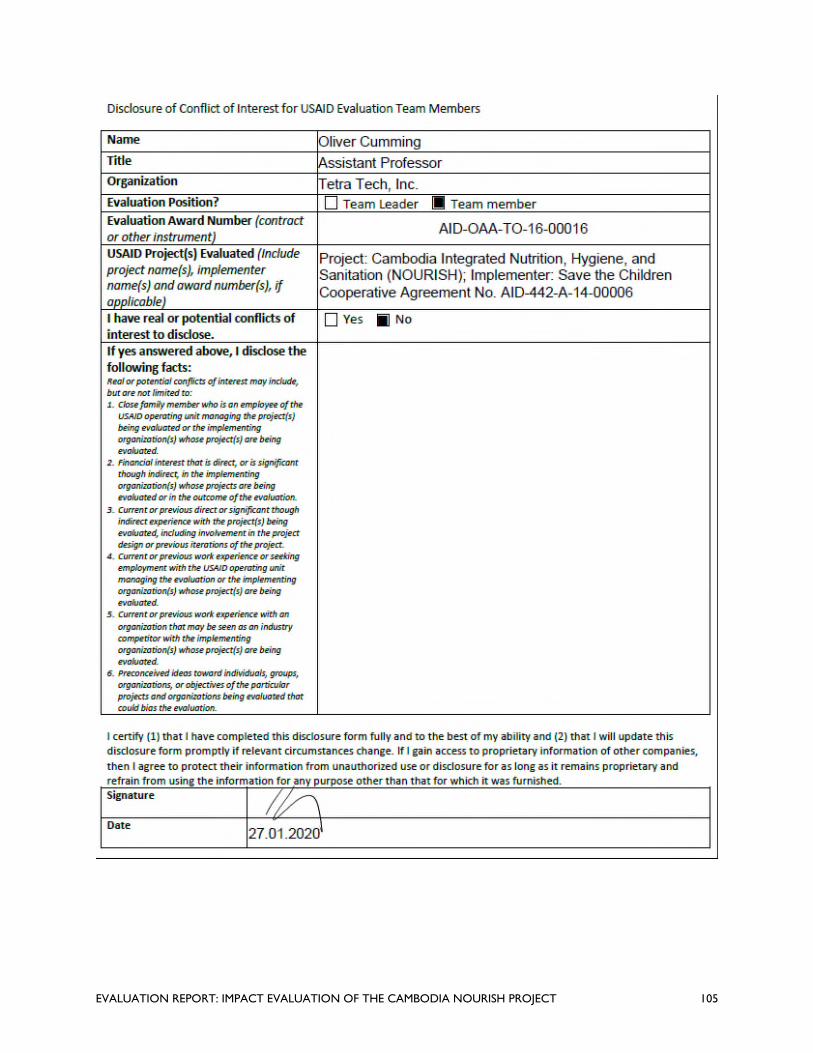
EVALUATION REPORT: IMPACT EVALUATION OF THE CAMBODIA NOURISH PROJECT 105

EVALUATION REPORT: IMPACT EVALUATION OF THE CAMBODIA NOURISH PROJECT 106

EVALUATION REPORT: IMPACT EVALUATION OF THE CAMBODIA NOURISH PROJECT 107

EVALUATION R
U.S. Agency f or International Development 1300 Pennsylvania Avenue, NW
Washington, DC 20523 Tel: (202) 712-0000 Fax: (202) 216-3524
EPORT: IMPACT EVALUATION OwF TwHEw C.AMusaiBODdIA N.goOv UR ISH PROJECT 108