
Impact Evaluation of Remittances for Pakistan: Propensity ... · PDF file©The Pakistan...
30
©The Pakistan Development Review 52:1 (Spring 2013) pp. 17–44 Impact Evaluation of Remittances for Pakistan: Propensity Score Matching Approach RIZWANA SIDDIQUI This study attempts to uncover the biases in the impact evaluation of remittances when the problems relating to selection bias and counter factual are not taken into account. Taking migration as an intervention and foreign remittances as an input, the study measures the socioeconomic impact using an approach which yields more accurate non-experimental estimates in self-select cases through multiple output and outcome indicators such as income, expenditure, saving, and capital accumulation which, directly and indirectly, affect households’ welfare, poverty incidence and growth prospects of a country. Using PIHS data, the study first calculates the difference in socioeconomic characteristics of treated or remittances beneficiary households (RBH) and control or remittances non-beneficiary households (NRBH) ignoring endogeneity and observable differences. Second, it calculates the propensity score and evaluates the impact using data from common support area for both RBH and NRBH households. Third, it evaluates the impact using the propensity score matching approach which replicates the experimental benchmark. The difference in the first and the third estimates reveals the bias originating from the issues of selection and difference in observable characteristics. The results show that after controlling for observable characteristics of households, regional difference, networking and applying the selection correction technique, the average impact of remittances is significantly reduced. A disaggregated analysis shows that the socioeconomic impact of remittances differs by the level of skills. The impact is significant for relatively low skilled poor households but for high skilled households it remains significant only in case of bank deposits. The paper concludes that estimates are biased upward if the selectivity issue and endogeniety problems are ignored which may lead to wrong policy implications. JEL Classification: F24, O15, P36 Keywords: Propensity Score Matching, Remittances, Poverty, and Capital Accumulation 1. INTRODUCTION The extent to which foreign remittances affect welfare, poverty and growth has been a matter of considerable debate. 1 Pakistan is among the top five countries whose Rizwana Siddiqui <[email protected]> is Senior Research Economist at the Pakistan Institute of Development Economics, Islamabad. Author’s Note: I am very thankful to Dr Howard White, Executive Director of International Initiative for Impact Evaluation (3ie), for his continuous help and invaluable comments. I am also thankful to anonymous referees for their detailed comments.
Transcript of Impact Evaluation of Remittances for Pakistan: Propensity ... · PDF file©The Pakistan...

©The Pakistan Development Review
52:1 (Spring 2013) pp. 17–44
Impact Evaluation of Remittances for Pakistan:
Propensity Score Matching Approach
RIZWANA SIDDIQUI
This study attempts to uncover the biases in the impact evaluation of remittances when
the problems relating to selection bias and counter factual are not taken into account. Taking
migration as an intervention and foreign remittances as an input, the study measures the
socioeconomic impact using an approach which yields more accurate non-experimental
estimates in self-select cases through multiple output and outcome indicators such as income,
expenditure, saving, and capital accumulation which, directly and indirectly, affect households’
welfare, poverty incidence and growth prospects of a country. Using PIHS data, the study first
calculates the difference in socioeconomic characteristics of treated or remittances beneficiary
households (RBH) and control or remittances non-beneficiary households (NRBH) ignoring
endogeneity and observable differences. Second, it calculates the propensity score and
evaluates the impact using data from common support area for both RBH and NRBH
households. Third, it evaluates the impact using the propensity score matching approach which
replicates the experimental benchmark. The difference in the first and the third estimates
reveals the bias originating from the issues of selection and difference in observable
characteristics. The results show that after controlling for observable characteristics of
households, regional difference, networking and applying the selection correction technique,
the average impact of remittances is significantly reduced. A disaggregated analysis shows that
the socioeconomic impact of remittances differs by the level of skills. The impact is significant
for relatively low skilled poor households but for high skilled households it remains significant
only in case of bank deposits. The paper concludes that estimates are biased upward if the
selectivity issue and endogeniety problems are ignored which may lead to wrong policy
implications.
JEL Classification: F24, O15, P36
Keywords: Propensity Score Matching, Remittances, Poverty, and Capital
Accumulation
1. INTRODUCTION
The extent to which foreign remittances affect welfare, poverty and growth has
been a matter of considerable debate.1 Pakistan is among the top five countries whose
Rizwana Siddiqui <[email protected]> is Senior Research Economist at the Pakistan Institute of
Development Economics, Islamabad.
Author’s Note: I am very thankful to Dr Howard White, Executive Director of International Initiative
for Impact Evaluation (3ie), for his continuous help and invaluable comments. I am also thankful to anonymous
referees for their detailed comments.

18 Rizwana Siddiqui
foreign exchange earnings comprise a significant amount of foreign remittances.
Growing by about 20 percent annually the foreign remittances now form 5 percent of
Pakistan’s GDP in 2010-11.2 Their importance can be viewed from the fact that
remittances do not have to be paid back like other foreign exchange receipts such as
official development assistance. Therefore, its integration into overall development
planning is essential to maximise its benefits. A comprehensive analysis using the most
appropriate technique is needed to form appropriate policies [White (2005)].
Foreign remittances play an important role at the macro as well as micro levels.
They are a major source of income of the recipient households in Pakistan and help
mitigate the financial hardships of the households. The recipient households put them to
various uses that have welfare, poverty, and growth implications. The existing
literature3measures the impact of the remittances using methodologies that vary from the
most complicated ones such as the economy wide computable general equilibrium (CGE)
model [Siddiqui and Kemal (2006) and Siddiqui (2009)] to the simplest as descriptive
statistics.4 The CGE method is most demanding not only in overcoming the problem of
data scarcity and capturing multi-round effects5 but also in finding appropriate elasticities
and skills for programming [Knerr (1992)]. Some studies explore just one dimension or
the other in the partial equilibrium framework.6 However, the majority of these studies do
not account for selection to migration7and ignore the counterfactual or differences in the
observable characteristics, hence they tend to overstate the impact. Therefore, it is
1Remittances currently represent about one-third of total financial flows to developing countries, which
are larger than official development assistance flows. In many countries, they are also larger than foreign direct
investment. Therefore, the interest in the impact of remittances is growing to better understand how remittances
resulting from migration contribute to poverty reduction [Fajnzylber and Lopez (2007)]. 2In absolute term, remittances have increased from $1087 million to $13186.58 over 2001-12 [Pakistan
(2008-09, 2012-13)]. 3Adams (1998), Aggarwal, et al. (2006); Amjad (1986); Amjad (1988); Arif (1999); Burney (1988);
Gilani, et al. (1981); Hyun (1988); Iqbal and Sattar (2005); Jongwanich (2007); Kazi (1988); Mahmud (1988);
Malik and Sarwar (1993); Maqsood and Sirajeldin (1994); Nayar (1988); Quisumbing and McNiven (2007);
Rodrigo and Jayatissa (1988); Siddiqui and Kemal (2006); Tan and Canlas (1988); Tingsabad (1988). 4Amjad (1986, 1988); Burney (1987, 1988), Gilani, et al. (1981); Kazi (1988) for Pakistan, Oh-Seok
(1988) for Korea, Mahmud (1988) for Bangladesh, Nayar (1988) for India, Rodrigo and Jayatissa (1988) for Sri
Lanka, Tan and Canlas (1988) for Philippines, Tingsabad (1988) for Thailand. 5An inflow of remittances increases household income and expenditure, which may, in turn, generate
new income and employment opportunities—multiplier effect [Adams (1998)]. 6For instance, Iqbal and Sattar (2005) estimate the relationship between growth and remittances. Arif
(1999) investigates investment behaviour of remittances beneficiary households (RBH) and Malik and Sarwar
(1993) compare the consumption pattern of RBH and NRBH [non-remittance beneficiary households]. Adam
(1998) has conducted a Tobit analysis to explore remittances impact on rural asset accumulation-land, livestock
and non-farm assets. All these studies ignore the problem of selection to migration. Though Maqsood and
Sirajeldin (1994) account for selection correction terms and focus on one aspect, wage earnings and used
explanatory variables which are correlated with migration such as wealth. 7Gilani, et al. (1981); Amjad (1986); Irfan (1986); Various studies in Amjad (1988); Burney (1987);
Malik and Sarwar (1993); Arif (1999); Iqbal and Sattar (2005); Siddiqui and Kemal (2006); Jongwanich (2007);
Some of them have analysed the impact of remittances on macro and micro aggregates quantitatively using
regression analysis. For instance Maqsood and Sirajeldin (1994) consider migration as endogenously
determined, therefore made corrections in their earnings function. However, all these studies overstate the
impact because they ignore the differences in observable characteristics i.e., measure the impact of remittances
on consumption without taking into account the impact of income what they have earned in the domestic
economy before migration.

Impact Evaluation of Remittances 19
obligatory to take into account the selectivity issue and the difference in observable
characteristics that measure the actual impact of treatment. Any ambiguity in the impact
raises need for empirical research. To correctly measure the socio economic impact of
remittances, one must compare the socio-economic indicators such as income,
expenditure, saving and capital accumulation (human, financial and physical) of the
migrant-households8 to what they have if they are not migrated. The latter has not been
observed. Recognising this difficulty, Rosenbaum and Rubin (1983) were the first to
propose the propensity score matching (PSM) approach for more accurate non-
experimental estimates in self-select cases. In the following years, the method was also
recommended by Heckman, et al. (1997); Dehejia and Wehba (2002); White (2006); and
McKenzie and Gibson (2006); Deininger and Liu (2008) for this type of analysis.
Considering migration as an intervention—a case of non-random selection of
remittance beneficiary households [individual self-select to migrate]—this author adopted
the PSM approach to evaluate the impact of remittances on the socio economic condition
of households which, directly and indirectly, affect welfare, poverty, and growth
prospects of the country. For this purpose data from the Pakistan Integrated Households
Survey (PIHS) [Pakistan (2002)] on income, consumption, saving, asset holdings,
indebtedness, capital accumulation—human, physical and financial, and domestic
economic activity for both groups i.e. [RBH and NRBH] was used employing the same
methodology. This study assumes that households which receive foreign remittance are
treated or remittance beneficiary households (RBH) and the control group which does not
receive remittance income are called non-treated or remittance non-beneficiary
households (NRBH).
Here three approaches are used to calculate bias in attribution of remittances. First,
the naive approach to calculate the mean difference in socio-economic indicators using
full sample of all RBH and NRBH ignoring selection bias and counter factual. Second,
the difference in the indicators is calculated using data from common support area after
allowing for the propensity score. Third, after pairing observation from RBH and NRBH
groups based on PSM to balance treatment and control group on observable
characteristics, the difference in the mean value of socio-economic indicators is
calculated. The difference in the three estimates reveals the bias that originates due to
selection bias and the difference in observable characteristics.
The rest of the paper has been organised as follows. The next section presents
impact evaluation methodology, selection variables and multiple socio-economic
indicators. Data used for the analysis are discussed in Section 3. Section 4 discusses
distribution of beneficiary and control group. The results are discussed in Section 5.
Sections 6 and 7, respectively, discuss heterogeneity in the impact by skill level and
compare the results of this study with earlier ones. Section 8 concludes the paper.
2. METHODOLOGY
In impact evaluation studies, bias originates from three sources; (i) selection bias,
(ii) self-selection, and (iii) difference in observable characteristics.
8Migrant households are those who receive remittance income from abroad and non-migrants are those
who do not receive income from abroad.

20 Rizwana Siddiqui
First, the naive approach is used to measure the difference in socio-economic
impact of remittances. In this approach, the impact is measured using all households—
RBH and NRBH ignoring selection bias and counter factual.9
Second, the conceptual framework from Rosenbaum and Rubin (1983) and
Heckman, et al. (1997, 1998); which has been widely used in this type of analysis
[Dehejia and Wehba (2002); McKenzie and Gibson (2006); Deininger and Liu (2008)
etc.] is used to reveal the bias (if any) in the estimates. The framework consists of PSM
and difference methods. The PSM approach has many advantages over the other
methods:
(1) It overcomes the problem of multi dimensionalities and develops an index of
propensity score P(X) for the treated (RBH) and control (NRBH) groups to match. In the
presence of a large number of explanatory variables, matching all variables becomes
difficult. The PSM method renders the multidimensional matching problem to one-
dimensional i.e. instead of matching on a vector X of variables.
(2) It gives more accurate non-experimental estimates, where households self-
select into the programme [Dehejia and Wehba (2002); McKenzie and Gibson (2006);
Deininger and Yanyan (2008); White (2006)].
(3) It replicates the experimental benchmark if the outcome from the treatment and
control groups is (i) compared over a common support area (the distribution of
households likely to receive the treatment is similar in both groups). (ii) Data is collected
from both groups in a similar fashion [Dehejia and Wehba (2002)].
(4) The method does not require a parametric model and allows the estimation of
mean impacts without arbitrary assumptions about functional forms and error distribution
[Jalan and Ravallion (2001)].
In this study the remittance-response function or selection equation is estimated
first. The major concern in the PSM approach concerns which explanatory variables
should be included in remittance response function to estimate the probability of a
household receiving remittances or not. The probability depends on households and
community based characteristics of RBH and NRBH. The dependent variable represents
the status of households receiving remittance income (decision to migrate) or not i.e., a
dichotomous variable taking the value ‘1’ when household receive remittances and ‘0’
when it does not.
jjiiREM zgxbD ... ... ... ... ... ... (1)
DREM is a dichotomous variable where DREM = 1 if a household receive
remittances, otherwise 0.
xi is a vector of individual or household level characteristics
zj is a vector of community characteristics
In the absence of information about migrated labour, it is worthwhile to examine
family characteristics that motivate the migrated worker’s decision to remit income.
9Malik and Sarwar (1993) have compared consumption of RBH and NRBH using this method. The
results show that total consumption and recurrent consumption of RBH are higher by 0.05 points, whereas
expenditure on durable goods is higher for NRBH.

Impact Evaluation of Remittances 21
These variables are chosen in such a way that they affect remittance income (migration
decision) but not the outcome variables.
The most important variable that determines remittance from migrated labour is
their education [Nishat and Bilgrami (1993); Adams (2008).10
This information is not
available from the existing data. However, the correlation between the education of the
head of the households and average education of the earners is 0.75. Therefore, here the
education of the head of household has been used as a determinant of the remittance
income. Five categories of education [(1-5), (6-9), (10-13), (14-15), and 16 and above
including all professional categories] are defined with base category of education of less
than one year.
The principal migration motivation comes from household size, which determines
the need for migration. If a household has a large family size, labour is expected to
migrate to earn more owing to the fact that labour receives higher wages abroad. The age
of the head of the household is included in the equation as an explanatory variable.
People living in the same community are more likely to have many characteristics
(Zj) in common including community norms, infrastructure, leadership, physical
environment, social structure, household strategies. Therefore, they behave in similar
fashion. The existence of migratory network affects migration from that community. In
this study community remittance income per household has been used to indicate the
existence of migratory network.11
It indicates that the larger the value of remittances per
household, the stronger is the migratory network and more people are expected to migrate
abroad from that community.12
Region also reflects a certain skill level. For instance, labour from rural area
belongs to lower education level and more likely to send a higher proportion of low
skill (low educated or unskilled) labour compared to urban labour. Language is also an
important factor in determining the type of labour migrating to different parts of the
world. In this case, workers from more developed provinces with high literacy rate are
more likely to send skilled labour.13
In this study one dummy variable has been
employed for region –DRegion with rural as base category and three dummy variables
(Di) for three provinces, Punjab, Sindh, Khyber Pakhtunkhwa (KP) with rest of
Pakistan (ROP)14
as the base category to control for regional differences, assuming that
characteristics mentioned above are region specific and vary across the regions [Nishat
and Bilgrami (1993)].
10Education may also be an important variable to determine, whether migrant send money through
formal or informal channel. The highly educated are expected to send remittances through formal channels-
using financial institution. Whereas illiterate or low educated labour send remittance through informal channels
such as ‘hundi’. Education and occupation are highly correlated. 11This indicates migration prevalence rate and is used as an instrument for the opportunity to migrate
[Mansuri (2007)]. Migratory network increase migration opportunities by providing information to potential
migrants and existing migrant worker relax financial constraints [Mansuri (2007)]. 12Remittance income per households along with education level will also determine how these
remittances are sent and from where. However, all these are assumptions, for real analysis there is a need to
collect data on these issues. 13Education may also be important determinant of labour migrated to specific region. For instance,
labour with high education level may migrate to English speaking countries, whereas labour with lower
education level may migrate to Middle East countries. 14ROP includes Balochistan, Federal Administered Tribal Areas and Azad Kashmir.

22 Rizwana Siddiqui
The likelihood of being a recipient family is presented by reduced form equation
which includes above mentioned households level and community level characteristics.
The model is defined as follows:
regioni
iiEDU
EDUEDUHHcomREMHREM DDDHsizeAgeYD
5
1432
... (2)
Di= 1 for ith province and 0 otherwise,
where
i = P(Punjab), Sindh (S), Khyber Pakhtunkhwa (KP)
= 0 otherwise
DEDU = 1 for kth education level of head of the household and 0 otherwise,
where
EDU = primary (1-4), Middle (5-9), FA(10-13), BA (14-15), 16 and above with
base category of less than one year of education.
Dregion = 1 for urban and 0 otherwise, base category rural
Hsize = Household size—total members present in a household
Ycom
REMH = Community remittance income per household
AgeHH = Age of the head of household
In this study the SPSS programme has been used to estimate the logistic function
defined in Equation 2.
The second concern in this approach is to choose treatment (RBH) and comparison
or control group (NRBH). The SPSS-PSM–macros developed by Levesque to match
PSM of the treated (RBH) with control group (NRBH) are employed and the common
support area (S) is defined selecting the observation following Heckman, et al. (1998).
( ¦ 1) ( ¦ 0)rem remS Supp X D Supp X D ... ... ... ... (3)
It defines the area with the common range dropping all observations from RBH
and NRBH whose P values are beyond the range defined in Equation 3.
Third, the exact matching approach in which each RBH is paired with NRBH has
been used which minimises the difference of their PSM within the common support area
and drops the rest of the households.
The next goal is to calculate the attribution of remittances to socio-economic
outcome. Classic evaluations focus on two parameters: average impact on the units that
are given the opportunity to take it up (non-participant-NRBH) and the average impact on
those who receive it (participants-RBH) [Ravallion (2009)].
Let Y be the vector of socio-economic variables that are defined as output and
outcome variables. The outcomes corresponding to DREM=1 and DREM= 0 are denoted by
(Y1, Y0), respectively, and X is the vector of variables that are time invariant
characteristics of the treated unit RBH. The assumption underlying the matching
estimator is that all relevant differences between the two groups are captured by their
observables X. The treatment assignment DREM (household receiving remittance income)
is independent of Y (Y0 and Y1) given X (observable characteristics). It can be written as

Impact Evaluation of Remittances 23
XDYY REM ¦)( 1,0 ... ... ... ... ... ... (4)
This implies that
)P(¦)( 0 XDY REM ... ... ... ... ... ... (5)
Where P(X) is propensity score, and defined as P(X) = Pr (DREM=1│X) which by
definition lies between 0 and 1. Another implicit assumption required by the matching
estimator is the stable unit treatment value assumption (SUTVA), which states that the
outcome of ith unit given treatment is independent of the outcome of unit jth unit given
treatment. To satisfy this assumption we have to ignore the general equilibrium effects
[Ham, et al. (2005)]. In the absence of baseline data, the remittance impact (REMI) is
measured as follows:
REMI = E(Y1|DREM = 1) – E(Yo|DREM= 0)
This expression measures mean difference in the impact of remittance income on
RBH over the control group NRBH.
The effects of remittances vary with the education of head of the households.15
This study tests the hypotheses: Does the effect of the treatment vary by education level?
Let Edu denote schooling and s denote the different levels of schooling. The effect of
remittances income on different educational groups is estimated for each education level
in the following way:
Δs =E(Y1-Y0) ║DREM=1, Edu=s) = E(Y1 ║DREM=1, Edu=s )–E(Yo║DREM=0, Edu =s) (6)
We define s = 0, 1, 2, 3, 4, 5
S=0 if education is less than one year
S=1 if education is below primary, (1-4) year
S=2 if education is between (5-9) year
S=3 if education is between (10-13) year
S=4 if education is between (14-15) year
S=5 if education is 16 years and above including professionals such as doctors, engineers
etc.
This study measures the attribution of remittances to socioeconomic aspects of
households such as income, expenditure, saving, investment, welfare, and poverty. These
indicators are discussed in detail in the next section.
Third, the bias in the impact of remittances is calculated ignoring the differences
in observable characteristics. It is calculated as difference in difference.
Let D1, D2, and D3 be the differences measured using full sample, data from
common support area, and using PS matching of RBH and NRBH, respectively. The
difference between D1 and D3 reveals the bias in the estimates if one ignores the issues
of endogeniety and differences in the observable characteristics.
Bias = D1 – D3
15Quisumbing and McNiven (2007) show that countries exporting unskilled labour receive more
remittances per capita than the remittances per capita received by the countries exporting skilled labour.
24 Rizwana Siddiqui
2.1. Socio-economic Indicators
In this study multiple socio-economic indicators (including basic need indicators
(BNIs such as calorie intake, housing, safe drinking water, sanitation facilities, education)
have been used to measure attribution of remittances. Satisfaction of basic needs
determines a country’s capability development [Siddiqui (2006)] and poverty reduction.
(a) Income Effects
Migrants are expected to receive higher income as workers leave their home
country to take the advantage of higher wages [Farchy (2009)] and remit a significant
amount of their earnings; about 78 percent of their total earnings [Siddiqui and Kemal
(2006)]. Remittances are not exogenous transfers but a substitute for the domestic
earnings that migrants had earned if they had not migrated. Income per adult equivalent
has been used here to measure the income effect of migration.16
The RBH group has three choices to use these receipts: consume, save or invest,
which directly and indirectly affect poverty and growth prospects of a country.
(b) Consumption
Earlier literature on socio-economic impact of remittances [Gillani, et al. (1981)
and Amjad (1988)] show that remittances (57 to 62 percent) are generally, used for
consumption purposes.17
The expenditure pattern of households is central to any
meaningful discussion on welfare and poverty. If households increase the demand for
food and non-food items, remittances are more likely to improve the welfare of
households and reduce poverty. Here food and non-food expenditure in rupees per adult
equivalent term and calorie intake (BN) per adult equivalent have been used which
directly determine the welfare and poverty effects and indirectly determine the growth
effects as increase in expenditures boosts the economy through multiplier effects.
Similarly, higher expenditure on consumer durables [households’ equipment] such as
washing machine, TV, oven, refrigerator, automobiles also indicates higher standard of
living. Ownership of households’ equipment is measured in rupee value at the household
level.
(c) Investment
If remittances ease working capital constraint, it is expected to improve capability
and growth prospects of a country by increasing human and physical capital.
Investment in Human Capital: Remittances are expected to improve the capability
of a household if migrant households spend more on children’s education to improve the
quantity and quality of their education. It compensates for loss in human capital due to
migration of labour in the long run and improves literacy rate (as indicator used to
measure capability of a country). In this study ‘average class of school-going children in
16According to the theory of migration, migration itself is nothing but investment in human capital,
which contributes to growth on their return. But that analysis is beyond the scope of this paper. 1757 percent of total remittances (through official and unofficial channels) are allocated to recurrent
consumption and 62 percent of remittances through official channels only.

Impact Evaluation of Remittances 25
a household’ and expenditure on education per class have been used to measure quantity
and quality of human capital formation, respectively i.e., the key outcome from the
perspective of economic growth in the long run.
Investment in Physical Capital: Empirical studies show that migrant households
largely invest in housing. Housing is one of the basic needs. This effect has been captured
in terms of adults/room. In addition, existence of facilities like availability of clean water
(BN), sanitation, electricity, gas, and telephone indicates higher standard of living. These
facilities are partially dependent on infrastructure development by the government.18
Investment in productive capital is captured through agriculture farming/land holding,
livestock holdings, and entrepreneurial activity etc. If remittance income increases
accumulation of productive capital, it is expected to have a growth promoting impact.
(d) Saving
Households save by buying jewellery, keep cash at home or save in bank
schemes. (i) Jewellery is one form of investment in unproductive capital though it
indicates leakage from the economy but can be used in growth enhancing activities. For
instance, It may be used for investment purposes on the return of migrant labour.
However, for the year under analysis, this is idle money and indicates households’
financial condition. This indicator is measured at the household level in terms of
rupees. (ii) Households cash holdings at home are measured in rupees. (iii)
Households’ bank profit receipts measuring the size of the bank deposits19
are used as
outcome indicators of financial saving that determine financial development—financial
resources available for credit distribution. Remittances via financial development can
also positively affect poverty and growth [Aggarwal, et al. (2006)]. If the deposit level
is higher for RBH, it may also have growth-enhancing effect through the banks’
intermediation process—credit expansion. It can be indirectly inferred that higher bank
deposits have a growth promoting impact.
(e) Poverty
Poverty is measured by head count ratio i.e. the percentage of population below
the poverty line which is officially prescribed poverty line for rural and urban areas.
(f) Growth
The growth impact is deduced indirectly from growth oriented activities such as
increased demand for goods and services, entrepreneurial activity, livestock activities,
land farming etc. Entrepreneurial activities alone are considered as a driver of growth. If
these activities increase, one may expect to have growth promoting effects of remittances.
These channels of remittances’ impact on outcome indicators are comprehensively
presented in log Frame in Appendix I Table 1.
18Multiplier effects of remittances also generate growth-enhancing impact. Through back ward and
forward linkages—investment of one household could generate an increase in income of the other, for example,
investment in housing generates employment for construction workers and income. Existing literature show that
this sector boost at the macro level. 19Aggarwal, et al. (2006) use level of deposits to measure financial development that affect poverty and
growth via credit expansion.

26 Rizwana Siddiqui
3. DATA
This study relies on data from Pakistan Integrated Household Survey (PIHS) for the
year 2001-02 conducted by Federal Bureau of Statistics (FBS) [Pakistan (2002)]. The data
provides detailed information on household size, income, consumption (food, non-food, and
durable commodities), asset endowment (land, buildings, livestock), loans, education status
and expenditure on education, work status by gender, and small scale entrepreneurial
activities. The sample consists of 16182 randomly selected households. The sample is
restricted to households whose income is greater than Rs 1000 per month. Households whose
consumption data is missing have been dropped. Out of this sample of 15924, 802 households
(5 percent of the total) are remittance beneficiary households (RBH) and 15122 are non-
remittance beneficiary households (NRBH). Table 2 in Appendix I presents the set of
variables along with their definition that have been included in the analysis.
The major characteristics of households have been presented in Tables 3–5 in
Appendix I. The geographic distribution of the RBH show that majority of migrated
households are located in two provinces of Pakistan, Punjab and Khyber Pakhtunkhwa,
33.2 and 30.7 percent, respectively (Table 3 in Appendix I). However, RBH are largely
from rural areas –56.1 percent of the total (Table 4). This implies that migrated labour
can largely be categorised as unskilled or low skilled labour. The majority of migrants
consist of unskilled and semiskilled workers, i.e., 52.24 percent, while highly qualified
migrants are only 2.52 percent in 2007 [Siddiqui (2011)].
The average size of the households is 7.2 individuals with average age of head of
the household being 45.7 years having education of 4.2 years (Table 5 in Appendix I).
The income per adult equivalent per year is Rs 28063.7. Food expenditure is high relative
to non-food expenditure consuming 3732 calories per day per adult. Households own
household equipment worth Rs 19851.5. The human capital accumulation indicated by
the education level of currently school going children is 7.2 years with very low average
for the household education level of 2.7 years. Average expenditure on education of
children currently going to school is Rs 3807.9 per year.
The living condition is not good –2.5 adults / room. On average, 76.8 percent of
households have tap water and 35.6 percent have access to sanitation facilities, 69.9
percent have electricity. Average gas and telephone facilities are very low as a whole—
21.3 and 12.1 percent—respectively. Households, on average, own assets including
residential and commercial buildings, and land worth Rs 0.35 million. They own 1.4
acres of land per household. Household save on jewellery purchases and cash worth Rs
16619.6 and Rs 10355.5 respectively and they owe money amounting to Rs 29814.9 and
receive profit on bank deposits of Rs 332. Entrepreneurial activity is low as households,
on average, hold 0.2 enterprises. Two employed persons per household indicate a
dependency ratio of 3.6 per earner. With poverty line for rural and urban areas at Rs 705
and Rs 850 expenditure per adult per month, respectively, the poor households are 39.1
percent and 29.8 percent of the total in rural and urban areas in 2001-02.
4. DISTRIBUTION OF THE TREATMENT AND
COMPARISON SAMPLES
First, a binary logistic function [Equation 2] is tested to calculate the probability
that a household receives remittances. The results are reported in Table 1. The results
show that a majority of variables are significant at the 5 percent level.

Impact Evaluation of Remittances 27
Table 1
Results from Estimated Logistic Function
Coefficients T-Statistics
Community Characteristics
D_P 0.32 3.1
D_S 0.49 2.3
D_N 0.15 1.5
D_UR 0.10 1.2
LYcomREMH * 0.89 21.8
Households Characteristics
D_EDU1 0.16 1.0
D_EDU2 0.18 1.7
D_EDU3 0.03 0.3
D_EDU4 0.40 1.8
D_EDU5 0.39 1.8
LHSIZ* 0.18 2.3
LAGE* 0.01 0.1
Constant –12.35 –17.0
*–Variables are in log form.
Second, the paired t-test is employed to examine whether the mean of each
element of X vector for the treatment is equal to that of the matched sample. The results
show that prior to matching, the difference between the mean values of explanatory
variables of the two groups was very significant, but the difference becomes insignificant
for all variables after PSM (see Table 2). This indicates that the distribution of the
covariates is approximately the same across the RBH and NRBH.
Table 2
Mean of the Covariates of Remittances Income
Covariates (X-Vector)
T- Test for Equality of Means
Before PSM After PSM
Mean Difference T Mean Difference T
Age 3.1 5.2 1.0 1.3
Education of Head of the Household 0.3 1.6 -0.1 –0.4
Province 0.7 10.6 0.0 0.5
Region –0.1 –4.3 0.0 –0.6
Household Size 0.5 3.2 0.2 0.8
Remittance per Household by District 8439.8 28.0 785.0 1.8
***The range of estimated probability that a household receives remittance income is between 0.0002 –
0.35476. The distribution of propensity scores (PS0 for the treated and control groups before and after PSM
are presented in Figures 1 to 4 in Appendix I. The common support area is defined by dropping observation
from the RBH group whose P-values are larger than that of NRBH and the non treated observation of which
P-values are smaller than that of treated i.e.; unmatched PS. In other words we select a common field for
both players, which is with PS in the range of 0.00035 – 0.35187. I drop the cases that have probability less
than 0.00035 and larger than 0.35187 from both groups. Prior to matching, the mean of estimated PS for
migrant and non-migrant households were, respectively, 0.14867 and 0.045161. In the trimmed sample the
mean of PS for control is 0.06342, the gap between the two reduces. But after the matching there is
negligible difference in the mean values of propensity scores of the two groups—0.14867 for the control and
0.13853 for the RBH.

28 Rizwana Siddiqui
Prior to matching, the comparison of the mean values of the indicators across the
treated (RBH) and control group (NRBH) reveal a crude difference (that includes
difference due to observed characteristics) in living standards. The results show that
household size is larger for RBH i.e., 7.7 compared to 7.2 of the NRBH, the larger family
size indicates the need for migration (Table 5 in Appendix I). On average, the head of the
households is older with higher education level in the RBH. Treated units receiving
remittance income have higher expenditure per adult per year compared to NRBH. Their
expenditure on food is lower than expenditure on non-food item in contrast to the
expenditure pattern of NRBH. The human capital indicators support the positive
relationship of remittance income and human capital formation [see calorie intake,
average class of school going children at present, and expenditure on education per year].
On average, RBH households own equipment that 2.7 times higher in worth than NRBH.
RBH have 3.4 rooms per household compared to 2.4 rooms for NRBH. RBH own houses
with more facilities such as electricity, safe drinking water, and sanitation. The higher
percentage of RBH also has gas and telephone facilities. All these indicators show higher
standard of living of treated units compared to non-treated ones. The RBH hold larger
assets which include residential buildings, non-residential buildings and livestock, have
more cash and jewellery and are less indebted. The profit on bank deposits of RBH is
about three times higher than that of NRBH. On average, they hold fewer acres of land
holdings. The results support the view that remittances have positive impact on housing
and consumer durables and non-land assets [Quisumbing and McNiven (2007)]. Low
entrepreneurial activities among RBH do not support the growth impact of remittances. It
may affect growth through credit expansion. However, the poverty impact of remittances
is very strong with only 5 percent of RBH being below the poverty line compared to 23.9
percent of NRBH. This is a naïve valuation approach that overstates the remittances
impact as the difference in mean value which includes the impact of the difference in
observables characteristics.
5. RESULTS
Table 3 reports the difference in the mean value of socio-economic indicators of
the treated and control groups of households under three definitions. First, the differences
in the mean values of socio-economic indicators of the treated and control groups are
calculated using all observations. Second, these differences are calculated based on a set
of observations from common support area. Third, households that minimise the
difference between PS of the two groups—treated (RBH) and control (NRBH)—are
matched. The differences are tested statistically using t-ratios. These results are compared
by taking the difference in difference of mean of first and third exercise to find the bias in
the estimated values if the endogeneity problem and difference in observable
characteristics are ignored.
In Table 3, Column 1 and 2, respectively, the mean differences in socio-economic
indicators are reported which are based on the whole sample of the treated or remittances
receiving households (802) and the control group consists of all households who do not
receive remittances (15924) and their t-values. Column 3 and 4 present the results for the
trimmed sample (common support area) with the sample of 802 and 15122, respectively,
for beneficiary and non-beneficiary households. Finally, the 5th and 6th columns present
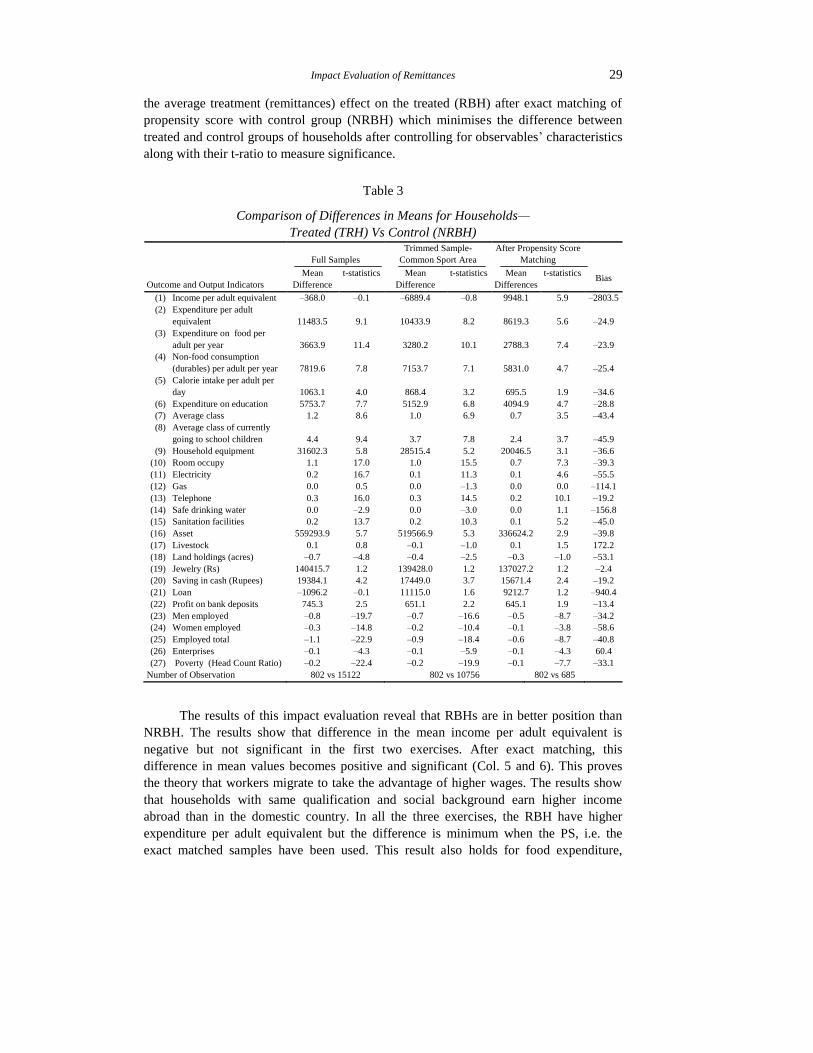
Impact Evaluation of Remittances 29
the average treatment (remittances) effect on the treated (RBH) after exact matching of
propensity score with control group (NRBH) which minimises the difference between
treated and control groups of households after controlling for observables’ characteristics
along with their t-ratio to measure significance.
Table 3
Comparison of Differences in Means for Households—
Treated (TRH) Vs Control (NRBH)
Outcome and Output Indicators
Full Samples
Trimmed Sample-
Common Sport Area
After Propensity Score
Matching
Bias Mean
Difference
t-statistics
Mean
Difference
t-statistics
Mean
Differences
t-statistics
(1) Income per adult equivalent –368.0 –0.1 –6889.4 –0.8 9948.1 5.9 –2803.5
(2) Expenditure per adult
equivalent 11483.5 9.1 10433.9 8.2 8619.3 5.6 –24.9
(3) Expenditure on food per
adult per year 3663.9 11.4 3280.2 10.1 2788.3 7.4 –23.9
(4) Non-food consumption
(durables) per adult per year 7819.6 7.8 7153.7 7.1 5831.0 4.7 –25.4
(5) Calorie intake per adult per
day 1063.1 4.0 868.4 3.2 695.5 1.9 –34.6
(6) Expenditure on education 5753.7 7.7 5152.9 6.8 4094.9 4.7 –28.8
(7) Average class 1.2 8.6 1.0 6.9 0.7 3.5 –43.4
(8) Average class of currently
going to school children 4.4 9.4 3.7 7.8 2.4 3.7 –45.9
(9) Household equipment 31602.3 5.8 28515.4 5.2 20046.5 3.1 –36.6
(10) Room occupy 1.1 17.0 1.0 15.5 0.7 7.3 –39.3
(11) Electricity 0.2 16.7 0.1 11.3 0.1 4.6 –55.5
(12) Gas 0.0 0.5 0.0 –1.3 0.0 0.0 –114.1
(13) Telephone 0.3 16.0 0.3 14.5 0.2 10.1 –19.2
(14) Safe drinking water 0.0 –2.9 0.0 –3.0 0.0 1.1 –156.8
(15) Sanitation facilities 0.2 13.7 0.2 10.3 0.1 5.2 –45.0
(16) Asset 559293.9 5.7 519566.9 5.3 336624.2 2.9 –39.8
(17) Livestock 0.1 0.8 –0.1 –1.0 0.1 1.5 172.2
(18) Land holdings (acres) –0.7 –4.8 –0.4 –2.5 –0.3 –1.0 –53.1
(19) Jewelry (Rs) 140415.7 1.2 139428.0 1.2 137027.2 1.2 –2.4
(20) Saving in cash (Rupees) 19384.1 4.2 17449.0 3.7 15671.4 2.4 –19.2
(21) Loan –1096.2 –0.1 11115.0 1.6 9212.7 1.2 –940.4
(22) Profit on bank deposits 745.3 2.5 651.1 2.2 645.1 1.9 –13.4
(23) Men employed –0.8 –19.7 –0.7 –16.6 –0.5 –8.7 –34.2
(24) Women employed –0.3 –14.8 –0.2 –10.4 –0.1 –3.8 –58.6
(25) Employed total –1.1 –22.9 –0.9 –18.4 –0.6 –8.7 –40.8
(26) Enterprises –0.1 –4.3 –0.1 –5.9 –0.1 –4.3 60.4
(27) Poverty (Head Count Ratio) –0.2 –22.4 –0.2 –19.9 –0.1 –7.7 –33.1
Number of Observation 802 vs 15122 802 vs 10756 802 vs 685
The results of this impact evaluation reveal that RBHs are in better position than
NRBH. The results show that difference in the mean income per adult equivalent is
negative but not significant in the first two exercises. After exact matching, this
difference in mean values becomes positive and significant (Col. 5 and 6). This proves
the theory that workers migrate to take the advantage of higher wages. The results show
that households with same qualification and social background earn higher income
abroad than in the domestic country. In all the three exercises, the RBH have higher
expenditure per adult equivalent but the difference is minimum when the PS, i.e. the
exact matched samples have been used. This result also holds for food expenditure,

30 Rizwana Siddiqui
calorie intake and non-food expenditure. After exact matching of RBH and NRBH, the
difference in expenditure per adult equivalent reduces to Rs 8619.3–24 percent.
With reference to human capital indicators, RBH appear to be better educated. The
difference in education level of children currently going to school reduces from 4.4
classes to 2.4 classes. This is also reflected in average expenditure per class. Like
previous studies, the results support the hypotheses that remittances have positive impact
on human capital accumulation. However, results also show that if differences in the
observable characteristics are not controlled, the impact would be 43 percent and 45.9 per
cent larger over the actual impact on human capital accumulation. The results may
misguide policy makers if issues of endogeneity and counterfactual are ignored.
Other differences are associated with ownership of durable goods and other
amenities of life. On average, RBH households own more equipment than the NRBH. A
higher proportion of the RBH has access to electricity, telephone facilities and room per
adult equivalent than the NRBH. However, gas and tap water facilities are not
significantly different in both groups may be because of lack of public infrastructure.
In case of different types of physical capital accumulation, the results suggest that
remittances do not have a statistically significant impact on the accumulation of
livestock, land holdings, jewellery, and loans (Table 3) but have higher assets of
residential buildings, cash holdings (significant at 5 percent) and profit receipts from
banks (significant at 10 percent level).20
These results make the role of remittances in
generating economic growth doubtful. Some of these results confirm the earlier findings
of Amjad (1988); Gilani (1981) and Arif (1999) that migrant households invest in
housing but reject that they are used for land, jewellery, and repayment of loans.
However, the results are not comparable as earlier studies did not take into account
counterfactual.
The level of female and male economic activity in RBH is significantly lower than
in the NRBH. This suggests that both men and women in the households are less likely to
work if they receive remittances. This may also imply that the control group of
households are relatively poor and women are forced to work to meet their basic needs.
Men’s lower economic activity in RBH is self-evident since it is they who are working
abroad. The lower participation of both men and women also indicates the loss of
production due to migration. Non-agriculture establishments (enterprises) are largely
owned by non-migrant households or NRBH. The difference between the two groups is
significant. This indicates that remittances are not invested in productive enterprises and
the hypotheses that remittances influence growth is not correct. The results of earlier
studies by Gilani, et al. (1981), Tinsabad (1988) for Thailand, and Rodrigo and Jayatissa
(1988) for Sri Lanka show that remittances are used for non-agriculture investment by 8.2
percent, 29.5 percent, and 3.6 percent, respectively. Therefore, government should
promote local businesses so that households predominantly engaged in consumption or
unproductive investment have the option to engage in productive activities.
These results show that the living standard of remittance receiving households is
higher than that of the non-treated group. But, if we ignore the difference in observable
20The reason can be that majority of RBH belong to rural area, and they may be receiving remittances
through informal channels. Even if the migrant send through formal channels (Banks), household may not
report.

Impact Evaluation of Remittances 31
characteristics, we overstate the impact extensively. This leads us to conclude that
remittances raise the standard of living. The results associated with basic needs such as
calorie intake, housing, sanitation facilities etc. also have a role in poverty reduction.
Poverty, measured by head count ratio, shows that among the RBH would be, on average,
0.1 points lower than among the NRBH i.e., a difference of 0.1 point (p.d) between the
two groups. This finding is supports the earlier finding by Siddiqui and Kemal (2006),
which shows that remittances reduce poverty by 0.1 percent over the base year with one
percent increase in remittances. The difference in poverty is of 0.2 points when we
compare poverty of two groups—all treated and all non-treated. This method overstates
the impact of remittance on poverty. PSM overcomes the bias problem cutting the
impact down to 0.1 p.d—a reduction of 33 percent. The bias in other estimates can be
observed from the last column of Table 3 which shows that the estimates are biased
upward. If one ignores the issues of selection and differences in observable
characteristics, remittances would look like having a greater than actual impact (see
Table 3) which is likely to result in wrong policies. The last column of Table 3 shows that
the existing literature measuring the impact of remittances belongs to the first group. This
study for Pakistan is the first which evaluates the impact of remittances overcoming the
problem of endogeniety and counterfactuals and provides an experimental benchmark.
Therefore, the results of earlier studies need careful consideration if used for policy
formulation.
6. HETEROGENEITY IN IMPACT OF REMITTANCES
BY EDUCATION LEVEL
It is important to examine heterogeneity in treatment effect on socioeconomic
aspects of households grouped by education level using a methodology that renders an
experimental benchmark. Here households are defined in two strata on the basis of
education of the head of the household—low skill (less than 10 years) and high skill
(10 years and above). In each group, households are further classified into three sub
groups. In the lower strata of education (below matriculation) three skill levels are
classified as: L-LS (less than one year of education), L-MS (1-4 years of education)
and L-HS (5-9 years of education). In the upper strata of education [matriculation and
above] three groups are classified as: H-LS (10-13), H-MS (14-15), H-HS (16 years
and above).21
The overall results show that the relatively poorer group of households (first four
groups) register larger gain from foreign remittances in terms of income and expenditure
per adult equivalent which increases with the education level except for L-MS. In this
group (L-MS) the difference in the income is significant at 10 percent level. Poverty
reduces the most among household groups in lower strata where education of the head of
the household is below matriculation. In the upper strata, income expenditure and poverty
impact are observed in households classified as low skill (10-13 years of education). The
other two groups do not register any significant impact of remittances. These groups
belong to the richest group of households.
21Where in the lower strata, L-LS =Low-Low skill,, L-MS=Low medium skill, L-HS= Low-high skill,
In the upper strata H-LS=High- low-skill, H-MS=High-medium-skill, and H-HS=High-high-skill.

32 Rizwana Siddiqui
Table 4
Impact Evaluation of Remittances by Education Level
Outcome Indicators
Education less
than 1 year
Education below
Primary (1-4 years)
Education Primary
but below Matric (5-9 years)
Difference in
Means
T-Statistics Difference in
Means
T-Statistics Difference in
Means
T-Statistics
Number of Observation 403 44.0 156.0
Income per Adult
Equivalent 6374.36 7.99 4725.54 1.73 8011.45 2.48
Expenditure per Adult
Equivalent 5396.05 7.94 637.83 0.23 9212.72 4.95
Poverty (Head Count
Ratio) –0.2 –5.84 –0.1 –1.12 –0.2 –4.39
Education Matric to below
BA (10-13 years)_
Education BA to below
MA (14 to 15 years)
Education MA and above
including Professionals
(16 years and above)
Number of Observation 146.0 27.0 28.0
Income per Adult
Equivalent 21040.96 3.51 13569.31 1.01 22259.93 0.98
Expenditure per Adult
Equivalent 18456.22 3.57 11935.50 0.77 13012.64 0.56
Poverty (Head Count
Ratio) –0.1 –2.93 0.00 –0.05 0.00 0.00
The poverty effect of remittance is estimated to be 0.1-point difference (p.d)
for the whole group in the aggregate analysis. The poverty reduction effect is
estimated to be –0.2 p.d for L-LS and L-HS, and larger than average effect for the
whole group (–0.1 p.d.). The poverty impact decreases (in absolute term) from –0.2
p.d. to –0.1 p.d. for below matriculation to above matriculation group. This finding is
consistent with the findings of Siddiqui and Kemal (2006), which show that poverty
impact is larger among relatively poor households and has a smaller impact on
relatively rich households. There is no poverty impact for the richest group of
households. This does not imply that migration is an irrational decision for these
groups of households. Some earlier studies show that the positive effect of migration
is not realised until five or six years after the original migration Ham, et al. (2005).
The initial returns are not significant. Siddiqui (2011) shows that migration of skilled
labour has increased in recent years. So the benefits have not been significantly
realised yet, or the sample of these households is very small.
The detailed results for these households are presented in Table 6 in Appendix I.
The results show that the impact of remittances is still positive in terms of income,
expenditure and all types of capital accumulation for the households with less than one
year of education. In the upper strata, households with education of matriculation and
above, i.e., with 10-13 years of education benefit. The other two groups show significant
positive impact only on [profit from bank at 10 percent level of significance] and
[expenditure on education, room occupancy], respectively [see Table 6 in Appendix I].
From this it can be concluded that two households in the upper strata belong to richer
group of households and do not register the impact in the basic needs’ variable. But the
impact is significant in bank accounts. However, insufficient data for these groups may
be the major reason for the insignificant results. The overall results show that aggregate
analysis hides the variation in impact by education level.

Impact Evaluation of Remittances 33
7. COMPARISON WITH EARLIER STUDIES
The main difference between the results of this study and the earlier studies is that
the change in outcome indicators in this study is unlikely to be correlated with the
migration decision, while in the earlier studies it is correlated. The characteristics that
influence the migration decision are likely to influence the decision of other households.
The majority of earlier works do not take into account the issues of selection and
differences in observable characteristics. Therefore they are likely to overestimate the
impact.
Empirical estimates from earlier studies are compiled in Table 7 in Appendix I.
The table reports major results along with data and methodology used in the analysis. It
shows that disparities in estimation techniques and data affect the conclusion. It also
shows that more than 90 percent labour migrated from Pakistan, India, Sri Lanka, and
Bangladesh to Middle East in the 1980s.
Income and Consumption: Many studies conducted in the 1980s, especially in
South Asian countries, have focused on the use of remittances based on existing
migration data collected at the household level. Amjad (1988), Kazi (1988) and Gilani, et
al. (1981), for Pakistan have found that migrant households allocate about 63 percent of
resources to total consumption expenditure and 56.8 percent when remittances through
unofficial channels are also included. While the results of the present study show that
RBH spend 44 percent on food measured in per adult equivalent term, which is lower
than the food expenditure of NRBH at 53 percent. Similarly, Gilani, et al. (1981) show
that RBH allocate 62 percent of their remittances to recurrent consumption (57 percent),
durable goods (2.8 percent) and other expenditure (2.3). The results of these studies do
not compare the expenditure pattern with counterfactual or control group expenditure.
Hence their findings cannot be used to conclude that remittances contribute to higher
consumption or lower consumption. Malik and Sarwar (1993) overcome this problem and
estimate demand functions for three types of consumption expenditure—total
consumption expenditure, recurrent consumption and expenditure on durable goods for
RBH and NRBH for various regions of Pakistan. The study concludes that the
expenditure pattern is different for migrant and non-migrant households. But the study
ignores the differences in observable characteristics and estimate the function by using
the whole sample. The result of the present study shows that estimates are biased if the
difference is measured using all migrant and non-migrant households. The difference in
consumption of RBH and NRBH decreases by 25 percent in total consumption and in
expenditure on durables, while the expenditure on food decreases by 24 percent.
Therefore it is necessary to use a methodology which at least minimises if not eliminates
the bias.
Empirical evidence shows that more than 50 percent of the migrated labour to
Middle East were unskilled labour. Mahmood (1988), Hyun (1988), and Tan and Canlas
(1988) show that migrated labour from Bangladesh, Korea and Philippines are earning
three to six times higher than wages in their country of origin. If we control for the
selection bias and the observable characteristics, the difference in income22
becomes
significant and positive (see Table 3).
22This difference is in total earned income.

34 Rizwana Siddiqui
Welfare, Poverty and Inequality: Higher income and consumption are expected to
reduce poverty and inequality. Siddiqui and Kemal (2006) show that remittances reduce
poverty and improve welfare by 0.01 percent and 0.06 percent, respectively. Rodrigo and
Jayatissa (1988) show that inequality increases with remittance inflow. The study by
Jongwanich (2007) using cross country data shows that remittances through direct and
indirect channels reduce poverty by 0.03 percent. The results of the present study—
reduction in poverty by 0.01 percent—match with the results of Siddiqui and Kemal
(2006) who show that the poverty impact varies by type of household, rich and poor.
These results are confirmed by the results of this study as the impact varies by type of
households i.e., the poor register larger impact. However, the results are not exactly
comparable as the base year is different. This study shows that bias reduces poverty
estimates by 33 percent, when we correct for the selection bias and observable
characteristics.
Investment: The studies show that investment in real estate, land, and housing are
higher for RBH and ranges between 20.7 and 35.4 percent for Pakistan. Another study for
Thailand shows that 33 percent migrant households own houses compared to 20 percent
non migrant households. Overall, 75 percent migrant households own assets compared to
39 percent non migrant households. The studies also measure the impact of remittances
or their allocation to different types of assets, physical, financial, and human (see Table
7) but the fact remains that they over-estimate the impact due to uncontrolled difference
in observable characteristics or counterfactuals. This type of analysis does not measure
the sole benefits of migration or remittances, but also include the effects of uncontrolled
differences in socio economic characteristics of households.
Growth: Burney (1987) using demand composition and Iqbal and Sattar (2005)
using the Chami, Fullenkamp, Jahjah model show positive relationship between growth
and remittances. Burney (1987) shows that the contribution of official remittances from
Middle East to GNP growth was 13.6 percent during 1973-4 to 1976-7. This contribution
increased to 24 percent when remittances through unofficial channels were also taken
into account. Iqbal and Sattar (2005) show that increase in remittances by one percentage
point increase growth by 0.44 percentage point. Jongwanich (2007) estimates the
neoclassical model of Barro using cross country data. The study could not find any direct
and significant impact on growth, but indirect effect of remittances on growth works
through human capital investment (0.02 percent) and physical capital (0.01 percent). The
growth impact remains inconclusive in the present study. The results show that
remittances affect human capital accumulation positively, which have a growth
promoting impact [Jongwanich (2007)]. In addition higher bank deposits also point to
growth promoting effects through the banks’ intermediary role i.e. credit expansion. But
low entrepreneurial activity and less land holding shows the opposite.
This writer constructed a table of expected outcome indicator of remittances
impact giving value of ‘1’ if a study includes the indicator and zero if it ignores,
measuring data quality with 1=secondary, 2=primary, 3=data on both treated and control
groups. Similarly the methodology is ranked as 1 if data uses only descriptive statistics,
and 2 if both descriptive and statistical estimation analysis are used, while 3 means
rigorous. An index based on the information has been developed. An ideal situation
(hypothetical) is when comprehensive data with treated and control groups is used, for

Impact Evaluation of Remittances 35
rigorous impact evaluation to measure the impact on all expected outcome indicators. A
comparison of the ideal study with the previous empirical studies shows deviation from
the optimal analysis (see Figure 1). The figure shows that majority of studies divert from
optimum evaluation level. There is a need to motivate researchers to conduct impact
evaluation using method which reduces biases if not eliminate them in the impact and
renders an experimental benchmark.
8. CONCLUSION
Given the multi dimension impact of remittances, its integration into overall
development planning is essential. For that purpose, it is required to conduct a
comprehensive analysis using the most appropriate techniques to draw lessons for
suitable policies. Rosenbaum and Rubin (1983) indicate that robust estimates can be
obtained by overcoming the problem of selection bias and difference in observable
characteristics using PSM and difference method which replicates experimental bench
mark in self-select cases.
This paper contributes to the literature of remittance in Pakistan by analysing the
impact of remittances using the propensity score matching and difference method. The
major finding of the study is that robust estimates that take into account both selection
and endogeniety problems in estimating the average impact of remittances are
substantially different from the estimates which disregard these issues and so overstate
the actual impact. A comparison of impact corrected for selection with those where it is
not shows a very large and significant bias. In policy-making it is the unbiased results
that are needed.
Figure 1: A comparison of Empirical studies
0.00
0.20
0.40
0.60
0.80
1.00
1.20
1. A
dam
s (
2008)
2. A
mja
d (
1986)
3. A
mja
d (
1988)
4. A
rif (1
999)
5. B
urn
ey(1
988)
6. Iq
bal and
7. G
ilani et al
8. K
azi(1988)
9. M
alik
and
10. M
aqsood
11. S
iddiq
ui and
12. O
h-S
eok,
13. Jongw
anic
h(
14. M
ahm
ud
15. N
ayar
16. R
odrigo a
nd
17. T
an a
nd
18. T
ingsabad
19. A
ggarw
al et
20. R
igoro
us
Figure 1: A Comparison of Empirical Studies

36 Rizwana Siddiqui
The paper quantifies the benefits of migration (remittance), in terms of income,
expenditure, savings, human capital and physical capital accumulation, poverty, and
growth. After balancing for the differences in observable characteristics, migration is
found to be beneficial. The number of migrant households with income levels below
poverty line reduces by 0.1 points over non-migrants in the aggregate. Their higher
human and physical capital ownership, savings in cash and profit from bank point to the
growth promoting impact of remittances, whereas lower entrepreneurial activity and low
men and women participation in economic activities in the RBH group illustrate the
opposite. The growth impact of remittances therefore remains inconclusive.
Aggregate analysis hides heterogeneity in impact by education level and
underestimates/over-estimate the effect for poor/rich households. The results show
remittances have significant impact on poor households (with less than one year of
education) but have no impact on highly educated households. Therefore, matching is a
useful way to control for observable heterogeneity too.
The pattern of use of remittances determines the impact on poverty and growth.
Therefore, if the objective is to achieve higher growth, the remittances can be redirected
from current consumption towards productive investment by offering higher interest rate
on deposits or subsidies for productive investment. However, further analysis requires
more demographic and economic information on migrants and return migrants, their stay
abroad, how they send money back home, over what period of time and from where. That
analysis would be helpful to devise migration policies for poverty reduction and growth
enhancing strategies.
APPENDIX I
Table 1
Impact in the Log Frame: Remittances Inflow from Abroad
Level Indicators
Activities Migration
Input Remittances
Outputs 1. Accumulation of Capital Stock: Human, Physical and Financial.
Intermediate
Outcomes
1. Better nutrition
2. Higher enrolment
3. Higher physical capital stock
4. Higher Bank Deposits
Final Outcomes Improved Social and Economic Indicators: literacy rate and health
status and growth
Short Run Impact 1. Reduce poverty
2. Improve welfare of households
Long Run Impact Higher Productivity and Earnings

Impact Evaluation of Remittances 37
Table 2
Detail of Variables Used in the Analysis
Variable Name Definition
1. Remittances Households’ remittance income from abroad in (Rs).
2. Income per Adult Household income from all sources–domestic and foreign,
divided by number of adult equivalent (Rs).
3. Total Expenditure per Adult Total households expenditure divided by number of adult
equivalent (Rs).
4. Expenditure on Food per Adult Food expenditure per adult equivalent in Rs.
5. Calorie Intake Calculated by multiplying quantity of good consumed with
calorie per unit.
6. Expenditure on Non-food
Items per Adult
Non Food Expenditure in Rs per year per adult equivalent
7. Expenditure on Durables such
as Clothing and Footwear
Expenditure on durables per adult equivalent per year
8. Expenditure of Education per
Class
Households Expenditure on Education divided by level
(classes) of school going individuals
9. Average Class of School Going
Children
Total number years of schooling of currently going to
school children divided by number of school going
children
10. Household Size Number of households members
11. Females Economic Activity Female Employment
12. Education of the Head of the
Household
Highest level of Education of head of the household
13. Capital Stock Accumulation
13a. Human Capital Measured by education of currently going to school (years
of schooling), average level of education of households
and expenditure on Education per class.
13b. Physical Capital Asset: Buildings (completed or under construction),– land,
residential buildings, commercial buildings
13c. Equipment Durable goods: Tangible asset accumulation such as
refrigerator, TV, automobile and other durables.
13d. Financial Capital Profit on Bank Deposits measure size of deposits
13e. Savings Jewellery and Cash
14. Poverty Head Count Ratio, Percentage of population below poverty
line
14.a Poverty Line Rural and urban poverty line are calculated based on the
assumption that the gap between rural and urban poverty
line is same as in 1990 Official national poverty line is
used to calculate poverty line for rural and urban areas.
Poverty lines are Rs 748, Rs 850 and Rs 705 for Pakistan,
Urban and Rural areas, respectively
15. Household Condition
(measured by amenities)
15a. Electricity Electricity direct connection
15b. Gas Gas direct connection
15c. Tap Water Piped, Hand Pump, Tube well direct
15d. Sanitation Facilities Flush connected to public sewerage, Flush connected to pit
15e. Telephone Telephone direct connection
15f. Occupancy Room per adult

38 Rizwana Siddiqui
Table 3
Geographic Distribution (%)
Control(NRBH) Treated(RBH) Total
Punjab 39.8 33.2 39.4
Sindh 24.2 4.0 23.2
KP 15.9 30.7 16.6
ROP 20.1 32.2 20.8
Total 100 100 100
Source: Author’s Calculations.
Table 4
Distribution of RBH and NRBH by Region
Urban Control Treated Total
Punjab 39.5 57.9 40.3
Sindh 40.8 41.0 41.3
KP 31.3 32.9 31.4
ROP 28.0 32.9 28.4
Total Urban 36.2 43.9 36.6
Rural
Punjab 60.5 42.1 59.7
Sindh 59.2 0.0 58.7
KPK 68.7 67.1 68.6
ROP 72.0 67.1 71.6
Total Rural 63.8 56.1 63.4
Pakistan 100.0 100.0 100.0
Source: Author’s Calculations.
Table 5
Mean Values of Output and Outcome Variables
Variables Full Sample Treated Control
No. of Observation 15924.0 802.0 15122.0
H-size 7.2 7.7 7.2
Age 45.7 48.6 45.5
Education of Head of the Household 4.2 4.5 4.2
Remittances per adult per year 778.1 15450.0 0.0
Households in a district 155.4 175.0 154.4
Income per Adult 28063.7 27714.3 28082.2
Expenditure per Adult 16053.0 26958.1 15474.6
Food intake per adult per year 8865.5 12344.9 8681.0
Non-food consumption (durables) per adult per year 7187.4 14613.2 6793.6
Calorie intake per adult per day 3732.2 4741.7 3678.7
Average class of currently going to School 7.2 11.4 7.0
Expenditure on education per year 3807.9 9271.8 3518.1
Average class of households 2.7 3.9 2.7
Continued—

Impact Evaluation of Remittances 39
Table 5—(Continued)
Household Equipment 19851.5 49862.1 18259.9
Room per households 2.4 3.4 2.4
Electricity 69.9 88.7 68.9
Gas 21.3 22.0 21.3
Telephone 12.1 38.5 10.7
Tap water 76.8 72.3 77.1
Toilet 35.6 58.9 34.4
Asset 351314.6 882440.2 323146.2
Livestock 0.2 0.2 0.2
Land Ownership 1.4 0.8 1.5
Jewelry 16619.6 149963.3 9547.6
Cash 10355.5 28763.3 9379.3
Loan 29814.9 28774.0 29870.2
Bank Deposit profit 332.0 1039.8 294.5
Employment 1.9 0.9 1.9
Enterprises 0.2 0.2 0.2
Poverty based on expenditure per adult equivalent 23.0 4.99 23.9
Source: Author’s Calculations.

Table 6
Impact Evaluation of Remittances by Education Level
Education level
Outcome/Output Indicators
Less than one Year 1–4 year 5–9 years 10–13 14–15 16 and above
Difference
in mean
T-Statistics Difference
in mean
T-Statistics Difference
in mean
T-Statistics Difference
in mean
T-Statistics Difference
in mean
T-Statistics Difference
in mean
T-Statistics
1. Income per adult equivalent 6374.36 7.99 4725.54 1.73 8011.45 2.48 21040.96 3.51 13569.31 1.01 22259.93 0.98
2. Expenditure per adult
equivalent 5396.05 7.94 637.83 0.23 9212.72 4.95 18456.22 3.57 11935.50 0.77 13012.64 0.56
3. Expenditure on Food per
Adult per Year 1685.03 5.64 664.59 0.60 2476.38 3.52 5719.69 4.77 5642.87 1.51 6204.74 1.63
4. Calorie intake per adult per
year 770.47 1.96 –140.26 –0.08 87.90 0.10 948.61 0.96 665.87 0.23 2930.88 0.83
5. Non food consumption
(durables)per adult per year 3711.02 7.54 –26.77 –0.01 6736.34 4.85 12736.53 3.00 6292.63 0.51 6807.90 0.34
6. Expenditure on education 3311.67 6.09 3333.83 1.98 5507.90 2.89 2179.34 1.49 12313.57 0.72 13585.78 1.98
7. Average class of Households 1.02 4.55 0.37 0.65 0.59 1.44 0.25 0.45 0.54 0.42 –0.29 –0.24
8. Average class of currently
going to School children 4.34 6.10 1.86 0.83 2.92 1.75 –1.42 –0.84 –1.49 –0.32 –1.62 –0.37
9. Household Equipment 13742.28 5.97 7194.39 1.25 51042.25 2.11 28240.48 2.01 54.49 0.00 –54404.74 –0.77
10 Room Occupy 0.86 7.61 0.52 1.54 0.73 3.68 0.11 0.44 0.34 0.75 0.70 1.69
11 Electricity 0.16 4.94 –0.12 –1.68 0.08 2.55 0.01 0.40 –0.04 –1.00 0.05 1.00
12 Gas –0.01 –0.58 0.02 0.20 0.04 0.73 0.02 0.36 0.00 0.00 –0.06 –0.46
13 Telephone 0.21 8.61 0.09 0.95 0.35 7.16 0.25 4.41 0.02 0.17 0.14 1.11
14. Safe Drinking Water 0.05 1.39 0.00 0.00 0.10 1.98 –0.08 –1.78 0.05 0.50 –0.04 –0.40
15. Sanitation facilities 0.18 5.43 –0.02 –0.20 0.15 2.68 0.08 1.62 0.01 0.08 0.15 1.60
16. Asset 246351.34 5.79 237325.76 0.97 646653.19 1.45 268842.66 0.84 979637.04 1.11 11444.81 0.02
17. Livestock 0.21 1.50 –0.36 –0.80 0.43 1.97 0.01 0.05 0.02 0.08 –0.57 –2.12
18. Land holdings (acres) 0.00 0.03 –4.85 –0.80 0.02 0.06 –0.36 –0.77 –0.68 –0.89 –0.36 –0.47
19. Jewelry (RS) 251106.20 1.06 5470.45 0.46 21636.55 4.39 26957.60 1.92 7958.52 0.83 27948.05 1.45
20. Saving in Cash (Rupees) 13687.21 3.84 37196.97 1.30 24624.74 1.65 33712.75 2.55 –118451.85 –0.97 6919.16 0.15
21. Loan 23780.64 1.77 43602.41 1.54 –14039.49 –0.76 –8412.13 –1.26 –16068.15 –1.38 –15250.00 –0.82
22. Profit on bank deposits –76.19 –0.79 795.45 1.16 530.70 1.32 1822.15 1.42 1814.81 1.68 4175.32 0.68
23. Men employed –0.51 –6.06 –0.28 –0.88 –0.43 –3.20 –0.65 –5.06 –0.30 –1.29 –0.69 –2.58
24. Women employed –0.14 –2.96 0.00 0.00 –0.10 –1.77 –0.15 –2.00 –0.17 –1.64 0.10 0.79
25. Employed total –0.65 –6.21 –0.28 –0.68 –0.53 –3.49 –0.80 –4.90 –0.47 –1.87 –0.58 –1.95
26. Enterprises –0.08 –2.37 –0.20 –1.75 –0.10 –1.59 –0.19 –3.12 –0.01 –0.08 –0.04 –0.36
27. Poverty (Head Count Ratio) –0.15 –5.84 –0.09 –1.12 –0.16 –4.39 –0.09 –2.93 0.00 –0.05 0.00 0.00
Source: Author’s Calculations.

Table 7
Empirical Estimates from Existing Literature Focus on Data Results
Growth (5,6,21) TS
official(unofficial)= 1.49
(2.89)to 6.59(11.01)
in1970 and 1980s
0.44 to one
percentage point of
remittances
Human capital= 0.02
Physical Investment
=0.01
Earning Estimate of non Migrant
Per Capita Remittances(1) 469 HH survey 223.6
Earnings(remittances)r(8) ARTEP 4908Rs/Month
Remittances(2,4) ARTEP/ILO 2589 Rs /m 27083 (20416) 5909.00
Wage ratio after migration
/Domestic(13,15,19) 2.65, Bangladesh=5.77 Philippines= 6.35
Variation in Remittances income =ratio of
poorest/richest 20 %,(1) 469 HH survey 1–13.8%
Consumption out of remit/ Share of
consumption (2,7,9,8,18,20, 99) Total 63.3% – 56.8% 62.19 0.57m 0.52nm 52.1
6.99/(0.55)
57%(99)
recurrent 53.50% 57.00 0.53m 0.48nm
marriages 9.80% 2.35 2.9
Consumer Durables included in recurrent 2.84 0.026m 0.03 nm 5.9 11.04
Real Estate Total 35.40% 21.68
Construction /Purchase of
Residential House 12.14
Improvement in House &
Construction 2.27 14.2 33.13/20.73
Commercial Real Estate 5.72
AgricultureLand 1.55 15.6 6.12/225.24
Investment/Saving, after/Before(2) Total 24.2% saving 12.95 35.1 M/NM=75/39 Asset Ownership
Agricultural Investment 3.3
Industrial/commercial Investment 8.21 29.5
Year= 1981 5.41(6.65)=transport
equipment, total invest=3.61
Financial
Investment/Saving=foreign currency
account 14.2 13.42/2.20
Residual 8.5 318 0.003
loan=4.3%,
Jewellery =5.1 loan=23.54, Jewellery=0.26
Loan=2.6%(99),
Jewellary=26.8(99)
Other saving = 5.1%
Human Capital 0
Education = 2.4,
Health=5.9
Poverty(12, 22) 0.01, 0.03 2275752.63
Welfare(12) -0.06 0
average cost of migrant(15,20) 1534 in $ 1983 38979 to 43518 baht
Sources: 1. Adams (1998), 2. Amjad (1986), 3. Amjad (1988), 4. Arif (1999), 5. Burney (1988) 6. Iqbal and Sattar (2005), 7. Gilani, et al. (1981), 8. Kazi (1988), 9. Malik and Sarwar (1993), 10. Maqsood and Sirajeldin (1994), 11. Nishat
and Bilgrami (1993), 12. Siddiqui and Kemal (2006), 13. Hyun (1988), 14. Jongwanich (2007), 15. Mahmud (1988), 16. Nayar (1988) 17. Quisumbing and McNiven (2007), 18. Rodrigo and Jayatissa (1988), 19. Tan and Canlas
(1988), 20. Tingsabad (1988), 21. Aggarwal, et al. (2006), Jongwanich (2007).
Note: Number in parentheses in the first and second column indicates reference study described below.

40 Rizwana Siddiqui
Table 6

Impact Evaluation of Remittances 41
Table 7

42 Rizwana Siddiqui
APPENDIX II
Histograms Before and After Propensity Score Matching
Predicted probability
.350.325
.300.275
.250.225
.200.175
.150.125
.100.075
.050.025
0.000
Figure 1: Histogram of RTH before PSM50
40
30
20
10
0
Std. Dev = .09
Mean = .149
N = 802.00
Predicted probability
.350.325
.300.275
.250.225
.200.175
.150.125
.100.075
.050.025
0.000
Figure 3: Histogram of TRH after PSM50
40
30
20
10
0
Std. Dev = .09
Mean = .149
N = 802.00
Predicted probability
.350.325
.300.275
.250.225
.200.175
.150.125
.100.075
.050.025
0.000
Figure 2: Histogram of NRCH before PSM6000
5000
4000
3000
2000
1000
0
Std. Dev = .06
Mean = .045
N = 15122.00
Predicted probability
.350.325
.300.275
.250.225
.200.175
.150.125
.100.075
.050.025
0.000
Figure 4: Histogram of NRCH After PSM50
40
30
20
10
0
Std. Dev = .09
Mean = .139
N = 685.00
Note: Author’s Construction.
REFERENCES
Adams, J. R. H. (1998) Remittances, Investment, and Rural Asset Accumulation in
Pakistan. Economic Development and Cultural Change 47, 155–173.
Adams, J. R. H. (2008) The Demographic, Economic and Financial Determinants of
International Remittances in Developing Countries. Development Economics
Department, Developing Prospects Group. The World Bank, Washington, D. C.
(Policy Research Working Paper 4583).
Aggarwal, R., A. D. Kunt, and M. S. M. Peria (2006) Do Worker Remittances Promote
Financial Development? World Bank, Washington, DC. (World Bank Policy
Research Paper 3957).
Amjad, R. (1986) Impact of Workers’ Remittances from the Middle East on Pakistan’s
Economy: Some Selected Issues. The Pakistan Development Review 25:4, 757–782.
Amjad, R. (1988) To the Gulf and Back: Studies on the Economic Impact of Asian
Labour Migration (eds.). New Delhi: ILO/ARTEP.
Arif, G. M. (1999) Remittances and Investments at the Household Level in Pakistan.
Pakistan Institute of Development Economics, Islamabad. (Research Report No. 166).
Burney, N. A. (1987) Workers’ Remittances from the Middle East and their Effect on
Pakistan’s Economy. The Pakistan Development Review 26:4, 745–763.
Burney, N. A. (1988) A Macro-Economic Analysis of the Impact of Workers’
Remittances from the Middle East on Pakistan’s Economy. In R. Amjad (ed.) To the

Impact Evaluation of Remittances 43
Gulf and Back: Studies on the Economic Impact of Asian Labour Migration. New
Delhi: ILO/ARTEP. 197–222.
Dehejia, R. and S. Wahba (2002) Propensity Score Matching Methods for Non-
Experimental Causal Studies. Review of Economics and Statistics 84:1, 151–161.
Deininger, K. and L. Yanyan (2008) Economic and Social Impacts of Self-Help Group in
India.Paper presented at the American Agricultural Economic Association Annual
Meeting, Orlando, FL, July 2007-29.
Fajnzylber, P. and J. H. Lopez (2007) Close to Home, The Development Impact of
Remittances in Latin America, Conference Edition, The International Bank for
Reconstruction and Development / The World Bank, Washington, D.C.
Farchy, E. (2009) The Impact of EU Accession on Human Capital Formation: Can
Migration Fuel a Brain Gain? The World Bank, Development Economics, Policy
Review Unit. Washington, D.C. (Policy Research Working Paper No. 4845).
Gilani, I., M. K. Faheem, and M. Iqbal (1981) Labour Migration from Pakistan to the
Middle East andIts Impact on the Domestic Economy. Pakistan Institute of
Development Economics, Islamabad. (Research Report Series No.126).
Ham, C., X. L. John, and B. R. Patricia (2005) Propensity Score Matching, a Distance—
Based Measure of Migration and the Wage Growth of Young Men. Federal Reserve
Bank of New York. (Staff Report No. 212).
Heckman, J. J., I. Hidehiko, and T. Petra (1997) Matching as an Econometric Evaluation
Estimator: Evidence from Evaluating a Job Training Programme. Review of Economic
Studies 64, 605–654.
Heckman, J., H. Ichimura, and P. Todd (1998) Matching as an Econometric Evaluation
Estimator. Review of Economic Studies 65, 261–294.
Hyun, O. S. (1988) The Impact of Overseas Migration on National Development: The
Case of the Republic of Korea. In R. Amjad (ed.) To the Gulf and Back: Studies on
the Economic Impact of Asian Labour Migration.New Delhi: ILO/ARTEP. 143–166.
Iqbal, Z. and A. Sattar (2005) The Contribution of Workers’ Remittances to Economic
Growth in Pakistan. Pakistan Institute of Development Economics, Islamabad.
(Research Report No. 187).
Jalan, J. and M. Ravallion (2001) Does Piped Water Reduce Diarrhea for Children in
Rural India? Development Research Group, Poverty. The World Bank, Washington,
D. C. (Policy Research Working Paper 2664).
Jongwanich, J. (2007) Worker’s Remittances, Economic Growth and Poverty in
Developing Asia and the Pacific Countries, United Nations Economic and Social
Commission for Asia and the Pacific (UNESCAP) (Working Paper, WP/07/01).
Kazi, S. (1988) Domestic Impact of Overseas Migration: Pakistan. In R. Amjad (ed.) To
the Gulf and Back: Studies on the Economic Impact of Asian Labour Migration. New
Delhi: ILO/ARTEP.
Knerr, B. (1992) Methods for Assessing the Impact of Temporary Labour Emigration.
The Pakistan Development Review 31:4, 1207–1239.
Mahmud, W. (1988) The Impact of Overseas Labour Migration on the Bangladesh
Economy: A Macro-Economic Perspective. In R. Amjad (ed.) To the Gulf and Back:
Studies on the Economic Impact of Asian Labour Migration. New Delhi:
ILO/ARTEP.

44 Rizwana Siddiqui
Malik, S. J. and N. Sarwar (1993) Some Tests for Difference in Consumption Pattern:
The Impact of Remittances using Household Income and Expenditure Survey data of
Pakistan 1987-88. The Pakistan Development Review 32:4, 699–711.
Maqsood, A. and I. Sirajeldin (1994) International Migration, Earnings, and the
Importance of Self-selection. The Pakistan Development Review 33:3, 211–227.
Mansuri, G. (2007) Does Work Migration Spur Investment in Origin Communities? In
CaglarOzden and Maurice Schiff (eds.) Entrepreneurship, Schooling, and Child
Health in Rural Pakistan in International Migration, Economic Development and
Policy. Washington, DC.: World Bank and Palgrave Macmillan.
McKenzie, D., J. Gibson, and S. Stillman (2006) How Important is Selection?
Experimental vs. Non-experimental Measures of Income Gains from Migration.
Department of Economics. (Working Paper in Economics 3/06).
Nishat, M. and N. Bilgrami (1993) The Determinants of Workers Remittances in
Pakistan. The Pakistan Development Review 32:4, 1235–1245.
Nayyar, D. (1988) International Migration from India: Amacro Economic Analysis. In R.
Amjad (ed.) To the Gulf and Back: Studies on the Economic Impact of Asian Labour
Migration.New Delhi: ILO/ARTEP.
Pakistan, Government of (2002) Pakistan Integrated Household Survey. Islamabad:
Federal Bureau of Statistics.
Pakistan, Government of (2008-09) Pakistan Economic Survey. Islamabad: Planning
Commission, Finance Division.
Quisumbing, R. A. and S. McNiven (2007) Moving Forward, Looking Back: The Impact
of Migration and Remittances on Assets, Consumption and Credit Constraints in the
Rural Philippines. Agriculture Development Economics Division, The Food and
Agriculture Organisation of the United States. (ESA Working Paper No. 07-05).
Rodrigo, C. and R. A. Jayatissa (1988) Maximising Benefits from Labour Migration: Sri
Lanka. In R. Amjad (ed.) To the Gulf and Back: Studies on the Economic Impact of
Asian Labour Migration. New Delhi: ILO/ARTEP.
Ravallion, M. (Forthcoming) Evaluating Three Stylised Interventions, Forthcoming.
Journal of Development Effectiveness.
Rosenbaum, P. R. and D. B. Rubin (1983) The Central Role of the Propensity Score in
Observational Studies for Causal Effects. Biometrika 70:1, 41–55.
Siddiqui, R. (2011) Pakistan: Migration, Remittances, and Development. Chapter 3. In
Saman Kelegama (ed.) Migration, Remittances, and Development in South Asia.
India: SAGE.
Siddiqui, R. and A. R. Kemal (2006) Remittances, Trade Liberalisation and Poverty in Pakistan,
The Role of Excluded Variable. The Pakistan Development Review 45:3, 383–415.
Tan, E. A. and D. B. Canlas (1988) Migrant’s Saving Remittances and Labour Supply
Behaviour: The Philippines Case. In R. Amjad (ed.) To the Gulf and Back: Studies on
the Economic Impact of Asian Labour Migration. New Delhi: ILO/ARTEP. 223–254.
Tingsabadh, C. (1988) Maximising Development Benefits from Labour Migration:
Thailand. In R. Amjad (ed.) To the Gulf and Back: Studies on the Economic Impact of
Asian Labour Migration. New Delhi: ILO/ARTEP. 304–343.
White, H. (2005) Challenges in Evaluating Development Effectiveness. Institute of
Development Studies, Brighton. (IDS Working Paper 242).
White, H. (2006) Impact Evaluation: The Experience of the Independent Evaluation
Group of The World Bank. Washington, DC.: World Bank.