IMPACT EVALUATION FOR THE USAID/ APRENDER A LER …
146
February 25, 2015 This report was prepared for USAID/Mozambique by Magda Raupp, Bruce Newman, Luis Revés, and Carlos Lauchande under Evaluation Services IQC Task Order AID-656-TO-12-00002 awarded to International Business & Technical Consultants, Inc. (IBTCI), with Global Surveys Corporation (GSC Research) as sub-contractor. The authors’ views expressed in this report do not necessarily reflect the views of the United States Agency for International Development or the United States Government. IMPACT EVALUATION FOR THE USAID/ APRENDER A LER PROJECT IN MOZAMBIQUE Year 2 (Midline 2) IE/RCT Final Report
Transcript of IMPACT EVALUATION FOR THE USAID/ APRENDER A LER …
February 25, 2015
This report was prepared for USAID/Mozambique by Magda Raupp, Bruce Newman, Luis Revés, and Carlos Lauchande under Evaluation Services IQC Task Order AID-656-TO-12-00002 awarded to International Business & Technical Consultants, Inc. (IBTCI), with Global Surveys Corporation (GSC Research) as sub-contractor. The authors’ views expressed in this report do not necessarily reflect the views of the United States Agency for International Development or the United States Government.
IMPACT EVALUATION FOR THE
USAID/ APRENDER A LER PROJECT
IN MOZAMBIQUE Year 2 (Midline 2) IE/RCT
Final Report

USAID/Aprender a Ler Impact Evaluation: Midline 2 Report i
IMPACT EVALUATION FOR THE USAID/APRENDER A LER PROJECT IN MOZAMBIQUE Year 2 (Midline 2) IE/RCT Report Final Report
Evaluation Services IQC Task Order AID-656-TO-12-00002
Deliverable 7
International Business & Technical Consultants Inc.
Magda Raupp, Team Leader Bruce Newman, Statistician/Data Specialist Luis Revés, GSC Research, Deputy Team Leader Carlos Lauchande, Statistician/Data Analyst February 25, 2015
DISCLAIMER
The authors’ views expressed in this publication do not necessarily reflect the views of the United States Agency for International Development or the United States Government.

USAID/Aprender a Ler Impact Evaluation: Midline 2 Report i
TABLE OF CONTENTS ACRONYMS ............................................................................................................................................................... iv EXECUTIVE SUMMARY ........................................................................................................................................... v 1. INTRODUCTION ............................................................................................................................................ 1
1.1 Organization of the Report .................................................................................................................... 2
2. USAID APRENDER A LER.............................................................................................................................. 3 3. METHODOLOGICAL OVERVIEW ............................................................................................................. 6
3.1 Research Approach .................................................................................................................................. 6 3.2 Impact Evaluation Questions.................................................................................................................. 7 3.3 Data Collection Instruments .................................................................................................................. 8 3.4 Instrument Administration .................................................................................................................. 10 3.5 Data Analysis........................................................................................................................................... 11 3.6 Limitations of the Study ....................................................................................................................... 12
4. FINDINGS ........................................................................................................................................................ 14 4.1 Findings Related to Students ............................................................................................................... 14 4.2 Student-Level Effects: Changes in Reading-Related Skills ........................................................... 18 4.3 Teacher-Level Effects: Changes in Instructional Behaviors ......................................................... 31 4.4 School-Level Effects: Changes in School Management and Support for Reading ................ 38 4.5 Interviews with School/Pedagogical Directors ............................................................................... 43
5. COST EFFECTIVENESS ANALYSIS ........................................................................................................... 50 5.1 Methodological Approach .................................................................................................................... 50 5.2 Results Obtained .................................................................................................................................... 52
6. CONCLUSIONS ............................................................................................................................................ 56 7. RECOMMENDATIONS ............................................................................................................................... 59 ANNEX A THE EGRA INSTRUMENT .............................................................................................................. 62 ANNEX B THE SCHOOL MANAGEMENT ASSESSMENT ......................................................................... 73 ANNEX C CLASSROOM OBSERVATION PROTOCOL............................................................................ 77 ANNEX D SMA TEACHER INTERVIEW PROTOCOL ............................................................................... 82 ANNEX E SCHOOL DIRECTOR INTERVIEW PROTOCOL .................................................................... 84 ANNEX F COLLECTION SUPERVISOR REPORT ........................................................................................ 85 ANNEX G COMPARABILITY OF RCT GROUPS ......................................................................................... 88 ANNEX H COSTS OF USAID/APRENDER A LER AND CEA UNIT COST PER SKILL (2014) ....... 94 ANNEX I URBAN AND RURAL DIFFERENCES ......................................................................................... 101 ANNEX J SELECTED REFERENCES ................................................................................................................ 103 ANNEX K IE SCOPE OF WORK ..................................................................................................................... 105 ANNEX L CONFLICT OF INTEREST FORMS ............................................................................................. 124
USAID/Aprender a Ler Impact Evaluation: Midline 2 Report ii
List of Figures
Figure 1 Scores on familiar word reading at Midline 1 and Midline 2 by treatment group .................... vii Figure 2 Number of letters, familiar words and words in connected text read by 3rd graders .......... viii Figure 3 Percentage of third graders correctly reading 20 + words per minute at Midline 2 by
treatment group ............................................................................................................................................... viii Figure 4 Percentage of grade 3 students correctly reading 45 + words of connected text.................... ix Figure 5 Self-reported repetition ......................................................................................................................... 16 Figure 6 Percentage of proximity to maximum score in each section per group .................................... 32 Figure 7 Relationship between teach decoding and student achievement in word recognition .......... 36 Figure 8 Relationship between teach comprehension and student scores in word recognition
(Grade 3) ............................................................................................................................................................ 37 Figure 9 Relationship between planning and sequence and student scores in word recognition
(Grade 3) ............................................................................................................................................................ 38 Figure 10 Percentage of school directors observed utilizing the routines ................................................ 41 Figure 11 Initiatives implemented at the school as a result of participation in ApaL .............................. 45 Figure 12 Initiatives implemented at the school as a result of project participation ............................... 46 Figure 13 School directors’ perception of ApaL initiatives that impact student reading performance
the most ............................................................................................................................................................. 47 Figure 14 School directors’ perception of ApaL initiatives to maintain ..................................................... 48 Figure 15 Initiatives that could be sustained with school resources ........................................................... 49 Figure 16 Steps involved in conducting the CEA of ApaL ............................................................................. 51
List of Tables
Table 1 Differences between type of school by grade and intervention group .......................................... x Table 2 Baseline EGRA results by intervention group (Nampula) .............................................................. 13 Table 3 Baseline EGRA results by intervention group (Zambézia) ............................................................. 13 Table 4 Population and sample count of schools where data were collected .......................................... 14 Table 5 EGRA administration by sex .................................................................................................................. 15 Table 6 Age of students taking the EGRA ......................................................................................................... 15 Table 7 Family situation as reported by students who took the EGRA ..................................................... 16 Table 8 Student absentee rates in randomly selected 2nd and 3rd grade classes ................................... 17 Table 9 Overall absentee rates for boys and girls in both provinces ......................................................... 17 Table 10 Measures taken at Baseline, Midline 1 and Midline 2 on reading skills affected by the project
(Grade 2) ............................................................................................................................................................ 18 Table 11 Mean Scores of Intervention and Control Schools at Midline 1 and Midline 2 on EGRA Sub-
Tests .................................................................................................................................................................... 19 Table 12 Mean Scores of Intervention and Control Schools at Midline1 and 2 on EGRA Sub-Tests
(Grade 3) ............................................................................................................................................................ 19 Table 13 Mean scores by Treatment group for Grade 2 and Grade 3 ...................................................... 20 Table 14 Mean scores by Treatment group for Grade 2 and Grade 3 ...................................................... 21 Table 15 Mean scores by Treatment group for Grade 2 and Grade 3 (letters correctly read in one
minute) ................................................................................................................................................................ 21 Table 16 Mean scores by treatment group for Grade 2 and Grade 3 (familiar words read per
minute—cwpm) ................................................................................................................................................ 22 Table 17 Percentage of third graders reading 20 or more familiar words per minute (cwpm) ........... 22 Table 18 Mean scores by treatment group for Grade 2 and Grade 3 (Fluency: words correctly read
out of 120 words in connected text) .......................................................................................................... 23 Table 19 Third graders correctly reading 45 or more words of connected text .................................... 23 Table 20 Mean scores by Treatment group for Grade 2 and Grade 3 ...................................................... 24
USAID/Aprender a Ler Impact Evaluation: Midline 2 Report iii
Table 21 Percentage of third graders correctly answering the comprehension questions (Grade 3) 24 Table 22 Mean Scores of Intervention and Control Schools on EGRA Sub-Tests by sex (Grade 2) . 25 Table 23 Mean Scores of Intervention and Control Schools on EGRA Sub-Tests by sex (Grade 3) . 25 Table 24 Third graders correctly reading 20 or more familiar words in one minute by sex ............... 26 Table 25 Third graders correctly reading 45 or more words of connected text by sex ...................... 26 Table 26 Third graders correctly answering reading comprehension questions by sex ........................ 27 Table 27 Performance of girls relative to boys on EGRA subtests at Baseline, Midline 1 and Midline 2
in Grade 2 .......................................................................................................................................................... 27 Table 28 Performance of Girls relative to Boys on EGRA subtests at Baseline, Midline 1 and Midline
2 in Grade 3 ....................................................................................................................................................... 28 Table 29 Grade 2 EGRA results by province (Nampula) and intervention group ................................... 28 Table 30 Grade 2 EGRA results by province (Zambézia) and intervention group ................................. 29 Table 31 Grade 3 EGRA results by province (Nampula) and intervention group ................................... 29 Table 32 Grade 3 EGRA results by province (Zambézia) and intervention group ................................. 29 Table 33 Differences between provinces (Grade 2) ....................................................................................... 29 Table 34 Differences between provinces (Grade 3) ....................................................................................... 30 Table 35 Midline 2 EGRA scores by grade and urban and rural schools ................................................... 30 Table 36 Midline 2 EGRA scores by urban and rural schools and intervention group (Grade 2) ....... 30 Table 37 Midline 2 EGRA scores by urban and rural schools and intervention group (Grade 3) ....... 31 Table 38 Attendance recorded at INSET .......................................................................................................... 32 Table 39 Section 1 Teacher-Student Interactions ........................................................................................... 33 Table 40 Section 2 Teaching Decoding .............................................................................................................. 33 Table 41 Section 3 Teaching Comprehension .................................................................................................. 34 Table 42 Section 4 Classroom Management ..................................................................................................... 34 Table 43 Section 5 Planning and Sequencing ..................................................................................................... 35 Table 44 Correlation between teaching decoding and student scores on EGRA subtests ................... 36 Table 45 Correlation between teaching comprehension and student scores on selected EGRA
subtests ............................................................................................................................................................... 37 Table 47 Correlation between planning and sequencing and selected EGRA scores ............................. 37 Table 47 Number and percentage of schools visited with the SD or PD present .................................. 39 Table 48 Average minute late start of instruction ........................................................................................... 40 Table 49 Teacher Absentee Rates* ..................................................................................................................... 41 Table 50 Composite indicator of school management ................................................................................... 42 Table 51 Correlation between school management composite score and EGRA scores ..................... 43 Table 53 Interviews with school and/or pedagogical directors .................................................................... 44 Table 53 . Unit costs per treatment and Control groups .............................................................................. 52 Table 54 Skills measured by the EGRA and costs per gains obtained (Grade 2) ..................................... 53 Table 55 Gains obtained per US$ 1.00 by Full and Medium treatment groups by EGRA subtest
(Grade 2) ............................................................................................................................................................ 54 Table 56 Skills measured by the EGRA and costs per gains obtained (Grade 3) ..................................... 54 Table 57 Gains obtained per US$ 1.00 by Full and Medium treatment groups by EGRA subtest
(Grade 3) ............................................................................................................................................................ 55
USAID/Aprender a Ler Impact Evaluation: Midline 2 Report iv
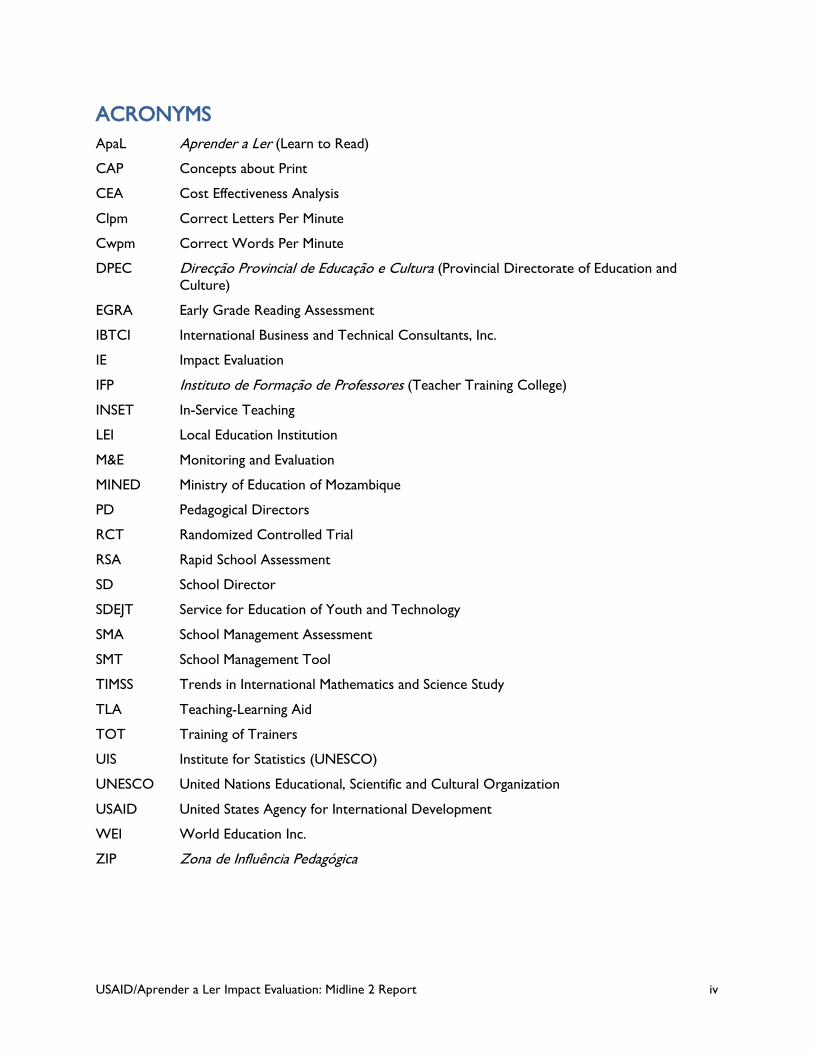
ACRONYMS ApaL Aprender a Ler (Learn to Read)
CAP Concepts about Print
CEA Cost Effectiveness Analysis
Clpm Correct Letters Per Minute
Cwpm Correct Words Per Minute
DPEC Direcção Provincial de Educação e Cultura (Provincial Directorate of Education and Culture)
EGRA Early Grade Reading Assessment
IBTCI International Business and Technical Consultants, Inc.
IE Impact Evaluation
IFP Instituto de Formação de Professores (Teacher Training College)
INSET In-Service Teaching
LEI Local Education Institution
M&E Monitoring and Evaluation
MINED Ministry of Education of Mozambique
PD Pedagogical Directors
RCT Randomized Controlled Trial
RSA Rapid School Assessment
SD School Director
SDEJT Service for Education of Youth and Technology
SMA School Management Assessment
SMT School Management Tool
TIMSS Trends in International Mathematics and Science Study
TLA Teaching-Learning Aid
TOT Training of Trainers
UIS Institute for Statistics (UNESCO)
UNESCO United Nations Educational, Scientific and Cultural Organization
USAID United States Agency for International Development
WEI World Education Inc.
ZIP Zona de Influência Pedagógica
USAID/Aprender a Ler Impact Evaluation: Midline 2 Report v
EXECUTIVE SUMMARY Background United States Agency for International Development (USAID) Mozambique has financed World Education Inc. (WEI) to develop and implement an early grade reading approach, the USAID/Aprender a Ler (ApaL) project, in line with USAID’s global goal of 100 million children reading by 2015. The project advocates the “simple view of reading” and includes vocabulary, decoding, fluency, and reading comprehension activities, training, coaching and scripted lesson plans for teachers, teaching-learning aids (TLAs), decodable books,1 student readers and school director (SD) training and coaching to support reading instruction. ApaL was launched in July 2012 by USAID and the Ministry of Education of Mozambique (MINED). It has targeted at 45,469 students in second and third grades, 849 first and second grade teachers, and 61 school directors in122 schools. The schools were clustered around 34 Zonas de Influência Pedagógica (ZIPs)2 in seven districts along the economic corridors of the provinces of Nampula and Zambézia in Mozambique.
Since September 2012, International Business and Technical Consultants, Inc. (IBTCI) has been conducting an Impact Evaluation (IE) of the ApaL project in a random sample of 180 schools in the two target provinces on behalf of USAID/Mozambique. The IE used a Randomized Controlled Trial (RCT) methodology and the Early Grade Reading Assessment (EGRA) to collect data on reading skills of approximately 3,600 second and third graders at three data points: Baseline in February-March 2013 at the beginning of the school year and Midline 1 and 2 near the end of the 2013 and 2014 school years respectively. In seven districts selected by the implementer, 34 ZIPs and their cluster of schools were randomly assigned to Medium treatment, which focuses on improved student learning, to Full treatment, which adds components for more effective school management, or to a non-treatment Control group. This Midline 2 report also contains a cost-effectiveness analysis. At the end of the 2015 academic year, a further data collection will be conducted to assess the sustainability of ApaL interventions one year following the end of ApaL assistance to treatment schools.
ApaL focuses on two objectives: (1) Improve the quality of reading instruction to be achieved through teacher in-service training, coaching and monitoring and the provision of TLAs and (2) Increase the amount of instruction delivered to be achieved through more efficient school management. While both treatment groups included the same teacher in-service training3 and coaching and the provision of the same TLAs, the Full group includes a school management training component to increase the quantity of reading instruction through the adoption of a more efficient school management procedures.
Methodology
The main purpose of the IE is to assess the impact of the project on children’s reading skills and provide evidence to guide future decision and policy making. In addition, the IE provides robust data to inform the scale-up of ApaL to 522 schools in 2015 and to advocate for improved early grade reading strategies. According to the IE model, the two treatment groups—Full and Medium—are compared to a no treatment Control group. The IE utilizes a randomized controlled trial (RCT) methodology with a counterfactual—e.g., a group similar to the treatment groups—to estimate what could be expected after a year of reading instruction without the benefit of the intervention. Having started with equivalent
1 Decodable books are small, inexpensive, four- or six-page books with controlled text difficulty that the students are allowed to take home but must bring back. Almost 900,000 of them were distributed to the treatment schools. 2 Schools in Mozambique are clustered (usually in groups of 5-7) around one lead school to constitute a Zona de Influência Pedagógica (ZIP). 3 A direct training model would be unsustainable. ApaL uses a “modified cascade” training model, which is folded into the current MINED system making training more sustainable.
USAID/Aprender a Ler Impact Evaluation: Midline 2 Report vi
groups, the IE is able to assess the level of performance all students would have reached without the benefit of the project.
A second comparison of interest focuses on results obtained at the end of the 2013 school year after an abbreviated two-month intervention and those obtained at the end of 2014 after a full school year of project implementation. Results obtained at Baseline (February-March 2013) are presented to describe the situation prior to project implementation and to document that the randomization worked and that the groups (Full, Medium and Control) were equivalent as the project started. These comparisons are detailed in the Findings section of the report.
Six EGRA subtests were used in the assessment—Oral Comprehension, Concepts about Print (CAP), Letter Recognition, Reading Familiar Words, Reading Connected Text (Fluency) and Reading Comprehension.
Findings
Results show that after a full school year of project implementation, students in both the Medium and the Full treatment schools perform at significantly higher levels than their counterparts in Control schools on all EGRA subtests. The findings clearly indicate the impact of the project and show the improvement made by students in the intervention groups—especially in Full treatment schools. ApaL strengthened reading instruction in the intervention schools on all EGRA measures, as evidenced by student reading outcomes and the observation of teacher instructional behavior. After six months of participation in ApaL, students in the intervention schools made marked improvement in their reading performance compared with students in the Control schools. Looking across EGRA subtasks, we found intervention groups showed the greatest improvements in letter recognition (identifying and sounding out letters), familiar word reading, and reading connected text (fluency).
Compared with Midline 1, letter recognition by third graders in the intervention schools increased from 16 to 29 correct letters read per minute (clpm), an increase of 78% versus an increase of 54% in Control schools. In treatment schools, familiar word reading doubled from 3.7 correct words per minute (cwpm) at Midline 1 to 7.3 cwpm at Midline 2. By contrast, in Control schools, the improvement was modest, from 2.9 to 3.2 cwpm, a 10% increase. Reading connected text (fluency) shows the same patterns: treatment groups rose from 4.9 cwpm at Midline 1 to 13.4, an increase of 174% while students in Control schools who read 4.4 cwpm at Midline 1 and were reading 5.2 cwpm at Midline 2, an 18% increase over what was observed at Midline 1. Differences in gains between treatment and Control groups are always significant and with very few exceptions, the differences observed between Full and Medium treatment groups are also significant.
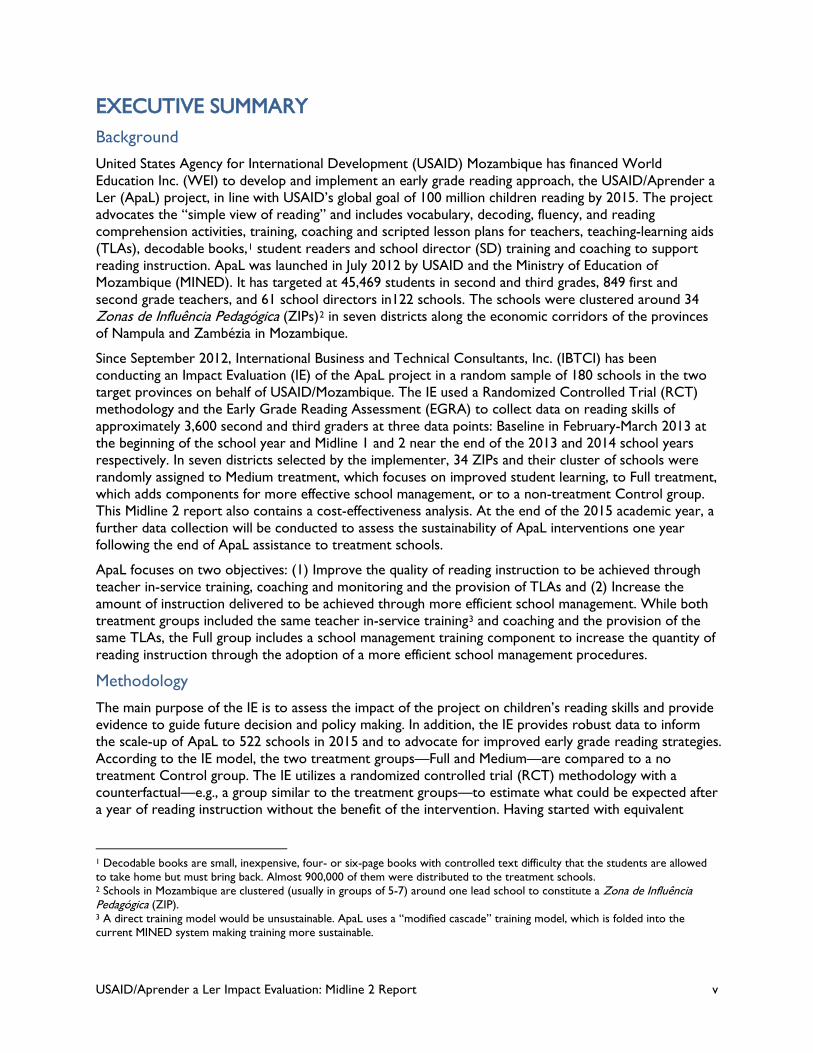
The fact that students in the Full treatment group outperform their counterparts in the Medium treatment group could be the effect of the school management component, which is part of the Full treatment. Figure 1 compares scores obtained at Midline 1 (October 2013) and Midline 2 (September 2014) and provides an overall picture of the evolution of the groups between the two data points.
USAID/Aprender a Ler Impact Evaluation: Midline 2 Report vii
N=1704
Figure 1 Scores on familiar word reading at Midline 1 and Midline 2 by treatment group
Although treatment and Control groups were somewhat similar at Midline 1, with treatment groups slightly ahead of the Control, at Midline 2, after a whole school year of project implementation, the differences have become larger and statistically quite significant with the Full treatment group clearly ahead of the other two, especially ahead of Control. The information displayed in Figure 1 shows that while at Midline 1 the difference in the number of words read by students in the treatment group and in the Control group is small (0.75 words) at Midline 2 students in treatment groups are able to read more than twice the number of words read by students in the Control group.
Considering that our sample is representative of the entire second and third grade student population in the 180 schools where the project was implemented as well as of second and third grade teachers and of school directors, we can project the results obtained by the 3,475 students in the sample to the entire population of beneficiaries: 45,469 second and third grade students, 849 teachers and 61 school directors.
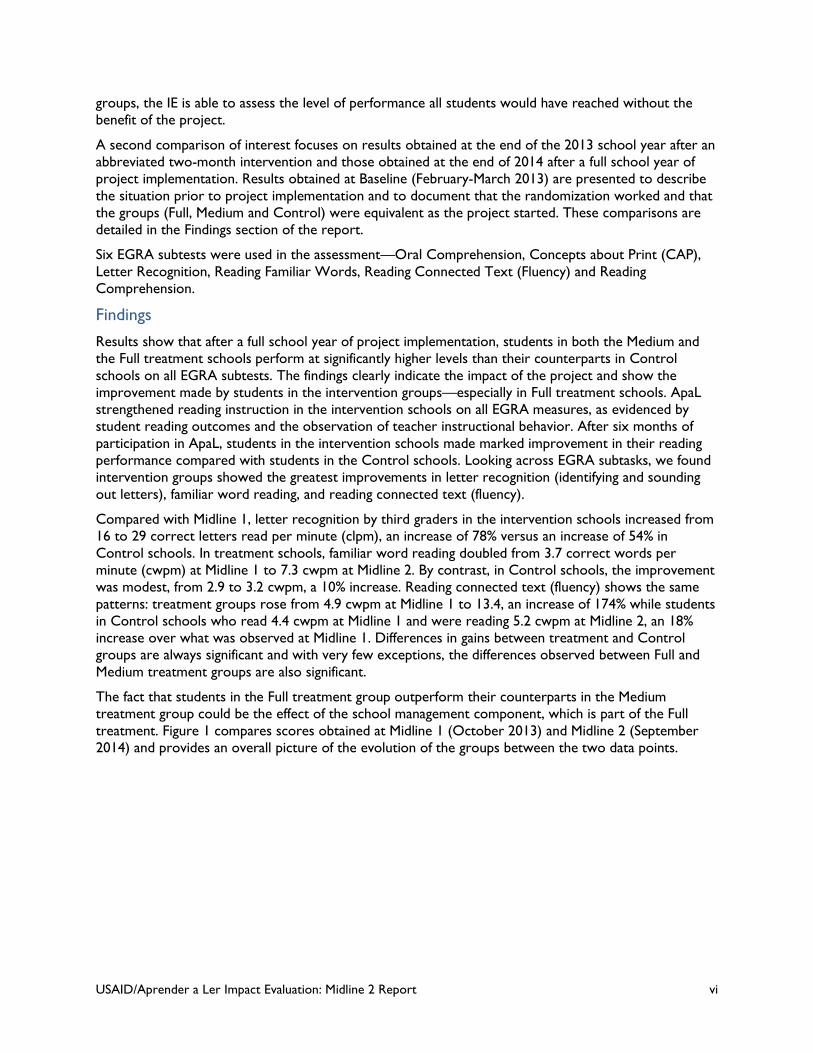
The main focus of an Impact Evaluation is on the observed differences between the treatment and the Control groups in order to assess the magnitude of the impact that resulted from the project. Comparisons at the third grade level are the most relevant because international reading skills benchmarks have been established for Grade 3 in developing countries—a minimum of 45 words correctly read per minute to allow students to comprehend what they read—but not for second grade. Figure 2 compares results obtained on three EGRA subtests by intervention group. These findings are discussed in detail in the Findings section.
0
5
10
Midline 1 Midline 2
3.8
8.1
3.3
6.5
2.8 3.2
Full Medium Control
USAID/Aprender a Ler Impact Evaluation: Midline 2 Report viii
N=1704
Figure 2 Number of letters, familiar words and words in connected text read by 3rd graders
Figure 2 shows clearly that in spite of being equivalent at Baseline, students in the treatment groups—especially the Full treatment group—clearly outperform their counterparts in the Control group at Midline 2.
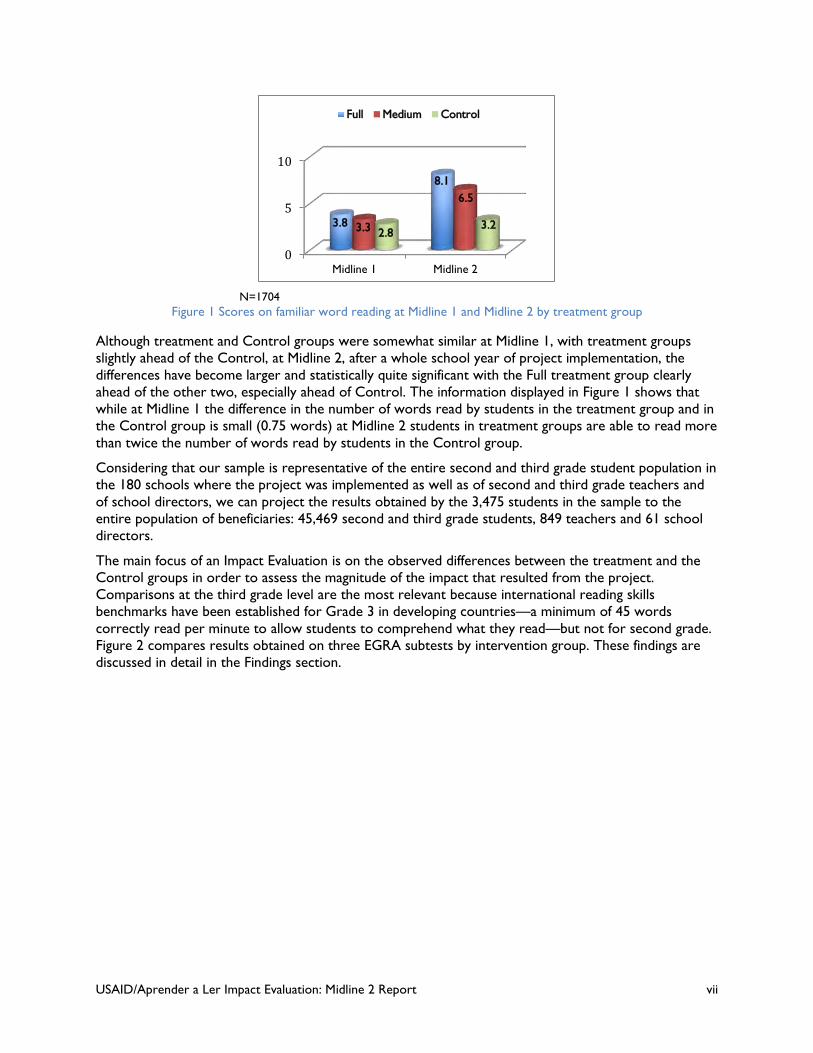
Reading 20+ familiar words per minute is a useful indicator that shows how far along students are on the way to reach the objective of 45 words per minute that allows them to read a text with comprehension. Figure 2 shows the percentage of third graders able to read 20 or more words per minute.
N=1704
Figure 3 Percentage of third graders correctly reading 20 + words per minute at Midline 2 by treatment group
We note that 15.9% of all Grade 3 students who have benefitted from a year of ApaL Full treatment can read at least 20 familiar words per minute correctly (as compared to 4.3% of Grade 3 students in Control schools). The percentage of third graders able to read 20 or more words in Control schools (4.3% at Midline 2) provides an insight of the progress all 1,704 third graders would likely have made without the benefit of the ApaL program. It is clear that the differences between Control and Full and Medium groups have accelerated as a result of approximately six months of intervention over the course of the 2014 school year with the performance of the Control group falling farther behind the treatment groups. We strongly encourage MINED to establish and monitor intermediate benchmarks or targets for improvement as recommended by the joint United Nations Educational, Scientific and
0
5
10
15
20
25
30
CLPM CWPM CWPM (Fluency)
29,5
8.1
14.6
27.1
6.5
12
18.8
3.2 5.2
Full Medium Control
0 10 20
16
11 4.3
Percentage reading reading 20+ cwpm
Control Medium Full
USAID/Aprender a Ler Impact Evaluation: Midline 2 Report ix
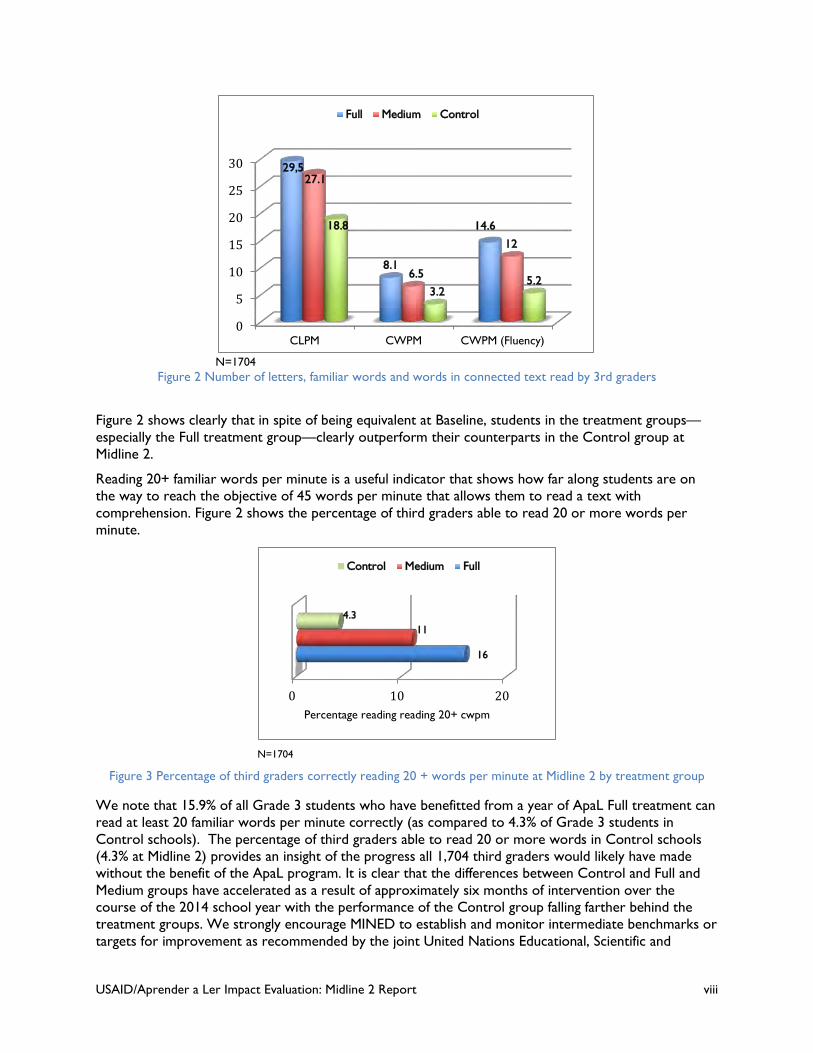
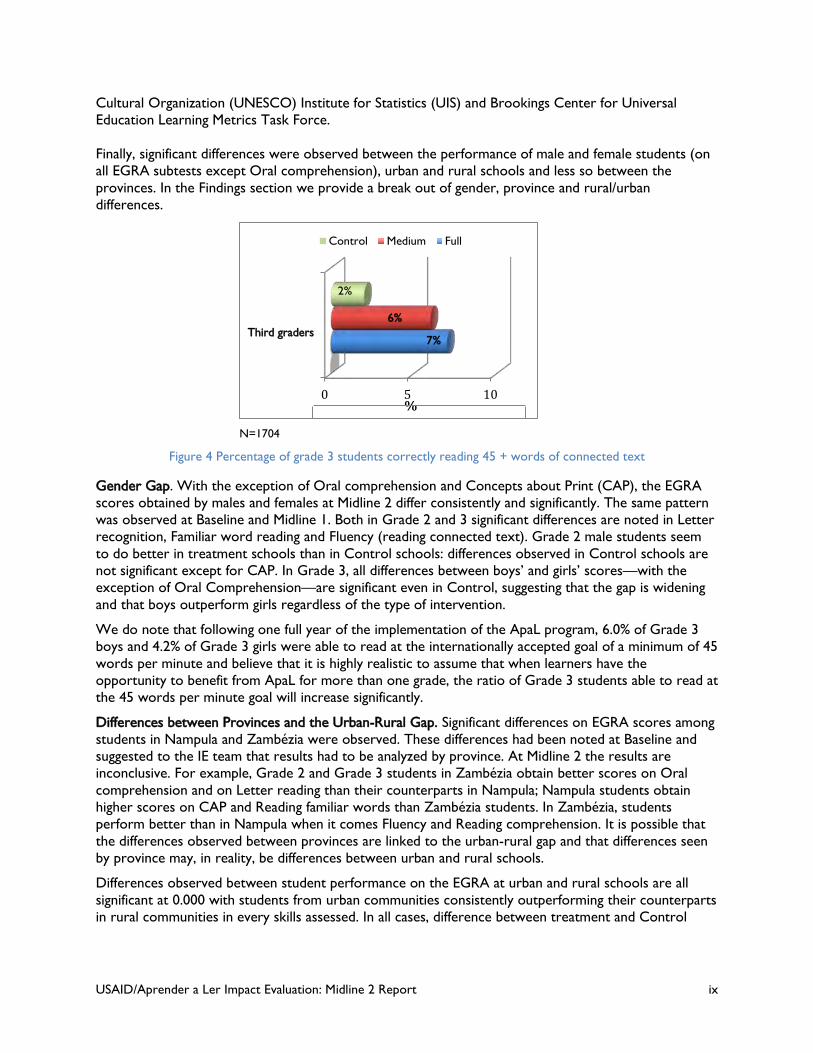
Cultural Organization (UNESCO) Institute for Statistics (UIS) and Brookings Center for Universal Education Learning Metrics Task Force. Finally, significant differences were observed between the performance of male and female students (on all EGRA subtests except Oral comprehension), urban and rural schools and less so between the provinces. In the Findings section we provide a break out of gender, province and rural/urban differences.
N=1704
Figure 4 Percentage of grade 3 students correctly reading 45 + words of connected text
Gender Gap. With the exception of Oral comprehension and Concepts about Print (CAP), the EGRA scores obtained by males and females at Midline 2 differ consistently and significantly. The same pattern was observed at Baseline and Midline 1. Both in Grade 2 and 3 significant differences are noted in Letter recognition, Familiar word reading and Fluency (reading connected text). Grade 2 male students seem to do better in treatment schools than in Control schools: differences observed in Control schools are not significant except for CAP. In Grade 3, all differences between boys’ and girls’ scores—with the exception of Oral Comprehension—are significant even in Control, suggesting that the gap is widening and that boys outperform girls regardless of the type of intervention.
We do note that following one full year of the implementation of the ApaL program, 6.0% of Grade 3 boys and 4.2% of Grade 3 girls were able to read at the internationally accepted goal of a minimum of 45 words per minute and believe that it is highly realistic to assume that when learners have the opportunity to benefit from ApaL for more than one grade, the ratio of Grade 3 students able to read at the 45 words per minute goal will increase significantly.
Differences between Provinces and the Urban-Rural Gap. Significant differences on EGRA scores among students in Nampula and Zambézia were observed. These differences had been noted at Baseline and suggested to the IE team that results had to be analyzed by province. At Midline 2 the results are inconclusive. For example, Grade 2 and Grade 3 students in Zambézia obtain better scores on Oral comprehension and on Letter reading than their counterparts in Nampula; Nampula students obtain higher scores on CAP and Reading familiar words than Zambézia students. In Zambézia, students perform better than in Nampula when it comes Fluency and Reading comprehension. It is possible that the differences observed between provinces are linked to the urban-rural gap and that differences seen by province may, in reality, be differences between urban and rural schools.
Differences observed between student performance on the EGRA at urban and rural schools are all significant at 0.000 with students from urban communities consistently outperforming their counterparts in rural communities in every skills assessed. In all cases, difference between treatment and Control
0 5 10
Third graders7%
6%
2%
%
Control Medium Full
USAID/Aprender a Ler Impact Evaluation: Midline 2 Report x
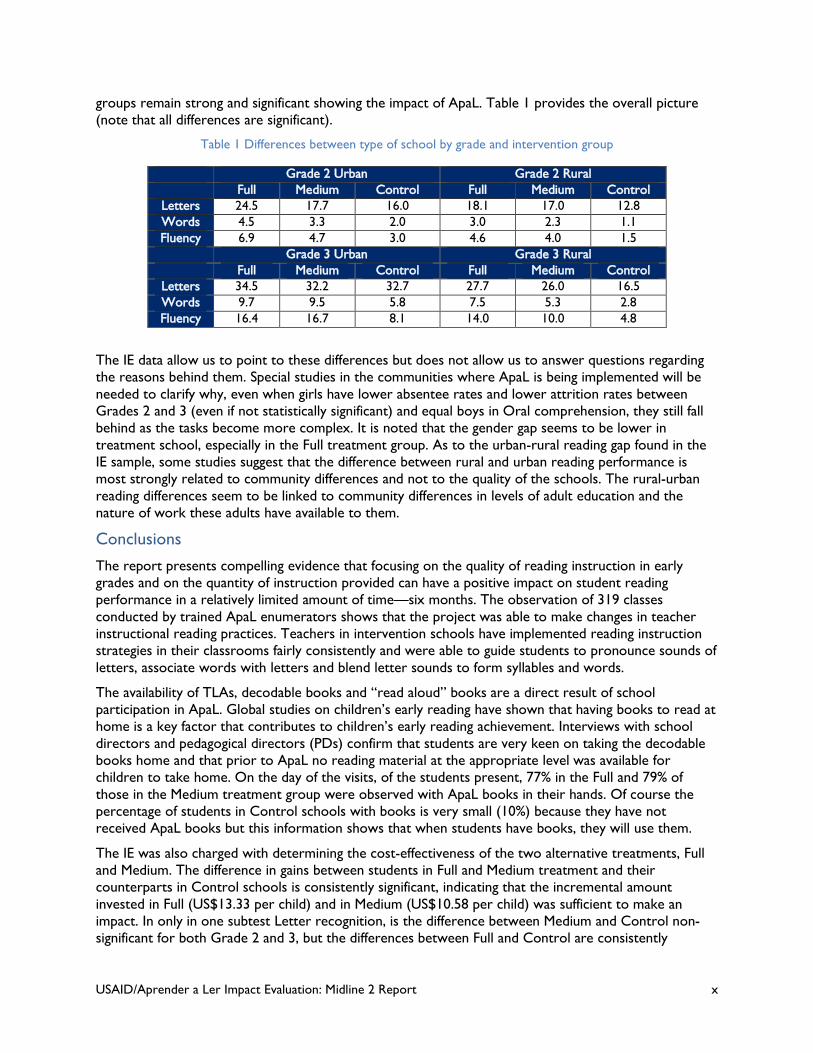
groups remain strong and significant showing the impact of ApaL. Table 1 provides the overall picture (note that all differences are significant).
Table 1 Differences between type of school by grade and intervention group
Grade 2 Urban Grade 2 Rural Full Medium Control Full Medium Control
Letters 24.5 17.7 16.0 18.1 17.0 12.8 Words 4.5 3.3 2.0 3.0 2.3 1.1 Fluency 6.9 4.7 3.0 4.6 4.0 1.5
Grade 3 Urban Grade 3 Rural Full Medium Control Full Medium Control
Letters 34.5 32.2 32.7 27.7 26.0 16.5 Words 9.7 9.5 5.8 7.5 5.3 2.8 Fluency 16.4 16.7 8.1 14.0 10.0 4.8
The IE data allow us to point to these differences but does not allow us to answer questions regarding the reasons behind them. Special studies in the communities where ApaL is being implemented will be needed to clarify why, even when girls have lower absentee rates and lower attrition rates between Grades 2 and 3 (even if not statistically significant) and equal boys in Oral comprehension, they still fall behind as the tasks become more complex. It is noted that the gender gap seems to be lower in treatment school, especially in the Full treatment group. As to the urban-rural reading gap found in the IE sample, some studies suggest that the difference between rural and urban reading performance is most strongly related to community differences and not to the quality of the schools. The rural-urban reading differences seem to be linked to community differences in levels of adult education and the nature of work these adults have available to them.
Conclusions
The report presents compelling evidence that focusing on the quality of reading instruction in early grades and on the quantity of instruction provided can have a positive impact on student reading performance in a relatively limited amount of time—six months. The observation of 319 classes conducted by trained ApaL enumerators shows that the project was able to make changes in teacher instructional reading practices. Teachers in intervention schools have implemented reading instruction strategies in their classrooms fairly consistently and were able to guide students to pronounce sounds of letters, associate words with letters and blend letter sounds to form syllables and words.
The availability of TLAs, decodable books and “read aloud” books are a direct result of school participation in ApaL. Global studies on children’s early reading have shown that having books to read at home is a key factor that contributes to children’s early reading achievement. Interviews with school directors and pedagogical directors (PDs) confirm that students are very keen on taking the decodable books home and that prior to ApaL no reading material at the appropriate level was available for children to take home. On the day of the visits, of the students present, 77% in the Full and 79% of those in the Medium treatment group were observed with ApaL books in their hands. Of course the percentage of students in Control schools with books is very small (10%) because they have not received ApaL books but this information shows that when students have books, they will use them.
The IE was also charged with determining the cost-effectiveness of the two alternative treatments, Full and Medium. The difference in gains between students in Full and Medium treatment and their counterparts in Control schools is consistently significant, indicating that the incremental amount invested in Full (US$13.33 per child) and in Medium (US$10.58 per child) was sufficient to make an impact. In only in one subtest Letter recognition, is the difference between Medium and Control non-significant for both Grade 2 and 3, but the differences between Full and Control are consistently
USAID/Aprender a Ler Impact Evaluation: Midline 2 Report xi
significant for all EGRA sub-tests. Based on the differences observed between treatment groups the Full treatment yields more gains per US$1 spent than the Medium alternative.
But information provided in the report also draws attention to a number of challenges that USAID ApaL will continue to face when it expands in 2015 to over 500 schools. The most urgent, and likely the most difficult to overcome, is the high absentee rates of students, teachers and school directors. On a typical day near the end of the school year, student absentee rate is extremely high: 58% (52% Full; 59% Medium; 62% Control). Rather than overcrowded classrooms or lack of materials, this may be the single most important challenge that ApaL needs to overcome. While the smaller-than-average absentee rate observed at Full schools may be a result of the added component of school management, it is important to realize that absenteeism is a system-wide challenge that requires all stakeholders to join forces and devise strategies focused on getting all students to school every day. ApaL has identified the challenge and called attention to high absentee rates and has been working with the local education institutions (LEIs) such as the Service for Education of Youth and Technology (SDEJT) and the Provincial Directorate for Education and Culture (DPEC) to address the issue.
Teacher, SD and PD absentee rates compound the problem. In 24% of the 180 schools visited, both the SD and PD were absent on the day of visit. It was generally observed that instruction begins with significant delays in many of the schools where the project has been working—typically the average delays in the start of the school day is from 24 minutes at Full treatment schools to 46 in Control schools and even 58 minutes in Zambézia Control schools. It is possible to look at the absentee rates as a chain reaction: when the director of the school (the assistant director or the pedagogical director) is not present at the beginning of the school day, teachers may feel that it is not important for them to be there either. If students come to school and their teacher is not there they may learn the lesson that school is not important and be truant as they please—on a typical day 58% of them do so.
The findings show that the project has indeed improved the EGRA scores of treatment school students over the Control group at every EGRA subtest and that the differences are significant. But even though impressive progress has been achieved and results are statistically significant, the educational significance is modest. A concerted effort of all stakeholders is needed to reach the 45 word per minute mark considered by reading specialists the minimum number of words required to read with comprehension. It is clear that designing and implementing an educational program in early grade reading such as ApaL in a country going through transition after years of having experienced nationwide conflict is no small feat. Overcoming roadblocks and barriers involves flexibility, creative problem solving and compromise. Establishing new ways of teaching and learning, supervision and support requires new ways of thinking for many education professionals. While gains are still modest in absolute terms, the increase in student achievement is impressive and the changes noted in the classrooms confirm that the quality of teaching and better school management does impact student outcomes. Based on the differences observed between Midline 1 and Midline 2, ApaL type strategies integrated through grades 1-3 with adequate support from district level staff would probably result in much higher differences between the treatment and the Control groups. At the same time, as reported by ApaL, training SD in how to manage a school more effectively has reduced absenteeism and tardiness—with the result of increasing the quantity of instruction. The USAID Aprender a Ler project may be initiating some major paradigm changes in Mozambique.
Recommendations
The recommendations offered in this section are based on the data analyzed by the IE and refer specifically to the results obtained, which are related to the improvement of early grade reading skills. We also focus on two ApaL intermediate indicators: (i) improved quality and (2) improved quantity of early reading instruction. The main recommendations to strengthen the overall impact of the project are outlined below, in general order of priority.
USAID/Aprender a Ler Impact Evaluation: Midline 2 Report xii
1. The ApaL program works, and should be continued. Although absolute levels of achievement remain lower than desired, both Full and Medium treatments contributed to significant gains in student reading skills relative to Control schools, especially in third grade. Teacher training was shown to impact teacher classroom behavior, which in turn was shown to impact student performance on the EGRA. Similarly, the provision of TLAs under both treatments is shown to both change classroom activities and resultant student learning of early grade reading skills.
2. Expansion of ApaL in 2015 should be performed under the Full treatment model. The cost-effectiveness analysis clearly demonstrates that significant gains on most EGRA sub scores in both grades are obtained with the inclusion of the SD-oriented activities. These gains exceed the marginal costs of the Full treatment model over those of the Medium treatment model.
Nonetheless, there are a number of areas that limited the impact of the ApaL model, and these should be addressed as the intervention is expanded beyond the 2014 pilot schools. Even though significant gains were demonstrated by the ApaL interventions relative to Control schools, high teacher and student absenteeism, in particular, limited student exposure to the new techniques and practices and TLAs available. Furthermore, not all sub-groups showed similar gains. Deeper use of the detailed EGRA data can only go so far. We believe that the ApaL project should develop, test and evaluate the effectiveness of different approaches to improve the EGRA results of students in various sub-groups. Recommendations on this are listed below.
3. Implement strategies to reduce the high absentee rates of teachers, and school/pedagogical directors and the delay in the start of the day. The challenges posed by SD, PD and teacher absenteeism and tardiness deserve continued attention since this is the single factor that most negatively impacts all aspects of student learning by reducing the quantity of instruction that students receive. While by no means an “either-or” matter and efforts can and should be made to address all aspects of absenteeism concurrently, based on the data and our own professional judgement, we recommend that priority be given to (a) absentee teachers and SD/PD, (b) teachers and SD/PD who are frequently tardy, and (c) student absenteeism.
• We recognize that actions related to instructional personnel are beyond USAID’s direct span of control, but encourage the Mission to continue its engagement with MINED on this issue. When teachers and school directors often arrive late or fail to arrive, they communicate to students and parents the message that going to school is not important. As the program scales up in 2015 to cover over 500 schools in the six target districts, the DPEC and the SDEJT will need to be called on to support improved attendance. ApaL is already carrying out meetings with local and district authorities to develop mechanisms to support existing MINED systems for holding schools accountable. ApaL should also consider which incentives could be put into place to encourage teachers, SDs and PDs to reduce the level of absenteeism and tardiness.
• Both USAID and ApaL recognize the potential relationship between teacher tardiness and student learning; however, researching this was beyond the scope of work of the IE, especially since it is probable that ApaL has or can get the relevant data itself. We encourage ApaL to determine for low-performing schools when in the school day reading lessons typically take place and to match this against schools in the sample where teachers were tardy to determine whether there appears to be a correlation (which, however, does not necessarily reflect a causation). If feasible, a similar analysis should be undertaken for higher-performing schools.
4. Engage parents and the community in the effort to reduce student tardiness and absenteeism. As a corollary to teacher tardiness, when classes start 15, 20 or even 40 minutes late on a typical day, the time available for learning becomes insufficient, students have reduced time-on-task and consequently learn less. When teachers and/or students are not present at all, there is no opportunity for learning. There are two separate sets of issues involved, tardiness and absenteeism, which based on our experience overlap but do not necessarily have the same causes.
USAID/Aprender a Ler Impact Evaluation: Midline 2 Report xiii
• It will be necessary to engage parents, as heads of their own households and as a group, to ensure that children do not miss school and arrive on time. Reducing student tardiness and absenteeism requires the cooperation from parents or other adults who are responsible for the children so idea champions must be found within the community.
• Strategies to reduce tardiness and absenteeism may include prizes for students with good attendance, good attendance certificates or a posted list of students with 100% attendance during the week or during the month. Consider introducing a simple competition among classrooms and awarding parents and students highest attendance/least tardiness certificates or starting the day with a playful activity to motivate students to arrive on time. These do not have cost implications.
• USAID should commission a study to determine the most significant causes of absenteeism and propose recommendations. Guided both by the IE and our own experience, we suggest that the study consider, for example: • To what extent, if any, is the question of absentee students real or an artifact of “ghost students,”
i.e., children who realistically were rarely, if ever, present in school? • Are there particular patterns in absenteeism? E.g., is it seasonal? To what extent, if at all, do
children from the same family take turns in attending class? • What are the commonalities and the differences between attendance by boys and girls in rural
and urban areas? • What constraints do parents feel with respect to sending their children to school regularly? • What practices are in place to alert parents that their children are missing school? • What formal or informal support systems are in place to keep children from falling behind? • What relationships, if any, are there between repetition and absenteeism? Per Figure 5, in
Zambezia repetition rates were self-reported at over 20% for grades 1, 2, and 3, and of course drop-out rates were not self-reported at all. Related to this could be an analysis of a possible relationship of the impact of ApaL on student repetition. This could not be conducted within the time frame of the current IE, but could be conducted during the follow-on or could be conducted by ApaL itself.
5. Make reading a priority and clarify expectations. It is important for MINED both to establish yearly benchmarks that will lead schools towards the generally recognized 45 correct word per minute target and to put into place a package of incentives—not necessarily monetary—to benefit schools that reach the yearly target while providing support to schools that lag behind. Reading competitions, prizes for teachers/schools that get students to make progress towards the mark of 45 words correctly read by the end of grade 3, etc. should be considered.
• Regardless of how creative and how well implemented and managed the project is, without a firm resolve on the part of MINED officers at the district, provincial and central level to make reading a priority, reading achievement will continue to fall short of what is acceptable. The RSA designed and implemented by ApaL is a powerful tool that could be used to assess school progress towards the 45 cwpm pm target.
• Expand on efforts to engage parents in promotion of reading at home. Learn more about how the decodable books, and other books, are actually being used in the home environment, and consider how appropriate ones can be replicated.
6. Conduct focused studies to investigate the differences in reading performance observed in the subgroups—girls/boys, provinces, urban and rural. Girls’ absentee rate is lower than boys’ and they seem to drop out less often between second and third grades. In addition, their level of performance on the EGRA subtest Oral comprehension is equal or higher than boys. Yet, boys consistently outperform girls in five out of six EGRA sub-tasks, especially in the more complex tasks such as reading familiar words, reading connected text and answering comprehension questions. While the EGRA data show this situation clearly, as it also shows differences between provinces and between rural and urban
USAID/Aprender a Ler Impact Evaluation: Midline 2 Report xiv
schools, an Impact Evaluation cannot determine the reasons behind what the data show. Special studies need to be conducted in the communities where the project is implemented to provide insights into the causes for these differences. This is essential information for ApaL because it would allow the project to design and incorporate strategies and procedures to reduce the gender gap and the urban-rural gap that currently exist in the schools where the project is being implemented.
7. Strengthen and continue to experiment and perfect the RSA procedures. Supervision and support has a positive impact on improving teachers’ practice, particularly when it is specific, constructive and non-threatening. More analysis of the supervision and support capacity, procedures and practices needs to be carried out in order to provide more targeted improvements to this important component. The RSA procedure developed and implemented by ApaL in the treatment schools could be adapted to MINED’s needs at the district level and become instrumental in the improvement of an effective supervision and accountability system.
8. Identify and, if possible/necessary, address the reasons for significant numbers of over-age students. As indicated in Table 6, in Zambézia and particularly in Nampula, over 60% of the students in the target grades are over-age, with some primary school students even being 17 years of age. From looking at the age breakdowns, and from knowledge of patterns in other countries, one could surmise that this might be partially the result of expansion of education to previously unserved or underserved communities, and therefore might be partially an artifact that would revert to an expected normal pattern, but with respect to the situations in Zambézia and Nampula, we have no evidence to support this surmise. However, in any event it is important for educational planning to learn the actual reasons.
9. In association with the recommended studies on repetition, encourage MINED to conduct cohort analyses. These would be helpful in identifying and later studying both higher-performing and lower-performing schools. While studies for grade levels above grade 3 would likely be outside the scope of work for ApaL, we believe that they would still fall within parameters for Goal 1 of USAID’s Education Strategy.
10. Conduct an item analysis of results from the EGRA instruments to identify issues associated with particular letters and/or words. This can help to identify phonological issues that may call for more attention from teachers than they may currently receive.
USAID/Aprender a Ler Impact Evaluation: Midline 2 Report 1
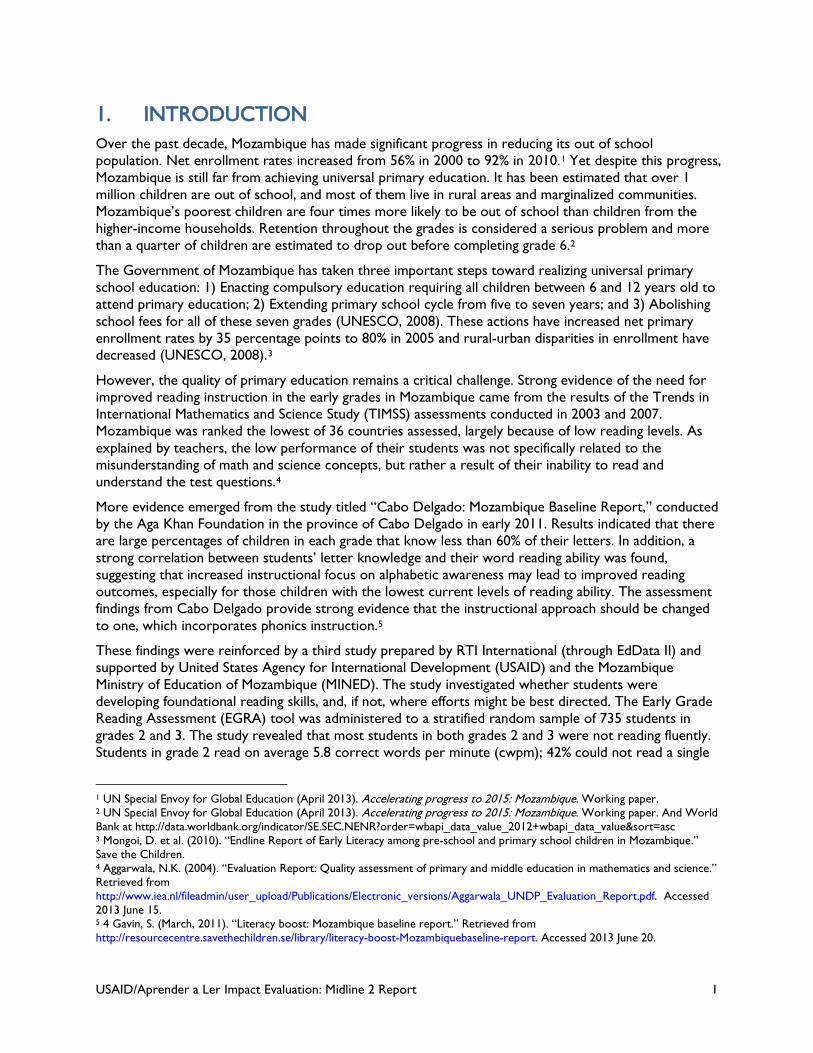
1. INTRODUCTION Over the past decade, Mozambique has made significant progress in reducing its out of school population. Net enrollment rates increased from 56% in 2000 to 92% in 2010.1 Yet despite this progress, Mozambique is still far from achieving universal primary education. It has been estimated that over 1 million children are out of school, and most of them live in rural areas and marginalized communities. Mozambique’s poorest children are four times more likely to be out of school than children from the higher-income households. Retention throughout the grades is considered a serious problem and more than a quarter of children are estimated to drop out before completing grade 6.2
The Government of Mozambique has taken three important steps toward realizing universal primary school education: 1) Enacting compulsory education requiring all children between 6 and 12 years old to attend primary education; 2) Extending primary school cycle from five to seven years; and 3) Abolishing school fees for all of these seven grades (UNESCO, 2008). These actions have increased net primary enrollment rates by 35 percentage points to 80% in 2005 and rural-urban disparities in enrollment have decreased (UNESCO, 2008).3
However, the quality of primary education remains a critical challenge. Strong evidence of the need for improved reading instruction in the early grades in Mozambique came from the results of the Trends in International Mathematics and Science Study (TIMSS) assessments conducted in 2003 and 2007. Mozambique was ranked the lowest of 36 countries assessed, largely because of low reading levels. As explained by teachers, the low performance of their students was not specifically related to the misunderstanding of math and science concepts, but rather a result of their inability to read and understand the test questions.4
More evidence emerged from the study titled “Cabo Delgado: Mozambique Baseline Report,” conducted by the Aga Khan Foundation in the province of Cabo Delgado in early 2011. Results indicated that there are large percentages of children in each grade that know less than 60% of their letters. In addition, a strong correlation between students’ letter knowledge and their word reading ability was found, suggesting that increased instructional focus on alphabetic awareness may lead to improved reading outcomes, especially for those children with the lowest current levels of reading ability. The assessment findings from Cabo Delgado provide strong evidence that the instructional approach should be changed to one, which incorporates phonics instruction.5
These findings were reinforced by a third study prepared by RTI International (through EdData II) and supported by United States Agency for International Development (USAID) and the Mozambique Ministry of Education of Mozambique (MINED). The study investigated whether students were developing foundational reading skills, and, if not, where efforts might be best directed. The Early Grade Reading Assessment (EGRA) tool was administered to a stratified random sample of 735 students in grades 2 and 3. The study revealed that most students in both grades 2 and 3 were not reading fluently. Students in grade 2 read on average 5.8 correct words per minute (cwpm); 42% could not read a single
1 UN Special Envoy for Global Education (April 2013). Accelerating progress to 2015: Mozambique. Working paper. 2 UN Special Envoy for Global Education (April 2013). Accelerating progress to 2015: Mozambique. Working paper. And World Bank at http://data.worldbank.org/indicator/SE.SEC.NENR?order=wbapi_data_value_2012+wbapi_data_value&sort=asc 3 Mongoi, D. et al. (2010). “Endline Report of Early Literacy among pre-school and primary school children in Mozambique.” Save the Children. 4 Aggarwala, N.K. (2004). “Evaluation Report: Quality assessment of primary and middle education in mathematics and science.” Retrieved from http://www.iea.nl/fileadmin/user_upload/Publications/Electronic_versions/Aggarwala_UNDP_Evaluation_Report.pdf. Accessed 2013 June 15. 5 4 Gavin, S. (March, 2011). “Literacy boost: Mozambique baseline report.” Retrieved from http://resourcecentre.savethechildren.se/library/literacy-boost-Mozambiquebaseline-report. Accessed 2013 June 20.
USAID/Aprender a Ler Impact Evaluation: Midline 2 Report 2
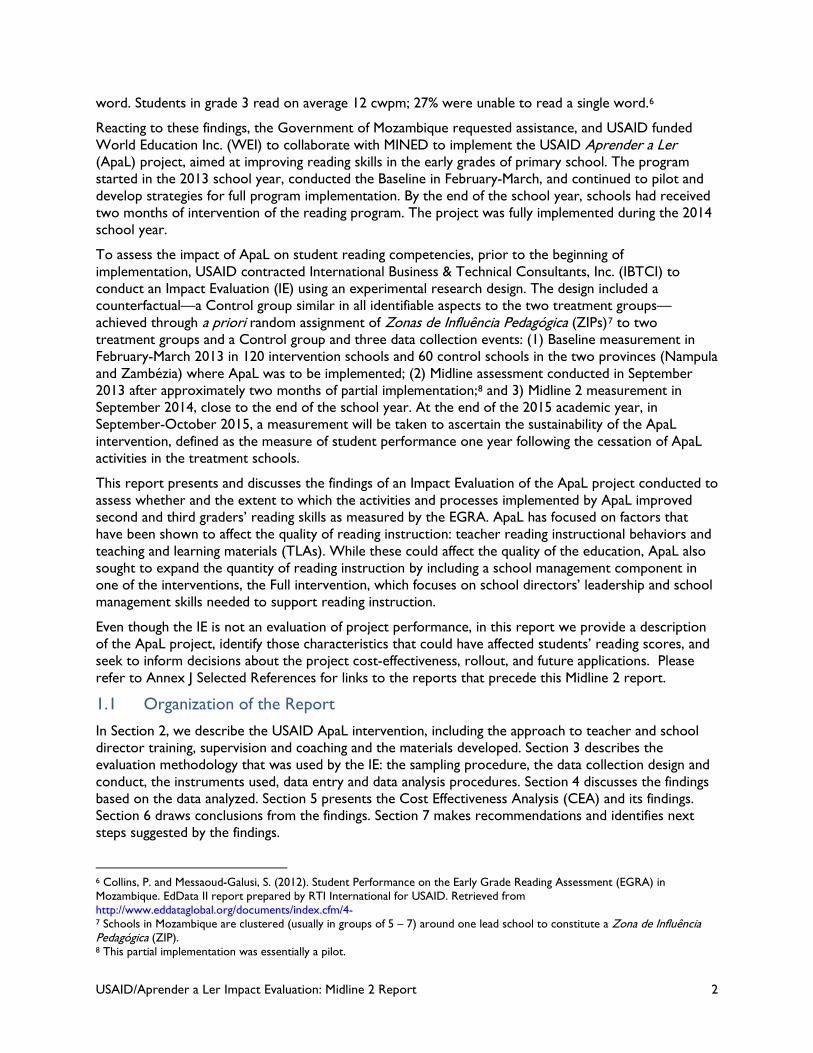
word. Students in grade 3 read on average 12 cwpm; 27% were unable to read a single word.6
Reacting to these findings, the Government of Mozambique requested assistance, and USAID funded World Education Inc. (WEI) to collaborate with MINED to implement the USAID Aprender a Ler (ApaL) project, aimed at improving reading skills in the early grades of primary school. The program started in the 2013 school year, conducted the Baseline in February-March, and continued to pilot and develop strategies for full program implementation. By the end of the school year, schools had received two months of intervention of the reading program. The project was fully implemented during the 2014 school year.
To assess the impact of ApaL on student reading competencies, prior to the beginning of implementation, USAID contracted International Business & Technical Consultants, Inc. (IBTCI) to conduct an Impact Evaluation (IE) using an experimental research design. The design included a counterfactual—a Control group similar in all identifiable aspects to the two treatment groups—achieved through a priori random assignment of Zonas de Influência Pedagógica (ZIPs)7 to two treatment groups and a Control group and three data collection events: (1) Baseline measurement in February-March 2013 in 120 intervention schools and 60 control schools in the two provinces (Nampula and Zambézia) where ApaL was to be implemented; (2) Midline assessment conducted in September 2013 after approximately two months of partial implementation;8 and 3) Midline 2 measurement in September 2014, close to the end of the school year. At the end of the 2015 academic year, in September-October 2015, a measurement will be taken to ascertain the sustainability of the ApaL intervention, defined as the measure of student performance one year following the cessation of ApaL activities in the treatment schools.
This report presents and discusses the findings of an Impact Evaluation of the ApaL project conducted to assess whether and the extent to which the activities and processes implemented by ApaL improved second and third graders’ reading skills as measured by the EGRA. ApaL has focused on factors that have been shown to affect the quality of reading instruction: teacher reading instructional behaviors and teaching and learning materials (TLAs). While these could affect the quality of the education, ApaL also sought to expand the quantity of reading instruction by including a school management component in one of the interventions, the Full intervention, which focuses on school directors’ leadership and school management skills needed to support reading instruction.
Even though the IE is not an evaluation of project performance, in this report we provide a description of the ApaL project, identify those characteristics that could have affected students’ reading scores, and seek to inform decisions about the project cost-effectiveness, rollout, and future applications. Please refer to Annex J Selected References for links to the reports that precede this Midline 2 report.
1.1 Organization of the Report
In Section 2, we describe the USAID ApaL intervention, including the approach to teacher and school director training, supervision and coaching and the materials developed. Section 3 describes the evaluation methodology that was used by the IE: the sampling procedure, the data collection design and conduct, the instruments used, data entry and data analysis procedures. Section 4 discusses the findings based on the data analyzed. Section 5 presents the Cost Effectiveness Analysis (CEA) and its findings. Section 6 draws conclusions from the findings. Section 7 makes recommendations and identifies next steps suggested by the findings.
6 Collins, P. and Messaoud-Galusi, S. (2012). Student Performance on the Early Grade Reading Assessment (EGRA) in Mozambique. EdData II report prepared by RTI International for USAID. Retrieved from http://www.eddataglobal.org/documents/index.cfm/4- 7 Schools in Mozambique are clustered (usually in groups of 5 – 7) around one lead school to constitute a Zona de Influência Pedagógica (ZIP). 8 This partial implementation was essentially a pilot.
USAID/Aprender a Ler Impact Evaluation: Midline 2 Report 3
2. USAID APRENDER A LER In response to the increasing need to ensure that all children develop sound early grade reading abilities, USAID initiated Aprender a Ler Project in Mozambique. Working in the provinces of Nampula and Zambézia, the project provides a training model and materials that build capacity of Lead Trainers to train teachers at the ZIP level. ApaL also trains pedagogical directors (PDs) and cycle leaders to provide classroom coaching in early reading and in the use of teaching and learning aids (TLAs). Training in school management to school and pedagogical directors is also provided to foster systemic and high-quality early reading instruction in Portuguese. The target population for the project was approximately 45,469 second and third grade students enrolled in 120 schools.
The main result areas of the USAID ApaL project are:
1. Improved quality of reading instruction for 2nd and 3rd graders in target schools.
2. Increased quantity of reading instruction for 2nd and 3rd graders in target schools.
The Aprender a Ler approach to improve the teaching of reading in the initial classes includes the following components for both Medium and Full treatment groups:
• 300 systematically organized lessons, one lesson per day, focused on grades 2 and 3. Each lesson is 45 minutes of reading instruction and includes seven steps for the teacher to follow: (1) Review of previous lessons (not just sound and letters, but specifically words); (2) Phonemic awareness: identifying the sounds of letters in words; (3) Phonics, decoding words; (4) Fluency, practicing reading words, sentences and connected text with decodable books and flashcards; (5) Vocabulary and comprehension, practicing listening comprehension and learn new vocabulary using the “read aloud” books; (6) Writing, review of taught letters and words in the lesson; and (7) Homework.
• Teaching-Learning Aids (TLAs), which include alphabet charts to be permanently posted in the classroom; key word cards12 with letters and corresponding images; chart (quadro de pregas) that allows individual letter cards to be posted on the wall to form words from letters; decodable books,13 and “read aloud” books.
• Continuous assessment, which is integrated into the lesson plans. Every four weeks a written assessment is conducted allowing teachers to track progress of individual students and determine which reading tasks students had difficulty answering.
• Fluency assessment conducted in weeks 9 and 20 of the program when the teacher and the reading coach individually assess all students. The assessment is based on the ASER model and allows teachers to quickly determine which students need extra support in teaching and practice.
• Training Manuals for Master Trainers and Training of Trainers (TOTs) and supervisors including strategies on how to structure meetings and give constructive feedback (coaching), Rapid Assessment supervision and coaching cycle, interview.
• Training and coaching. A program of up to 87 hours of training was delivered, starting in the beginning of 2014. Teacher training sessions were held on Saturdays targeting all 849 Grade 2 and 3 teachers in the intervention schools. The model for training was an enhanced cascade system that taught teachers to use the scripted lessons, use teachers’ guides, develop teaching-learning materials and the TLAs provided by the project. To avoid taking teachers away from their classes training periods were held on Saturdays, initially for the whole day and later reduced to five hours per session.
Instructional innovations in ApaL include providing teachers a simple structure to be repeated and 12 Key word cards are self-made teaching aids with words on them to practice fluency. 13 Decodable books are small, inexpensive, four- or six-page books with controlled text difficulty that the students are allowed to take home but must bring back. Almost 900,000 of them were distributed to the treatment schools.
USAID/Aprender a Ler Impact Evaluation: Midline 2 Report 4
followed every day in every reading class. The repetition of the seven steps to conduct the lesson facilitates internalizing a manner of teaching and favors sustainability. Application of what was learned in the training was carried out in the teachers’ own classrooms with support and coaching from trainers and supervisors. Reflections on the practice were made during the subsequent training session when trainers introduced new concepts and strategies. This “learn-practice-debrief” format is one of the hallmarks of the ApaL approach to training.
In the Full treatment schools, school management and leadership is enhanced through the training and coaching of SDs and the provision of a school management toolkit. To improve reading outcomes, ApaL reinforces critical reading instruction improvement efforts with a school management focus. These interventions are designed to increase the quantity of improved reading instruction children receive. Therefore, ApaL school management interventions empower SDs with a combination of knowledge, skills and abilities on planning, management, communication, and leadership.
In addition, to ensure that new leadership practices and management routines become a natural part of the SDs’ daily practice, ApaL implemented a Peer Coaching model at the ZIP-level (i.e. school clusters) through a coaching program to provide regular, practical follow-up for SDs at the school-level.
The nine In-Service Teaching (INSET) session themes are as follows:
1. Leadership and management 2. Improving reading instruction 3. Community engagement 4. Giving and receiving feedback 5. Gender awareness 6. Addressing teacher attendance 7. Addressing student attendance 8. Effective communication 9. Annual review of school processes
In order to increase student instructional time, SDs were trained and monitored throughout 2014 on the implementation of time saving routines:
• Regular school assembly: SDs were oriented to start the assembly well in advance of the official shift start time, ensure that school cleaning activities are conducted prior to the assembly, verify that teachers arrive prior to the assembly, and have students and teachers disperse promptly to their respective classrooms at the conclusion of the assembly.
• Use of regular bell schedule: In order to effectively manage school start times and the intervals between 45-40 minute instruction periods, SDs were oriented on the use of a regular bell schedule to mark these times.
• Routines for managing students of absent teachers: To address absenteeism, SDs were oriented on practical strategies such as joining classes or providing pre-planned learning activities.
• Use of School Management Tools: SDs have received training on the use of a set of School Management Tools (SMTs) that allow the tracking of indicators related to quantity of instruction and support for reading improvements.
• TLA management. SDs have received training on how to maintain an inventory, keep track and store TLAs so that they are available to teachers when necessary.
The ApaL program has developed a set of easy-to-use School Management Tools (SMTs) to facilitate the collection of data that can be used by SDs to track progress on established goals relating to the quantity and quality of instruction in their schools. The school management toolkit currently consists of eight instruments designed to record operational data for review by the SD and school staff, during SD INSET sessions, during coaching visits by ZIP coordinators and by USAID ApaL and Instituto de Formação de Professores (Teacher Training College) IFP management trainers:
USAID/Aprender a Ler Impact Evaluation: Midline 2 Report 5
• Monthly teacher attendance register • Monthly teacher arrival register • Monthly student attendance register • Monthly teacher coaching register • ApaL teaching and learning materials inventory • TLA usage register • Weekly summary form • Monthly summary form
Additional support is provided to strengthen the technical capacity of Local Education Institutions (LEIs) through training workshops and coaching. The project does not provides financial support to LEIs but provides meals and transport support to participants of the training, and some per diem and transport support to LEI staff who do the coaching and monitoring to facilitate organization of training workshops. APaL also provides quality support visits, as well as underwrites the development, production and distribution of all materials mentioned above.
An important part of the overall monitoring and evaluation (M&E) system for USAID ApaL is regular collection of data at school level. These data are collected to provide: (1) Data for select indicators (e.g., attendance, student reading ability, management routines implemented, etc.); (2) Important feedback to USAID ApaL on the level of program implementation in schools (e.g., whether teachers are implementing continuous assessment as planned or using TLAs); and, (3) feedback to program stakeholders (SDEJT, DPEC, IFP, and school directors in Full treatment schools) regarding the level and quality of program implementation and indicators related to reading and school management outcomes (e.g., student fluency levels and teacher and student attendance rates). USAID ApaL Reading, School Management, Institutional Capacity Building, and M&E teams worked together to develop the Rapid Assessment Tool. This tool is a condensed version of the EGRA/School Management Assessment (SMA) instrument and facilitates data collection on the three sets of indicators related to teachers, students and school management.
Examples of teacher indicators are the percentage of teachers receiving coaching visits, implementing the written assessment and using TLAs (Alphabet Chart, Key Word Cards, Read Aloud Books, Decodable Books, Letter/Word Charts). Student indicators include reading fluency, letter reading (grade 2) measured in letters per minute and word reading (grade 3) measured in words per minute. Finally for school management indicators data are collected on absence or presence of the school director, minutes late for start time of shift, SD use of School Management Tools (SMTs), teacher attendance and arrival register (include INSET attendance) student attendance register, monthly Teacher Coaching Register and management of TLAs.
The Rapid School Assessment (RSA) is designed to allow one person to collect all the data in a school in less than two hours and to cover about three schools per day. Teams arrive in schools prior to the start of the first shift to observe the start of the day. In each randomly selected classroom, a total of five students are randomly selected to participate in the fluency assessments. The assessments were developed by USAID ApaL Senior Reading Expert and consist of a simple timed one-minute oral assessment of letter recognition for grade 2 students and of word recognition for grade 3 students. Data are collected using a smartphone equipped with the Magpi data collection application making the process of data collection, data entry, data analysis, and the presentation of results extremely efficient.
USAID/Aprender a Ler Impact Evaluation: Midline 2 Report 6
3. METHODOLOGICAL OVERVIEW In this section we describe the methodology utilized to conduct the Impact Evaluation of the USAID Aprender a Ler project. We provide an overview of the research approach, describe the sampling strategy, and detail the instruments utilized for data collection. Section 3 also advances the methods of analyses used and addresses their adequacy to the research questions and to the data collected.
3.1 Research Approach The findings presented in this report are based on the analyses performed on systematically collected data from a random sample of 180 schools (60 control and 120 intervention schools) participating in the ApaL project from January 2013 to the end of the 2014 school year. In districts selected by USAID ApaL along the economic corridors of the Nampula and Zambézia provinces, three groups of ZIPs and the schools clustered around each ZIP were randomly assigned to either Full or Medium treatment groups or to a no treatment or Control group.
From mid-February to mid-March 2013, prior to the start of the intervention, data were collected on the180 schools included in the sample. In October 2013 a second data collection event took place at the same 180 schools after approximately two months of intervention, essentially on a pilot basis, near the end of the 2013 school year. At the end of the 2014 school year (September 2014), data were again collected in the same schools in order to capture the impact of one full school year of exposure to treatment and compare results to those obtained by students in the Control schools that did not have the benefit of the project. Although the school year ended on November 14, 2014, the data were collected in the first three weeks of September, about seven weeks prior to the end of the school year to avoid potential challenges of data collection during the presidential elections in October. We also seek to determine whether the additional School Management component added to the Full treatment schools resulted in added benefit to students.
The primary outcome of interest of the study is student level of reading competency. To assess student reading skills, the Early Grade Reading Assessment (EGRA) tool was administered by trained supervised assessors to ten randomly selected Grade 2 and 10 randomly selected Grade 3 students in randomly selected classrooms of the sampled schools. The IE focused on student reading outcomes first and then, in order to address the multiple domains of interest in this study, on a number of variables that could explain the results obtained. These variables included student characteristics, teacher instructional performance during the reading instruction period, availability and utilization of teaching-learning aids (TLAs), and observable school management practices that could be related to the Full treatment intervention.
In line with the 2011 USAID Evaluation Policy and associated USAID documents and general best practice in measuring causal impacts, the IE utilizes a randomized controlled trial (RCT) methodology with a counterfactual—e.g., a control group similar to the treatment groups—to estimate the impact of the project and assess what would have occurred without the intervention. The IE is testing USAID/Mozambique‘s development hypothesis that reading outcomes in grades 2 and 3 improve when the quality and quantity of reading instruction in those grades are expanded.
The general specification of the IE model is based on the evaluation objective of assessing the extent to which the Aprender a Ler intervention has improved early grade (second and third grade) reading outcomes as measured by the EGRA. The model treats early grade reading outcomes as a function of the Medium and Full interventions and the development hypothesis is tested under three scenarios: with the Medium treatment sample, with the Full treatment sample, and with the Control group sample. To examine this hypothesis, the IE compares reading scores in schools that have received the Full and the Medium treatment to those that did not receive any intervention. The results obtained at the Control schools represent the level of reading skills to be expected without the benefit of ApaL. Comparisons between reading scores obtained by students in the Full treatment schools and those observed in the
USAID/Aprender a Ler Impact Evaluation: Midline 2 Report 7
Medium treatment schools allows us to determine whether complementing teacher training and coaching and TLAs with school director training and coaching in school management improves student reading scores sufficiently to justify the added cost of the intervention.14
The use of RCT methodology is the most effective way to measure the impact of a project or program for three main reasons. First, it allows for direct attribution of the Aprender a Ler interventions to improve outcomes because the RCT model controls for all other possible determinants of the outcomes. Second, the random sampling component of RCT eliminates the effects of potential unobservable differences between treatment and control groups on the outcomes. Third, an RCT is a rigorous evaluation method to obtain accurate and valid results to inform plans to scale up the most effective and cost-effective interventions.
The quantitative data collected through the EGRA administration answers questions such as who was involved (second and third grade students), where (180 schools in two provinces), and how much (scores obtained and gains in scores). Additional questions such as what and how require the description of the intervention and the collection of qualitative data. In the case of ApaL, collecting these data involved talking to and observing teachers and the school environment (e.g., when instruction begins, delays in the start of the school day, school management routines utilized by the school directors, etc.).The results provided by ApaL have been integrated into this report, as has the information obtained by the interviewing of 94 school and pedagogical directors conducted by the IE key staff and supervisors.
In conclusion, the main objective of the IE is to measure the causal effect of USAID ApaL treatment interventions on early grade reading outcomes in grades 2 and 3 in 180 targeted schools. The evaluation is testing two treatment interventions against a Control group that has not received any of the interventions. One treatment intervention, the Medium treatment model, includes training, coaching, classroom materials, and support in improved reading instruction methodology for teachers. The second treatment intervention, the Full treatment model, supplements what was provided to the Medium treatment schools with additional school management training, coaching and support for school directors.
EGRA scores obtained at Baseline and Midline 1 are reported and discussed to contextualize the conditions under which ApaL began operating and, in the case of the Baseline, to show the equivalence of the groups prior to ApaL implementation. It must be noted that the Baseline data were collected in February-March after the long school vacation and before students started Grade 2 or 3 instruction and the IE does not follow a pre/post design (prior and after intervention). Rather, it uses the observed differences between gains in treatment and Control groups to determine the impact of the project.
3.2 Impact Evaluation Questions
The main evaluation question to be addressed by the Impact Evaluation (IE) is stated as: To what extent have USAID Aprender a Ler treatment interventions improved early grade reading outcomes for students in second and third grades in the target schools in the Nampula and Zambézia Provinces?
From this general guiding question flows a set of focused questions to be answered by the Impact Evaluation.
1. To what extent does the “reading instruction support” treatment intervention cause early grade reading outcomes to improve for students in grades two and three in target schools whose teachers have received training, coaching and support?
14 As part of ApaL’s design, none of the 180 schools will receive USAID/ApaL interventions in the 2015 school year. This makes possible the assessment of whether the ApaL activities implemented can be sustained without the project’s financial and technical resources.
USAID/Aprender a Ler Impact Evaluation: Midline 2 Report 8
2. To what extent does the treatment intervention of additional “school management training, coaching and support to school directors” cause a significant and additional improvement in early grade reading outcomes when coupled with “reading instruction” in target schools?
3. To what extent are the Medium and Full treatment interventions cost-effective? 4. Of the most cost-effective interventions, which falls within the existing technical and financial
management capacity of local education institutional personnel?
To answer Question 1 requires a comparison between scores obtained by second and third graders in Medium Treatment and in Control schools. Question 2 requires a comparison between scores obtained by second and third graders in Medium Treatment and in Full Treatment schools. Question 3, cost-effectiveness, is answered in Section 5 of this report. Question 4, sustainability, can only be answered at the end of 2015, after ApaL ceases its direct involvement with the schools in the sample.
3.3 Data Collection Instruments
Based on the data requirements for the Impact Evaluation, five instruments were adapted or developed to collect the necessary data. These instruments are attached in the Annexes.
1. EGRA Instrument—administered to 3,475 randomly selected students (Annex A); 2. Student Interview Protocol—administered to each student selected for assessment; 3. Teacher Interview—administered to the teachers whose students were selected for assessment
(Annex D); 4. School Management Assessment (SMA) package (Annex B), which includes the SD structured
interview (Annex E), the Classroom Observation Instrument (Annex C), and the Classroom Inventory;
5. Semi-Structured Interview Protocol—administered to 94 school and pedagogical directors.
3.3.1 Early Grade Reading Assessment (EGRA) Instrument
The ability to read and understand a simple text is one of the most fundamental skills a child can learn. Yet, measuring early reading can be challenging since most tests are administered in higher grades, such as grades 4 or 6. Because these tests are aimed at higher-level skills, they are not likely to capture the specific fundamental or emerging skills that students need to become fluent readers.15 Early assessment of the pre-reading and foundational skills required for fluency allows the implementation of measures to correct deficiencies where they exist.16
The Early Grade Reading Assessment (EGRA) tool offers an opportunity to determine whether students in the early grades are developing the fundamental reading skills, and, if not, where efforts might be best directed. The EGRA has been adapted and used in over 50 countries and can capture more subtle impacts from specific teaching approaches than pencil-and-paper tests, as it incorporates subtasks that measure pre-reading skills.17
The assessments are administered orally and individually, when needed using the students’ native language to ensure that they understand the instructions for each task. In Mozambique, the ApaL enumerators were instructed to use the local language of the student, when necessary to explain the task. However, given that the language of instruction at schools is Portuguese, the test itself was
15 Emergent reading skills are “skills, knowledge, and attitudes that are developmental precursors to conventional forms of reading and writing. These skills are the basic building blocks for how students learn to read and write.” (Connor et al, 2006, p. 665). 16 Abadzi, Helen. (2009). “Instructional Time Loss in Developing Countries: Concepts, Measurement, and Implications.” World Bank Research Observer. 24 (2): 267-290. 17 The Early Grade Reading Assessment (EGRA) is a 15-minute test originally developed by the Research Triangle Institute (RTI) administered orally to students in the early grades of primary school. As pointed out by RTI, the EGRA evaluates students’ foundational reading skills, including pre-reading skills like phonemic awareness and listening comprehension, which have been shown to predict later reading abilities. Research Triangle Institute (RTI), www.rti.org
USAID/Aprender a Ler Impact Evaluation: Midline 2 Report 9
conducted in Portuguese. Administering the EGRA Instrument for grade 2 and grade 3 took between15 and 25 minutes per child.
Brief Explanation of EGRA Sub-tasks. The EGRA assessed children’s competency in six sub-tasks explained below.
1. Oral comprehension measures ability to understand basic Portuguese oral vocabulary. The first part of this subtask includes 8 prompts that required students to perform an action (e.g., “show me your arm”). A second part, with a maximum score of 6, requests that students follow instructions given orally (e.g., “place the pencil on the paper”). The maximum score is 14.
2. Concepts about print (CAP) measures children’s emergent reading skills by asking them to demonstrate how they read a book—recognition of the front and back covers, direction in which to read, identifying the title of the story, location of page numbers, etc.18 The maximum score was 10.
3. Letter recognition assessed ability to provide the names of the letters of the alphabet naturally and without hesitation. This is a timed test that assesses automaticity and fluency of letter recognition and measured in letter names correct per minute. Students were shown a chart containing 10 rows of 10 random letters (in uppercase and lowercase) and asked to name as many letters as they could 19 within one minute yielding a score of correct letters read per minute (clpm).
4. Familiar word reading assessed students’ skill at reading high-frequency words. Recognizing familiar words is critical for developing reading fluency. In this timed subtask, children were asked to sound out as many words (in a list of 30) as they could within one minute, yielding a score of correct words per minute (cwpm).20
5. Oral passage reading assessed students’ fluency in reading a passage of grade-level aloud and their ability to understand what they read. There are two parts to this subtask:
a. Oral reading fluency: As described above, the ability to read passages fluently is considered a necessary component of reading comprehension. In this subtask, students were given a second 120-word story and were asked to read aloud in one minute. The oral reading fluency score was the number of correct words read by minute (cwpm).
b. Reading comprehension: After the students finished the first passage, or the minute ended, the passage was removed. Students were orally asked four questions that required them to recall basic facts from the passage. The reading comprehension score was the number of correct answers with a maximum possible score of 4. When students were not able to read a minimum of 15 words of the first story, they were presented with a second story. The maximum total score for this subtask was 4.
Students selected to take the EGRA also responded to a brief, orally administered interview before they started the EGRA sub-tasks. The purpose of the interview was to gather information about the home and school contexts that might explain students’ reading performance. For example, students were asked about the language they most speak at home with their family and with their friends.
3.3.2 School Management Assessment (SMA) Instrument
The original SMA used at Baseline was adapted from the instrument used in Cabo Delgado in 2011 by the project funded by the Aga Khan Foundation. The instrument underwent extensive revisions in 2013 and again in 2014 for the Midline 2 administration. The main focus of the revised SMA for school management practice is to collect data (1) on indicators related to quantity of instruction (e.g. teacher
18 The assessor used a book in order to determine the students’ facility in handling printed material. 19 Letters were presented in either block or cursive formats (one type on each side of a large plasticized card) as familiarity with the two formats was found to vary during field-testing of the instrument. 20 To facilitate recognition, a large plasticized chart of 30 words of 1-3 syllables was presented to the student.
USAID/Aprender a Ler Impact Evaluation: Midline 2 Report 10
and student attendance, start time of school shift, SD and PD attendance) and (2) classroom teaching and learning processes, including instructional content, student-teacher interactions and use of TLAs. The purpose of the SMA is to produce a multifaceted and comprehensive picture of school management routines and of the school-learning environment.
3.4 Instrument Administration
Each instrument required a different procedure for administration. The training of enumerators focused on preparing the enumerators to collect reliable data21 and the supervisors to support the effort, advise the enumerators, clarify doubts and review all completed instruments to identify missing data or incorrect entries.
Training was conducted by ApaL senior staff with the participation of the IE Deputy Team Leader and the IE supervisors. The two IE supervisors, one per province, are senior GSC staff. Supervisor training was conducted on August 18-19 in Nampula and August 22-23 in Zambézia. Enumerator training was conducted in August 25-29. Over half of the enumerators trained had participated in both the training and in the prior data collection events (Baseline and Midline). Data collection started on September 1 and was finalized by September 25. Besides participating in training, the supervisors made the rounds of the schools visited, observing the work of the different enumerator teams, calling attention to incorrect procedures, if any, and conducting interviews with school directors.
3.4.1 EGRA and Student Interview Administration
The EGRA administration started by randomly selecting among the grade 2 and 3 classes in the school—when there was more than one class—one second grade and one third grade class to participate in the assessment. After selecting the class, the enumerator spoke to the teacher and if necessary explained the purpose of the visit. Next, children were organized in rows and the enumerator would randomly select the ten students to be assessed. When there were ten or fewer students, all were selected for participation. The enumerator would then take the child to a quiet place to administer the EGRA. The detailed process to select the ten students to be assessed was the same utilized previously and is described in detail in the Baseline and Midline reports. As this is an RCT, although data on gender were collected, gender played no role in the process of selecting classes or students for participation.
3.4.2 Teacher Interview
One of the enumerators administered face-to-face interview with the teacher whose class had been selected for EGRA administration. The interview included 33 items, which included questions regarding teaching experience, pre- and in-service training, use of local language to facilitate teaching, use of class management tools, etc.
3.4.3 School Director Interview
This interview was conducted face-to-face with the school director, or when he/she was not present at the school, with the assistant director or the pedagogical director.22 Some items required school directors to present proof of the answers they gave. For example, when asked whether they recorded teacher or student attendance or tardiness, they were asked to show the logs or forms used for this purpose.
3.4.4 Reading Class Observation
The focus on the observation was on the instructional behaviors exhibited by the teacher during one full reading class period. The enumerator used a structured observation protocol that listed reading instruction behaviors promoted by ApaL in the teacher training sessions. Instrument administration 21 Validity of the instruments as well as their ease of administration had already been established prior to the training. 22 Pedagogical directors are often also assistant directors. Their primary responsibility is to assist teachers with methodological issues and to fill in for school directors when they are absent. In many cases they are the deputy directors.
USAID/Aprender a Ler Impact Evaluation: Midline 2 Report 11
required that the enumerator arrive at the scheduled time for the class to start, record the time the class started and stay until the scheduled time for the class to end—about 45 minutes.
3.4.5 Classroom Inventory
The enumerator who conducted the classroom observation also filled out the classroom inventory. The purpose of the instrument was to capture information to describe the classroom environment—seating patterns, materials posted on the walls, materials available to students, etc.
3.4.6 School Observation
The overall context of the school environment is important, and school observations began with arrival of the supervisor/enumerator teams at a school at least 15 minutes prior to the scheduled start of the school day in order to determine whether teachers and school directors arrived on time and, if late, how late they were. The completion of this instrument required the supervisor to move around the school and fill in the information as various aspects of the school were observed.
3.4.7 Interview with School/Pedagogical Directors
A semi-structured interview protocol was developed by the IE team and administered under the IE Deputy Team Leader’s guidance by the IE supervisors. The interview protocol focused on the directors’ assessment of the benefits accrued by participating in ApaL and on their perception of which activities or procedures impacted student reading ability and had been internalized to the point of being sustainable once ApaL ceased its involvement with the school.
3.5 Data Analysis
3.5.1 Analysis of the Class Observation Data
A preliminary analysis was provided to the IE team by the implementer and the IE team conducted further analyses. The steps followed by the IE are described here and the results are included in the Findings section.
The Class Observation instrument groups its 49 items into five sections:
1. Teacher-student interaction (12 items) 2. Teaching decoding (9 items) 3. Teaching comprehension (10 items) 4. Classroom management (10 items) 5. Teaching planning and sequence (8 items)
After examining the frequencies of positive responses to the individual items, it was found that many items in each category were scored very highly. Furthermore, multiple items had been included per section to describe a set of observable teacher behaviors and some items showed weak inter-item correlation or had little discriminatory power.23 To solve these problems, an index or a composite score per section was created to summarize teacher performance within each section. This was done by first determining the relative “difficulty” of a positive behavior across all 319 observations.
Thus, a simple behavior demonstrated by most teachers received less weight in the composite score than more difficult positive behaviors observed among fewer teachers.24 These weights were then applied to each item response to each teacher in each category. This allowed us both to compare means overall and to conduct inter-group comparisons in accordance with the IE model. The results obtained
23 What is usually done is to calculate Chronbach's Alpha and delete items that correlate least with the other items in the test or in the block of items until an Alpha of an acceptable standard (usually 0.7 or above) is obtained. 24 Item difficulty can range from 0.0 (none of the teachers answered the item correctly) to 1.0 (all of the teachers answered the item correctly).
USAID/Aprender a Ler Impact Evaluation: Midline 2 Report 12
express the proportion or percentage of teachers who answered the item correctly weighted by the difficulty of the item. The ANOVA, Tukey post-hoc comparisons were used to compare groups.
3.5.2 Analysis of the Qualitative Interview Data Conducted by the IE team
The interviews with 94 school/pedagogical directors were recorded with the permission of the interviewees and then transcribed to facilitate analysis. To analyze the data we took the following steps:
1. Read the transcribed interviews and identify recurrent themes or the idea categories that emerged from the data;
2. Note patterns in the data by examining the content of each response in order to categorize verbal data for the purpose of classification, summarization and tabulation;
3. Code the data by attaching labels to the lines of text in order to group and compare similar or related pieces of information and then compile similar blocks of text from different sources into a single file;
4. Search data for answers to the research questions.
3.6 Limitations of the Study
As with all research projects there is the need to tell the reader the factors that limit the study and to what extent the findings can be generalized. These factors could be related to the methodology or to the data collection and analysis. In retrospect, there are a few, specific limitations of this study which should be mentioned as a means for improvement or potential strategies for further studies to be conducted.
The first limitation is related to the design of the IE and to the data collected. By obtaining the data only in a set of ZIPs along the economic corridors of Nampula and Zambézia, at a pre-defined number of schools (180), and in schools that could be accessible to the implementer, bias was introduced with respect to proximity to roads. Obviously, the characteristics of the schools are not the same where the impacts of roads are not felt. This is not critical to the overall accuracy assessment since ZIPs were randomly assigned to the “Full”, “Medium”, and “Control” groups and all schools within a ZIP were assigned to a specific treatment group, however, it is important to mention.
Also, by design, the Baseline data collection took place in the first months of the school year. Even though we refer to second and third grade performance it must be remembered that the participating students were only beginning the second and the third grades and, therefore, their reading ability level is closer to what is expected from first and second graders at the end of the school year. Moreover, they were returning from the long summer vacation. Thus, the Baseline results allow us to observe learning gains over the course of a school year. These comparisons have been made and are presented in details in the Midline 1 report.
A third and probably most important limitation associated with this study refers to the methodology itself. The RCT methodology presupposes a number of schools in each group, randomly allocated to treatment or control groups. However, as pointed out by Scriven (2008)25 “any two such groups will always be distinguished by some factors, (e.g., location) and these unavoidable distinguishing factors may be linked in an unexpected way to causally relevant differentiating factors such as local variations in weather or room temperature, or ambient noise level, or facilities management style, which then invalidate the inference to the experimental treatment as being the only possible cause of any outcome differences.” These factors only surface during the course of running an RCT.
Finally, Hawthorne-type effects may pose threats to the study.26 It may be worth recalling the experiment done in the early days of placebo studies that showed that the placebo effect works even if 25 Scriven, M. (2008). A Summative Evaluation of RCT Methodology and an Alternative Approach to Causal Research. Journal of Multidisciplinary Evaluation, Vol 5, No 9, March 8. http//www.jmde.com 26 The Hawthorne effect has been well established in the empirical literature beyond the original studies.
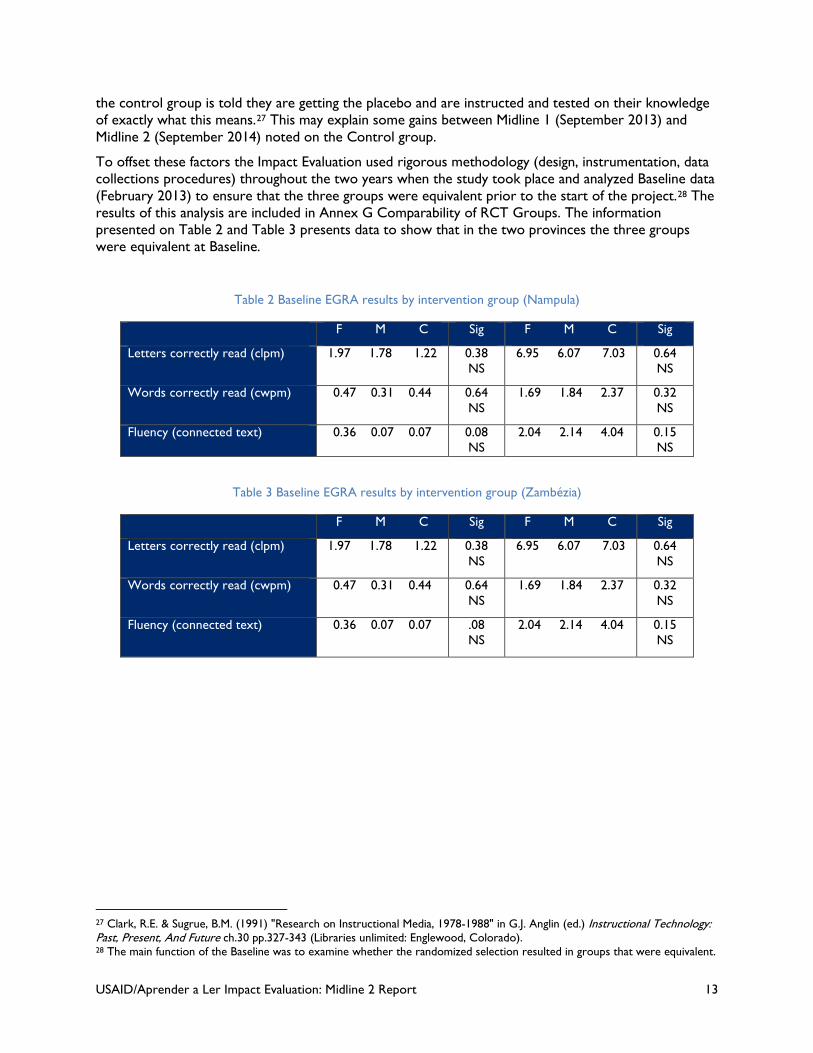
USAID/Aprender a Ler Impact Evaluation: Midline 2 Report 13
the control group is told they are getting the placebo and are instructed and tested on their knowledge of exactly what this means.27 This may explain some gains between Midline 1 (September 2013) and Midline 2 (September 2014) noted on the Control group.
To offset these factors the Impact Evaluation used rigorous methodology (design, instrumentation, data collections procedures) throughout the two years when the study took place and analyzed Baseline data (February 2013) to ensure that the three groups were equivalent prior to the start of the project.28 The results of this analysis are included in Annex G Comparability of RCT Groups. The information presented on Table 2 and Table 3 presents data to show that in the two provinces the three groups were equivalent at Baseline.
Table 2 Baseline EGRA results by intervention group (Nampula)
F M C Sig F M C Sig
Letters correctly read (clpm) 1.97 1.78 1.22 0.38 NS
6.95 6.07 7.03 0.64 NS
Words correctly read (cwpm) 0.47 0.31 0.44 0.64 NS
1.69 1.84 2.37 0.32 NS
Fluency (connected text) 0.36 0.07 0.07 0.08 NS
2.04 2.14 4.04 0.15 NS
Table 3 Baseline EGRA results by intervention group (Zambézia)
F M C Sig F M C Sig
Letters correctly read (clpm) 1.97 1.78 1.22 0.38 NS
6.95 6.07 7.03 0.64 NS
Words correctly read (cwpm) 0.47 0.31 0.44 0.64 NS
1.69 1.84 2.37 0.32 NS
Fluency (connected text) 0.36 0.07 0.07 .08 NS
2.04 2.14 4.04 0.15 NS
27 Clark, R.E. & Sugrue, B.M. (1991) "Research on Instructional Media, 1978-1988" in G.J. Anglin (ed.) Instructional Technology: Past, Present, And Future ch.30 pp.327-343 (Libraries unlimited: Englewood, Colorado). 28 The main function of the Baseline was to examine whether the randomized selection resulted in groups that were equivalent.
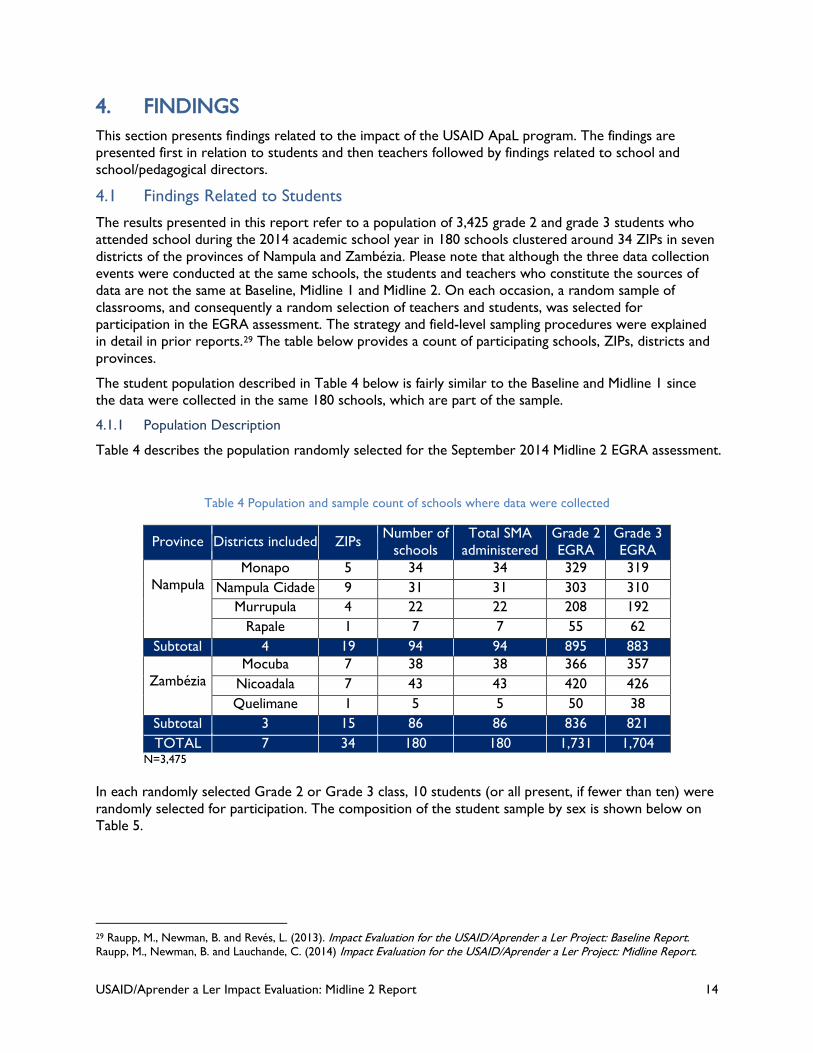
USAID/Aprender a Ler Impact Evaluation: Midline 2 Report 14
4. FINDINGS This section presents findings related to the impact of the USAID ApaL program. The findings are presented first in relation to students and then teachers followed by findings related to school and school/pedagogical directors.
4.1 Findings Related to Students
The results presented in this report refer to a population of 3,425 grade 2 and grade 3 students who attended school during the 2014 academic school year in 180 schools clustered around 34 ZIPs in seven districts of the provinces of Nampula and Zambézia. Please note that although the three data collection events were conducted at the same schools, the students and teachers who constitute the sources of data are not the same at Baseline, Midline 1 and Midline 2. On each occasion, a random sample of classrooms, and consequently a random selection of teachers and students, was selected for participation in the EGRA assessment. The strategy and field-level sampling procedures were explained in detail in prior reports.29 The table below provides a count of participating schools, ZIPs, districts and provinces.
The student population described in Table 4 below is fairly similar to the Baseline and Midline 1 since the data were collected in the same 180 schools, which are part of the sample.
4.1.1 Population Description
Table 4 describes the population randomly selected for the September 2014 Midline 2 EGRA assessment.
Table 4 Population and sample count of schools where data were collected
Province Districts included ZIPs Number of schools
Total SMA administered
Grade 2 EGRA
Grade 3 EGRA
Nampula
Monapo 5 34 34 329 319 Nampula Cidade 9 31 31 303 310
Murrupula 4 22 22 208 192 Rapale 1 7 7 55 62
Subtotal 4 19 94 94 895 883
Zambézia Mocuba 7 38 38 366 357
Nicoadala 7 43 43 420 426 Quelimane 1 5 5 50 38
Subtotal 3 15 86 86 836 821 TOTAL 7 34 180 180 1,731 1,704
N=3,475 In each randomly selected Grade 2 or Grade 3 class, 10 students (or all present, if fewer than ten) were randomly selected for participation. The composition of the student sample by sex is shown below on Table 5.
29 Raupp, M., Newman, B. and Revés, L. (2013). Impact Evaluation for the USAID/Aprender a Ler Project: Baseline Report. Raupp, M., Newman, B. and Lauchande, C. (2014) Impact Evaluation for the USAID/Aprender a Ler Project: Midline Report.
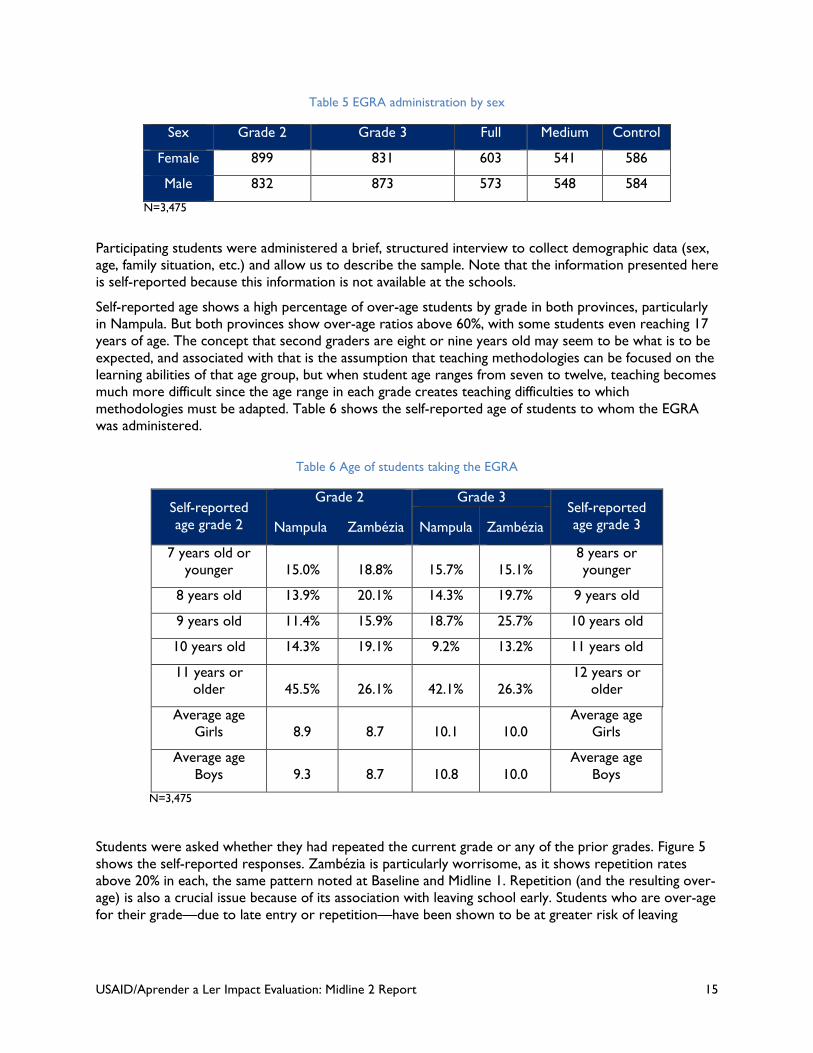
USAID/Aprender a Ler Impact Evaluation: Midline 2 Report 15
Table 5 EGRA administration by sex
Sex Grade 2 Grade 3 Full Medium Control
Female 899 831 603 541 586
Male 832 873 573 548 584
N=3,475
Participating students were administered a brief, structured interview to collect demographic data (sex, age, family situation, etc.) and allow us to describe the sample. Note that the information presented here is self-reported because this information is not available at the schools.
Self-reported age shows a high percentage of over-age students by grade in both provinces, particularly in Nampula. But both provinces show over-age ratios above 60%, with some students even reaching 17 years of age. The concept that second graders are eight or nine years old may seem to be what is to be expected, and associated with that is the assumption that teaching methodologies can be focused on the learning abilities of that age group, but when student age ranges from seven to twelve, teaching becomes much more difficult since the age range in each grade creates teaching difficulties to which methodologies must be adapted. Table 6 shows the self-reported age of students to whom the EGRA was administered.
Table 6 Age of students taking the EGRA
Self-reported age grade 2
Grade 2
Nampula Zambézia
Grade 3 Self-reported age grade 3 Nampula Zambézia
7 years old or younger 15.0% 18.8% 15.7% 15.1%
8 years or younger
8 years old 13.9% 20.1% 14.3% 19.7% 9 years old
9 years old 11.4% 15.9% 18.7% 25.7% 10 years old
10 years old 14.3% 19.1% 9.2% 13.2% 11 years old
11 years or older 45.5% 26.1% 42.1% 26.3%
12 years or older
Average age Girls 8.9 8.7 10.1 10.0
Average age Girls
Average age Boys 9.3 8.7 10.8 10.0
Average age Boys
N=3,475
Students were asked whether they had repeated the current grade or any of the prior grades. Figure 5 shows the self-reported responses. Zambézia is particularly worrisome, as it shows repetition rates above 20% in each, the same pattern noted at Baseline and Midline 1. Repetition (and the resulting over-age) is also a crucial issue because of its association with leaving school early. Students who are over-age for their grade—due to late entry or repetition—have been shown to be at greater risk of leaving
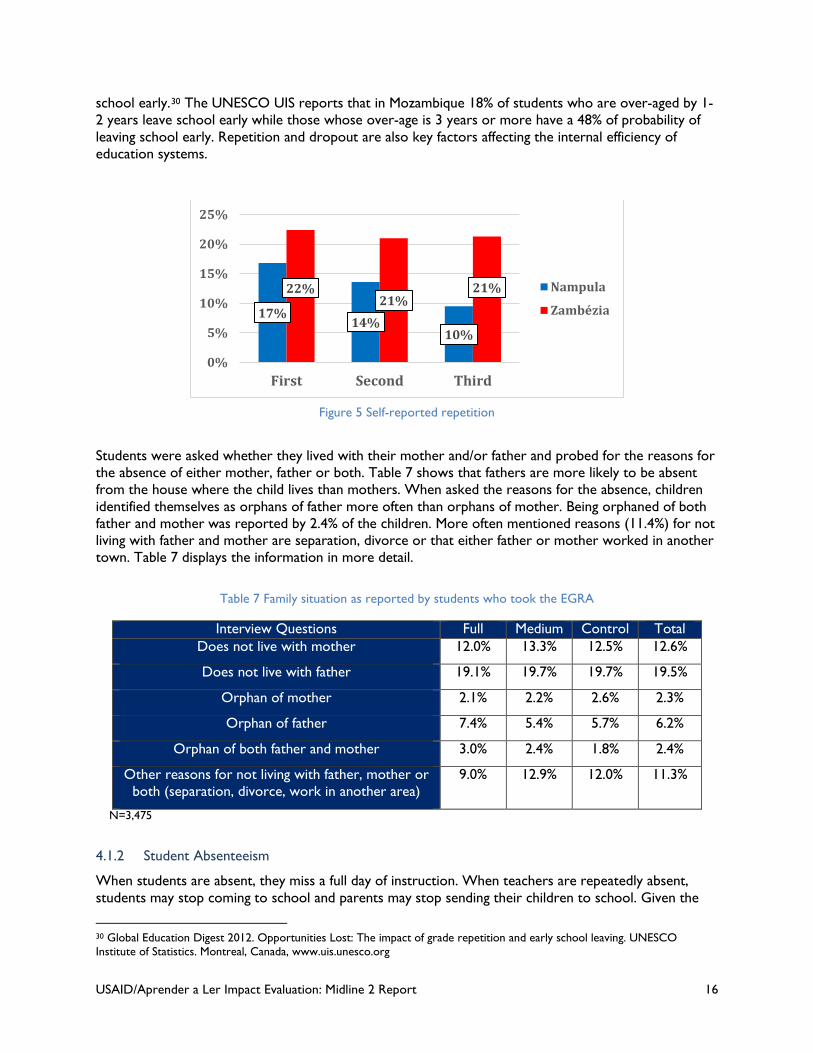
USAID/Aprender a Ler Impact Evaluation: Midline 2 Report 16
school early.30 The UNESCO UIS reports that in Mozambique 18% of students who are over-aged by 1-2 years leave school early while those whose over-age is 3 years or more have a 48% of probability of leaving school early. Repetition and dropout are also key factors affecting the internal efficiency of education systems.
Figure 5 Self-reported repetition
Students were asked whether they lived with their mother and/or father and probed for the reasons for the absence of either mother, father or both. Table 7 shows that fathers are more likely to be absent from the house where the child lives than mothers. When asked the reasons for the absence, children identified themselves as orphans of father more often than orphans of mother. Being orphaned of both father and mother was reported by 2.4% of the children. More often mentioned reasons (11.4%) for not living with father and mother are separation, divorce or that either father or mother worked in another town. Table 7 displays the information in more detail.
Table 7 Family situation as reported by students who took the EGRA
Interview Questions Full Medium Control Total Does not live with mother 12.0% 13.3% 12.5% 12.6%
Does not live with father 19.1% 19.7% 19.7% 19.5%
Orphan of mother 2.1% 2.2% 2.6% 2.3%
Orphan of father 7.4% 5.4% 5.7% 6.2%
Orphan of both father and mother 3.0% 2.4% 1.8% 2.4%
Other reasons for not living with father, mother or both (separation, divorce, work in another area)
9.0% 12.9% 12.0% 11.3%
N=3,475
4.1.2 Student Absenteeism
When students are absent, they miss a full day of instruction. When teachers are repeatedly absent, students may stop coming to school and parents may stop sending their children to school. Given the
30 Global Education Digest 2012. Opportunities Lost: The impact of grade repetition and early school leaving. UNESCO Institute of Statistics. Montreal, Canada, www.uis.unesco.org
17% 14%
10%
22% 21%
21%
0%
5%
10%
15%
20%
25%
First Second Third
Nampula
Zambézia
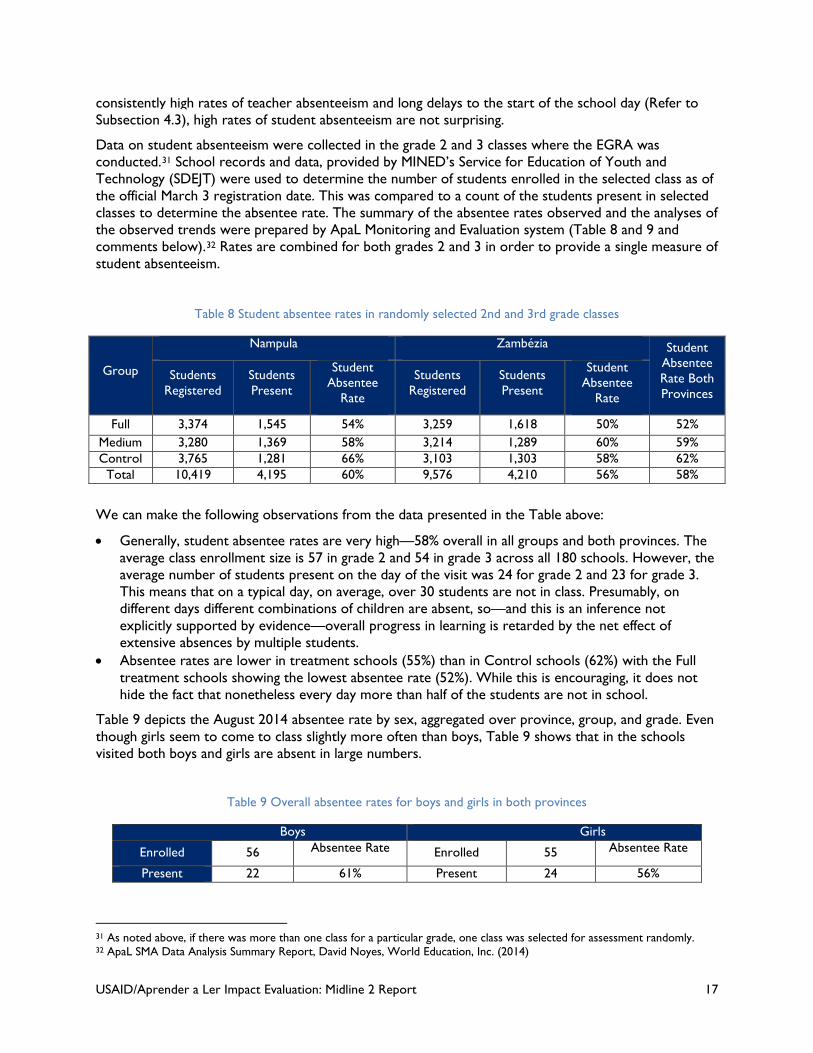
USAID/Aprender a Ler Impact Evaluation: Midline 2 Report 17
consistently high rates of teacher absenteeism and long delays to the start of the school day (Refer to Subsection 4.3), high rates of student absenteeism are not surprising.
Data on student absenteeism were collected in the grade 2 and 3 classes where the EGRA was conducted.31 School records and data, provided by MINED’s Service for Education of Youth and Technology (SDEJT) were used to determine the number of students enrolled in the selected class as of the official March 3 registration date. This was compared to a count of the students present in selected classes to determine the absentee rate. The summary of the absentee rates observed and the analyses of the observed trends were prepared by ApaL Monitoring and Evaluation system (Table 8 and 9 and comments below).32 Rates are combined for both grades 2 and 3 in order to provide a single measure of student absenteeism.
Table 8 Student absentee rates in randomly selected 2nd and 3rd grade classes
Group
Nampula Zambézia Student Absentee Rate Both Provinces
Students Registered
Students Present
Student Absentee
Rate
Students Registered
Students Present
Student Absentee
Rate
Full 3,374 1,545 54% 3,259 1,618 50% 52% Medium 3,280 1,369 58% 3,214 1,289 60% 59% Control 3,765 1,281 66% 3,103 1,303 58% 62%
Total 10,419 4,195 60% 9,576 4,210 56% 58%
We can make the following observations from the data presented in the Table above:
• Generally, student absentee rates are very high—58% overall in all groups and both provinces. The average class enrollment size is 57 in grade 2 and 54 in grade 3 across all 180 schools. However, the average number of students present on the day of the visit was 24 for grade 2 and 23 for grade 3. This means that on a typical day, on average, over 30 students are not in class. Presumably, on different days different combinations of children are absent, so—and this is an inference not explicitly supported by evidence—overall progress in learning is retarded by the net effect of extensive absences by multiple students.
• Absentee rates are lower in treatment schools (55%) than in Control schools (62%) with the Full treatment schools showing the lowest absentee rate (52%). While this is encouraging, it does not hide the fact that nonetheless every day more than half of the students are not in school.
Table 9 depicts the August 2014 absentee rate by sex, aggregated over province, group, and grade. Even though girls seem to come to class slightly more often than boys, Table 9 shows that in the schools visited both boys and girls are absent in large numbers.
Table 9 Overall absentee rates for boys and girls in both provinces
Boys Girls
Enrolled 56 Absentee Rate Enrolled 55 Absentee Rate
Present 22 61% Present 24 56%
31 As noted above, if there was more than one class for a particular grade, one class was selected for assessment randomly. 32 ApaL SMA Data Analysis Summary Report, David Noyes, World Education, Inc. (2014)
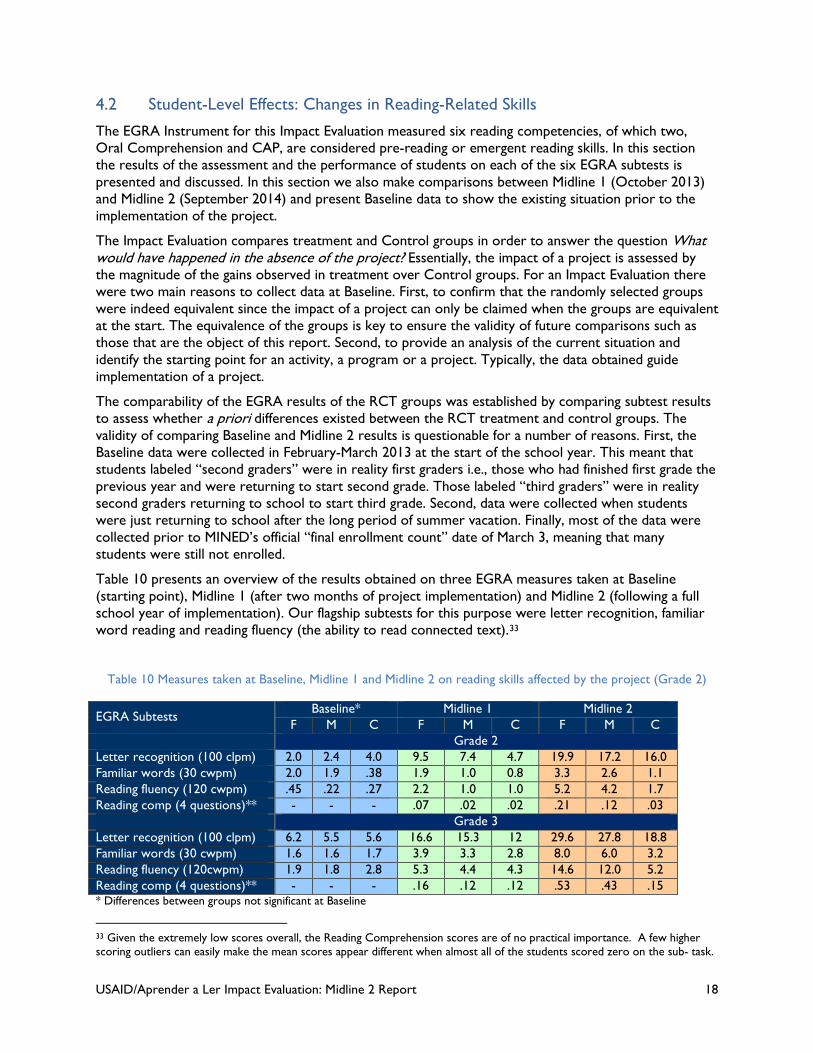
USAID/Aprender a Ler Impact Evaluation: Midline 2 Report 18
4.2 Student-Level Effects: Changes in Reading-Related Skills
The EGRA Instrument for this Impact Evaluation measured six reading competencies, of which two, Oral Comprehension and CAP, are considered pre-reading or emergent reading skills. In this section the results of the assessment and the performance of students on each of the six EGRA subtests is presented and discussed. In this section we also make comparisons between Midline 1 (October 2013) and Midline 2 (September 2014) and present Baseline data to show the existing situation prior to the implementation of the project.
The Impact Evaluation compares treatment and Control groups in order to answer the question What would have happened in the absence of the project? Essentially, the impact of a project is assessed by the magnitude of the gains observed in treatment over Control groups. For an Impact Evaluation there were two main reasons to collect data at Baseline. First, to confirm that the randomly selected groups were indeed equivalent since the impact of a project can only be claimed when the groups are equivalent at the start. The equivalence of the groups is key to ensure the validity of future comparisons such as those that are the object of this report. Second, to provide an analysis of the current situation and identify the starting point for an activity, a program or a project. Typically, the data obtained guide implementation of a project.
The comparability of the EGRA results of the RCT groups was established by comparing subtest results to assess whether a priori differences existed between the RCT treatment and control groups. The validity of comparing Baseline and Midline 2 results is questionable for a number of reasons. First, the Baseline data were collected in February-March 2013 at the start of the school year. This meant that students labeled “second graders” were in reality first graders i.e., those who had finished first grade the previous year and were returning to start second grade. Those labeled “third graders” were in reality second graders returning to school to start third grade. Second, data were collected when students were just returning to school after the long period of summer vacation. Finally, most of the data were collected prior to MINED’s official “final enrollment count” date of March 3, meaning that many students were still not enrolled.
Table 10 presents an overview of the results obtained on three EGRA measures taken at Baseline (starting point), Midline 1 (after two months of project implementation) and Midline 2 (following a full school year of implementation). Our flagship subtests for this purpose were letter recognition, familiar word reading and reading fluency (the ability to read connected text).33
Table 10 Measures taken at Baseline, Midline 1 and Midline 2 on reading skills affected by the project (Grade 2)
EGRA Subtests Baseline* Midline 1 Midline 2
F M C F M C F M C Grade 2 Letter recognition (100 clpm) 2.0 2.4 4.0 9.5 7.4 4.7 19.9 17.2 16.0 Familiar words (30 cwpm) 2.0 1.9 .38 1.9 1.0 0.8 3.3 2.6 1.1 Reading fluency (120 cwpm) .45 .22 .27 2.2 1.0 1.0 5.2 4.2 1.7 Reading comp (4 questions)** - - - .07 .02 .02 .21 .12 .03 Grade 3 Letter recognition (100 clpm) 6.2 5.5 5.6 16.6 15.3 12 29.6 27.8 18.8 Familiar words (30 cwpm) 1.6 1.6 1.7 3.9 3.3 2.8 8.0 6.0 3.2 Reading fluency (120cwpm) 1.9 1.8 2.8 5.3 4.4 4.3 14.6 12.0 5.2 Reading comp (4 questions)** - - - .16 .12 .12 .53 .43 .15 * Differences between groups not significant at Baseline
33 Given the extremely low scores overall, the Reading Comprehension scores are of no practical importance. A few higher scoring outliers can easily make the mean scores appear different when almost all of the students scored zero on the sub- task.
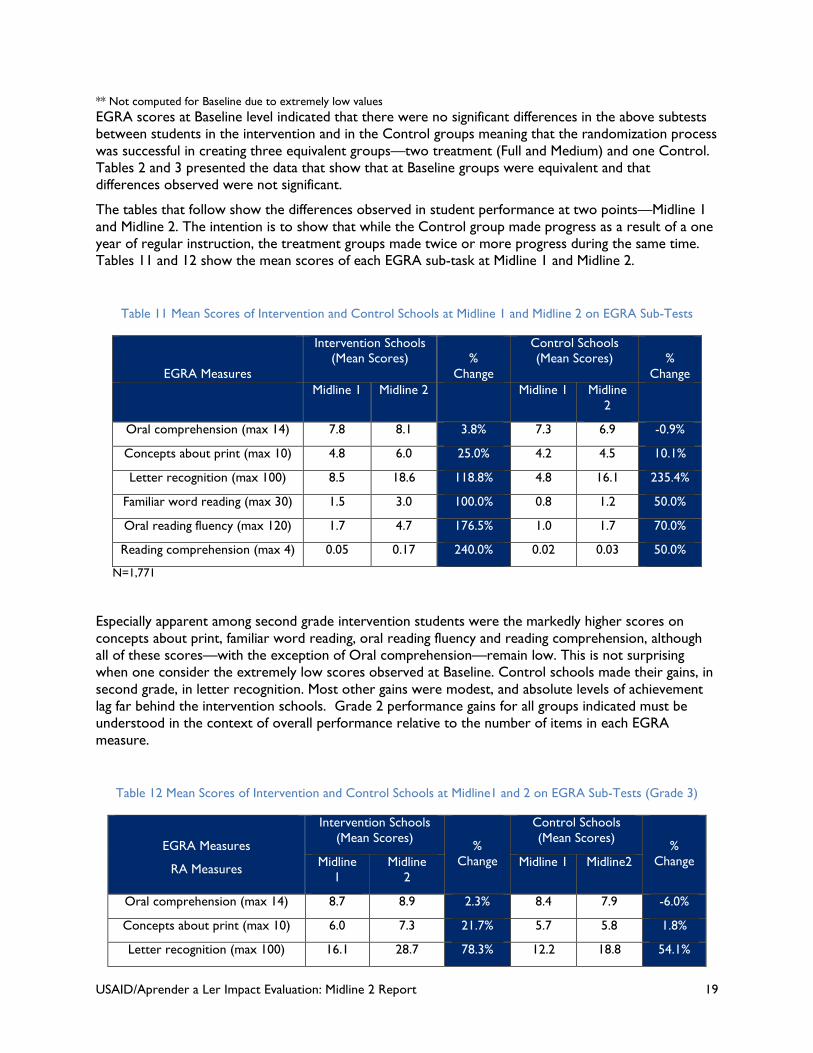
USAID/Aprender a Ler Impact Evaluation: Midline 2 Report 19
** Not computed for Baseline due to extremely low values EGRA scores at Baseline level indicated that there were no significant differences in the above subtests between students in the intervention and in the Control groups meaning that the randomization process was successful in creating three equivalent groups—two treatment (Full and Medium) and one Control. Tables 2 and 3 presented the data that show that at Baseline groups were equivalent and that differences observed were not significant.
The tables that follow show the differences observed in student performance at two points—Midline 1 and Midline 2. The intention is to show that while the Control group made progress as a result of a one year of regular instruction, the treatment groups made twice or more progress during the same time. Tables 11 and 12 show the mean scores of each EGRA sub-task at Midline 1 and Midline 2.
Table 11 Mean Scores of Intervention and Control Schools at Midline 1 and Midline 2 on EGRA Sub-Tests
EGRA Measures
Intervention Schools (Mean Scores)
%
Change
Control Schools (Mean Scores)
%
Change Midline 1 Midline 2 Midline 1 Midline
2
Oral comprehension (max 14) 7.8 8.1 3.8% 7.3 6.9 -0.9%
Concepts about print (max 10) 4.8 6.0 25.0% 4.2 4.5 10.1%
Letter recognition (max 100) 8.5 18.6 118.8% 4.8 16.1 235.4%
Familiar word reading (max 30) 1.5 3.0 100.0% 0.8 1.2 50.0%
Oral reading fluency (max 120) 1.7 4.7 176.5% 1.0 1.7 70.0%
Reading comprehension (max 4) 0.05 0.17 240.0% 0.02 0.03 50.0%
N=1,771
Especially apparent among second grade intervention students were the markedly higher scores on concepts about print, familiar word reading, oral reading fluency and reading comprehension, although all of these scores—with the exception of Oral comprehension—remain low. This is not surprising when one consider the extremely low scores observed at Baseline. Control schools made their gains, in second grade, in letter recognition. Most other gains were modest, and absolute levels of achievement lag far behind the intervention schools. Grade 2 performance gains for all groups indicated must be understood in the context of overall performance relative to the number of items in each EGRA measure.
Table 12 Mean Scores of Intervention and Control Schools at Midline1 and 2 on EGRA Sub-Tests (Grade 3)
EGRA Measures
RA Measures
Intervention Schools (Mean Scores)
% Change
Control Schools (Mean Scores)
% Change Midline
1 Midline
2 Midline 1 Midline2
Oral comprehension (max 14) 8.7 8.9 2.3% 8.4 7.9 -6.0%
Concepts about print (max 10) 6.0 7.3 21.7% 5.7 5.8 1.8%
Letter recognition (max 100) 16.1 28.7 78.3% 12.2 18.8 54.1%
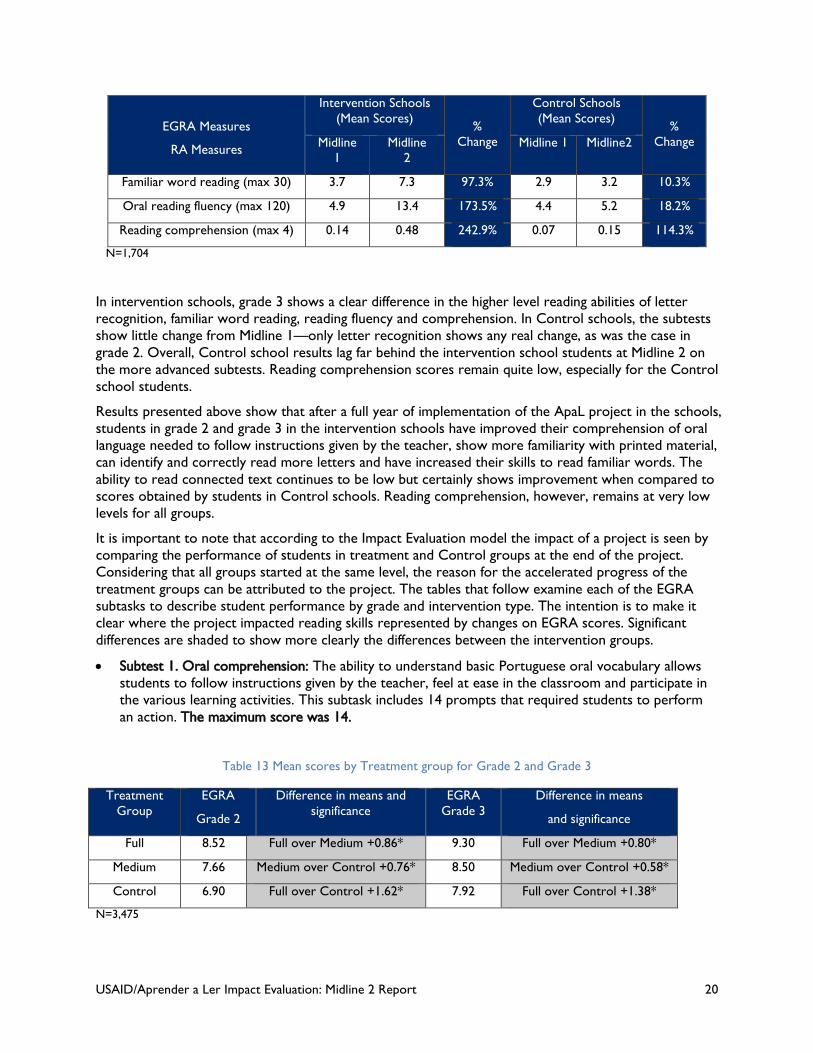
USAID/Aprender a Ler Impact Evaluation: Midline 2 Report 20
EGRA Measures
RA Measures
Intervention Schools (Mean Scores)
% Change
Control Schools (Mean Scores)
% Change Midline
1 Midline
2 Midline 1 Midline2
Familiar word reading (max 30) 3.7 7.3 97.3% 2.9 3.2 10.3%
Oral reading fluency (max 120) 4.9 13.4 173.5% 4.4 5.2 18.2%
Reading comprehension (max 4) 0.14 0.48 242.9% 0.07 0.15 114.3%
N=1,704
In intervention schools, grade 3 shows a clear difference in the higher level reading abilities of letter recognition, familiar word reading, reading fluency and comprehension. In Control schools, the subtests show little change from Midline 1—only letter recognition shows any real change, as was the case in grade 2. Overall, Control school results lag far behind the intervention school students at Midline 2 on the more advanced subtests. Reading comprehension scores remain quite low, especially for the Control school students.
Results presented above show that after a full year of implementation of the ApaL project in the schools, students in grade 2 and grade 3 in the intervention schools have improved their comprehension of oral language needed to follow instructions given by the teacher, show more familiarity with printed material, can identify and correctly read more letters and have increased their skills to read familiar words. The ability to read connected text continues to be low but certainly shows improvement when compared to scores obtained by students in Control schools. Reading comprehension, however, remains at very low levels for all groups.
It is important to note that according to the Impact Evaluation model the impact of a project is seen by comparing the performance of students in treatment and Control groups at the end of the project. Considering that all groups started at the same level, the reason for the accelerated progress of the treatment groups can be attributed to the project. The tables that follow examine each of the EGRA subtasks to describe student performance by grade and intervention type. The intention is to make it clear where the project impacted reading skills represented by changes on EGRA scores. Significant differences are shaded to show more clearly the differences between the intervention groups.
• Subtest 1. Oral comprehension: The ability to understand basic Portuguese oral vocabulary allows students to follow instructions given by the teacher, feel at ease in the classroom and participate in the various learning activities. This subtask includes 14 prompts that required students to perform an action. The maximum score was 14.
Table 13 Mean scores by Treatment group for Grade 2 and Grade 3
Treatment Group
EGRA
Grade 2
Difference in means and significance
EGRA Grade 3
Difference in means
and significance
Full 8.52 Full over Medium +0.86* 9.30 Full over Medium +0.80*
Medium 7.66 Medium over Control +0.76* 8.50 Medium over Control +0.58*
Control 6.90 Full over Control +1.62* 7.92 Full over Control +1.38*
N=3,475
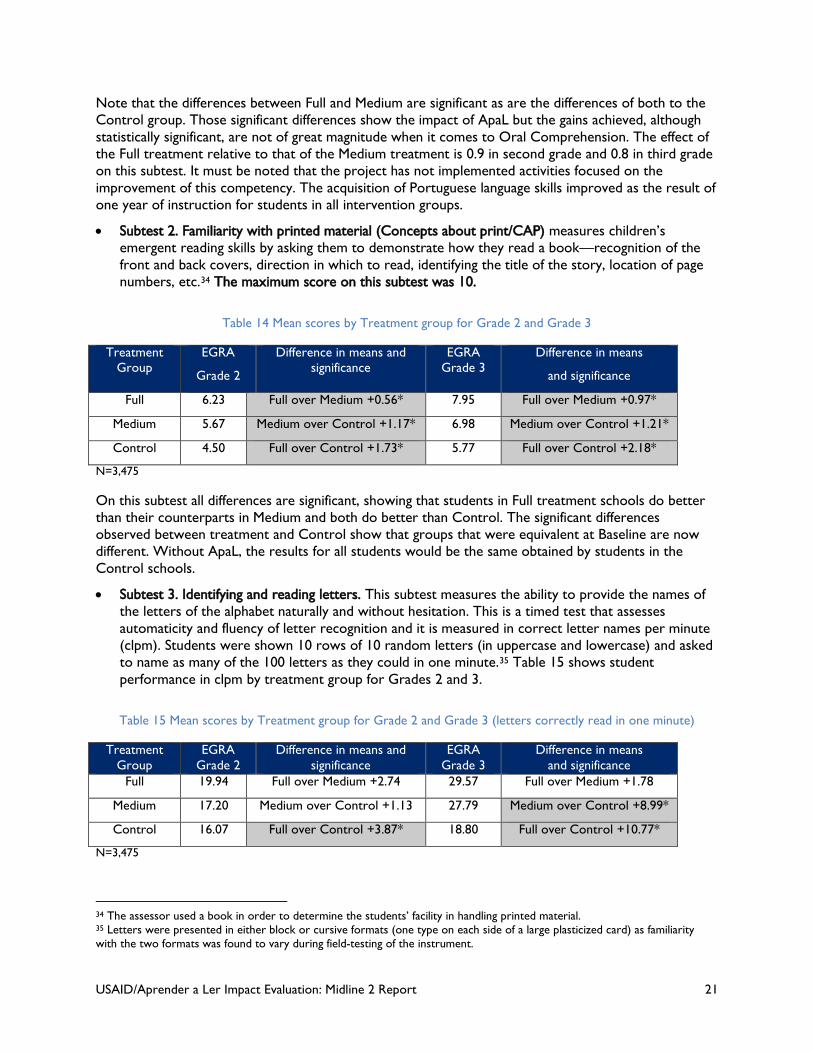
USAID/Aprender a Ler Impact Evaluation: Midline 2 Report 21
Note that the differences between Full and Medium are significant as are the differences of both to the Control group. Those significant differences show the impact of ApaL but the gains achieved, although statistically significant, are not of great magnitude when it comes to Oral Comprehension. The effect of the Full treatment relative to that of the Medium treatment is 0.9 in second grade and 0.8 in third grade on this subtest. It must be noted that the project has not implemented activities focused on the improvement of this competency. The acquisition of Portuguese language skills improved as the result of one year of instruction for students in all intervention groups.
• Subtest 2. Familiarity with printed material (Concepts about print/CAP) measures children’s emergent reading skills by asking them to demonstrate how they read a book—recognition of the front and back covers, direction in which to read, identifying the title of the story, location of page numbers, etc.34 The maximum score on this subtest was 10.
Table 14 Mean scores by Treatment group for Grade 2 and Grade 3
Treatment Group
EGRA
Grade 2
Difference in means and significance
EGRA Grade 3
Difference in means
and significance
Full 6.23 Full over Medium +0.56* 7.95 Full over Medium +0.97*
Medium 5.67 Medium over Control +1.17* 6.98 Medium over Control +1.21*
Control 4.50 Full over Control +1.73* 5.77 Full over Control +2.18*
N=3,475
On this subtest all differences are significant, showing that students in Full treatment schools do better than their counterparts in Medium and both do better than Control. The significant differences observed between treatment and Control show that groups that were equivalent at Baseline are now different. Without ApaL, the results for all students would be the same obtained by students in the Control schools.
• Subtest 3. Identifying and reading letters. This subtest measures the ability to provide the names of the letters of the alphabet naturally and without hesitation. This is a timed test that assesses automaticity and fluency of letter recognition and it is measured in correct letter names per minute (clpm). Students were shown 10 rows of 10 random letters (in uppercase and lowercase) and asked to name as many of the 100 letters as they could in one minute.35 Table 15 shows student performance in clpm by treatment group for Grades 2 and 3.
Table 15 Mean scores by Treatment group for Grade 2 and Grade 3 (letters correctly read in one minute)
Treatment Group
EGRA Grade 2
Difference in means and significance
EGRA Grade 3
Difference in means and significance
Full 19.94 Full over Medium +2.74 29.57 Full over Medium +1.78
Medium 17.20 Medium over Control +1.13 27.79 Medium over Control +8.99*
Control 16.07 Full over Control +3.87* 18.80 Full over Control +10.77*
N=3,475
34 The assessor used a book in order to determine the students’ facility in handling printed material. 35 Letters were presented in either block or cursive formats (one type on each side of a large plasticized card) as familiarity with the two formats was found to vary during field-testing of the instrument.
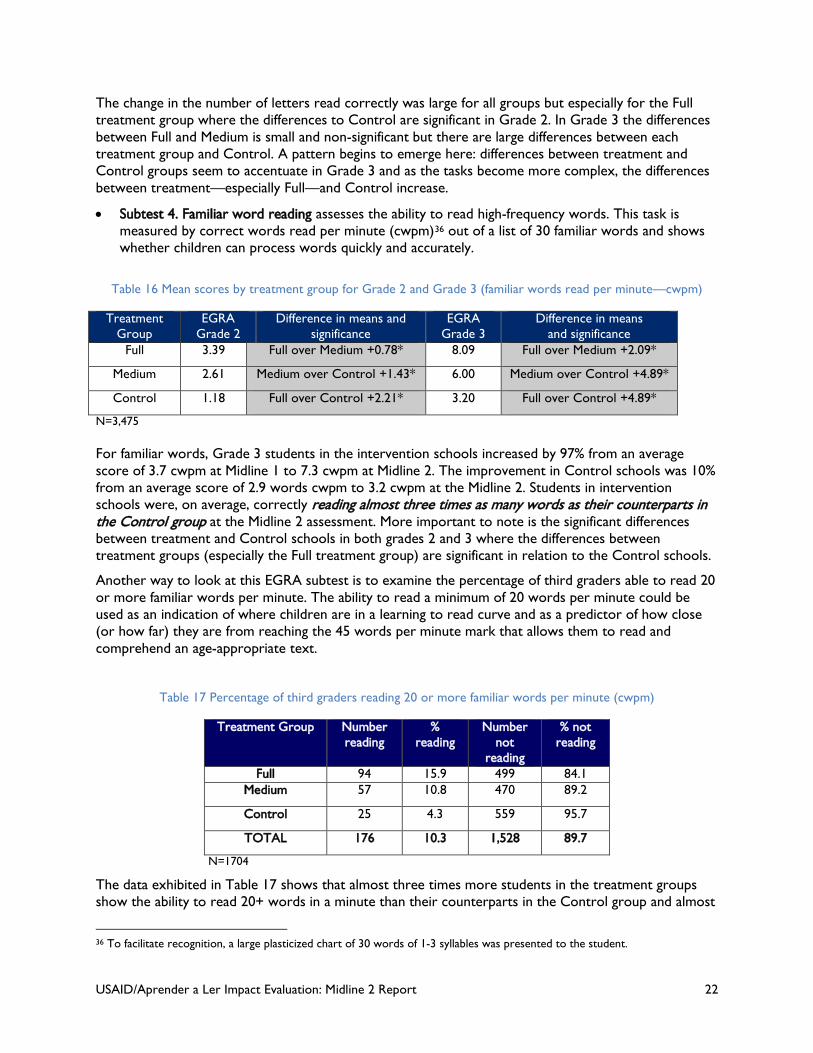
USAID/Aprender a Ler Impact Evaluation: Midline 2 Report 22
The change in the number of letters read correctly was large for all groups but especially for the Full treatment group where the differences to Control are significant in Grade 2. In Grade 3 the differences between Full and Medium is small and non-significant but there are large differences between each treatment group and Control. A pattern begins to emerge here: differences between treatment and Control groups seem to accentuate in Grade 3 and as the tasks become more complex, the differences between treatment—especially Full—and Control increase.
• Subtest 4. Familiar word reading assesses the ability to read high-frequency words. This task is measured by correct words read per minute (cwpm)36 out of a list of 30 familiar words and shows whether children can process words quickly and accurately.
Table 16 Mean scores by treatment group for Grade 2 and Grade 3 (familiar words read per minute—cwpm)
Treatment Group
EGRA Grade 2
Difference in means and significance
EGRA Grade 3
Difference in means and significance
Full 3.39 Full over Medium +0.78* 8.09 Full over Medium +2.09*
Medium 2.61 Medium over Control +1.43* 6.00 Medium over Control +4.89*
Control 1.18 Full over Control +2.21* 3.20 Full over Control +4.89*
N=3,475 For familiar words, Grade 3 students in the intervention schools increased by 97% from an average score of 3.7 cwpm at Midline 1 to 7.3 cwpm at Midline 2. The improvement in Control schools was 10% from an average score of 2.9 words cwpm to 3.2 cwpm at the Midline 2. Students in intervention schools were, on average, correctly reading almost three times as many words as their counterparts in the Control group at the Midline 2 assessment. More important to note is the significant differences between treatment and Control schools in both grades 2 and 3 where the differences between treatment groups (especially the Full treatment group) are significant in relation to the Control schools.
Another way to look at this EGRA subtest is to examine the percentage of third graders able to read 20 or more familiar words per minute. The ability to read a minimum of 20 words per minute could be used as an indication of where children are in a learning to read curve and as a predictor of how close (or how far) they are from reaching the 45 words per minute mark that allows them to read and comprehend an age-appropriate text.
Table 17 Percentage of third graders reading 20 or more familiar words per minute (cwpm)
Treatment Group Number reading
% reading
Number not
reading
% not reading
Full 94 15.9 499 84.1 Medium 57 10.8 470 89.2
Control 25 4.3 559 95.7
TOTAL 176 10.3 1,528 89.7
N=1704
The data exhibited in Table 17 shows that almost three times more students in the treatment groups show the ability to read 20+ words in a minute than their counterparts in the Control group and almost
36 To facilitate recognition, a large plasticized chart of 30 words of 1-3 syllables was presented to the student.
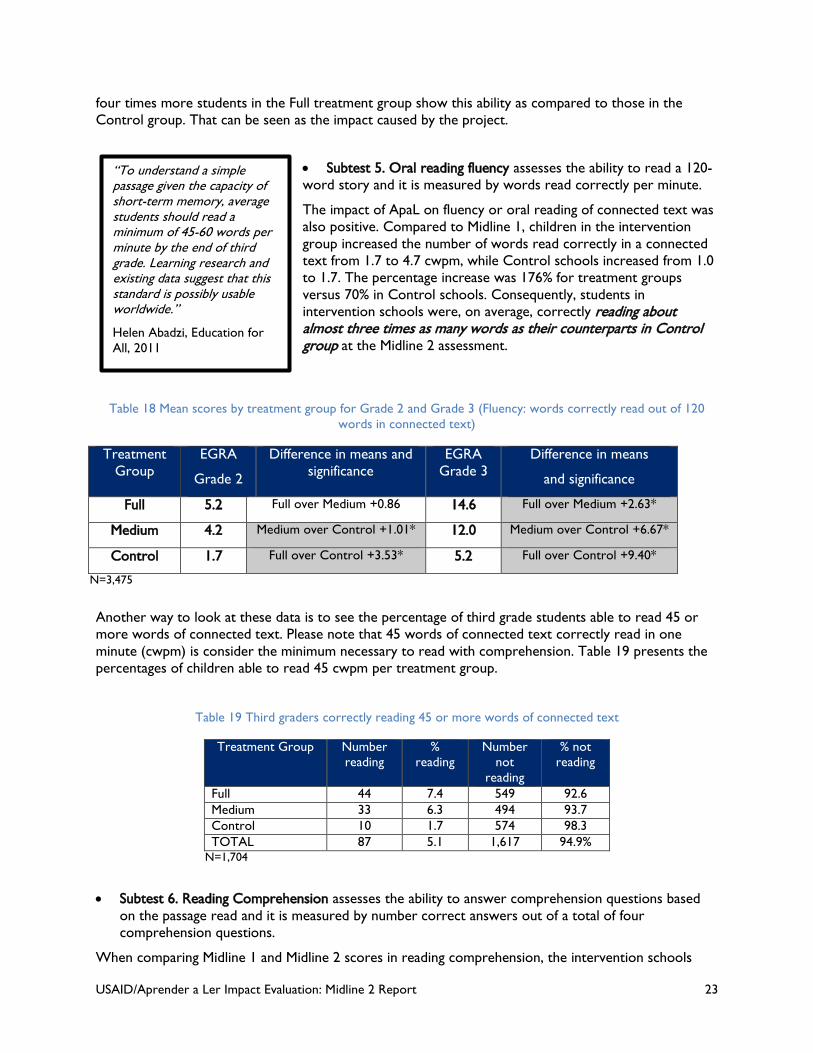
USAID/Aprender a Ler Impact Evaluation: Midline 2 Report 23
four times more students in the Full treatment group show this ability as compared to those in the Control group. That can be seen as the impact caused by the project.
• Subtest 5. Oral reading fluency assesses the ability to read a 120-word story and it is measured by words read correctly per minute.
The impact of ApaL on fluency or oral reading of connected text was also positive. Compared to Midline 1, children in the intervention group increased the number of words read correctly in a connected text from 1.7 to 4.7 cwpm, while Control schools increased from 1.0 to 1.7. The percentage increase was 176% for treatment groups versus 70% in Control schools. Consequently, students in intervention schools were, on average, correctly reading about almost three times as many words as their counterparts in Control group at the Midline 2 assessment.
Table 18 Mean scores by treatment group for Grade 2 and Grade 3 (Fluency: words correctly read out of 120 words in connected text)
Treatment Group
EGRA
Grade 2
Difference in means and significance
EGRA Grade 3
Difference in means
and significance
Full 5.2 Full over Medium +0.86 14.6 Full over Medium +2.63*
Medium 4.2 Medium over Control +1.01* 12.0 Medium over Control +6.67*
Control 1.7 Full over Control +3.53* 5.2 Full over Control +9.40*
N=3,475
Another way to look at these data is to see the percentage of third grade students able to read 45 or more words of connected text. Please note that 45 words of connected text correctly read in one minute (cwpm) is consider the minimum necessary to read with comprehension. Table 19 presents the percentages of children able to read 45 cwpm per treatment group.
Table 19 Third graders correctly reading 45 or more words of connected text
Treatment Group Number reading
% reading
Number not
reading
% not reading
Full 44 7.4 549 92.6 Medium 33 6.3 494 93.7 Control 10 1.7 574 98.3 TOTAL 87 5.1 1,617 94.9%
N=1,704
• Subtest 6. Reading Comprehension assesses the ability to answer comprehension questions based
on the passage read and it is measured by number correct answers out of a total of four comprehension questions.
When comparing Midline 1 and Midline 2 scores in reading comprehension, the intervention schools
“To understand a simple passage given the capacity of short-term memory, average students should read a minimum of 45-60 words per minute by the end of third grade. Learning research and existing data suggest that this standard is possibly usable worldwide.”
Helen Abadzi, Education for All, 2011
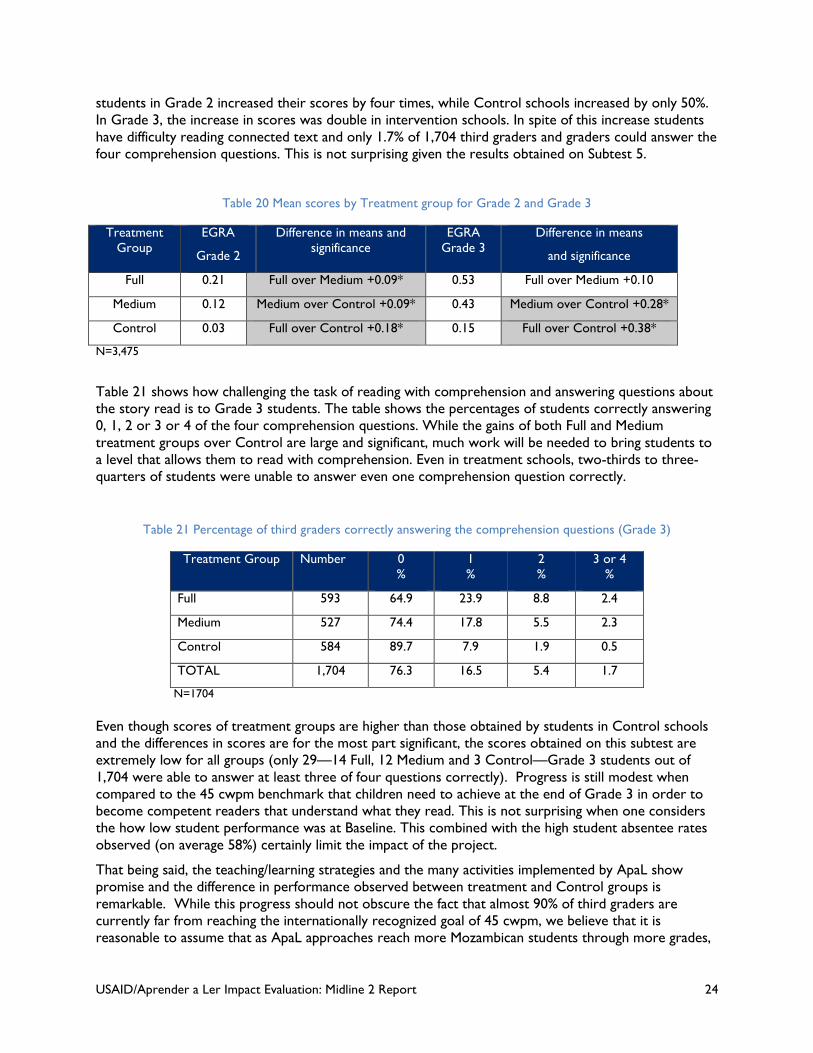
USAID/Aprender a Ler Impact Evaluation: Midline 2 Report 24
students in Grade 2 increased their scores by four times, while Control schools increased by only 50%. In Grade 3, the increase in scores was double in intervention schools. In spite of this increase students have difficulty reading connected text and only 1.7% of 1,704 third graders and graders could answer the four comprehension questions. This is not surprising given the results obtained on Subtest 5.
Table 20 Mean scores by Treatment group for Grade 2 and Grade 3
Treatment Group
EGRA
Grade 2
Difference in means and significance
EGRA Grade 3
Difference in means
and significance
Full 0.21 Full over Medium +0.09* 0.53 Full over Medium +0.10
Medium 0.12 Medium over Control +0.09* 0.43 Medium over Control +0.28*
Control 0.03 Full over Control +0.18* 0.15 Full over Control +0.38*
N=3,475
Table 21 shows how challenging the task of reading with comprehension and answering questions about the story read is to Grade 3 students. The table shows the percentages of students correctly answering 0, 1, 2 or 3 or 4 of the four comprehension questions. While the gains of both Full and Medium treatment groups over Control are large and significant, much work will be needed to bring students to a level that allows them to read with comprehension. Even in treatment schools, two-thirds to three-quarters of students were unable to answer even one comprehension question correctly.
Table 21 Percentage of third graders correctly answering the comprehension questions (Grade 3)
Treatment Group Number 0 %
1 %
2 %
3 or 4 %
Full 593 64.9 23.9 8.8 2.4
Medium 527 74.4 17.8 5.5 2.3
Control 584 89.7 7.9 1.9 0.5
TOTAL 1,704 76.3 16.5 5.4 1.7
N=1704 Even though scores of treatment groups are higher than those obtained by students in Control schools and the differences in scores are for the most part significant, the scores obtained on this subtest are extremely low for all groups (only 29—14 Full, 12 Medium and 3 Control—Grade 3 students out of 1,704 were able to answer at least three of four questions correctly). Progress is still modest when compared to the 45 cwpm benchmark that children need to achieve at the end of Grade 3 in order to become competent readers that understand what they read. This is not surprising when one considers the how low student performance was at Baseline. This combined with the high student absentee rates observed (on average 58%) certainly limit the impact of the project.
That being said, the teaching/learning strategies and the many activities implemented by ApaL show promise and the difference in performance observed between treatment and Control groups is remarkable. While this progress should not obscure the fact that almost 90% of third graders are currently far from reaching the internationally recognized goal of 45 cwpm, we believe that it is reasonable to assume that as ApaL approaches reach more Mozambican students through more grades,
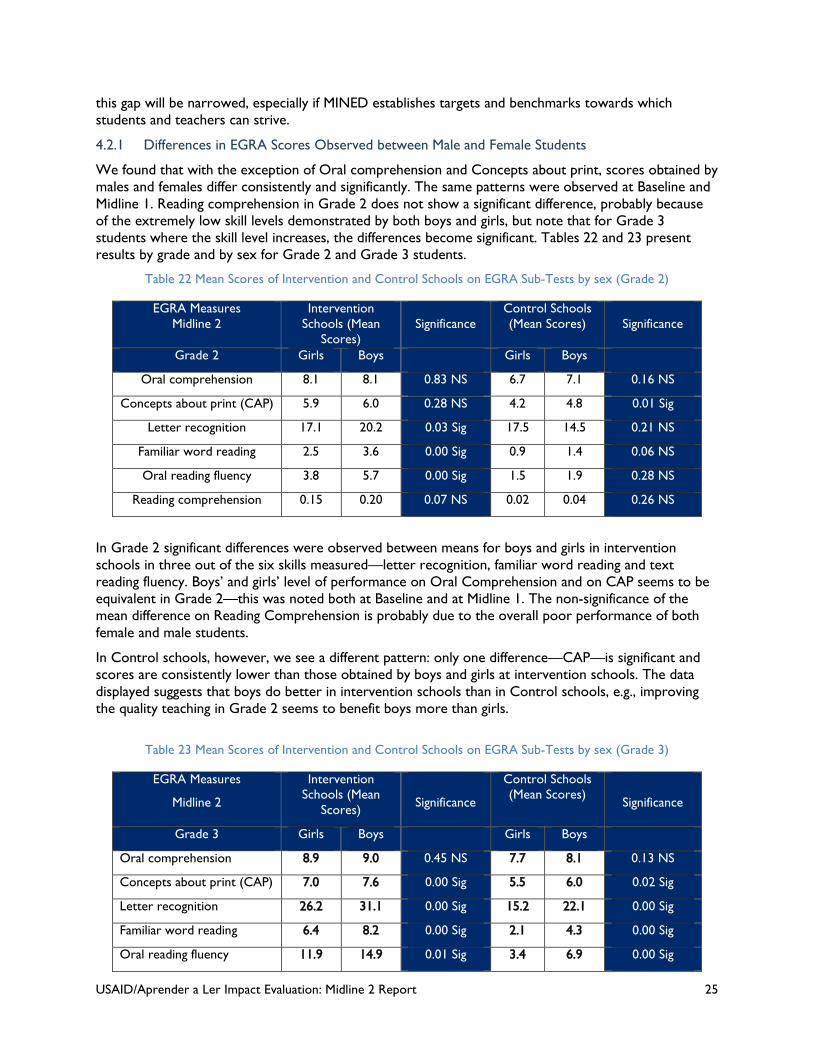
USAID/Aprender a Ler Impact Evaluation: Midline 2 Report 25
this gap will be narrowed, especially if MINED establishes targets and benchmarks towards which students and teachers can strive.
4.2.1 Differences in EGRA Scores Observed between Male and Female Students
We found that with the exception of Oral comprehension and Concepts about print, scores obtained by males and females differ consistently and significantly. The same patterns were observed at Baseline and Midline 1. Reading comprehension in Grade 2 does not show a significant difference, probably because of the extremely low skill levels demonstrated by both boys and girls, but note that for Grade 3 students where the skill level increases, the differences become significant. Tables 22 and 23 present results by grade and by sex for Grade 2 and Grade 3 students.
Table 22 Mean Scores of Intervention and Control Schools on EGRA Sub-Tests by sex (Grade 2)
EGRA Measures Midline 2
Intervention Schools (Mean
Scores)
Significance
Control Schools (Mean Scores)
Significance
Grade 2 Girls Boys Girls Boys
Oral comprehension 8.1 8.1 0.83 NS 6.7 7.1 0.16 NS
Concepts about print (CAP) 5.9 6.0 0.28 NS 4.2 4.8 0.01 Sig
Letter recognition 17.1 20.2 0.03 Sig 17.5 14.5 0.21 NS
Familiar word reading 2.5 3.6 0.00 Sig 0.9 1.4 0.06 NS
Oral reading fluency 3.8 5.7 0.00 Sig 1.5 1.9 0.28 NS
Reading comprehension 0.15 0.20 0.07 NS 0.02 0.04 0.26 NS
In Grade 2 significant differences were observed between means for boys and girls in intervention schools in three out of the six skills measured—letter recognition, familiar word reading and text reading fluency. Boys’ and girls’ level of performance on Oral Comprehension and on CAP seems to be equivalent in Grade 2—this was noted both at Baseline and at Midline 1. The non-significance of the mean difference on Reading Comprehension is probably due to the overall poor performance of both female and male students.
In Control schools, however, we see a different pattern: only one difference—CAP—is significant and scores are consistently lower than those obtained by boys and girls at intervention schools. The data displayed suggests that boys do better in intervention schools than in Control schools, e.g., improving the quality teaching in Grade 2 seems to benefit boys more than girls.
Table 23 Mean Scores of Intervention and Control Schools on EGRA Sub-Tests by sex (Grade 3)
EGRA Measures
Midline 2
Intervention Schools (Mean
Scores)
Significance
Control Schools (Mean Scores)
Significance
Grade 3 Girls Boys Girls Boys
Oral comprehension 8.9 9.0 0.45 NS 7.7 8.1 0.13 NS
Concepts about print (CAP) 7.0 7.6 0.00 Sig 5.5 6.0 0.02 Sig
Letter recognition 26.2 31.1 0.00 Sig 15.2 22.1 0.00 Sig
Familiar word reading 6.4 8.2 0.00 Sig 2.1 4.3 0.00 Sig
Oral reading fluency 11.9 14.9 0.01 Sig 3.4 6.9 0.00 Sig
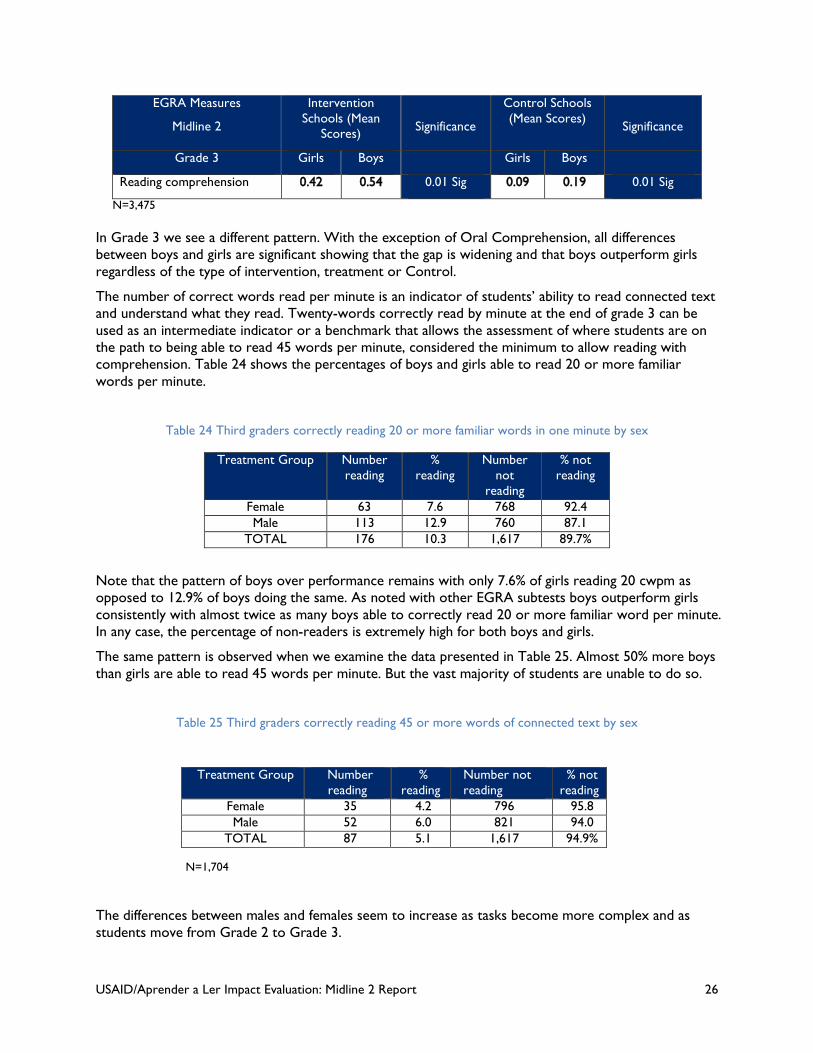
USAID/Aprender a Ler Impact Evaluation: Midline 2 Report 26
EGRA Measures
Midline 2
Intervention Schools (Mean
Scores)
Significance
Control Schools (Mean Scores)
Significance
Grade 3 Girls Boys Girls Boys
Reading comprehension 0.42 0.54 0.01 Sig 0.09 0.19 0.01 Sig
N=3,475 In Grade 3 we see a different pattern. With the exception of Oral Comprehension, all differences between boys and girls are significant showing that the gap is widening and that boys outperform girls regardless of the type of intervention, treatment or Control.
The number of correct words read per minute is an indicator of students’ ability to read connected text and understand what they read. Twenty-words correctly read by minute at the end of grade 3 can be used as an intermediate indicator or a benchmark that allows the assessment of where students are on the path to being able to read 45 words per minute, considered the minimum to allow reading with comprehension. Table 24 shows the percentages of boys and girls able to read 20 or more familiar words per minute.
Table 24 Third graders correctly reading 20 or more familiar words in one minute by sex
Treatment Group Number reading
% reading
Number not
reading
% not reading
Female 63 7.6 768 92.4 Male 113 12.9 760 87.1
TOTAL 176 10.3 1,617 89.7%
Note that the pattern of boys over performance remains with only 7.6% of girls reading 20 cwpm as opposed to 12.9% of boys doing the same. As noted with other EGRA subtests boys outperform girls consistently with almost twice as many boys able to correctly read 20 or more familiar word per minute. In any case, the percentage of non-readers is extremely high for both boys and girls.
The same pattern is observed when we examine the data presented in Table 25. Almost 50% more boys than girls are able to read 45 words per minute. But the vast majority of students are unable to do so.
Table 25 Third graders correctly reading 45 or more words of connected text by sex
N=1,704
The differences between males and females seem to increase as tasks become more complex and as students move from Grade 2 to Grade 3.
Treatment Group Number reading
% reading
Number not reading
% not reading
Female 35 4.2 796 95.8 Male 52 6.0 821 94.0
TOTAL 87 5.1 1,617 94.9%
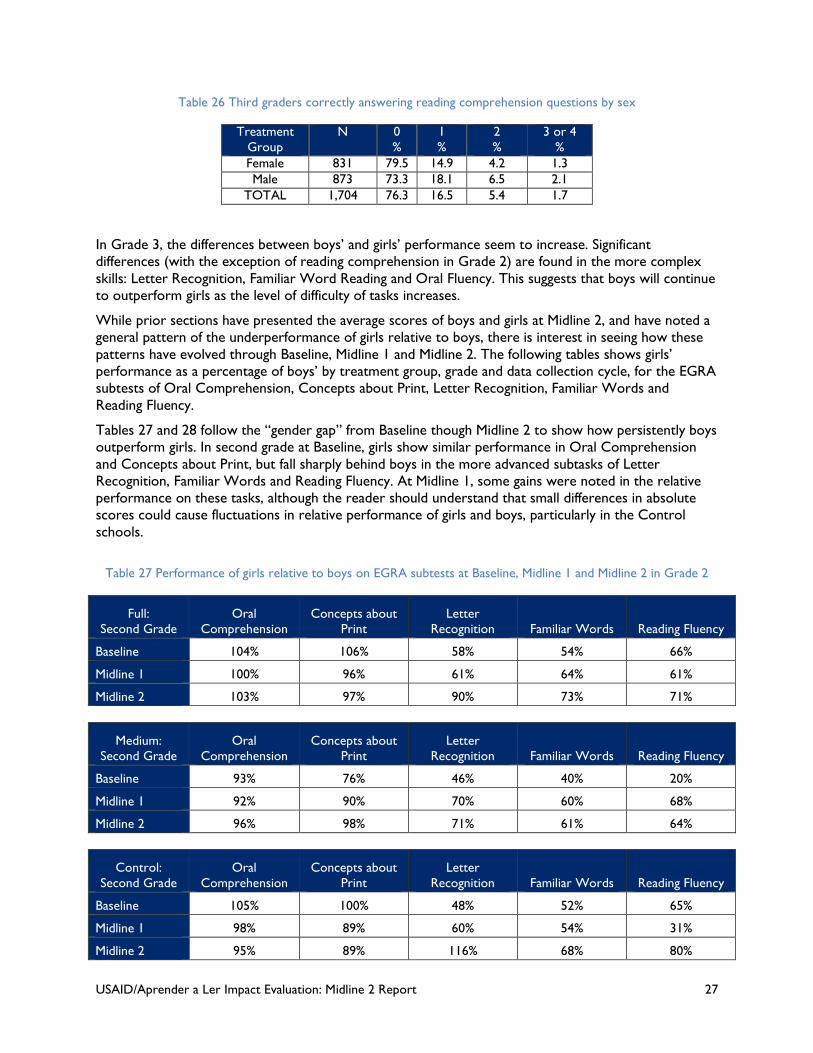
USAID/Aprender a Ler Impact Evaluation: Midline 2 Report 27
Table 26 Third graders correctly answering reading comprehension questions by sex
Treatment Group
N 0 %
1 %
2 %
3 or 4 %
Female 831 79.5 14.9 4.2 1.3 Male 873 73.3 18.1 6.5 2.1
TOTAL 1,704 76.3 16.5 5.4 1.7 In Grade 3, the differences between boys’ and girls’ performance seem to increase. Significant differences (with the exception of reading comprehension in Grade 2) are found in the more complex skills: Letter Recognition, Familiar Word Reading and Oral Fluency. This suggests that boys will continue to outperform girls as the level of difficulty of tasks increases.
While prior sections have presented the average scores of boys and girls at Midline 2, and have noted a general pattern of the underperformance of girls relative to boys, there is interest in seeing how these patterns have evolved through Baseline, Midline 1 and Midline 2. The following tables shows girls’ performance as a percentage of boys’ by treatment group, grade and data collection cycle, for the EGRA subtests of Oral Comprehension, Concepts about Print, Letter Recognition, Familiar Words and Reading Fluency.
Tables 27 and 28 follow the “gender gap” from Baseline though Midline 2 to show how persistently boys outperform girls. In second grade at Baseline, girls show similar performance in Oral Comprehension and Concepts about Print, but fall sharply behind boys in the more advanced subtasks of Letter Recognition, Familiar Words and Reading Fluency. At Midline 1, some gains were noted in the relative performance on these tasks, although the reader should understand that small differences in absolute scores could cause fluctuations in relative performance of girls and boys, particularly in the Control schools.
Table 27 Performance of girls relative to boys on EGRA subtests at Baseline, Midline 1 and Midline 2 in Grade 2
Full: Second Grade
Oral Comprehension
Concepts about Print
Letter Recognition Familiar Words Reading Fluency
Baseline 104% 106% 58% 54% 66%
Midline 1 100% 96% 61% 64% 61%
Midline 2 103% 97% 90% 73% 71%
Medium:
Second Grade Oral
Comprehension Concepts about
Print Letter
Recognition Familiar Words Reading Fluency
Baseline 93% 76% 46% 40% 20%
Midline 1 92% 90% 70% 60% 68%
Midline 2 96% 98% 71% 61% 64%
Control:
Second Grade Oral
Comprehension Concepts about
Print Letter
Recognition Familiar Words Reading Fluency
Baseline 105% 100% 48% 52% 65%
Midline 1 98% 89% 60% 54% 31%
Midline 2 95% 89% 116% 68% 80%
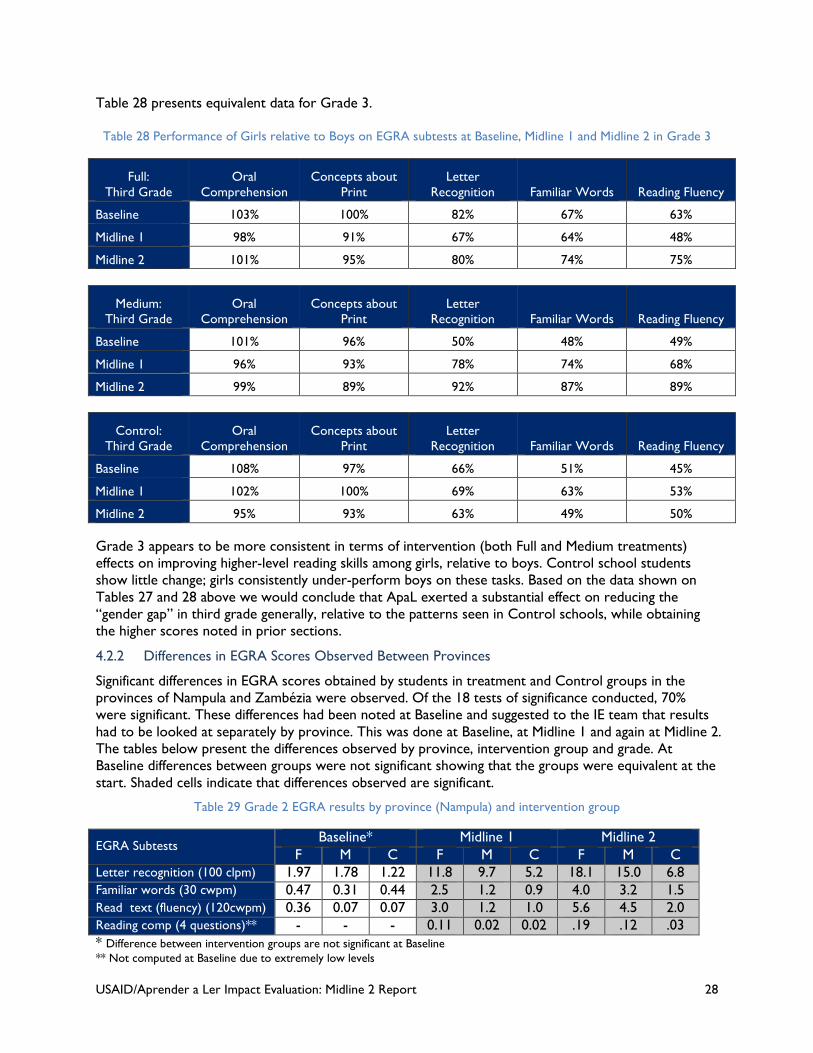
USAID/Aprender a Ler Impact Evaluation: Midline 2 Report 28
Table 28 presents equivalent data for Grade 3. Table 28 Performance of Girls relative to Boys on EGRA subtests at Baseline, Midline 1 and Midline 2 in Grade 3
Full: Third Grade
Oral Comprehension
Concepts about Print
Letter Recognition Familiar Words Reading Fluency
Baseline 103% 100% 82% 67% 63%
Midline 1 98% 91% 67% 64% 48%
Midline 2 101% 95% 80% 74% 75%
Medium:
Third Grade Oral
Comprehension Concepts about
Print Letter
Recognition Familiar Words Reading Fluency
Baseline 101% 96% 50% 48% 49%
Midline 1 96% 93% 78% 74% 68%
Midline 2 99% 89% 92% 87% 89%
Control:
Third Grade Oral
Comprehension Concepts about
Print Letter
Recognition Familiar Words Reading Fluency
Baseline 108% 97% 66% 51% 45%
Midline 1 102% 100% 69% 63% 53%
Midline 2 95% 93% 63% 49% 50% Grade 3 appears to be more consistent in terms of intervention (both Full and Medium treatments) effects on improving higher-level reading skills among girls, relative to boys. Control school students show little change; girls consistently under-perform boys on these tasks. Based on the data shown on Tables 27 and 28 above we would conclude that ApaL exerted a substantial effect on reducing the “gender gap” in third grade generally, relative to the patterns seen in Control schools, while obtaining the higher scores noted in prior sections.
4.2.2 Differences in EGRA Scores Observed Between Provinces
Significant differences in EGRA scores obtained by students in treatment and Control groups in the provinces of Nampula and Zambézia were observed. Of the 18 tests of significance conducted, 70% were significant. These differences had been noted at Baseline and suggested to the IE team that results had to be looked at separately by province. This was done at Baseline, at Midline 1 and again at Midline 2. The tables below present the differences observed by province, intervention group and grade. At Baseline differences between groups were not significant showing that the groups were equivalent at the start. Shaded cells indicate that differences observed are significant.
Table 29 Grade 2 EGRA results by province (Nampula) and intervention group
EGRA Subtests Baseline* Midline 1 Midline 2
F M C F M C F M C Letter recognition (100 clpm) 1.97 1.78 1.22 11.8 9.7 5.2 18.1 15.0 6.8 Familiar words (30 cwpm) 0.47 0.31 0.44 2.5 1.2 0.9 4.0 3.2 1.5 Read text (fluency) (120cwpm) 0.36 0.07 0.07 3.0 1.2 1.0 5.6 4.5 2.0 Reading comp (4 questions)** - - - 0.11 0.02 0.02 .19 .12 .03 * Difference between intervention groups are not significant at Baseline ** Not computed at Baseline due to extremely low levels
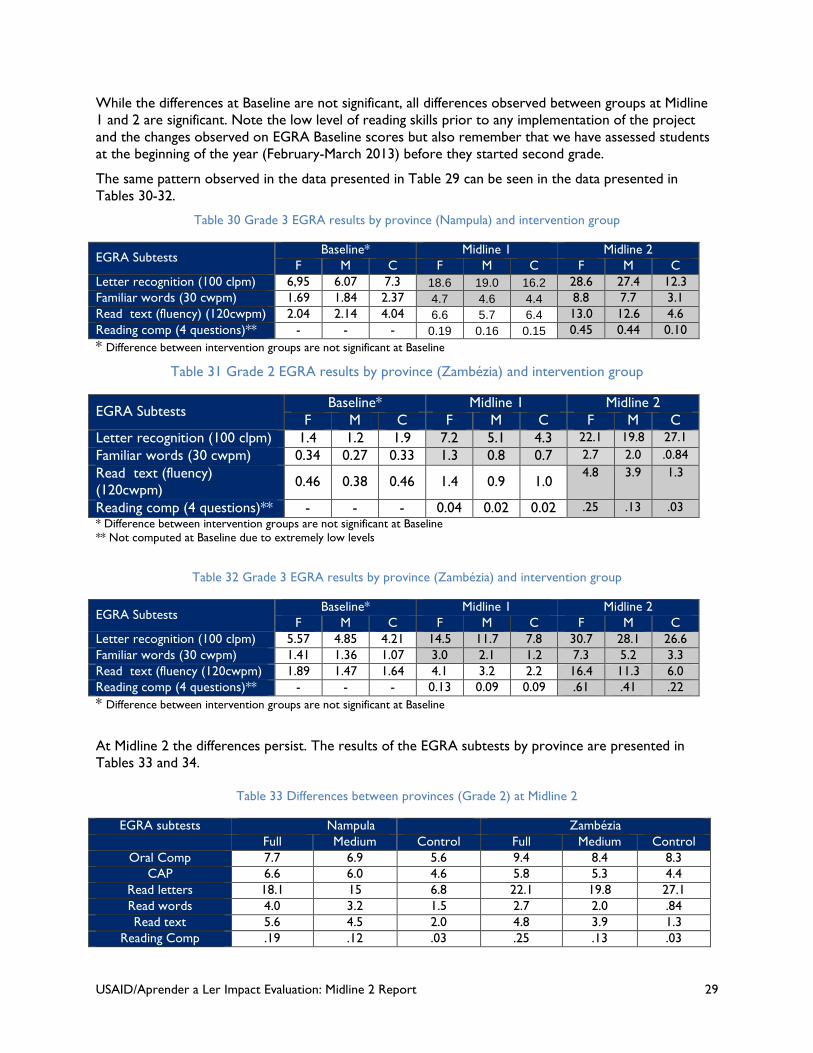
USAID/Aprender a Ler Impact Evaluation: Midline 2 Report 29
While the differences at Baseline are not significant, all differences observed between groups at Midline 1 and 2 are significant. Note the low level of reading skills prior to any implementation of the project and the changes observed on EGRA Baseline scores but also remember that we have assessed students at the beginning of the year (February-March 2013) before they started second grade.
The same pattern observed in the data presented in Table 29 can be seen in the data presented in Tables 30-32.
Table 30 Grade 3 EGRA results by province (Nampula) and intervention group
EGRA Subtests Baseline* Midline 1 Midline 2
F M C F M C F M C Letter recognition (100 clpm) 6,95 6.07 7.3 18.6 19.0 16.2 28.6 27.4 12.3 Familiar words (30 cwpm) 1.69 1.84 2.37 4.7 4.6 4.4 8.8 7.7 3.1 Read text (fluency) (120cwpm) 2.04 2.14 4.04 6.6 5.7 6.4 13.0 12.6 4.6 Reading comp (4 questions)** - - - 0.19 0.16 0.15 0.45 0.44 0.10 * Difference between intervention groups are not significant at Baseline
Table 31 Grade 2 EGRA results by province (Zambézia) and intervention group
EGRA Subtests Baseline* Midline 1 Midline 2 F M C F M C F M C
Letter recognition (100 clpm) 1.4 1.2 1.9 7.2 5.1 4.3 22.1 19.8 27.1 Familiar words (30 cwpm) 0.34 0.27 0.33 1.3 0.8 0.7 2.7 2.0 .0.84 Read text (fluency) (120cwpm) 0.46 0.38 0.46 1.4 0.9 1.0
4.8 3.9 1.3
Reading comp (4 questions)** - - - 0.04 0.02 0.02 .25 .13 .03 * Difference between intervention groups are not significant at Baseline ** Not computed at Baseline due to extremely low levels
Table 32 Grade 3 EGRA results by province (Zambézia) and intervention group
EGRA Subtests Baseline* Midline 1 Midline 2
F M C F M C F M C Letter recognition (100 clpm) 5.57 4.85 4.21 14.5 11.7 7.8 30.7 28.1 26.6 Familiar words (30 cwpm) 1.41 1.36 1.07 3.0 2.1 1.2 7.3 5.2 3.3 Read text (fluency (120cwpm) 1.89 1.47 1.64 4.1 3.2 2.2 16.4 11.3 6.0 Reading comp (4 questions)** - - - 0.13 0.09 0.09 .61 .41 .22 * Difference between intervention groups are not significant at Baseline
At Midline 2 the differences persist. The results of the EGRA subtests by province are presented in Tables 33 and 34.
Table 33 Differences between provinces (Grade 2) at Midline 2
EGRA subtests Nampula Zambézia Full Medium Control Full Medium Control
Oral Comp 7.7 6.9 5.6 9.4 8.4 8.3 CAP 6.6 6.0 4.6 5.8 5.3 4.4
Read letters 18.1 15 6.8 22.1 19.8 27.1 Read words 4.0 3.2 1.5 2.7 2.0 .84 Read text 5.6 4.5 2.0 4.8 3.9 1.3
Reading Comp .19 .12 .03 .25 .13 .03
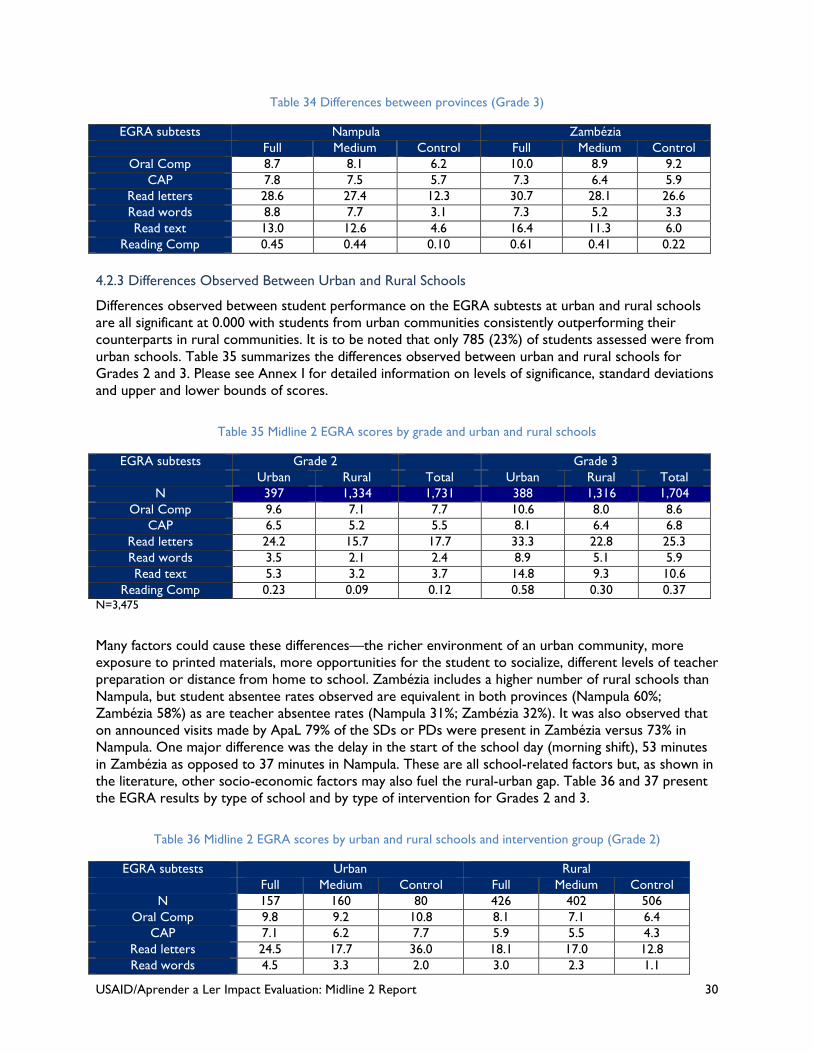
USAID/Aprender a Ler Impact Evaluation: Midline 2 Report 30
Table 34 Differences between provinces (Grade 3)
EGRA subtests Nampula Zambézia Full Medium Control Full Medium Control
Oral Comp 8.7 8.1 6.2 10.0 8.9 9.2 CAP 7.8 7.5 5.7 7.3 6.4 5.9
Read letters 28.6 27.4 12.3 30.7 28.1 26.6 Read words 8.8 7.7 3.1 7.3 5.2 3.3 Read text 13.0 12.6 4.6 16.4 11.3 6.0
Reading Comp 0.45 0.44 0.10 0.61 0.41 0.22 4.2.3 Differences Observed Between Urban and Rural Schools
Differences observed between student performance on the EGRA subtests at urban and rural schools are all significant at 0.000 with students from urban communities consistently outperforming their counterparts in rural communities. It is to be noted that only 785 (23%) of students assessed were from urban schools. Table 35 summarizes the differences observed between urban and rural schools for Grades 2 and 3. Please see Annex I for detailed information on levels of significance, standard deviations and upper and lower bounds of scores.
Table 35 Midline 2 EGRA scores by grade and urban and rural schools
EGRA subtests Grade 2 Grade 3 Urban Rural Total Urban Rural Total
N 397 1,334 1,731 388 1,316 1,704 Oral Comp 9.6 7.1 7.7 10.6 8.0 8.6
CAP 6.5 5.2 5.5 8.1 6.4 6.8 Read letters 24.2 15.7 17.7 33.3 22.8 25.3 Read words 3.5 2.1 2.4 8.9 5.1 5.9 Read text 5.3 3.2 3.7 14.8 9.3 10.6
Reading Comp 0.23 0.09 0.12 0.58 0.30 0.37 N=3,475
Many factors could cause these differences—the richer environment of an urban community, more exposure to printed materials, more opportunities for the student to socialize, different levels of teacher preparation or distance from home to school. Zambézia includes a higher number of rural schools than Nampula, but student absentee rates observed are equivalent in both provinces (Nampula 60%; Zambézia 58%) as are teacher absentee rates (Nampula 31%; Zambézia 32%). It was also observed that on announced visits made by ApaL 79% of the SDs or PDs were present in Zambézia versus 73% in Nampula. One major difference was the delay in the start of the school day (morning shift), 53 minutes in Zambézia as opposed to 37 minutes in Nampula. These are all school-related factors but, as shown in the literature, other socio-economic factors may also fuel the rural-urban gap. Table 36 and 37 present the EGRA results by type of school and by type of intervention for Grades 2 and 3.
Table 36 Midline 2 EGRA scores by urban and rural schools and intervention group (Grade 2)
EGRA subtests Urban Rural Full Medium Control Full Medium Control
N 157 160 80 426 402 506 Oral Comp 9.8 9.2 10.8 8.1 7.1 6.4
CAP 7.1 6.2 7.7 5.9 5.5 4.3 Read letters 24.5 17.7 36.0 18.1 17.0 12.8 Read words 4.5 3.3 2.0 3.0 2.3 1.1
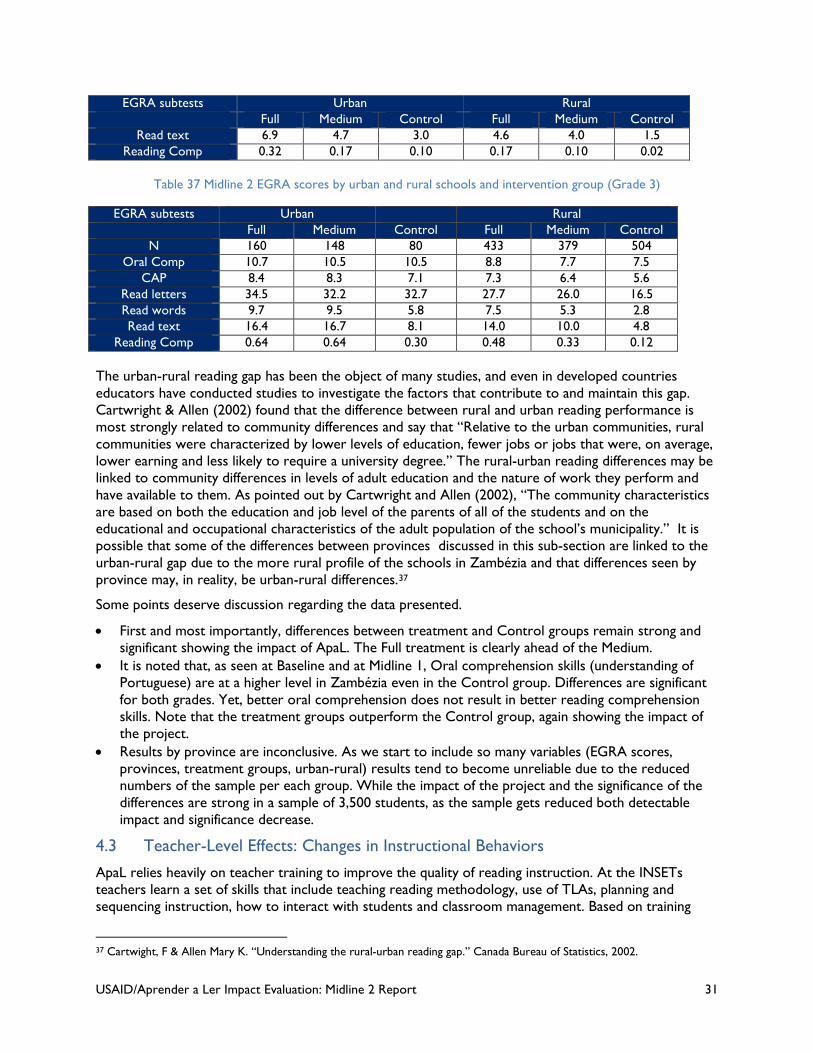
USAID/Aprender a Ler Impact Evaluation: Midline 2 Report 31
EGRA subtests Urban Rural Full Medium Control Full Medium Control
Read text 6.9 4.7 3.0 4.6 4.0 1.5 Reading Comp 0.32 0.17 0.10 0.17 0.10 0.02
Table 37 Midline 2 EGRA scores by urban and rural schools and intervention group (Grade 3)
EGRA subtests Urban Rural Full Medium Control Full Medium Control
N 160 148 80 433 379 504 Oral Comp 10.7 10.5 10.5 8.8 7.7 7.5
CAP 8.4 8.3 7.1 7.3 6.4 5.6 Read letters 34.5 32.2 32.7 27.7 26.0 16.5 Read words 9.7 9.5 5.8 7.5 5.3 2.8 Read text 16.4 16.7 8.1 14.0 10.0 4.8
Reading Comp 0.64 0.64 0.30 0.48 0.33 0.12 The urban-rural reading gap has been the object of many studies, and even in developed countries educators have conducted studies to investigate the factors that contribute to and maintain this gap. Cartwright & Allen (2002) found that the difference between rural and urban reading performance is most strongly related to community differences and say that “Relative to the urban communities, rural communities were characterized by lower levels of education, fewer jobs or jobs that were, on average, lower earning and less likely to require a university degree.” The rural-urban reading differences may be linked to community differences in levels of adult education and the nature of work they perform and have available to them. As pointed out by Cartwright and Allen (2002), “The community characteristics are based on both the education and job level of the parents of all of the students and on the educational and occupational characteristics of the adult population of the school’s municipality.” It is possible that some of the differences between provinces discussed in this sub-section are linked to the urban-rural gap due to the more rural profile of the schools in Zambézia and that differences seen by province may, in reality, be urban-rural differences.37
Some points deserve discussion regarding the data presented.
• First and most importantly, differences between treatment and Control groups remain strong and significant showing the impact of ApaL. The Full treatment is clearly ahead of the Medium.
• It is noted that, as seen at Baseline and at Midline 1, Oral comprehension skills (understanding of Portuguese) are at a higher level in Zambézia even in the Control group. Differences are significant for both grades. Yet, better oral comprehension does not result in better reading comprehension skills. Note that the treatment groups outperform the Control group, again showing the impact of the project.
• Results by province are inconclusive. As we start to include so many variables (EGRA scores, provinces, treatment groups, urban-rural) results tend to become unreliable due to the reduced numbers of the sample per each group. While the impact of the project and the significance of the differences are strong in a sample of 3,500 students, as the sample gets reduced both detectable impact and significance decrease.
4.3 Teacher-Level Effects: Changes in Instructional Behaviors
ApaL relies heavily on teacher training to improve the quality of reading instruction. At the INSETs teachers learn a set of skills that include teaching reading methodology, use of TLAs, planning and sequencing instruction, how to interact with students and classroom management. Based on training
37 Cartwight, F & Allen Mary K. “Understanding the rural-urban reading gap.” Canada Bureau of Statistics, 2002.
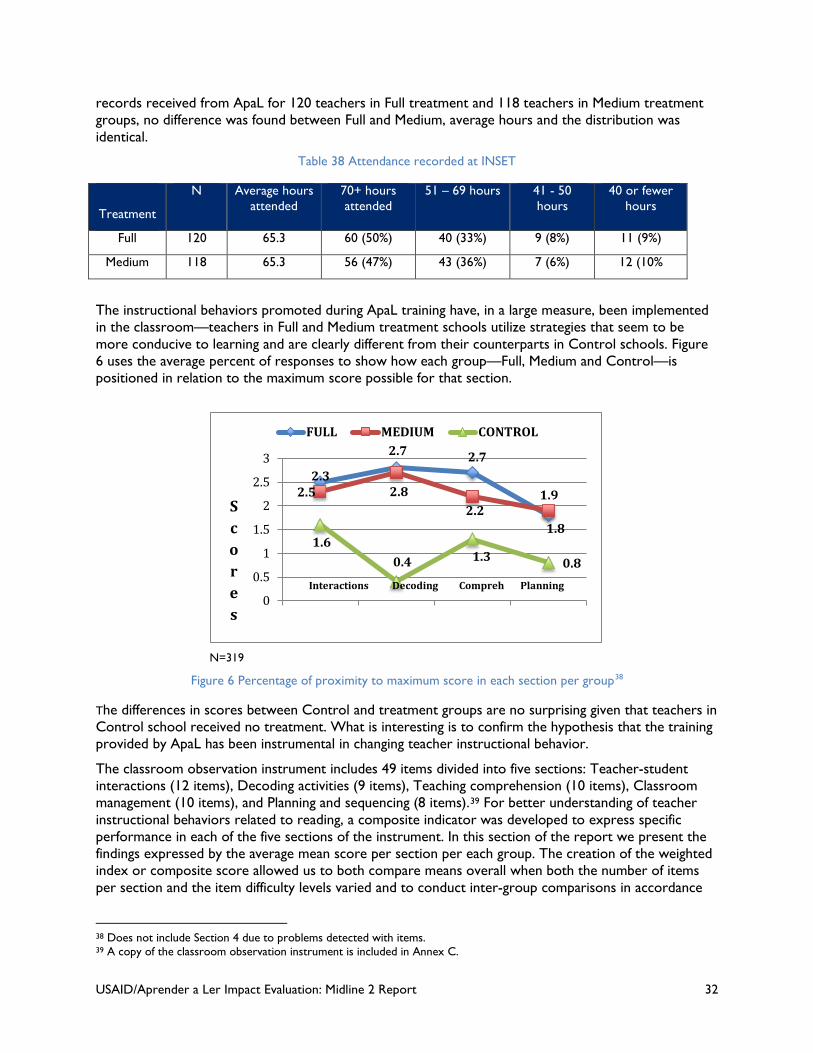
USAID/Aprender a Ler Impact Evaluation: Midline 2 Report 32
records received from ApaL for 120 teachers in Full treatment and 118 teachers in Medium treatment groups, no difference was found between Full and Medium, average hours and the distribution was identical.
Table 38 Attendance recorded at INSET
Treatment
N Average hours attended
70+ hours attended
51 – 69 hours 41 - 50 hours
40 or fewer hours
Full 120 65.3 60 (50%) 40 (33%) 9 (8%) 11 (9%)
Medium 118 65.3 56 (47%) 43 (36%) 7 (6%) 12 (10%
The instructional behaviors promoted during ApaL training have, in a large measure, been implemented in the classroom—teachers in Full and Medium treatment schools utilize strategies that seem to be more conducive to learning and are clearly different from their counterparts in Control schools. Figure 6 uses the average percent of responses to show how each group—Full, Medium and Control—is positioned in relation to the maximum score possible for that section.
N=319
Figure 6 Percentage of proximity to maximum score in each section per group38
The differences in scores between Control and treatment groups are no surprising given that teachers in Control school received no treatment. What is interesting is to confirm the hypothesis that the training provided by ApaL has been instrumental in changing teacher instructional behavior.
The classroom observation instrument includes 49 items divided into five sections: Teacher-student interactions (12 items), Decoding activities (9 items), Teaching comprehension (10 items), Classroom management (10 items), and Planning and sequencing (8 items).39 For better understanding of teacher instructional behaviors related to reading, a composite indicator was developed to express specific performance in each of the five sections of the instrument. In this section of the report we present the findings expressed by the average mean score per section per each group. The creation of the weighted index or composite score allowed us to both compare means overall when both the number of items per section and the item difficulty levels varied and to conduct inter-group comparisons in accordance
38 Does not include Section 4 due to problems detected with items. 39 A copy of the classroom observation instrument is included in Annex C.
2.5 2.8
2.7
1.8
2.3
2.7
2.2 1.9
1.6 0.4 1.3 0.8
0
0.5
1
1.5
2
2.5
3
Scores
Interactions Decoding Compreh Planning
FULL MEDIUM CONTROL
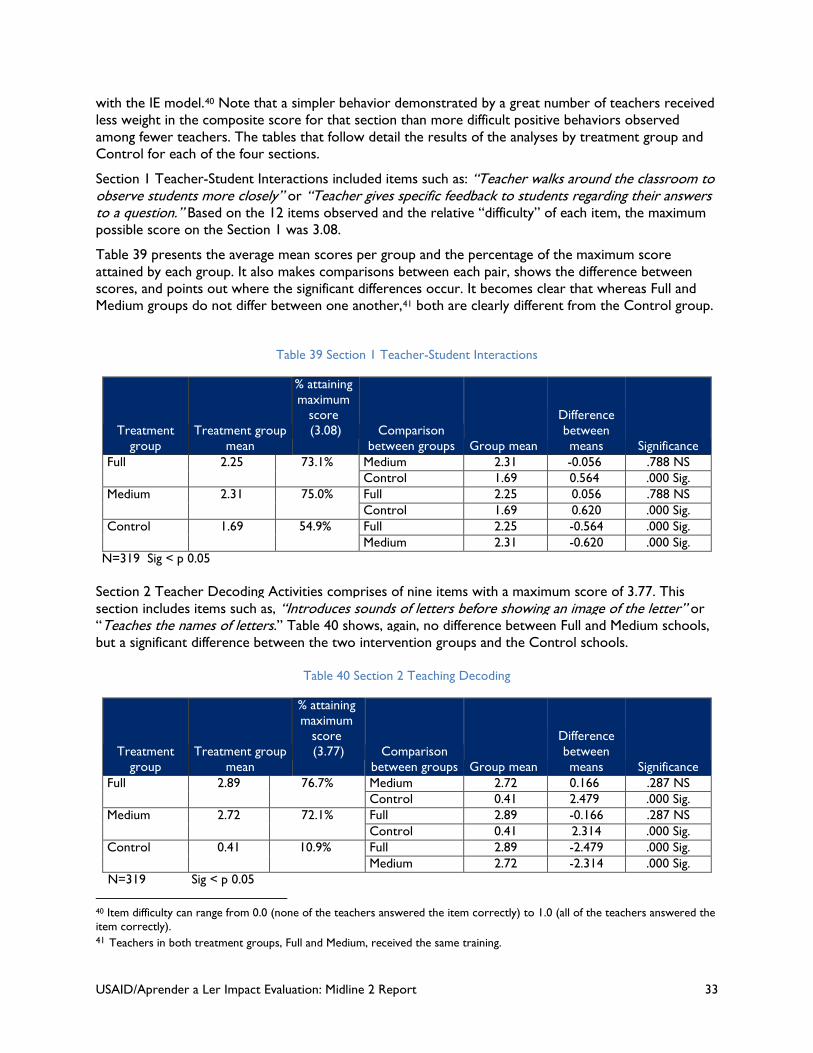
USAID/Aprender a Ler Impact Evaluation: Midline 2 Report 33
with the IE model.40 Note that a simpler behavior demonstrated by a great number of teachers received less weight in the composite score for that section than more difficult positive behaviors observed among fewer teachers. The tables that follow detail the results of the analyses by treatment group and Control for each of the four sections.
Section 1 Teacher-Student Interactions included items such as: “Teacher walks around the classroom to observe students more closely” or “Teacher gives specific feedback to students regarding their answers to a question.” Based on the 12 items observed and the relative “difficulty” of each item, the maximum possible score on the Section 1 was 3.08.
Table 39 presents the average mean scores per group and the percentage of the maximum score attained by each group. It also makes comparisons between each pair, shows the difference between scores, and points out where the significant differences occur. It becomes clear that whereas Full and Medium groups do not differ between one another,41 both are clearly different from the Control group.
Table 39 Section 1 Teacher-Student Interactions
Treatment group
Treatment group mean
% attaining maximum
score (3.08) Comparison
between groups Group mean
Difference between means Significance
Full 2.25 73.1% Medium 2.31 -0.056 .788 NS Control 1.69 0.564 .000 Sig.
Medium 2.31 75.0% Full 2.25 0.056 .788 NS Control 1.69 0.620 .000 Sig.
Control 1.69 54.9% Full 2.25 -0.564 .000 Sig. Medium 2.31 -0.620 .000 Sig.
N=319 Sig < p 0.05
Section 2 Teacher Decoding Activities comprises of nine items with a maximum score of 3.77. This section includes items such as, “Introduces sounds of letters before showing an image of the letter” or “Teaches the names of letters.” Table 40 shows, again, no difference between Full and Medium schools, but a significant difference between the two intervention groups and the Control schools.
Table 40 Section 2 Teaching Decoding
Treatment group
Treatment group mean
% attaining maximum
score (3.77) Comparison
between groups Group mean
Difference between means Significance
Full 2.89 76.7% Medium 2.72 0.166 .287 NS Control 0.41 2.479 .000 Sig.
Medium 2.72 72.1% Full 2.89 -0.166 .287 NS Control 0.41 2.314 .000 Sig.
Control 0.41 10.9% Full 2.89 -2.479 .000 Sig. Medium 2.72 -2.314 .000 Sig.
N=319 Sig < p 0.05 40 Item difficulty can range from 0.0 (none of the teachers answered the item correctly) to 1.0 (all of the teachers answered the item correctly). 41 Teachers in both treatment groups, Full and Medium, received the same training.
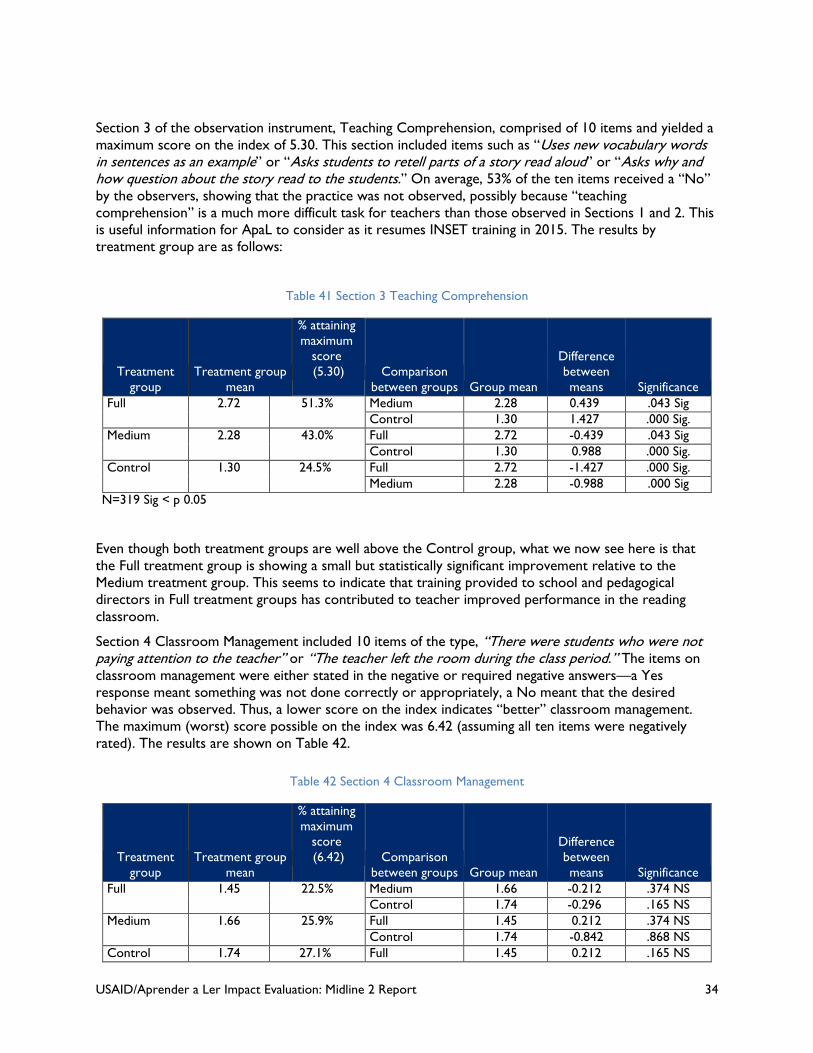
USAID/Aprender a Ler Impact Evaluation: Midline 2 Report 34
Section 3 of the observation instrument, Teaching Comprehension, comprised of 10 items and yielded a maximum score on the index of 5.30. This section included items such as “Uses new vocabulary words in sentences as an example” or “Asks students to retell parts of a story read aloud” or “Asks why and how question about the story read to the students.” On average, 53% of the ten items received a “No” by the observers, showing that the practice was not observed, possibly because “teaching comprehension” is a much more difficult task for teachers than those observed in Sections 1 and 2. This is useful information for ApaL to consider as it resumes INSET training in 2015. The results by treatment group are as follows:
Table 41 Section 3 Teaching Comprehension
Treatment group
Treatment group mean
% attaining maximum
score (5.30) Comparison
between groups Group mean
Difference between means Significance
Full 2.72 51.3% Medium 2.28 0.439 .043 Sig Control 1.30 1.427 .000 Sig.
Medium 2.28 43.0% Full 2.72 -0.439 .043 Sig Control 1.30 0.988 .000 Sig.
Control 1.30 24.5% Full 2.72 -1.427 .000 Sig. Medium 2.28 -0.988 .000 Sig
N=319 Sig < p 0.05
Even though both treatment groups are well above the Control group, what we now see here is that the Full treatment group is showing a small but statistically significant improvement relative to the Medium treatment group. This seems to indicate that training provided to school and pedagogical directors in Full treatment groups has contributed to teacher improved performance in the reading classroom.
Section 4 Classroom Management included 10 items of the type, “There were students who were not paying attention to the teacher” or “The teacher left the room during the class period.” The items on classroom management were either stated in the negative or required negative answers—a Yes response meant something was not done correctly or appropriately, a No meant that the desired behavior was observed. Thus, a lower score on the index indicates “better” classroom management. The maximum (worst) score possible on the index was 6.42 (assuming all ten items were negatively rated). The results are shown on Table 42.
Table 42 Section 4 Classroom Management
Treatment group
Treatment group mean
% attaining maximum
score (6.42) Comparison
between groups Group mean
Difference between means Significance
Full 1.45 22.5% Medium 1.66 -0.212 .374 NS Control 1.74 -0.296 .165 NS
Medium 1.66 25.9% Full 1.45 0.212 .374 NS Control 1.74 -0.842 .868 NS
Control 1.74 27.1% Full 1.45 0.212 .165 NS
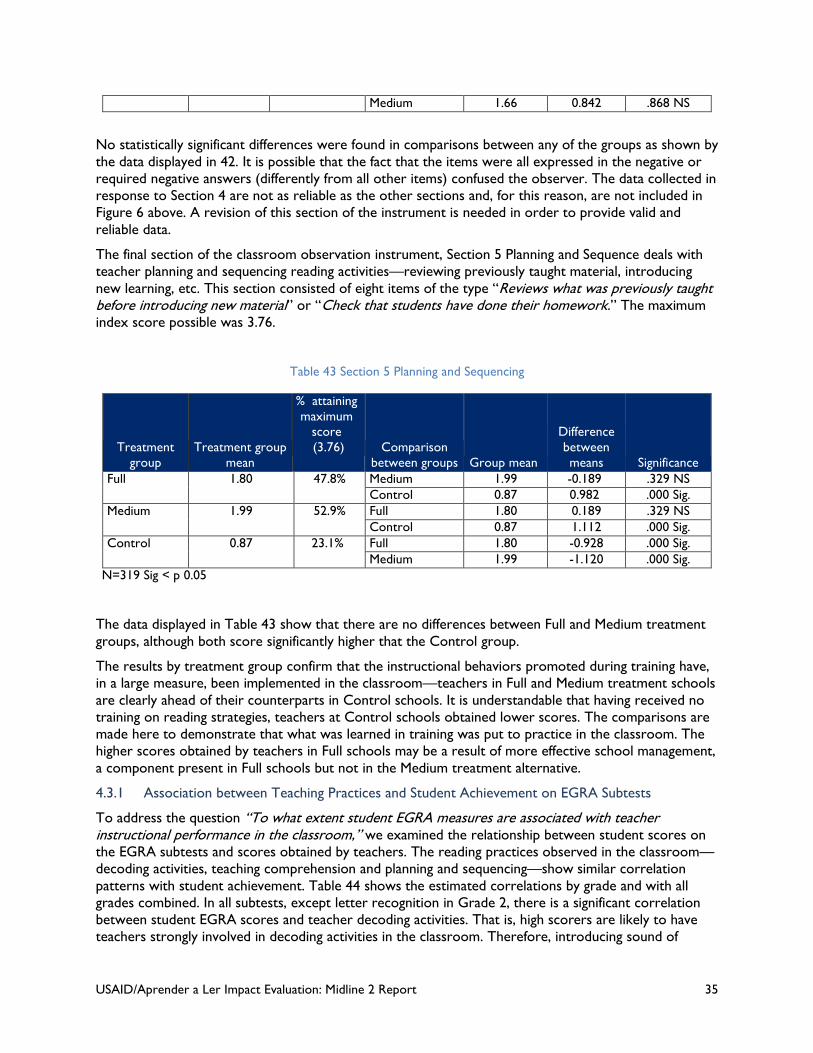
USAID/Aprender a Ler Impact Evaluation: Midline 2 Report 35
Medium 1.66 0.842 .868 NS
No statistically significant differences were found in comparisons between any of the groups as shown by the data displayed in 42. It is possible that the fact that the items were all expressed in the negative or required negative answers (differently from all other items) confused the observer. The data collected in response to Section 4 are not as reliable as the other sections and, for this reason, are not included in Figure 6 above. A revision of this section of the instrument is needed in order to provide valid and reliable data.
The final section of the classroom observation instrument, Section 5 Planning and Sequence deals with teacher planning and sequencing reading activities—reviewing previously taught material, introducing new learning, etc. This section consisted of eight items of the type “Reviews what was previously taught before introducing new material” or “Check that students have done their homework.” The maximum index score possible was 3.76.
Table 43 Section 5 Planning and Sequencing
Treatment group
Treatment group mean
% attaining maximum
score (3.76) Comparison
between groups Group mean
Difference between means Significance
Full 1.80 47.8% Medium 1.99 -0.189 .329 NS Control 0.87 0.982 .000 Sig.
Medium 1.99 52.9% Full 1.80 0.189 .329 NS Control 0.87 1.112 .000 Sig.
Control 0.87 23.1% Full 1.80 -0.928 .000 Sig. Medium 1.99 -1.120 .000 Sig.
N=319 Sig < p 0.05
The data displayed in Table 43 show that there are no differences between Full and Medium treatment groups, although both score significantly higher that the Control group.
The results by treatment group confirm that the instructional behaviors promoted during training have, in a large measure, been implemented in the classroom—teachers in Full and Medium treatment schools are clearly ahead of their counterparts in Control schools. It is understandable that having received no training on reading strategies, teachers at Control schools obtained lower scores. The comparisons are made here to demonstrate that what was learned in training was put to practice in the classroom. The higher scores obtained by teachers in Full schools may be a result of more effective school management, a component present in Full schools but not in the Medium treatment alternative.
4.3.1 Association between Teaching Practices and Student Achievement on EGRA Subtests
To address the question “To what extent student EGRA measures are associated with teacher instructional performance in the classroom,” we examined the relationship between student scores on the EGRA subtests and scores obtained by teachers. The reading practices observed in the classroom—decoding activities, teaching comprehension and planning and sequencing—show similar correlation patterns with student achievement. Table 44 shows the estimated correlations by grade and with all grades combined. In all subtests, except letter recognition in Grade 2, there is a significant correlation between student EGRA scores and teacher decoding activities. That is, high scorers are likely to have teachers strongly involved in decoding activities in the classroom. Therefore, introducing sound of
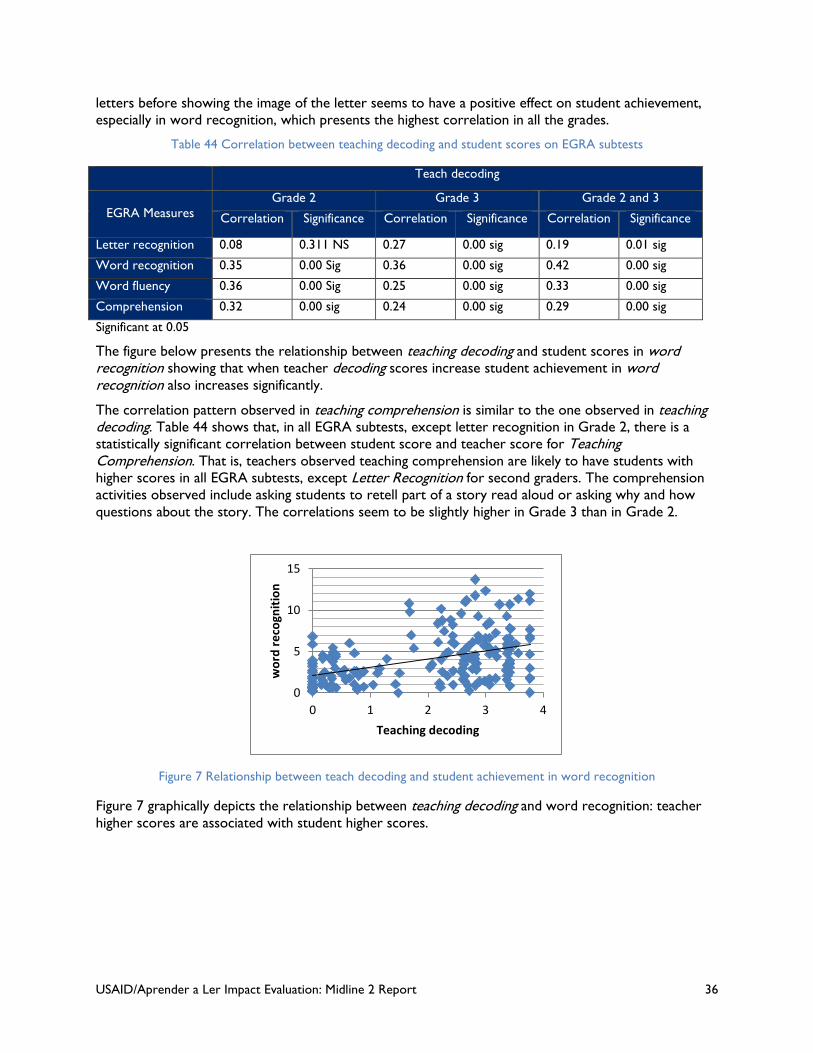
USAID/Aprender a Ler Impact Evaluation: Midline 2 Report 36
letters before showing the image of the letter seems to have a positive effect on student achievement, especially in word recognition, which presents the highest correlation in all the grades.
Table 44 Correlation between teaching decoding and student scores on EGRA subtests
Teach decoding
EGRA Measures
Grade 2 Grade 3 Grade 2 and 3
Correlation Significance Correlation Significance Correlation Significance
Letter recognition 0.08 0.311 NS 0.27 0.00 sig 0.19 0.01 sig
Word recognition 0.35 0.00 Sig 0.36 0.00 sig 0.42 0.00 sig
Word fluency 0.36 0.00 Sig 0.25 0.00 sig 0.33 0.00 sig
Comprehension 0.32 0.00 sig 0.24 0.00 sig 0.29 0.00 sig
Significant at 0.05
The figure below presents the relationship between teaching decoding and student scores in word recognition showing that when teacher decoding scores increase student achievement in word recognition also increases significantly.
The correlation pattern observed in teaching comprehension is similar to the one observed in teaching decoding. Table 44 shows that, in all EGRA subtests, except letter recognition in Grade 2, there is a statistically significant correlation between student score and teacher score for Teaching Comprehension. That is, teachers observed teaching comprehension are likely to have students with higher scores in all EGRA subtests, except Letter Recognition for second graders. The comprehension activities observed include asking students to retell part of a story read aloud or asking why and how questions about the story. The correlations seem to be slightly higher in Grade 3 than in Grade 2.
Figure 7 Relationship between teach decoding and student achievement in word recognition
Figure 7 graphically depicts the relationship between teaching decoding and word recognition: teacher higher scores are associated with student higher scores.
0
5
10
15
0 1 2 3 4
wor
d re
cogn
ition
Teaching decoding
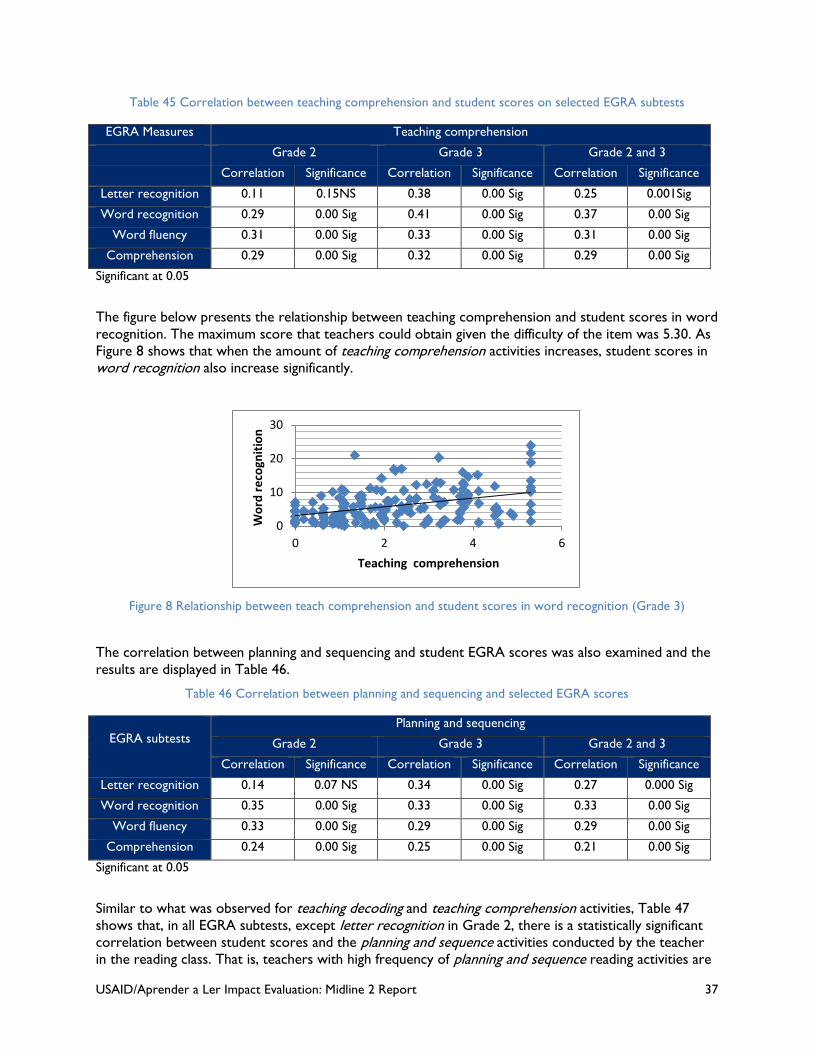
USAID/Aprender a Ler Impact Evaluation: Midline 2 Report 37
Table 45 Correlation between teaching comprehension and student scores on selected EGRA subtests
EGRA Measures Teaching comprehension
Grade 2 Grade 3 Grade 2 and 3
Correlation Significance Correlation Significance Correlation Significance
Letter recognition 0.11 0.15NS 0.38 0.00 Sig 0.25 0.001Sig
Word recognition 0.29 0.00 Sig 0.41 0.00 Sig 0.37 0.00 Sig
Word fluency 0.31 0.00 Sig 0.33 0.00 Sig 0.31 0.00 Sig
Comprehension 0.29 0.00 Sig 0.32 0.00 Sig 0.29 0.00 Sig
Significant at 0.05
The figure below presents the relationship between teaching comprehension and student scores in word recognition. The maximum score that teachers could obtain given the difficulty of the item was 5.30. As Figure 8 shows that when the amount of teaching comprehension activities increases, student scores in word recognition also increase significantly.
Figure 8 Relationship between teach comprehension and student scores in word recognition (Grade 3)
The correlation between planning and sequencing and student EGRA scores was also examined and the results are displayed in Table 46.
Table 46 Correlation between planning and sequencing and selected EGRA scores
EGRA subtests
Planning and sequencing
Grade 2 Grade 3 Grade 2 and 3 Correlation Significance Correlation Significance Correlation Significance
Letter recognition 0.14 0.07 NS 0.34 0.00 Sig 0.27 0.000 Sig
Word recognition 0.35 0.00 Sig 0.33 0.00 Sig 0.33 0.00 Sig
Word fluency 0.33 0.00 Sig 0.29 0.00 Sig 0.29 0.00 Sig
Comprehension 0.24 0.00 Sig 0.25 0.00 Sig 0.21 0.00 Sig
Significant at 0.05
Similar to what was observed for teaching decoding and teaching comprehension activities, Table 47 shows that, in all EGRA subtests, except letter recognition in Grade 2, there is a statistically significant correlation between student scores and the planning and sequence activities conducted by the teacher in the reading class. That is, teachers with high frequency of planning and sequence reading activities are
0
10
20
30
0 2 4 6
Wor
d re
cogn
ition
Teaching comprehension
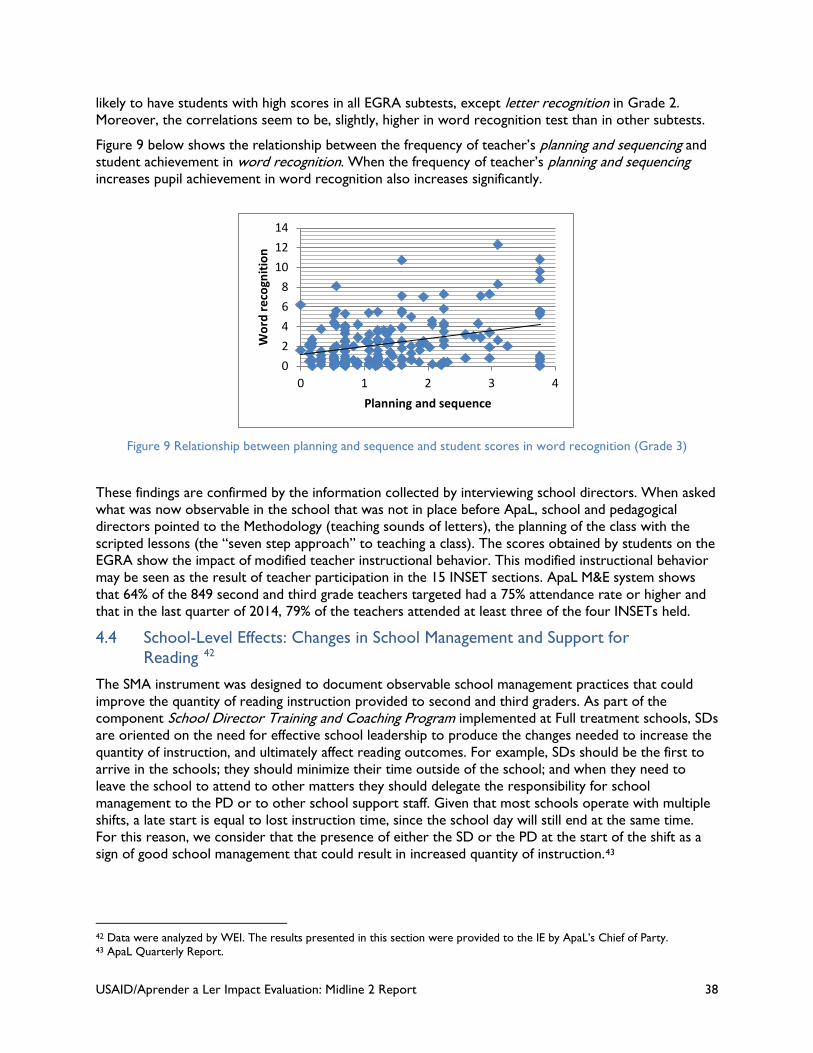
USAID/Aprender a Ler Impact Evaluation: Midline 2 Report 38
likely to have students with high scores in all EGRA subtests, except letter recognition in Grade 2. Moreover, the correlations seem to be, slightly, higher in word recognition test than in other subtests.
Figure 9 below shows the relationship between the frequency of teacher’s planning and sequencing and student achievement in word recognition. When the frequency of teacher’s planning and sequencing increases pupil achievement in word recognition also increases significantly.
Figure 9 Relationship between planning and sequence and student scores in word recognition (Grade 3)
These findings are confirmed by the information collected by interviewing school directors. When asked what was now observable in the school that was not in place before ApaL, school and pedagogical directors pointed to the Methodology (teaching sounds of letters), the planning of the class with the scripted lessons (the “seven step approach” to teaching a class). The scores obtained by students on the EGRA show the impact of modified teacher instructional behavior. This modified instructional behavior may be seen as the result of teacher participation in the 15 INSET sections. ApaL M&E system shows that 64% of the 849 second and third grade teachers targeted had a 75% attendance rate or higher and that in the last quarter of 2014, 79% of the teachers attended at least three of the four INSETs held.
4.4 School-Level Effects: Changes in School Management and Support for Reading 42
The SMA instrument was designed to document observable school management practices that could improve the quantity of reading instruction provided to second and third graders. As part of the component School Director Training and Coaching Program implemented at Full treatment schools, SDs are oriented on the need for effective school leadership to produce the changes needed to increase the quantity of instruction, and ultimately affect reading outcomes. For example, SDs should be the first to arrive in the schools; they should minimize their time outside of the school; and when they need to leave the school to attend to other matters they should delegate the responsibility for school management to the PD or to other school support staff. Given that most schools operate with multiple shifts, a late start is equal to lost instruction time, since the school day will still end at the same time. For this reason, we consider that the presence of either the SD or the PD at the start of the shift as a sign of good school management that could result in increased quantity of instruction.43
42 Data were analyzed by WEI. The results presented in this section were provided to the IE by ApaL’s Chief of Party. 43 ApaL Quarterly Report.
02468
101214
0 1 2 3 4
Wor
d re
cogn
ition
Planning and sequence
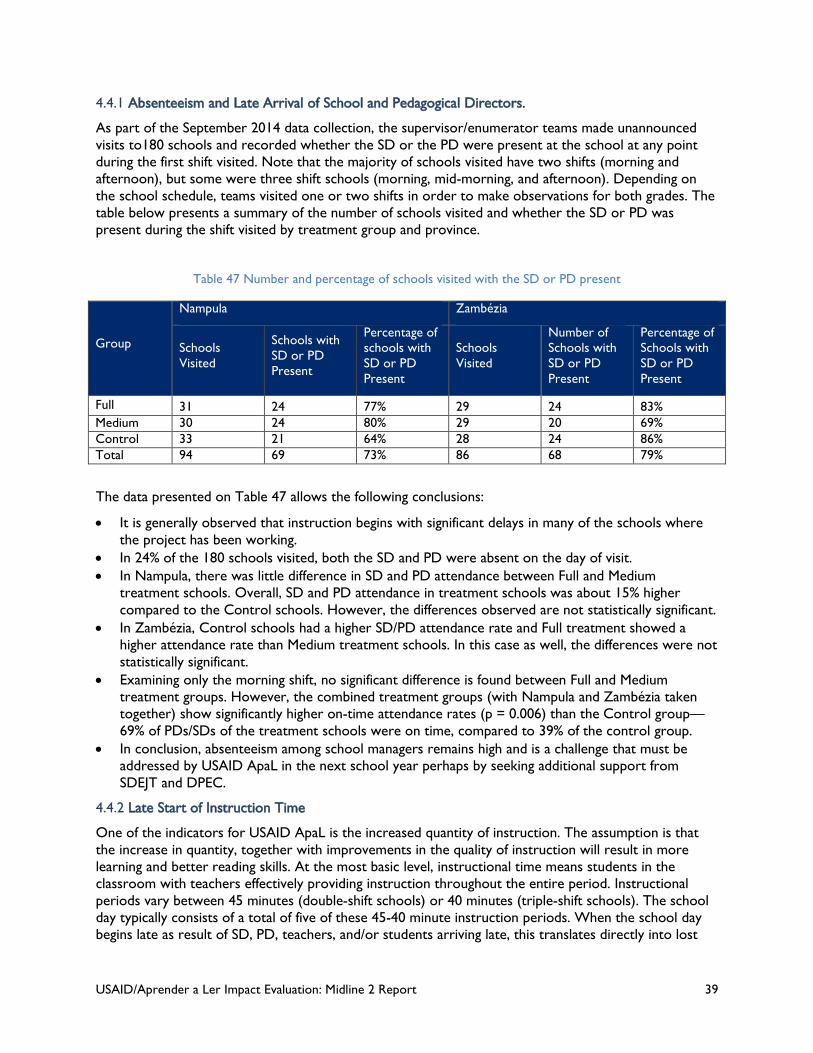
USAID/Aprender a Ler Impact Evaluation: Midline 2 Report 39
4.4.1 Absenteeism and Late Arrival of School and Pedagogical Directors.
As part of the September 2014 data collection, the supervisor/enumerator teams made unannounced visits to180 schools and recorded whether the SD or the PD were present at the school at any point during the first shift visited. Note that the majority of schools visited have two shifts (morning and afternoon), but some were three shift schools (morning, mid-morning, and afternoon). Depending on the school schedule, teams visited one or two shifts in order to make observations for both grades. The table below presents a summary of the number of schools visited and whether the SD or PD was present during the shift visited by treatment group and province.
Table 47 Number and percentage of schools visited with the SD or PD present
Group
Nampula Zambézia
Schools Visited
Schools with SD or PD Present
Percentage of schools with SD or PD Present
Schools Visited
Number of Schools with SD or PD Present
Percentage of Schools with SD or PD Present
Full 31 24 77% 29 24 83% Medium 30 24 80% 29 20 69% Control 33 21 64% 28 24 86% Total 94 69 73% 86 68 79%
The data presented on Table 47 allows the following conclusions:
• It is generally observed that instruction begins with significant delays in many of the schools where the project has been working.
• In 24% of the 180 schools visited, both the SD and PD were absent on the day of visit. • In Nampula, there was little difference in SD and PD attendance between Full and Medium
treatment schools. Overall, SD and PD attendance in treatment schools was about 15% higher compared to the Control schools. However, the differences observed are not statistically significant.
• In Zambézia, Control schools had a higher SD/PD attendance rate and Full treatment showed a higher attendance rate than Medium treatment schools. In this case as well, the differences were not statistically significant.
• Examining only the morning shift, no significant difference is found between Full and Medium treatment groups. However, the combined treatment groups (with Nampula and Zambézia taken together) show significantly higher on-time attendance rates (p = 0.006) than the Control group—69% of PDs/SDs of the treatment schools were on time, compared to 39% of the control group.
• In conclusion, absenteeism among school managers remains high and is a challenge that must be addressed by USAID ApaL in the next school year perhaps by seeking additional support from SDEJT and DPEC.
4.4.2 Late Start of Instruction Time
One of the indicators for USAID ApaL is the increased quantity of instruction. The assumption is that the increase in quantity, together with improvements in the quality of instruction will result in more learning and better reading skills. At the most basic level, instructional time means students in the classroom with teachers effectively providing instruction throughout the entire period. Instructional periods vary between 45 minutes (double-shift schools) or 40 minutes (triple-shift schools). The school day typically consists of a total of five of these 45-40 minute instruction periods. When the school day begins late as result of SD, PD, teachers, and/or students arriving late, this translates directly into lost
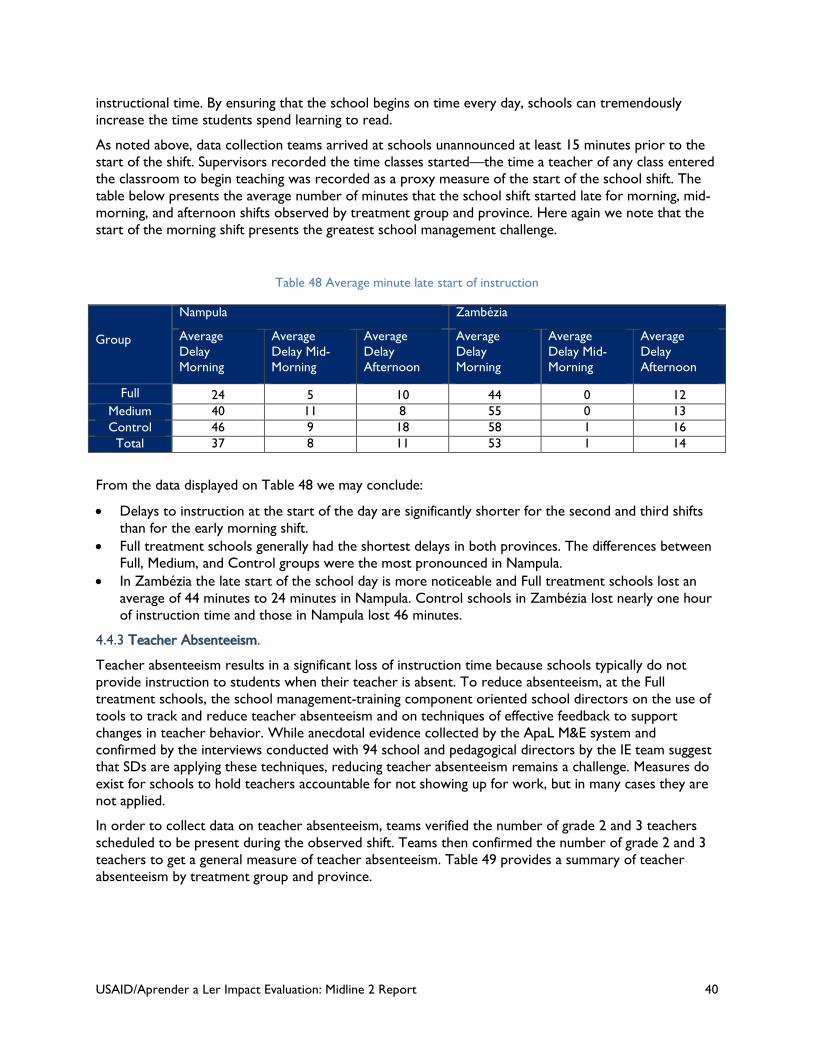
USAID/Aprender a Ler Impact Evaluation: Midline 2 Report 40
instructional time. By ensuring that the school begins on time every day, schools can tremendously increase the time students spend learning to read.
As noted above, data collection teams arrived at schools unannounced at least 15 minutes prior to the start of the shift. Supervisors recorded the time classes started—the time a teacher of any class entered the classroom to begin teaching was recorded as a proxy measure of the start of the school shift. The table below presents the average number of minutes that the school shift started late for morning, mid-morning, and afternoon shifts observed by treatment group and province. Here again we note that the start of the morning shift presents the greatest school management challenge.
Table 48 Average minute late start of instruction
Group
Nampula Zambézia
Average Delay Morning
Average Delay Mid-Morning
Average Delay Afternoon
Average Delay Morning
Average Delay Mid-Morning
Average Delay Afternoon
Full 24 5 10 44 0 12 Medium 40 11 8 55 0 13 Control 46 9 18 58 1 16
Total 37 8 11 53 1 14
From the data displayed on Table 48 we may conclude:
• Delays to instruction at the start of the day are significantly shorter for the second and third shifts than for the early morning shift.
• Full treatment schools generally had the shortest delays in both provinces. The differences between Full, Medium, and Control groups were the most pronounced in Nampula.
• In Zambézia the late start of the school day is more noticeable and Full treatment schools lost an average of 44 minutes to 24 minutes in Nampula. Control schools in Zambézia lost nearly one hour of instruction time and those in Nampula lost 46 minutes.
4.4.3 Teacher Absenteeism.
Teacher absenteeism results in a significant loss of instruction time because schools typically do not provide instruction to students when their teacher is absent. To reduce absenteeism, at the Full treatment schools, the school management-training component oriented school directors on the use of tools to track and reduce teacher absenteeism and on techniques of effective feedback to support changes in teacher behavior. While anecdotal evidence collected by the ApaL M&E system and confirmed by the interviews conducted with 94 school and pedagogical directors by the IE team suggest that SDs are applying these techniques, reducing teacher absenteeism remains a challenge. Measures do exist for schools to hold teachers accountable for not showing up for work, but in many cases they are not applied.
In order to collect data on teacher absenteeism, teams verified the number of grade 2 and 3 teachers scheduled to be present during the observed shift. Teams then confirmed the number of grade 2 and 3 teachers to get a general measure of teacher absenteeism. Table 49 provides a summary of teacher absenteeism by treatment group and province.
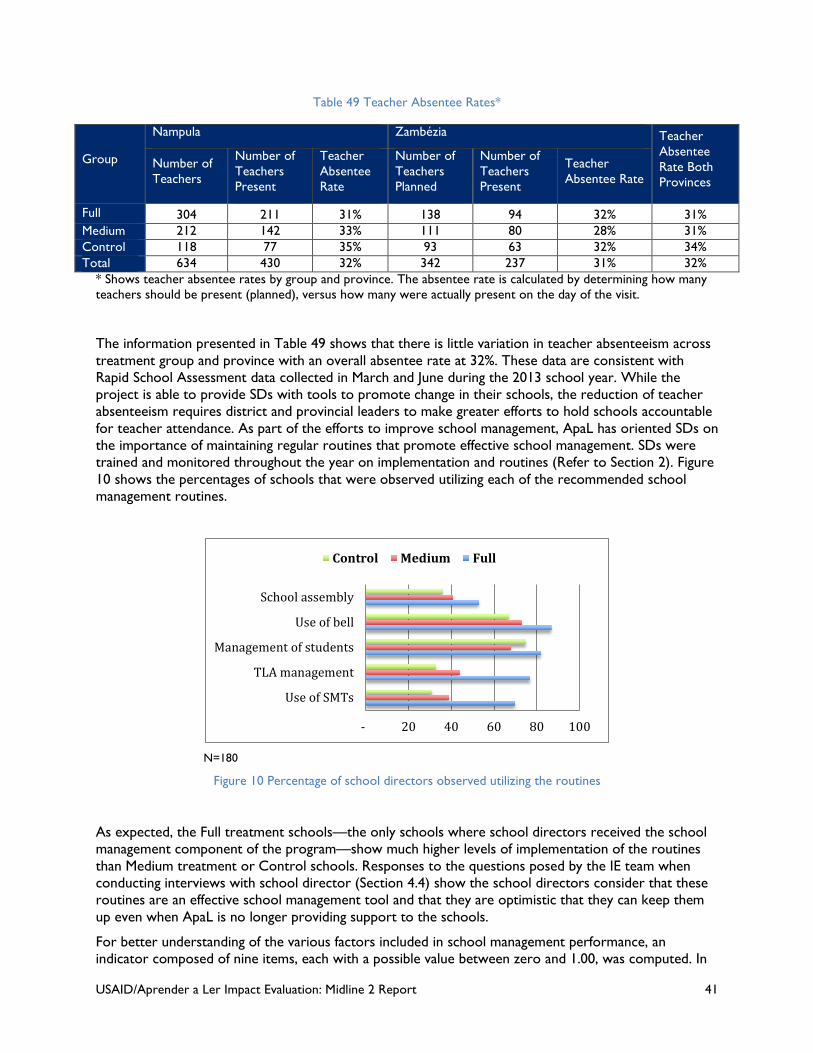
USAID/Aprender a Ler Impact Evaluation: Midline 2 Report 41
Table 49 Teacher Absentee Rates*
Group
Nampula Zambézia Teacher Absentee Rate Both Provinces
Number of Teachers
Number of Teachers Present
Teacher Absentee Rate
Number of Teachers Planned
Number of Teachers Present
Teacher Absentee Rate
Full 304 211 31% 138 94 32% 31% Medium 212 142 33% 111 80 28% 31% Control 118 77 35% 93 63 32% 34% Total 634 430 32% 342 237 31% 32%
* Shows teacher absentee rates by group and province. The absentee rate is calculated by determining how many teachers should be present (planned), versus how many were actually present on the day of the visit.
The information presented in Table 49 shows that there is little variation in teacher absenteeism across treatment group and province with an overall absentee rate at 32%. These data are consistent with Rapid School Assessment data collected in March and June during the 2013 school year. While the project is able to provide SDs with tools to promote change in their schools, the reduction of teacher absenteeism requires district and provincial leaders to make greater efforts to hold schools accountable for teacher attendance. As part of the efforts to improve school management, ApaL has oriented SDs on the importance of maintaining regular routines that promote effective school management. SDs were trained and monitored throughout the year on implementation and routines (Refer to Section 2). Figure 10 shows the percentages of schools that were observed utilizing each of the recommended school management routines.
N=180
Figure 10 Percentage of school directors observed utilizing the routines
As expected, the Full treatment schools—the only schools where school directors received the school management component of the program—show much higher levels of implementation of the routines than Medium treatment or Control schools. Responses to the questions posed by the IE team when conducting interviews with school director (Section 4.4) show the school directors consider that these routines are an effective school management tool and that they are optimistic that they can keep them up even when ApaL is no longer providing support to the schools.
For better understanding of the various factors included in school management performance, an indicator composed of nine items, each with a possible value between zero and 1.00, was computed. In
- 20 40 60 80 100
Use of SMTs
TLA management
Management of students
Use of bell
School assembly
Control Medium Full
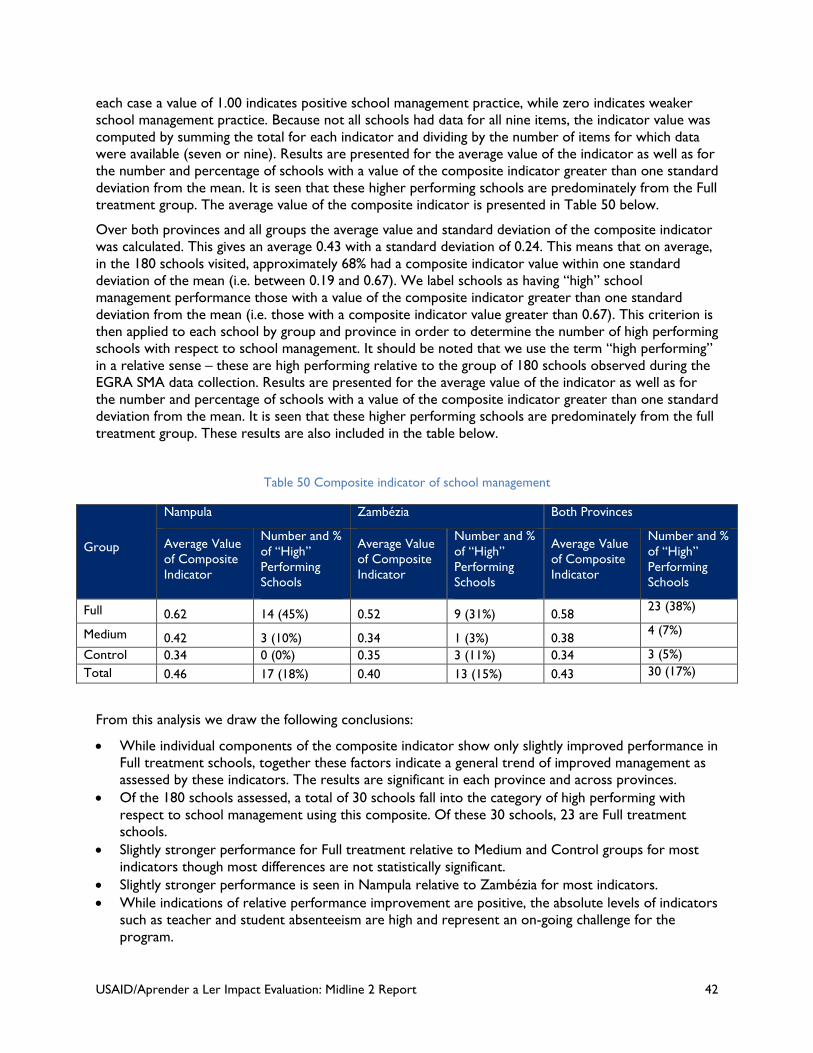
USAID/Aprender a Ler Impact Evaluation: Midline 2 Report 42
each case a value of 1.00 indicates positive school management practice, while zero indicates weaker school management practice. Because not all schools had data for all nine items, the indicator value was computed by summing the total for each indicator and dividing by the number of items for which data were available (seven or nine). Results are presented for the average value of the indicator as well as for the number and percentage of schools with a value of the composite indicator greater than one standard deviation from the mean. It is seen that these higher performing schools are predominately from the Full treatment group. The average value of the composite indicator is presented in Table 50 below.
Over both provinces and all groups the average value and standard deviation of the composite indicator was calculated. This gives an average 0.43 with a standard deviation of 0.24. This means that on average, in the 180 schools visited, approximately 68% had a composite indicator value within one standard deviation of the mean (i.e. between 0.19 and 0.67). We label schools as having “high” school management performance those with a value of the composite indicator greater than one standard deviation from the mean (i.e. those with a composite indicator value greater than 0.67). This criterion is then applied to each school by group and province in order to determine the number of high performing schools with respect to school management. It should be noted that we use the term “high performing” in a relative sense – these are high performing relative to the group of 180 schools observed during the EGRA SMA data collection. Results are presented for the average value of the indicator as well as for the number and percentage of schools with a value of the composite indicator greater than one standard deviation from the mean. It is seen that these higher performing schools are predominately from the full treatment group. These results are also included in the table below.
Table 50 Composite indicator of school management
Group
Nampula Zambézia Both Provinces
Average Value of Composite Indicator
Number and % of “High” Performing Schools
Average Value of Composite Indicator
Number and % of “High” Performing Schools
Average Value of Composite Indicator
Number and % of “High” Performing Schools
Full 0.62 14 (45%) 0.52 9 (31%) 0.58 23 (38%)
Medium 0.42 3 (10%) 0.34 1 (3%) 0.38 4 (7%)
Control 0.34 0 (0%) 0.35 3 (11%) 0.34 3 (5%) Total 0.46 17 (18%) 0.40 13 (15%) 0.43 30 (17%)
From this analysis we draw the following conclusions:
• While individual components of the composite indicator show only slightly improved performance in Full treatment schools, together these factors indicate a general trend of improved management as assessed by these indicators. The results are significant in each province and across provinces.
• Of the 180 schools assessed, a total of 30 schools fall into the category of high performing with respect to school management using this composite. Of these 30 schools, 23 are Full treatment schools.
• Slightly stronger performance for Full treatment relative to Medium and Control groups for most indicators though most differences are not statistically significant.
• Slightly stronger performance is seen in Nampula relative to Zambézia for most indicators. • While indications of relative performance improvement are positive, the absolute levels of indicators
such as teacher and student absenteeism are high and represent an on-going challenge for the program.
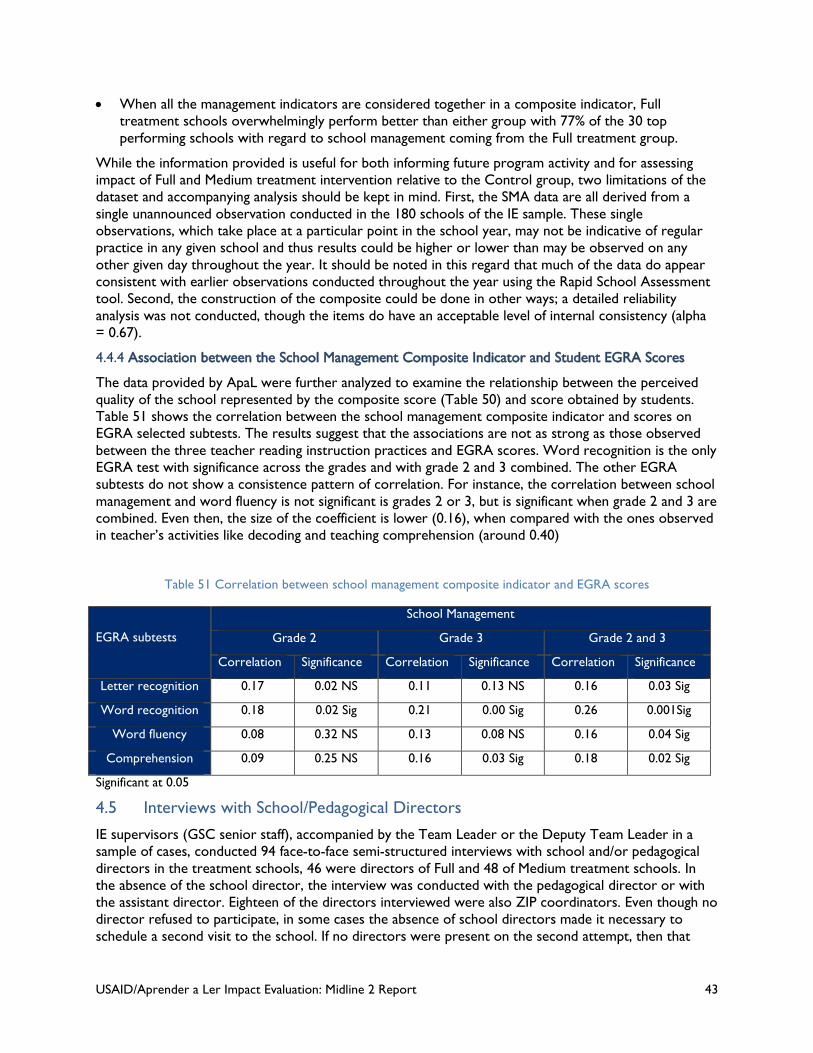
USAID/Aprender a Ler Impact Evaluation: Midline 2 Report 43
• When all the management indicators are considered together in a composite indicator, Full treatment schools overwhelmingly perform better than either group with 77% of the 30 top performing schools with regard to school management coming from the Full treatment group.
While the information provided is useful for both informing future program activity and for assessing impact of Full and Medium treatment intervention relative to the Control group, two limitations of the dataset and accompanying analysis should be kept in mind. First, the SMA data are all derived from a single unannounced observation conducted in the 180 schools of the IE sample. These single observations, which take place at a particular point in the school year, may not be indicative of regular practice in any given school and thus results could be higher or lower than may be observed on any other given day throughout the year. It should be noted in this regard that much of the data do appear consistent with earlier observations conducted throughout the year using the Rapid School Assessment tool. Second, the construction of the composite could be done in other ways; a detailed reliability analysis was not conducted, though the items do have an acceptable level of internal consistency (alpha = 0.67).
4.4.4 Association between the School Management Composite Indicator and Student EGRA Scores
The data provided by ApaL were further analyzed to examine the relationship between the perceived quality of the school represented by the composite score (Table 50) and score obtained by students. Table 51 shows the correlation between the school management composite indicator and scores on EGRA selected subtests. The results suggest that the associations are not as strong as those observed between the three teacher reading instruction practices and EGRA scores. Word recognition is the only EGRA test with significance across the grades and with grade 2 and 3 combined. The other EGRA subtests do not show a consistence pattern of correlation. For instance, the correlation between school management and word fluency is not significant is grades 2 or 3, but is significant when grade 2 and 3 are combined. Even then, the size of the coefficient is lower (0.16), when compared with the ones observed in teacher’s activities like decoding and teaching comprehension (around 0.40)
Table 51 Correlation between school management composite indicator and EGRA scores
EGRA subtests
School Management
Grade 2 Grade 3 Grade 2 and 3
Correlation Significance Correlation Significance Correlation Significance
Letter recognition 0.17 0.02 NS 0.11 0.13 NS 0.16 0.03 Sig
Word recognition 0.18 0.02 Sig 0.21 0.00 Sig 0.26 0.001Sig
Word fluency 0.08 0.32 NS 0.13 0.08 NS 0.16 0.04 Sig
Comprehension 0.09 0.25 NS 0.16 0.03 Sig 0.18 0.02 Sig
Significant at 0.05
4.5 Interviews with School/Pedagogical Directors
IE supervisors (GSC senior staff), accompanied by the Team Leader or the Deputy Team Leader in a sample of cases, conducted 94 face-to-face semi-structured interviews with school and/or pedagogical directors in the treatment schools, 46 were directors of Full and 48 of Medium treatment schools. In the absence of the school director, the interview was conducted with the pedagogical director or with the assistant director. Eighteen of the directors interviewed were also ZIP coordinators. Even though no director refused to participate, in some cases the absence of school directors made it necessary to schedule a second visit to the school. If no directors were present on the second attempt, then that
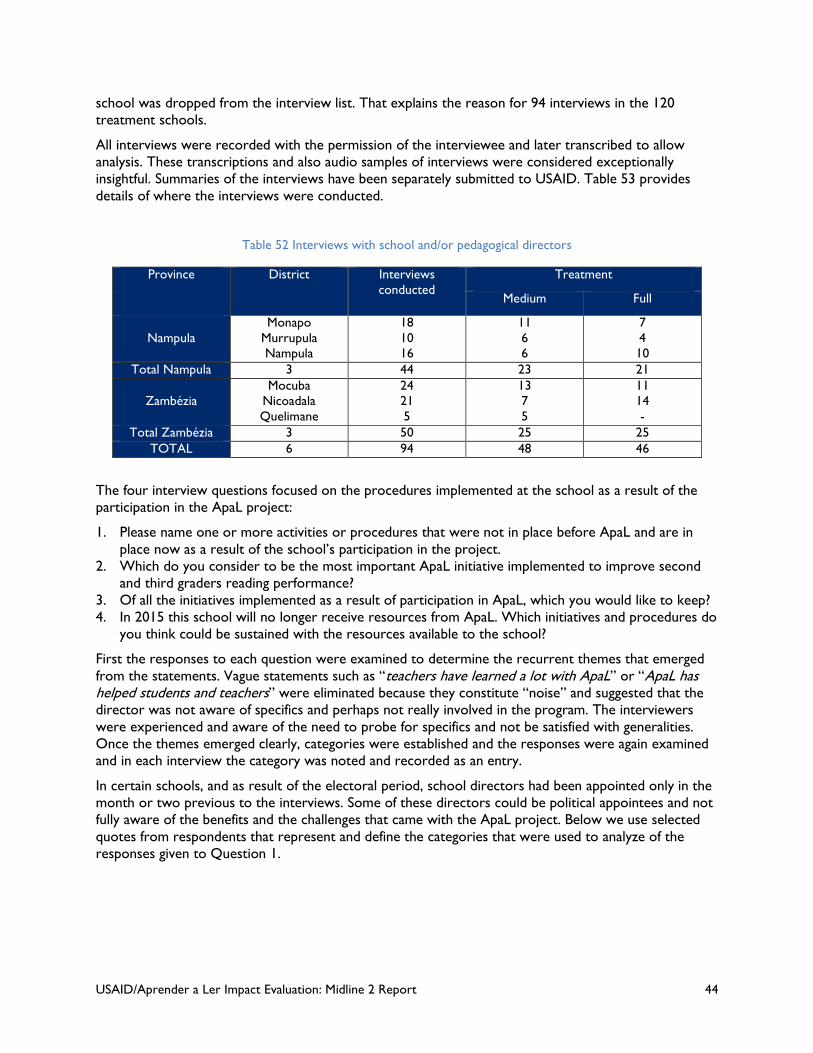
USAID/Aprender a Ler Impact Evaluation: Midline 2 Report 44
school was dropped from the interview list. That explains the reason for 94 interviews in the 120 treatment schools.
All interviews were recorded with the permission of the interviewee and later transcribed to allow analysis. These transcriptions and also audio samples of interviews were considered exceptionally insightful. Summaries of the interviews have been separately submitted to USAID. Table 53 provides details of where the interviews were conducted.
Table 52 Interviews with school and/or pedagogical directors
Province District Interviews conducted
Treatment
Medium Full
Nampula
Monapo Murrupula Nampula
18 10 16
11 6 6
7 4 10
Total Nampula 3 44 23 21
Zambézia Mocuba
Nicoadala Quelimane
24 21 5
13 7 5
11 14 -
Total Zambézia 3 50 25 25 TOTAL 6 94 48 46
The four interview questions focused on the procedures implemented at the school as a result of the participation in the ApaL project:
1. Please name one or more activities or procedures that were not in place before ApaL and are in place now as a result of the school’s participation in the project.
2. Which do you consider to be the most important ApaL initiative implemented to improve second and third graders reading performance?
3. Of all the initiatives implemented as a result of participation in ApaL, which you would like to keep? 4. In 2015 this school will no longer receive resources from ApaL. Which initiatives and procedures do
you think could be sustained with the resources available to the school?
First the responses to each question were examined to determine the recurrent themes that emerged from the statements. Vague statements such as “teachers have learned a lot with ApaL” or “ApaL has helped students and teachers” were eliminated because they constitute “noise” and suggested that the director was not aware of specifics and perhaps not really involved in the program. The interviewers were experienced and aware of the need to probe for specifics and not be satisfied with generalities. Once the themes emerged clearly, categories were established and the responses were again examined and in each interview the category was noted and recorded as an entry.
In certain schools, and as result of the electoral period, school directors had been appointed only in the month or two previous to the interviews. Some of these directors could be political appointees and not fully aware of the benefits and the challenges that came with the ApaL project. Below we use selected quotes from respondents that represent and define the categories that were used to analyze of the responses given to Question 1.
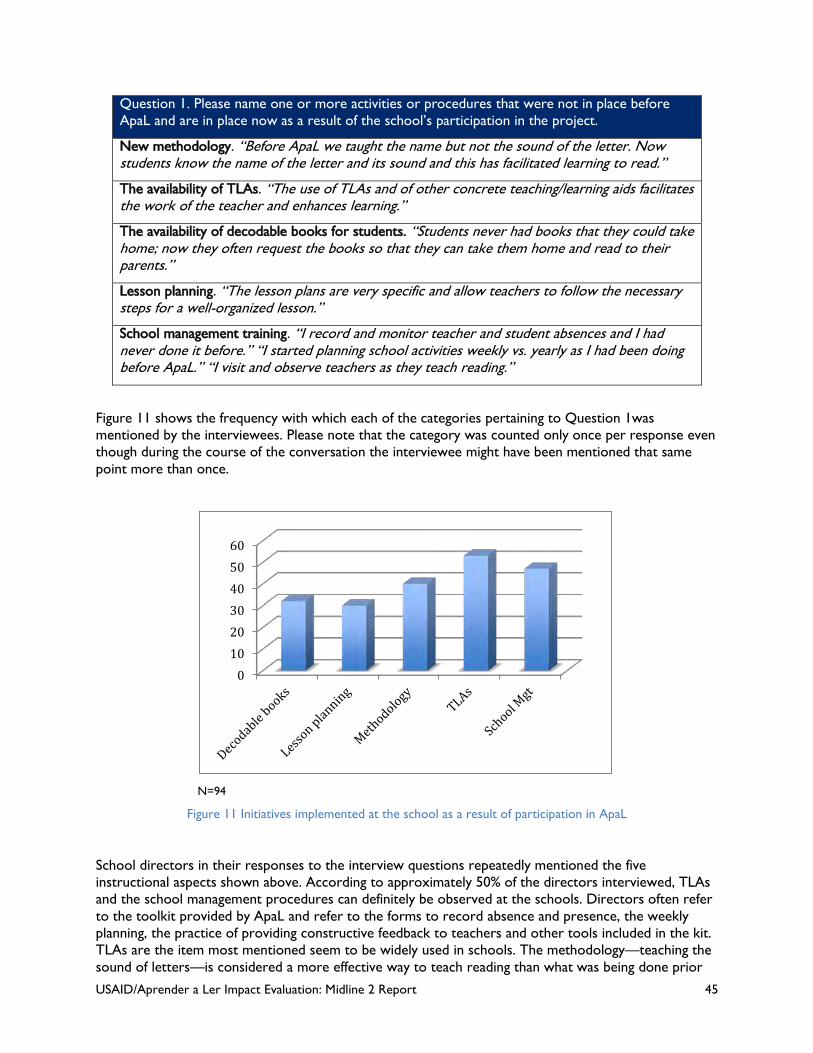
USAID/Aprender a Ler Impact Evaluation: Midline 2 Report 45
Question 1. Please name one or more activities or procedures that were not in place before ApaL and are in place now as a result of the school’s participation in the project.
New methodology. “Before ApaL we taught the name but not the sound of the letter. Now students know the name of the letter and its sound and this has facilitated learning to read.”
The availability of TLAs. “The use of TLAs and of other concrete teaching/learning aids facilitates the work of the teacher and enhances learning.”
The availability of decodable books for students. “Students never had books that they could take home; now they often request the books so that they can take them home and read to their parents.”
Lesson planning. “The lesson plans are very specific and allow teachers to follow the necessary steps for a well-organized lesson.”
School management training. “I record and monitor teacher and student absences and I had never done it before.” “I started planning school activities weekly vs. yearly as I had been doing before ApaL.” “I visit and observe teachers as they teach reading.”
Figure 11 shows the frequency with which each of the categories pertaining to Question 1was mentioned by the interviewees. Please note that the category was counted only once per response even though during the course of the conversation the interviewee might have been mentioned that same point more than once.
N=94
Figure 11 Initiatives implemented at the school as a result of participation in ApaL
School directors in their responses to the interview questions repeatedly mentioned the five instructional aspects shown above. According to approximately 50% of the directors interviewed, TLAs and the school management procedures can definitely be observed at the schools. Directors often refer to the toolkit provided by ApaL and refer to the forms to record absence and presence, the weekly planning, the practice of providing constructive feedback to teachers and other tools included in the kit. TLAs are the item most mentioned seem to be widely used in schools. The methodology—teaching the sound of letters—is considered a more effective way to teach reading than what was being done prior
0102030405060
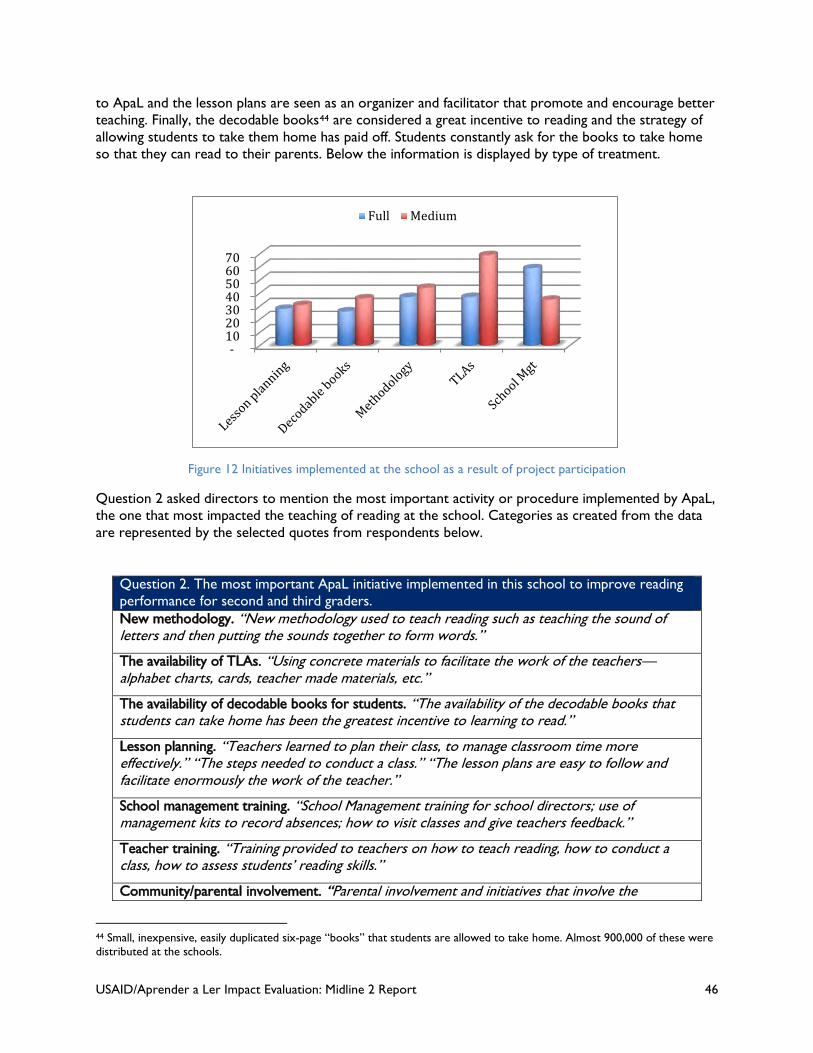
USAID/Aprender a Ler Impact Evaluation: Midline 2 Report 46
to ApaL and the lesson plans are seen as an organizer and facilitator that promote and encourage better teaching. Finally, the decodable books44 are considered a great incentive to reading and the strategy of allowing students to take them home has paid off. Students constantly ask for the books to take home so that they can read to their parents. Below the information is displayed by type of treatment.
Figure 12 Initiatives implemented at the school as a result of project participation
Question 2 asked directors to mention the most important activity or procedure implemented by ApaL, the one that most impacted the teaching of reading at the school. Categories as created from the data are represented by the selected quotes from respondents below.
Question 2. The most important ApaL initiative implemented in this school to improve reading performance for second and third graders. New methodology. “New methodology used to teach reading such as teaching the sound of letters and then putting the sounds together to form words.”
The availability of TLAs. “Using concrete materials to facilitate the work of the teachers—alphabet charts, cards, teacher made materials, etc.”
The availability of decodable books for students. “The availability of the decodable books that students can take home has been the greatest incentive to learning to read.”
Lesson planning. “Teachers learned to plan their class, to manage classroom time more effectively.” “The steps needed to conduct a class.” “The lesson plans are easy to follow and facilitate enormously the work of the teacher.”
School management training. “School Management training for school directors; use of management kits to record absences; how to visit classes and give teachers feedback.”
Teacher training. “Training provided to teachers on how to teach reading, how to conduct a class, how to assess students’ reading skills.”
Community/parental involvement. “Parental involvement and initiatives that involve the
44 Small, inexpensive, easily duplicated six-page “books” that students are allowed to take home. Almost 900,000 of these were distributed at the schools.
- 10 20 30 40 50 60 70
Full Medium
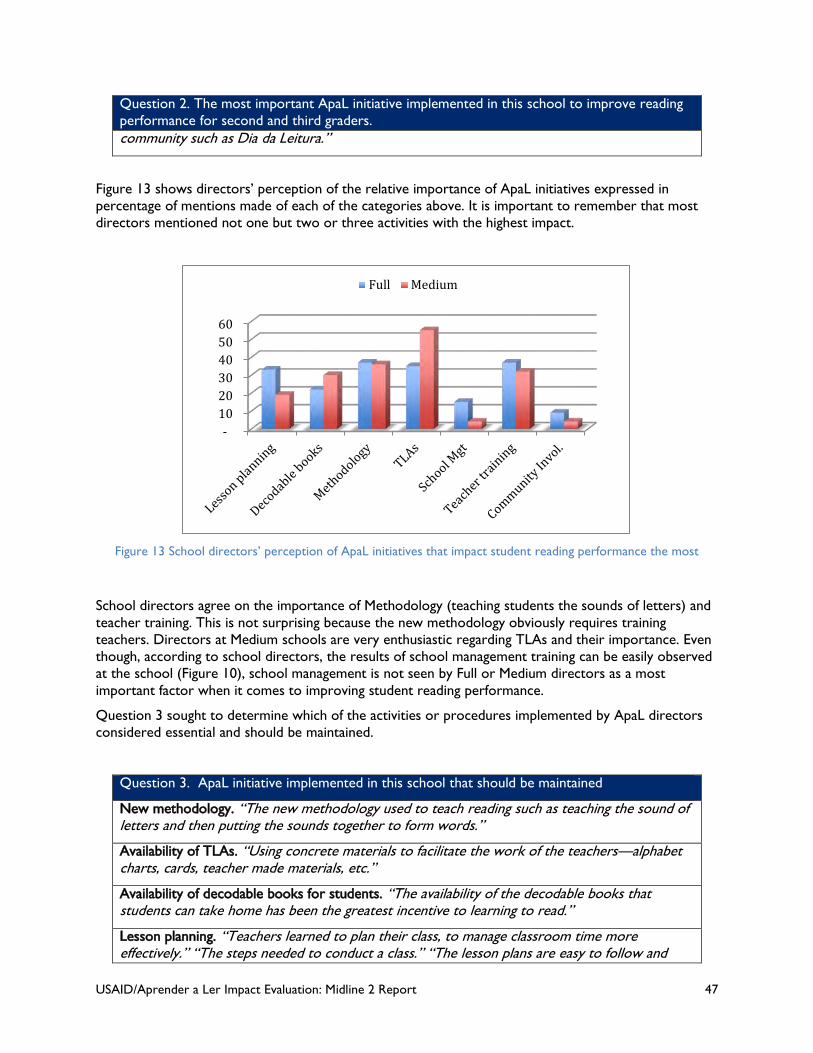
USAID/Aprender a Ler Impact Evaluation: Midline 2 Report 47
Question 2. The most important ApaL initiative implemented in this school to improve reading performance for second and third graders. community such as Dia da Leitura.”
Figure 13 shows directors’ perception of the relative importance of ApaL initiatives expressed in percentage of mentions made of each of the categories above. It is important to remember that most directors mentioned not one but two or three activities with the highest impact.
Figure 13 School directors’ perception of ApaL initiatives that impact student reading performance the most
School directors agree on the importance of Methodology (teaching students the sounds of letters) and teacher training. This is not surprising because the new methodology obviously requires training teachers. Directors at Medium schools are very enthusiastic regarding TLAs and their importance. Even though, according to school directors, the results of school management training can be easily observed at the school (Figure 10), school management is not seen by Full or Medium directors as a most important factor when it comes to improving student reading performance.
Question 3 sought to determine which of the activities or procedures implemented by ApaL directors considered essential and should be maintained.
Question 3. ApaL initiative implemented in this school that should be maintained
New methodology. “The new methodology used to teach reading such as teaching the sound of letters and then putting the sounds together to form words.”
Availability of TLAs. “Using concrete materials to facilitate the work of the teachers—alphabet charts, cards, teacher made materials, etc.”
Availability of decodable books for students. “The availability of the decodable books that students can take home has been the greatest incentive to learning to read.”
Lesson planning. “Teachers learned to plan their class, to manage classroom time more effectively.” “The steps needed to conduct a class.” “The lesson plans are easy to follow and
- 10 20 30 40 50 60
Full Medium
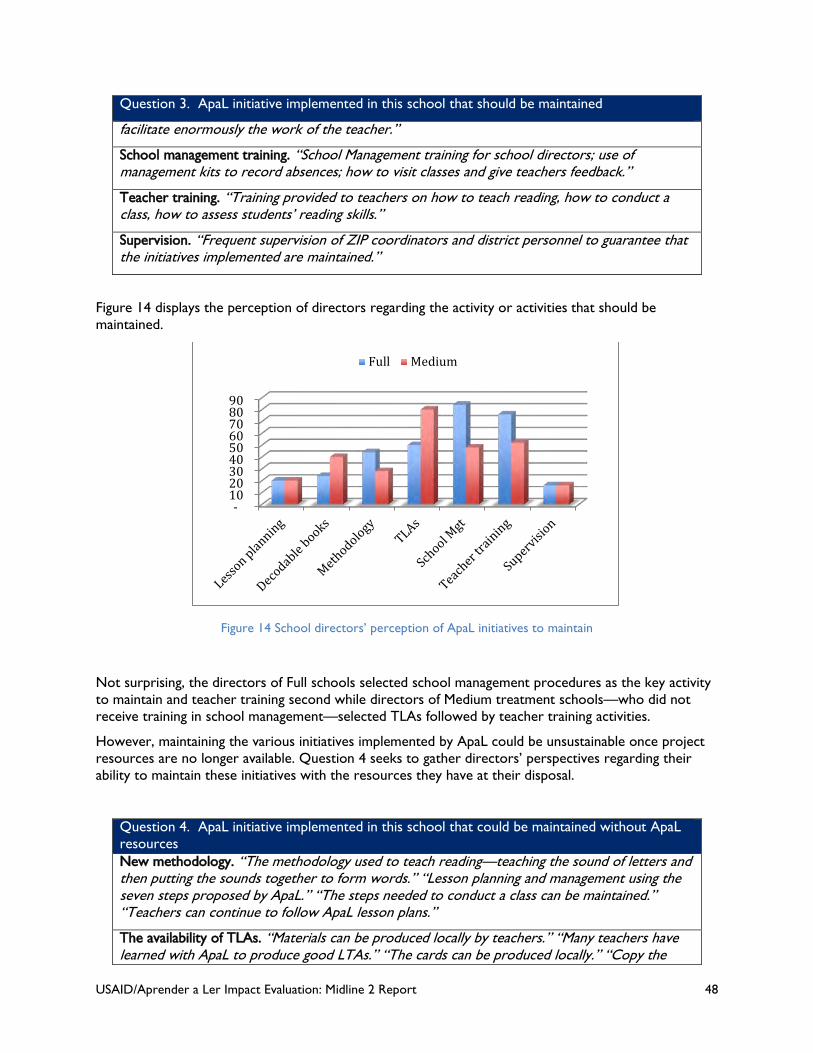
USAID/Aprender a Ler Impact Evaluation: Midline 2 Report 48
Question 3. ApaL initiative implemented in this school that should be maintained
facilitate enormously the work of the teacher.”
School management training. “School Management training for school directors; use of management kits to record absences; how to visit classes and give teachers feedback.”
Teacher training. “Training provided to teachers on how to teach reading, how to conduct a class, how to assess students’ reading skills.”
Supervision. “Frequent supervision of ZIP coordinators and district personnel to guarantee that the initiatives implemented are maintained.”
Figure 14 displays the perception of directors regarding the activity or activities that should be maintained.
Figure 14 School directors’ perception of ApaL initiatives to maintain
Not surprising, the directors of Full schools selected school management procedures as the key activity to maintain and teacher training second while directors of Medium treatment schools—who did not receive training in school management—selected TLAs followed by teacher training activities.
However, maintaining the various initiatives implemented by ApaL could be unsustainable once project resources are no longer available. Question 4 seeks to gather directors’ perspectives regarding their ability to maintain these initiatives with the resources they have at their disposal.
Question 4. ApaL initiative implemented in this school that could be maintained without ApaL resources New methodology. “The methodology used to teach reading—teaching the sound of letters and then putting the sounds together to form words.” “Lesson planning and management using the seven steps proposed by ApaL.” “The steps needed to conduct a class can be maintained.” “Teachers can continue to follow ApaL lesson plans.”
The availability of TLAs. “Materials can be produced locally by teachers.” “Many teachers have learned with ApaL to produce good LTAs.” “The cards can be produced locally.” “Copy the
- 10 20 30 40 50 60 70 80 90
Full Medium
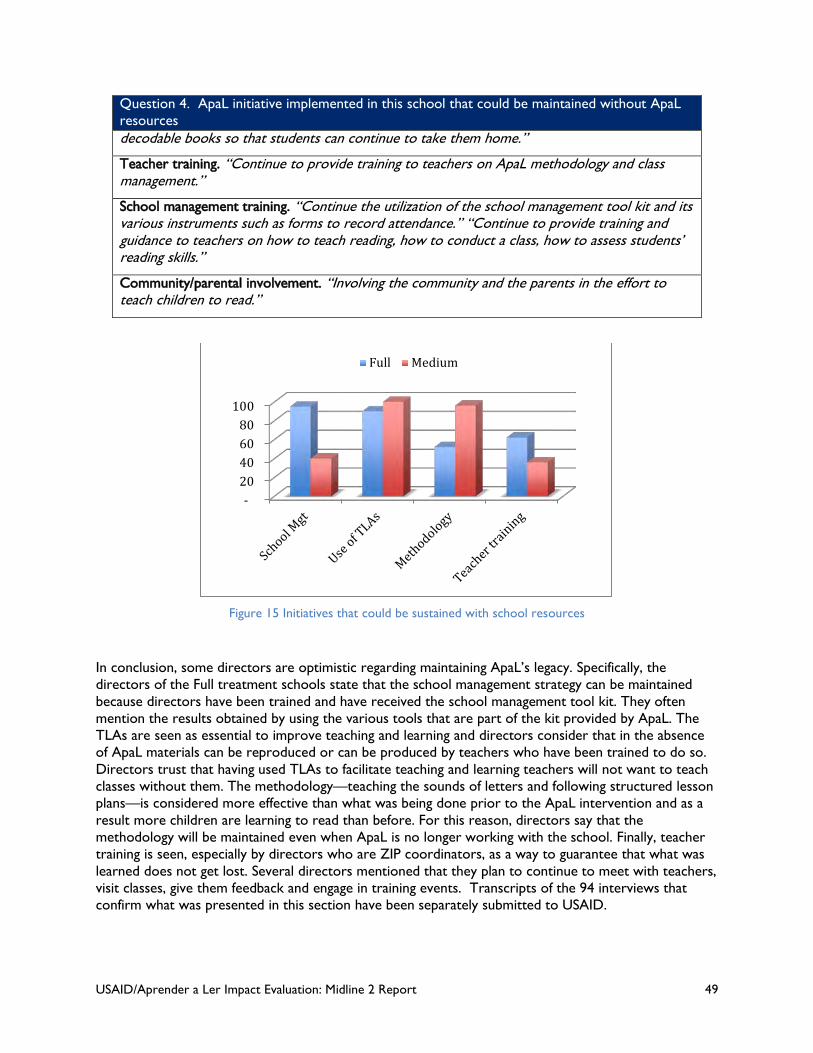
USAID/Aprender a Ler Impact Evaluation: Midline 2 Report 49
Question 4. ApaL initiative implemented in this school that could be maintained without ApaL resources decodable books so that students can continue to take them home.”
Teacher training. “Continue to provide training to teachers on ApaL methodology and class management.”
School management training. “Continue the utilization of the school management tool kit and its various instruments such as forms to record attendance.” “Continue to provide training and guidance to teachers on how to teach reading, how to conduct a class, how to assess students’ reading skills.”
Community/parental involvement. “Involving the community and the parents in the effort to teach children to read.”
Figure 15 Initiatives that could be sustained with school resources
In conclusion, some directors are optimistic regarding maintaining ApaL’s legacy. Specifically, the directors of the Full treatment schools state that the school management strategy can be maintained because directors have been trained and have received the school management tool kit. They often mention the results obtained by using the various tools that are part of the kit provided by ApaL. The TLAs are seen as essential to improve teaching and learning and directors consider that in the absence of ApaL materials can be reproduced or can be produced by teachers who have been trained to do so. Directors trust that having used TLAs to facilitate teaching and learning teachers will not want to teach classes without them. The methodology—teaching the sounds of letters and following structured lesson plans—is considered more effective than what was being done prior to the ApaL intervention and as a result more children are learning to read than before. For this reason, directors say that the methodology will be maintained even when ApaL is no longer working with the school. Finally, teacher training is seen, especially by directors who are ZIP coordinators, as a way to guarantee that what was learned does not get lost. Several directors mentioned that they plan to continue to meet with teachers, visit classes, give them feedback and engage in training events. Transcripts of the 94 interviews that confirm what was presented in this section have been separately submitted to USAID.
- 20 40 60 80
100
Full Medium
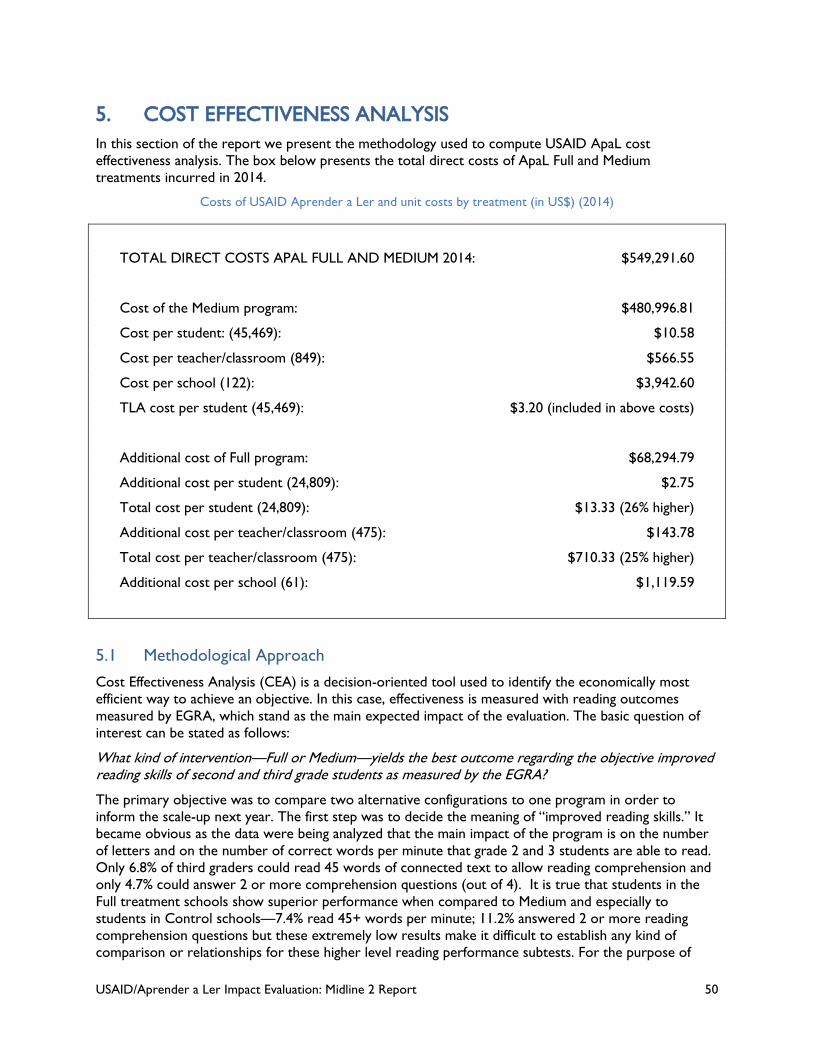
USAID/Aprender a Ler Impact Evaluation: Midline 2 Report 50
5. COST EFFECTIVENESS ANALYSIS In this section of the report we present the methodology used to compute USAID ApaL cost effectiveness analysis. The box below presents the total direct costs of ApaL Full and Medium treatments incurred in 2014.
Costs of USAID Aprender a Ler and unit costs by treatment (in US$) (2014)
TOTAL DIRECT COSTS APAL FULL AND MEDIUM 2014: $549,291.60
Cost of the Medium program: $480,996.81
Cost per student: (45,469): $10.58
Cost per teacher/classroom (849): $566.55
Cost per school (122): $3,942.60
TLA cost per student (45,469): $3.20 (included in above costs)
Additional cost of Full program: $68,294.79
Additional cost per student (24,809): $2.75
Total cost per student (24,809): $13.33 (26% higher)
Additional cost per teacher/classroom (475): $143.78
Total cost per teacher/classroom (475): $710.33 (25% higher)
Additional cost per school (61): $1,119.59
5.1 Methodological Approach Cost Effectiveness Analysis (CEA) is a decision-oriented tool used to identify the economically most efficient way to achieve an objective. In this case, effectiveness is measured with reading outcomes measured by EGRA, which stand as the main expected impact of the evaluation. The basic question of interest can be stated as follows:
What kind of intervention—Full or Medium—yields the best outcome regarding the objective improved reading skills of second and third grade students as measured by the EGRA?
The primary objective was to compare two alternative configurations to one program in order to inform the scale-up next year. The first step was to decide the meaning of “improved reading skills.” It became obvious as the data were being analyzed that the main impact of the program is on the number of letters and on the number of correct words per minute that grade 2 and 3 students are able to read. Only 6.8% of third graders could read 45 words of connected text to allow reading comprehension and only 4.7% could answer 2 or more comprehension questions (out of 4). It is true that students in the Full treatment schools show superior performance when compared to Medium and especially to students in Control schools—7.4% read 45+ words per minute; 11.2% answered 2 or more reading comprehension questions but these extremely low results make it difficult to establish any kind of comparison or relationships for these higher level reading performance subtests. For the purpose of
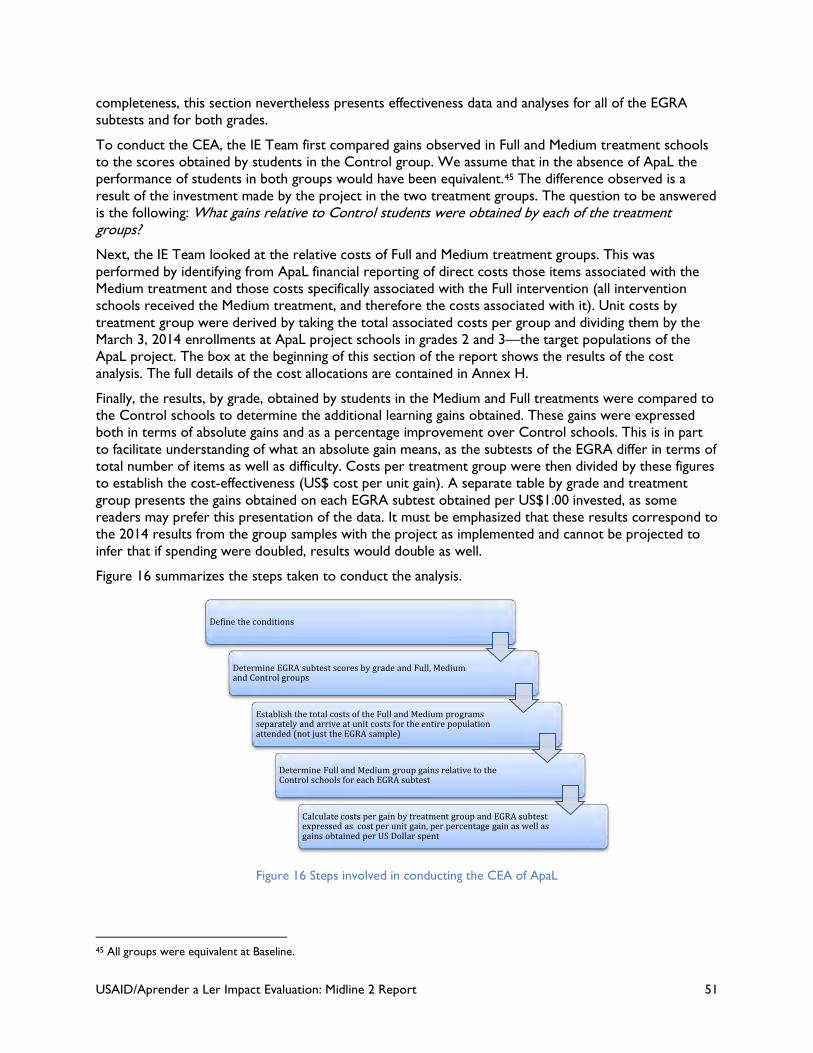
USAID/Aprender a Ler Impact Evaluation: Midline 2 Report 51
completeness, this section nevertheless presents effectiveness data and analyses for all of the EGRA subtests and for both grades.
To conduct the CEA, the IE Team first compared gains observed in Full and Medium treatment schools to the scores obtained by students in the Control group. We assume that in the absence of ApaL the performance of students in both groups would have been equivalent.45 The difference observed is a result of the investment made by the project in the two treatment groups. The question to be answered is the following: What gains relative to Control students were obtained by each of the treatment groups?
Next, the IE Team looked at the relative costs of Full and Medium treatment groups. This was performed by identifying from ApaL financial reporting of direct costs those items associated with the Medium treatment and those costs specifically associated with the Full intervention (all intervention schools received the Medium treatment, and therefore the costs associated with it). Unit costs by treatment group were derived by taking the total associated costs per group and dividing them by the March 3, 2014 enrollments at ApaL project schools in grades 2 and 3—the target populations of the ApaL project. The box at the beginning of this section of the report shows the results of the cost analysis. The full details of the cost allocations are contained in Annex H.
Finally, the results, by grade, obtained by students in the Medium and Full treatments were compared to the Control schools to determine the additional learning gains obtained. These gains were expressed both in terms of absolute gains and as a percentage improvement over Control schools. This is in part to facilitate understanding of what an absolute gain means, as the subtests of the EGRA differ in terms of total number of items as well as difficulty. Costs per treatment group were then divided by these figures to establish the cost-effectiveness (US$ cost per unit gain). A separate table by grade and treatment group presents the gains obtained on each EGRA subtest obtained per US$1.00 invested, as some readers may prefer this presentation of the data. It must be emphasized that these results correspond to the 2014 results from the group samples with the project as implemented and cannot be projected to infer that if spending were doubled, results would double as well.
Figure 16 summarizes the steps taken to conduct the analysis.
Figure 16 Steps involved in conducting the CEA of ApaL
45 All groups were equivalent at Baseline.
Define the conditions
Determine EGRA subtest scores by grade and Full, Medium and Control groups
Establish the total costs of the Full and Medium programs separately and arrive at unit costs for the entire population attended (not just the EGRA sample)
Determine Full and Medium group gains relative to the Control schools for each EGRA subtest
Calculate costs per gain by treatment group and EGRA subtest expressed as cost per unit gain, per percentage gain as well as gains obtained per US Dollar spent
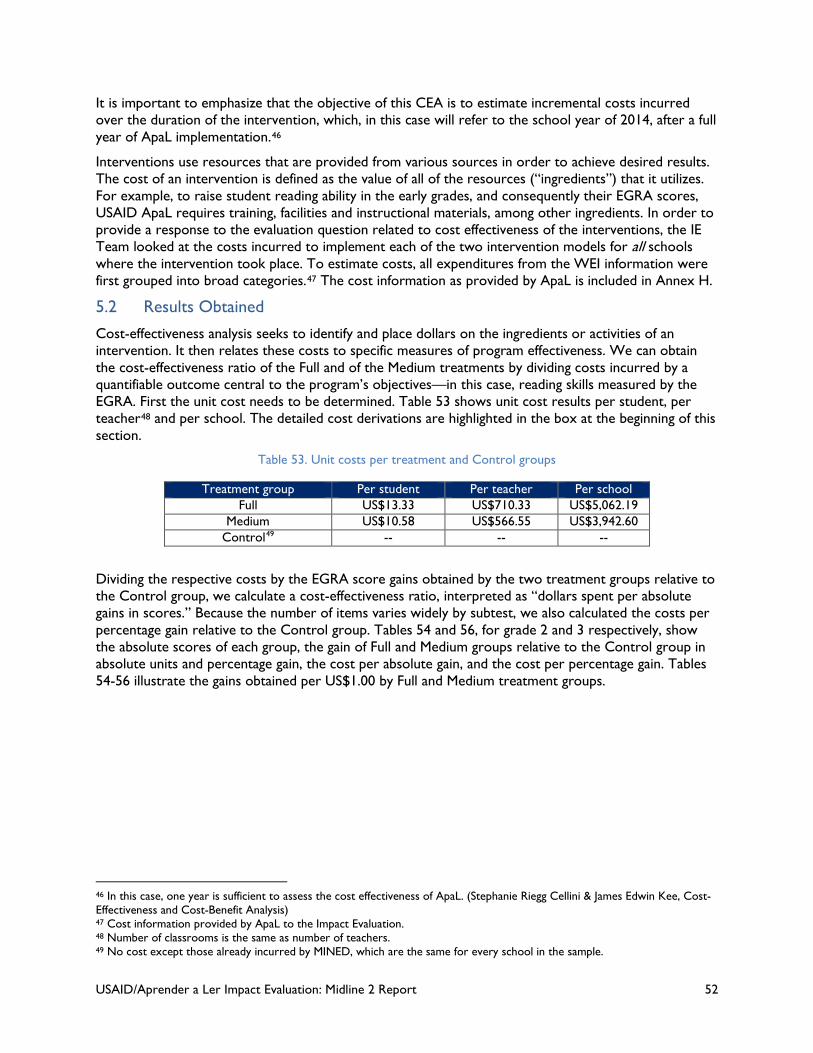
USAID/Aprender a Ler Impact Evaluation: Midline 2 Report 52
It is important to emphasize that the objective of this CEA is to estimate incremental costs incurred over the duration of the intervention, which, in this case will refer to the school year of 2014, after a full year of ApaL implementation.46
Interventions use resources that are provided from various sources in order to achieve desired results. The cost of an intervention is defined as the value of all of the resources (“ingredients”) that it utilizes. For example, to raise student reading ability in the early grades, and consequently their EGRA scores, USAID ApaL requires training, facilities and instructional materials, among other ingredients. In order to provide a response to the evaluation question related to cost effectiveness of the interventions, the IE Team looked at the costs incurred to implement each of the two intervention models for all schools where the intervention took place. To estimate costs, all expenditures from the WEI information were first grouped into broad categories.47 The cost information as provided by ApaL is included in Annex H.
5.2 Results Obtained
Cost-effectiveness analysis seeks to identify and place dollars on the ingredients or activities of an intervention. It then relates these costs to specific measures of program effectiveness. We can obtain the cost-effectiveness ratio of the Full and of the Medium treatments by dividing costs incurred by a quantifiable outcome central to the program’s objectives—in this case, reading skills measured by the EGRA. First the unit cost needs to be determined. Table 53 shows unit cost results per student, per teacher48 and per school. The detailed cost derivations are highlighted in the box at the beginning of this section.
Table 53. Unit costs per treatment and Control groups
Treatment group Per student Per teacher Per school Full US$13.33 US$710.33 US$5,062.19
Medium US$10.58 US$566.55 US$3,942.60 Control49 -- -- --
Dividing the respective costs by the EGRA score gains obtained by the two treatment groups relative to the Control group, we calculate a cost-effectiveness ratio, interpreted as “dollars spent per absolute gains in scores.” Because the number of items varies widely by subtest, we also calculated the costs per percentage gain relative to the Control group. Tables 54 and 56, for grade 2 and 3 respectively, show the absolute scores of each group, the gain of Full and Medium groups relative to the Control group in absolute units and percentage gain, the cost per absolute gain, and the cost per percentage gain. Tables 54-56 illustrate the gains obtained per US$1.00 by Full and Medium treatment groups.
46 In this case, one year is sufficient to assess the cost effectiveness of ApaL. (Stephanie Riegg Cellini & James Edwin Kee, Cost- Effectiveness and Cost-Benefit Analysis) 47 Cost information provided by ApaL to the Impact Evaluation. 48 Number of classrooms is the same as number of teachers. 49 No cost except those already incurred by MINED, which are the same for every school in the sample.
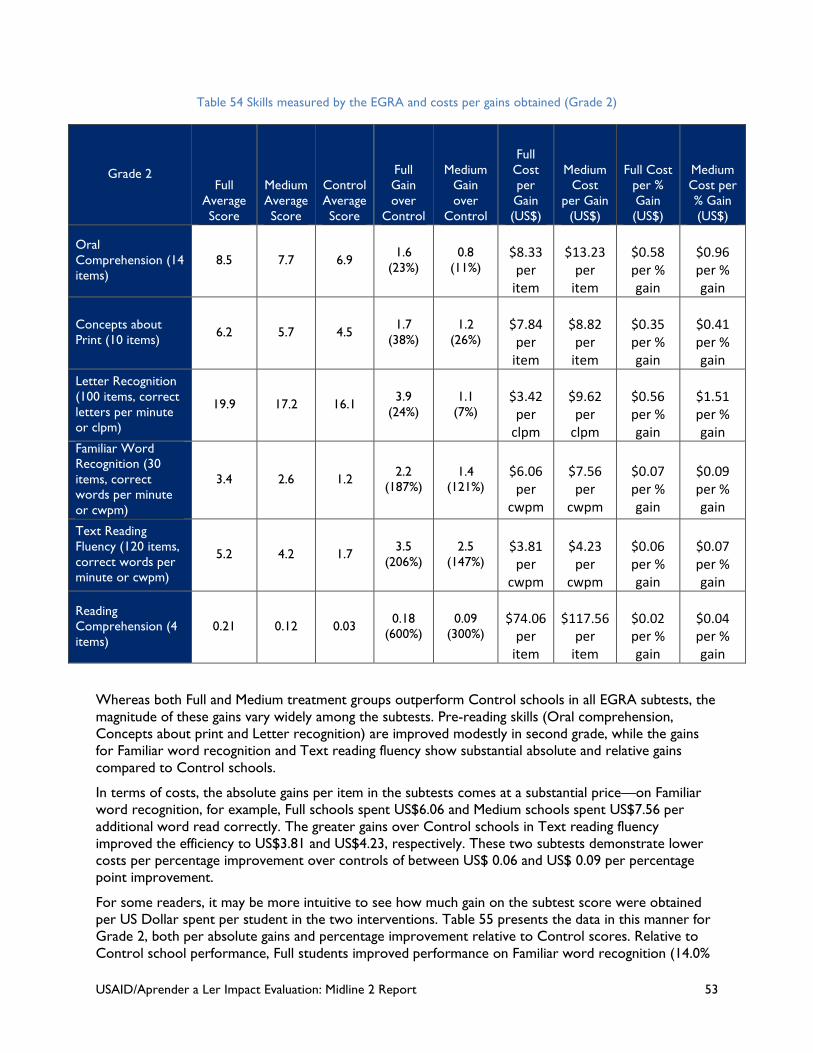
USAID/Aprender a Ler Impact Evaluation: Midline 2 Report 53
Table 54 Skills measured by the EGRA and costs per gains obtained (Grade 2)
Grade 2 Full
Average Score
Medium Average Score
Control Average Score
Full Gain over
Control
Medium Gain over
Control
Full Cost per Gain (US$)
Medium Cost
per Gain (US$)
Full Cost per % Gain (US$)
Medium Cost per % Gain (US$)
Oral Comprehension (14 items)
8.5 7.7 6.9 1.6 (23%)
0.8 (11%)
$8.33
per item
$13.23
per item
$0.58 per % gain
$0.96 per % gain
Concepts about Print (10 items) 6.2 5.7 4.5 1.7
(38%) 1.2
(26%)
$7.84
per item
$8.82
per item
$0.35 per % gain
$0.41 per % gain
Letter Recognition (100 items, correct letters per minute or clpm)
19.9 17.2 16.1 3.9 (24%)
1.1 (7%)
$3.42
per clpm
$9.62
per clpm
$0.56 per % gain
$1.51 per % gain
Familiar Word Recognition (30 items, correct words per minute or cwpm)
3.4 2.6 1.2 2.2 (187%)
1.4 (121%)
$6.06
per cwpm
$7.56
per cwpm
$0.07 per % gain
$0.09 per % gain
Text Reading Fluency (120 items, correct words per minute or cwpm)
5.2 4.2 1.7 3.5 (206%)
2.5 (147%)
$3.81
per cwpm
$4.23
per cwpm
$0.06 per % gain
$0.07 per % gain
Reading Comprehension (4 items)
0.21 0.12 0.03 0.18 (600%)
0.09 (300%)
$74.06
per item
$117.56
per item
$0.02 per % gain
$0.04 per % gain
Whereas both Full and Medium treatment groups outperform Control schools in all EGRA subtests, the magnitude of these gains vary widely among the subtests. Pre-reading skills (Oral comprehension, Concepts about print and Letter recognition) are improved modestly in second grade, while the gains for Familiar word recognition and Text reading fluency show substantial absolute and relative gains compared to Control schools.
In terms of costs, the absolute gains per item in the subtests comes at a substantial price—on Familiar word recognition, for example, Full schools spent US$6.06 and Medium schools spent US$7.56 per additional word read correctly. The greater gains over Control schools in Text reading fluency improved the efficiency to US$3.81 and US$4.23, respectively. These two subtests demonstrate lower costs per percentage improvement over controls of between US$ 0.06 and US$ 0.09 per percentage point improvement.
For some readers, it may be more intuitive to see how much gain on the subtest score were obtained per US Dollar spent per student in the two interventions. Table 55 presents the data in this manner for Grade 2, both per absolute gains and percentage improvement relative to Control scores. Relative to Control school performance, Full students improved performance on Familiar word recognition (14.0%
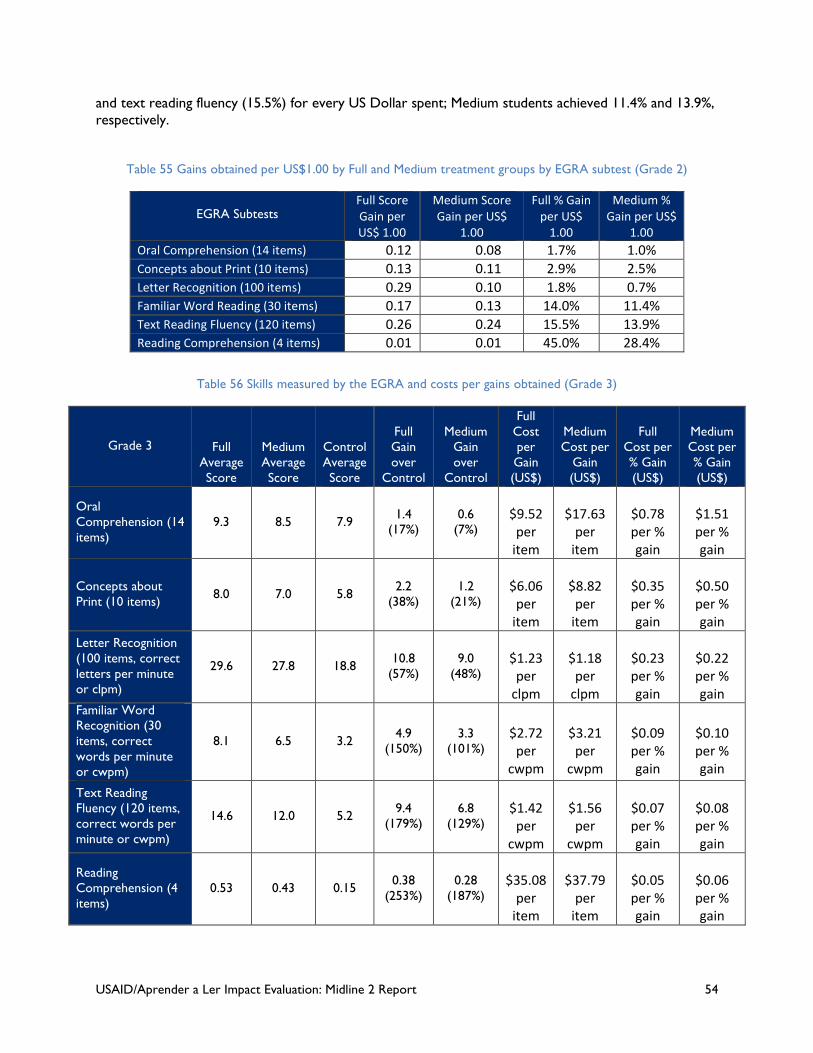
USAID/Aprender a Ler Impact Evaluation: Midline 2 Report 54
and text reading fluency (15.5%) for every US Dollar spent; Medium students achieved 11.4% and 13.9%, respectively.
Table 55 Gains obtained per US$1.00 by Full and Medium treatment groups by EGRA subtest (Grade 2)
EGRA Subtests
Full Score Gain per US$ 1.00
Medium Score Gain per US$
1.00
Full % Gain per US$
1.00
Medium % Gain per US$
1.00 Oral Comprehension (14 items) 0.12 0.08 1.7% 1.0% Concepts about Print (10 items) 0.13 0.11 2.9% 2.5% Letter Recognition (100 items) 0.29 0.10 1.8% 0.7% Familiar Word Reading (30 items) 0.17 0.13 14.0% 11.4% Text Reading Fluency (120 items) 0.26 0.24 15.5% 13.9% Reading Comprehension (4 items) 0.01 0.01 45.0% 28.4%
Table 56 Skills measured by the EGRA and costs per gains obtained (Grade 3)
Grade 3 Full Average Score
Medium Average Score
Control Average Score
Full Gain over
Control
Medium Gain over
Control
Full Cost per Gain (US$)
Medium Cost per
Gain (US$)
Full Cost per % Gain (US$)
Medium Cost per % Gain (US$)
Oral Comprehension (14 items)
9.3 8.5 7.9 1.4 (17%)
0.6 (7%)
$9.52
per item
$17.63
per item
$0.78 per % gain
$1.51 per % gain
Concepts about Print (10 items) 8.0 7.0 5.8 2.2
(38%) 1.2
(21%)
$6.06
per item
$8.82
per item
$0.35 per % gain
$0.50 per % gain
Letter Recognition (100 items, correct letters per minute or clpm)
29.6 27.8 18.8 10.8 (57%)
9.0 (48%)
$1.23
per clpm
$1.18
per clpm
$0.23 per % gain
$0.22 per % gain
Familiar Word Recognition (30 items, correct words per minute or cwpm)
8.1 6.5 3.2 4.9 (150%)
3.3 (101%)
$2.72
per cwpm
$3.21
per cwpm
$0.09 per % gain
$0.10 per % gain
Text Reading Fluency (120 items, correct words per minute or cwpm)
14.6 12.0 5.2 9.4 (179%)
6.8 (129%)
$1.42
per cwpm
$1.56
per cwpm
$0.07 per % gain
$0.08 per % gain
Reading Comprehension (4 items)
0.53 0.43 0.15 0.38 (253%)
0.28 (187%)
$35.08
per item
$37.79
per item
$0.05 per % gain
$0.06 per % gain
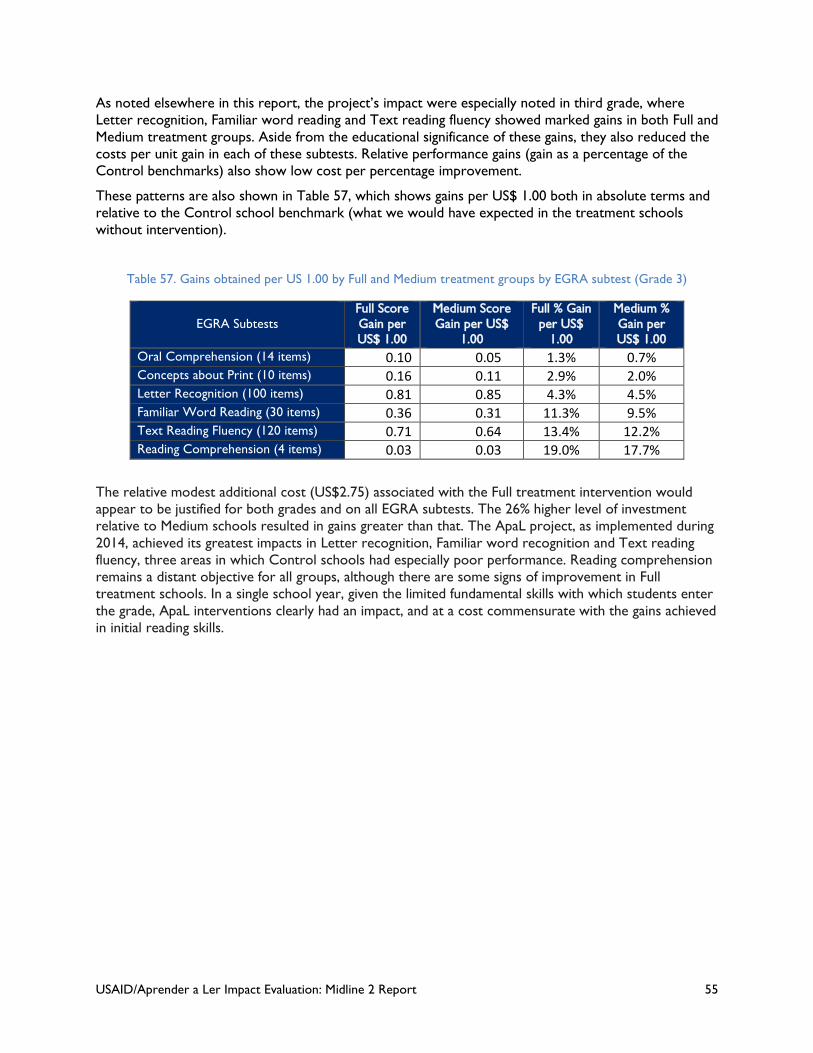
USAID/Aprender a Ler Impact Evaluation: Midline 2 Report 55
As noted elsewhere in this report, the project’s impact were especially noted in third grade, where Letter recognition, Familiar word reading and Text reading fluency showed marked gains in both Full and Medium treatment groups. Aside from the educational significance of these gains, they also reduced the costs per unit gain in each of these subtests. Relative performance gains (gain as a percentage of the Control benchmarks) also show low cost per percentage improvement.
These patterns are also shown in Table 57, which shows gains per US$ 1.00 both in absolute terms and relative to the Control school benchmark (what we would have expected in the treatment schools without intervention).
Table 57. Gains obtained per US 1.00 by Full and Medium treatment groups by EGRA subtest (Grade 3)
EGRA Subtests
Full Score Gain per US$ 1.00
Medium Score Gain per US$
1.00
Full % Gain per US$
1.00
Medium % Gain per US$ 1.00
Oral Comprehension (14 items) 0.10 0.05 1.3% 0.7% Concepts about Print (10 items) 0.16 0.11 2.9% 2.0% Letter Recognition (100 items) 0.81 0.85 4.3% 4.5% Familiar Word Reading (30 items) 0.36 0.31 11.3% 9.5% Text Reading Fluency (120 items) 0.71 0.64 13.4% 12.2% Reading Comprehension (4 items) 0.03 0.03 19.0% 17.7%
The relative modest additional cost (US$2.75) associated with the Full treatment intervention would appear to be justified for both grades and on all EGRA subtests. The 26% higher level of investment relative to Medium schools resulted in gains greater than that. The ApaL project, as implemented during 2014, achieved its greatest impacts in Letter recognition, Familiar word recognition and Text reading fluency, three areas in which Control schools had especially poor performance. Reading comprehension remains a distant objective for all groups, although there are some signs of improvement in Full treatment schools. In a single school year, given the limited fundamental skills with which students enter the grade, ApaL interventions clearly had an impact, and at a cost commensurate with the gains achieved in initial reading skills.
USAID/Aprender a Ler Impact Evaluation: Midline 2 Report 56
6. CONCLUSIONS The present study assessed whether USAID ApaL in its first full school year of implementation (2014) had an impact on students’ reading skills and if so, how much and at what cost. The findings presented in the report show improvement in student outcomes in intervention schools on all EGRA measures. We see impact among grade 2 student reading performance and even higher impact among grade 3 students and gains in all EGRA subtasks—oral comprehension, familiarity with printed material, letter identification, reading familiar words, reading connected text (fluency) and reading comprehension.
Differences between treatment groups (Full and Medium) and Control are consistently significant as are, in most cases, the differences between the two treatment groups. Effects of ApaL were also observed on teacher instructional behavior and on school management routines. Specifically, these effects are related to ApaL’s intermediate indicators—improving the quality of reading instruction and the quantity of time available for teaching and learning (time-on-task). The cost-effectiveness analysis conducted allows us to say that the Full treatment has a higher impact on student performance than the Medium treatment even when the cost difference of US$2.75 per year per student is considered. The data collected and analyzed leads us to the following conclusions:
The ApaL project causes a significant impact on second and third graders’ reading skills. Students in treatment groups show higher performance in all reading skills measured by the EGRA than their counterparts in the Control group. All the differences observed between treatment and Control groups are significant as are, in 60% of the cases examined, the differences between Full and Medium treatment. Only in one EGRA subtest, Letter Recognition, the difference between Medium and Control is non-significant for both Grade 2 and 3. Differences between Full and Control however, are always significant. Comparing across EGRA subtasks, we found the greatest improvements in letter recognition, familiar word reading, and reading fluency.
The Full treatment alternative shows a higher cost-effectiveness ratio than Medium. The amount invested in Full treatment schools (US$13.33) or the lower amount of US$10.58 per child per year invested in the Medium treatment schools was sufficient to make an impact on student reading performance. However, the difference in gains between students in Full and in Medium treatment is significant for both grades and for most competencies indicating that with an additional US$2.75 per child per year gains increase significantly thus justifying the additional cost.
The project produced an impact on teacher instructional behavior. In-service training (INSET) can be implemented at low cost with the cascade model used by ApaL—selecting and training trainers from local institutions and from district and provincial personnel. This training model also increases the likelihood that MINED local authorities incorporate training. Moreover, when conducted on Saturdays as done by ApaL, there is no negative impact on teachers’ presence in class. Training 849 Grade 2 and 3 teachers amounts to US$566.55 per teacher per year. The cost includes training provided to the Trainers and all materials needed for training in addition to teachers’ guides and per diem for trainers and for teachers to attend training.
Teachers in the intervention schools have been able to implement the ApaL model in their classrooms fairly consistently with a high degree of take-up of reading instruction methods. Improved instructional practices were observed in the 319 classes visited. The program effected positive changes in teacher practices in the reading class as teachers are observed using the methodology acquired during training—they teach decoding, plan and sequence instruction, follow lesson plans, using TLAs to enhance teaching and learning. Observations show that intervention schools teachers were able to guide students to pronounce sounds of letters, associate words with letters and blend letter sounds to form word patterns. Of all skills observed in the classroom, teaching decoding showed the highest correlation with EGRA performance in skills such as letter recognition, word reading and text reading (fluency).
Intervention schoolteachers use TLAs to enrich their teaching. TLAs clearly enrich the classroom environment and encourage teachers to employ better pedagogical practices. The provision of low-cost
USAID/Aprender a Ler Impact Evaluation: Midline 2 Report 57
materials, both in the classroom environment and reading materials for students to take home, has substantial potential to improve acquisition of basic reading skills. The teaching/learning resources provided by ApaL (alphabet banners, keywords flashcards, decodable and read aloud books) are observed in the classes visited. These are relatively low-cost inputs—US$3.20 per student per year including printing, import taxes and distribution—and can have relatively high returns (Mingat, 2003; Vespoor, 2003). The 94 school directors interviewed consider that TLAs are key in teaching reading and manifest their expectation that teachers will continue to use them even when ApaL is no longer directly involved with the schools. The reason is that as part of the training, teachers learned to produce materials to enhance their reading class thus making their use more sustainable. School directors also praise the large distribution of the small decodable books that students are allowed to take home. This seems to be an inexpensive way (US$0.15 per student per year) to encourage reading and to ensure that students have some reading material at home.
Improved school management. The significant differences observed between results obtained by students in the Full and in the Medium treatment groups seem to justify adding a school management component to improve the quantity of reading instruction. The School Management component adds 26% to the cost of the Medium alternative but students’ gains in Full treatment schools are higher and
significant both statistically and educationally. The ApaL program has enabled SDs to have a positive impact on instructional practice in schools. This is consistent with literature on school leadership, which has found that when the school director is trained on a new intervention and its support, there is a higher rate of successful implementation.50 In the 60 schools where the Full intervention was implemented, school directors seem to play a greater role in supporting instruction compared with Medium and Control schools.
There are significant differences between the performance of students in some sub-groups.
We examined the magnitude of the differences among members of three of these sub-groups: (i) male and female; (ii) provinces; and (iii) urban and rural schools. Although the Impact Evaluation is able to identify these differences clearly other types of study need to be conducted in order to look into the reasons that cause these differences.
Male and female differences. The higher level of performance of boys when compared to girls follows the pattern already observed at Baseline and at Midline 1. Midline 2 data show that of the 1,704 Grade 3 students able to read 20 plus words in one minute, 12.9% are boys and 7.6% are girls and of those able to correctly read 45 or more words of connected text, 4.2% are female while males account for 6.1%. Boys outperform girls on all EGRA sub-tasks except in Oral Comprehension and this may indicate that language is not a factor causing this disparity. Note that girls come to class more often—absentee rate is 61% for boys and 56% for girls. In addition, when we examine the number of boys and girls registered in Grade 2 and in Grade 3, more boys seem to leave school between the grades—16% as opposed to 14% of the girls. We also note that the gender gap seems to be less acute in treatment schools.
The opportunity for student learning (time on task) is limited by high absentee rates and tardiness on the part of students, teachers, and school directors. The high absentee rates severely limit the amount
50 The Making of the School Principal: Five Lessons in Leadership.The Wallace Foundation, 2012
It is the principal, more than anyone else, who is in a position to ensure that excellent teaching and learning are part of every classroom. In fact, leadership is second only to teaching among school-related factors as an influence on learning, according to a six-year study, the largest of its kind, which analyzed data from 180 schools in nine states. The report by researchers from the Universities of Minnesota and Toronto further noted: “To date we have not found a single case of a school improving its student achievement record in the absence of talented leadership”
The Making of the School Principal: Five Lessons in Leadership. The Wallace Foundation, 2012
USAID/Aprender a Ler Impact Evaluation: Midline 2 Report 58
of time available for instruction. On a typical day, student absentee rates reach 58% (61% for boys and 56% for girls). Teacher absentee rates vary between 31% and 34% and in 22% of the schools visited school directors were not present. In addition, actual instructional time is often much shorter than the scheduled teaching time due to deficiencies in organization and monitoring. Visits to schools show that, on average, classes begin between 24-46 minutes late.51
This said, it is important to note that lower absentee and tardiness rates are found at treatment schools, especially at Full treatment schools. Empowering the SD to become managers and instructional leaders seems to exert a positive influence on the school with the result of bringing down the high absentee and tardiness rates. Unannounced visits to schools show that in 25% of the Medium treatment and Control schools there was no SD or PD present while at Full treatment schools the absentee of both PD and SD was 20%. The same pattern is observed when teacher and student absentee rates or the delay in starting the school day are examined. The rates, while still high and unacceptable, are consistently lower at Full treatment schools.
In spite of the high impact caused by the project and the progress made on all EGRA subtasks, grade 3 students are still far from the international established target of 45 correct words per minute (cwpm) needed to allow them to comprehend what they read. Reaching the 45 cwpm target at the end of one year was not ApaL’s intention and would not have been feasible in any event, given the low level of reading skills noted both at Baseline and at Midline 1. This combined with high levels of absenteeism recorded for students, teachers and school/pedagogical directors and the daily delays in the start of instruction severely limit time available for learning.
ApaL has made an impact and improved student reading performance, but reaching this ambitious goal of 45 cwpm requires a joint effort by MINED, a project or projects such as ApaL, the cooperation of district/local educational officers as well as a higher degree of community involvement. Reaching the 45 cwpm would also require setting clear expectations and greater transparency. The use of tools such as the Rapid School Assessment (RSA) can communicate clearly to district and local authorities the rates of absenteeism found at each school. Widespread implementation of the RSA could result in making education authorities as well as teachers, school directors, and parents, more accountable.
51 During the 2014 school year ApaL conducted repeated visits to schools as part of the Rapid School Assessment. The same data were collected in September 2014 in the 180 schools where the EGRA was administered.
USAID/Aprender a Ler Impact Evaluation: Midline 2 Report 59
7. RECOMMENDATIONS The recommendations offered in this section are based on the data analyzed by the IE and refer specifically to the results obtained, which are related to the improvement of early grade reading skills. We also focus on two ApaL intermediate indicators: (i) improved quality and (2) improved quantity of early reading instruction. The main recommendations to strengthen the overall impact of the project are outlined below, in general order of priority.
1. The ApaL program works, and should be continued. Although absolute levels of achievement remain lower than desired, both Full and Medium treatments contributed to significant gains in student reading skills relative to Control schools, especially in third grade. Teacher training was shown to impact teacher classroom behavior, which in turn was shown to impact student performance on the EGRA. Similarly, the provision of TLAs under both treatments is shown to both change classroom activities and resultant student learning of early grade reading skills.
2. Expansion of ApaL in 2015 should be performed under the Full treatment model. The cost-effectiveness analysis clearly demonstrates that significant gains on most EGRA sub scores in both grades are obtained with the inclusion of the SD-oriented activities. These gains exceed the marginal costs of the Full treatment model over those of the Medium treatment model.
Nonetheless, there are a number of areas that limited the impact of the ApaL model, and these should be addressed as the intervention is expanded beyond the 2014 pilot schools. Even though significant gains were demonstrated by the ApaL interventions relative to Control schools, high teacher and student absenteeism, in particular, limited student exposure to the new techniques and practices and TLAs available. Furthermore, not all sub-groups showed similar gains. Deeper use of the detailed EGRA data can only go so far. We believe that the ApaL project should develop, test and evaluate the effectiveness of different approaches to improve the EGRA results of students in various sub-groups. Recommendations on this are listed below.
3. Implement strategies to reduce the high absentee rates of teachers, and school/pedagogical directors and the delay in the start of the day. The challenges posed by SD, PD and teacher absenteeism and tardiness deserve continued attention since this is the single factor that most negatively impacts all aspects of student learning by reducing the quantity of instruction that students receive. While by no means an “either-or” matter and efforts can and should be made to address all aspects of absenteeism concurrently, based on the data and our own professional judgment, we recommend that priority be given to (a) absentee teachers and SD/PD, (b) teachers and SD/PD who are frequently tardy, and (c) student absenteeism.
• We recognize that actions related to instructional personnel are beyond USAID’s direct span of control, but encourage the Mission to continue its engagement with MINED on this issue. When teachers and school directors often arrive late or fail to arrive, they communicate to students and parents the message that going to school is not important. As the program scales up in 2015 to cover over 500 schools in the six target districts, the DPEC and the SDEJT will need to be called on to support improved attendance. ApaL is already carrying out meetings with local and district authorities to develop mechanisms to support existing MINED systems for holding schools accountable. ApaL should also consider which incentives could be put into place to encourage teachers, SDs and PDs to reduce the level of absenteeism and tardiness.
• Both USAID and ApaL recognize the potential relationship between teacher tardiness and student learning; however, researching this was beyond the scope of work of the IE, especially since it is probable that ApaL has or can get the relevant data itself. We encourage ApaL to determine for low-performing schools when in the school day reading lessons typically take place and to match this against schools in the sample where teachers were tardy to determine whether there appears to be
USAID/Aprender a Ler Impact Evaluation: Midline 2 Report 60
a correlation (which, however, does not necessarily reflect a causation). If feasible, a similar analysis should be undertaken for higher-performing schools.
4. Engage parents and the community in the effort to reduce student tardiness and absenteeism. As a corollary to teacher tardiness, when classes start 15, 20 or even 40 minutes late on a typical day, the time available for learning becomes insufficient, students have reduced time-on-task and consequently learn less. When teachers and/or students are not present at all, there is no opportunity for learning. There are two separate sets of issues involved, tardiness and absenteeism, which based on our experience overlap but do not necessarily have the same causes.
• It will be necessary to engage parents, as heads of their own households and as a group, to ensure that children do not miss school and arrive on time. Reducing student tardiness and absenteeism requires the cooperation from parents or other adults who are responsible for the children so idea champions52 must be found within the community.
• Strategies to reduce tardiness and absenteeism may include prizes for students with good attendance, good attendance certificates or a posted list of students with 100% attendance during the week or during the month. Consider introducing a simple competition among classrooms and awarding parents and students highest attendance/least tardiness certificates or starting the day with a playful activity to motivate students to arrive on time. These do not have cost implications.
• USAID should commission a study to determine the most significant causes of absenteeism and propose recommendations. Guided both by the IE and our own experience, we suggest that the study consider, for example: • To what extent, if any, is the question of absentee students real or an artifact of “ghost students,”
i.e., children who realistically were rarely, if ever, present in school? • Are there particular patterns in absenteeism? E.g., is it seasonal? To what extent, if at all, do
children from the same family take turns in attending class? • What are the commonalities and the differences between attendance by boys and girls in rural
and urban areas? • What constraints do parents feel with respect to sending their children to school regularly? • What practices are in place to alert parents that their children are missing school? • What formal or informal support systems are in place to keep children from falling behind? • What relationships, if any, are there between repetition and absenteeism? Per Figure 5, in
Zambezia repetition rates were self-reported at over 20% for grades 1, 2, and 3, and of course drop-out rates were not self-reported at all. Related to this could be an analysis of a possible relationship of the impact of ApaL on student repetition. This could not be conducted within the time frame of the current IE, but could be conducted during the follow-on or could be conducted by ApaL itself.
5. Make reading a priority and clarify expectations. It is important for MINED both to establish yearly benchmarks that will lead schools towards the generally recognized 45 correct word per minute target and to put into place a package of incentives—not necessarily monetary—to benefit schools that reach the yearly target while providing support to schools that lag behind. Reading competitions, prizes for teachers/schools that get students to make progress towards the mark of 45 words correctly read by the end of grade 3, etc. should be considered.53
52 An idea champion is a person who voluntarily takes extraordinary interest in the adoption, implementation, and success of a cause, policy, program, project, or product. He or she will typically try to force the idea through entrenched internal resistance to change. 53 F. Halsey Rogers & Emiliana Vegas No More Cutting Class? Reducing Teacher Absence and Providing Incentives for Performance Policy Research Working Paper 4847, World Bank Development Research Group, Human Development and Public Services Team & Human Development Network Education Team. February 2009.
USAID/Aprender a Ler Impact Evaluation: Midline 2 Report 61
• Regardless of how creative and how well implemented and managed the project is, without a firm resolve on the part of MINED officers at the district, provincial and central level to make reading a priority, reading achievement will continue to fall short of what is acceptable. The RSA designed and implemented by ApaL is a powerful tool that could be used to assess school progress towards the 45 cwpm pm target.
• Expand on efforts to engage parents in promotion of reading at home. Learn more about how the decodable books, and other books, are actually being used in the home environment, and consider how appropriate ones can be replicated.
6. Conduct focused studies to investigate the differences in reading performance observed in the subgroups—girls/boys, provinces, urban and rural. Girls’ absentee rate is lower than boys’ and they seem to drop out less often between second and third grades. In addition, their level of performance on the EGRA subtest Oral comprehension is equal or higher than boys. Yet, boys consistently outperform girls in five out of six EGRA sub-tasks, especially in the more complex tasks such as reading familiar words, reading connected text and answering comprehension questions. While the EGRA data show this situation clearly, as it also shows differences between provinces and between rural and urban schools, an Impact Evaluation cannot determine the reasons behind what the data show. Special studies need to be conducted in the communities where the project is implemented to provide insights into the causes for these differences. This is essential information for ApaL because it would allow the project to design and incorporate strategies and procedures to reduce the gender gap and the urban-rural gap that currently exist in the schools where the project is being implemented.
7. Strengthen and continue to experiment and perfect the RSA procedures. Supervision and support has a positive impact on improving teachers’ practice, particularly when it is specific, constructive and non-threatening. More analysis of the supervision and support capacity, procedures and practices needs to be carried out in order to provide more targeted improvements to this important component. The RSA procedure developed and implemented by ApaL in the treatment schools could be adapted to MINED’s needs at the district level and become instrumental in the improvement of an effective supervision and accountability system.
8. Identify and, if possible/necessary, address the reasons for significant numbers of over-age students. As indicated in Table 6, in Zambézia and particularly in Nampula, over 60% of the students in the target grades are over-age, with some primary school students even being 17 years of age. From looking at the age breakdowns, and from knowledge of patterns in other countries, one could surmise that this might be partially the result of expansion of education to previously unserved or underserved communities, and therefore might be partially an artifact that would revert to an expected normal pattern, but with respect to the situations in Zambézia and Nampula, we have no evidence to support this surmise. However, in any event it is important for educational planning to learn the actual reasons.
9. In association with the recommended studies on repetition, encourage MINED to conduct cohort analyses. These would be helpful in identifying and later studying both higher-performing and lower-performing schools. While studies for grade levels above grade 3 would likely be outside the scope of work for ApaL, we believe that they would still fall within parameters for Goal 1 of USAID’s Education Strategy.
10. Conduct an item analysis of results from the EGRA instruments to identify issues associated with particular letters and/or words. This can help to identify phonological issues that may call for more attention from teachers than they may currently receive.
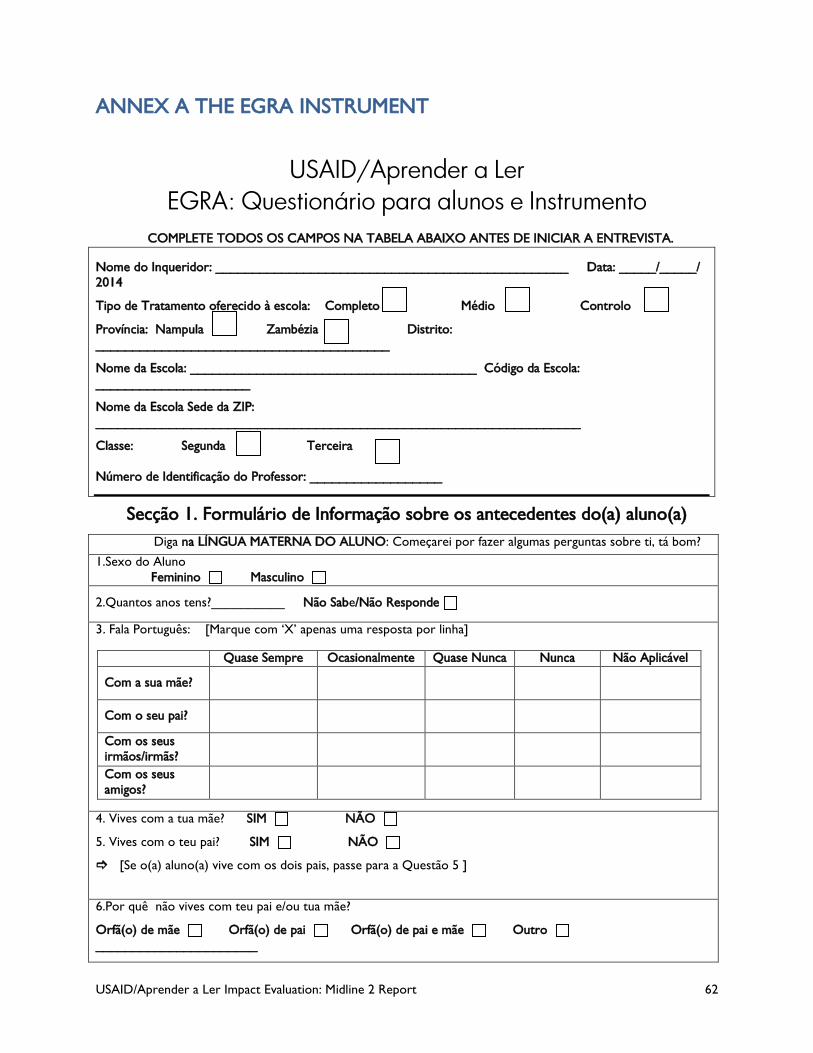
USAID/Aprender a Ler Impact Evaluation: Midline 2 Report 62
ANNEX A THE EGRA INSTRUMENT
USAID/Aprender a Ler EGRA: Questionário para alunos e Instrumento
COMPLETE TODOS OS CAMPOS NA TABELA ABAIXO ANTES DE INICIAR A ENTREVISTA.
Nome do Inqueridor: ________________________________________________ Data: _____/_____/ 2014
Tipo de Tratamento oferecido à escola: Completo Médio Controlo
Província: Nampula Zambézia Distrito: ________________________________________
Nome da Escola: _______________________________________ Código da Escola: _____________________
Nome da Escola Sede da ZIP: __________________________________________________________________
Classe: Segunda Terceira Número de Identificação do Professor: __________________
Secção 1. Formulário de Informação sobre os antecedentes do(a) aluno(a) Diga na LÍNGUA MATERNA DO ALUNO: Começarei por fazer algumas perguntas sobre ti, tá bom?
1.Sexo do Aluno Feminino Masculino
2.Quantos anos tens?__________ Não Sabe/Não Responde
3. Fala Português: [Marque com ‘X’ apenas uma resposta por linha]
Quase Sempre Ocasionalmente Quase Nunca Nunca Não Aplicável
Com a sua mãe?
Com o seu pai?
Com os seus irmãos/irmãs?
Com os seus amigos?
4. Vives com a tua mãe? SIM NÃO
5. Vives com o teu pai? SIM NÃO
[Se o(a) aluno(a) vive com os dois pais, passe para a Questão 5 ]
6.Por quê não vives com teu pai e/ou tua mãe?
Orfã(o) de mãe Orfã(o) de pai Orfã(o) de pai e mãe Outro ______________________
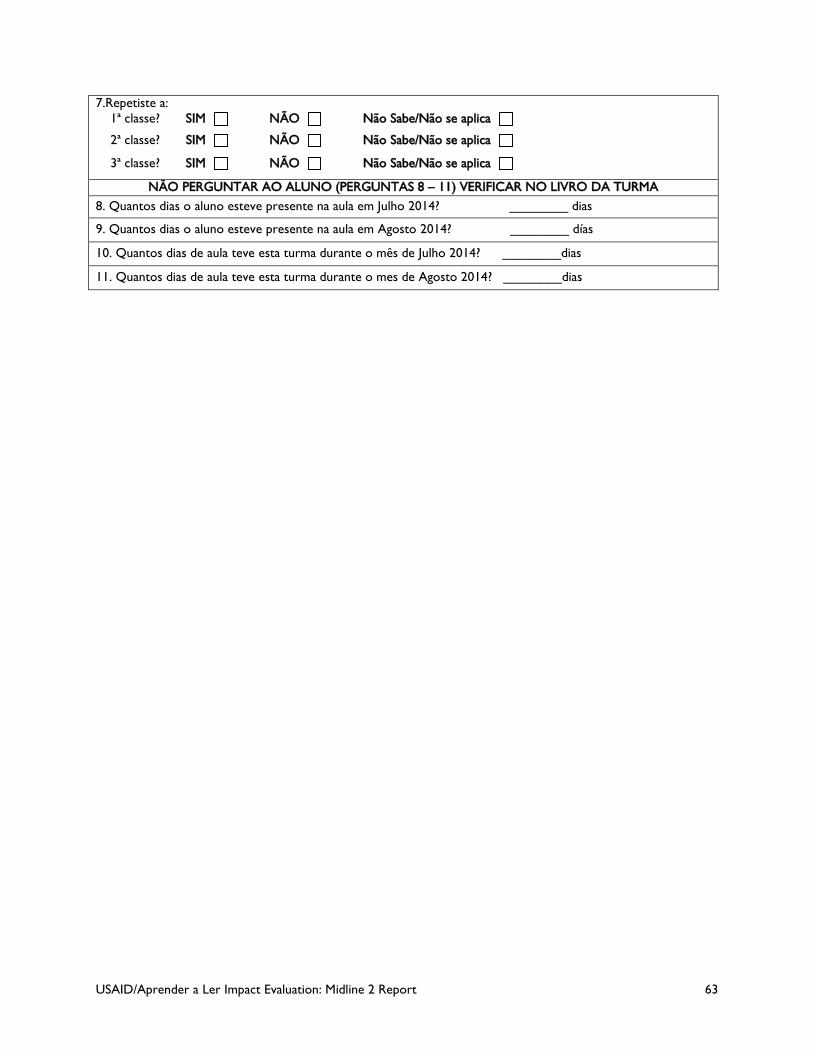
USAID/Aprender a Ler Impact Evaluation: Midline 2 Report 63
7.Repetiste a: 1ª classe? SIM NÃO Não Sabe/Não se aplica
2ª classe? SIM NÃO Não Sabe/Não se aplica
3ª classe? SIM NÃO Não Sabe/Não se aplica
NÃO PERGUNTAR AO ALUNO (PERGUNTAS 8 – 11) VERIFICAR NO LIVRO DA TURMA 8. Quantos dias o aluno esteve presente na aula em Julho 2014? ________ dias
9. Quantos dias o aluno esteve presente na aula em Agosto 2014? ________ días
10. Quantos dias de aula teve esta turma durante o mês de Julho 2014? ________dias
11. Quantos dias de aula teve esta turma durante o mes de Agosto 2014? ________dias
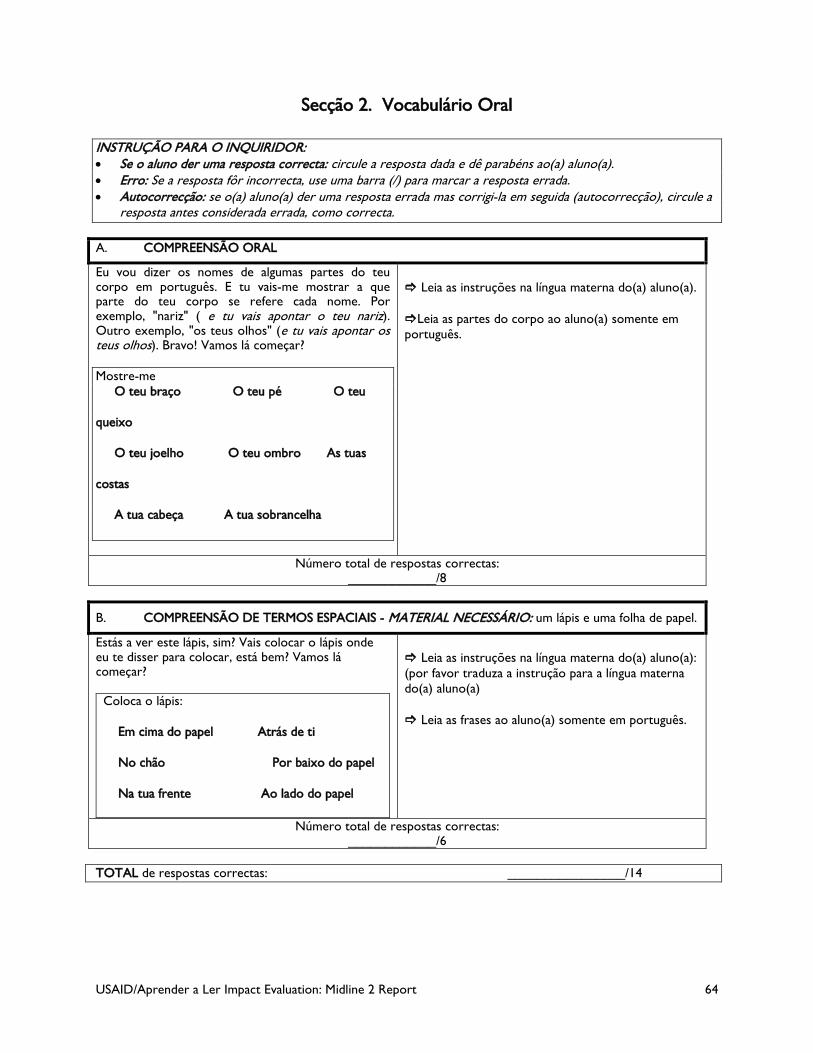
USAID/Aprender a Ler Impact Evaluation: Midline 2 Report 64
Secção 2. Vocabulário Oral
INSTRUÇÃO PARA O INQUIRIDOR: • Se o aluno der uma resposta correcta: circule a resposta dada e dê parabéns ao(a) aluno(a). • Erro: Se a resposta fôr incorrecta, use uma barra (/) para marcar a resposta errada. • Autocorrecção: se o(a) aluno(a) der uma resposta errada mas corrigi-la em seguida (autocorrecção), circule a
resposta antes considerada errada, como correcta. A. COMPREENSÃO ORAL
Eu vou dizer os nomes de algumas partes do teu corpo em português. E tu vais-me mostrar a que parte do teu corpo se refere cada nome. Por exemplo, "nariz" ( e tu vais apontar o teu nariz). Outro exemplo, "os teus olhos" (e tu vais apontar os teus olhos). Bravo! Vamos lá começar? Mostre-me O teu braço O teu pé O teu
queixo
O teu joelho O teu ombro As tuas
costas
A tua cabeça A tua sobrancelha
Leia as instruções na língua materna do(a) aluno(a).
Leia as partes do corpo ao aluno(a) somente em português.
Número total de respostas correctas: ____________/8
B. COMPREENSÃO DE TERMOS ESPACIAIS - MATERIAL NECESSÁRIO: um lápis e uma folha de papel.
Estás a ver este lápis, sim? Vais colocar o lápis onde eu te disser para colocar, está bem? Vamos lá começar?
Coloca o lápis: Em cima do papel Atrás de ti
No chão Por baixo do papel
Na tua frente Ao lado do papel
Leia as instruções na língua materna do(a) aluno(a): (por favor traduza a instrução para a língua materna do(a) aluno(a)
Leia as frases ao aluno(a) somente em português.
Número total de respostas correctas: ____________/6
TOTAL de respostas correctas: ________________/14
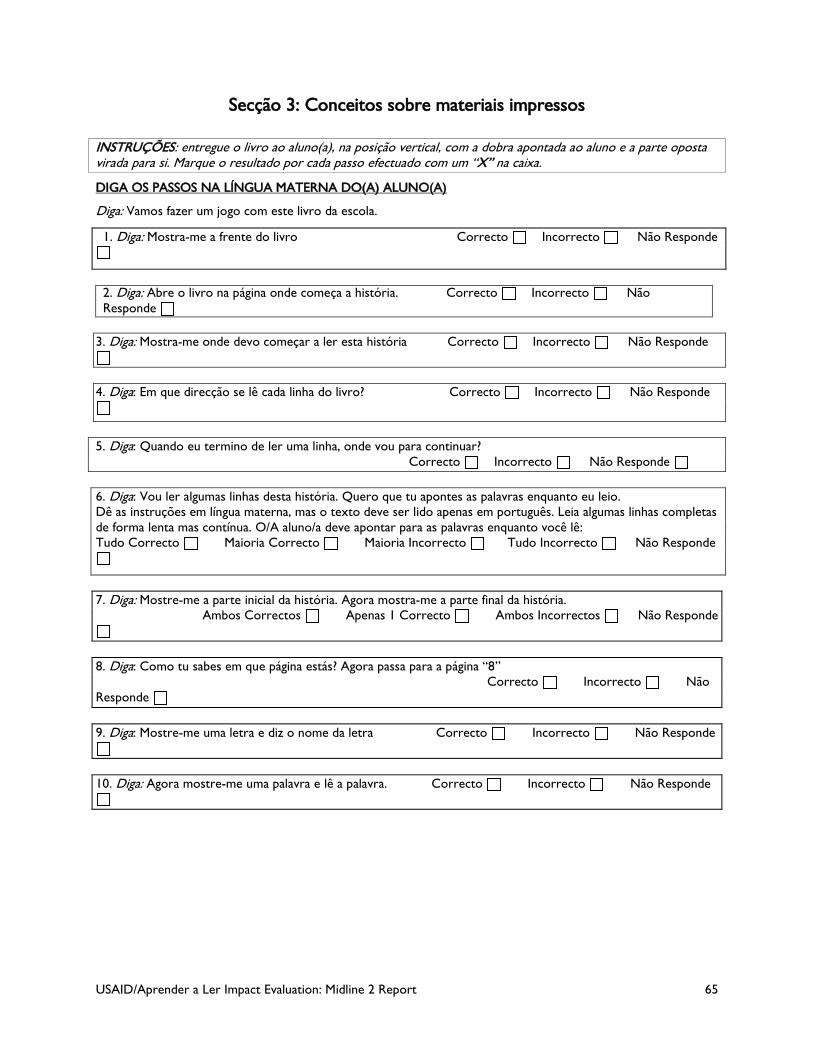
USAID/Aprender a Ler Impact Evaluation: Midline 2 Report 65
Secção 3: Conceitos sobre materiais impressos
INSTRUÇÕES: entregue o livro ao aluno(a), na posição vertical, com a dobra apontada ao aluno e a parte oposta virada para si. Marque o resultado por cada passo efectuado com um “X” na caixa.
DIGA OS PASSOS NA LÍNGUA MATERNA DO(A) ALUNO(A)
Diga: Vamos fazer um jogo com este livro da escola.
1. Diga: Mostra-me a frente do livro Correcto Incorrecto Não Responde
2. Diga: Abre o livro na página onde começa a história. Correcto Incorrecto Não Responde
3. Diga: Mostra-me onde devo começar a ler esta história Correcto Incorrecto Não Responde
4. Diga: Em que direcção se lê cada linha do livro? Correcto Incorrecto Não Responde
5. Diga: Quando eu termino de ler uma linha, onde vou para continuar? Correcto Incorrecto Não Responde 6. Diga: Vou ler algumas linhas desta história. Quero que tu apontes as palavras enquanto eu leio. Dê as instruções em língua materna, mas o texto deve ser lido apenas em português. Leia algumas linhas completas de forma lenta mas contínua. O/A aluno/a deve apontar para as palavras enquanto você lê: Tudo Correcto Maioria Correcto Maioria Incorrecto Tudo Incorrecto Não Responde
7. Diga: Mostre-me a parte inicial da história. Agora mostra-me a parte final da história. Ambos Correctos Apenas 1 Correcto Ambos Incorrectos Não Responde
8. Diga: Como tu sabes em que página estás? Agora passa para a página “8”
Correcto Incorrecto Não Responde 9. Diga: Mostre-me uma letra e diz o nome da letra Correcto Incorrecto Não Responde
10. Diga: Agora mostre-me uma palavra e lê a palavra. Correcto Incorrecto Não Responde
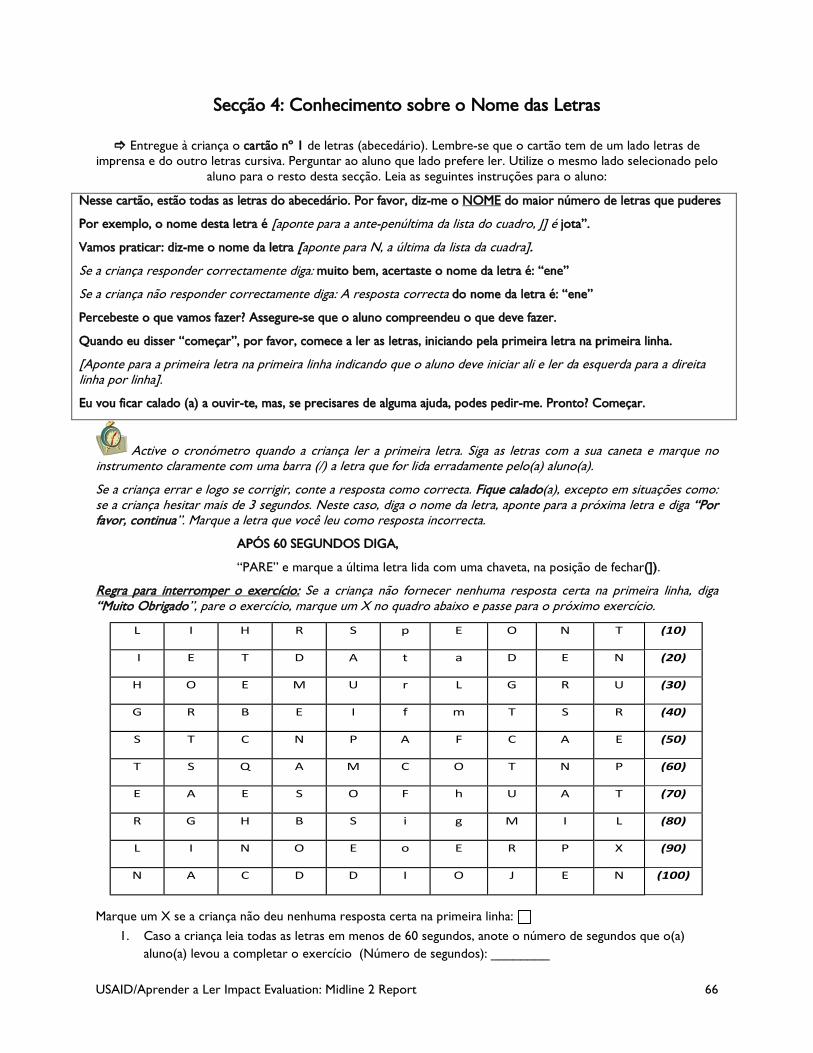
USAID/Aprender a Ler Impact Evaluation: Midline 2 Report 66
Secção 4: Conhecimento sobre o Nome das Letras Entregue à criança o cartão nº 1 de letras (abecedário). Lembre-se que o cartão tem de um lado letras de
imprensa e do outro letras cursiva. Perguntar ao aluno que lado prefere ler. Utilize o mesmo lado selecionado pelo aluno para o resto desta secção. Leia as seguintes instruções para o aluno:
Nesse cartão, estão todas as letras do abecedário. Por favor, diz-me o NOME do maior número de letras que puderes
Por exemplo, o nome desta letra é [aponte para a ante-penúltima da lista do cuadro, J] é jota”.
Vamos praticar: diz-me o nome da letra [aponte para N, a última da lista da cuadra].
Se a criança responder correctamente diga: muito bem, acertaste o nome da letra é: “ene”
Se a criança não responder correctamente diga: A resposta correcta do nome da letra é: “ene”
Percebeste o que vamos fazer? Assegure-se que o aluno compreendeu o que deve fazer.
Quando eu disser “começar”, por favor, comece a ler as letras, iniciando pela primeira letra na primeira linha.
[Aponte para a primeira letra na primeira linha indicando que o aluno deve iniciar ali e ler da esquerda para a direita linha por linha].
Eu vou ficar calado (a) a ouvir-te, mas, se precisares de alguma ajuda, podes pedir-me. Pronto? Começar.
Active o cronómetro quando a criança ler a primeira letra. Siga as letras com a sua caneta e marque no instrumento claramente com uma barra (/) a letra que for lida erradamente pelo(a) aluno(a).
Se a criança errar e logo se corrigir, conte a resposta como correcta. Fique calado(a), excepto em situações como: se a criança hesitar mais de 3 segundos. Neste caso, diga o nome da letra, aponte para a próxima letra e diga “Por favor, continua”. Marque a letra que você leu como resposta incorrecta.
APÓS 60 SEGUNDOS DIGA,
“PARE” e marque a última letra lida com uma chaveta, na posição de fechar(]).
Regra para interromper o exercício: Se a criança não fornecer nenhuma resposta certa na primeira linha, diga “Muito Obrigado”, pare o exercício, marque um X no quadro abaixo e passe para o próximo exercício.
Marque um X se a criança não deu nenhuma resposta certa na primeira linha: 1. Caso a criança leia todas as letras em menos de 60 segundos, anote o número de segundos que o(a)
aluno(a) levou a completar o exercício (Número de segundos): ________
L I H R S p E O N T (10)
I E T D A t a D E N (20)
H O E M U r L G R U (30)
G R B E I f m T S R (40)
S T C N P A F C A E (50)
T S Q A M C O T N P (60)
E A E S O F h U A T (70)
R G H B S i g M I L (80)
L I N O E o E R P X (90)
N A C D D I O J E N (100)
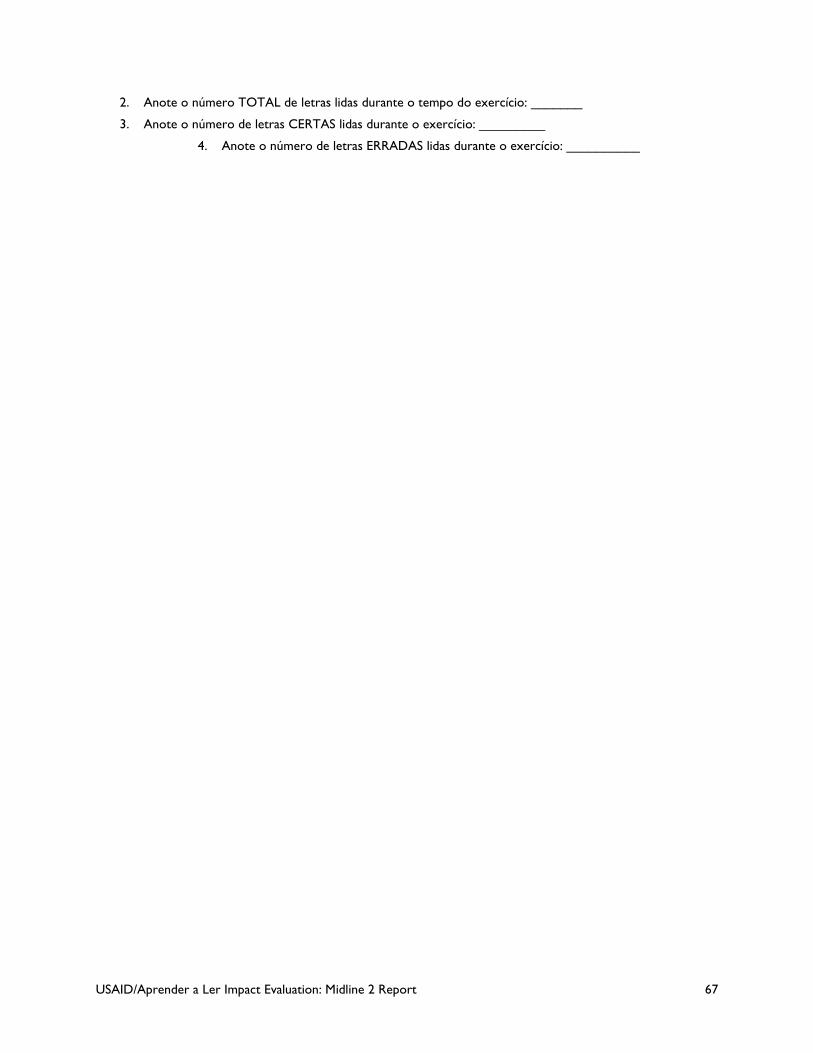
USAID/Aprender a Ler Impact Evaluation: Midline 2 Report 67
2. Anote o número TOTAL de letras lidas durante o tempo do exercício: _______
3. Anote o número de letras CERTAS lidas durante o exercício: _________
4. Anote o número de letras ERRADAS lidas durante o exercício: __________
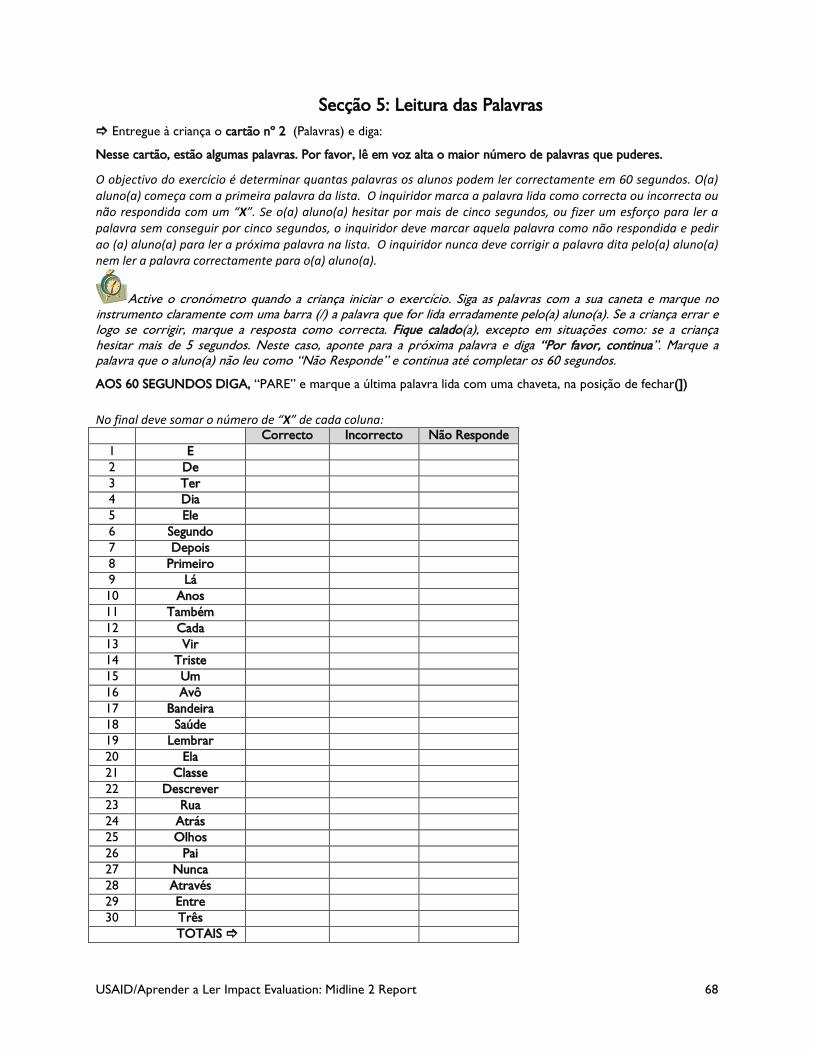
USAID/Aprender a Ler Impact Evaluation: Midline 2 Report 68
Secção 5: Leitura das Palavras
Entregue à criança o cartão nº 2 (Palavras) e diga:
Nesse cartão, estão algumas palavras. Por favor, lê em voz alta o maior número de palavras que puderes.
O objectivo do exercício é determinar quantas palavras os alunos podem ler correctamente em 60 segundos. O(a) aluno(a) começa com a primeira palavra da lista. O inquiridor marca a palavra lida como correcta ou incorrecta ou não respondida com um “X”. Se o(a) aluno(a) hesitar por mais de cinco segundos, ou fizer um esforço para ler a palavra sem conseguir por cinco segundos, o inquiridor deve marcar aquela palavra como não respondida e pedir ao (a) aluno(a) para ler a próxima palavra na lista. O inquiridor nunca deve corrigir a palavra dita pelo(a) aluno(a) nem ler a palavra correctamente para o(a) aluno(a).
Active o cronómetro quando a criança iniciar o exercício. Siga as palavras com a sua caneta e marque no instrumento claramente com uma barra (/) a palavra que for lida erradamente pelo(a) aluno(a). Se a criança errar e logo se corrigir, marque a resposta como correcta. Fique calado(a), excepto em situações como: se a criança hesitar mais de 5 segundos. Neste caso, aponte para a próxima palavra e diga “Por favor, continua”. Marque a palavra que o aluno(a) não leu como “Não Responde” e continua até completar os 60 segundos.
AOS 60 SEGUNDOS DIGA, “PARE” e marque a última palavra lida com uma chaveta, na posição de fechar(])
No final deve somar o número de “X” de cada coluna: Correcto Incorrecto Não Responde 1 E 2 De 3 Ter 4 Dia 5 Ele 6 Segundo 7 Depois 8 Primeiro 9 Lá 10 Anos 11 Também 12 Cada 13 Vir 14 Triste 15 Um 16 Avô 17 Bandeira 18 Saúde 19 Lembrar 20 Ela 21 Classe 22 Descrever 23 Rua 24 Atrás 25 Olhos 26 Pai 27 Nunca 28 Através 29 Entre 30 Três
TOTAIS
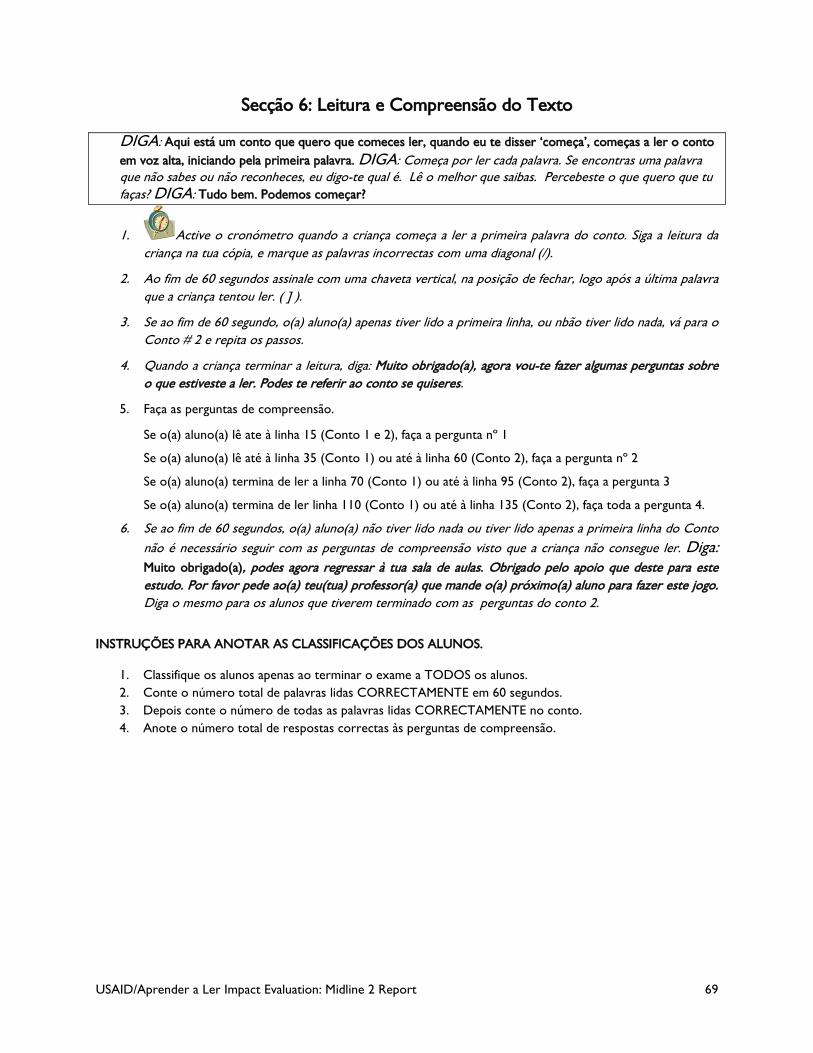
USAID/Aprender a Ler Impact Evaluation: Midline 2 Report 69
Secção 6: Leitura e Compreensão do Texto
DIGA: Aqui está um conto que quero que comeces ler, quando eu te disser ‘começa’, começas a ler o conto em voz alta, iniciando pela primeira palavra. DIGA: Começa por ler cada palavra. Se encontras uma palavra que não sabes ou não reconheces, eu digo-te qual é. Lê o melhor que saibas. Percebeste o que quero que tu faças? DIGA: Tudo bem. Podemos começar?
1. Active o cronómetro quando a criança começa a ler a primeira palavra do conto. Siga a leitura da criança na tua cópia, e marque as palavras incorrectas com uma diagonal (/).
2. Ao fim de 60 segundos assinale com uma chaveta vertical, na posição de fechar, logo após a última palavra que a criança tentou ler. ( ] ).
3. Se ao fim de 60 segundo, o(a) aluno(a) apenas tiver lido a primeira linha, ou nbão tiver lido nada, vá para o Conto # 2 e repita os passos.
4. Quando a criança terminar a leitura, diga: Muito obrigado(a), agora vou-te fazer algumas perguntas sobre o que estiveste a ler. Podes te referir ao conto se quiseres.
5. Faça as perguntas de compreensão.
Se o(a) aluno(a) lê ate à linha 15 (Conto 1 e 2), faça a pergunta nº 1
Se o(a) aluno(a) lê até à linha 35 (Conto 1) ou até à linha 60 (Conto 2), faça a pergunta nº 2
Se o(a) aluno(a) termina de ler a linha 70 (Conto 1) ou até à linha 95 (Conto 2), faça a pergunta 3
Se o(a) aluno(a) termina de ler linha 110 (Conto 1) ou até à linha 135 (Conto 2), faça toda a pergunta 4.
6. Se ao fim de 60 segundos, o(a) aluno(a) não tiver lido nada ou tiver lido apenas a primeira linha do Conto não é necessário seguir com as perguntas de compreensão visto que a criança não consegue ler. Diga: Muito obrigado(a), podes agora regressar à tua sala de aulas. Obrigado pelo apoio que deste para este estudo. Por favor pede ao(a) teu(tua) professor(a) que mande o(a) próximo(a) aluno para fazer este jogo. Diga o mesmo para os alunos que tiverem terminado com as perguntas do conto 2.
INSTRUÇÕES PARA ANOTAR AS CLASSIFICAÇÕES DOS ALUNOS.
1. Classifique os alunos apenas ao terminar o exame a TODOS os alunos. 2. Conte o número total de palavras lidas CORRECTAMENTE em 60 segundos. 3. Depois conte o número de todas as palavras lidas CORRECTAMENTE no conto. 4. Anote o número total de respostas correctas às perguntas de compreensão.
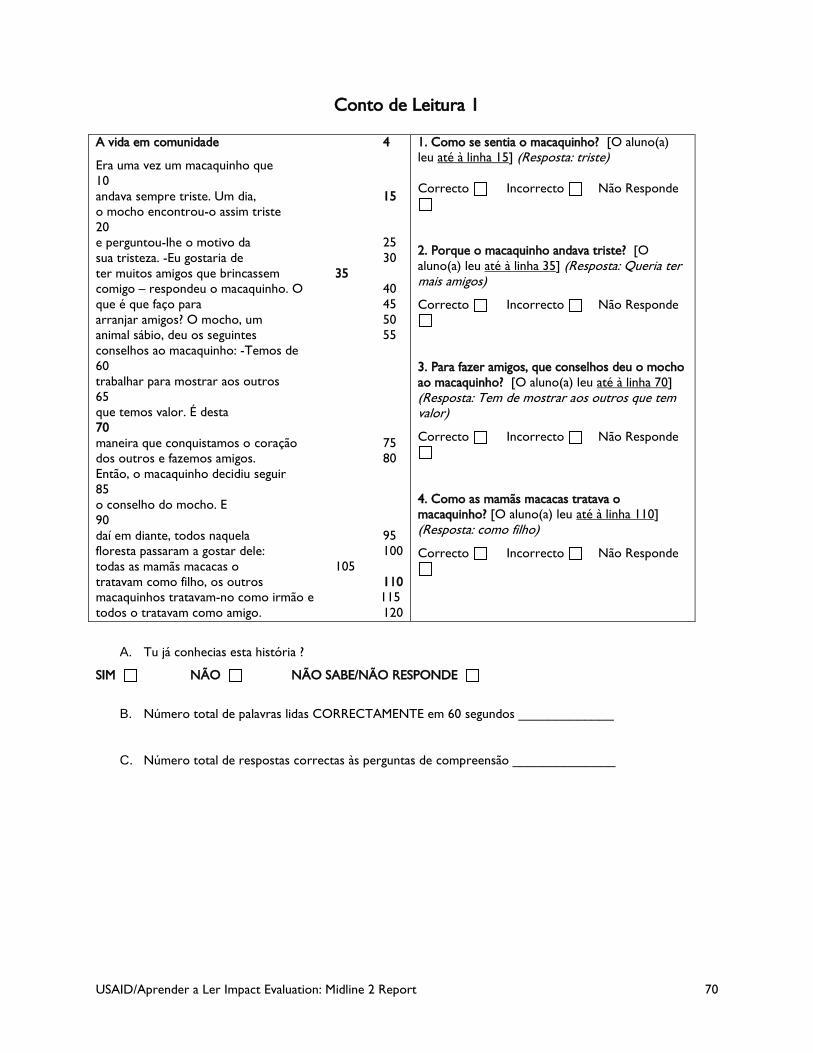
USAID/Aprender a Ler Impact Evaluation: Midline 2 Report 70
Conto de Leitura 1
A. Tu já conhecias esta história ?
SIM NÃO NÃO SABE/NÃO RESPONDE
B. Número total de palavras lidas CORRECTAMENTE em 60 segundos _____________
C. Número total de respostas correctas às perguntas de compreensão ______________
A vida em comunidade 4
Era uma vez um macaquinho que 10 andava sempre triste. Um dia, 15 o mocho encontrou-o assim triste 20 e perguntou-lhe o motivo da 25 sua tristeza. -Eu gostaria de 30 ter muitos amigos que brincassem 35 comigo – respondeu o macaquinho. O 40 que é que faço para 45 arranjar amigos? O mocho, um 50 animal sábio, deu os seguintes 55 conselhos ao macaquinho: -Temos de 60 trabalhar para mostrar aos outros 65 que temos valor. É desta 70 maneira que conquistamos o coração 75 dos outros e fazemos amigos. 80 Então, o macaquinho decidiu seguir 85 o conselho do mocho. E 90 daí em diante, todos naquela 95 floresta passaram a gostar dele: 100 todas as mamãs macacas o 105 tratavam como filho, os outros 110 macaquinhos tratavam-no como irmão e 115 todos o tratavam como amigo. 120
1. Como se sentia o macaquinho? [O aluno(a) leu até à linha 15] (Resposta: triste) Correcto Incorrecto Não Responde
2. Porque o macaquinho andava triste? [O aluno(a) leu até à linha 35] (Resposta: Queria ter mais amigos)
Correcto Incorrecto Não Responde
3. Para fazer amigos, que conselhos deu o mocho ao macaquinho? [O aluno(a) leu até à linha 70] (Resposta: Tem de mostrar aos outros que tem valor)
Correcto Incorrecto Não Responde
4. Como as mamãs macacas tratava o macaquinho? [O aluno(a) leu até à linha 110] (Resposta: como filho)
Correcto Incorrecto Não Responde
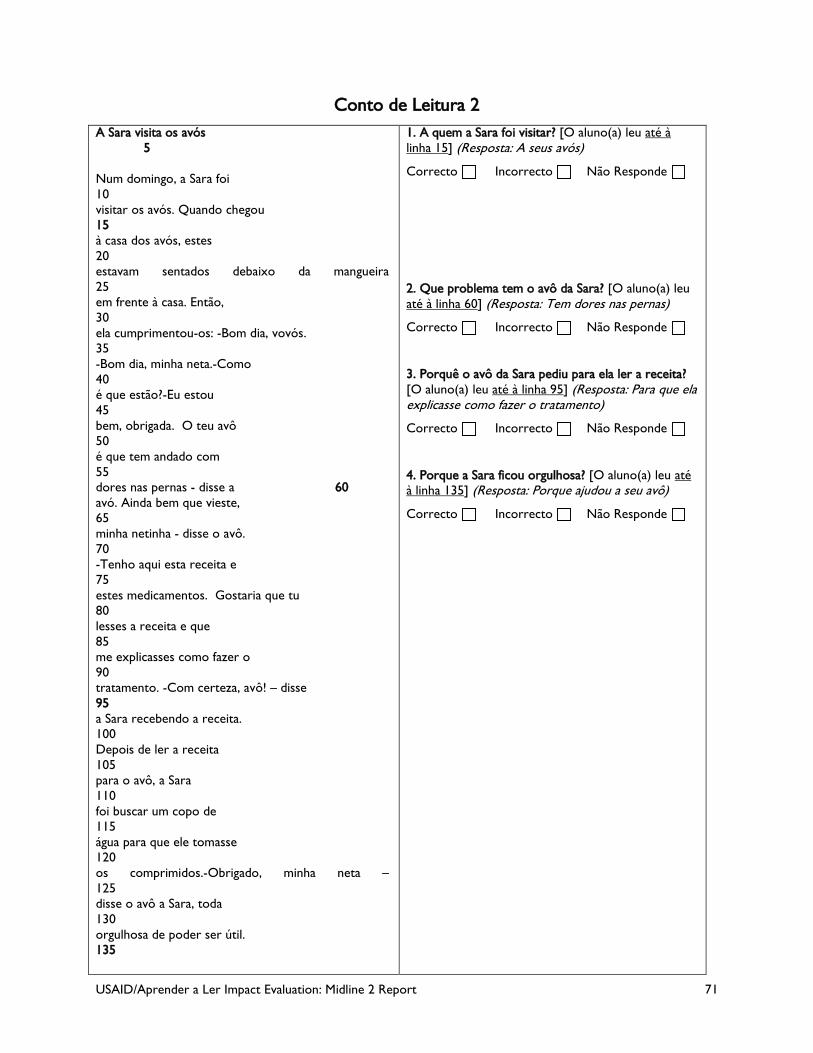
USAID/Aprender a Ler Impact Evaluation: Midline 2 Report 71
Conto de Leitura 2 A Sara visita os avós 5 Num domingo, a Sara foi 10 visitar os avós. Quando chegou 15 à casa dos avós, estes 20 estavam sentados debaixo da mangueira 25 em frente à casa. Então, 30 ela cumprimentou-os: -Bom dia, vovós. 35 -Bom dia, minha neta.-Como 40 é que estão?-Eu estou 45 bem, obrigada. O teu avô 50 é que tem andado com 55 dores nas pernas - disse a 60 avó. Ainda bem que vieste, 65 minha netinha - disse o avô. 70 -Tenho aqui esta receita e 75 estes medicamentos. Gostaria que tu 80 lesses a receita e que 85 me explicasses como fazer o 90 tratamento. -Com certeza, avô! – disse 95 a Sara recebendo a receita. 100 Depois de ler a receita 105 para o avô, a Sara 110 foi buscar um copo de 115 água para que ele tomasse 120 os comprimidos.-Obrigado, minha neta – 125 disse o avô a Sara, toda 130 orgulhosa de poder ser útil. 135
1. A quem a Sara foi visitar? [O aluno(a) leu até à linha 15] (Resposta: A seus avós)
Correcto Incorrecto Não Responde
2. Que problema tem o avô da Sara? [O aluno(a) leu até à linha 60] (Resposta: Tem dores nas pernas)
Correcto Incorrecto Não Responde
3. Porquê o avô da Sara pediu para ela ler a receita? [O aluno(a) leu até à linha 95] (Resposta: Para que ela explicasse como fazer o tratamento)
Correcto Incorrecto Não Responde
4. Porque a Sara ficou orgulhosa? [O aluno(a) leu até à linha 135] (Resposta: Porque ajudou a seu avô)
Correcto Incorrecto Não Responde
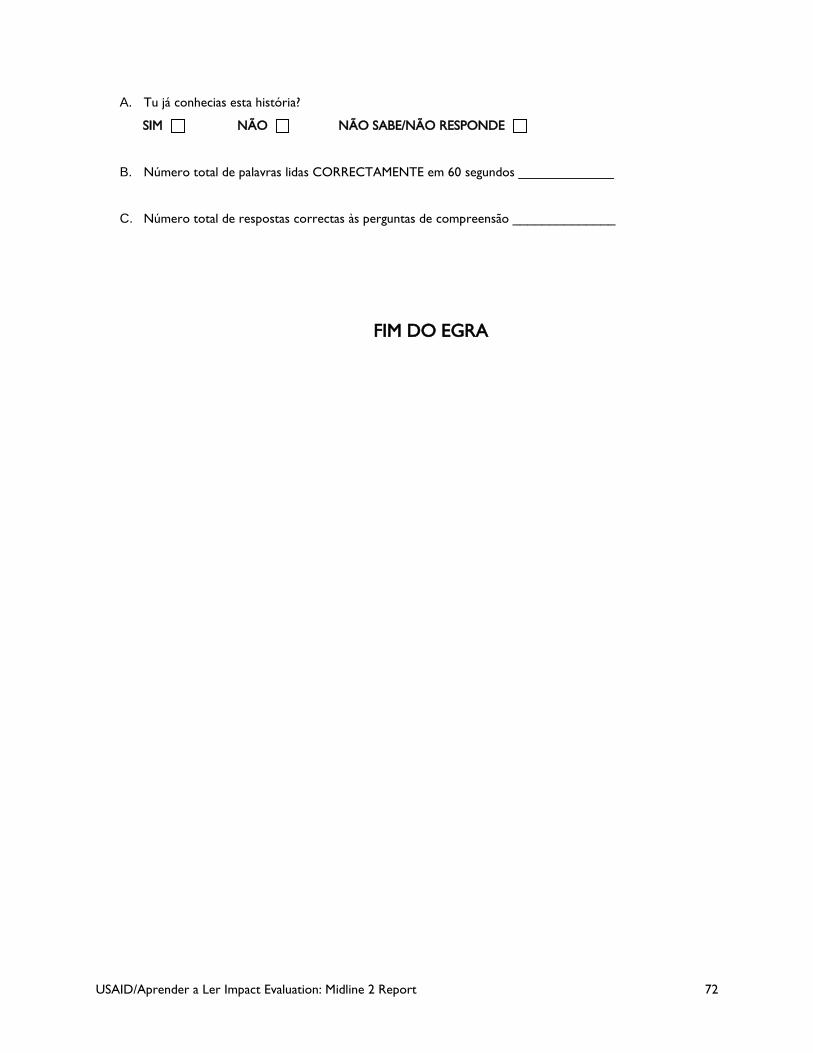
USAID/Aprender a Ler Impact Evaluation: Midline 2 Report 72
A. Tu já conhecias esta história?
SIM NÃO NÃO SABE/NÃO RESPONDE
B. Número total de palavras lidas CORRECTAMENTE em 60 segundos _____________
C. Número total de respostas correctas às perguntas de compreensão ______________
FIM DO EGRA
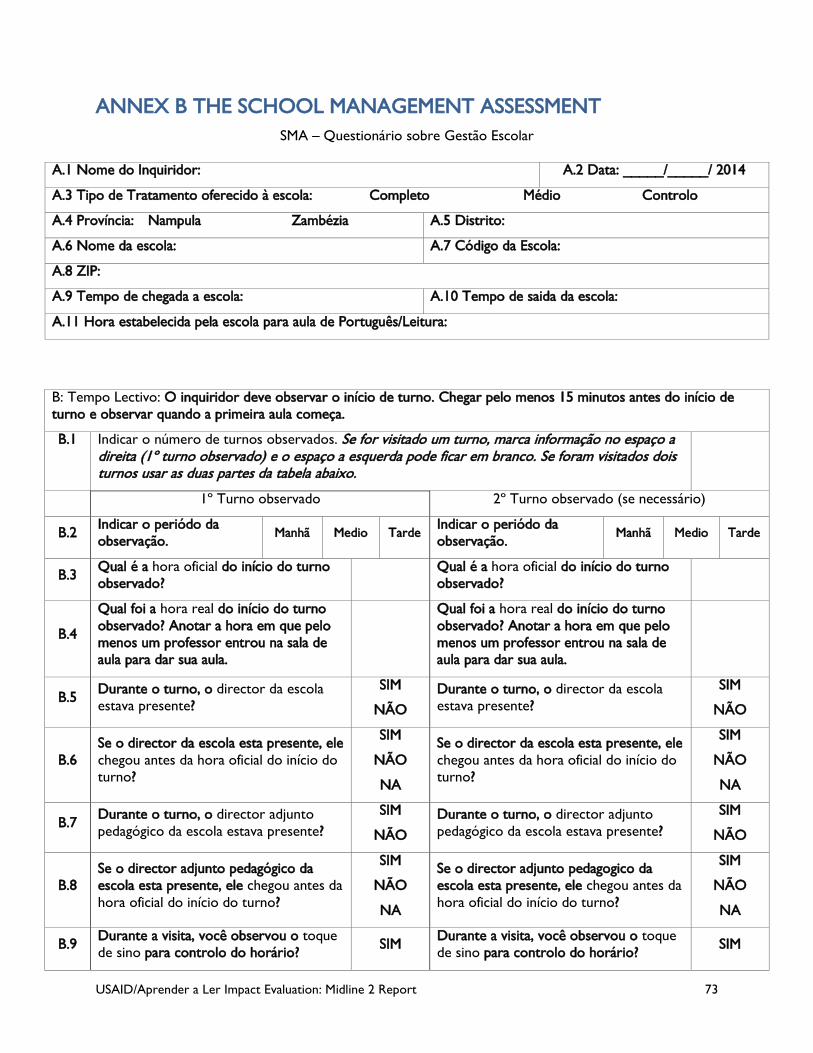
USAID/Aprender a Ler Impact Evaluation: Midline 2 Report 73
ANNEX B THE SCHOOL MANAGEMENT ASSESSMENT SMA – Questionário sobre Gestão Escolar
A.1 Nome do Inquiridor: A.2 Data: _____/_____/ 2014
A.3 Tipo de Tratamento oferecido à escola: Completo Médio Controlo
A.4 Província: Nampula Zambézia A.5 Distrito:
A.6 Nome da escola: A.7 Código da Escola:
A.8 ZIP:
A.9 Tempo de chegada a escola: A.10 Tempo de saida da escola:
A.11 Hora estabelecida pela escola para aula de Português/Leitura:
B: Tempo Lectivo: O inquiridor deve observar o início de turno. Chegar pelo menos 15 minutos antes do início de turno e observar quando a primeira aula começa.
B.1 Indicar o número de turnos observados. Se for visitado um turno, marca informação no espaço a direita (1º turno observado) e o espaço a esquerda pode ficar em branco. Se foram visitados dois turnos usar as duas partes da tabela abaixo.
1º Turno observado 2º Turno observado (se necessário)
B.2 Indicar o periódo da observação. Manhã Medio Tarde
Indicar o periódo da observação. Manhã Medio Tarde
B.3 Qual é a hora oficial do início do turno observado? Qual é a hora oficial do início do turno
observado?
B.4
Qual foi a hora real do início do turno observado? Anotar a hora em que pelo menos um professor entrou na sala de aula para dar sua aula.
Qual foi a hora real do início do turno observado? Anotar a hora em que pelo menos um professor entrou na sala de aula para dar sua aula.
B.5 Durante o turno, o director da escola estava presente?
SIM
NÃO Durante o turno, o director da escola estava presente?
SIM
NÃO
B.6 Se o director da escola esta presente, ele chegou antes da hora oficial do início do turno?
SIM
NÃO
NA
Se o director da escola esta presente, ele chegou antes da hora oficial do início do turno?
SIM
NÃO
NA
B.7 Durante o turno, o director adjunto pedagógico da escola estava presente?
SIM
NÃO Durante o turno, o director adjunto pedagógico da escola estava presente?
SIM
NÃO
B.8 Se o director adjunto pedagógico da escola esta presente, ele chegou antes da hora oficial do início do turno?
SIM
NÃO
NA
Se o director adjunto pedagogico da escola esta presente, ele chegou antes da hora oficial do início do turno?
SIM
NÃO
NA
B.9 Durante a visita, você observou o toque de sino para controlo do horário? SIM Durante a visita, você observou o toque
de sino para controlo do horário? SIM
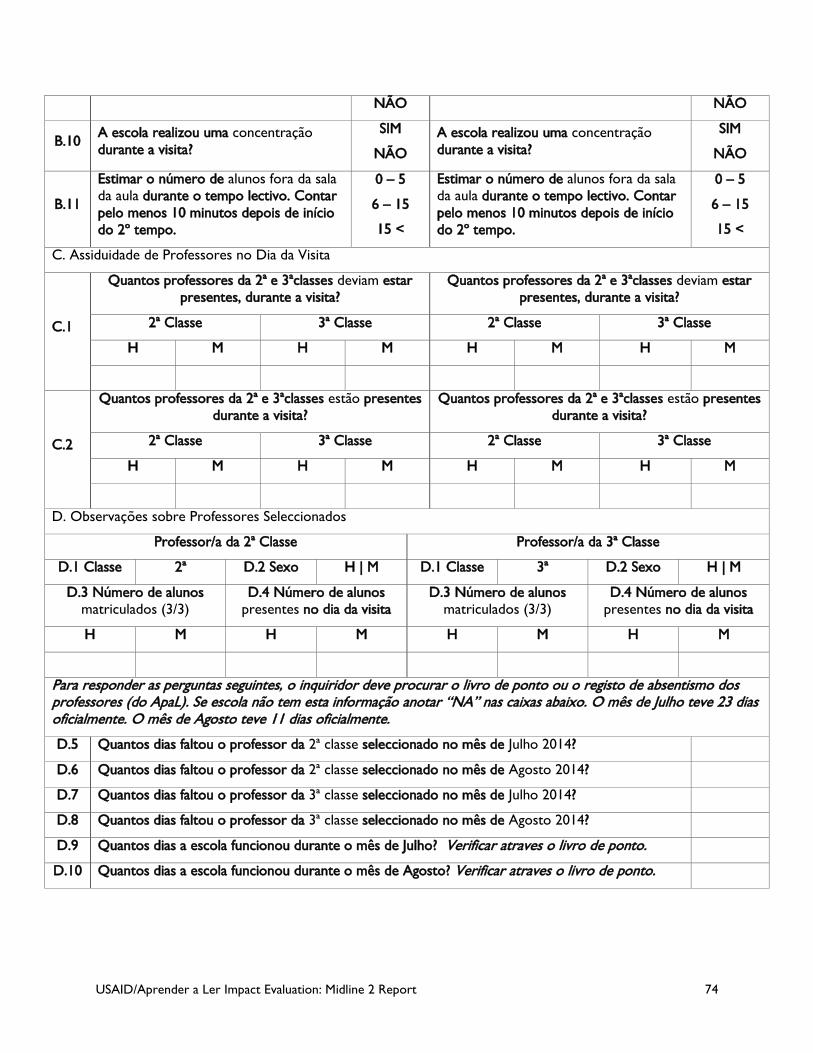
USAID/Aprender a Ler Impact Evaluation: Midline 2 Report 74
NÃO NÃO
B.10 A escola realizou uma concentração durante a visita?
SIM
NÃO A escola realizou uma concentração durante a visita?
SIM
NÃO
B.11
Estimar o número de alunos fora da sala da aula durante o tempo lectivo. Contar pelo menos 10 minutos depois de início do 2º tempo.
0 – 5
6 – 15
15 <
Estimar o número de alunos fora da sala da aula durante o tempo lectivo. Contar pelo menos 10 minutos depois de início do 2º tempo.
0 – 5
6 – 15
15 <
C. Assiduidade de Professores no Dia da Visita
C.1
Quantos professores da 2ª e 3ªclasses deviam estar presentes, durante a visita?
Quantos professores da 2ª e 3ªclasses deviam estar presentes, durante a visita?
2ª Classe 3ª Classe 2ª Classe 3ª Classe
H M H M H M H M
C.2
Quantos professores da 2ª e 3ªclasses estão presentes durante a visita?
Quantos professores da 2ª e 3ªclasses estão presentes durante a visita?
2ª Classe 3ª Classe 2ª Classe 3ª Classe
H M H M H M H M
D. Observações sobre Professores Seleccionados
Professor/a da 2ª Classe Professor/a da 3ª Classe
D.1 Classe 2ª D.2 Sexo H | M D.1 Classe 3ª D.2 Sexo H | M
D.3 Número de alunos matriculados (3/3)
D.4 Número de alunos presentes no dia da visita
D.3 Número de alunos matriculados (3/3)
D.4 Número de alunos presentes no dia da visita
H M H M H M H M
Para responder as perguntas seguintes, o inquiridor deve procurar o livro de ponto ou o registo de absentismo dos professores (do ApaL). Se escola não tem esta informação anotar “NA” nas caixas abaixo. O mês de Julho teve 23 dias oficialmente. O mês de Agosto teve 11 dias oficialmente.
D.5 Quantos dias faltou o professor da 2ª classe seleccionado no mês de Julho 2014?
D.6 Quantos dias faltou o professor da 2ª classe seleccionado no mês de Agosto 2014?
D.7 Quantos dias faltou o professor da 3ª classe seleccionado no mês de Julho 2014?
D.8 Quantos dias faltou o professor da 3ª classe seleccionado no mês de Agosto 2014?
D.9 Quantos dias a escola funcionou durante o mês de Julho? Verificar atraves o livro de ponto.
D.10 Quantos dias a escola funcionou durante o mês de Agosto? Verificar atraves o livro de ponto.
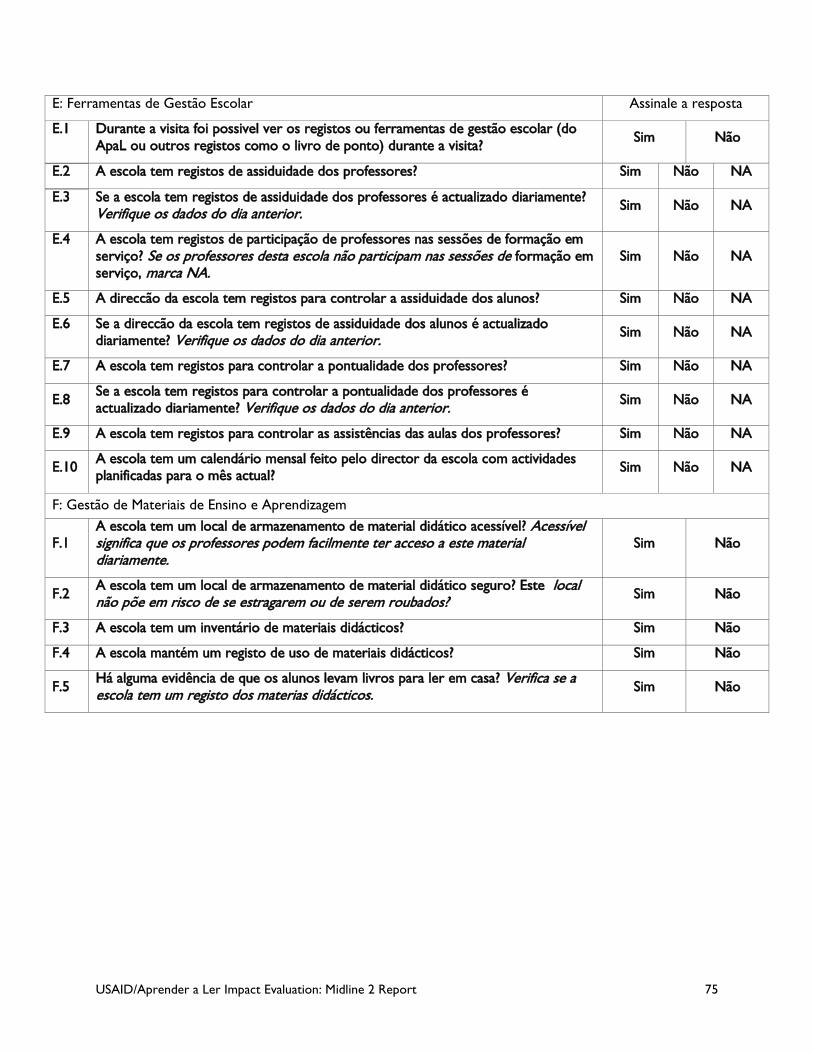
USAID/Aprender a Ler Impact Evaluation: Midline 2 Report 75
E: Ferramentas de Gestão Escolar Assinale a resposta
E.1 Durante a visita foi possivel ver os registos ou ferramentas de gestão escolar (do ApaL ou outros registos como o livro de ponto) durante a visita? Sim Não
E.2 A escola tem registos de assiduidade dos professores? Sim Não NA
E.3 Se a escola tem registos de assiduidade dos professores é actualizado diariamente? Verifique os dados do dia anterior. Sim Não NA
E.4 A escola tem registos de participação de professores nas sessões de formação em serviço? Se os professores desta escola não participam nas sessões de formação em serviço, marca NA.
Sim Não NA
E.5 A direccão da escola tem registos para controlar a assiduidade dos alunos? Sim Não NA
E.6 Se a direccão da escola tem registos de assiduidade dos alunos é actualizado diariamente? Verifique os dados do dia anterior. Sim Não NA
E.7 A escola tem registos para controlar a pontualidade dos professores? Sim Não NA
E.8 Se a escola tem registos para controlar a pontualidade dos professores é actualizado diariamente? Verifique os dados do dia anterior. Sim Não NA
E.9 A escola tem registos para controlar as assistências das aulas dos professores? Sim Não NA
E.10 A escola tem um calendário mensal feito pelo director da escola com actividades planificadas para o mês actual? Sim Não NA
F: Gestão de Materiais de Ensino e Aprendizagem
F.1 A escola tem um local de armazenamento de material didático acessível? Acessível significa que os professores podem facilmente ter acceso a este material diariamente.
Sim Não
F.2 A escola tem um local de armazenamento de material didático seguro? Este local não põe em risco de se estragarem ou de serem roubados? Sim Não
F.3 A escola tem um inventário de materiais didácticos? Sim Não
F.4 A escola mantém um registo de uso de materiais didácticos? Sim Não
F.5 Há alguma evidência de que os alunos levam livros para ler em casa? Verifica se a escola tem um registo dos materias didácticos. Sim Não
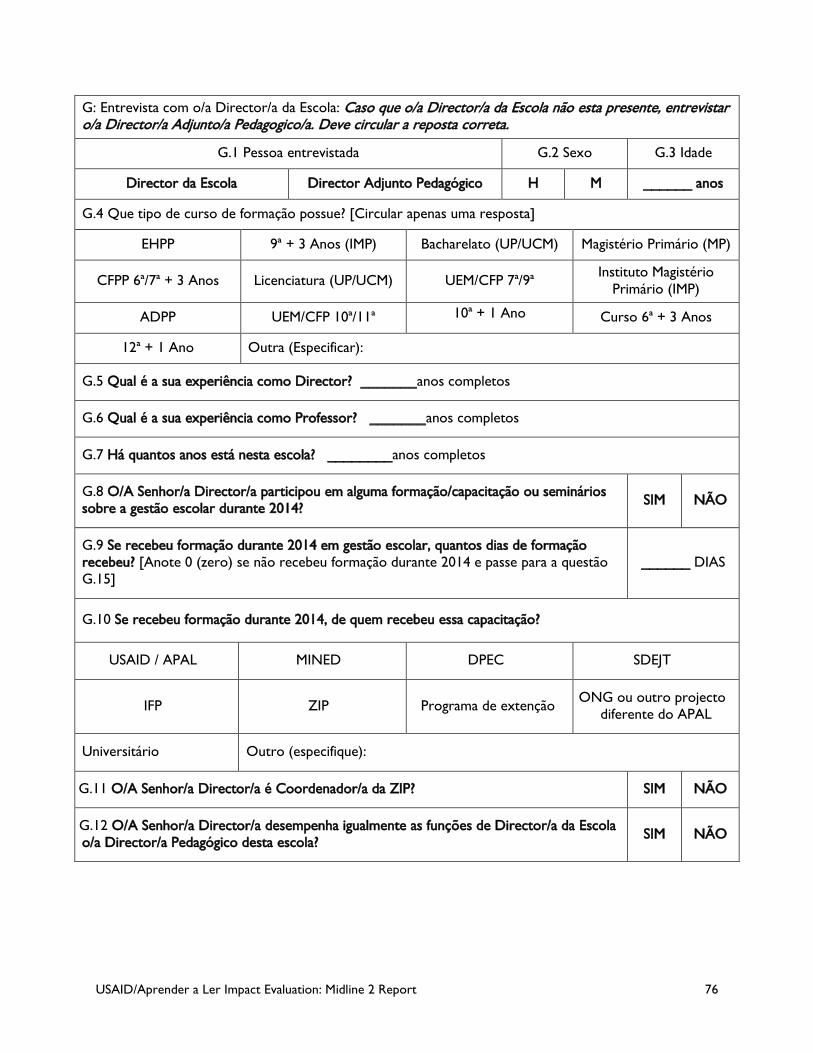
USAID/Aprender a Ler Impact Evaluation: Midline 2 Report 76
G: Entrevista com o/a Director/a da Escola: Caso que o/a Director/a da Escola não esta presente, entrevistar o/a Director/a Adjunto/a Pedagogico/a. Deve circular a reposta correta.
G.1 Pessoa entrevistada G.2 Sexo G.3 Idade
Director da Escola Director Adjunto Pedagógico H M ______ anos
G.4 Que tipo de curso de formação possue? [Circular apenas uma resposta]
EHPP 9ª + 3 Anos (IMP) Bacharelato (UP/UCM) Magistério Primário (MP)
CFPP 6ª/7ª + 3 Anos Licenciatura (UP/UCM) UEM/CFP 7ª/9ª Instituto Magistério Primário (IMP)
ADPP UEM/CFP 10ª/11ª 10ª + 1 Ano Curso 6ª + 3 Anos
12ª + 1 Ano Outra (Especificar):
G.5 Qual é a sua experiência como Director? _______anos completos
G.6 Qual é a sua experiência como Professor? _______anos completos
G.7 Há quantos anos está nesta escola? ________anos completos
G.8 O/A Senhor/a Director/a participou em alguma formação/capacitação ou seminários sobre a gestão escolar durante 2014? SIM NÃO
G.9 Se recebeu formação durante 2014 em gestão escolar, quantos dias de formação recebeu? [Anote 0 (zero) se não recebeu formação durante 2014 e passe para a questão G.15]
______ DIAS
G.10 Se recebeu formação durante 2014, de quem recebeu essa capacitação?
USAID / APAL MINED DPEC SDEJT
IFP ZIP Programa de extenção ONG ou outro projecto diferente do APAL
Universitário Outro (especifique):
G.11 O/A Senhor/a Director/a é Coordenador/a da ZIP? SIM NÃO
G.12 O/A Senhor/a Director/a desempenha igualmente as funções de Director/a da Escola o/a Director/a Pedagógico desta escola? SIM NÃO
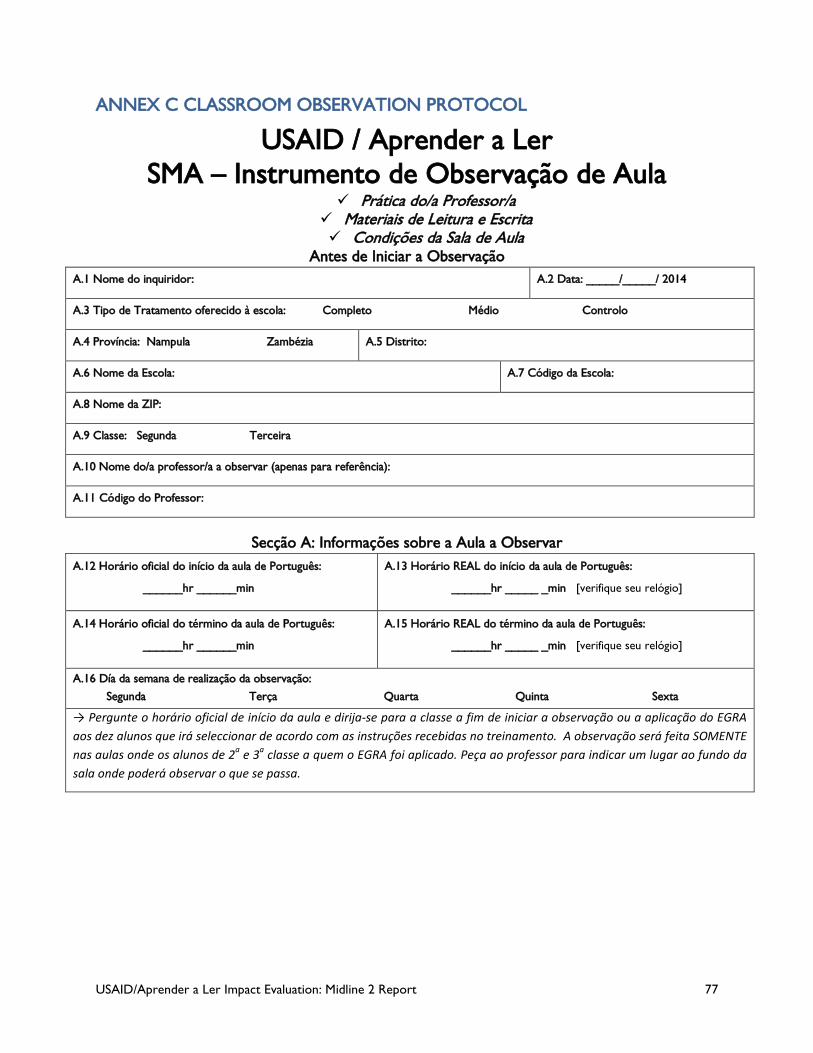
USAID/Aprender a Ler Impact Evaluation: Midline 2 Report 77
ANNEX C CLASSROOM OBSERVATION PROTOCOL
USAID / Aprender a Ler SMA – Instrumento de Observação de Aula
Prática do/a Professor/a Materiais de Leitura e Escrita Condições da Sala de Aula
Antes de Iniciar a Observação A.1 Nome do inquiridor: A.2 Data: _____/_____/ 2014
A.3 Tipo de Tratamento oferecido à escola: Completo Médio Controlo
A.4 Província: Nampula Zambézia A.5 Distrito:
A.6 Nome da Escola: A.7 Código da Escola:
A.8 Nome da ZIP:
A.9 Classe: Segunda Terceira
A.10 Nome do/a professor/a a observar (apenas para referência):
A.11 Código do Professor:
Secção A: Informações sobre a Aula a Observar
A.12 Horário oficial do início da aula de Português:
______hr ______min
A.13 Horário REAL do início da aula de Português:
______hr _____ _min [verifique seu relógio]
A.14 Horário oficial do término da aula de Português:
______hr ______min
A.15 Horário REAL do término da aula de Português:
______hr _____ _min [verifique seu relógio]
A.16 Día da semana de realização da observação: Segunda Terça Quarta Quinta Sexta
→ Pergunte o horário oficial de início da aula e dirija-se para a classe a fim de iniciar a observação ou a aplicação do EGRA aos dez alunos que irá seleccionar de acordo com as instruções recebidas no treinamento. A observação será feita SOMENTE nas aulas onde os alunos de 2a e 3a classe a quem o EGRA foi aplicado. Peça ao professor para indicar um lugar ao fundo da sala onde poderá observar o que se passa.
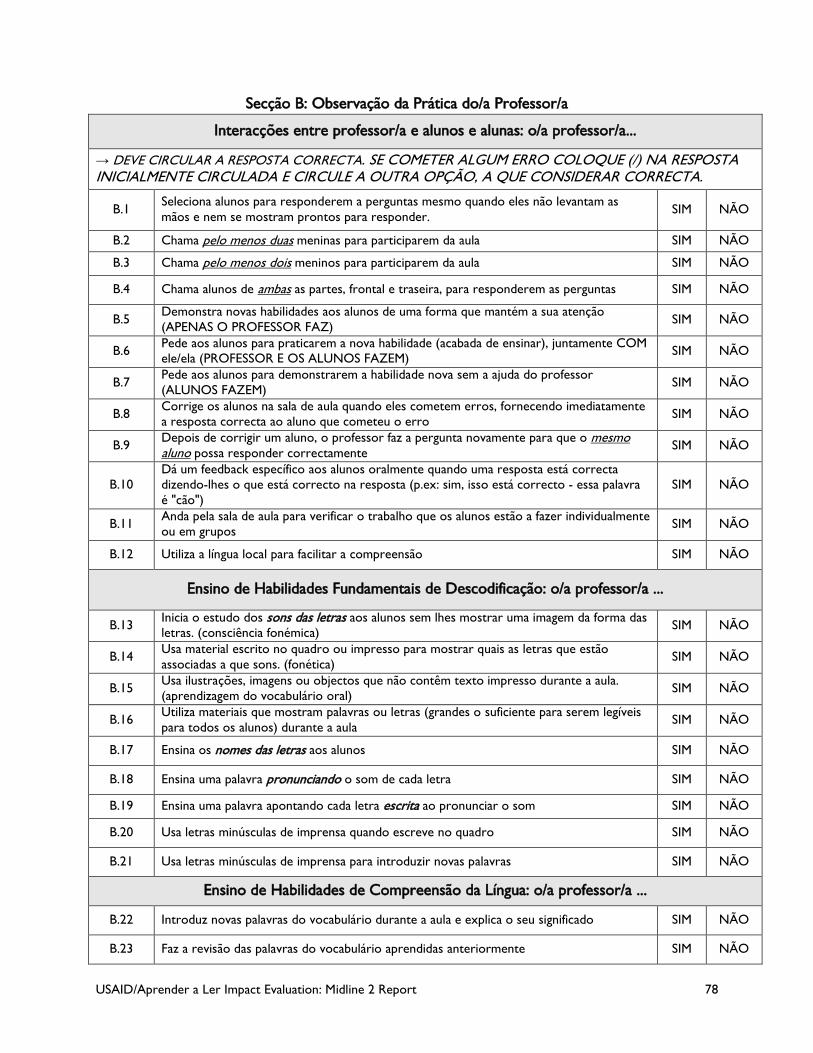
USAID/Aprender a Ler Impact Evaluation: Midline 2 Report 78
Secção B: Observação da Prática do/a Professor/a
Interacções entre professor/a e alunos e alunas: o/a professor/a...
→ DEVE CIRCULAR A RESPOSTA CORRECTA. SE COMETER ALGUM ERRO COLOQUE (/) NA RESPOSTA INICIALMENTE CIRCULADA E CIRCULE A OUTRA OPÇÃO, A QUE CONSIDERAR CORRECTA.
B.1 Seleciona alunos para responderem a perguntas mesmo quando eles não levantam as mãos e nem se mostram prontos para responder. SIM NÃO
B.2 Chama pelo menos duas meninas para participarem da aula SIM NÃO
B.3 Chama pelo menos dois meninos para participarem da aula SIM NÃO
B.4 Chama alunos de ambas as partes, frontal e traseira, para responderem as perguntas SIM NÃO
B.5 Demonstra novas habilidades aos alunos de uma forma que mantém a sua atenção (APENAS O PROFESSOR FAZ) SIM NÃO
B.6 Pede aos alunos para praticarem a nova habilidade (acabada de ensinar), juntamente COM ele/ela (PROFESSOR E OS ALUNOS FAZEM) SIM NÃO
B.7 Pede aos alunos para demonstrarem a habilidade nova sem a ajuda do professor (ALUNOS FAZEM) SIM NÃO
B.8 Corrige os alunos na sala de aula quando eles cometem erros, fornecendo imediatamente a resposta correcta ao aluno que cometeu o erro SIM NÃO
B.9 Depois de corrigir um aluno, o professor faz a pergunta novamente para que o mesmo aluno possa responder correctamente SIM NÃO
B.10 Dá um feedback específico aos alunos oralmente quando uma resposta está correcta dizendo-lhes o que está correcto na resposta (p.ex: sim, isso está correcto - essa palavra é "cão")
SIM NÃO
B.11 Anda pela sala de aula para verificar o trabalho que os alunos estão a fazer individualmente ou em grupos SIM NÃO
B.12 Utiliza a língua local para facilitar a compreensão SIM NÃO
Ensino de Habilidades Fundamentais de Descodificação: o/a professor/a ...
B.13 Inicia o estudo dos sons das letras aos alunos sem lhes mostrar uma imagem da forma das letras. (consciência fonémica) SIM NÃO
B.14 Usa material escrito no quadro ou impresso para mostrar quais as letras que estão associadas a que sons. (fonética) SIM NÃO
B.15 Usa ilustrações, imagens ou objectos que não contêm texto impresso durante a aula. (aprendizagem do vocabulário oral) SIM NÃO
B.16 Utiliza materiais que mostram palavras ou letras (grandes o suficiente para serem legíveis para todos os alunos) durante a aula SIM NÃO
B.17 Ensina os nomes das letras aos alunos SIM NÃO
B.18 Ensina uma palavra pronunciando o som de cada letra SIM NÃO
B.19 Ensina uma palavra apontando cada letra escrita ao pronunciar o som SIM NÃO
B.20 Usa letras minúsculas de imprensa quando escreve no quadro SIM NÃO
B.21 Usa letras minúsculas de imprensa para introduzir novas palavras SIM NÃO
Ensino de Habilidades de Compreensão da Língua: o/a professor/a ...
B.22 Introduz novas palavras do vocabulário durante a aula e explica o seu significado SIM NÃO
B.23 Faz a revisão das palavras do vocabulário aprendidas anteriormente SIM NÃO
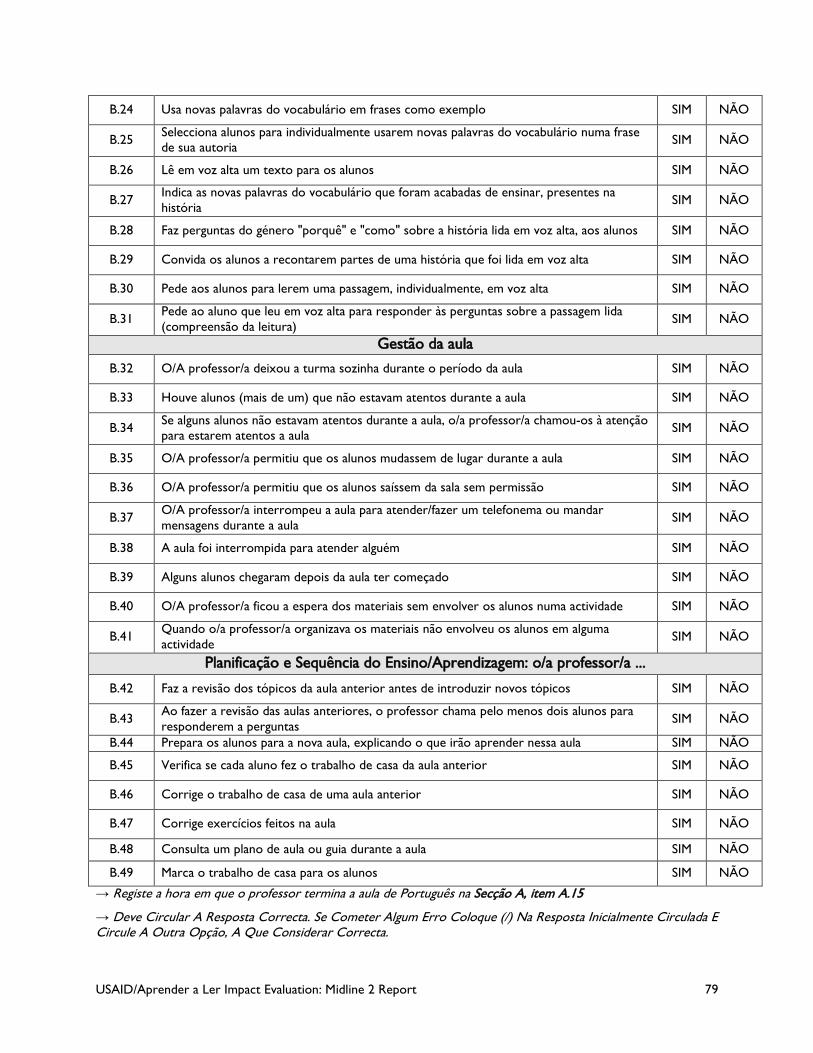
USAID/Aprender a Ler Impact Evaluation: Midline 2 Report 79
B.24 Usa novas palavras do vocabulário em frases como exemplo SIM NÃO
B.25 Selecciona alunos para individualmente usarem novas palavras do vocabulário numa frase de sua autoria SIM NÃO
B.26 Lê em voz alta um texto para os alunos SIM NÃO
B.27 Indica as novas palavras do vocabulário que foram acabadas de ensinar, presentes na história SIM NÃO
B.28 Faz perguntas do género "porquê" e "como" sobre a história lida em voz alta, aos alunos SIM NÃO
B.29 Convida os alunos a recontarem partes de uma história que foi lida em voz alta SIM NÃO
B.30 Pede aos alunos para lerem uma passagem, individualmente, em voz alta SIM NÃO
B.31 Pede ao aluno que leu em voz alta para responder às perguntas sobre a passagem lida (compreensão da leitura) SIM NÃO
Gestão da aula B.32 O/A professor/a deixou a turma sozinha durante o período da aula SIM NÃO
B.33 Houve alunos (mais de um) que não estavam atentos durante a aula SIM NÃO
B.34 Se alguns alunos não estavam atentos durante a aula, o/a professor/a chamou-os à atenção para estarem atentos a aula SIM NÃO
B.35 O/A professor/a permitiu que os alunos mudassem de lugar durante a aula SIM NÃO
B.36 O/A professor/a permitiu que os alunos saíssem da sala sem permissão SIM NÃO
B.37 O/A professor/a interrompeu a aula para atender/fazer um telefonema ou mandar mensagens durante a aula SIM NÃO
B.38 A aula foi interrompida para atender alguém SIM NÃO
B.39 Alguns alunos chegaram depois da aula ter começado SIM NÃO
B.40 O/A professor/a ficou a espera dos materiais sem envolver os alunos numa actividade SIM NÃO
B.41 Quando o/a professor/a organizava os materiais não envolveu os alunos em alguma actividade SIM NÃO
Planificação e Sequência do Ensino/Aprendizagem: o/a professor/a ... B.42 Faz a revisão dos tópicos da aula anterior antes de introduzir novos tópicos SIM NÃO
B.43 Ao fazer a revisão das aulas anteriores, o professor chama pelo menos dois alunos para responderem a perguntas SIM NÃO
B.44 Prepara os alunos para a nova aula, explicando o que irão aprender nessa aula SIM NÃO
B.45 Verifica se cada aluno fez o trabalho de casa da aula anterior SIM NÃO
B.46 Corrige o trabalho de casa de uma aula anterior SIM NÃO
B.47 Corrige exercícios feitos na aula SIM NÃO
B.48 Consulta um plano de aula ou guia durante a aula SIM NÃO
B.49 Marca o trabalho de casa para os alunos SIM NÃO
→ Registe a hora em que o professor termina a aula de Português na Secção A, item A.15
→ Deve Circular A Resposta Correcta. Se Cometer Algum Erro Coloque (/) Na Resposta Inicialmente Circulada E Circule A Outra Opção, A Que Considerar Correcta.
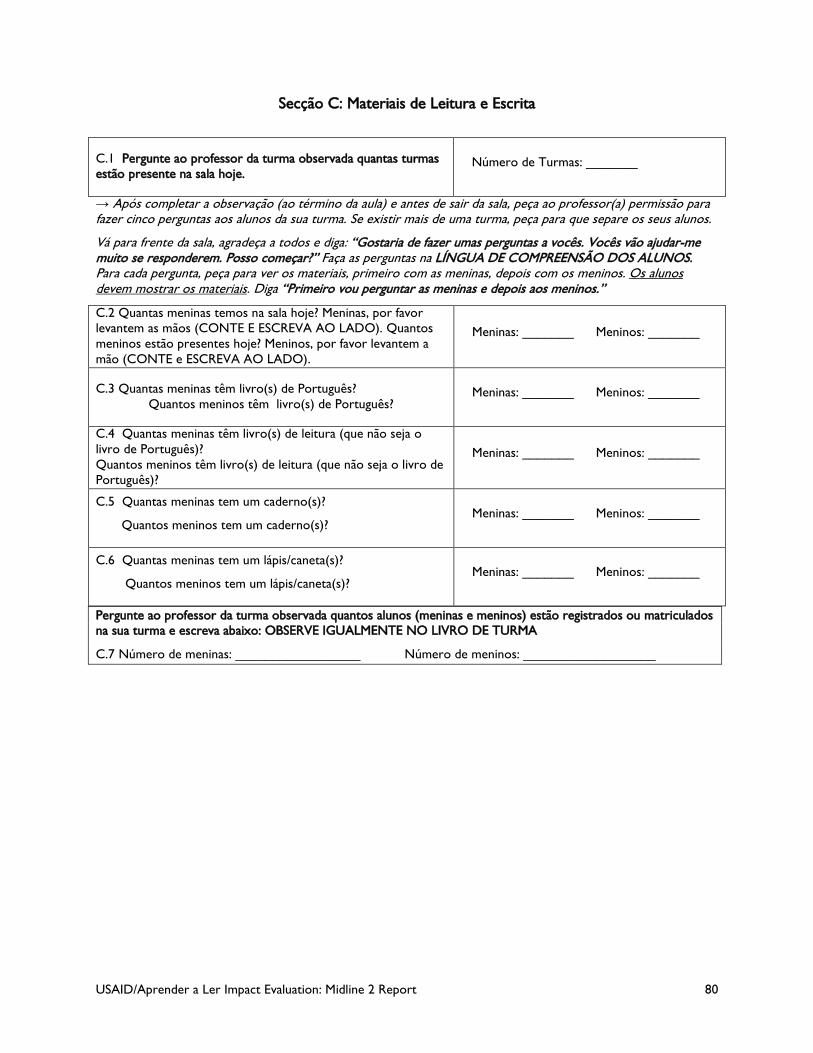
USAID/Aprender a Ler Impact Evaluation: Midline 2 Report 80
Secção C: Materiais de Leitura e Escrita
C.1 Pergunte ao professor da turma observada quantas turmas estão presente na sala hoje.
Número de Turmas: _______
→ Após completar a observação (ao término da aula) e antes de sair da sala, peça ao professor(a) permissão para fazer cinco perguntas aos alunos da sua turma. Se existir mais de uma turma, peça para que separe os seus alunos.
Vá para frente da sala, agradeça a todos e diga: “Gostaria de fazer umas perguntas a vocês. Vocês vão ajudar-me muito se responderem. Posso começar?” Faça as perguntas na LÍNGUA DE COMPREENSÃO DOS ALUNOS. Para cada pergunta, peça para ver os materiais, primeiro com as meninas, depois com os meninos. Os alunos devem mostrar os materiais. Diga “Primeiro vou perguntar as meninas e depois aos meninos.”
C.2 Quantas meninas temos na sala hoje? Meninas, por favor levantem as mãos (CONTE E ESCREVA AO LADO). Quantos meninos estão presentes hoje? Meninos, por favor levantem a mão (CONTE e ESCREVA AO LADO).
Meninas: _______ Meninos: _______
C.3 Quantas meninas têm livro(s) de Português? Quantos meninos têm livro(s) de Português?
Meninas: _______ Meninos: _______
C.4 Quantas meninas têm livro(s) de leitura (que não seja o livro de Português)? Quantos meninos têm livro(s) de leitura (que não seja o livro de Português)?
Meninas: _______ Meninos: _______
C.5 Quantas meninas tem um caderno(s)?
Quantos meninos tem um caderno(s)? Meninas: _______ Meninos: _______
C.6 Quantas meninas tem um lápis/caneta(s)?
Quantos meninos tem um lápis/caneta(s)? Meninas: _______ Meninos: _______
Pergunte ao professor da turma observada quantos alunos (meninas e meninos) estão registrados ou matriculados na sua turma e escreva abaixo: OBSERVE IGUALMENTE NO LIVRO DE TURMA
C.7 Número de meninas: _________________ Número de meninos: __________________
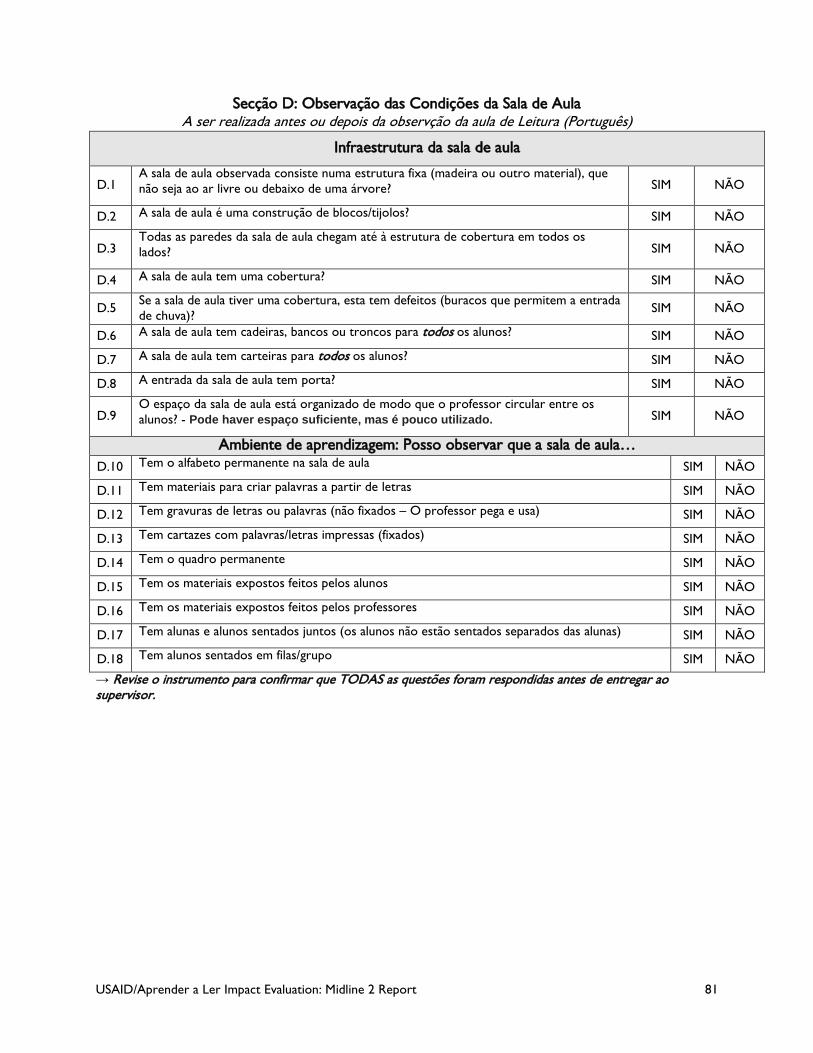
USAID/Aprender a Ler Impact Evaluation: Midline 2 Report 81
Secção D: Observação das Condições da Sala de Aula A ser realizada antes ou depois da observção da aula de Leitura (Português)
Infraestrutura da sala de aula
D.1 A sala de aula observada consiste numa estrutura fixa (madeira ou outro material), que não seja ao ar livre ou debaixo de uma árvore? SIM NÃO
D.2 A sala de aula é uma construção de blocos/tijolos? SIM NÃO
D.3 Todas as paredes da sala de aula chegam até à estrutura de cobertura em todos os lados? SIM NÃO
D.4 A sala de aula tem uma cobertura? SIM NÃO
D.5 Se a sala de aula tiver uma cobertura, esta tem defeitos (buracos que permitem a entrada de chuva)? SIM NÃO
D.6 A sala de aula tem cadeiras, bancos ou troncos para todos os alunos? SIM NÃO
D.7 A sala de aula tem carteiras para todos os alunos? SIM NÃO
D.8 A entrada da sala de aula tem porta? SIM NÃO
D.9 O espaço da sala de aula está organizado de modo que o professor circular entre os alunos? - Pode haver espaço suficiente, mas é pouco utilizado. SIM NÃO
Ambiente de aprendizagem: Posso observar que a sala de aula… D.10 Tem o alfabeto permanente na sala de aula SIM NÃO
D.11 Tem materiais para criar palavras a partir de letras SIM NÃO
D.12 Tem gravuras de letras ou palavras (não fixados – O professor pega e usa) SIM NÃO
D.13 Tem cartazes com palavras/letras impressas (fixados) SIM NÃO
D.14 Tem o quadro permanente SIM NÃO
D.15 Tem os materiais expostos feitos pelos alunos SIM NÃO
D.16 Tem os materiais expostos feitos pelos professores SIM NÃO
D.17 Tem alunas e alunos sentados juntos (os alunos não estão sentados separados das alunas) SIM NÃO
D.18 Tem alunos sentados em filas/grupo SIM NÃO
→ Revise o instrumento para confirmar que TODAS as questões foram respondidas antes de entregar ao supervisor.
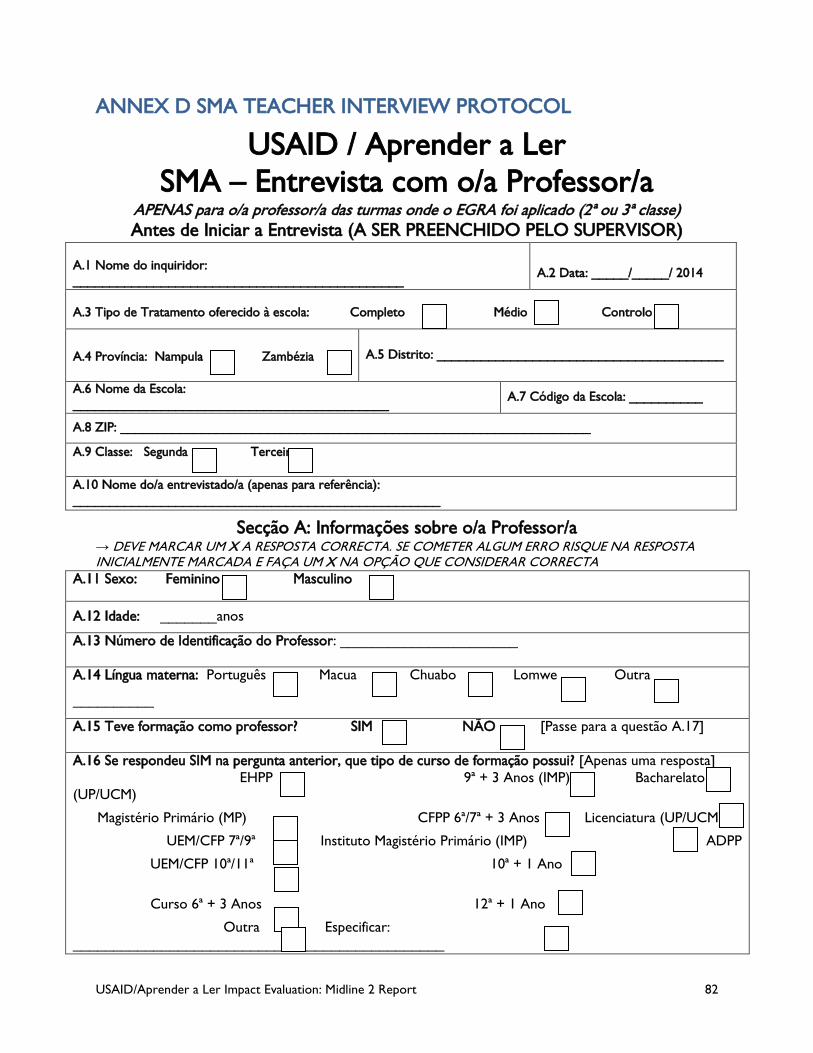
USAID/Aprender a Ler Impact Evaluation: Midline 2 Report 82
ANNEX D SMA TEACHER INTERVIEW PROTOCOL
USAID / Aprender a Ler SMA – Entrevista com o/a Professor/a
APENAS para o/a professor/a das turmas onde o EGRA foi aplicado (2ª ou 3ª classe) Antes de Iniciar a Entrevista (A SER PREENCHIDO PELO SUPERVISOR)
A.1 Nome do inquiridor: _____________________________________________
A.2 Data: _____/_____/ 2014
A.3 Tipo de Tratamento oferecido à escola: Completo Médio Controlo
A.4 Província: Nampula Zambézia A.5 Distrito: _______________________________________
A.6 Nome da Escola: ___________________________________________ A.7 Código da Escola: __________
A.8 ZIP: ________________________________________________________________
A.9 Classe: Segunda Terceira
A.10 Nome do/a entrevistado/a (apenas para referência): __________________________________________________
Secção A: Informações sobre o/a Professor/a → DEVE MARCAR UM X A RESPOSTA CORRECTA. SE COMETER ALGUM ERRO RISQUE NA RESPOSTA INICIALMENTE MARCADA E FAÇA UM X NA OPÇÃO QUE CONSIDERAR CORRECTA
A.11 Sexo: Feminino Masculino
A.12 Idade: _______anos
A.13 Número de Identificação do Professor: ______________________
A.14 Língua materna: Português Macua Chuabo Lomwe Outra
__________
A.15 Teve formação como professor? SIM NÃO [Passe para a questão A.17]
A.16 Se respondeu SIM na pergunta anterior, que tipo de curso de formação possui? [Apenas uma resposta] EHPP 9ª + 3 Anos (IMP) Bacharelato (UP/UCM)
Magistério Primário (MP) CFPP 6ª/7ª + 3 Anos Licenciatura (UP/UCM)
UEM/CFP 7ª/9ª Instituto Magistério Primário (IMP) ADPP
UEM/CFP 10ª/11ª 10ª + 1 Ano
Curso 6ª + 3 Anos 12ª + 1 Ano
Outra Especificar: ______________________________________________
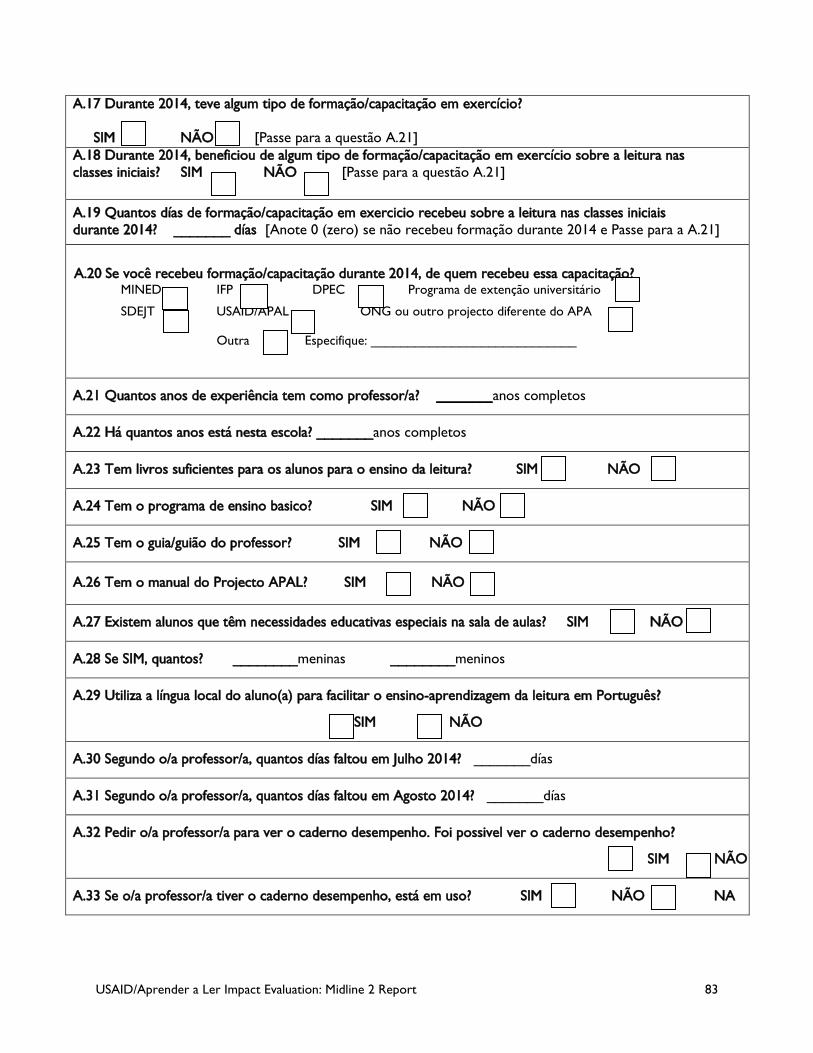
USAID/Aprender a Ler Impact Evaluation: Midline 2 Report 83
A.17 Durante 2014, teve algum tipo de formação/capacitação em exercício? SIM NÃO [Passe para a questão A.21] A.18 Durante 2014, beneficiou de algum tipo de formação/capacitação em exercício sobre a leitura nas classes iniciais? SIM NÃO [Passe para a questão A.21]
A.19 Quantos días de formação/capacitação em exercicio recebeu sobre a leitura nas classes iniciais durante 2014? _______ días [Anote 0 (zero) se não recebeu formação durante 2014 e Passe para a A.21]
A.20 Se você recebeu formação/capacitação durante 2014, de quem recebeu essa capacitação? MINED IFP DPEC Programa de extenção universitário
SDEJT USAID/APAL ONG ou outro projecto diferente do APA
Outra Especifique: ____________________________
A.21 Quantos anos de experiência tem como professor/a? _______anos completos
A.22 Há quantos anos está nesta escola? _______anos completos
A.23 Tem livros suficientes para os alunos para o ensino da leitura? SIM NÃO
A.24 Tem o programa de ensino basico? SIM NÃO
A.25 Tem o guia/guião do professor? SIM NÃO
A.26 Tem o manual do Projecto APAL? SIM NÃO
A.27 Existem alunos que têm necessidades educativas especiais na sala de aulas? SIM NÃO
A.28 Se SIM, quantos? ________meninas ________meninos
A.29 Utiliza a língua local do aluno(a) para facilitar o ensino-aprendizagem da leitura em Português?
SIM NÃO
A.30 Segundo o/a professor/a, quantos días faltou em Julho 2014? _______días
A.31 Segundo o/a professor/a, quantos días faltou em Agosto 2014? _______días
A.32 Pedir o/a professor/a para ver o caderno desempenho. Foi possivel ver o caderno desempenho?
SIM NÃO
A.33 Se o/a professor/a tiver o caderno desempenho, está em uso? SIM NÃO NA
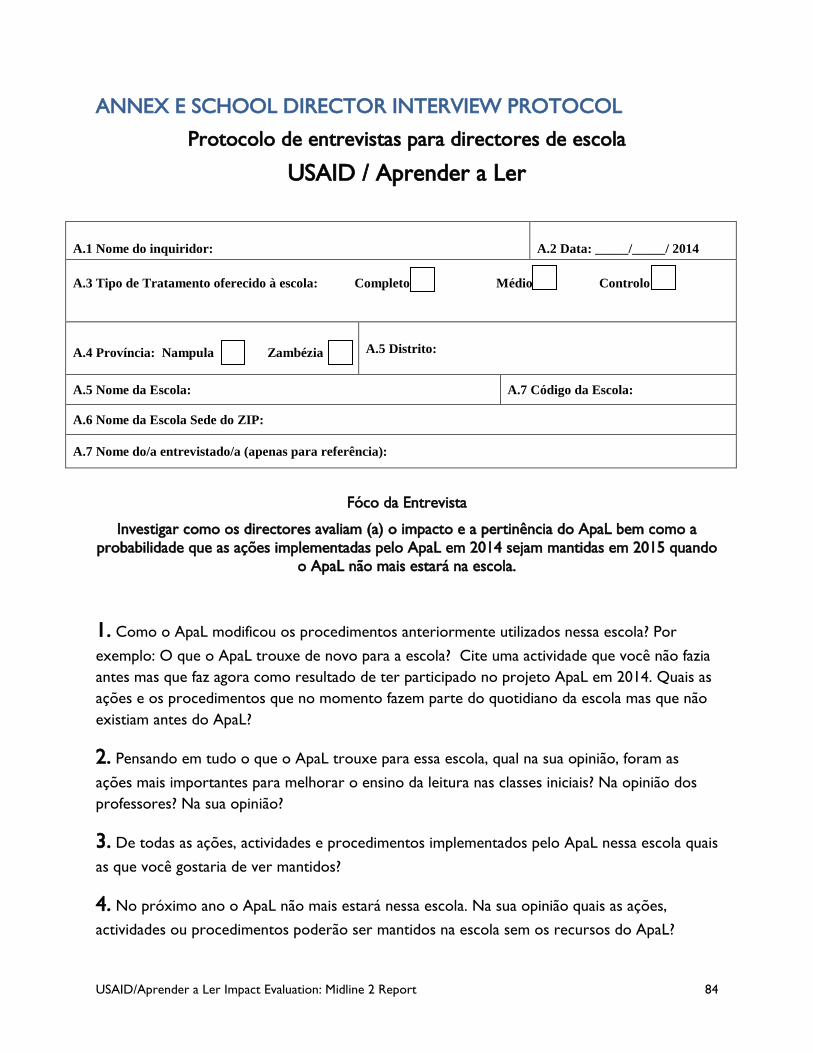
USAID/Aprender a Ler Impact Evaluation: Midline 2 Report 84
ANNEX E SCHOOL DIRECTOR INTERVIEW PROTOCOL
Protocolo de entrevistas para directores de escola
USAID / Aprender a Ler
A.1 Nome do inquiridor:
A.2 Data: _____/_____/ 2014
A.3 Tipo de Tratamento oferecido à escola: Completo Médio Controlo
A.4 Província: Nampula Zambézia A.5 Distrito:
A.5 Nome da Escola: A.7 Código da Escola:
A.6 Nome da Escola Sede do ZIP:
A.7 Nome do/a entrevistado/a (apenas para referência):
Fóco da Entrevista
Investigar como os directores avaliam (a) o impacto e a pertinência do ApaL bem como a probabilidade que as ações implementadas pelo ApaL em 2014 sejam mantidas em 2015 quando
o ApaL não mais estará na escola.
1. Como o ApaL modificou os procedimentos anteriormente utilizados nessa escola? Por exemplo: O que o ApaL trouxe de novo para a escola? Cite uma actividade que você não fazia antes mas que faz agora como resultado de ter participado no projeto ApaL em 2014. Quais as ações e os procedimentos que no momento fazem parte do quotidiano da escola mas que não existiam antes do ApaL?
2. Pensando em tudo o que o ApaL trouxe para essa escola, qual na sua opinião, foram as ações mais importantes para melhorar o ensino da leitura nas classes iniciais? Na opinião dos professores? Na sua opinião?
3. De todas as ações, actividades e procedimentos implementados pelo ApaL nessa escola quais as que você gostaria de ver mantidos?
4. No próximo ano o ApaL não mais estará nessa escola. Na sua opinião quais as ações, actividades ou procedimentos poderão ser mantidos na escola sem os recursos do ApaL?
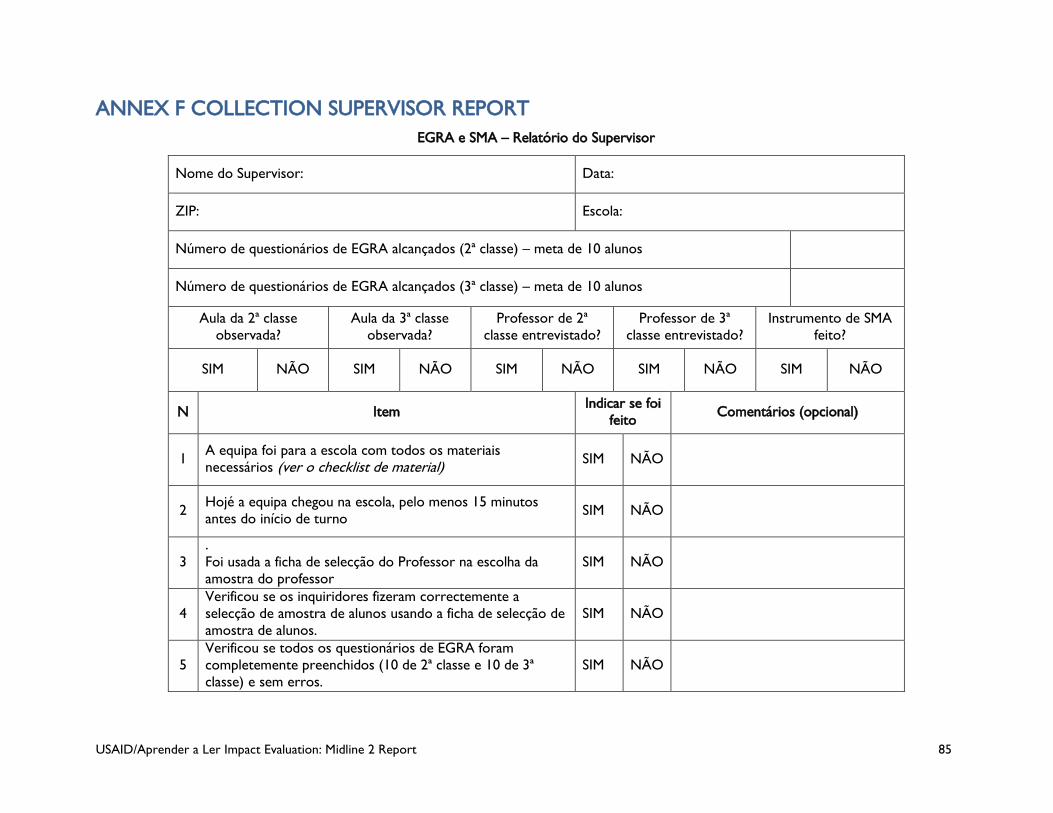
USAID/Aprender a Ler Impact Evaluation: Midline 2 Report 85
ANNEX F COLLECTION SUPERVISOR REPORT EGRA e SMA – Relatório do Supervisor
Nome do Supervisor: Data:
ZIP: Escola:
Número de questionários de EGRA alcançados (2ª classe) – meta de 10 alunos
Número de questionários de EGRA alcançados (3ª classe) – meta de 10 alunos
Aula da 2ª classe observada?
Aula da 3ª classe observada?
Professor de 2ª classe entrevistado?
Professor de 3ª classe entrevistado?
Instrumento de SMA feito?
SIM NÃO SIM NÃO SIM NÃO SIM NÃO SIM NÃO
N Item Indicar se foi feito Comentários (opcional)
1 A equipa foi para a escola com todos os materiais necessários (ver o checklist de material) SIM NÃO
2 Hojé a equipa chegou na escola, pelo menos 15 minutos antes do início de turno SIM NÃO
3 . Foi usada a ficha de selecção do Professor na escolha da amostra do professor
SIM NÃO
4 Verificou se os inquiridores fizeram correctemente a selecção de amostra de alunos usando a ficha de selecção de amostra de alunos.
SIM NÃO
5 Verificou se todos os questionários de EGRA foram completemente preenchidos (10 de 2ª classe e 10 de 3ª classe) e sem erros.
SIM NÃO
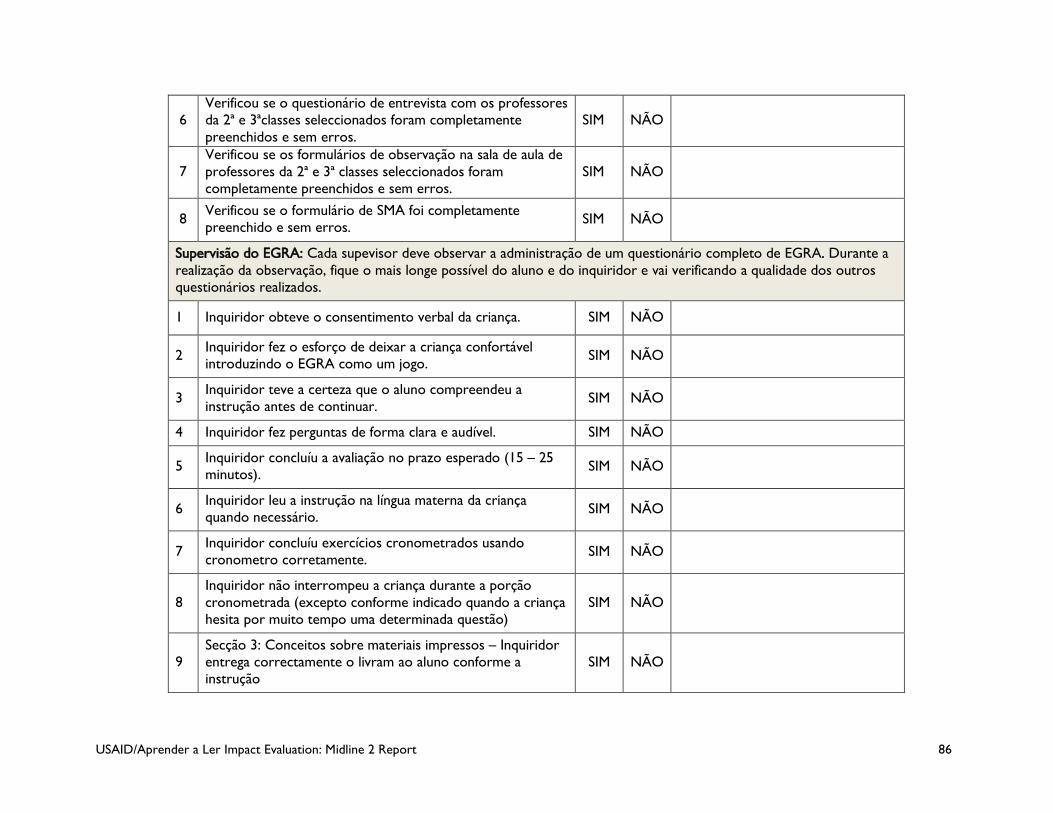
USAID/Aprender a Ler Impact Evaluation: Midline 2 Report 86
6 Verificou se o questionário de entrevista com os professores da 2ª e 3ªclasses seleccionados foram completamente preenchidos e sem erros.
SIM NÃO
7 Verificou se os formulários de observação na sala de aula de professores da 2ª e 3ª classes seleccionados foram completamente preenchidos e sem erros.
SIM NÃO
8 Verificou se o formulário de SMA foi completamente preenchido e sem erros. SIM NÃO
Supervisão do EGRA: Cada supevisor deve observar a administração de um questionário completo de EGRA. Durante a realização da observação, fique o mais longe possível do aluno e do inquiridor e vai verificando a qualidade dos outros questionários realizados.
1 Inquiridor obteve o consentimento verbal da criança. SIM NÃO
2 Inquiridor fez o esforço de deixar a criança confortável introduzindo o EGRA como um jogo. SIM NÃO
3 Inquiridor teve a certeza que o aluno compreendeu a instrução antes de continuar. SIM NÃO
4 Inquiridor fez perguntas de forma clara e audível. SIM NÃO
5 Inquiridor concluíu a avaliação no prazo esperado (15 – 25 minutos). SIM NÃO
6 Inquiridor leu a instrução na língua materna da criança quando necessário. SIM NÃO
7 Inquiridor concluíu exercícios cronometrados usando cronometro corretamente. SIM NÃO
8 Inquiridor não interrompeu a criança durante a porção cronometrada (excepto conforme indicado quando a criança hesita por muito tempo uma determinada questão)
SIM NÃO
9 Secção 3: Conceitos sobre materiais impressos – Inquiridor entrega correctamente o livram ao aluno conforme a instrução
SIM NÃO
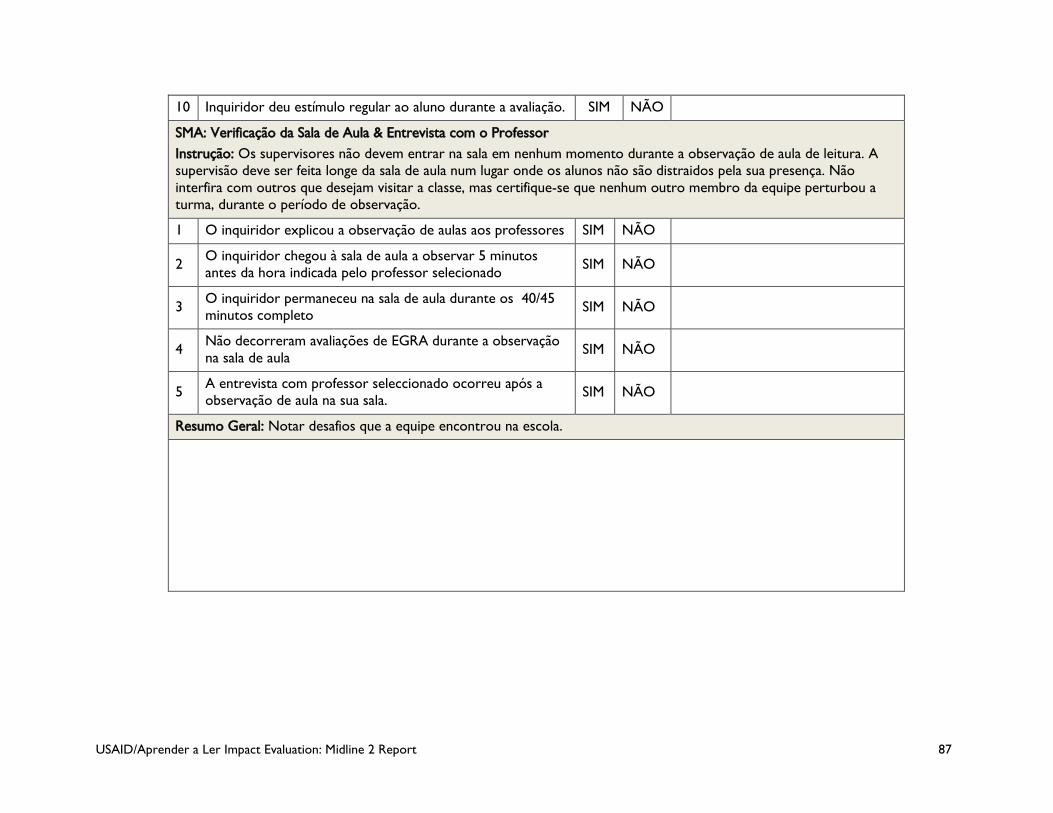
USAID/Aprender a Ler Impact Evaluation: Midline 2 Report 87
10 Inquiridor deu estímulo regular ao aluno durante a avaliação. SIM NÃO
SMA: Verificação da Sala de Aula & Entrevista com o Professor Instrução: Os supervisores não devem entrar na sala em nenhum momento durante a observação de aula de leitura. A supervisão deve ser feita longe da sala de aula num lugar onde os alunos não são distraidos pela sua presença. Não interfira com outros que desejam visitar a classe, mas certifique-se que nenhum outro membro da equipe perturbou a turma, durante o período de observação.
1 O inquiridor explicou a observação de aulas aos professores SIM NÃO
2 O inquiridor chegou à sala de aula a observar 5 minutos antes da hora indicada pelo professor selecionado SIM NÃO
3 O inquiridor permaneceu na sala de aula durante os 40/45 minutos completo SIM NÃO
4 Não decorreram avaliações de EGRA durante a observação na sala de aula SIM NÃO
5 A entrevista com professor seleccionado ocorreu após a observação de aula na sua sala. SIM NÃO
Resumo Geral: Notar desafios que a equipe encontrou na escola.
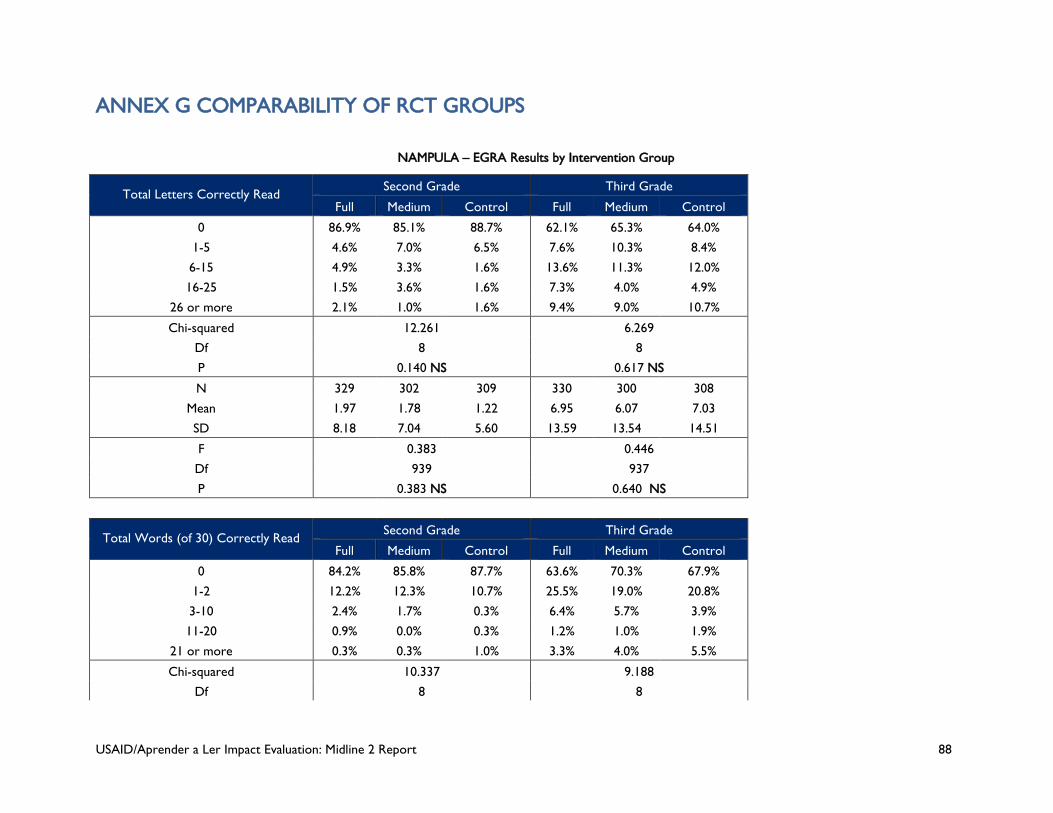
USAID/Aprender a Ler Impact Evaluation: Midline 2 Report 88
ANNEX G COMPARABILITY OF RCT GROUPS
NAMPULA – EGRA Results by Intervention Group
Total Letters Correctly Read Second Grade Third Grade
Full Medium Control Full Medium Control
0 86.9% 85.1% 88.7% 62.1% 65.3% 64.0%
1-5 4.6% 7.0% 6.5% 7.6% 10.3% 8.4%
6-15 4.9% 3.3% 1.6% 13.6% 11.3% 12.0%
16-25 1.5% 3.6% 1.6% 7.3% 4.0% 4.9%
26 or more 2.1% 1.0% 1.6% 9.4% 9.0% 10.7%
Chi-squared 12.261 6.269
Df 8 8
P 0.140 NS 0.617 NS
N 329 302 309 330 300 308
Mean 1.97 1.78 1.22 6.95 6.07 7.03
SD 8.18 7.04 5.60 13.59 13.54 14.51
F 0.383 0.446
Df 939 937
P 0.383 NS 0.640 NS
Total Words (of 30) Correctly Read
Second Grade Third Grade
Full Medium Control Full Medium Control
0 84.2% 85.8% 87.7% 63.6% 70.3% 67.9%
1-2 12.2% 12.3% 10.7% 25.5% 19.0% 20.8%
3-10 2.4% 1.7% 0.3% 6.4% 5.7% 3.9%
11-20 0.9% 0.0% 0.3% 1.2% 1.0% 1.9%
21 or more 0.3% 0.3% 1.0% 3.3% 4.0% 5.5%
Chi-squared 10.337 9.188
Df 8 8
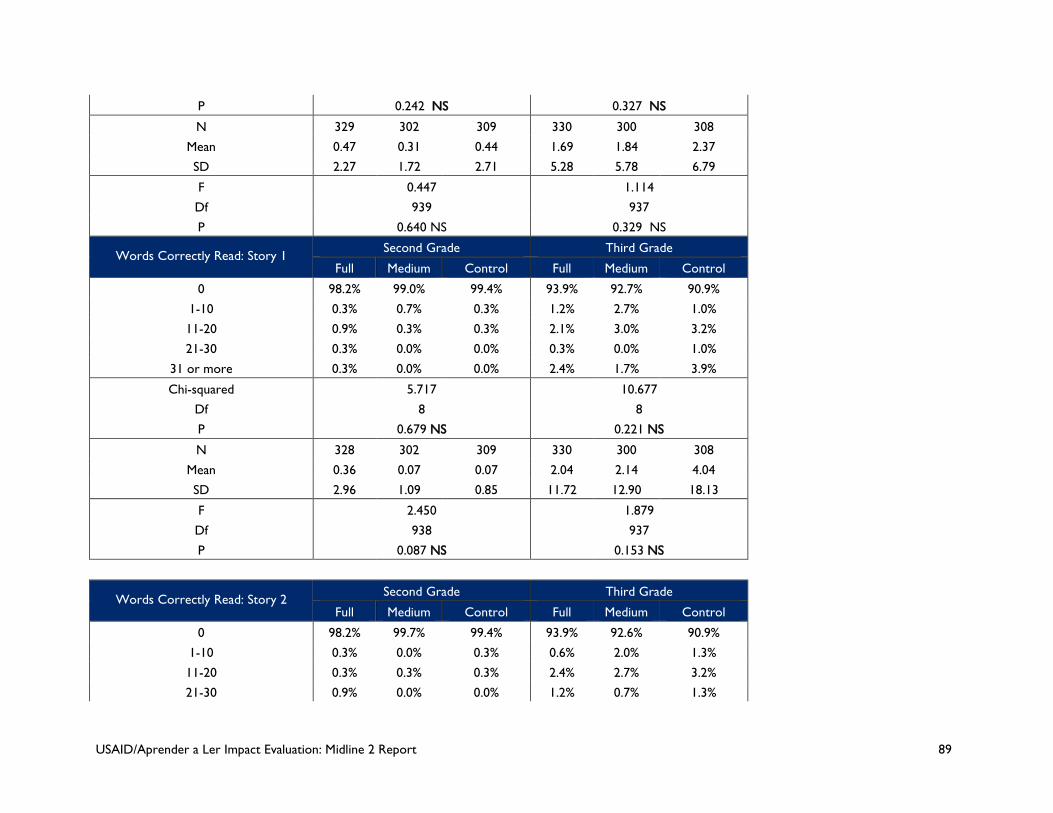
USAID/Aprender a Ler Impact Evaluation: Midline 2 Report 89
P 0.242 NS 0.327 NS
N 329 302 309 330 300 308
Mean 0.47 0.31 0.44 1.69 1.84 2.37
SD 2.27 1.72 2.71 5.28 5.78 6.79
F 0.447 1.114
Df 939 937
P 0.640 NS 0.329 NS
Words Correctly Read: Story 1 Second Grade Third Grade
Full Medium Control Full Medium Control
0 98.2% 99.0% 99.4% 93.9% 92.7% 90.9%
1-10 0.3% 0.7% 0.3% 1.2% 2.7% 1.0%
11-20 0.9% 0.3% 0.3% 2.1% 3.0% 3.2%
21-30 0.3% 0.0% 0.0% 0.3% 0.0% 1.0%
31 or more 0.3% 0.0% 0.0% 2.4% 1.7% 3.9%
Chi-squared 5.717 10.677
Df 8 8
P 0.679 NS 0.221 NS
N 328 302 309 330 300 308
Mean 0.36 0.07 0.07 2.04 2.14 4.04
SD 2.96 1.09 0.85 11.72 12.90 18.13
F 2.450 1.879
Df 938 937
P 0.087 NS 0.153 NS
Words Correctly Read: Story 2
Second Grade Third Grade
Full Medium Control Full Medium Control
0 98.2% 99.7% 99.4% 93.9% 92.6% 90.9%
1-10 0.3% 0.0% 0.3% 0.6% 2.0% 1.3%
11-20 0.3% 0.3% 0.3% 2.4% 2.7% 3.2%
21-30 0.9% 0.0% 0.0% 1.2% 0.7% 1.3%
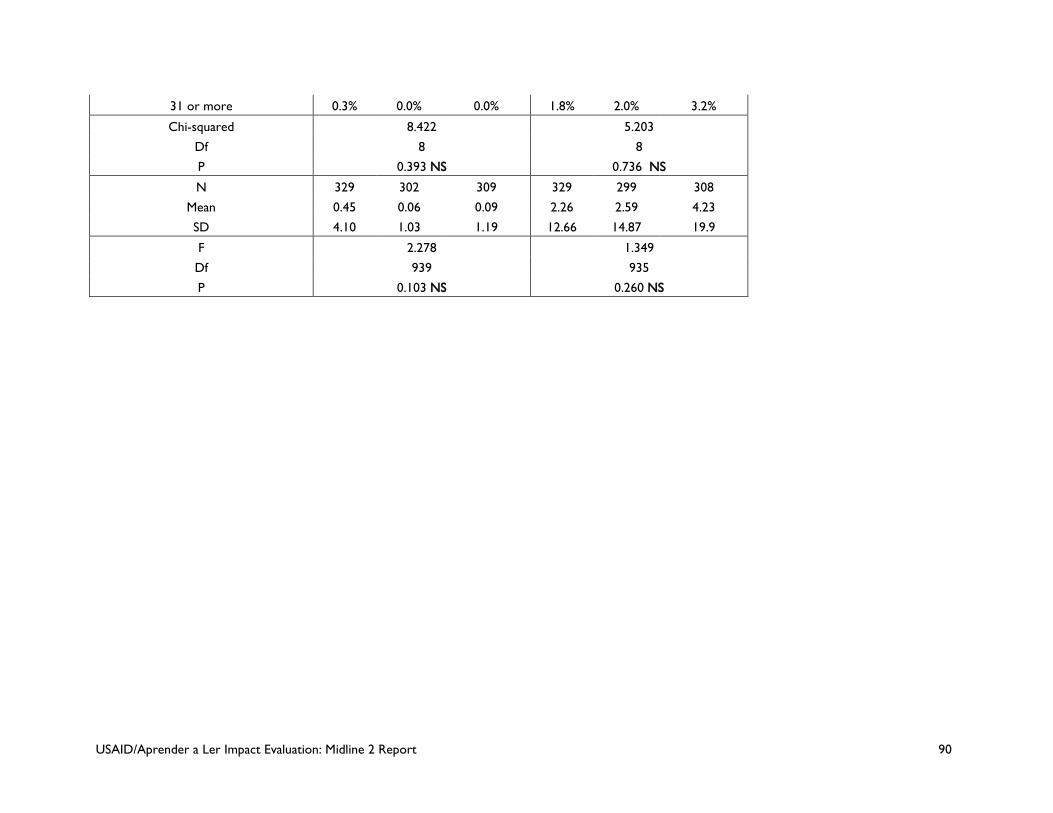
USAID/Aprender a Ler Impact Evaluation: Midline 2 Report 90
31 or more 0.3% 0.0% 0.0% 1.8% 2.0% 3.2%
Chi-squared 8.422 5.203
Df 8 8
P 0.393 NS 0.736 NS
N 329 302 309 329 299 308
Mean 0.45 0.06 0.09 2.26 2.59 4.23
SD 4.10 1.03 1.19 12.66 14.87 19.9
F 2.278 1.349
Df 939 935
P 0.103 NS 0.260 NS
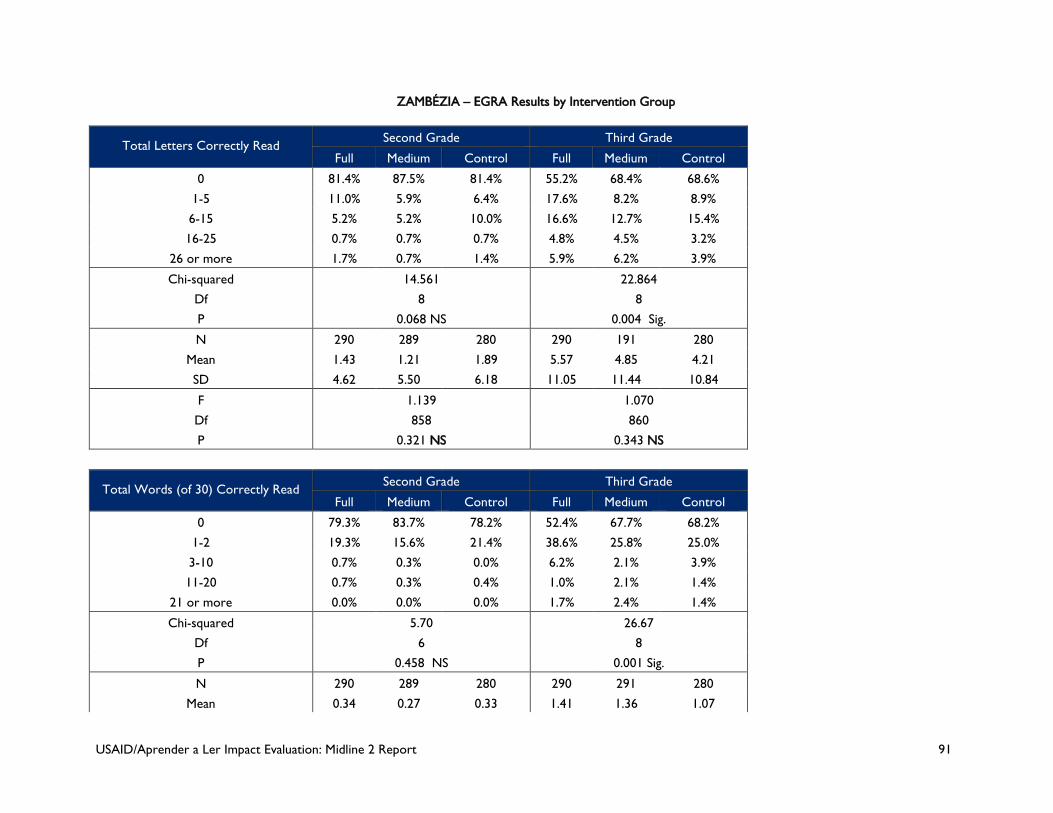
USAID/Aprender a Ler Impact Evaluation: Midline 2 Report 91
ZAMBÉZIA – EGRA Results by Intervention Group
Total Letters Correctly Read Second Grade Third Grade
Full Medium Control Full Medium Control
0 81.4% 87.5% 81.4% 55.2% 68.4% 68.6%
1-5 11.0% 5.9% 6.4% 17.6% 8.2% 8.9%
6-15 5.2% 5.2% 10.0% 16.6% 12.7% 15.4%
16-25 0.7% 0.7% 0.7% 4.8% 4.5% 3.2%
26 or more 1.7% 0.7% 1.4% 5.9% 6.2% 3.9%
Chi-squared 14.561 22.864
Df 8 8
P 0.068 NS 0.004 Sig.
N 290 289 280 290 191 280
Mean 1.43 1.21 1.89 5.57 4.85 4.21
SD 4.62 5.50 6.18 11.05 11.44 10.84
F 1.139 1.070
Df 858 860
P 0.321 NS 0.343 NS
Total Words (of 30) Correctly Read
Second Grade Third Grade
Full Medium Control Full Medium Control
0 79.3% 83.7% 78.2% 52.4% 67.7% 68.2%
1-2 19.3% 15.6% 21.4% 38.6% 25.8% 25.0%
3-10 0.7% 0.3% 0.0% 6.2% 2.1% 3.9%
11-20 0.7% 0.3% 0.4% 1.0% 2.1% 1.4%
21 or more 0.0% 0.0% 0.0% 1.7% 2.4% 1.4%
Chi-squared 5.70 26.67
Df 6 8
P 0.458 NS 0.001 Sig.
N 290 289 280 290 291 280
Mean 0.34 0.27 0.33 1.41 1.36 1.07
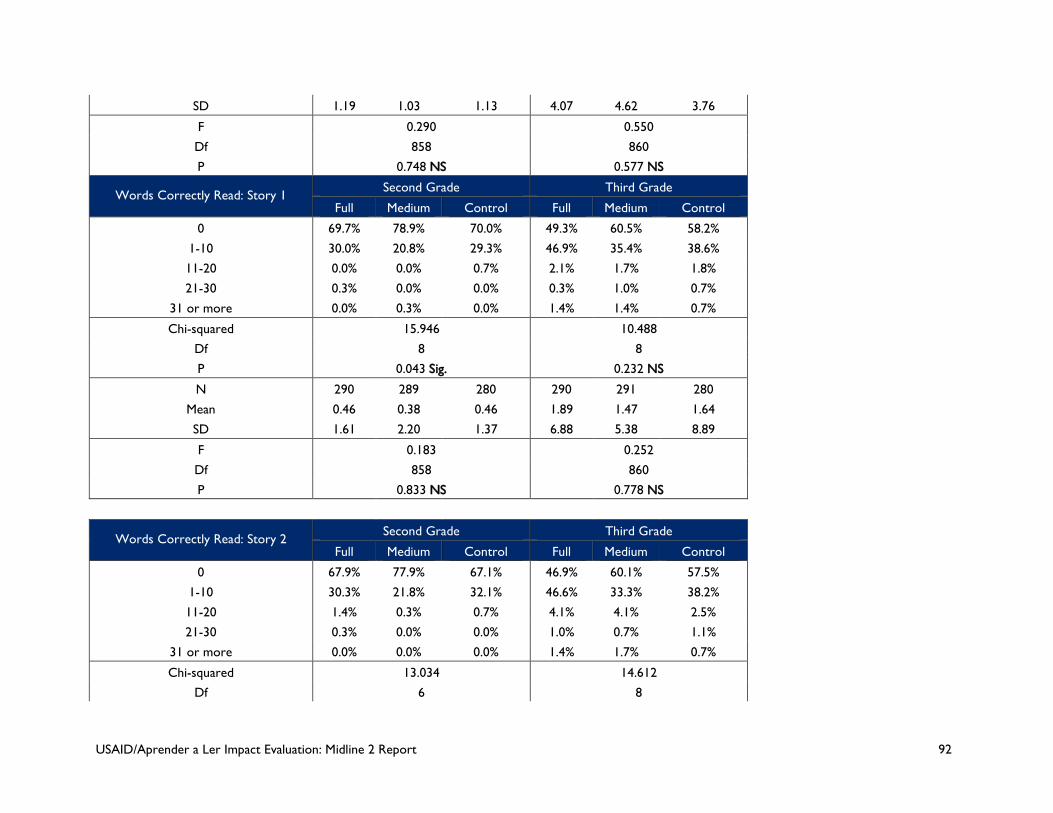
USAID/Aprender a Ler Impact Evaluation: Midline 2 Report 92
SD 1.19 1.03 1.13 4.07 4.62 3.76
F 0.290 0.550
Df 858 860
P 0.748 NS 0.577 NS
Words Correctly Read: Story 1 Second Grade Third Grade
Full Medium Control Full Medium Control
0 69.7% 78.9% 70.0% 49.3% 60.5% 58.2%
1-10 30.0% 20.8% 29.3% 46.9% 35.4% 38.6%
11-20 0.0% 0.0% 0.7% 2.1% 1.7% 1.8%
21-30 0.3% 0.0% 0.0% 0.3% 1.0% 0.7%
31 or more 0.0% 0.3% 0.0% 1.4% 1.4% 0.7%
Chi-squared 15.946 10.488
Df 8 8
P 0.043 Sig. 0.232 NS
N 290 289 280 290 291 280
Mean 0.46 0.38 0.46 1.89 1.47 1.64
SD 1.61 2.20 1.37 6.88 5.38 8.89
F 0.183 0.252
Df 858 860
P 0.833 NS 0.778 NS
Words Correctly Read: Story 2
Second Grade Third Grade
Full Medium Control Full Medium Control
0 67.9% 77.9% 67.1% 46.9% 60.1% 57.5%
1-10 30.3% 21.8% 32.1% 46.6% 33.3% 38.2%
11-20 1.4% 0.3% 0.7% 4.1% 4.1% 2.5%
21-30 0.3% 0.0% 0.0% 1.0% 0.7% 1.1%
31 or more 0.0% 0.0% 0.0% 1.4% 1.7% 0.7%
Chi-squared 13.034 14.612
Df 6 8
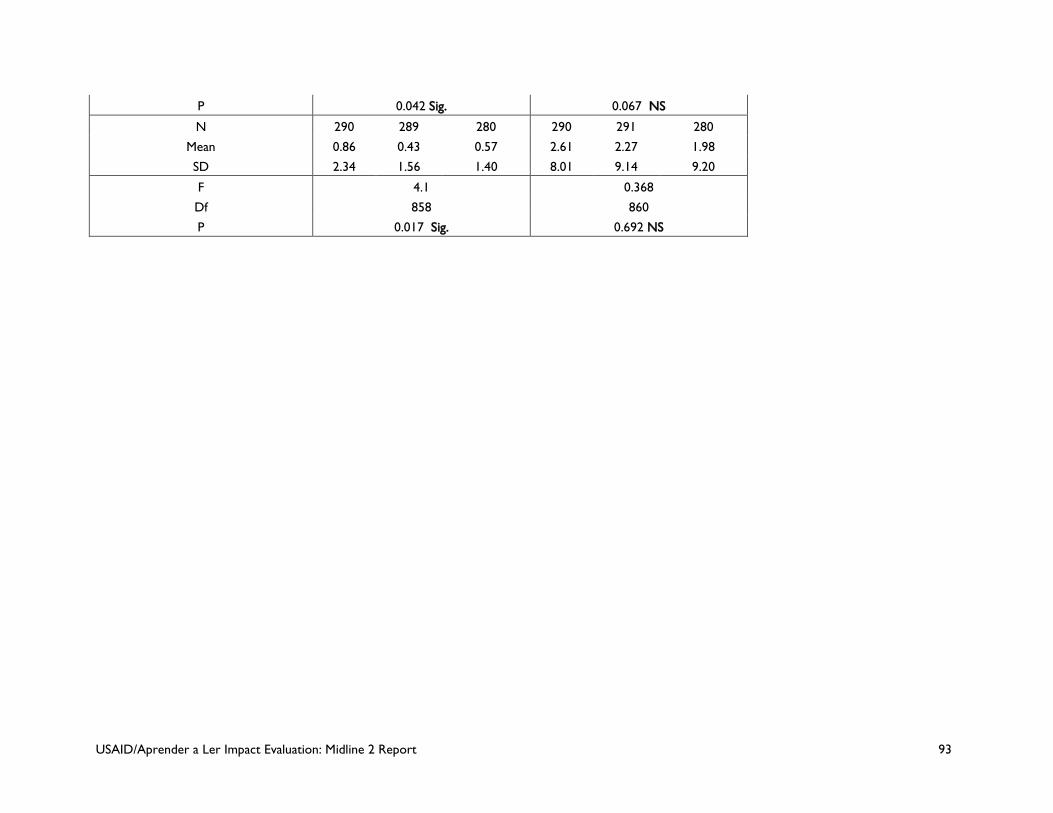
USAID/Aprender a Ler Impact Evaluation: Midline 2 Report 93
P 0.042 Sig. 0.067 NS
N 290 289 280 290 291 280
Mean 0.86 0.43 0.57 2.61 2.27 1.98
SD 2.34 1.56 1.40 8.01 9.14 9.20
F 4.1 0.368
Df 858 860
P 0.017 Sig. 0.692 NS
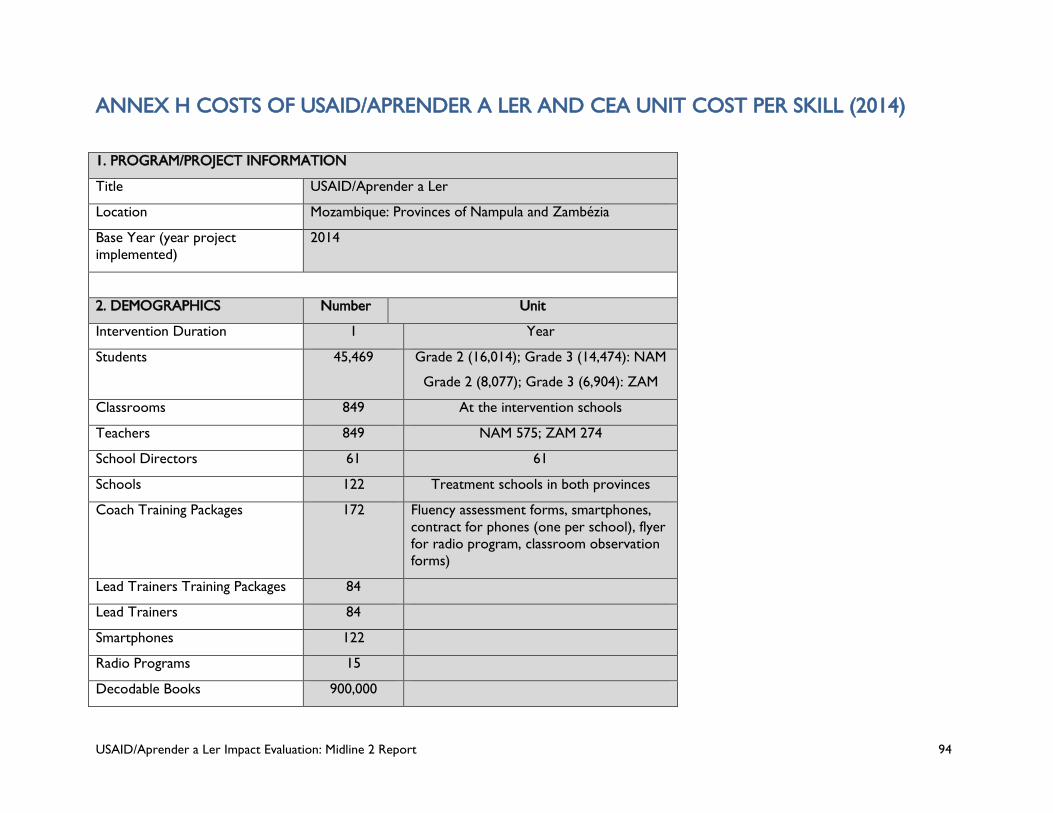
USAID/Aprender a Ler Impact Evaluation: Midline 2 Report 94
ANNEX H COSTS OF USAID/APRENDER A LER AND CEA UNIT COST PER SKILL (2014)
1. PROGRAM/PROJECT INFORMATION
Title USAID/Aprender a Ler
Location Mozambique: Provinces of Nampula and Zambézia
Base Year (year project implemented)
2014
2. DEMOGRAPHICS Number Unit
Intervention Duration 1 Year
Students 45,469 Grade 2 (16,014); Grade 3 (14,474): NAM
Grade 2 (8,077); Grade 3 (6,904): ZAM
Classrooms 849 At the intervention schools
Teachers 849 NAM 575; ZAM 274
School Directors 61 61
Schools 122 Treatment schools in both provinces
Coach Training Packages 172 Fluency assessment forms, smartphones, contract for phones (one per school), flyer for radio program, classroom observation forms)
Lead Trainers Training Packages 84
Lead Trainers 84
Smartphones 122
Radio Programs 15
Decodable Books 900,000
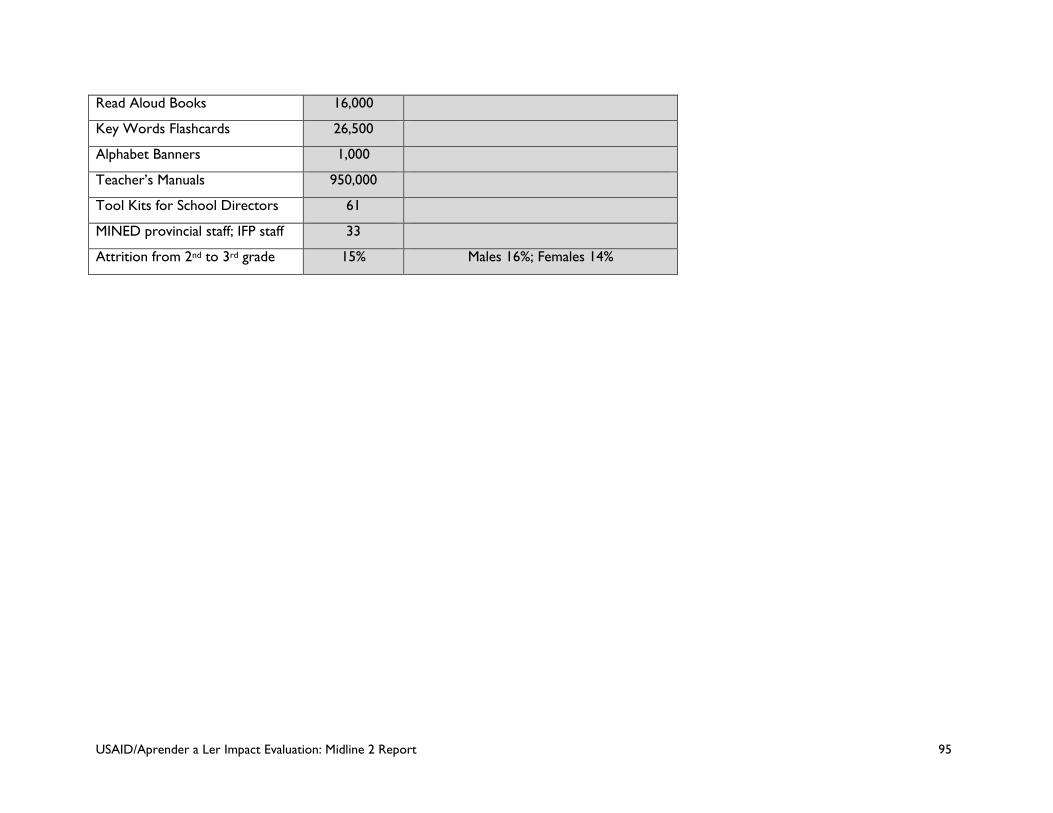
USAID/Aprender a Ler Impact Evaluation: Midline 2 Report 95
Read Aloud Books 16,000
Key Words Flashcards 26,500
Alphabet Banners 1,000
Teacher’s Manuals 950,000
Tool Kits for School Directors 61
MINED provincial staff; IFP staff 33
Attrition from 2nd to 3rd grade 15% Males 16%; Females 14%
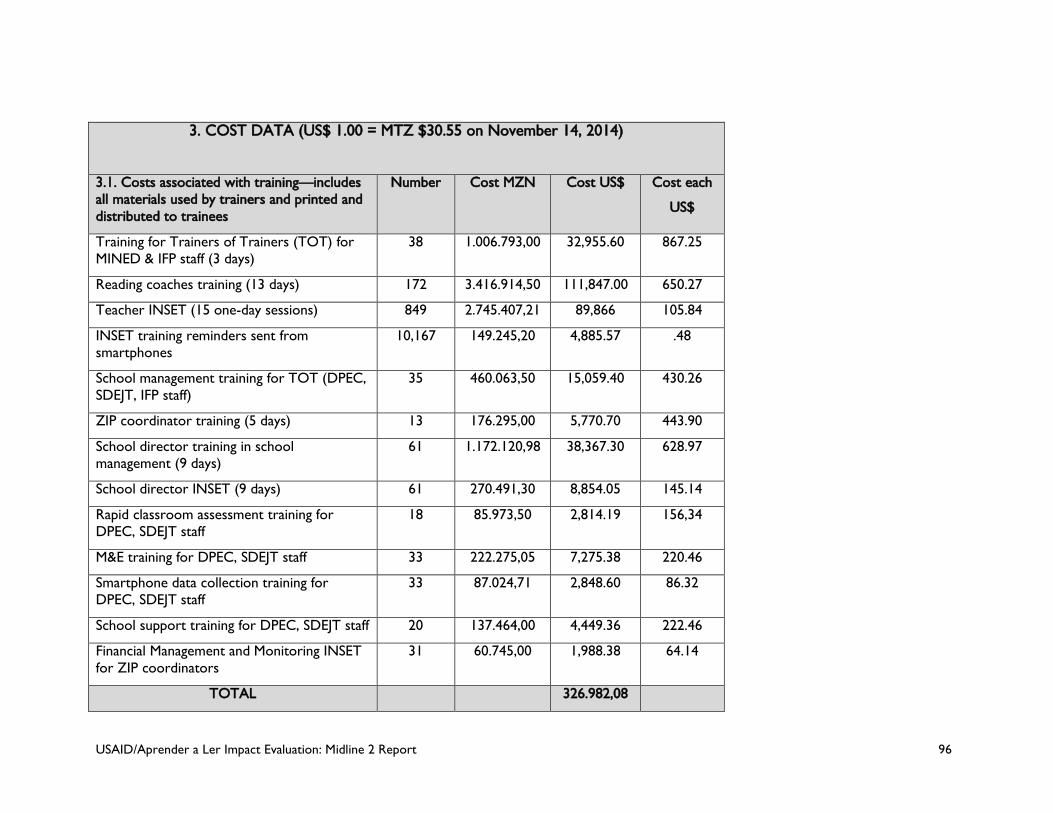
USAID/Aprender a Ler Impact Evaluation: Midline 2 Report 96
3. COST DATA (US$ 1.00 = MTZ $30.55 on November 14, 2014)
3.1. Costs associated with training—includes all materials used by trainers and printed and distributed to trainees
Number Cost MZN Cost US$ Cost each
US$
Training for Trainers of Trainers (TOT) for MINED & IFP staff (3 days)
38 1.006.793,00 32,955.60 867.25
Reading coaches training (13 days) 172 3.416.914,50 111,847.00 650.27
Teacher INSET (15 one-day sessions) 849 2.745.407,21 89,866 105.84
INSET training reminders sent from smartphones
10,167 149.245,20 4,885.57 .48
School management training for TOT (DPEC, SDEJT, IFP staff)
35 460.063,50 15,059.40 430.26
ZIP coordinator training (5 days) 13 176.295,00 5,770.70 443.90
School director training in school management (9 days)
61 1.172.120,98 38,367.30 628.97
School director INSET (9 days) 61 270.491,30 8,854.05 145.14
Rapid classroom assessment training for DPEC, SDEJT staff
18 85.973,50 2,814.19 156,34
M&E training for DPEC, SDEJT staff 33 222.275,05 7,275.38 220.46
Smartphone data collection training for DPEC, SDEJT staff
33 87.024,71 2,848.60 86.32
School support training for DPEC, SDEJT staff 20 137.464,00 4,449.36 222.46
Financial Management and Monitoring INSET for ZIP coordinators
31 60.745,00 1,988.38 64.14
TOTAL 326.982,08
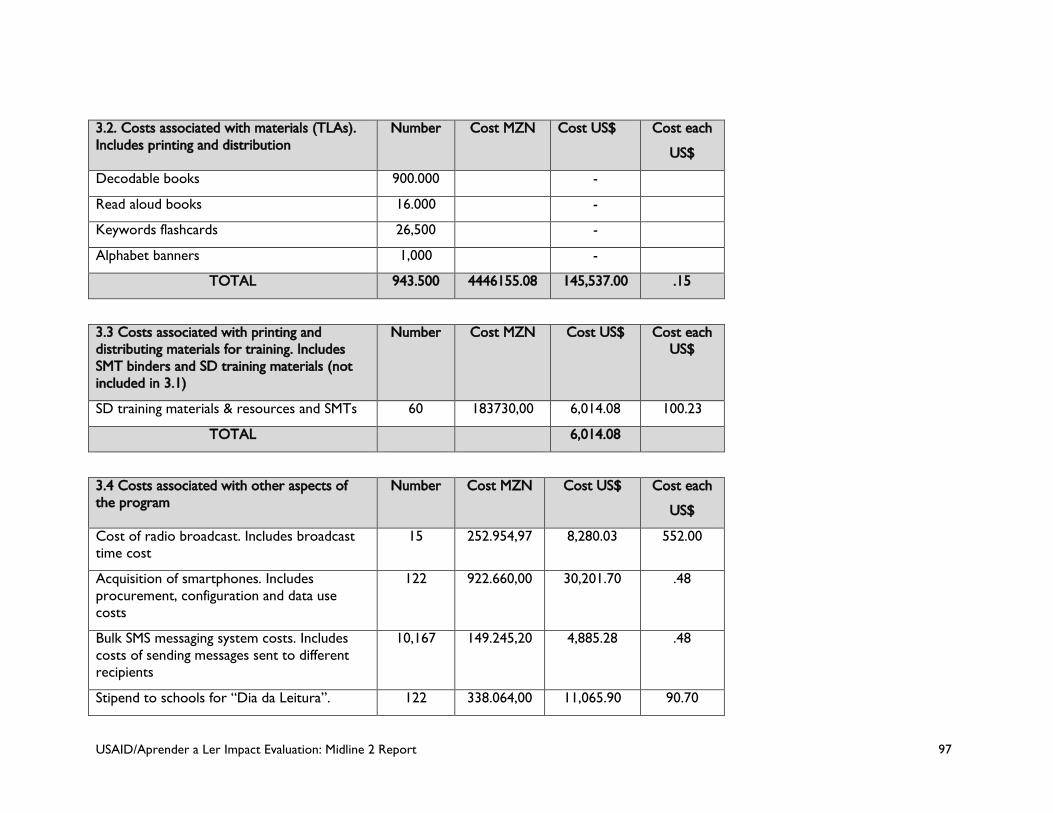
USAID/Aprender a Ler Impact Evaluation: Midline 2 Report 97
3.2. Costs associated with materials (TLAs). Includes printing and distribution
Number Cost MZN Cost US$ Cost each
US$
Decodable books 900.000 -
Read aloud books 16.000 -
Keywords flashcards 26,500 -
Alphabet banners 1,000 -
TOTAL 943.500 4446155.08 145,537.00 .15
3.3 Costs associated with printing and distributing materials for training. Includes SMT binders and SD training materials (not included in 3.1)
Number Cost MZN Cost US$ Cost each US$
SD training materials & resources and SMTs 60 183730,00 6,014.08 100.23
TOTAL 6,014.08
3.4 Costs associated with other aspects of the program
Number Cost MZN Cost US$ Cost each
US$
Cost of radio broadcast. Includes broadcast time cost
15 252.954,97 8,280.03 552.00
Acquisition of smartphones. Includes procurement, configuration and data use costs
122 922.660,00 30,201.70 .48
Bulk SMS messaging system costs. Includes costs of sending messages sent to different recipients
10,167 149.245,20 4,885.28 .48
Stipend to schools for “Dia da Leitura”. 122 338.064,00 11,065.90 90.70
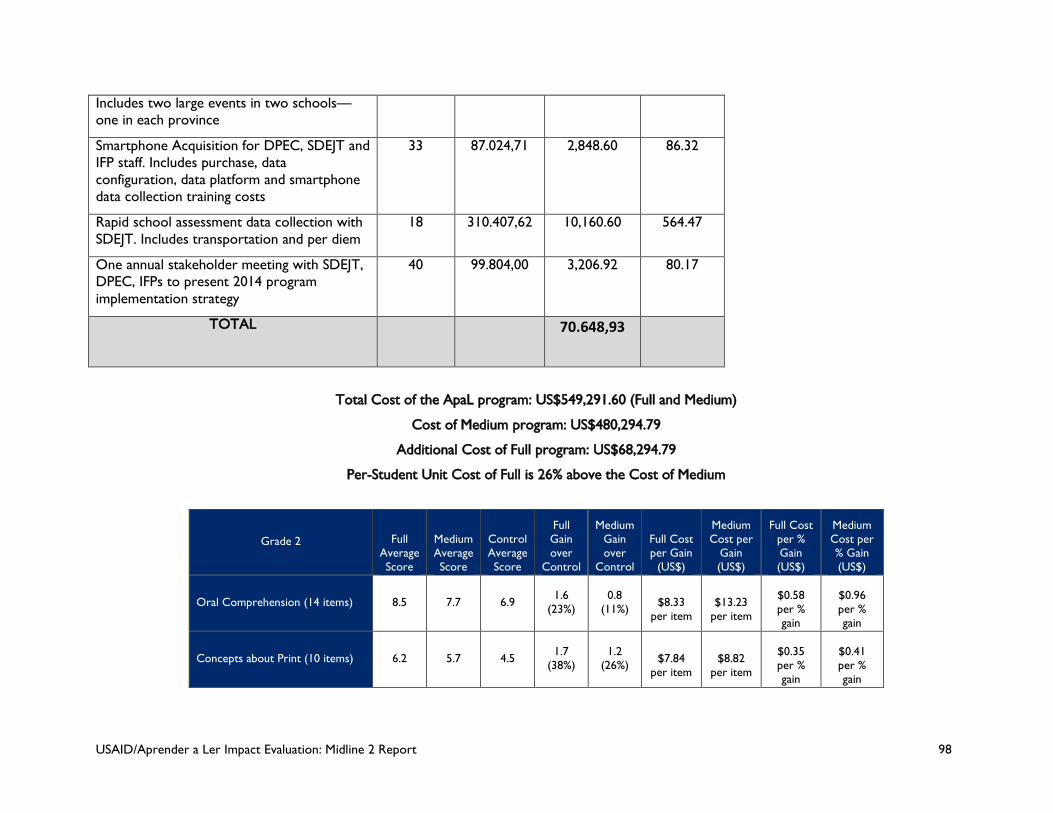
USAID/Aprender a Ler Impact Evaluation: Midline 2 Report 98
Includes two large events in two schools—one in each province
Smartphone Acquisition for DPEC, SDEJT and IFP staff. Includes purchase, data configuration, data platform and smartphone data collection training costs
33 87.024,71 2,848.60 86.32
Rapid school assessment data collection with SDEJT. Includes transportation and per diem
18 310.407,62 10,160.60 564.47
One annual stakeholder meeting with SDEJT, DPEC, IFPs to present 2014 program implementation strategy
40 99.804,00 3,206.92 80.17
TOTAL
70.648,93
Total Cost of the ApaL program: US$549,291.60 (Full and Medium)
Cost of Medium program: US$480,294.79
Additional Cost of Full program: US$68,294.79
Per-Student Unit Cost of Full is 26% above the Cost of Medium
Grade 2 Full Average Score
Medium Average Score
Control Average Score
Full Gain over
Control
Medium Gain over
Control
Full Cost per Gain
(US$)
Medium Cost per
Gain (US$)
Full Cost per % Gain (US$)
Medium Cost per % Gain (US$)
Oral Comprehension (14 items) 8.5 7.7 6.9 1.6 (23%)
0.8 (11%)
$8.33
per item
$13.23
per item
$0.58 per % gain
$0.96 per % gain
Concepts about Print (10 items) 6.2 5.7 4.5 1.7 (38%)
1.2 (26%)
$7.84
per item
$8.82
per item
$0.35 per % gain
$0.41 per % gain
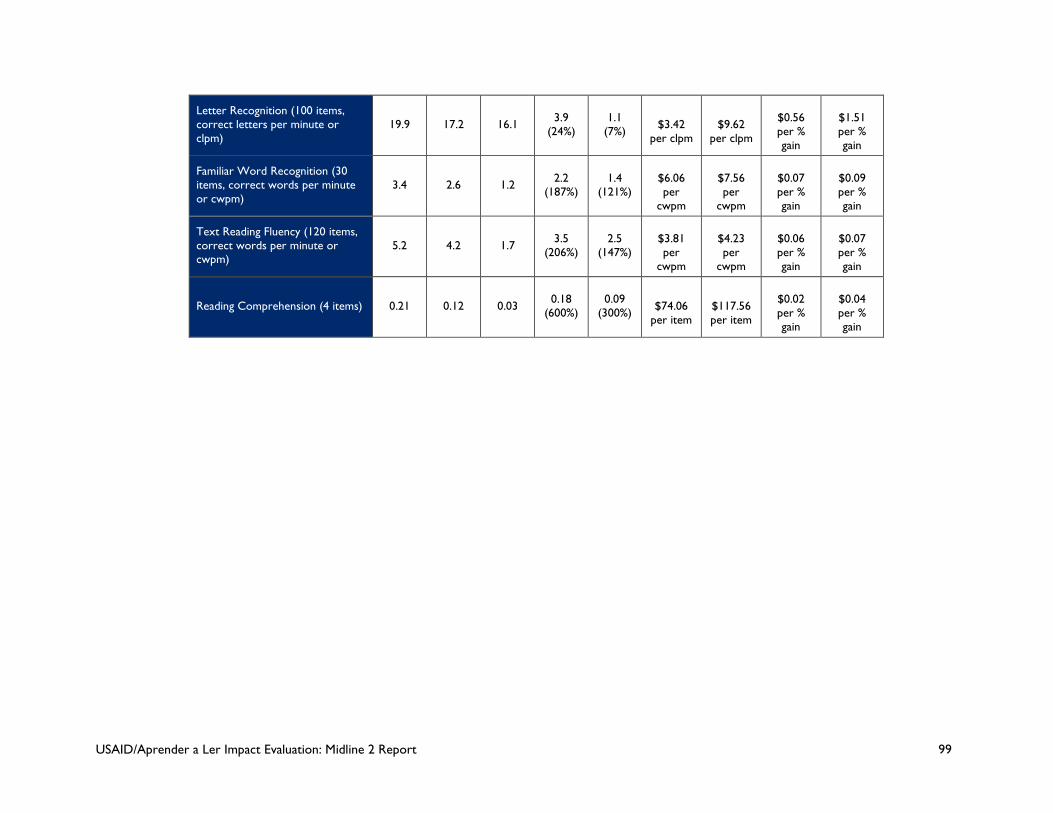
USAID/Aprender a Ler Impact Evaluation: Midline 2 Report 99
Letter Recognition (100 items, correct letters per minute or clpm)
19.9 17.2 16.1 3.9 (24%)
1.1 (7%)
$3.42
per clpm
$9.62
per clpm
$0.56 per % gain
$1.51 per % gain
Familiar Word Recognition (30 items, correct words per minute or cwpm)
3.4 2.6 1.2 2.2 (187%)
1.4 (121%)
$6.06 per
cwpm
$7.56 per
cwpm
$0.07 per % gain
$0.09 per % gain
Text Reading Fluency (120 items, correct words per minute or cwpm)
5.2 4.2 1.7 3.5 (206%)
2.5 (147%)
$3.81 per
cwpm
$4.23 per
cwpm
$0.06 per % gain
$0.07 per % gain
Reading Comprehension (4 items) 0.21 0.12 0.03 0.18 (600%)
0.09 (300%)
$74.06
per item
$117.56 per item
$0.02 per % gain
$0.04 per % gain
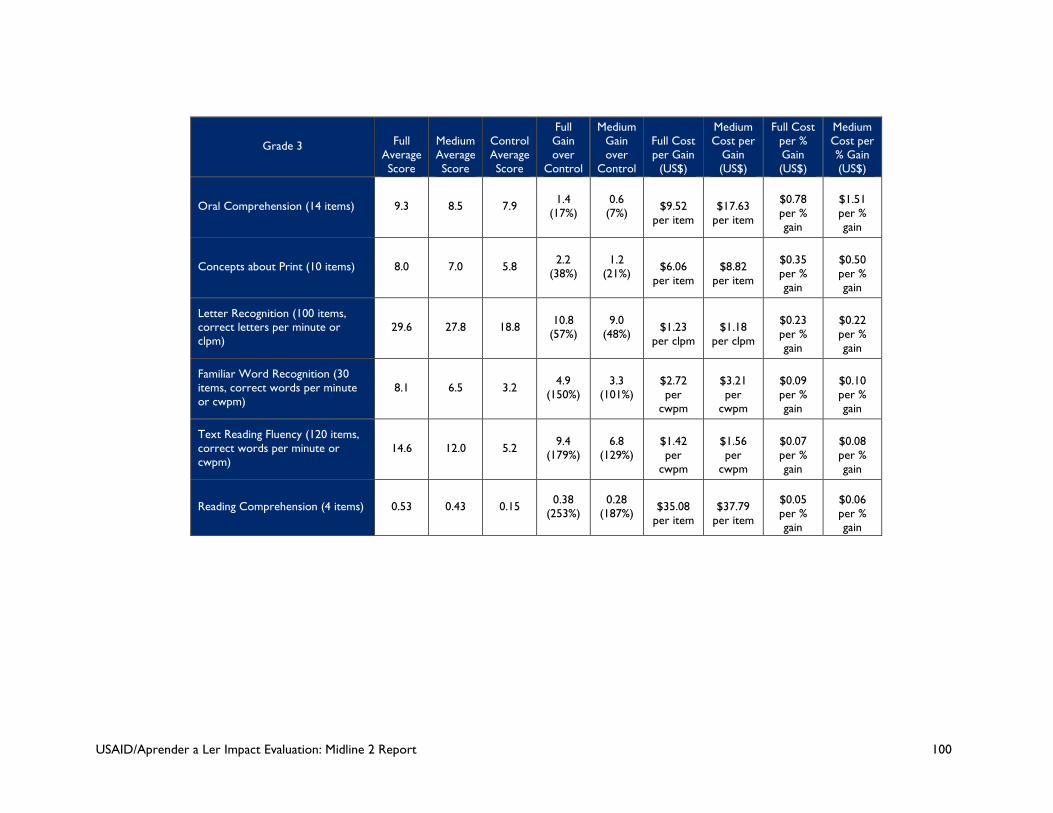
USAID/Aprender a Ler Impact Evaluation: Midline 2 Report 100
Grade 3 Full Average Score
Medium Average Score
Control Average Score
Full Gain over
Control
Medium Gain over
Control
Full Cost per Gain
(US$)
Medium Cost per
Gain (US$)
Full Cost per % Gain (US$)
Medium Cost per % Gain (US$)
Oral Comprehension (14 items) 9.3 8.5 7.9 1.4 (17%)
0.6 (7%)
$9.52
per item
$17.63
per item
$0.78 per % gain
$1.51 per % gain
Concepts about Print (10 items) 8.0 7.0 5.8 2.2 (38%)
1.2 (21%)
$6.06
per item
$8.82
per item
$0.35 per % gain
$0.50 per % gain
Letter Recognition (100 items, correct letters per minute or clpm)
29.6 27.8 18.8 10.8 (57%)
9.0 (48%)
$1.23
per clpm
$1.18
per clpm
$0.23 per % gain
$0.22 per % gain
Familiar Word Recognition (30 items, correct words per minute or cwpm)
8.1 6.5 3.2 4.9 (150%)
3.3 (101%)
$2.72 per
cwpm
$3.21 per
cwpm
$0.09 per % gain
$0.10 per % gain
Text Reading Fluency (120 items, correct words per minute or cwpm)
14.6 12.0 5.2 9.4 (179%)
6.8 (129%)
$1.42 per
cwpm
$1.56 per
cwpm
$0.07 per % gain
$0.08 per % gain
Reading Comprehension (4 items) 0.53 0.43 0.15 0.38 (253%)
0.28 (187%)
$35.08
per item
$37.79
per item
$0.05 per % gain
$0.06 per % gain
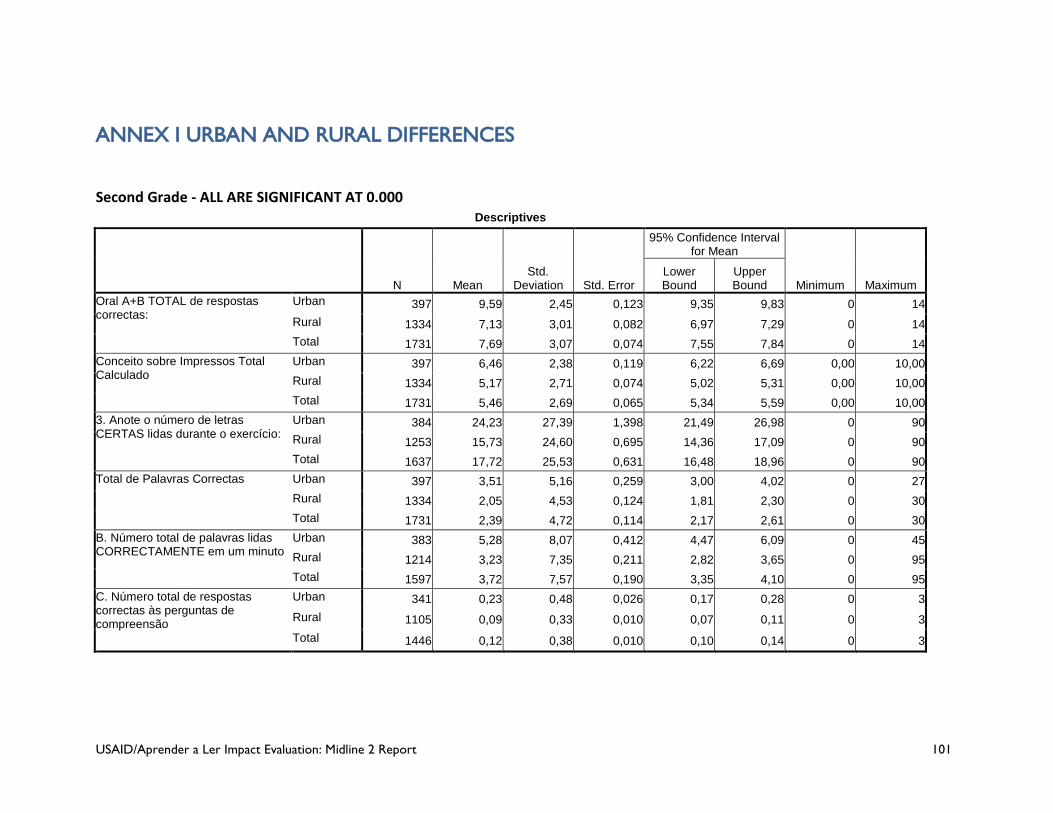
USAID/Aprender a Ler Impact Evaluation: Midline 2 Report 101
ANNEX I URBAN AND RURAL DIFFERENCES
Second Grade - ALL ARE SIGNIFICANT AT 0.000 Descriptives
N Mean Std.
Deviation Std. Error
95% Confidence Interval for Mean
Minimum Maximum Lower Bound
Upper Bound
Oral A+B TOTAL de respostas correctas:
Urban 397 9,59 2,45 0,123 9,35 9,83 0 14 Rural 1334 7,13 3,01 0,082 6,97 7,29 0 14 Total 1731 7,69 3,07 0,074 7,55 7,84 0 14
Conceito sobre Impressos Total Calculado
Urban 397 6,46 2,38 0,119 6,22 6,69 0,00 10,00 Rural 1334 5,17 2,71 0,074 5,02 5,31 0,00 10,00 Total 1731 5,46 2,69 0,065 5,34 5,59 0,00 10,00
3. Anote o número de letras CERTAS lidas durante o exercício:
Urban 384 24,23 27,39 1,398 21,49 26,98 0 90 Rural 1253 15,73 24,60 0,695 14,36 17,09 0 90 Total 1637 17,72 25,53 0,631 16,48 18,96 0 90
Total de Palavras Correctas Urban 397 3,51 5,16 0,259 3,00 4,02 0 27 Rural 1334 2,05 4,53 0,124 1,81 2,30 0 30 Total 1731 2,39 4,72 0,114 2,17 2,61 0 30
B. Número total de palavras lidas CORRECTAMENTE em um minuto
Urban 383 5,28 8,07 0,412 4,47 6,09 0 45 Rural 1214 3,23 7,35 0,211 2,82 3,65 0 95 Total 1597 3,72 7,57 0,190 3,35 4,10 0 95
C. Número total de respostas correctas às perguntas de compreensão
Urban 341 0,23 0,48 0,026 0,17 0,28 0 3 Rural 1105 0,09 0,33 0,010 0,07 0,11 0 3 Total 1446 0,12 0,38 0,010 0,10 0,14 0 3
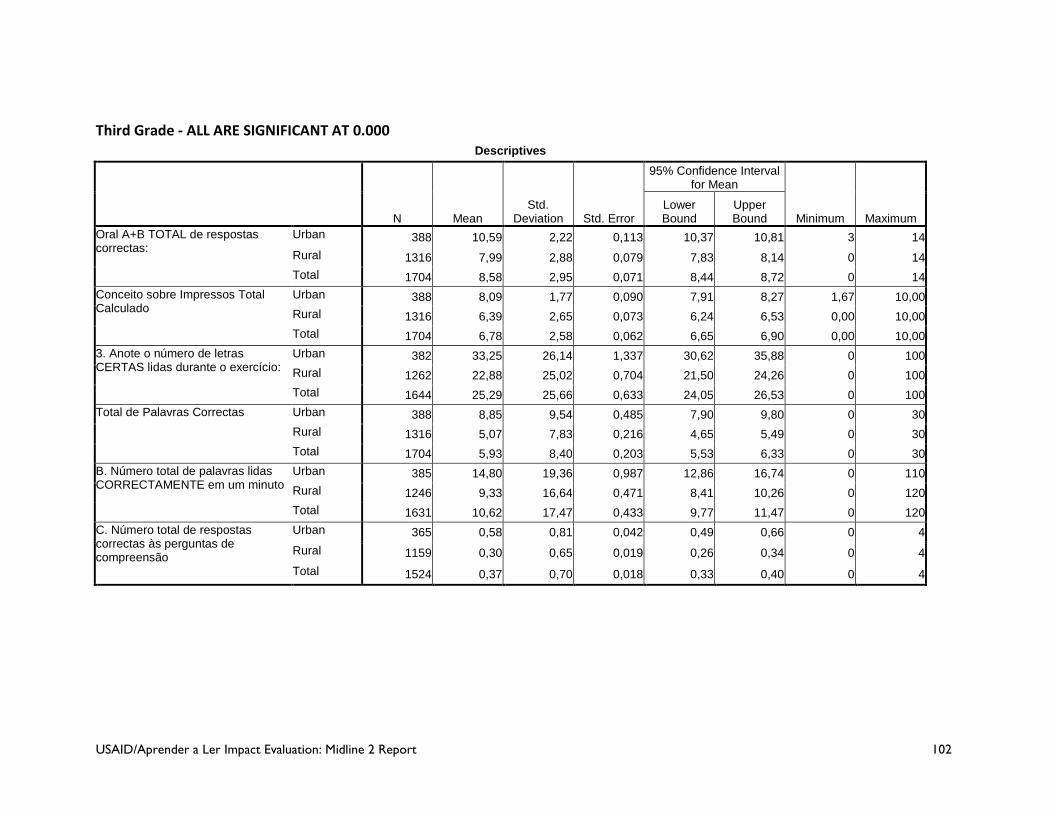
USAID/Aprender a Ler Impact Evaluation: Midline 2 Report 102
Third Grade - ALL ARE SIGNIFICANT AT 0.000 Descriptives
N Mean Std.
Deviation Std. Error
95% Confidence Interval for Mean
Minimum Maximum Lower Bound
Upper Bound
Oral A+B TOTAL de respostas correctas:
Urban 388 10,59 2,22 0,113 10,37 10,81 3 14 Rural 1316 7,99 2,88 0,079 7,83 8,14 0 14 Total 1704 8,58 2,95 0,071 8,44 8,72 0 14
Conceito sobre Impressos Total Calculado
Urban 388 8,09 1,77 0,090 7,91 8,27 1,67 10,00 Rural 1316 6,39 2,65 0,073 6,24 6,53 0,00 10,00 Total 1704 6,78 2,58 0,062 6,65 6,90 0,00 10,00
3. Anote o número de letras CERTAS lidas durante o exercício:
Urban 382 33,25 26,14 1,337 30,62 35,88 0 100 Rural 1262 22,88 25,02 0,704 21,50 24,26 0 100 Total 1644 25,29 25,66 0,633 24,05 26,53 0 100
Total de Palavras Correctas Urban 388 8,85 9,54 0,485 7,90 9,80 0 30 Rural 1316 5,07 7,83 0,216 4,65 5,49 0 30 Total 1704 5,93 8,40 0,203 5,53 6,33 0 30
B. Número total de palavras lidas CORRECTAMENTE em um minuto
Urban 385 14,80 19,36 0,987 12,86 16,74 0 110 Rural 1246 9,33 16,64 0,471 8,41 10,26 0 120 Total 1631 10,62 17,47 0,433 9,77 11,47 0 120
C. Número total de respostas correctas às perguntas de compreensão
Urban 365 0,58 0,81 0,042 0,49 0,66 0 4 Rural 1159 0,30 0,65 0,019 0,26 0,34 0 4 Total 1524 0,37 0,70 0,018 0,33 0,40 0 4
USAID/Aprender a Ler Impact Evaluation: Midline 2 Report 103
ANNEX J SELECTED REFERENCES Abadzi, H. (2013). “Literacy for All in a 100 days?” Global Partnership for Education. Series on
learning No. 7 (2009). “Instructional Time Loss in Developing Countries: Concepts, Measurement, and Implications.” World Bank Research Observer. 24 (2): 267-290
Aga Khan Foundation (2010) Cabo Delgado, Mozambique EQUIP2 Aggarwala, N.K. (2004). Evaluation Report: Quality assessment of primary and middle education
in mathematics and science. Retrieved from http://www.iea.nl/fileadmin/user_upload/Publications/Electronic_versions/Aggarwala_UNDP_Evaluation_Report.pdf. Accessed 2013 June 15.
Cellini, Stephanie Riegg and James Edwin Kee, “Cost-Effectiveness and Cost-Benefit Analysis,”
Chapter 25 of Handbook of Practical Program Evaluation, Third Edition, edited by Joseph S. Wholey, Harry P. Hatry, and Kathryn E. Newcomer. San Francisco: Jossey-Bass, 2010.
Collins, P. and Messaoud-Galusi, S. (2012). Student Performance on the Early Grade Reading
Assessment (EGRA) in Mozambique. EdData II report prepared by RTI International for USAID. Retrieved from http://www.eddataglobal.org/documents/index.cfm/4-
Dhaliwal, I. et al. (2011). Comparative Cost-Effectiveness Analysis to Inform Policy in Developing
Countries: A General Framework with Applications for Education. MIT Abdul Latif Jameel Poverty Action Lab (J-PAL), August 10, 2011
Drummond, M.F. et al. (2005). Methods for the economic evaluation of health care programmes.
3rd ed. Oxford: Oxford University Press. Fiedler et al. (2008). An activity-based cost analysis of the Honduras community-based,
integrated child care (AIN-C) programme. Health policy and planning, 23:408–427. Gavin, S. (March, 2011). Literacy boost: Mozambique baseline report. Retrieved from
http://resourcecentre.savethechildren.se/library/literacy-boost-Mozambiquebaseline-report. Accessed 2013 June 20.
Glewwe, Paul (2004) “An Investigation of the Determinants of School Progress and Academic
Achievement in Vietnam,” in P. Glewwe, D. Dollar and N Agrawal, eds., Economic Growth, Poverty, and Household Welfare in Vietnam. The World Bank. Washington, DC.
Glewwe, Paul, Michael Kremer, and Sylvie Moulin (2002) “Textbooks and Test Scores: Evidence
from a Randomized Evaluation in Kenya,” Development Research Group, World Bank, Washington, DC.
Global Education Digest 2012. Opportunities Lost: The impact of grade repetition and early
school leaving. UNESCO Institute of Statistics. Montreal, Canada, www.uis.unesco.org Gold et al. (1996). Cost-effectiveness in health and medicine. New York: Oxford University
Press.
USAID/Aprender a Ler Impact Evaluation: Midline 2 Report 104
Levin and McEwan (2001). Cost-effectiveness analysis: methods and applications. 2nd ed. Thousand Oaks, CA: Sage.
McEwan, Patrick J. (2012). Cost-effectiveness analysis of education and health interventions in
developing countries. Journal of Development Effectiveness 4:189 Michaelowa, K. (2001). Primary education quality in francophone Sub-Saharan Africa:
Determinants of learning achievement and efficiency considerations, World Development, 2001
Bruns, B., Mingat, A., & Rakotomalala, R. (2003). Achieving universal primary education by 2015:
A chance for every child. Washington, D.C: The World Bank. doi:10.1596/0-8213-5345-4 Mongoi, D. et al. (2010). Endline Report of Early Literacy among pre-school and primary school
children in Mozambique. Save the Children. Raupp, M., Newman, B. and Revés, L. (2013). Impact Evaluation for the USAID/Aprender a Ler
Project: Baseline Report. Raupp, M., Newman, B. and Lauchande, C. (2014) Impact Evaluation for the USAID/Aprender a
Ler Project: Midline Report. Tatto, M.T., Nielsen, H.D., Cummings, W.C., Kularatna, N.G., & Dharmadasa, D.H. (1991).
Comparing the effects and costs of different approaches for educating primary school teachers: The case of Sri Lanka. BRIDGES Research Report Series (10), Cambridge, Massachusetts: Harvard Institute for International Development.
UN Special Envoy for Global Education (April 2013). Accelerating progress to 2015:
Mozambique. Working paper. UN Special Envoy for Global Education (April 2013). Accelerating progress to 2015:
Mozambique. Working paper. And World Bank at http://data.worldbank.org/indicator/SE.SEC.NENR?order=wbapi_data_value_2012+wbapi_data_value&sort=asc
USAID/Aprender a Ler Impact Evaluation: Midline 2 Report 105
ANNEX K IE SCOPE OF WORK

AID-656-TO-12-00002, EGRA+QIM Impact Evaluation
Page 7 of 43
SECTION C – STATEMENT OF WORK C.1 BACKGROUND Following a long colonial period, a 10-year war for independence, and 16 years of civil war, Mozambique is rebuilding its education sector and strengthening its capacity to provide quality educational services. Under the colonial government, the Portuguese provided very little education for most Mozambicans. By 1962, after centuries of Portuguese rule, only 25 percent of the population had any education at all (Candido et al, 1986). The illiteracy rate at independence, in 1975, was estimated to be as high as 93 percent. The civil war, which lasted from 1977 to 1992, resulted in the destruction of 50 percent of school infrastructure (especially primary schools) and saw many teachers kidnapped or killed. Despite these challenges, access to primary education in Mozambique expanded rapidly after the civil war ended in 1992. The Government of Mozambique (GOM) created a national system of primary school education and, between 2003 and 2007, the number of children in primary school increased from 3.3 million to 5.3 million at an average growth rate of 8 percent per year. Retention of children in school has improved from 30 percent in 2006 to 41 percent in 2010 (Mozambique Fast Track Initiative (FTI) and Catalytic Fund Application, 2010). Although available budget has not fully met increasing demand for services, the GOM has continuously increased allocations to the education sector, consistently allocating around 20 percent of its budget, including both internal and external sources, to the education sector, with more than half these funds going to primary education. The GOM has also initiated reforms in public financial management, decentralization, and human resource management aimed at improving the provision of basic services. In the education sector, increasing operational budgets have been managed at the school level, and specific funds have been channeled to both provincial and district accounts for supervision activities. Despite laudable progress in access made since 1992, key challenges still exist and will have to be overcome to help the primary school system teach children the basic skills required for the country‘s economic and social development. Improving the quality and increasing the quantity of instructional time, crucial for academic success, remains a challenge and an elusive goal across the public primary school system. The rapid expansion of the primary school system in sheer numbers of children has not been accompanied by a similar increase in the number of modern classrooms. Double and triple shifts of teaching (early morning/midday/afternoon) have become standard among the majority of schools in the system, meaning that students spend a limited amount of time in the classroom and receive a low quantity of instruction in basic skills such as reading. Education is a vital element in the socio-economic and democratic transformation of Mozambique. Progress along the development continuum and full participation in a competitive global economy will require Mozambique to address critical educational quality and learning outcomes issues, especially in light of lackluster performance as has been highlighted in a sequence of assessments (USAID/ Educational Quality Improvement Program 2 (EQUIP 2) Aga Khan 2011; Southern and Eastern Africa Consortium for Monitoring Educational Quality (SACMEQ) 2007). Moreover, many Mozambicans believe that education is one of the key tools for improving socio-economic conditions, and narrowing the gap between rich and poor.

AID-656-TO-12-00002, EGRA+QIM Impact Evaluation
Page 8 of 43
C.2 STATEMENT OF NEED The title of the program to be implemented under this contract is the ―Impact Evaluation (IE) for the Early Grade Reading Assessment Plus Quality Instruction and Management (EGRA+QIM) program”. The main purpose of the IE is to use the findings and conclusions to guide USAID, the Ministry of Education (MINED), and the EGRA+QIM program to select the most powerful interventions to be brought to scale in subsequent school years within the EGRA+QIM program‘s timeframe.
In addition, the IE will provide the rigorous evidence needed to advocate effectively with the government and other donor agencies about the best way to invest scarce resources to improve the quality of education, more specifically reading outcomes, in primary schools. Given the lack of rigorous external and independent evaluation evidence on EGRA+QIM type interventions in USAID Africa, this IE has the potential to raise awareness of the effectiveness of such interventions. The results of the IE will also be shared globally with other international partners active in early grade reading, such as the World Bank, networks such as the Early Grade Learning Community of Practice, and academic organizations or think tanks that will be able to use the findings from the IE to strengthen the research base on early grade reading. In full support and in alignment with USAID Forward, the IE will demonstrate the Agency‘s renewed commitment to learning, systematically monitoring performance, and rigorously evaluating program impact. USAID will link enhanced monitoring and evaluation efforts to its program design, budgeting and strategy work. The IE contract will be one of several mechanisms for implementing the USAID/Mozambique Basic Education Program for the 2012 to 2017 period. The IE contract will contribute towards achieving the global USAID Education Strategy – Goal 1: ―Improved reading skills for 100 million children in primary grades by 2015;‖ and toward the fourth objective of the USAID/Mozambique Country Assistance Strategy (CAS): ―Expand opportunities for quality education and training.‖ Based on evidence in multiple countries and in accordance with the global USAID Education Strategy and the United States Government (USG) Mozambique CAS, USAID/Mozambique has determined that the most effective way to support education—and ultimately the country‘s economic and social development—is by focusing resources on improving early grade reading outcomes.
1. TARGET GEOGRAPHICAL REGIONS AND BENEFICIARIES The EGRA+QIM program will target the provinces of Nampula and Zambezia in central and northern Mozambique. The rationale for selecting these two provinces can be summarized as follows: These two provinces combined contain 42 percent of the school-age population of Mozambique and, according to national statistics, these heavily populated and rural provinces have posted weak education performance results compared to national averages. . In addition, girls in these two provinces are grossly underserved and disadvantaged. The national illiteracy rate for women is 62.7 percent; in Nampula it is 77.4 percent, and in Zambezia 79 percent (Multiple Indicator Cluster Survey (MICS), 2008). Furthermore, despite clear and
AID-656-TO-12-00002, EGRA+QIM Impact Evaluation
Page 9 of 43
pressing needs, there is relatively little bilateral or multilateral support for education in these provinces, with the exception of UNICEF working in only one district in each province. The IE Contractor will collaborate closely with the EGRA+QIM implementing partner and operate in the same provinces and with the same target students, teachers, school directors and schools to evaluate the impact of the various interventions introduced.
2. RATIONALE AND NEED FOR IMPACT EVALUATION OF THE EGRA+QIM PROGRAM
USAID and governments in Africa urgently need rigorously generated evidence about the effectiveness of education interventions to help them make informed decisions about the allocation of scarce resources in the struggle to improve early grade reading outcomes. In Mozambique, the government is poised to take pro-active steps towards establishing quality standards in basic education, but lacks the necessary assessment instruments and skills to effectively measure learning outcomes. This IE, which will be the first external and independent impact evaluation of its kind in USAID Africa, will provide a thorough understanding of the benefits of EGRA+QIM type programming as it relates to improving early grade reading outcomes. The IE will utilize a randomized control trial (RCT) methodology, which is recommended by the new USAID evaluation policy and which is considered the gold standard in measuring causal impacts. A carefully designed RCT can provide exactly the rigorous evidence needed to advocate effectively with the government and donor agencies about the best way to invest scarce resources to improve reading outcomes in primary schools. Given the lack of rigorous external and independent evaluation evidence on EGRA+QIM type interventions in USAID Africa, this IE has the potential to raise awareness of the importance of such interventions as well as the importance of conducting well thought out impact evaluation with the goal of improving reading outcomes.
3. DEVELOPMENT HYPOTHESIS The IE will test USAID/Mozambique‘s EGRA+QIM program development hypothesis that, reading outcomes in grades 2 and 3 will improve if the quality and quantity of reading instruction in those grades is improved through better teacher training and coaching and strengthened school management.
C.3 OBJECTIVES The main objective of the IE will be to measure the causal effect of EGRA+QIM program treatment interventions on improving early grade reading outcomes in grades 2 and 3 in targeted schools. The evaluation will test two treatment models of early reading interventions, against a control group that will not receive any of the interventions. The first model is the ―medium‖ treatment model, which will include training, coaching and support for teachers; and the second is the ―full‖ treatment model which will include training, coaching and support for teachers, and additional school management training for directors.

AID-656-TO-12-00002, EGRA+QIM Impact Evaluation
Page 10 of 43
Impact of these interventions will be measured at two levels. First, the evaluation will determine which of the two models is the most effective in achieving the planned results to improve early grade reading in the EGRA+QIM program; and secondly, which of the two models is the most cost-effective in producing the reading outcomes achieved, measured through unit costs per student, and technical/management sustainability.
EVALUATION QUESTIONS The IE will address the following overarching question: 1. To what extent have EGRA+QIM treatment interventions improved early grade reading outcomes for students in target schools. Specifically the IE will address the following questions related to the impact of the two intervention models: a. Impact of ―Medium‖ Treatment Intervention - To what extent does the ―reading instruction support‖ treatment intervention cause early grade reading outcomes to improve for students in grades 2 and 3 in target schools whose teachers have received training, coaching and support (direct student beneficiaries)? b. Impact of ―Full‖ Treatment Intervention – To what extent does the treatment intervention of additional ―school management‖ training, coaching and support to school directors cause a significant and additional improvement in early grade reading outcomes when coupled with ―reading instruction support‖ in target schools? c. Cost Effectiveness - To what extent are the various ―medium‖ and ―full‖ treatment interventions cost-effective? Specifically, what are the most significant reading outcome effects and unit costs per student, per teacher, per school director, per school of the key treatment interventions? d. Management Sustainability – Of the most cost effective interventions, which fall within the existing technical and financial management capacity of local education institutional personnel? What capacity building activities would be required to ensure sufficient MINED technical and financial management capacity to implement EGRA+QIM interventions?
C.4 SCOPE OF WORK
1. MAIN ACTIVITIES A. Develop Detailed Inception Report - The IE Contractor will develop a detailed inception
report; which will include: a detailed evaluation design; a comprehensive plan to fully address each evaluation question; proposed sampling methods; proposed methods (quantitative and qualitative) for data collection and analysis; and a list and description of proposed data sources to be used. The Inception Report should include a Final Evaluation Work Plan detailing the main activities and objectives to be achieved during the full 30 month IE period. Additionally, the Final Evaluation Work Plan will outline how the Contractor will ―hit the ground running.‖ This includes having the appropriate staff positioned and ready to go, a list of activities to be accomplished, responsible personnel, and a timeline for proposed activities through December 31, 2014. The Detailed Inception Report is due 45
AID-656-TO-12-00002, EGRA+QIM Impact Evaluation
Page 11 of 43
days after the effective date of the award. The IE Contractor will draw upon but is not limited to the following data sources: EGRA assessment data, performance data and progress reports from the EGRA+QIM program, and available data and information from MINED, local education institutions, and civil society. The IE Contractor will employ appropriate qualitative methods to gather information on the local operating environment of schools in target areas to effectively contextualize and interpret data, findings and results.
B. Design, pilot, and implement RCT to establish baseline and evaluate EGRA+QIM interventions - The IE Contractor will design, pilot, and provide oversight for an RCT to establish a baseline and evaluate key EGRA+QIM treatment interventions. The IE Contractor will analyze results to determine the most cost-effective interventions. Using data from an EGRA assessment, the IE Contractor will gather empirical data (ensuring that USAID evaluation policy and impact evaluation standards are rigorously applied) from the RCT to establish a baseline, track progress in reading outcomes, evaluate treatment interventions, and inform the selection of interventions to be brought to scale in subsequent school years. The IE Contractor will design the RCT to evaluate the non-treatment (control) and the two treatment interventions. It is noted that the design, piloting, and implementation of the RCT should strictly adhere to USAID evaluation policy and acceptable professional education evaluation standards.
C. Analyze Results of EGRA Tests - The IE Contractor will analyze EGRA assessment
results, taking into account gender equality and rural/urban factors, and mother tongue issues. Data should be disaggregated by sex, school, grade level, and language group.
D. Disseminate Results of EGRA Tests –The IE Contractor will broadly disseminate results
of the EGRA assessment in an accessible form to key stakeholders (See Attachment J.1: Illustrative Communication and User Engagement Plan). The IE Contractor will also make all assessment instruments, data, analysis, results, reports, and supporting documents available to all key stakeholders, partners and the public.
2. METHODOLOGY The IE will apply an experimental design using RCT to test the impact of the ―medium‖ and ―full‖ EGRA+QIM models on reading levels among 2nd and 3rd graders in Nampula and Zambezia provinces, Mozambique. The EGRA+QIM contractor will be responsible for designing and implementing intervention activities of both the ―medium‖ and ―full‖ models, and develop strong, positive and productive relationships with local education institutions and personnel, as well as, with key MINED directorates, civil society, and education sector donors. The IE contractor will work closely with the EGRA+QIM implementing contractor in designing and conducting the IE activities. The IE contractor will be responsible for: 1. Working with USAID and the EGRA+QIM in developing a sampling frame for evaluation
that will include randomly selecting 60 schools that will participate in the ―full‖ model

AID-656-TO-12-00002, EGRA+QIM Impact Evaluation
Page 12 of 43
intervention, 60 schools in the ―medium‖ intervention, and 60 schools that will serve as control schools with no EGRA+QIM interventions;
2. Designing, piloting, and providing oversight for the RCT that evaluates the impact of the various interventions;
3. Collecting and analyzing all quantitative and qualitative data associated with the evaluation process, including baseline, mid-term, and end line data;
4. Using empirical data generated from the RCT to determine the extent to which EGRA+QIM interventions caused improvements in early grade reading outcomes in target schools.
5. Generating the baseline for all future impact and performance evaluation activities related to the EGRA+QIM program, as well as, inform USAID and MINED‘s selection of the most cost-effective interventions to bring to scale in subsequent years.
The Contractor will design and set up an impact evaluation that will allow for the comparison of a control group and the two intervention treatments. The control group of 60 schools, randomly selected from the target provinces will not receive any program intervention but whose performance will be measured. The control group represents the proximate counterfactual in the evaluation component of the program—that is, what reading achievement levels would be over the same period of time in the absence of any program intervention. The first treatment group, the ―medium‖ intervention, will comprise 60 additional, randomly selected schools; the ―medium‖ group of schools will receive an intensive slate of training, coaching and support activities focused on improving reading instruction. The second treatment group, the ―full‖ intervention, will be another set of 60 schools. The ―full‖ treatment group will receive a slate of training, coaching and support activities targeting reading instruction, and an additional slate of activities to improve school management focusing on increasing instructional time devoted to reading. Qualitative data collection methodologies should also be used to compliment the experimental RCT, to further understand the challenges, obstacles, and motivation experienced by teachers, students, and administrators before, during and after implementation of the EGRA+QIM program.
The IE Contractor will ensure that USAID evaluation policy is adhered to and that rigorous impact evaluation standards are maintained including the responsibility for determining the random assignment of schools into treatment groups, and the validity of findings accounting for school clustering and the largest urban and rural schools in economic corridors in the target provinces.
3. LOCAL COLLABORATION AND COLLABORATION WITH EGRA+QIM CONTRACTOR
The IE Contractor will partner with a local indigenous non-governmental organization (NGO), local university, or a private sector company to recruit, train, and manage locally hired staff to help conduct the IE. Additionally, through the evaluation process (design, pilot, implementation, and analysis) the IE Contractor will collaborate closely with the EGRA+QIM Contractor to
AID-656-TO-12-00002, EGRA+QIM Impact Evaluation
Page 13 of 43
design, pilot, implement and analyze results for a successful RCT. Furthermore, the IE and EGRA+QIM Contractors will coordinate closely so as not to duplicate activity or engage staff positions and resources in a manner that is redundant.
4. GUIDING PRINCIPLES The following are guiding principles that will help in the successful implementation of this evaluation. The Contractor should review the themes listed below carefully, to ensure they are considered throughout the evaluation. a. USAID Forward The IE Contractor will adhere to key reform initiatives described under USAID Forward which emphasizes new partnerships, local capacity building, innovation, and rigorous monitoring and evaluation to achieve results. The Contractor should focus on ways to strengthen host country systems and build local technical and managerial capacity to ensure sustainability. b. USAID Evaluation Policy The IE Contractor should ensure that the Impact Evaluation follows the USAID Evaluation Policy requirements for rigorous impact evaluations. In addition, the IE should lead to more focused and collaborative education investments aimed at identifying low unit costs and at improving learning outcomes and institutional sustainability in the host country. c. Data Quality Standards The IE contractor must ensure that the Impact Evaluation adheres to USAID‘s requirements for data quality. USAID data quality standards are detailed in Automated Directives System (ADS) 578 and ADS 203, which will be provided to the IE Contractor. d. Data Analysis The qualitative and quantitative data that is collected must undergo separate, but complementary analyses. The analysis of qualitative data will consist of four components:
1) data reduction; 2) displaying data; 3) drawing conclusions; and 4) verification through data triangulation. Qualitative data should undergo analysis using a coding system to be developed by the team‘s Statistician/Data Expert.
The IE Contractor will utilize a variety of techniques, including computer-based tools to draw conclusions from the data such as noting patterns, themes, and relations between variables, assessing plausibility, and uncovering intervening variables. The consultant will protect against bias by testing explanations, examining exceptions, and confirming findings. Quantitative data from the survey must be reviewed for missing information and when possible corrected. The data must be cleaned and inputted into SPSS, CSPro or similar statistical program to begin analysis. e. Consultation with Key Stakeholders
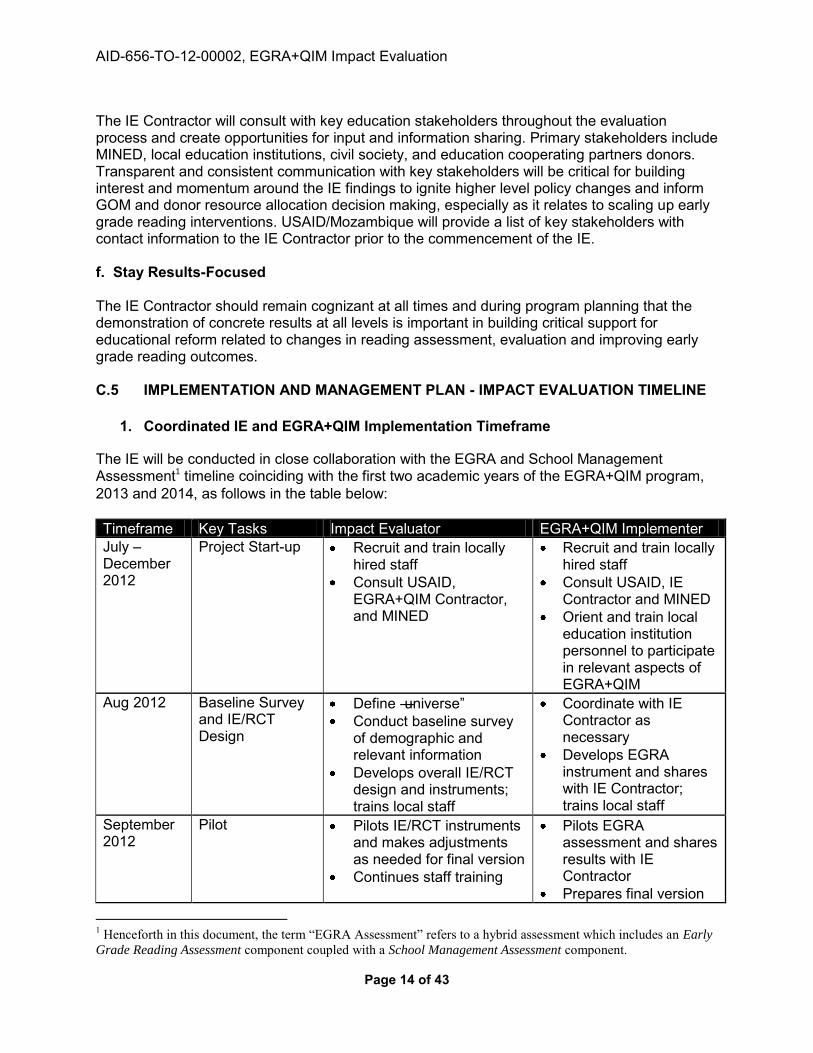
AID-656-TO-12-00002, EGRA+QIM Impact Evaluation
Page 14 of 43
The IE Contractor will consult with key education stakeholders throughout the evaluation process and create opportunities for input and information sharing. Primary stakeholders include MINED, local education institutions, civil society, and education cooperating partners donors. Transparent and consistent communication with key stakeholders will be critical for building interest and momentum around the IE findings to ignite higher level policy changes and inform GOM and donor resource allocation decision making, especially as it relates to scaling up early grade reading interventions. USAID/Mozambique will provide a list of key stakeholders with contact information to the IE Contractor prior to the commencement of the IE. f. Stay Results-Focused The IE Contractor should remain cognizant at all times and during program planning that the demonstration of concrete results at all levels is important in building critical support for educational reform related to changes in reading assessment, evaluation and improving early grade reading outcomes. C.5 IMPLEMENTATION AND MANAGEMENT PLAN - IMPACT EVALUATION TIMELINE
1. Coordinated IE and EGRA+QIM Implementation Timeframe
The IE will be conducted in close collaboration with the EGRA and School Management Assessment1 timeline coinciding with the first two academic years of the EGRA+QIM program, 2013 and 2014, as follows in the table below: Timeframe Key Tasks Impact Evaluator EGRA+QIM Implementer July – December 2012
Project Start-up Recruit and train locally hired staff
Consult USAID, EGRA+QIM Contractor, and MINED
Recruit and train locally hired staff
Consult USAID, IE Contractor and MINED
Orient and train local education institution personnel to participate in relevant aspects of EGRA+QIM
Aug 2012 Baseline Survey and IE/RCT Design
Define ―universe‖ Conduct baseline survey
of demographic and relevant information
Develops overall IE/RCT design and instruments; trains local staff
Coordinate with IE Contractor as necessary
Develops EGRA instrument and shares with IE Contractor; trains local staff
September 2012
Pilot Pilots IE/RCT instruments and makes adjustments as needed for final version
Continues staff training
Pilots EGRA assessment and shares results with IE Contractor
Prepares final version 1 Henceforth in this document, the term “EGRA Assessment” refers to a hybrid assessment which includes an Early
Grade Reading Assessment component coupled with a School Management Assessment component.
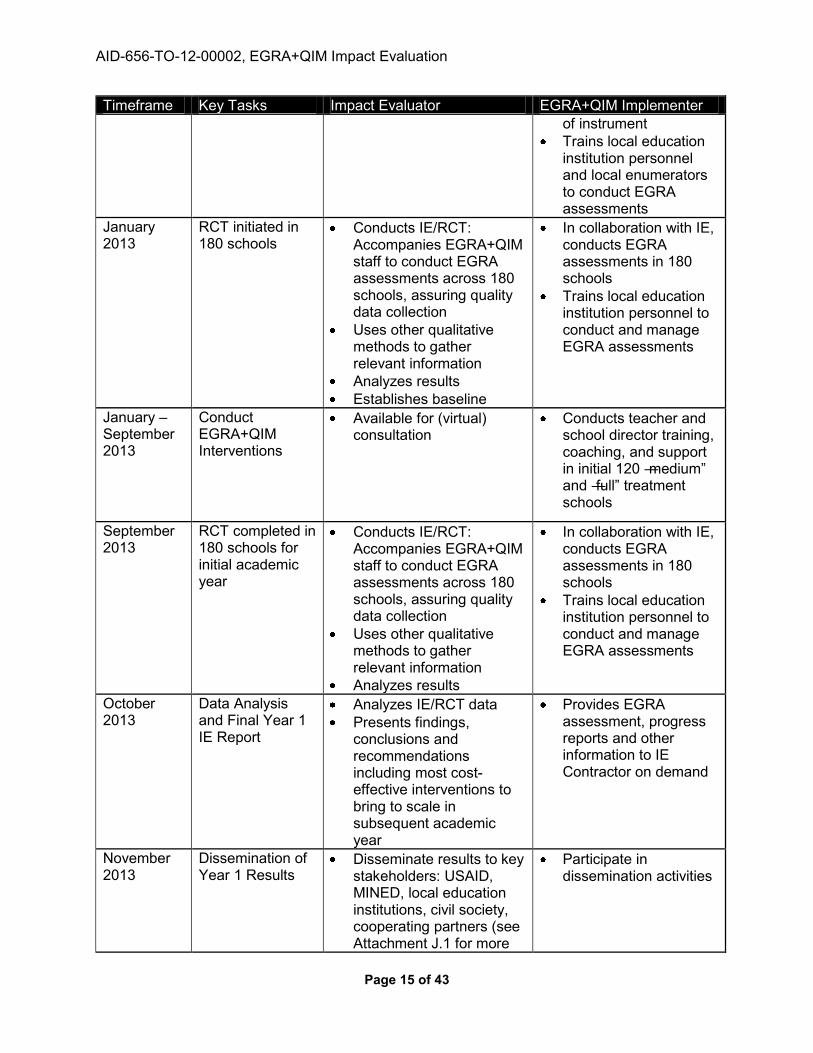
AID-656-TO-12-00002, EGRA+QIM Impact Evaluation
Page 15 of 43
Timeframe Key Tasks Impact Evaluator EGRA+QIM Implementer of instrument
Trains local education institution personnel and local enumerators to conduct EGRA assessments
January 2013
RCT initiated in 180 schools
Conducts IE/RCT: Accompanies EGRA+QIM staff to conduct EGRA assessments across 180 schools, assuring quality data collection
Uses other qualitative methods to gather relevant information
Analyzes results Establishes baseline
In collaboration with IE, conducts EGRA assessments in 180 schools
Trains local education institution personnel to conduct and manage EGRA assessments
January –September 2013
Conduct EGRA+QIM Interventions
Available for (virtual) consultation
Conducts teacher and school director training, coaching, and support in initial 120 ―medium‖ and ―full‖ treatment schools
September 2013
RCT completed in 180 schools for initial academic year
Conducts IE/RCT: Accompanies EGRA+QIM staff to conduct EGRA assessments across 180 schools, assuring quality data collection
Uses other qualitative methods to gather relevant information
Analyzes results
In collaboration with IE, conducts EGRA assessments in 180 schools
Trains local education institution personnel to conduct and manage EGRA assessments
October 2013
Data Analysis and Final Year 1 IE Report
Analyzes IE/RCT data Presents findings,
conclusions and recommendations including most cost-effective interventions to bring to scale in subsequent academic year
Provides EGRA assessment, progress reports and other information to IE Contractor on demand
November 2013
Dissemination of Year 1 Results
Disseminate results to key stakeholders: USAID, MINED, local education institutions, civil society, cooperating partners (see Attachment J.1 for more
Participate in dissemination activities
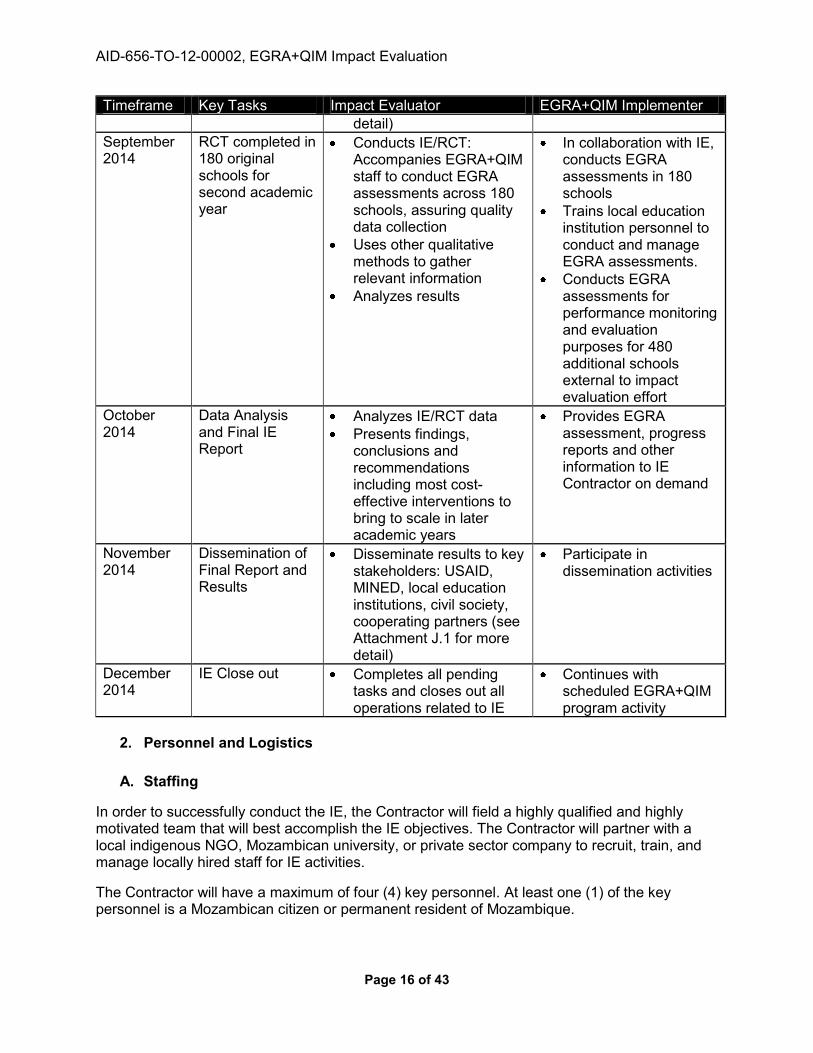
AID-656-TO-12-00002, EGRA+QIM Impact Evaluation
Page 16 of 43
Timeframe Key Tasks Impact Evaluator EGRA+QIM Implementer detail)
September 2014
RCT completed in 180 original schools for second academic year
Conducts IE/RCT: Accompanies EGRA+QIM staff to conduct EGRA assessments across 180 schools, assuring quality data collection
Uses other qualitative methods to gather relevant information
Analyzes results
In collaboration with IE, conducts EGRA assessments in 180 schools
Trains local education institution personnel to conduct and manage EGRA assessments.
Conducts EGRA assessments for performance monitoring and evaluation purposes for 480 additional schools external to impact evaluation effort
October 2014
Data Analysis and Final IE Report
Analyzes IE/RCT data Presents findings,
conclusions and recommendations including most cost-effective interventions to bring to scale in later academic years
Provides EGRA assessment, progress reports and other information to IE Contractor on demand
November 2014
Dissemination of Final Report and Results
Disseminate results to key stakeholders: USAID, MINED, local education institutions, civil society, cooperating partners (see Attachment J.1 for more detail)
Participate in dissemination activities
December 2014
IE Close out Completes all pending tasks and closes out all operations related to IE
Continues with scheduled EGRA+QIM program activity
2. Personnel and Logistics
A. Staffing
In order to successfully conduct the IE, the Contractor will field a highly qualified and highly motivated team that will best accomplish the IE objectives. The Contractor will partner with a local indigenous NGO, Mozambican university, or private sector company to recruit, train, and manage locally hired staff for IE activities.
The Contractor will have a maximum of four (4) key personnel. At least one (1) of the key personnel is a Mozambican citizen or permanent resident of Mozambique.
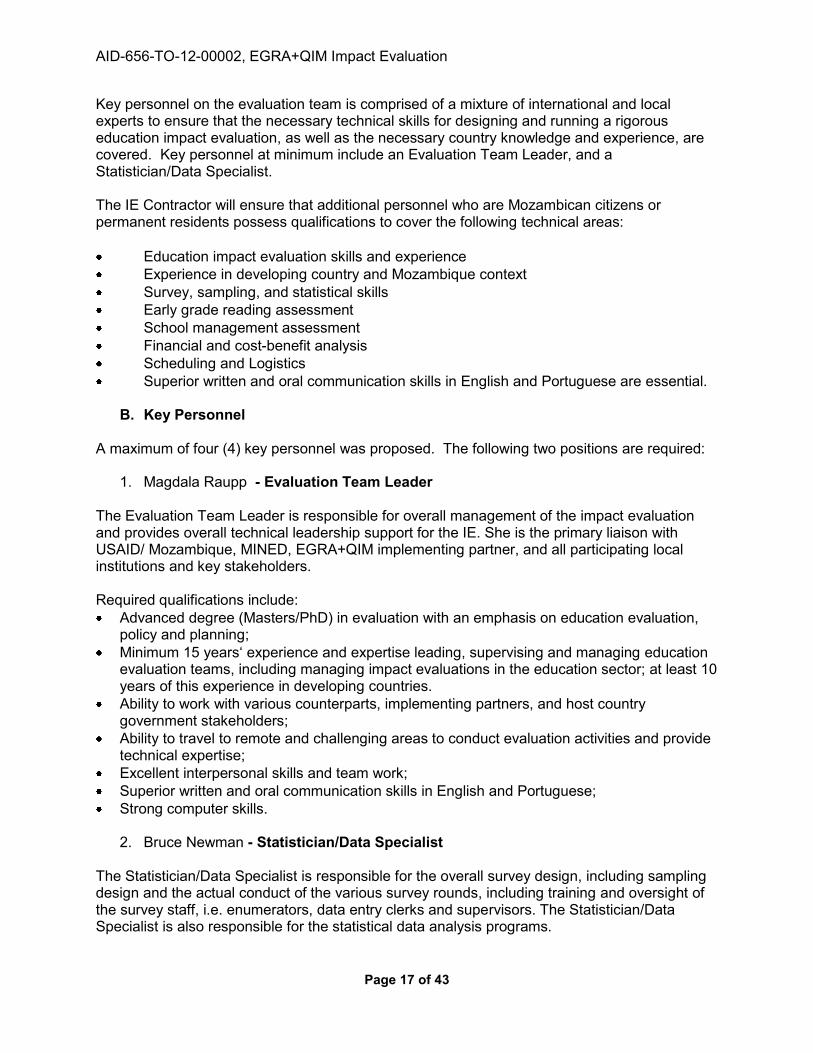
AID-656-TO-12-00002, EGRA+QIM Impact Evaluation
Page 17 of 43
Key personnel on the evaluation team is comprised of a mixture of international and local experts to ensure that the necessary technical skills for designing and running a rigorous education impact evaluation, as well as the necessary country knowledge and experience, are covered. Key personnel at minimum include an Evaluation Team Leader, and a Statistician/Data Specialist. The IE Contractor will ensure that additional personnel who are Mozambican citizens or permanent residents possess qualifications to cover the following technical areas: Education impact evaluation skills and experience Experience in developing country and Mozambique context Survey, sampling, and statistical skills Early grade reading assessment School management assessment Financial and cost-benefit analysis Scheduling and Logistics Superior written and oral communication skills in English and Portuguese are essential.
B. Key Personnel
A maximum of four (4) key personnel was proposed. The following two positions are required:
1. Magdala Raupp - Evaluation Team Leader The Evaluation Team Leader is responsible for overall management of the impact evaluation and provides overall technical leadership support for the IE. She is the primary liaison with USAID/ Mozambique, MINED, EGRA+QIM implementing partner, and all participating local institutions and key stakeholders. Required qualifications include: Advanced degree (Masters/PhD) in evaluation with an emphasis on education evaluation,
policy and planning; Minimum 15 years‘ experience and expertise leading, supervising and managing education
evaluation teams, including managing impact evaluations in the education sector; at least 10 years of this experience in developing countries.
Ability to work with various counterparts, implementing partners, and host country government stakeholders;
Ability to travel to remote and challenging areas to conduct evaluation activities and provide technical expertise;
Excellent interpersonal skills and team work; Superior written and oral communication skills in English and Portuguese; Strong computer skills.
2. Bruce Newman - Statistician/Data Specialist
The Statistician/Data Specialist is responsible for the overall survey design, including sampling design and the actual conduct of the various survey rounds, including training and oversight of the survey staff, i.e. enumerators, data entry clerks and supervisors. The Statistician/Data Specialist is also responsible for the statistical data analysis programs.

AID-656-TO-12-00002, EGRA+QIM Impact Evaluation
Page 18 of 43
Required qualifications include: Advance degree (Masters/PhD) in statistics, Evaluation, Monitoring and Evaluation (M&E) or
related field; Minimum 15 years‘ experience in qualitative and quantitative data collection and analysis
methods and in designing education evaluations, and at least 7 of these years in a developing country context;
Minimum 10 years‘ experience in designing and leading education national surveys, including expert knowledge of state-of-the-art sampling or census methods;
Minimum 10 years‘ experience in running statistical analysis programs; Ability to work with various counterparts, implementing partners, and host country
government stakeholders; Ability to travel to remote and challenging areas to conduct data collection and analysis
activities; Excellent interpersonal skills and team work; Superior written and oral communication skills in English and Portuguese; Strong computer skills.
3. Luis Reves - Deputy Team Leader
4. Assane Pinto - Data Specialist
C. Non-Key Personnel
RCT Survey Staff and Research Assistants In addition to the above key personnel, the IE Contractor is expected to hire and manage the following: Mozambican data entry clerks to ensure that collected data is entered into statistical
databases.
Mozambique supervisors to oversee and maintain quality standards during the data collection and entry process. The supervisors are essential as they provide oversight of the various teams of enumerators who are contracted by the EGRA+QIM project during the data collection process in the field as well as manage the data entry clerks during the data entry process.
Mozambican research assistants, to assist in the collection of qualitative data using qualitative methods, such as focus groups and key informant interviews.
The enumerators responsible for conducting the actual EGRA assessments shall not be hired and managed by the IE Contractor, but instead, by the EGRA+QIM Contractor. IE Contractor supervisors shall provide overall quality control oversight of these enumerators during the various rounds of IE data collection and data entry.
D. Logistics For purposes of the IE/RCT, a total of three EGRA and School Management Assessments (henceforth, referred to as EGRA Assessment) shall be administered in 180 schools by the EGRA+QIM Contractor: Baseline assessment in Jan 2013; Post academic year 1 assessment
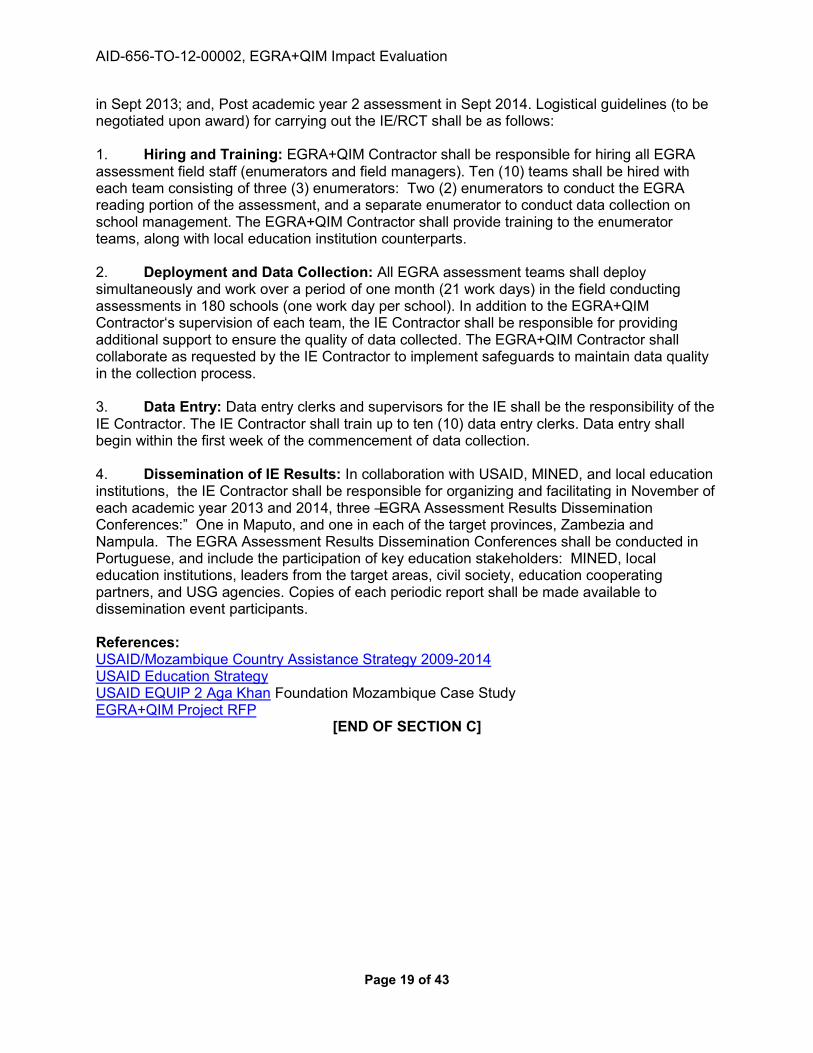
AID-656-TO-12-00002, EGRA+QIM Impact Evaluation
Page 19 of 43
in Sept 2013; and, Post academic year 2 assessment in Sept 2014. Logistical guidelines (to be negotiated upon award) for carrying out the IE/RCT shall be as follows: 1. Hiring and Training: EGRA+QIM Contractor shall be responsible for hiring all EGRA assessment field staff (enumerators and field managers). Ten (10) teams shall be hired with each team consisting of three (3) enumerators: Two (2) enumerators to conduct the EGRA reading portion of the assessment, and a separate enumerator to conduct data collection on school management. The EGRA+QIM Contractor shall provide training to the enumerator teams, along with local education institution counterparts. 2. Deployment and Data Collection: All EGRA assessment teams shall deploy simultaneously and work over a period of one month (21 work days) in the field conducting assessments in 180 schools (one work day per school). In addition to the EGRA+QIM Contractor‘s supervision of each team, the IE Contractor shall be responsible for providing additional support to ensure the quality of data collected. The EGRA+QIM Contractor shall collaborate as requested by the IE Contractor to implement safeguards to maintain data quality in the collection process. 3. Data Entry: Data entry clerks and supervisors for the IE shall be the responsibility of the IE Contractor. The IE Contractor shall train up to ten (10) data entry clerks. Data entry shall begin within the first week of the commencement of data collection. 4. Dissemination of IE Results: In collaboration with USAID, MINED, and local education institutions, the IE Contractor shall be responsible for organizing and facilitating in November of each academic year 2013 and 2014, three ―EGRA Assessment Results Dissemination Conferences:‖ One in Maputo, and one in each of the target provinces, Zambezia and Nampula. The EGRA Assessment Results Dissemination Conferences shall be conducted in Portuguese, and include the participation of key education stakeholders: MINED, local education institutions, leaders from the target areas, civil society, education cooperating partners, and USG agencies. Copies of each periodic report shall be made available to dissemination event participants. References: USAID/Mozambique Country Assistance Strategy 2009-2014 USAID Education Strategy USAID EQUIP 2 Aga Khan Foundation Mozambique Case Study EGRA+QIM Project RFP
[END OF SECTION C]
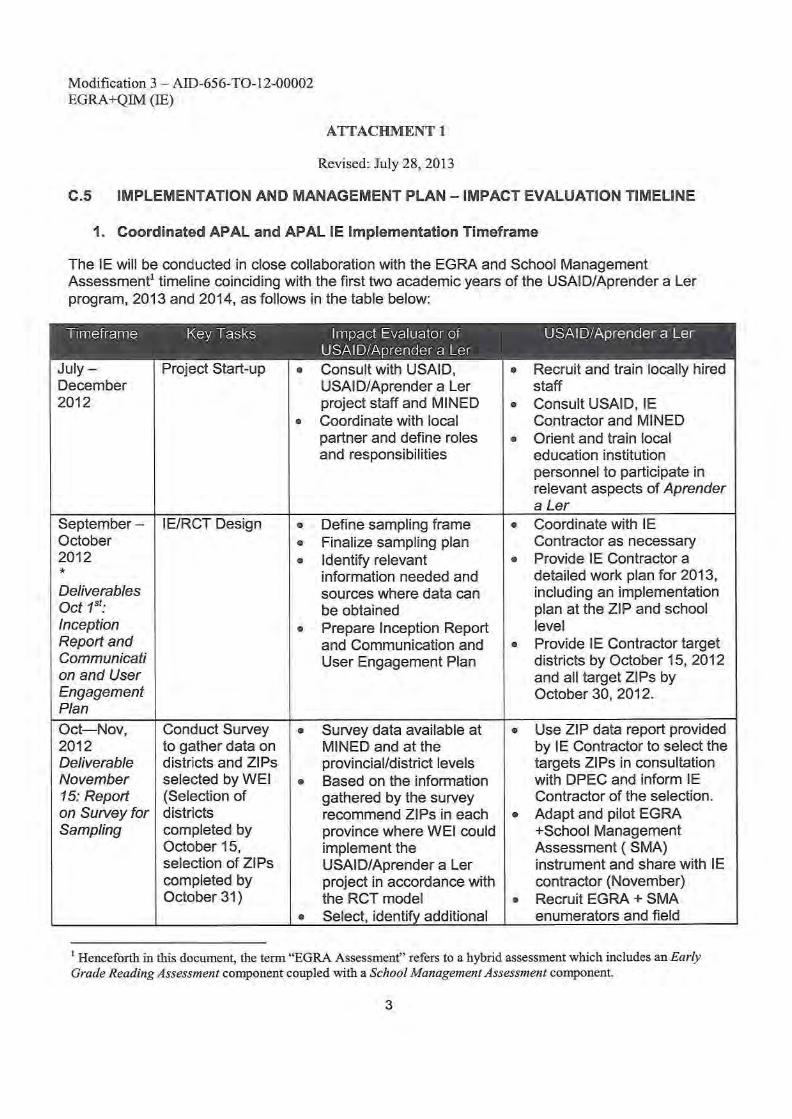
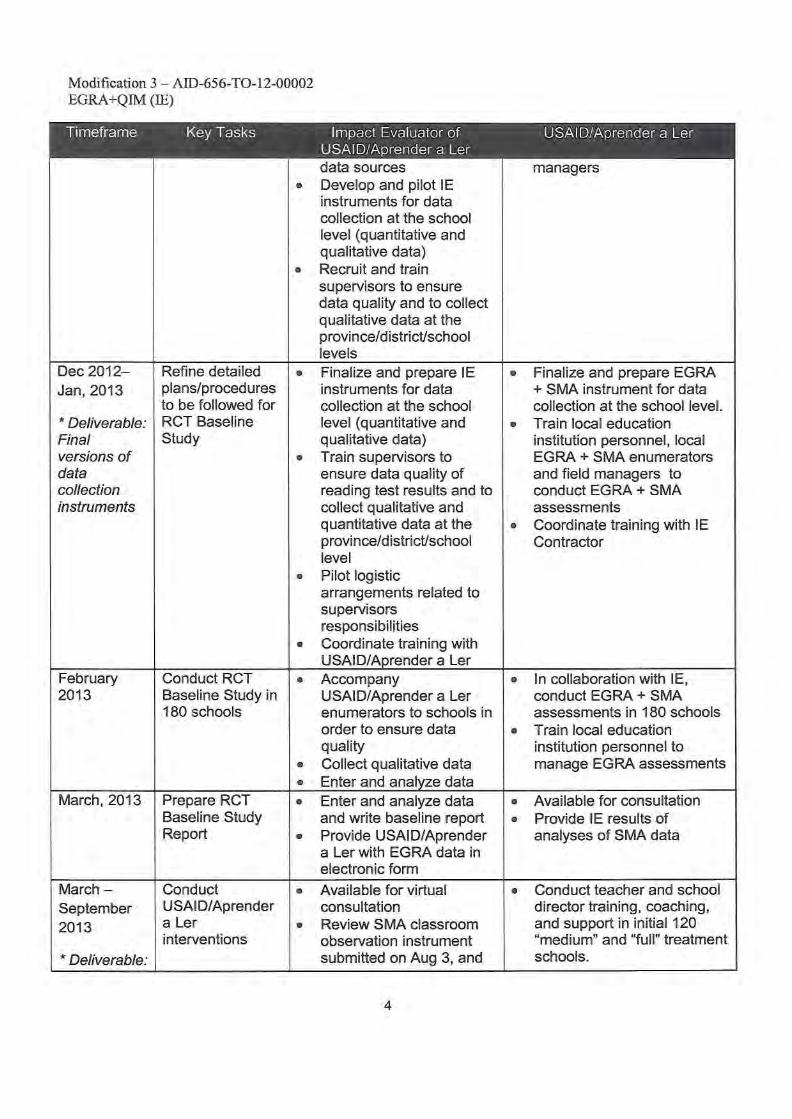
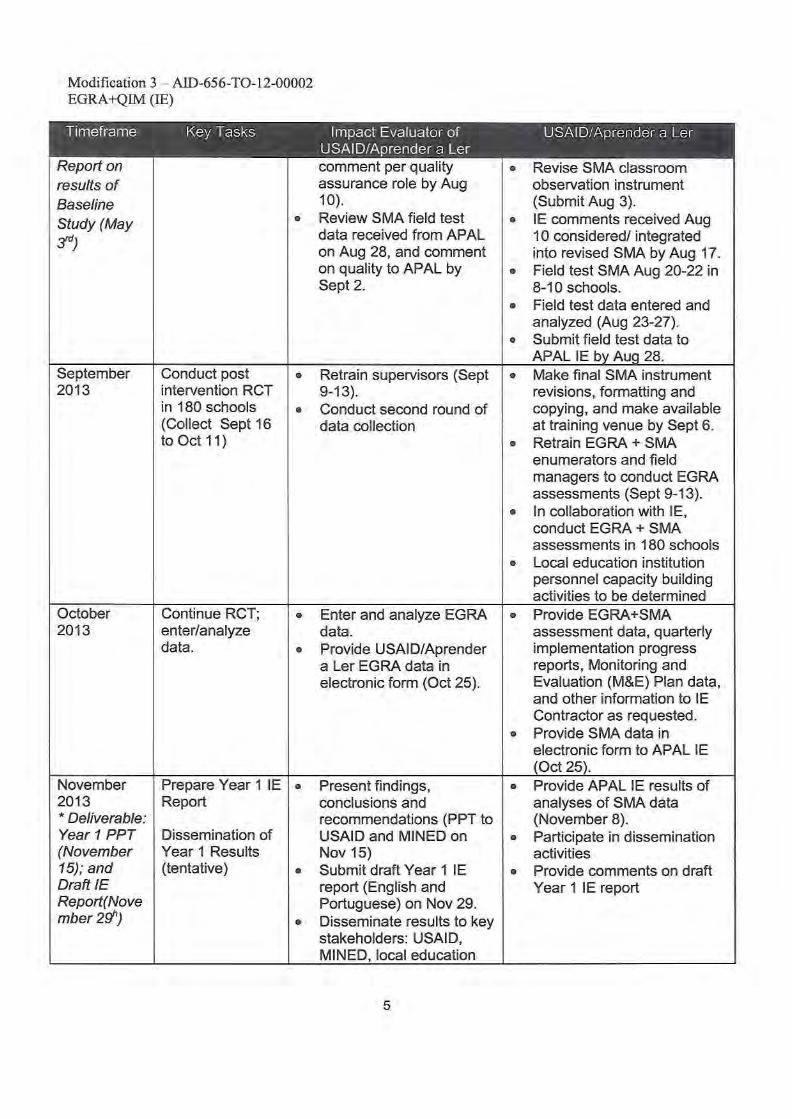
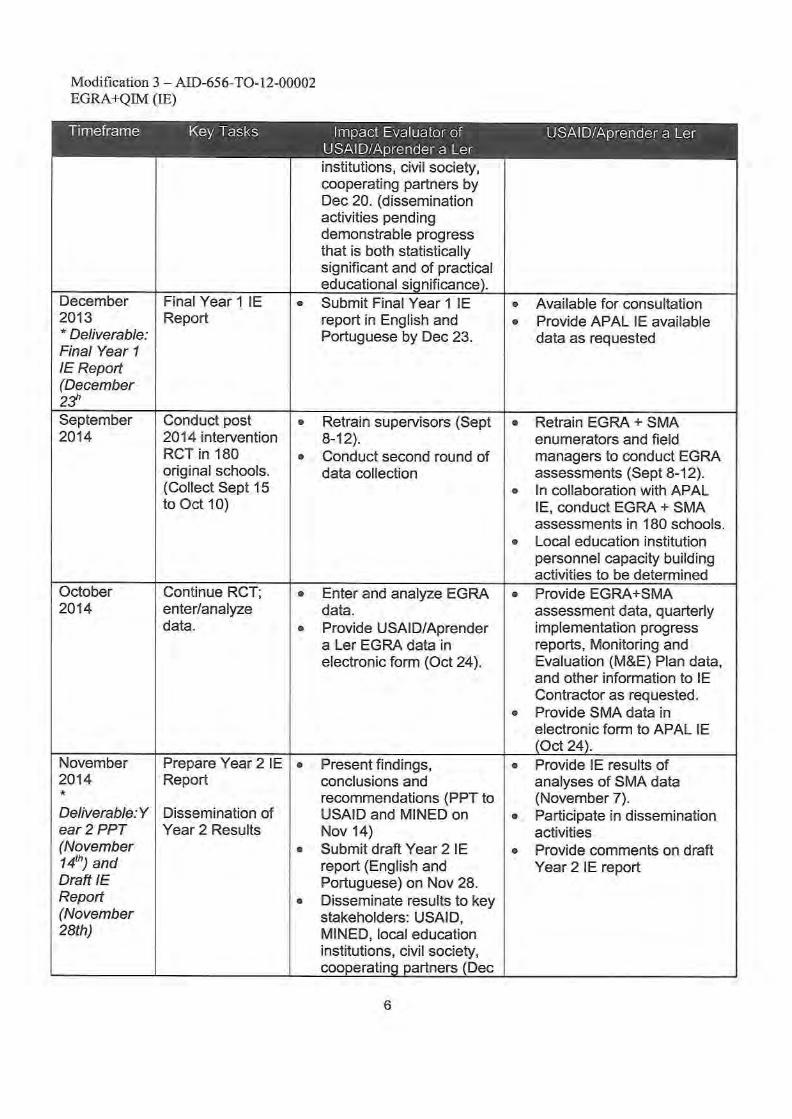
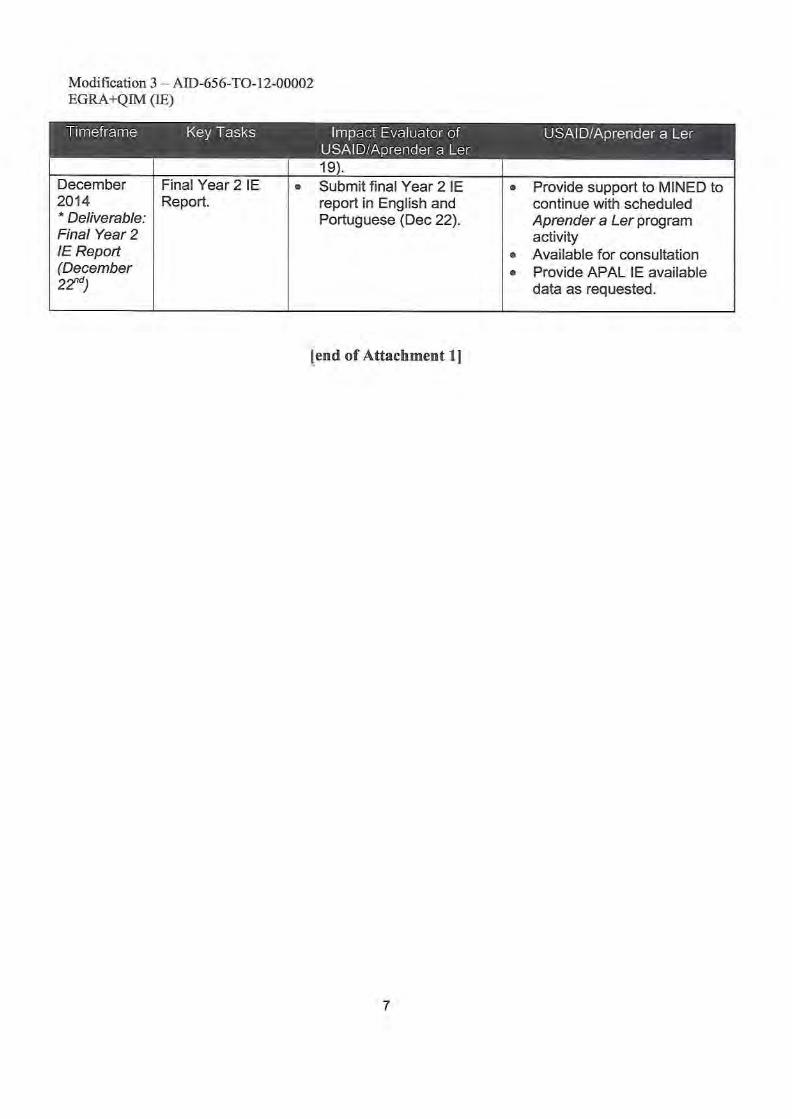
USAID/Aprender a Ler Impact Evaluation: Midline 2 Report 118
ANNEX L CONFLICT OF INTEREST FORMS
Disclosure of Conflict of Interest for USAID Evaluation Team Members
Name Magdala RauppTitleOrganization IBJCIEvaluation Position lZl'-Team Leader oTeam memberEvaluation Award Number (contract or AID-656- TO-I 2-00002other instrument) .USAlD Project(s) Evaluated (Include Impact Evaluation of the USAlD Aprender a Ler (ApaL) Early Grade Readingproject name(s), implementer name(s) and Assessment Plus Quality Instruction and Management Project in Mozambique,award number(s), if applicable) World Education, Inc., AlD-656-C-12-0000 1I have real or potential conflicts of c=J Yes N~interest to disclose.Jfyes answered above, I disclose thefollowing facts:Real or potential conflicts of interest mayinclude, but are not limited to:1. Closefamily member who is an employee
of the USAlD operating unit managingthe project(s) being evaluated or theimplementing organization/s) whoseprojeci(s) are being evaluated.
2. Financial interest that is direct, or issignificant though indirect, in theimplementing organization(s) whoseprojects are being evaluated or in theoutcome of the evaluation.
3. Current or previous direct or significantthough indirect experience with theproject(s) being evaluated, includinginvolvement in the project design orprevious iterations of the project.
4. Current or previous work experience orseeking employment with the USAIDoperating unit managing the evaluationor the implementing organization(s)whose project(s) are being evaluated.
5. Current or previous work experience withan organization that may be seen as anindustry competitor with theimplementing organization(s) whoseproject(s) are being evaluated.
6. Preconceived ideas toward individuals,groups, organizations, or objectives ofthe particular projects and organizationsbeing evaluated that could bias theevaluation.
I certify (I) that 1have completed this disclosure form fully and to the best of my ability and (2) that I will update this disclosureform promptly if relevant circumsttln s change. If I gain access to proprietary information of other companies, then I agree toprotect their information from unau rized use or disclosure for as long as it remains proprietary and refrain from using theinformation for any ouroose other that for which it was furfiiSiled.Signature
Date