
Impact Damage Formation on Composite Aircraft Structures · Impact Damage Formation on Composite...
31
Impact Damage Impact Damage Formation on Composite Formation on Composite Aircraft Structures Aircraft Structures 2011 Technical Review Hyonny Kim Hyonny Kim University of California San Diego 1 FAA JAMS 2011 Technical Review Meeting, April 20-21, 2011, San Diego, CA
Transcript of Impact Damage Formation on Composite Aircraft Structures · Impact Damage Formation on Composite...
Department of Structural Engineering
Impact Damage Impact Damage Formation on Composite Formation on Composite Aircraft StructuresAircraft Structures2011 Technical ReviewHyonny KimHyonny KimUniversity of California San Diego
1FAA JAMS 2011 Technical Review Meeting, April 20-21, 2011, San Diego, CA

Department of Structural EngineeringImpact Damage Formation on Composite Aircraft Structures
Motivation and Key Issues • Impact damage to composites remains significant source of concern
» particularly from high energy blunt sources that are not well understoodincreasingl more composite primar str ct re being deplo ed» increasingly more composite primary structure being deployed
• Focus: Blunt Impacts affecting large area and/or multiple structural elements
ObjectivesCh t i Bl t I t th t d th l ti h d• Characterize Blunt Impact threats and the locations where damage can occur
• Understand damage formation from Blunt Impact sources and how this relates to visual detectability
• Develop: analysis & testing methodologies, new modeling capabilitiesp y g g , g p
Approach• Conduct experiments on representative structure/specimens
» wide area high energy blunt impact – e.g., from ground service equipmentg gy p g , g q p» high velocity hail ice impacts – in-flight and ground-hail conditions
• Nonlinear finite element modeling – contact, explicit dynamics, material failure• Workshops and meetings (at UCSD, via teleconf), UCSD Blunt Impact website
2
• Form collaborations with industry on relevant problems/projects
Department of Structural EngineeringImpact Damage Formation on Composite Aircraft Structures
Principal Investigators & Researchers• PI: Hyonny Kim, Associate Professor, UCSD
» Prof. JM Yang, UCLA – sending subcontract to UCSD• Graduate Students:
» PhD: Gabriela DeFrancisci, Zhi Chen, Jennifer Rhymer» MS: Sho Funai, Jeff Tippmann (graduated Jan. 2011)
U d d t J H h S L S h F M D l• Undergraduates: Jon Hughes, Sean Luong, Sarah Fung, Mac Delaney
FAA Technical Monitor• Lynn Pham
Other FAA Personnel Involved• Curt Davies• Larry IlcewiczLarry Ilcewicz
Industry Participation• Material support by Cytec, San Diego Composites, Boeing
P ti i ti b Ai b B b di UAL D lt JC H l i
3
• Participation by Airbus, Bombardier, UAL, Delta, JC Halpin• Collaborations with Bishop GMBH (EASA-funded), Sandia Labs

Department of Structural EngineeringProject Focus: Blunt ImpactsBlunt Impacts• blunt impact damage (BID) can exist with little orexist with little or no exteriorvisibility
• sources of interest are those that
Hail Ice Impact• upward & forward facing
surfaces
are those that affect wide area or multiple structural elements
surfaces• low mass, high velocity
Ground Vehicles & Service Equipmentq p• side & lower facing
surfaces• high mass, low velocity• wide area contact
damage possible at
4
• damage possible at locations away from impact

Department of Structural Engineering
Part I L V l it Hi h MCargo Loader
~ 15,000 kgPart I. Low-Velocity High-Mass Wide-Area Blunt Impact• ground service equipment (GSE) impact
k j f d
g
• known major source of damage• determine key phenomena and parameters that
are related to damage formation• how affected by bluntness
potential low angle contact w/out bumper
• ID & predict failure thresholds• what conditions relate to development of
significant internal damage with minimal or no exterior visual detectability?
Belt Loader~3,000 kg
p
y
5
Part II. High Velocity Hail Ice Impact

Department of Structural EngineeringBlunt Impact Program Phases
Increasingly Complex Phases of Activity – Gain Fundamental Understanding at Bottom
Modeling Capability
OEMHardware- 1/4 to 1/2
Increasing LengthScale, Complexity,and Specificity
Phase III(Year 3)
Modeling CapabilityDevelopment & Correlationwith Test are Key Aspects
at Each Level
Large Panele g 5 Bays
1/4 to 1/2Barrel Size
- Vehicle Impacts Scaling,B.C. Effects
Phase II
Status:Phase I completed.
- e.g., 5 Bays- Damage Excitation
- Damage Thresholds- Model Correlation
Scaling
(Year 2)Phase II specimens in preparation.
Basic Elements- Excite Key Failure Modes- Model Correlation Data
- Understand Damage Formation &
Scaling,B.C. EffectsDynamicsPhase I
(Year 1)
6
Understand Damage Formation &Relationship to Bluntness Parameters
Department of Structural Engineering
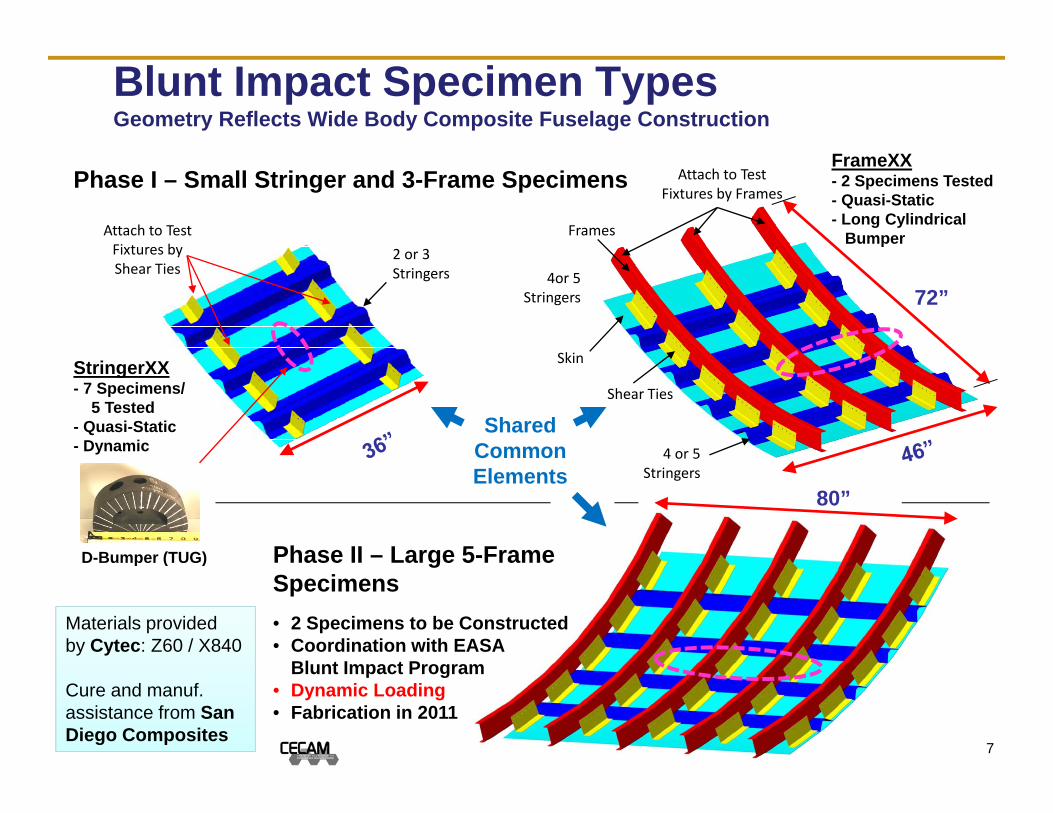
Blunt Impact Specimen TypesGeometry Reflects Wide Body Composite Fuselage Construction
Phase I – Small Stringer and 3-Frame Specimens
Frames
Attach to Test Fixtures by Frames
Attach to Test Fixtures by
FrameXX- 2 Specimens Tested- Quasi-Static- Long Cylindrical
Bumper2 or 3
Skin
Fixtures by Shear Ties
72”
2 or 3 Stringers 4or 5
Stringers
Shear Ties
Skin
4 or 5
SharedCommon
StringerXX- 7 Specimens/
5 Tested- Quasi-Static- Dynamic 4 or 5
Stringers
Phase II – Large 5-Frame
80”
Co oElements
D-Bumper (TUG) Phase II Large 5 FrameSpecimens• 2 Specimens to be Constructed• Coordination with EASA
Bl t I t P
Materials providedby Cytec: Z60 / X840
D Bumper (TUG)
7
Blunt Impact Program• Dynamic Loading• Fabrication in 2011
Cure and manuf.assistance from San Diego Composites

Department of Structural EngineeringSpecimen Testing DetailsF XX S tFrameXX Setup: • Loading by 1D table, specimens on strong wall• Indentor head moves into specimen – simulates
GSE contact• Velocity up to 1 m/s
ControlledRotational
Stiffness BC
Frame Specimen ~6 x 4 ft.
Velocity up to 1 m/s
Indentor Assembly on Rigid Frame
Stroke Direction StringerXX Setup
– Uniaxial Machine– D-Bumper
GSE CylindricalRubber Bumper
8

Department of Structural Engineering
Test Matrix and Results SummarySpecimen
IDPanel Config
Loading Details(Q.Static Unless Noted)
Intermediate Failure Modes
Final Failure Mode
Vis-ible
?
Max Load (kN)
Max Displ( )ID Config Noted) Modes Mode ? (kN) (mm)
Stringer00 3 Stringers R3” Alum. at Stringer Skin Delamination Local Skin
Penetration Y 30.7 25.3
Stringer01 2 Stringers R3” Alum. on Skin Between Stringers Skin Delamination Local Skin
Penetration Y 26.7 21.8Between Stringers Penetration
Stringer02 2 Stringers D-Bumper on Skin Between Stringers
Skin-Stringer Delamination of Each
Adjacent Stringer
Extensive Stringer-Skin Delamination
N 61.7 39.5
D-Bumper at Stringer Radius Cracks Extensive Stringer03 3 Stringers D Bumper at
StringerStringer Radius Cracks
Under Indentor Stringer-Skin Delamination
Y 61.6 48.5
Stringer04 3 Stringers D-Bumper on Stringer Flange
Stringer Radius Cracks Under Indentor
Extensive Stringer-Skin Delamination
Y 78.2 44.2Delamination
Stringer05 2 StringersD-Bumper on Skin Between Stringers, Dynamic
-- test not run yet --expected June 2011
Stringer06 3 Stringers D-Bumper at -- test not run yet --Stringer06 3 StringersStringer, Dynamic expected June 2011
Frame014 Stringers, 3 Frames
Long Cyl. Bumper Between Stringers
Shear Ties Crush, Stringer Sever & Flange
DelamFrame Crack N 57.4 75.5
Shear Ties CrushFrame02
5 Stringers, 3 Frames
Long Cyl. Bumper at Stringer
Shear Ties Crush, Stringer Sever & Flange
Delam, Skin CrackFrame Crack Y 71.0 55.9
Frame03 and Frame04: four stringers + five-frame panels – specimen fab. Summer 2011, test Jan 2012

Department of Structural EngineeringStringerXX Summary Specimen
Stringer03
SpecimenStringer04
10

Department of Structural EngineeringStringer02 Delamination
Stringer02 – Loaded to 13,797 lb by Rubber Bumper
Panel Surface after the 4th Loading• blue hatching shows delamination after the 3rd loading• blue hatching shows delamination after the 3 loading• red outline shows additional delamination after 4th
loadingDelamination of Stringer Flange After 4th Loadingg g
11
NDI Details: pulse/echo c-scan using manual x-y scanner; 5 MHz, 0.1x0.1 in.

Department of Structural EngineeringFrameXX Summary
Frame#1
Frame#2
Frame#3
Specimen Frame01
#1
Loaded Area
4 Stringers+
3 Frames
S i F 02
Frame#1
Frame#2
Frame#3
Specimen Frame02
5 Stringers
Loaded Area
5 Stringers+
3 Frames
UCSD Blunt Impact 12

Department of Structural EngineeringShear Tie Crushing and Bending Failure
Contact &S i F 02 Contact & Scraping Along
Stringer as Frame #1 Rotates
Specimen Frame02
Rotates
Frame #1
Local Crushing atSh Ti CShear Tie Corners
Shear Tie Corner Crushing and
13
Shear Tie Bending Failureat Bolt Line Like Hinge –
Allows More Frame Rotation
Crushing and Delam

Department of Structural Engineering
Severed Stringer
Delaminated FlangeStringer PenetrationSevered Stringer
Frame #2
Runs TowardFrame #3
Upper Stringer
Fractured Shear Tie(Liberated FragmentNot Shown)
Frame01 – Post L3. Cl I t i
UCSD Blunt Impact 14
Closeup Interior View

Department of Structural EngineeringFrame Cracking Closeup View
Fractured Shear TieSpecimen Frame01 Fractured Shear Tie
S i F 02 FrameSpecimen Frame02 Frame
Through-Thickness Crack in Frame WebP i it t d b C t t ith St i
Frame Stringer
UCSD Blunt Impact 15
- Precipitated by Contact with Stringer- Crack Length ~ 1.5 in. Stringer

Department of Structural EngineeringExterior View After Major Damage Development
Loaded ZoneSpecimen Frame01Post-loading 3 exterior view.Extensive internal damage.
16
Specimen Frame02 (not shown) developed skin crack originating from free edge.

Department of Structural EngineeringDamage Progression Process
Open Bumper
Collapses
Shear TieDelamination& Crushing
Stringers and Frames Contact at Multiple Points
Initial Contact Rotated
Framer
Shear Tie Bending Failure
Penetrate/SeverStringer
More Frame
Rotation
Stri
nger
At Each Contact
Point
Focus Load
Path toDamageArrested
CrackFrame
Extensive Stringer Delam.
High ContactStress
Note:Rotation of c-shaped
Which is Desirable Path?
Large Stiffness Loss / Major Damage
e
frame promotes bending failure of shear ties and presents “sharp”
No Dam. Path – SurroundingStructure Subject to Failure
ntac
t For
ce corner contact onto stringer.
Absorbed Energy
17
Con
Indentation Displacement
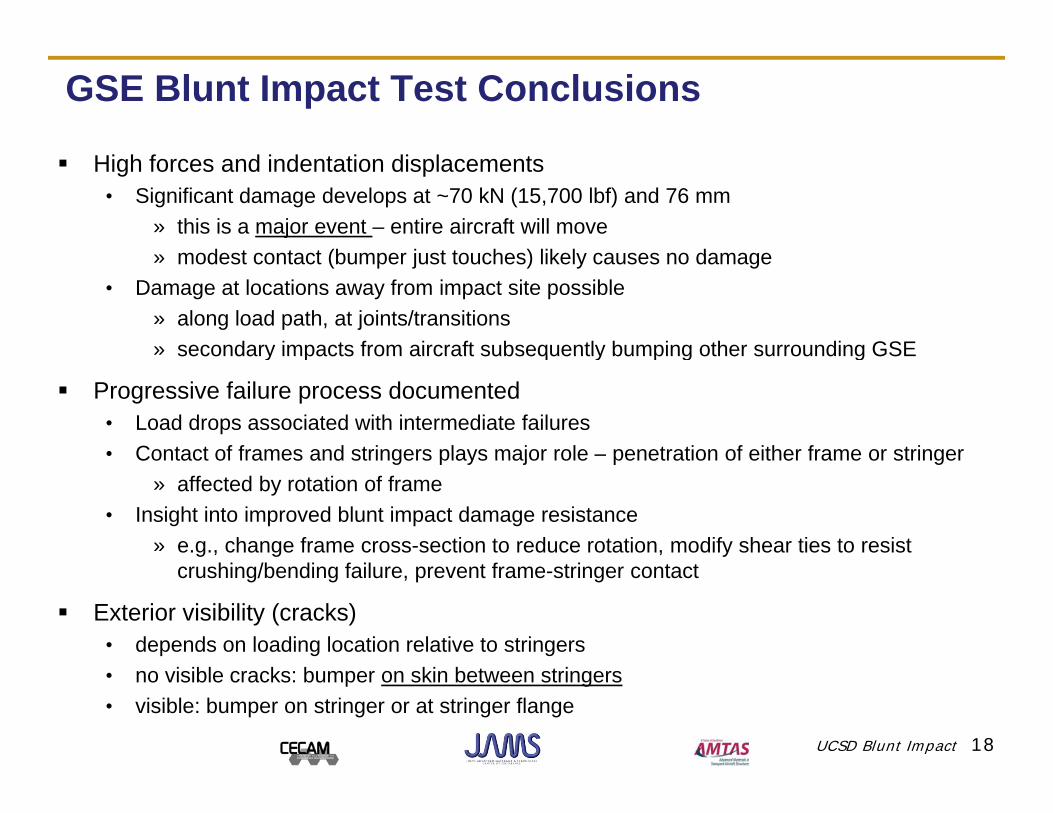
Department of Structural EngineeringGSE Blunt Impact Test Conclusions
High forces and indentation displacements• Significant damage develops at ~70 kN (15,700 lbf) and 76 mm
» this is a major event – entire aircraft will movemodest contact (b mper j st to ches) likel ca ses no damage» modest contact (bumper just touches) likely causes no damage
• Damage at locations away from impact site possible» along load path, at joints/transitions» secondary impacts from aircraft subsequently bumping other surrounding GSEsecondary impacts from aircraft subsequently bumping other surrounding GSE
Progressive failure process documented• Load drops associated with intermediate failures• Contact of frames and stringers plays major role – penetration of either frame or stringerContact of frames and stringers plays major role penetration of either frame or stringer
» affected by rotation of frame• Insight into improved blunt impact damage resistance
» e.g., change frame cross-section to reduce rotation, modify shear ties to resist crushing/bending failure, prevent frame-stringer contact
Exterior visibility (cracks)• depends on loading location relative to stringers• no visible cracks: bumper on skin between stringers• visible: bumper on stringer or at stringer flange
UCSD Blunt Impact 18

Department of Structural EngineeringPrediction Methodologies Overview
Reduced Order 2DOF
- Estimate Contact Force
Able to Rapidly= Explore Wide Range
of Parameters
Easier to Use+
Lower Cost & Indentation Displacement
- Damage Thresholds
e
Energy & Momentum Balance
- Estimate Failure Modesase
of U
se
Elastic Static FEA- Damage Initiation
- Estimate Final D O t
Ea
FEA will also validate andHigh Fidelity Explicit
Dynamic FEA- Complete Simulation- Damage Progression
Damage OnsetFEA will also validate and confirm assumptions of
simple models
19
Damage Progression- Final Damage State
Model Complexity and Computational Cost
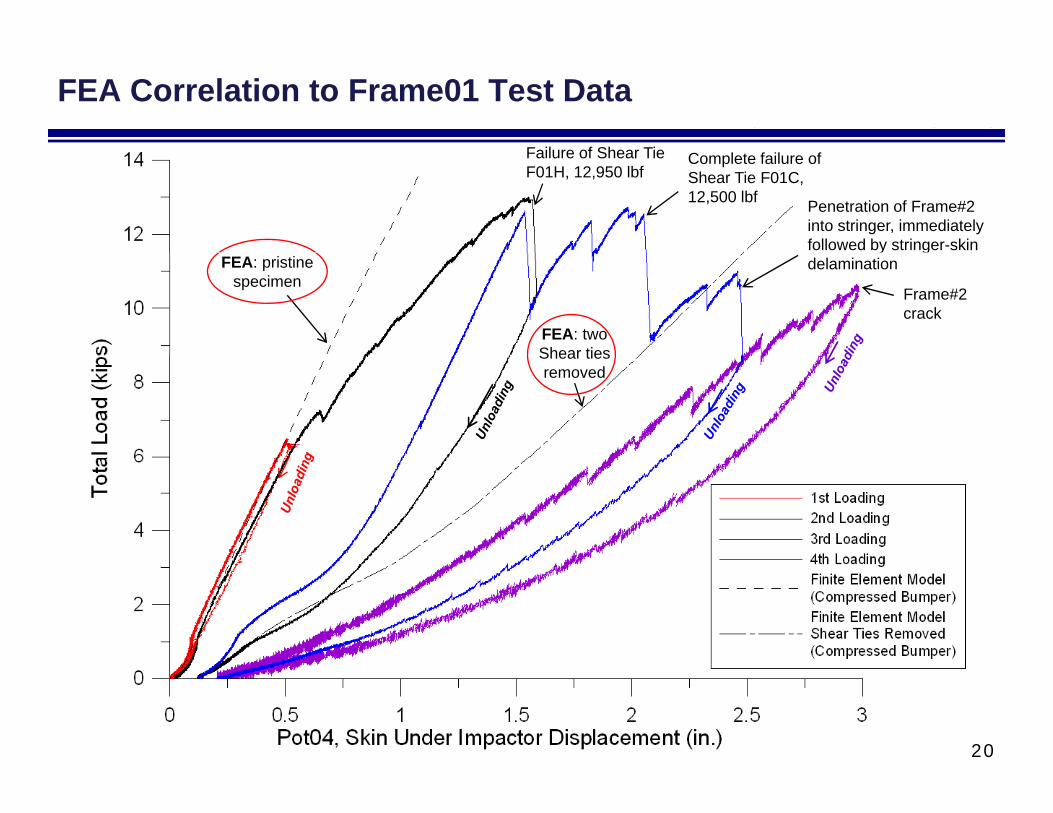
Department of Structural EngineeringFEA Correlation to Frame01 Test Data
Failure of Shear Tie Complete failure of Shear Tie F01C, 12,500 lbf Penetration of Frame#2
into stringer, immediately followed by stringer-skin
Failure of Shear Tie F01H, 12,950 lbf
FEA: two Shear ties
FEA: pristine specimen
y gdelamination
Frame#2 crack
Shear ties removed
20

Department of Structural Engineering
Estimation of Absorbed Energy for Contact Across Two Frames
Failure of Shear Tie Complete failure of Shear Tie F01C, 12,500 lbf Penetration of Frame#2
into stringer, immediately followed by stringer-skin
Failure of Shear Tie F01H, 12,950 lbfAbsorbed Energy
1150 J to Sever Stringers1990 J to Crack Frame
F il
FEA: two Shear ties
FEA: pristine specimen
y gdelamination
Frame#2 crack
FailureThreshold
Shear ties removed
21

Department of Structural EngineeringComparison to Field Observations
2 5
3
6
TUG Belt Loader Approaching B757
1.5
2
2.5
ity (m
/s)
4
ty (m
ph)
0.5
1Velo
ci
2Ve
loci
10 cm(3.9 in.)
4 2 0Position (m)
0 0
TUG vehicle weight: 3,030 kg (6,680 lb)
Velocities as high as 1 m/s (2.2 mph) are realistic within close proximity of the aircraft
R li ti l it 0 25 t 1 / (0 6 t 2 2 h)
22
- Realistic velocity range: 0.25 to 1 m/s (0.6 to 2.2 mph)
ex. kinetic energy = 1,515 J at 1 m/s (1,117 ft-lbf)

Department of Structural EngineeringReduced Order Models
Full Aircraft Impacted byGSE with InitialVelocity vo
Rigid BodyRepresentation
2DOF ModelRepresentation
ndin
g G
ear
Stif
fnes
sLa
n S
Meff defined via inertial equivalence about aircraft c.g.
total mass M- total mass MAC- rotational inertia IAC
2DOF Model Parameters: vo = GSE velocity at impact
23
MGSE = mass of GSE
kc = contact stiffness
Meff = effective mass
keff = effective stiffness

Department of Structural Engineering
Damage Occurrence PredictionDid Event Cause Damage? Yes or No
Contact StiffnessZone 1
Explore key parameters: MGSE vo kc
GSE threat (MGSE and vo) externally-defined, mostly independent of aircraft
Zone 2Zone 3Zone 4
...
Contact stiffness kc (most complex term)• determine via models and experiments• establish as zones for various aircraft locations
Design oriented curves to assess threat vs prospect Design-oriented curves to assess threat vs. prospect for creating damage
• based on critical force or indentation failure thresholds known from experiments on panel
ispecimens
Velocity contours for 48.95 kN threshold force
Failure ThresholdsEstablished WithinEach Zone Based on- Impactor Geom.- Internal Structure
10,000 kg20 000 kg
MGSE =1000 kg
3000 kg...
24
20,000 kg
Department of Structural Engineering
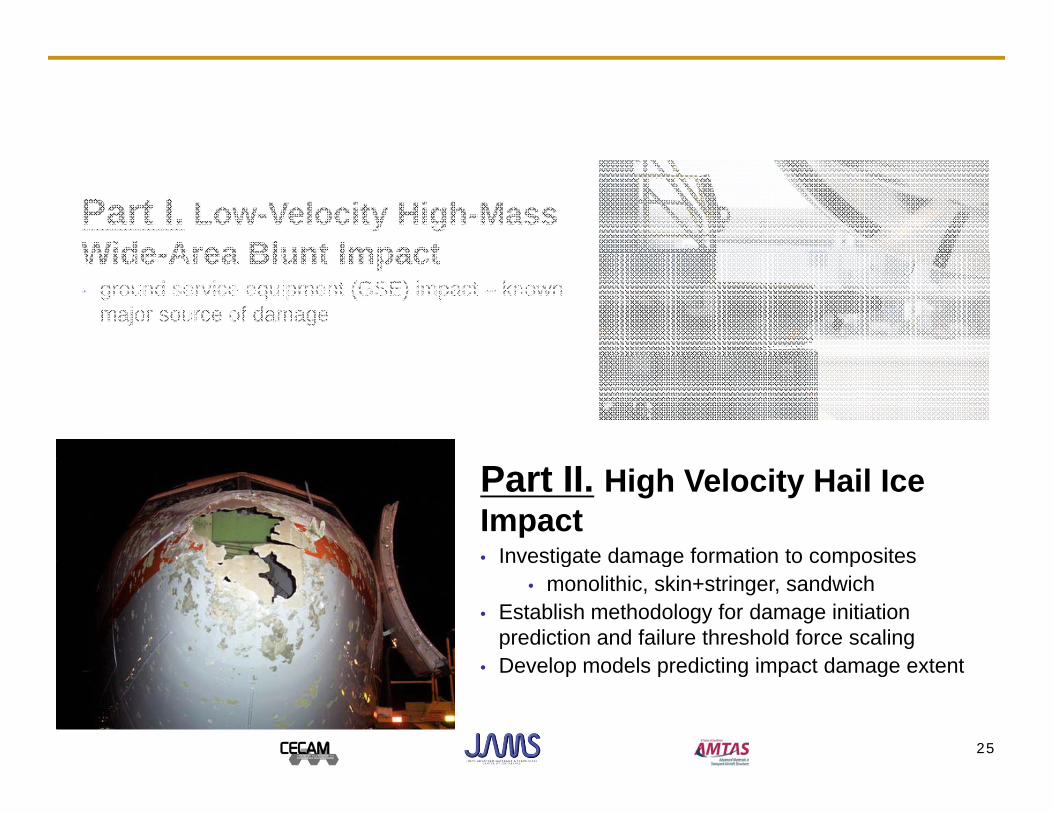
Part I. Low-Velocity High-Mass Wide Area Blunt ImpactWide-Area Blunt Impact• ground service equipment (GSE) impact – known
major source of damage
Part II. High Velocity Hail Ice Impact• Investigate damage formation to compositesInvestigate damage formation to composites
• monolithic, skin+stringer, sandwich• Establish methodology for damage initiation
prediction and failure threshold force scalingDevelop models predicting impact damage extent
25
• Develop models predicting impact damage extent

Department of Structural EngineeringIce Impact Activity Overview Experimental: Experimental:
• damage resistance of Toray T800/3900-2 unidirectional tape» 1.59 to 4.66 mm thick quasi-isotropic panels
• high velocity ice sphere impact
61 mm Iceat 72 m/s
» 38.1, 50.8, and 61 mm diameter• established failure threshold energy (FTE) and failure threshold velocity (FTV) t = 0 s
61 mm Ice FTE Regression Data Fit
• normal and glancing (20 to 40°) impact on monolithic» stringer-stiffened panels to be investigated in summer/fall 2011
t = 200 s
• Sandia Lab collaboration – advanced NDI to detect and image damage state
Modeling – seeking to establish prediction capability for:• onset of delamination – cohesive zone elements in explicit/dynamic FEA
t t f d (d l i ti fib f il )• extent of damage (delamination + fiber failure)• skin-stringer interaction and damage under ice impact – normal, glancing
26t = 700 s

Department of Structural EngineeringFEA Results – Normal Impact
FTV FEA V lPanel Type(Thickness)
SHI Diameter
FTV Experimental Value(10% Threshold)
[m/s]
FTV FEA Value(average)[m/s]
8 ply (1 59 mm)38.1 mm 115 10750 8 mm 91 92
Failure ThresholdExperimentsand ModelingResults Summary:
8 ply (1.59 mm) 50.8 mm 91 9261.0 mm 65 87
16 ply (3.11 mm)38.1 mm 154 16550.8 mm 121 13761 0 mm 96 125
Model Details:
61.0 mm 96 125
24 ply (4.66 mm)38.1 mm 178 20550.8 mm 154 17261.0 mm 127 152
Ice Model• UCSD-developed ice projectile model (UCSD
MS Thesis – Tippmann 2011)• strain rate sensitive strength
CohesiveZone Elem.
Failure
enta
tive
Valu
esB
eing
Ref
ined
strain rate sensitive strength
Composite Target Panel• solid elements – ply-by-ply layers• cohesive zone elements between layers
Te -
• all model properties from literature – no “tweaking” or parameter adjustments
27

Department of Structural Engineering
Glancing vs Normal Impact8 and 16 Ply Panels – Impact at 20° and 40° by 38.1, 50.8, & 61 mm Ice
Glancing impact (40° w.r.t. normal) Velocity: 178 m/s
• Energy: 982 J
Damage comparison: 16 ply panels (3.15 mm) impacted with 50.8mm SHI Perpendicular impact Velocity: 127 m/s
Energy: 488 JDefine ScalingRelationship• Energy: 982 J
Damage area: 4,000 mm2 Energy: 488 J
Damage area: 4,101 mm2Relationship
mpa
ct d
irect
ion
Im
Delamination shape at onset similar. Damage extent at higher velocity under investigation.
28
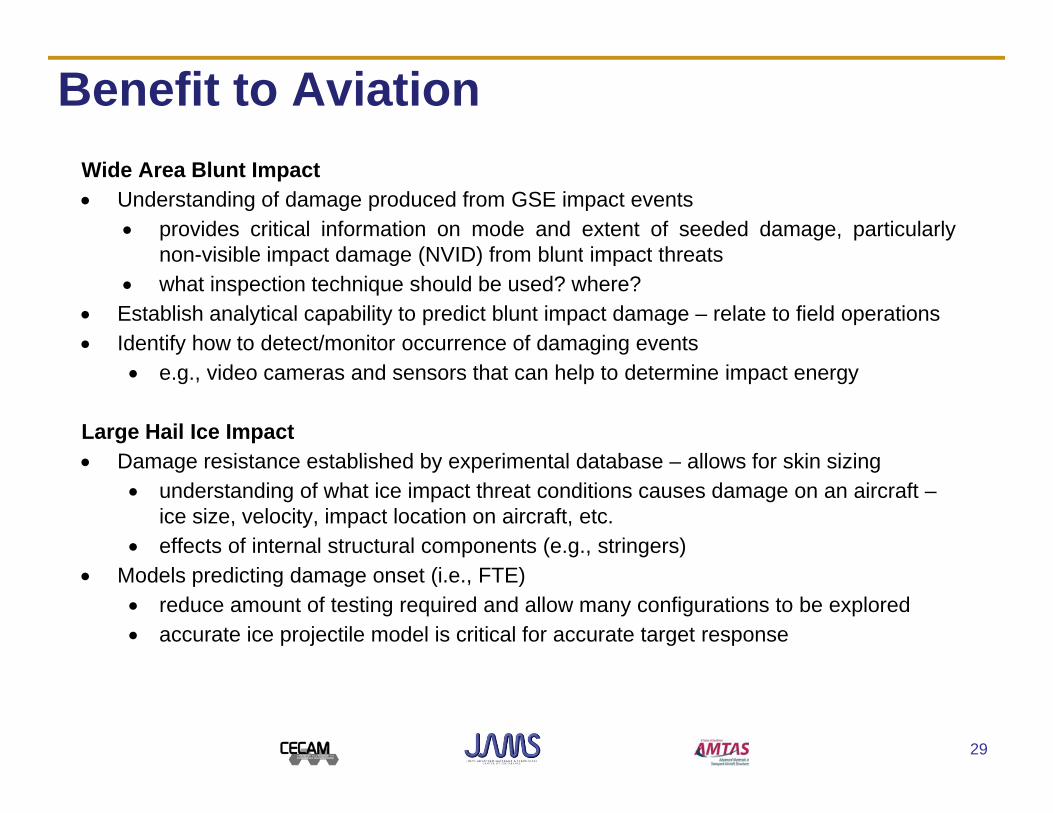
Department of Structural EngineeringBenefit to Aviation
Wide Area Blunt Impact Understanding of damage produced from GSE impact events
provides critical information on mode and extent of seeded damage, particularlynon visible impact damage (NVID) from blunt impact threatsnon-visible impact damage (NVID) from blunt impact threats
what inspection technique should be used? where? Establish analytical capability to predict blunt impact damage – relate to field operations Identify how to detect/monitor occurrence of damaging events
e.g., video cameras and sensors that can help to determine impact energy
Large Hail Ice ImpactDamage resistance established by experimental database allows for skin sizing Damage resistance established by experimental database – allows for skin sizing understanding of what ice impact threat conditions causes damage on an aircraft –
ice size, velocity, impact location on aircraft, etc. effects of internal structural components (e.g., stringers)
Models predicting damage onset (i.e., FTE) reduce amount of testing required and allow many configurations to be explored accurate ice projectile model is critical for accurate target response
29

Department of Structural EngineeringLooking Forward – Ongoing/Future Plans Conduct dynamic blunt impact experiments
• completion of Phase I “StringerXX” panels loaded by D-bumper• Phase II large frame specimens 4 bays/5 frames loaded with cylindrical rubber bumper• relation between quasi-static indentation vs dynamic impactrelation between quasi static indentation vs dynamic impact
Developing high fidelity FEA modeling capability• predict damage initiation, progressive failure process, damage extent , energy
absorptionl ti t l l t t lt d ti ll d t» correlation to large panel test results and supporting small coupon data
• effective representation of delamination – implementation into shell-based models Developing reduced order models
• estimate damage onset for wide parameter range: GSE mass, velocity, impact locationest ate da age o set o de pa a ete a ge GS ass, e oc ty, pact ocat o» based on critical force and energy threshold
• relate test results to GSE field operations Investigate glancing impacts effects
d fi li l ti hi i t d l• define scaling relationships via momentum and angle• moving contact area – e.g., pushing across multiple stringers
Consideration other primary structure types – e.g., wing, tail Hail ice-specific: investigate damage resistance and damage morphology ofHail ice specific: investigate damage resistance and damage morphology of
sandwich construction and stiffened skin Education/Training: dissemination of results, workshops
30

Department of Structural Engineering
End of Presentation.
Thank youThank you.
31


