Impact Assessment on European Electricity Balancing · PDF fileImpact Assessment on European...
135
Impact Assessment on European Electricity Balancing Market Final Report March 2013 Contract EC DG ENER/B2/524/2011
-
Upload
nguyentruc -
Category
Documents
-
view
223 -
download
2
Transcript of Impact Assessment on European Electricity Balancing · PDF fileImpact Assessment on European...

Impact Assessment on European Electricity Balancing Market
Final Report
March 2013
Contract EC DG ENER/B2/524/2011


299949 TRD EFR 01 E
PiMS/299949/EU Balancing Market/Reports/Issued Reports
28 March 2013
Impact Assessment on European Electricity Balancing Market
Final Report
March 2013
Contract EC DG ENER/B2/524/2011
Mott MacDonald, Victory House, Trafalgar Place, Brighton BN1 4FY, United Kingdom
T +44(0) 1273 365 000 F +44(0) 1273 365 100, W www.mottmac.com


Impact Assessment on European Electricity Balancing Market
Mott MacDonald, Victory House, Trafalgar Place, Brighton BN1 4FY, United Kingdom
T +44(0) 1273 365 000 F +44(0) 1273 365 100, W www.mottmac.com
Revision Date Originator Checker Approver Description
A 30 March 2012 Nick Frydas, Konrad Borkowski, Goran Strbac
Guy Doyle Guy Doyle
B 29 May 2012 Nick Frydas, Konrad Borkowski, Goran Strbac
Guy Doyle Guy Doyle
C
15 June 2012
Nick Frydas, Konrad Borkowski, Goran Strbac, Peter Fritz, Niklas Damsgaard, Len Borjeson
Guy Doyle
David Holding
D 31 August 2012 Nick Frydas, Konrad Borkowski, Goran Strbac
Guy Doyle David Holding
E 07 September 2012Nick Frydas, Konrad Borkowski, Goran Strbac,
Guy Doyle David Holding
F 15 January 2013 Nick Frydas, Konrad Borkowski, Goran Strbac, Jakob Helbrink, Niklas Damsgaard, Len Borjerson, Peter Styles
Guy Doyle David Holding
G 28 March 2013 David Holding, Nick Frydas, Guy Doyle
David Holding
Issue and revision record
This document is issued for the party which commissioned it
and for specific purposes connected with the above-captioned
project only. It should not be relied upon by any other party or
used for any other purpose.
We accept no responsibility for the consequences of this
document being relied upon by any other party, or being used
for any other purpose, or containing any error or omission which
is due to an error or omission in data supplied to us by other
parties.
This document contains confidential information and proprietary
intellectual property. It should not be shown to other parties
without consent from us and from the party which
commissioned it.


299949/TRD/EFR/01/E 28 March 2013 PiMS/299949/EU Balancing Market/Reports/Issued Reports
Impact Assessment on European Electricity Balancing Market
Chapter Title Page
Glossary - Definitions i
Executive Summary i
1. Introduction 1
1.1 Background __________________________________________________________________________ 1
1.2 Basis for the Study ____________________________________________________________________ 3
1.3 Report Structure ______________________________________________________________________ 4
1.4 Required level of understanding for reading this report ________________________________________ 5
2. European System Control & Balancing – Problem Definition 6
2.1 Problem definition _____________________________________________________________________ 6
2.2 Integration of renewable energy sources ___________________________________________________ 7
2.3 Lack of competition under the existing national Balancing Market arrangements___________________ 11
2.4 Market distortions ____________________________________________________________________ 12
2.5 Security of Supply ____________________________________________________________________ 13
2.6 The mechanics and products to maintain System Control and security in European Power Systems ___ 14
2.7 Conclusion __________________________________________________________________________ 15
3. Key design elements in cross border balancing markets - Recommendations 16
3.1 Capturing benefits from cross-border integration of balancing markets __________________________ 16
3.2 Role, responsibilities and incentives of TSO in cross-border balancing __________________________ 16
3.3 Procurement and remuneration of Balancing Services - ensuring cost reflective imbalance prices,
allocation of capacity payments _________________________________________________________ 19
3.4 Ensuring cost-reflective imbalance prices: allocation of energy payments - "one-price" versus "two-
price" systems _______________________________________________________________________ 25
3.5 Other Balancing Market design attributes - linkages with intra-day markets _______________________ 31
3.6 Harmonisation issues _________________________________________________________________ 34
3.7 Reservation and use of cross border capacity for Balancing Services ___________________________ 38
3.8 Integration of demand side into balancing markets __________________________________________ 42
4. Quantitative Analysis – Benefits of Balancing Markets Integration 44
4.1 Overview and underlying Principles ______________________________________________________ 44
4.2 Modelling analysis of welfare gains from trading Balancing Energy using historical data (2011) from
the GB – France systems ______________________________________________________________ 45
4.2.1 Data and modelling assumptions for the UK _______________________________________________ 46
4.2.2 Data and modelling assumptions for France _______________________________________________ 49
4.2.3 Description of scenarios _______________________________________________________________ 50
All other bids/offers were assumed to be made available for trade under CMO list _________________ 52
4.2.4 Trading with Margins __________________________________________________________________ 52
4.2.5 Results ____________________________________________________________________________ 53
4.2.5.1 Projected benefits from trading under CMO and “Surpluses” cases _____________________________ 55
4.2.5.2 Pattern of trading _____________________________________________________________________ 55
4.3 Time series analysis utilising “aggregated data” ____________________________________________ 60
4.4 Analysis of the Nordic countries Balancing Markets _________________________________________ 64
Content

299949/TRD/EFR/01/E 28 March 2013 PiMS/299949/EU Balancing Market/Reports/Issued Reports
Impact Assessment on European Electricity Balancing Market
4.4.1 Background – Data utilised _____________________________________________________________ 64
4.4.2 Methodology ________________________________________________________________________ 65
4.4.3 Conclusion & discussion _______________________________________________________________ 68
4.5 Assessing the benefits of Exchanging short term operating reserves and cross-border balancing in
systems with increased penetration of intermittent wind generation _____________________________ 69
4.5.1 Objectives __________________________________________________________________________ 69
4.5.2 Approach ___________________________________________________________________________ 70
4.5.3 System parameters and assumptions ____________________________________________________ 71
4.5.4 Case studies & Key results _____________________________________________________________ 73
4.6 Assessing the benefits of Exchanging & Sharing Reserve Services cross-border in future (2030) EU
electricity system _____________________________________________________________________ 76
4.7 Conclusions of the Quantitative Analysis __________________________________________________ 81
5. Qualitative analysis of key policy options 83
5.1 Cross border exchanges of Balancing Energy and Balancing Reserves _________________________ 83
5.2 Common Merit Order List - CMOL _______________________________________________________ 84
5.3 Netting of Imbalances _________________________________________________________________ 85
5.4 Exchange of Replacement Reserves _____________________________________________________ 87
5.5 Exchange of Frequency Restoration Reserves _____________________________________________ 89
5.6 Cross-border exchanges of contracted Reserves ___________________________________________ 89
5.7 Assessing the four Policy Options _______________________________________________________ 89
5.7.1 A description of the four Policy Options ___________________________________________________ 90
5.7.2 Operational challenges of Policy Options – Security of Supply _________________________________ 91
5.7.3 Harmonization issues – Products, Procedures, Gate Closures, Hardware/Software ________________ 94
5.8 Implementation Roadmap & Costs of various policy options ___________________________________ 96
6. Conclusions and Recommendations 99
Appendices 101
Appendix A. Validation of models _________________________________________________________________ 102
Appendix B. Systems control approach and definitions ________________________________________________ 109
• B.1 System Control methodologies and products __________________________________________ 109
• B.1.1 European TSO policies in System Control ___________________________________________ 110
• B.1.2 Markets for Balancing Services ____________________________________________________ 113
Appendix C. List of References ___________________________________________________________________ 116
Tables
Table 3.1: Allocation of Capacity Payments via the imbalance price _____________________________________ 23
Table 3.2: Imbalance settlement through a typical one-price system _____________________________________ 26
Table 3.3: Imbalance settlement through a typical two-price system _____________________________________ 26
Table 3.4 List of harmonisation pre-requisites for two models of XB – balancing ___________________________ 38
Table 4.1: Regression Results for France __________________________________________________________ 61
Table 4.2: Regression Results for UK _____________________________________________________________ 61
Table 4.3: GDP Deflators _______________________________________________________________________ 63
Table 4.4: Installed capacities of conventional plant __________________________________________________ 71
Table 4.5: Cost characteristics of conventional plant _________________________________________________ 71
Table 4.6: Key dynamic parameters of the plant _____________________________________________________ 71
Table 4.7: Average volumes of hourly imbalances in GWh/h for different levels of wind penetration and different

299949/TRD/EFR/01/E 28 March 2013 PiMS/299949/EU Balancing Market/Reports/Issued Reports
Impact Assessment on European Electricity Balancing Market
capacities available for sharing of balancing resources (0GW, 2GW, 5GW and 10GW) _____________ 75
Table 4.8: Ranges of annual savings (m€/annum) that can be made from sharing of balancing resources _______ 75
Table 4.9: Ranges of wind uncertainty cost (m€/annum) ______________________________________________ 76
Table 4.10: Fuel price assumptions in 2030 _________________________________________________________ 78
Figures
Figure 2.1: Projected maximum “Power Ramps” required by German intermittent RES-E ______________________ 8
Figure 2.2: Projected requirements for short term Operating Reserve, and increase of BS requirements in the GB
system ______________________________________________________________________________ 9
Figure 2.3: Required capacities for short-term adjustments as a function of installed wind power capacity (MW) ___ 10
Figure 2.4: Correlation of two wind parks depending on the distance of the wind parks and time of forecast ______ 10
Figure 2.5: Imbalance as a market outcome – TSO control target ________________________________________ 11
Figure 2.6: Improved “equilibrium” as a result of markets integration _____________________________________ 12
Figure 3.2: Split of Reserve obligations ____________________________________________________________ 21
Figure 3.4: Joint optimisation of balancing capacities and intraday market ________________________________ 33
Figure 3.5: Different Institutional Frameworks for Imbalance management _________________________________ 36
Figure 4.2: Historical volume weighted imbalance price (€/MWh) ________________________________________ 48
Figure 4.4: Average price for the upward regulation offers that have been reserved for domestic use under the
‘margins scenario’ ____________________________________________________________________ 52
Figure 4.5: Average price for the downward regulation bids that have been reserved for domestic use under the
‘margins scenario’ ____________________________________________________________________ 53
Figure 4.6: Annual benefits from trading balancing energy _____________________________________________ 54
Figure 4.7: Trading benefits by month for the unconstrained and trading with surpluses cases _________________ 54
Figure 4.9: The annual volumes of balancing products traded under the unconstrained trade scenario __________ 56
Figure 4.10: The annual volumes of balancing products traded under the unconstrained trade scenario __________ 57
Figure 4.12: The monthly volumes of balancing products traded under the trade of surpluses scenario ___________ 58
Figure 4.13: The annual volumes of balancing products traded under the trade of surpluses scenario ____________ 58
Figure 4.14: Share of French balancing demand obtained from trade under the surpluses trade scenario _________ 59
Figure 4.15: Share of UK balancing demand obtained from trade under the surpluses trade scenario ____________ 59
Figure 4.16: Model Predicted versus observed balancing prices France____________________________________ 62
Figure 4.17: Model Predicted versus observed balancing prices UK _______________________________________ 63
Figure 4.19: Provision of response services __________________________________________________________ 72
Figure 4.20: Range of possible hourly imbalance volumes: minimum (left) and maximum (right), in case shared
balancing capacity T=0GW, T=2GW, T=5 GW and T=10GW __________________________________ 74
Figure 4.21: EU system topology used in the study ____________________________________________________ 77
Figure 4.22: Assessing the benefits of sharing reserve across EU regions in future systems with significant
contribution of renewable generation _____________________________________________________ 78
Figure 4.23: Short term variability of wind: benefits of an EU wide balancing perspective ______________________ 80
Figure 5.2: Avoidance of counteracting SCR activation – Reduction of secondary control energy. Cheaper control
energy due to the merit order ranking ____________________________________________________ 86
Figure 5.3: Improved Operational Planning on intra-day basis – lower amounts of reserve ____________________ 88
Figure 6.1: The cost of meeting upward regulation in the UK __________________________________________ 102
Figure 6.2: The ratio of RMSE to average balancing price (UK) ________________________________________ 104
Figure 6.3: The ratio of MAE to average balancing price (UK) __________________________________________ 105
Figure 6.4: The cost of meeting upward regulation in France __________________________________________ 106
Figure 6.5: The cost of meeting downward regulation in France ________________________________________ 106
Figure 6.6: The ratio of RMSE to average balancing price (France) _____________________________________ 107
Figure 6.7: The ratio of MAE to average balancing price (France) ______________________________________ 108
Figure B.1: Different kinds of Reserve and Sourcing _________________________________________________ 111

299949/TRD/EFR/01/E 28 March 2013 PiMS/299949/EU Balancing Market/Reports/Issued Reports
Impact Assessment on European Electricity Balancing Market
Figure B.3: Characteristics of Reserves ___________________________________________________________ 115

299949/TRD/EFR/01/E 28 March 2013 PiMS/299949/EU Balancing Market/Reports/Issued Reports
i
Impact Assessment on European Electricity Balancing Market
ACER Agency for the Co-operation of Energy Regulators, as established by Regulation (EC) No 713/2009.
ACE Area Control Error. instantaneous difference between the actual and the reference value (measured total power value and scheduled control program) for the power interchange of a Control Area (inadvertent deviation), taking into account the effect of the frequency bias for that Control Area according to the network power frequency characteristic of that Control Area and the overall frequency deviation.
AGC Automatic Generation Control
Annual report
Report to be published by ENTSO-E on a yearly basis, in accordance with Section 2.5 of these Framework Guidelines.
APX Amsterdam Power Exchange (APX) is an international power and gas exchange on which acknowledged market parties trade energy. The APX settles the Dutch day-ahead spot market.
Balancing All actions and processes through which TSOs ensure that total electricity withdrawals are equalled by total injections in a continuous way, in order to maintain the system frequency within a predefined stability range.
Balancing Energy - BE Balancing Energy - energy (MWh) activated by TSOs to maintain the balance between injections and withdrawals
Balancing Market - BM Balancing “Market” – the entirety of institutional, commercial and operational arrangements that establish market-based management of the function of System Balancing within the framework of a liberalised electricity market, and that consists of three main parts:
Balance responsibility,
Balancing services provision, and
imbalance settlement
The vehicle the TSO uses to balance the system in real-time in order to ensure system security. In this market contracted Balancing Reserves on a compulsory basis plus any other qualified parties (BSPs) on a voluntary basis provide physical energy Offers/Bids for upward and downward regulation of their energy input/output into the system. Those Offers/Bids constitute a “price ladder” and are accepted/called by the TSO according to its technical requirements and on the basis of a merit order
Balancing Services - BS Balancing reserves or balancing energy.
Balancing Reserves – BR
or Capacities Reserves
Power capacities (MW) available for TSOs to balance the system in real time. These capacities can be contracted by the TSO with an associated payment for their availability and/or be made available without payment. Technically, Reserves can be either automatically or manually activated.
Balancing Reserves Market or Capacities Reserves Market
The market where a TSO buys reserves Capacities (MW) according to its Security Criteria in order to secure their availability and hedge against price volatility and open quarter capacity volume close quarter shortages at short term.
BRP A market participant or its chosen representative responsible for its imbalances.
BSP A market participant providing balancing services to one or several TSOs within one or several control area(s).
Bidding Zone The largest geographical area within which market participants are able to exchange energy without capacity allocation.
CA Control Area is a coherent part of a synchronous area, usually coinciding with the territory/jurisdiction of a TSO, a country or a geographical area, physically demarcated by the position of points for measurement of the interchanged power and energy to the remaining interconnected network, operated by a single System Operator, with physical loads and controllable generation units connected within the Control Area. It balances its generation directly in exchange schedules with other control areas and contributes to frequency regulation of the system as a whole.
CACM Capacity Allocation and Congestion Management
Glossary - Definitions

299949/TRD/EFR/01/E 28 March 2013 PiMS/299949/EU Balancing Market/Reports/Issued Reports
ii
Impact Assessment on European Electricity Balancing Market
CMO Common Merit Order List. A merit order “Ladder” where all Bids/Offers are shared between several TSOs and activated in price hierarchy
Consultant The consortium Mott MacDonald (UK), SWECO (Sweden), Imperial College (UK) and Stratos Energy Consulting (UK awarded the study by DG ENER
Control Power Technical means by which the TSO ensures real-time system security
Counter trading A method to relieve congestion on a border whereby TSOs buy power on one side of the congestion and sell power on the other side of the congestion. This is the financial settling of a physical congestion
Cross-border balancing Exchanges of balancing energy and/or reserves between control areas and/or between bidding zones.
Cross-border (Transmission) Capacity
A capacity to transfer the energy from one congestion management bidding zone to another one.
CY
DK1
DK2
Calendar Year
Denmark Region 1
Denmark Region 2
Day Ahead market The Day Ahead market (sometimes called the Spot market) is the market in which parties can submit bids and offers to secure energy and sometimes also capacity for delivery on the following day.
Demand Side Response - DSR
Changes in electric usage by end-use consumers from their normal load patterns in response to changes in electricity prices and/or incentive payments designed to adjust electricity usage, or in response to the acceptance of the consumer’s bid, including through aggregation.
EC/DG ENER The contracting authority awarding this project
EEX European Energy Exchange (EEX) is an international power and gas exchange on which acknowledged market parties trade energy. The EEX settles the German day-ahead spot market.
Energy price Volume price per MWh of electricity per trading period
ENTSO-E European Transmission System Operators for Electricity
EPS European Power System
EU European Union
Ex-post trading Trading scheme where parties can trade open positions after real time to adjust their imbalances in the final settlement
FCR Frequency Containment Reserve - operating reserves necessary for constant containment of frequency deviations (fluctuations) from nominal value in order to constantly maintain the power balance in the whole synchronously interconnected Transmission System. Activation of these reserves results in a restored power balance at a frequency deviating from nominal value. This includes operating reserves with the activation time typically of 30 seconds (depending on the specific requirements in the ENTSO-E regions). Operating reserves of this category are usually activated automatically and locally.
FG Framework Guidelines
Forward Markets “Forward Markets” refers to timeframes prior to the day-ahead phase (e.g. monthly, quarterly, yearly, multi-yearly periods)
FRR Frequency Restoration Reserves - operating reserves necessary to restore frequency to the nominal value and power balance to the forecast value after a sudden system imbalance. This category includes operating reserves with an activation time typically up to 15 minutes (depending on the specific requirements of the ENTSO-E regions). Operating reserves of this category are typically activated centrally and can be activated automatically or manually.

299949/TRD/EFR/01/E 28 March 2013 PiMS/299949/EU Balancing Market/Reports/Issued Reports
iii
Impact Assessment on European Electricity Balancing Market
Gate Closure Deadline for the participation to a given market or mechanism by providing Technical Data and Commercial Data regarding its schedule and prices to either the TSO or Market Operator, as the case may be. For a particular Market Trading Period (this could refer to the Day-ahead-Market, the intra-day market or even the Balancing Market. In the majority of cases this is 60 minutes ahead of “real-time” operations (H-1)
Gate Closure time Deadline for the participation to a given market or mechanism.
GB Great Britain only market
ICT Information and Communication Technology
IEM Internal Energy Market in Europe
IIA Initial Impact Assessment
Imbalances Deviations between generation, consumption and commercial transactions (in all timeframes – commercial transactions include sales and purchases on organised markets or between BRPs) of a BRP within a given imbalance settlement period.
Imbalance of Control Area The imbalance of the Control Area is the difference between the measured cross border power exchanges and the scheduled exchanges before control power activation.
Intraday market Market timeframe beginning after the day-ahead gate closure time and ending at the intraday gate closure time, where commercial transactions are executed prior to the delivery of traded products.
Intra-day Gate Closure Gate Closure the point in time when energy trading for a Bidding Zone is no longer permitted for a given Market Time Period within the Intraday Market. There is one Intraday Energy Gate Closure Time for each Market Time Period per Bidding Zone. The Intraday Energy Gate Closure Times shall be after or at the same time as the Cross Zonal Intraday Gate Closure Time
Imbalance settlement A financial settlement mechanism aiming at charging or paying BRPs for their imbalances.
Imbalance settlement Period Time unit used for computing BRPs’ imbalances.
Marginal Price Highest accepted price in a market auction, or sometimes a volume weighted average of a set of prices. Marginal pricing also known as uniform price model, when marginal prices arise from collecting all bids for a specified control action and determining a uniform average price for all suppliers of control power.
MEL Maximum Export Limit
Merit order In the balancing markets a merit order list is a list of all valid balancing bids submitted by BSPs and sorted in order of their bid prices.
MS Member State of the EU
N-1 criterion
NOIS
A rule according to which elements remaining in operation after a Fault of Transmission System element must be capable of accommodating the new operational situation without violating Operational Security Limits.
Activisation optimisation programme of the balancing market
NRAs National Regulatory Authorities according to the interpretation of Chapter IX of Directive 2009/72/EC.
NRV Netzregelverbund, combination of four German control areas into a single virtual control area.
NSG North Sea Grid
Operational Reserves Operational reserves available for maintaining the planned power exchange and for guaranteeing secure operation of the Transmission System.
Operational Security The ability of power system to maintain the system within acceptable operating limits (thermal, voltage and stability limits)

299949/TRD/EFR/01/E 28 March 2013 PiMS/299949/EU Balancing Market/Reports/Issued Reports
iv
Impact Assessment on European Electricity Balancing Market
Pay-as-bid Also known as discriminatory pricing. In a pay-as-bid pricing model all suppliers of control power receive the price included in their individual bids when called to supply control power.
PCR Primary Control Reserve. Local automatic control system which delivers reserve power to counter frequency change. Equivalent to Frequency Containment Reserves (FCR) under new ENTSO-E terminology.
Programme Time Unit Time unit used for scheduling and programs.
PTU Program Time Unit, which is used for Scheduling & Settlement of the “Programs” of the European Market Participants and can be 15 mins, 30 mins or 1 hour depending on national market design characteristics.
Re-dispatch Re-dispatch involves deviation from normal stroke scheduled dispatch operations when there are physical or technical limits or constraints on transmission lines.
Replacement Reserves - RR Operating reserves used to restore the required level of operating reserves to be prepared for a further system imbalance. This category includes operating reserves with activation time from 15 minutes up to hours.
RES-E Renewable Energy Sources producing electricity
Reservation of cross-border transmission capacity
A portion of available cross-border capacity which is reserved for cross-border exchange of balancing reserves and thus is not accessible to market participants for cross-border energy trade.
SCR Secondary Control Reserve. Centralized automatic control which delivers reserve power in order to replace the need for FCR and bring interchange programs to their target values. Equivalent to Frequency Restoration Reserves (FRR) under new ENTSO-E terminology.
Security of Supply Security of Supply is ensured through the security of the frequency and voltage (including reserves), short term balancing planning, testing of ancillary services, balance management, demand forecast
SEL Stable Export Limit for a Generating unit
Settlement Involves the ex-post attribution of imbalances to different Balance Responsible Parties. Once attribution is done, the TSO (or another third party who undertakes the role of clearing the market) invoices BRPs for the net cost of its own imbalance
Settlement or "cash-out" price The price at which BRPs are charged for imbalances. There can be one uniform price, two or (double cash-out) prices or even in some systems up to four prices; depending whether the BRP itself was long or short and whether the system overall required upwards or downwards regulation for that settlement period
Settlement Period The time during which the difference (imbalance) between contracted and actual load is measured. 15, 30 and even 60 minutes are used in some markets
SoS standards Those operational system security technical standards as defined in the Operational Security Network Code.
System Balancing All actions and processes (starting from assessing, planning, procuring all the way to real-time operations) through which TSOs ensure that the total electricity withdrawals are equalled by the total injections in a continuous way, in order to maintain the system frequency within a predefined stability range
System Control TSOs are required to ensure system stability by controlling adequacy of power and ancillary services, voltage levels and frequency levels
System Operation System operation includes monitoring, data exchange, states of system operation, training, safety coordination, emergency procedures and investigation
System Security The ability of the power system to withstand unexpected disturbances or contingencies
System Services Such Balancing Services secured by the TSO from BSPs, which benefit all Users of the system. FCR (PCR), FRR (SCR) and Reactive power control are referred to as System Services and their cost is socialised and recovered through the grid tariffs.
System Stability System Stability is defined by the acceptable operating boundaries of the Transmission System in terms of respecting of the constraints of Voltage Stability, Small Disturbance Angle Stability and Transient Stability.

299949/TRD/EFR/01/E 28 March 2013 PiMS/299949/EU Balancing Market/Reports/Issued Reports
v
Impact Assessment on European Electricity Balancing Market
TCR Tertiary Control Reserve. Manual change in the dispatching and unit commitment in order to restore the secondary control reserve, to manage potential congestions, and to bring back the frequency and the interchange programs to their target if the secondary control reserve is not sufficient. Equivalent to Replacement Reserves (RR) under new ENTSO-E terminology.
TSO Transmission System Operator as defined under Chapter IV of the European Directive 2009/72/EC
XB – BE/BR/BS Cross Border – exchanges of Balancing Energy, Balancing Reserves and/or Balancing Services

299949/TRD/EFR/01/E 28 March 2013 PiMS/299949/EU Balancing Market/Reports/Issued Reports
i
Impact Assessment on European Electricity Balancing Market
Energy Policy in Europe is driving the power sector towards a new paradigm on how the European Power
System of the future will be structured and operated. This is largely as a result of EU Member States
increasing deployment of intermittent renewable energy sources to deliver the targets formulated in the
European Renewables Directive of 2009, but also changes in the pattern, profile and predictability of
electrical demand. As the installed capacity of intermittent and unpredictable generation capacity increases,
so are increased the volumes of imbalances which system operators have to deal with and as a result the
amount of control power that is required to be held grows. This may lead to a situation where costs and
technical challenges present a serious obstacle to the implementation of the EU’s sustainability policies,
whilst rendering obsolete the methodologies deployed so far for System Control and Security in a
synchronously interconnected system.
This study, commissioned by the European Commission in support of ACER’s Impact Assessment for the
development of Electricity Balancing Framework Guidelines (FG), attempts to answer a set of questions
generated around the issue of how best to develop the so far disjointed, highly concentrated and diverse
national balancing markets, into one robust integrated scheme accessible by all market participants which
seamlessly is joined to the other timeframes of the Internal Energy Market (IEM). The aim of the study is to
assess the pros and cons of different arrangements for handling cross-border exchanges of balancing
services, and seeks to quantify estimates of the various proposed models. The study utilises both empirical
information gained from European Transmission System Operators (TSOs) in the implementation of some
bilateral and regional (in some cases pilot) schemes of operating cross-border balancing arrangements, as
well as the result of a quantitative analysis built around four separate models of simulating operations with
cross-border Balancing Markets where exchanges of balancing energy and sharing of reserve capacities
can realise substantial economic benefits. The simulation results obtained provide evidence of the increase
in social welfare and facilitation of integration of intermittent generation, as a result of cross-border
integration of balancing markets.
This report is organised as following:
Chapter 1 gives the background to the issues and the basis of this study.
Chapter 2 presents the basic principles of electricity balancing in European Power Systems (EPS). It also
sets the context in terms of outlining the problems of the current balancing arrangements across the IEM
and challenges for the future EPS with high levels of renewables and reduced levels of flexible generation
plant.
Chapter 3 proposes key design elements for the future pan-European Balancing Market. This covers the
responsibilities of market participants, harmonisation pre-requisites according to the level of integration,
pricing for the settlement of imbalances, the allocation of capacity and energy costs with regards to
balancing, procurement of Balancing Services, the integration with day-ahead and intra-day markets, the
treatment of interconnection capacity and the incentivisation of demand side participation
Chapter 4 presents our quantitative analysis and results from simulating cross-border (XB) exchanges of
balancing energy and the exchanging and sharing of balancing reserves. The objective of these analyses
was to estimate the magnitude of the welfare gains available through the integration of balancing markets –
i.e. whether they are they negligible or material and the comparison benchmarking of different models of
integration.
Executive Summary

299949/TRD/EFR/01/E 28 March 2013 PiMS/299949/EU Balancing Market/Reports/Issued Reports
ii
Impact Assessment on European Electricity Balancing Market
We have applied four different approaches to determine the benefits of integrating the European Balancing
markets:
� Using historical bid/offer data and interconnector availability between France-Great Britain & the Nordic
countries (for year 2011) to model the impact of exchanging balancing energy under various modalities;
� Time series (regression) analysis of the relationship between balancing prices and market indices for
two interconnected jurisdictions (UK, France), where trading of balancing energy has been introduced;
� Modelling two similarly sized generic jurisdictions with varying levels of penetration of intermittent
generation;
� Modelling the benefits of cross-border exchanging and sharing of balancing reserves services between
member states of a projected future (2030) pan-European power system;
The results of the quantitative analysis emphatically support the view that there are significant potential
welfare benefits from allowing cross-border trading of balancing energy and the exchanging and sharing
balancing reserve services across the EU Member States (MS) borders.
Annual benefits from balancing energy trade between GB and France are potentially of the order of € 51
million. The results from the Nordic countries integrated market, demonstrate estimated annual savings of
approximately € 221 million from what would have been the case if each country operated its own “stand
alone” balancing market. The time series analysis (run for the GB and France) shows a comparable level of
benefits realised after the introduction of the “Balit Mechanism”. Our analysis included “hypothetical”
scenarios of future European Power System (c. 2030) with arrangements for cross-border trading of
balancing energy and balancing reserves. Results demonstrate significant benefits which are increasing in
correlation to the percentage of the penetration factor of wind generation and which justify the cost of
investment for enhanced interconnectivity. Integration of Balancing Markets and the exchanging and
sharing of reserves could achieve operational cost savings in the order of € 3bn/year and reduced (up to
40% less) requirements for reserve capacity Furthermore these annual trading benefits are at least one
order of magnitude higher that the “one-off” cost of implementation in IT and related systems.
Chapter 5 considers in a qualitative way the pros and cons of the different policy options for handling cross
border balancing and the practicalities of the implementation roadmap in the current European IEM
landscape. It addresses these issues in terms of impacts on security of supply, extent to which the
proposals address market distortions costs, and harmonisation requirements.
Chapter 6 presents the conclusions and the recommended course of action. The evidence points towards
an integrated model of a multilateral “TSOs to TSOs” platform for the exchange of balancing energy and
reserves based on a Common Merit Order (CMO) where “security margins” can be imposed with minimum
loss of economic efficiency. The scheme of “avoidance of counteracting secondary control” (“imbalance
netting”) could be the first step of integration where cost/benefit analysis provides the case for its
implementation.
Finally the report recommends a certain level of harmonisation on specific key design elements of a
balancing market and suggests the appropriate “building blocks” to achieve a robust design of the cross-
border balancing market. There is some evidence suggesting that ad hoc and hastily conceived schemes
may actually introduce distortions and convey a perverted economic signal.
In the span of the last 12 months, we have consulted with many industry stakeholders for the purpose of
this study. We would like to especially thank for their valuable comments, opinions and remarks the

299949/TRD/EFR/01/E 28 March 2013 PiMS/299949/EU Balancing Market/Reports/Issued Reports
iii
Impact Assessment on European Electricity Balancing Market
members of staff of Elia (Belgium), TenneT (Netherlands & Germany), Statnett, Svenska Kraftnät, Fingrid,
National Grid (UK), RTE, Energinet, ENTSO-E, EFET and EURELECTRIC with whom we interfaced.
299949/TRD/EFR/01/E 28 March 2013 PiMS/299949/EU Balancing Market/Reports/Issued Reports
1
Impact Assessment on European Electricity Balancing Market
1.1 Background
In 2007 the European Union set the ambitious goal of achieving a 20% share of renewable energy and a
10% share of renewable energy in transport by 2020 and has flanked these objectives by a series of
supporting policies. The renewable energy goal is a headline target of the Europe 2020 strategy for smart,
sustainable and inclusive growth. At the start of 2012, these policies are beginning to work and the EU is
currently on track to achieve its goals. Furthermore the EU is attempting to complete the Internal Energy
Market in Europe (IEM) by 2014 and to underpin Security of Supply and Economic Efficiency through a
liquid & competitive energy market spanning Europe. The so called "Energy Roadmap 2050" builds on the
single energy market, the implementation of the energy infrastructure package and climate objectives as
outlined in the 2050 low carbon economy roadmap. Regardless of scenario choice, the biggest share of
energy supply in 2050 will come from renewable energy.
Those three key energy policy drivers of security of supply, sustainability and economic efficiency are not
“naturally aligned vectors” under the classic framework of planning, operating and governing the European
Power Systems (EPS), in fact they require a carefully considered set of rules and governance framework in
order for divergent and contradictory strategies to be avoided. The adoption of the EC’s “Third legislative
package for the IEM” provides the legislative instruments aimed at achieving this alignment through the
establishment of ACER who eliminate the cross-border “regulatory gap”. ACER issues Framework
Guidelines, and the establishment of ENTSO-E who develops the binding Network Codes following
ACER’s guidance, as a harmonised framework of operation for all Transmission System Operators (TSOs).
Sustainability targets set by the adopted “Climate Change” policies and the Energy Roadmap as planned
for the EPS, will have as a result that short-term adjustments in the power flows (to correct for any
imbalances in real-time) will inevitably increase both in size and in frequency. Corrective action by TSOs
may have to increase, in parallel with the increasing penetration of less-predictable renewable energy
technologies, energy market liberalisation and the more active market participation of producers and
consumers. The classical approach in power system operation is that prediction errors regarding demand,
unplanned generation units’ outages and increasingly the wind forecast error, require corrective action near
to or at real-time and planned by the System Operators in order to re-establish the instantaneous
equilibrium of demand and supply.
Electricity system balancing covers all the actions and activities performed by a TSO to ensure that in a
control area, total electricity withdrawals (including losses) are equal to total injections in real time
operation. These activities, simultaneously performed in all control areas and between control areas,
contribute to ensuring the global system’s balance and stability. When national control areas are
synchronously interconnected, the physical characteristics of power flows require that national TSOs
cooperate in order to balance the entire system. As the installed capacity of intermittent generation capacity
in a control area increases, the stochastic nature of wind/solar/wave output may result in increased
volumes of imbalances which system operators have to deal with, and as a result the amount of both
response and reserve that needs to be held and the significance of such reserve and response grow.
Furthermore system operators are forced to increase (by “buying off”) the amount of plants being run part-loaded and therefore less efficiently. The situation may also lead to increases in the load factors of peaking plants due to response constraints.
1. Introduction

299949/TRD/EFR/01/E 28 March 2013 PiMS/299949/EU Balancing Market/Reports/Issued Reports
2
Impact Assessment on European Electricity Balancing Market
Present arrangements therefore under which European TSOs maintain the real-time power balance and
system control may no longer be able to reliably and efficiently cope with those increased requirements for
balancing needs and costs, which in turn may compromise the plans for achieving the sustainability targets
as System Operators will have to resort to Renewable Energy production (RES-E) curtailment if they are to
preserve System Security. It is clear that a new paradigm and a coherent methodological framework for
System Control must be adopted in line with the drastically different physical characteristics, cost structure
and attributes of the future EPS, if all three policy objectives are to be met.
The balancing mechanisms’ technical arrangements set out to ensure system stability, have important implications on competition and market prices, as procuring reserve capacities for system security and balancing energy normally entails commercial arrangements with imbalances costs levied on the market through settlement mechanisms. Furthermore the uniqueness of electricity as a commoditised product in so far as it requires the ceding of “real-time trading” to a third party (TSO), for reasons having to do with the physical characteristics of the product, does not in itself cancel the standard financial model of continuous trading, neither the economic principle that one of the fundamental attributes of a well-functioning market should be “completeness”. In other words “completeness” means to demonstrate liquidity, competitiveness, transparency and unpredictability throughout the whole range/time-horizon of market operations and transactions (forward markets, day-ahead, Intra-day, real-time or balancing market).
The comparison between the forward, day-ahead, intra-day and the balancing market today in Europe,
points towards the existence of four different markets that prevent temporal arbitrage. These multiple
arrangements violate the finance principle that forward, day-ahead, intra-day and real-time should in fact
have been just different steps of a single trading process. Because of non-storability, the physical trade of
electricity only takes place in real-time, which is thus the only true "spot market". The other markets are all
"forward markets" that trade derivatives products maturing in real-time on the spot market. This makes the
economic signal conveyed by the Balancing Market all the more important, as the real-time or imbalance
prices expected to be brought forth by this market are reflected in wholesale prices and consequently affect
market parties’ decisions at the forward stage. For this reason, electricity markets can function
efficiently when imbalance prices are market-based or cost-reflective.
Of course the above has to be considered in the context of the technical specifics of electricity generation.
Not all generation units are able to change their generation schedule in real time, or react as fast as is
needed for the market to cope with unexpected events on the system. Getting closer to real time, fewer and
fewer generation units are available to modify their output to match the system’s needs. This ultimately
explains why prices for regulation are usually higher than day-ahead prices. The product traded in the
Balancing timeframe is not the same as in other markets. It implicitly includes a flexibility component, and
cannot be considered as pure energy.
In fact, European regulators have diagnosed that the lack of integration of national balancing markets (in
many cases fragmented and illiquid) is a key impediment to the development of a single European
electricity market. The seamless integration of all those markets through the price signal should be a
catalytic factor for the achievement of the objective of a fully competitive IEM and the elimination of market
distortions.
The European Commission (EC) has pursued, and continues to pursue, full implementation of the IEM.
Considerable efforts have been put so far by the EC, TSOs, national regulators and other power industry
stakeholders into integrating national electricity markets, and achieving the completion of the internal
market in electricity and cross-border trade. So far those efforts have been mainly focused on the forward,
day-ahead and intra-day stages. The implementation of balancing markets spanning across national
frontiers therefore constitutes an important next step towards full completion of the IEM. Often cited

299949/TRD/EFR/01/E 28 March 2013 PiMS/299949/EU Balancing Market/Reports/Issued Reports
3
Impact Assessment on European Electricity Balancing Market
benefits of cross-border balancing trade include an improved market functioning, a more efficient
deployment of power sector resources, the facilitation of absorption of increased levels of intermittent
generation and improved effectiveness in the use of cross-border interconnectors.
1.2 Basis for the Study
For the European IEM a target model has already been decided and is currently under development. The
target model is effectively implemented through the binding EU-wide Network Codes on topic areas for the
integration of EU electricity markets. The objective of these codes is to promote the completion and
functioning of the IEM and cross-border trade and to ensure the optimal management, coordinated
operation and sound technical evolution of the European electricity transmission network. The process for
developing these codes is stipulated in the Third Energy Package legislation and includes the elaboration
of Framework Guidelines (FG) by ACER, which set out the key principles for the development of the
Network Codes by ENTSO-E.
Against a background of initiatives and studies establishing the fact that the national balancing markets so
far remain diverse, disconnected and highly illiquid in certain cases, and identifying the potential benefits of
cross-border integration of the balancing markets, the European Commission invited ACER on 18 January
2012 to draft the FG on Electricity Balancing, and requested the FG to set the framework for competitive,
harmonised and effective EU-wide balancing arrangements. In particular the FG should:
� set out the roles and responsibilities for both TSOs and balancing service providers;
� set out harmonised technical specifications for facilities providing balancing services;
� define compatible balancing products and timeframes for the procurement of balancing services, and
prepare harmonised rules for the award and remuneration of these services;
� set out a harmonised and non-discriminatory framework for settling system imbalances with the balance
groups, including pricing of imbalances, imbalance periods, settlement timeframes, clearing
requirements; and
� set out rules for the use of cross-border transmission capacities for the exchange of balancing services.
The FG for Electricity Balancing were published by ACER on 20 September 2012. The FG aim to set out
clear and objective principles for the development of network codes pursuant to Article 6 paragraph 2 of
Regulation (EC) No 714/2009 (the “Electricity Regulation”). They cover the areas pursuant to Article 8
paragraph 6 (h) and (j) of the Electricity Regulation (EC). The network code(s) adopted according to these
Framework Guidelines (the “Electricity Balancing Network Code(s)”) will apply to the rules for trading
related to technical and operational provision of system balancing and the balancing rules including
network-related reserve power rules between the zones in the EU electricity market. These FGs address
the integration, coordination and harmonisation of the balancing regimes, and their gradual integration to
the “target model”, in order to facilitate electricity trade within the EU in compliance with Directive
2009/72/EC (the “Electricity Directive”) and the Electricity Regulation. This report presents the Consultant’s
opinion on the policy options and proposed roadmap of implementation contained in the FG.
In January 2012, the EC/DG ENER awarded the “Consultant” to assist ACER in drafting an impact
assessment for the Framework Guidelines on Electricity Balancing. The task includes:
1. Identifying together with ACER the issues and options for European electricity Balancing Market
based on the target model.

299949/TRD/EFR/01/E 28 March 2013 PiMS/299949/EU Balancing Market/Reports/Issued Reports
4
Impact Assessment on European Electricity Balancing Market
2. Analysing the feasibility and technical, economic and social impacts of the identified options.
3. Proposing the key design elements for a European balancing market to be included in the framework
guideline.
4. Proposing a tentative roadmap for implementing a European Balancing Market.
The underlying motivation of this project is to facilitate the integration of significant amounts of less-
predictable renewable energy sources, to support market liberalization by providing the correct economic
signal for future investments, avoid or reduce gaming/free-riding and market distortions, and to allow the
active participation of small-size consumers/distributed generation in Balancing Services, by introducing
proper price-based incentives. Put it differently, this study aims to verify whether the implementation of
cross-border balancing is a profitable and achievable goal without unrealistic or too costly preconditions.
To examine these profound shifts that may occur in the way electricity markets interact on a cross-border
basis, and the changes that the integration of cross-border balancing markets will require, the overall
objective of the work was to obtain some basic insight on the following topics:
� Understand the operational & market impacts of the various policy options and models of integration
� Identify potential implementation challenges, barriers and minimum pre-requisites
� Evaluate the likely costs & roadmap of implementation for the various models of integration
� Quantify the benefits of exchanging Balancing Energy (by drawing on real historical “Balancing data”)
and assessing the benefits of Sharing Reserve Services on a cross-border basis on a projected future
EPS
This work tries to be brief on “descriptive” issues with regards to various current practices in System
Balancing, but builds on numerous previous studies as the subject of cross-border balancing has already
attracted much attention. A full list of our references is provided at the end of this Report. We are grateful
for the support of many stakeholders in the energy industries, including nine TSOs (TenneT Netherlands
and Germany, ELIA Belgium NGC, RTE, Statnett, SvK, Fingrid, EnergiNet) and the institutions (ENTSO-E,
EFET, Eurelectric) who have provided us with their time, comments and significant support in terms of
data, interpretation and modelling methodology.
1.3 Report Structure
Our report is organised as follows:
Chapter 2 presents the basic principles of electricity balancing in EPS, and sets the context in terms of
outlining the problems of the current balancing arrangements across the IEM and challenges for the future
EPS with high levels of renewables and reduced levels of flexible generation plant.
Chapter 3 proposes key design elements for the future pan-European Balancing Market in terms of
responsibilities of market participants, harmonisation pre-requisites according to the level of integration,
pricing options for the settlement of imbalances, the allocation of capacity and energy costs with regards to
Balancing, procurement of Balancing Services, the integration with day-ahead and intra-day markets, the
treatment of interconnection capacity and the incentivisation of demand side participation

299949/TRD/EFR/01/E 28 March 2013 PiMS/299949/EU Balancing Market/Reports/Issued Reports
5
Impact Assessment on European Electricity Balancing Market
Chapter 4 presents our quantitative analysis and results from simulating cross-border (XB) exchanges of
balancing energy and the exchanging and sharing of balancing reserves. The objective of these analyses
was to estimate the magnitude of the welfare gains available through the integration of balancing markets –
i.e. whether they are they negligible or material and the comparison benchmarking of different models of
integration.
We have applied four different approaches to determine the benefits of integrating the European Balancing
Markets:
� Using historical bid/offer data and interconnector availability between France-Great Britain & the Nordic
countries (for year 2011) to model the impact of exchanging balancing energy under various modalities;
� Time series (regression) analysis of the relationship between balancing prices and market indices for
two interconnected jurisdictions (Great Britain, France), where trading of balancing energy has been
introduced;
� Modelling two similarly sized generic jurisdictions with varying levels of penetration of intermittent
generation;
� Modelling the benefits of cross-border exchanging and sharing of balancing reserves services between
member states of a projected future (2030) pan-European power system;
Chapter 5 considers in a qualitative way the pros and cons of the different policy options for handing cross
border balancing as proposed by ACER’S FG OF 20/09/2012. It addresses these issues in terms of
impacts on security of supply, the extent to which the proposals address market distortions costs, and
harmonisation requirements.
Chapter 6 presents our conclusions.
1.4 Required level of understanding for reading this report
This paper undertakes a critical analysis of the policy options, main design elements, economic & social
benefits, implementation challenges and an impact assessment of how best to integrate balancing markets.
As such it presumes that the reader has a good understanding of the concepts of the IEM Target Model,
principles of electricity trading including forward, day-ahead and intra-day market arrangements, gate
closures and congestion management.

299949/TRD/EFR/01/E 28 March 2013 PiMS/299949/EU Balancing Market/Reports/Issued Reports
6
Impact Assessment on European Electricity Balancing Market
2.1 Problem definition
Article 12 of the Directive 72/2009/EC (henceforth referred to as the “Directive”), determines the tasks and
duties of European Transmission System Operators amongst which, first and foremost is maintaining a
real-time balance between electrical energy generated and consumed as this is essential for safeguarding
system security. Disturbances of equilibrium between generation and load cause the system frequency to
deviate from its set value, which can affect the behaviour of electrical equipment and – in the case of large
deviations - may lead to protective disconnection of generation units and eventually a system black-out.
The size and duration of these Frequency Deviations with respect to the Nominal Frequency (50 Hz) for a
sufficiently long period of time are regarded as frequency quality and the TSOs have as a primary target to
properly monitor and maintain instantly. TSOs, therefore entrusted with the task of guaranteeing system
security, plan, organise, procure and deploy if needed, Balancing Services (BS) obtained from Balancing
Service Providers (BSPs). This task has the highest priority for system operation, since degrading
conditions in part of a synchronous system can cause overall system instability. Furthermore, TSO’s have
the responsibility to improve the efficiency of the energy markets they facilitate, in cooperation with their
respective national regulators. In recent years focus has shifted towards a more macro-economic
perspective of the costs incurred to balance the system and the efficiency of the “tools” at their disposal.
The main reasons for the occurrence of imbalances in power systems are;
� Not “N-1” (secure) disturbance / outage of generation or load or HVDC interconnector – Power
Imbalance
� stochastic imbalances in normal operation – Those can be further sub-divided into:
- Over Program Time Unit (PTU) Energy Imbalances (load forecast error, production forecast error -
this is expected to be considerably increased as a result of increased penetration of intermittent
RES-E in the future European generation portfolio – and Control Accuracy)
- Within PTU (Power Imbalances) (load noise, production noise)
- Between PTU Energy Imbalances (ramping of exchange programs)
� market driven imbalances – e.g. ramping at the “hour shift”. (already observed in liquid markets with
hourly PTUs/settlement periods, as generators try to optimise their portfolio with frequent “shifts” near
the round hours resulting in increased needs for reserves and costs, in fact this phenomenon is less
acute when the PTU/settlement period becomes more “granular” – 30 or 15 minutes)
� network splitting due to transmission bottlenecks (effectively requires balancing within separate zones).
Across European TSOs both the products for BS and the arrangements by which they are procured are
currently very diverse. This is mainly due to historical reasons as each TSO individually designed their
“balancing market” according to national specificities (generation portfolios, significant presence of internal
congestions and level of interconnections with foreign markets). It must be noted that currently not all
European TSOs “procure” BS in the commercial sense and in some jurisdictions the provision of BS by
BSPs is obligatory. Nevertheless the trend throughout Europe in the last years has been for an increasing
number of jurisdictions to introduce “organised markets” for the provision of BS encompassing all products.
Furthermore ERGEG’s “Guidelines of Good Practice for Electricity Balancing Markets Integration”4 clearly
state a preference for market-based methods to be used by TSOs when procuring balancing services.
2. European System Control & Balancing – Problem Definition

299949/TRD/EFR/01/E 28 March 2013 PiMS/299949/EU Balancing Market/Reports/Issued Reports
7
Impact Assessment on European Electricity Balancing Market
The concept of “BS procurement” on commercial basis is one of the basic assumptions of the present
study.
The diversity of market designs existing at European level is generally believed to hamper the integration
process and the implementation of IEM. In fact the definition of the problem can be revealed more easily if
we examine carefully the impact of four fundamental topics in EU energy policy:
� Integration of renewable energies
� Lack of competition in balancing markets
� Market distortions
� Security of supply
2.2 Integration of renewable energy sources
Both the EU and the Governments of the MS are committed to massive reductions in the carbon intensity
of their power sectors. A de-carbonized power system is likely to be characterized by: a large,
relatively inflexible nuclear baseload; a high penetration of intermittent and partially unpredictable
renewable generation capacity, which in many countries will be dominated by wind; and a fossil-fuel
fleet running at much lower load factors than at present and also relatively inflexible in providing response if
combined with CCS technology. Renewable energy sources are intermittent and hence not fully
dispatchable whilst nuclear, coal and gas units equipped with CCS will present issues of flexibility. The
dispatching of the generation system is thus expected to become more difficult as we progress towards
these renewable and GHG objectives. As the installed capacity of intermittent and unpredictable generation
capacity in a control area increases, the stochastic nature of wind output may result in increased volumes
of imbalances which system operators have to deal with, and as a result both the amount of response and
reserve that needs to be held, grow. In fact with large wind/solar capacities the wind/solar forecast error
gets more important and asymptotically the total error converges to the wind/solar forecast error as the
correlation between intermittent generation's output and total error increases.
Furthermore system operators are forced to increase the amount of plant being part-loaded and therefore
run less efficiently and the situation may also lead to increases in the load factors of peaking plant. Apart
from increased costs due to increasing needs for BS and reduced thermal efficiency, if left on its own
“national resources” each TSO, may have no other alternative but to curtail wind production due to
response constraints. This is because in order to provide “response” a thermal plant also injects energy
and in combination with Nuclear and CCS plant may impose curtailment of wind production in future
scenarios with increased levels of RES-E penetration. A central challenge of large-scale wind/solar
integration, therefore, is the ability to absorb the wind/solar generation with a thermal fleet of reduced
flexibility.
Whilst intermittent sources pose a problem of their own, they can at the same time dramatically benefit
from progress achieved in the market architecture. Today it is almost impossible to exactly forecast wind
speed a day in advance. This implies that wind generations will not be known, or at least very imperfectly
known in the day-ahead market. But forecasts improve as one moves forward in time and can become
quite accurate a few hours before real time. This should normally imply active trading as one moves from
day-ahead planning to real time and information on forthcoming wind/solar generation and also load,
temperature and unforeseen plant outages is progressively known. This new information may either be
based on new weather forecasts derived from meteorological models or on a statistical analysis and
extrapolation of the current wind power infeed as compared to the forecasts. The latter approach is

299949/TRD/EFR/01/E 28 March 2013 PiMS/299949/EU Balancing Market/Reports/Issued Reports
8
Impact Assessment on European Electricity Balancing Market
advantageous for the close future, i.e. roughly for forecast horizons below six hours whereas
meteorological models are mostly suitable for longer-term forecasts.
Adaptation to such new information requires either short-term (intra-day up to real-time) trading possibilities
or the existence of reserves or both. For the system balance it makes no difference whether the additional
(or reduced) power is provided through intra-day or real-time trading or through pre-contracted reserves
albeit the economic efficiency would be improved if less reserve capacity is "pre-contracted" by the TSO as
this capacity is removed from the forward markets. The idea therefore of integrating markets from day-
ahead to real time is thus of the essence.
For the same reason as in the day-ahead market, there is no economic reason for not trying to reduce the
cost of balancing by arbitraging balancing resources between systems, that is, for trying to organize cross-
border balancing in the same way as one tries to organize cross-border electricity trade.
Another factor is that large wind areas can reduce uncertainty in the overall wind feed-in. The correlation of
wind feed-in and uncertainty strongly depends on the distance between wind farms (Figure 2.4) and
therefore also on the size of the investigated area. This effect can be observed even for significantly large
areas. The integration of the German transmission system operators (TSOs) into one market in 2009
provided a good example. The day-ahead (24h) forecast error (RMSE - root mean square error) for each of
the four TSOs was between 6.6% and 7.8%. Bundling the region reduced the forecast error to 5.9%.
Developing cross-border balancing can therefore be considered a crucial element in realising the “Climate
Change” policies of the EU, accommodating an increasing amount of intermittent generation without
jeopardising the EPS and in mitigating the impact of potential high additional costs to balance the system.
Figure 2.1: Projected maximum “Power Ramps” required by German intermittent RES-E
Source: ENTSO-E

299949/TRD/EFR/01/E 28 March 2013 PiMS/299949/EU Balancing Market/Reports/Issued Reports
9
Impact Assessment on European Electricity Balancing Market
Figure 2.2: Projected requirements for short term Operating Reserve, and increase of BS requirements in the GB
system
Source: NGC

299949/TRD/EFR/01/E 28 March 2013 PiMS/299949/EU Balancing Market/Reports/Issued Reports
10
Impact Assessment on European Electricity Balancing Market
Figure 2.3: Required capacities for short-term adjustments as a function of installed wind power capacity (MW)
Source: source C. Weber (2009)
Figure 2.4: Correlation of two wind parks depending on the distance of the wind parks and time of forecast
Source: K. Neuhoff 2011

299949/TRD/EFR/01/E 28 March 2013 PiMS/299949/EU Balancing Market/Reports/Issued Reports
11
Impact Assessment on European Electricity Balancing Market
2.3 Lack of competition under the existing national Balancing Market
arrangements
The European Commission’s sector enquiry (2007) revealed high levels of concentration within national
balancing markets. This, combined with a low degree of cross-border integration enables in certain cases
BSP (especially generators) to heavily influence the market outcome. This effectively creates barriers to
market entry for suppliers, who face imbalance price risk and/or high network charges (to the extent that
balancing costs are included in the costs of the network. and below depict diagrammatically the nature of
this problem and ways to mitigate it.
Figure 2.5: Imbalance as a market outcome – TSO control target
Source: TenneT NL, Balance-IT symposium, Eindoven 18/10/2011, E-Price Project
The TSOs are responsible for maintaining system balance deploying the full range of tools they have in
their disposal under the “national BM” arrangements, but also in co-operation with other TSOs. Basically
depicts the fundamental principle that the economic objectives of Market Participants do not necessarily
coincide with the technical objective of the TSO which is zero imbalance (Optimal Balance point). TSOs
have as objectives the continuation of supply, compliance with their License conditions and applicable rules
& regulations, technical targets for voltage and frequency control and in general a neutral financial position
but securing adequate cost recovery. Market Participants’ objectives are profitability, security of supply, and
risk control through transparency and autonomy (dispatch and transacting). The result is a system
imbalance position of the market in its entirety. The market result leads (due to imperfections) to an initial
result that constitutes imbalance for the TSO. This input is a control target for the TSO. Using the means at
its disposal the TSO reduces its initial control target. The resulting sum is the ACE. The responsibility of
TSO to maintain system balance and hence for correcting for the imperfect market result is discharged
through the usage of a system of control reserve capacity and energy. This reserve capacity (in MWs) can
be activated when encountering disturbances or imbalances. This “system of control” is depicted by the
arrow of “Control Scheme”; the amount of required Balancing Services (BS) and the conditions of supply of
them by BSPs in the BM determines the market outcome.

299949/TRD/EFR/01/E 28 March 2013 PiMS/299949/EU Balancing Market/Reports/Issued Reports
12
Impact Assessment on European Electricity Balancing Market
Figure 2.6: Improved “equilibrium” as a result of markets integration
Source: TenneT NL, Balance-IT symposium, Eindoven 18/10/2011, E-Price Project
Figure 2.6 depicts various alternatives to improve the BM “equilibrium”. The solid red line depicts a situation
where BSPs can exercise “market power” as a result of inadequate competition in the BM. To the left of this
border (a position which may occur as a result of increased BS requirements) there are inadequate BS
resources in the disposal of the TSO and a threat to security of supply. This situation can be improved
either by moving the border to the “right” (increasing efficiency and competition of the BM by allowing more
new entrants (appropriate design conveying the correct economic signals), diluting market power by
allowing cross-border products, or moving “downwards” i.e. reducing the BS requirements through for
example the sharing of BS resources or appropriate incentives to all market participants to manage better
their projected imbalances which may result in less market imperfections.
In IEM, it is possible that the observed balancing market concentration could be decreased through a
higher degree of cross-border integration, a reduction in entry barriers and an improvement in market
efficiency. This could be done through the introduction of more competition between balancing service
providers and increased liquidity in balancing energy trading.
2.4 Market distortions
Despite its relatively small volume, the Balancing Market provides a powerful economic signal to the
market. One of the fundamental “building blocks” of a correctly designed market in every commodity is the
attribute of “completeness”, i.e. the appropriate incentive in each successive time-horizon step to promote
liquidity. Market participants trade in forward markets in order to hedge their risks in the “spot market”, and
conversely the spot day-ahead market for electricity is traded in order to avoid exposure in the intra-day
market price and to fine-tune positions (we have argued above that from a theoretical point of view the only
true "spot" market in electricity is the real-time balancing market but nevertheless the term "spot market" in

299949/TRD/EFR/01/E 28 March 2013 PiMS/299949/EU Balancing Market/Reports/Issued Reports
13
Impact Assessment on European Electricity Balancing Market
IEM parlance is currently used for the day-ahead markets). Equally, the intra-day market is the last chance
for a market participant to “avoid” being exposed to the imbalance price. Obviously the alternative for a
market participant is not to compensate the errors through market transactions but rather to use balancing
energy provided by the system operator. Which alternative is chosen, depends on the prices in both
markets. Given that reserves are even more flexible than quantities sold on the intra-day market, their
provision should be more complicated and their price should in principle be higher than the price of intra-
day energy.
Also on the supply side, bidding into the reserve market clearly is a substitute for the power plant owners to
short-term sales of power on the spot and intraday markets. Hence the two markets (intra-day and
balancing) are closely interlinked. From a market design perspective, the two markets and their interaction
should thus be designed in a way to provide incentives to all market participants for achieving globally
efficient market results. A correct market design should not allow arbitrage between a "forward" and a
market segment closer to real-time, albeit "ex post" prices may indeed inverse.
Hence, the intermittent power producers should normally have clear incentives to avoid using balancing
services in real time whereas the power producers would bid flexible units first into the reserve markets.
Only those units not accepted in the reserve market or not capable of delivering reserves would
consequently be offered in the intra-day market, reducing somewhat the liquidity in this market segment.
Nevertheless enough capacities should be available for the intraday market except for some peak-hours.
Consequently, correctly designed electricity markets need to convey the appropriate incentive through the
“price signal”, otherwise opportunistic locational/temporal “arbitrages” would result in market distortions. In
other words a correctly designed electricity trading framework, in forward, day-ahead and intraday markets
should, in the end, result in transactions motivated by the desire of market participants to balance their
positions before each successive gate closure. The design of the balancing arrangements and particularly
the resulting imbalance prices\penalties are therefore crucial to the functioning of day ahead and forward
markets across IEM.
The finance principle of “continuous trading” effectively means that Electricity markets can function more
efficiently conditionally to market-based or cost- reflective imbalance prices.
2.5 Security of Supply
Balancing Reserves (BR) (power capacities in MW) are the technical means by which the TSO ensures
real-time system security. Balancing Reserves act as a form of ‘insurance’ for the TSO and the BR Market
is the market where a TSO “procures” these reserves and where BSPs offer these services. This is a
technical task and therefore only technical criteria are relevant in determining how much reserve capacity
should be bought. All end-users (small or large) benefit from this system-wide Security of Supply since all
users face unplanned events independent from each other, all creating potential imbalances in the system.
It is therefore fair that cost for contracting reserve capacity is socialised e.g. via the Use of System tariff.
Since Security of Supply is in effect a matter of ensuring sufficient Reserve Capacity, the discussion in 2.2
and 2.3 above has already demonstrated that cross-border access to such products will help TSOs not only
to procure BR more efficiently, but also be able to cope with the increased amounts of Reserve Capacities
the Security of Supply criteria will require in a future EPS. Quantitative analysis results (discussed in more

299949/TRD/EFR/01/E 28 March 2013 PiMS/299949/EU Balancing Market/Reports/Issued Reports
14
Impact Assessment on European Electricity Balancing Market
detail in Chapter 4 below), have confirmed that allowing the exchanging and sharing of BR in a future EPS
characterised by a large level of intermittent RES-E, will decrease the total amount of Reserve Capacity
that is required to be held, and hence will result in substantial operational and capital cost savings.
Market solutions including cross-border procurement of Balancing Services will incentivise the entrance of
various market participants such as interruptible demand, energy storage etc who respond to the
appropriate economic signal, and will allow the TSOs in the future to deploy additional flexible tools to
guarantee Security of Supply
2.6 The mechanics and products to maintain System Control and security in
European Power Systems
It is not within the scope of this report to undertake a detailed description of the rich landscape of European
TSOs’ variety of approaches, tools and nomenclature to the issue of system control. This has been the
subject of several studies and reports in the past, dedicated to this topic. We need however to review some
common underpinning principles in order to evaluate the key issues and “building blocks” of the policy
options available to move forward the integration of balancing markets and to agree the terminology we are
using in the rest of this report. Although the details, products and procedures defer between synchronous
areas (continental Europe or CE, Nordic, GB, Ireland, Baltic and Cyprus) there are underlining common
concepts and the discussion below focuses in CE practices to demonstrate control philosophy.
These detailed descriptions and definitions of processes, hierarchical structure and balancing products are
contained within Appendix B of this report.
Typically, a distinction is made between several types of Balancing Services utilised by different TSOs.
These differ mainly in terms of activation method and response speed. The reason for this lies in the
technical limitations of generating units, entailing a trade-off between speed (dynamics) and sustainability
of response (steady state efficiency). For the purpose of this project, the discussion regarding the control
philosophy of European Power Systems and the tools at the disposal of the TSOs to maintain system
security and balance the system in real time needs to make only one distinction between the following two
generic categories of Balancing Services:
� “Balancing Reserves” – (BR – Capacity in MW) are services procured in advance of real-time as
“Security insurance” and mainly deployed for capacity purposes and usually delivering only a marginal
amount of energy in real time. Technically reserves can be either automatically or manually operated.
� “Balancing Energy” – (BE – MWh): energy activated by the TSO to maintain the balance of the system
in real time.

299949/TRD/EFR/01/E 28 March 2013 PiMS/299949/EU Balancing Market/Reports/Issued Reports
15
Impact Assessment on European Electricity Balancing Market
2.7 Conclusion
This chapter has explored some of the reasons for system imbalances and considered how the nature and
extent of such imbalances could be affected by the four fundamental topics in EU energy policy:
� Integration of renewable energies
� Lack of competition in balancing markets
� Market distortions
� Security of supply
For each of the above we have explained the issues relating to Balancing Services and given our view on
the extent to which we consider each suggest a move towards harmonization of balancing services across
a wider area. These are examined further and the benefits quantified in the following chapters.
Our review of the existing arrangements suggests that the problem our study tries to answer can be
formulated as the question:
“What is the best Policy Option to carry forward the integration of Balancing Markets in the IEM, what are
the key design elements and what are the potential implementation challenges”?

299949/TRD/EFR/01/E 28 March 2013 PiMS/299949/EU Balancing Market/Reports/Issued Reports
16
Impact Assessment on European Electricity Balancing Market
3.1 Capturing benefits from cross-border integration of balancing markets
The discussion in Chapter 2 above indicated that larger regions reduce the overall demand for balancing
and reduce costs for providing balancing power through a broader portfolio of power plants and additional
sources for balancing power. The development of cross-border balancing therefore may reduce the total
amount required for balancing reserves and increase competition on the balancing market, thereby
improving reserve procurement efficiency and reducing the costs of balancing the system. Moreover, the
implementation of the “target model” and its provisions for continuous intra-day trading, will result in cross-
border exchanges (schedules) being notified closer to real-time and emphasises the importance of TSOs’
task of balancing the system while it may impact on the level of resources available for them. As a
consequence, it is required that the on-going market integration process also prioritises the integration of
balancing markets. The discussion also highlighted the challenges faced by the future EPS with regards to
security of supply and high (and potentially escalating) costs of balancing. Cross-border integration of the
diverse national balancing markets would assist in developing competition, reduce costs and mitigate risks
of security of supply.
The transition from the existing control philosophy and operational mode to the target model of a
competitive and integrated cross-border “market environment” for the provision of Balancing Services,
presents major challenges and fundamental changes from an operational, implementation, infrastructure
and governance point of view. The more integrated the cross-border balancing arrangements are, the
greater the challenges will be in implementing across a wide area. To address this requires a carefully
planned progressive implementation, that identifies a series of conditions and milestones which will need to
be met before the next phase of harmonisation can take place.
Below we identify some key design elements of the framework that need to be put in place in order to
realise an effective cross-border balancing market.
3.2 Role, responsibilities and incentives of TSO in cross-border balancing
The TSO’s fundamental role, as the only party that has a real-time overview of the system, is exclusive
responsibility for system control and security. This responsibility should be discharged through the mandate
imposed by the Regulatory Framework to do so efficiently and subject to incentives.
In our view TSOs should be given the mandate to organise and run the Balancing Market for the
procurement and activation of all Balancing Services. In doing so they should work with each other in close
cooperation and coordinate their activities as much as necessary in order to facilitate their integration
across borders, promote liquidity and standardise the product. There have been some suggestions that
other independent entities may be able to organise such markets, subject of course to the TSOs
requirements, for the amount and technical characteristics of the products offered therein. We do not share
this opinion and we do not see obvious advantages provided TSOs do not interfere with the market and
remain truly independent according to the provisions and requirements of Directive 72/2009/EC.
Furthermore we believe that a future cross-border Balancing Market would require even closer involvement
and integration in running such market. The metering and settlement part of clearing the Balancing Market
can be outsourced.
As balancing risks are significant for individual market participants, the manner in which TSOs undertake
and execute this role is of vital importance for market participants and end-users of electricity. Despite the
3. Key design elements in cross border balancing markets - Recommendations

299949/TRD/EFR/01/E 28 March 2013 PiMS/299949/EU Balancing Market/Reports/Issued Reports
17
Impact Assessment on European Electricity Balancing Market
common ENTSO-E/UCTE control philosophy there is still diversity in system operation, procedures, control
concept and products amongst TSOs, including different criteria for Security of Supply. If Balancing
Markets are to be integrated on a cross-border basis there is a need for close co-operation between TSOs
in order to align those policies. For example if one market relies on Demand Side Response (DSR) as part
of the BM and integrates with one that excludes it, then Demand in the latter TSO’s area will try to “offer” to
the neighbouring TSO with as a result disadvantaging their “native” balancing market price.
Generation dynamic constraints must be taken into account in the Balancing timeframe. These constraints
are closely linked to the underlying generation technologies and the energy mix. Adequacy between the
specifics of generation technologies and balancing products brings added value: tailored products allow
further refinements in Balancing economic optimization. On the other hand, harmonized Balancing products
create more exchange opportunities between control areas. There is no evidence that gains of
harmonization through additional trading opportunities are always greater than losses incurred from the
standardization of products. This should be taken into account when integrating Balancing Markets -
decisions should only be taken on the basis of an extensive cost/benefit analysis. A possible solution to
integrate Balancing Markets without losing value from standardization effects is to create an additional
layer of Balancing products, tailored by TSOs from Balancing products at their disposal, only for trading
purposes. This is the principle of TSO to TSO mechanisms.
Furthermore TSOs should co-ordinate closely with NRAs in order to harmonise their respective national
market design with regards to System Balancing pricing and imbalance settlement, in order to mitigate
potential market distortions pursuant to Balancing Markets integration.
The TSOs should have a limited Involvement in the outcome of wholesale markets. The role of the TSOs is
to ensure that enough reserve capacity is available. This is a technical task, and therefore only technical
criteria are relevant in determining how much reserve capacity should be bought. TSOs should strive to
optimise the amount of required reserve capacity that is needed without compromising system security. In
our opinion the best way to achieve this is if they are subject to Regulatory Incentives with regards to the
overall costs of System Balancing in order to avoid TSOs “over-contracting”. Reliability should be
considered by the TSO within its cost impact to the final customers, and be incentivised to seek alternative
reliability measures that reduce such costs. Operating practices, procedures, and tools that reduce
variability and uncertainty while they maximize the effective use of limited responsive resources improve
reliability, but in order to develop them the TSO requires incentives.
Too much reserved capacity not only increases overall balancing costs faced by system users, but also has
an adverse impact on the market because all the generation capacity contracted for reserve is no longer
available for the wholesale market and might influence the social welfare created by the market. One
approach is the use of incentive schemes, which expose the TSO to some of the costs for system
balancing (or sharing profits from savings on balancing costs) - "sliding scale" regulation. Thus the TSO
would be motivated to reduce costs that would otherwise be fully passed on to consumers. Of course, such
a framework must account for the TSOs legal responsibilities regarding System Security and the risks of
such an approach should not be underestimated.
The UK has successfully applied incentive schemes for the TSO to minimise system balancing costs. This
has however created three sets of difficulties according to Neuhoff 23
; Firstly, to maximise the long-term
benefit from future negotiations of incentive schemes, the TSO has had strong incentives to improve its
bargaining position by limiting transparency. Secondly, generators in the UK have complained about non-
transparent contracting choices by the TSO, reducing trust and certainty. Such sentiments undermine
efforts to integrate wind power into the dispatch of power systems and to provide transparent information

299949/TRD/EFR/01/E 28 March 2013 PiMS/299949/EU Balancing Market/Reports/Issued Reports
18
Impact Assessment on European Electricity Balancing Market
for planning and permitting processes of transmission expansion. Thirdly, the UK is an island, so incentives
for NGC (the national TSO) have limited the impact on neighbouring TSOs. In the case of continental
European TSOs, incentives to minimise balancing costs for individual TSOs could lead to behaviour that
shifts costs and responsibility to neighbouring countries at the expense of system efficiency and security.
With difficulties relating to incentive schemes on TSOs, we consider that the regulatory solution is a
combination of (i) minimising exposure to market outcomes, e.g. through clear unbundling of system
balancing obligations from other business activities, and (ii) providing clear rules for as many decisions as
possible, while retaining the level of discretion necessary to allow responses to unexpected system
circumstances. As bilateral contracting is in its very nature based on discretionary choices associated with
each negotiation, auctions have become the preferred market interface in such environments. The Spanish
example is a starting point, and many power systems in the US (e.g. PJM) have further refined the
approach and use rules that are guided by the technical constraints of the system.
Balancing Market integration on a cross-border basis is a very important tool to share reserve capacities
(and therefore decrease costs and total amounts of capacity required). It is expected therefore that such
incentives will induce the motivation to TSOs to co-operate for the successful and fast integration of the
balancing markets. A good example is the co-ordination between ELIA (Belgium TSO), Tennet NL (Dutch
TSO) and TenneT DE (one of the German TSOs). Under those arrangements TenneT NL, has in place two
“System-to-System Emergency Assistance” contracts (300 MW each) with its neighbours, and as such
needs to reserve from the internal (Dutch) market a reduced amount of Reserve Capacities.
Other TSO System Services or actions should not in our opinion interfere with Balancing Markets. To
enable efficient arbitrage with the intra-day market, imbalance settlement prices should not be influenced
by other TSO tasks like congestion management. All services used for any purpose other than pure Energy
Balancing, should be “tagged” and priced separately, their costs socialised and recovered by all users
unlike imbalances paid by BRPs. We also consider that TSOs should be mandated to promote
transparency, which can be facilitated if TSOs are subject to regulatory incentives for the provision of
information. Lack of transparency will drive market participants out of the Balancing Market as participants
rely on clear unambiguous information to undertake their transactions. With respect to the capacity
reserves and balancing energy markets, publication should at least include the contracted capacity (MW),
the capacity price and the merit order for balancing energy for the next 24 hours. The TSO should publish
in real-time the actual balance of the system and the accepted bids/offers for balancing energy.
TSOs should ensure that all participants into the Balancing Market are “pre-qualified”, in other words meet
all the requirements set in the terms and conditions for balancing market, in order to ensure operational
security.
The Electricity Balancing Network Code should identify a series of conditions and milestones which will
need to be met by TSOs before each progressive phase of further integration of cross-border Balancing
Markets can take place and require TSOs to report on progress in meeting each milestone.
Main attributes of a TSO for an efficient balancing market: ■ TSO incentivised to efficiently plan & procure BS requirements ■ Organises and runs the BM, with limited involvement ■ Transparency of information published by TSO, enables a maximum number of “pre qualified”
participants and increases system flexibility

299949/TRD/EFR/01/E 28 March 2013 PiMS/299949/EU Balancing Market/Reports/Issued Reports
19
Impact Assessment on European Electricity Balancing Market
3.3 Procurement and remuneration of Balancing Services - ensuring cost
reflective imbalance prices, allocation of capacity payments
The procurement of Balancing Services should be based on separate markets for Balancing Reserves and
Balancing Energy. Together those two markets are referred to as the “Balancing Market”. Balancing
Reserves Capacity refers to the market where the TSO buys in advance the reserve capacity for its
security of supply needs, whereby selected BSPs take the commitment to reserve this capacity from their
portfolio. The Balancing Energy market refers to a mechanism for the real-time energy market where the
TSO balances the system based on the merit order of the bids/offers received from the pre-contracted
BSPs plus any other party participating voluntarily into the balancing energy market.
The Balancing Market should be organised in such a way so that Balancing Reserves and Balancing
Energy are procured along market based principles. This entails the promotion of non-discrimination and
fairness, competition, liquidity, transparency and the avoidance of undue entry barriers to new entrants.
The market should be designed in a way to attract participation of the full range of market participants:
conventional and renewable generators, energy storage and load. No product category should be
excluded. Excluding certain product categories would result in creating separate markets for these, which
goes against the principle of a single integrated market. The definition of the procured products should
therefore guarantee basic principles to both, TSOs and BSPs.
Balancing services are mainly provided by generation but load is increasingly contributing to balancing
through contractual switching-off schemes (DSR). However, technical limitations including the lack of
enabling infrastructure such as automatic measurement and the possibility of switching off individual
consumer loads still limits the latter’s role in the balancing market. In some jurisdictions the preconditions to
bid in the balancing market (to be “pre-qualified”) are very strict. There is also a perception that in many
Figure 3.1: Schematic Linkages between TSO and Market Participants for Balancing Services
Source: Tennet NL, Balance –IT symposium, Eindhoven 18/10/2011, E-Price Project
TSOOBJECTIVES: Continuity of Service, Compliance (License/ENTSO-E), Control targets (Security, Voltage, Frequency), Cost Recovery
TOOLS: Invest, Procure Balancing Services, Restrict Market Participants based on ex-ante Rules
Market Participants, All ConnectionsOBJECTIVES: SoS, Profitability, Risk Control (level-field Access, Transparency), Autonomy (Despatch, Transactions)
TOOLS: Connect, Transact freely, Despatch
X BorderCapacity
Balancing ServicesSystem Services
Access, etc

299949/TRD/EFR/01/E 28 March 2013 PiMS/299949/EU Balancing Market/Reports/Issued Reports
20
Impact Assessment on European Electricity Balancing Market
national balancing arrangements preconditions to bid are very strict. Making these preconditions more
flexible would allow distributed generators and flexible loads to participate. The best facilitator for the
required investments in new technology required for the future EPS, is to allow participation of
“decentralised demand” in balancing mechanisms and to enable the development of innovative schemes
like energy storage, electric vehicles and others to be deployed by using smart grids. The economic signal
conveyed by the market price must be correct. Demand side participation in balancing is further discussed
below in section 3.3.8.
The counterparts of the TSO in the balancing market are:
The Balancing Services Providers (BSPs), where these parties offer capacity in the reserve capacity
market and energy in the balancing energy market. BSPs who did not participate in / were not selected by
the reserve capacity procurement, may additionally provide energy bids and offers into the Balancing
Energy Market on a voluntary basis.
On the other hand, the counterparts for the settlement of the balancing energy market are the Balance
Responsible Parties (BRPs) that take the risk of imbalances in the market. BSPs and BRPs might also
have a relationship with each other. For instance, they may in some cases be the same entity
TSOs should be assured that they will be able to procure the amount of Reserve Capacity and Balancing
Energy needed to maintain their control area balance and therefore security of supply. Meanwhile BSPs
must be assured that prices will allow for investments into flexibility to be remunerated. The following
principles should therefore apply to make balancing markets attractive and avoid distortion:
� Market-based prices. BSPs remunerated on the basis of cost reflective prices, regulated prices without
at least some indexation to market prices, should in our opinion be abolished;
� Mandatory technical capability to provide Balancing Services (specified in the applicable Network
Codes) but voluntary market participation across all products. Mandatory provision of some of the BS
may discourage NRAs and TSOs from establishing inventive market arrangements, which encourage
participation by a maximum number of generators, suppliers and consumers and thus facilitate liquidity.
Market participants may even start to behave anti-competitively or leave the market altogether under the
burden of mandatory balancing obligations.
� Unity of procured products, wide participation of conventional and renewable generators and load on
the basis of a “level playing field”.
� All BRPs should in principle face the same risks in order for the market to convey the appropriate
economic signal to incentivise “self-balance” which in turn has a positive outturn for the whole outcome
of the market. Uniformity of imbalance settlements for load and generation.
� Transparency and swiftness of settlement information disclosure.

299949/TRD/EFR/01/E 28 March 2013 PiMS/299949/EU Balancing Market/Reports/Issued Reports
21
Impact Assessment on European Electricity Balancing Market
Figure 3.2 below demonstrates the key challenge, which is to find an efficient balance of incentives
between TSOs and the wider market.
Reserve Capacity should be procured through an auction or competitive tendering mechanism. The choice
of remuneration i.e. whether it should be paid on a “pay-as-bid” or "marginal cost" basis depends on the
choice taken with regards to the allocation of capacity payments as discussed below. We just note that
marginal pricing is far less complex to implement than is “pay-as-bid”. A framework of a wide range of
time-frames for the procurement of Balancing Reserve capacity (day-ahead, weekly, monthly, quarterly,
annually, up to several years in advance under schemes for capacity tendering) must be developed, as well
as the establishment of a Secondary Market for reserve capacities. Procuring reserves for different time
frames in combination with a secondary market for balancing reserve capacity will capture several benefits.
The closer to real time, the better the information on unit availability/maintenance is and the less risk will be
priced in by the providers. Shorter procurement cycles allow new entrants and providers with a small
portfolio of either generation units and/or schedulable load to participate in reserve capacity markets.
Operators of peak/marginal plants as well some large consumers will be interested in longer procurement
cycles to capture fixed revenues. On the other hand TSOs are using this market in order to “hedge” against
risks of volume and price in the real time balancing energy market. The penalty for non-delivery should be
set at levels reflecting short-term marginal cost of replacement for the TSO and dissuading market
participants not to honour their contracts.
Figure 3.2: Split of Reserve obligations
Source: Mott MacDonald
Physical notificationsand Bids/Offers ladder
The tools for the TSO to
form operational strategy
& undertake System Balancing
Imbalance Prices
Market “incentives”
to TSOs to procure
Reserves
Gate Closure
The ability of the Market
to utilise its own resources
Physical notificationsand Bids/Offers ladder
The tools for the TSO to
form operational strategy
& undertake System Balancing
Imbalance Prices
Market “incentives”
to TSOs to procure
Reserves
Gate Closure
The ability of the Market
to utilise its own resources

299949/TRD/EFR/01/E 28 March 2013 PiMS/299949/EU Balancing Market/Reports/Issued Reports
22
Impact Assessment on European Electricity Balancing Market
Balancing markets provide market parties with a ‘last resort’ for energy transactions. The real-time or
imbalance prices expected to be brought forth by this market are reflected in wholesale prices and
consequently affect market parties’ decisions at the forward stage. For this reason, electricity markets can
only function efficiently conditionally to market-based or cost- reflective imbalance prices (Tractebel
Engineering and Katholieke Universiteit Leuven, 2009). The need for imbalance prices reflecting the costs
imbalanced BRPs incur to the system becomes even more important with increasing wind power
penetration as the variability and limited predictability of wind generation prevents them more than
conventional generation from being perfectly balanced.
Imbalance prices are market based in so far as they fully reflect all procurement expenses incurred by the
TSO for delivering energy in real-time. As such, imbalance prices should in principle correctly pass on both
energy (h/MWh) and if applicable capacity payments (h/MW). While the former are payments on a
settlement period basis for the actual real time delivery of regulating power the latter are payments made
beforehand for holding reserve capacity available. Although it would have been preferable to avoid
remunerating FRR and RR for capacity, amongst others because of the difficulties in accurately allocating
the associated costs (i.e. they are socialised and not allocated to those responsible for incurring them
particularly for “load following” within a PTU), there are three fundamental arguments which support
capacity payments:
− Firstly, balancing markets typically exhibit higher but more volatile prices and smaller volumes as
activation is dependent on the system state. Consequently, revenues are often more volatile than in
wholesale markets, inciting generators to sell on the wholesale rather than the balancing market. In
such case, capacity payments – yielding a guaranteed income – can serve as a risk premium to
attract more BSPs.
− Secondly, balancing markets – and in general all electricity markets –exhibit non- convexities, such
as start-up costs and minimum output levels. To ensure efficient dispatch in the presence of non-
convexities and simultaneously safeguard uniform or marginal real-time energy procurement prices,
an additional capacity payment can be useful, especially in small markets where e.g. start-up costs
have a relatively larger impact.
− Thirdly, balancing markets in several countries still exhibit regulated prices for real-time energy
making it impossible for BRPs to pass on all of their costs via their real-time energy bids (including
opportunity costs and actual costs for keeping services online).
Capacity payments are thus a means of recovering these remaining costs. However, if there is a well-
functioning and unrestricted balancing market, BSPs have the opportunity to pass on all costs via the real-
time energy price. In view of these arguments, it is understandable that some countries currently
remunerate services other than primary control and disturbance reserves for capacity. However, this type
of remuneration should only be transitional and should preferably be phased out.
Unfortunately this theoretical principle (phasing out capacity payments) presents the following problem;
contrary to energy payments, capacity is procured for a time period far exceeding the settlement period.
Consequently, its associated costs cannot be directly attributed to imbalanced BRPs. A choice should
therefore be made between one of the following cost allocation methods:
The System Balancing task is considered as a “system security service” and as such the costs of procuring
reserve capacity could be recovered via use-of-system charges (transmission tariffs) levied on a “fair basis”

299949/TRD/EFR/01/E 28 March 2013 PiMS/299949/EU Balancing Market/Reports/Issued Reports
23
Impact Assessment on European Electricity Balancing Market
to all system users or at least to all final consumers. Regulatory incentives on TSOs to reduce those costs
will result in efficient procurement and drive them to seek inventive solutions (including cross-border
balancing markets) to first reduce required volume and associated costs.
However this "socialisation" of capacity payments among grid users (consumers and producers) does not
entail cost-reflective imbalance prices: the resultant imbalance prices are too low as they do not include all
procurement costs. Consequently, BRPs are given fewer incentives to balance their portfolio using
wholesale markets (day-ahead and intra-day markets) and increasingly rely on the balancing market.
An improvement step would be for the capacity payments to be socialised among BRPs via a periodical fee
compared to the payments of all final customers via transmission tariffs. This approach still does not
provide BRPs with the right incentives. This is because the periodical fee is fixed (€/period) or proportional
to BRPs’ injections (generation–import–purchases) or off-takes (consumption–export–sales) (€/MWh of
injections/off- takes) – i.e. the BRPs’ size – rather than proportional to BRP’s imbalances, imbalance prices
will again be too low, encouraging BRPs to be over-reliant on the balancing market.
The third alternative is allocation to BRPs proportional to their imbalances via an additive component in the
imbalance price as proposed by Vandezande24
(2009). The third and most cost-reflective method consists
of the inclusion of capacity costs in the imbalance price (€/MWh of imbalances). Such allocation of capacity
payments is similar to the allocation of fixed costs under Ramsey–Boiteux pricing, whereby fixed costs are
recouped from customers by charging them prices in excess of marginal costs, in inverse proportion to their
demand elasticity. Based on this, capacity payments can be recovered by means of an additive component
(component cap) on top of the marginal procurement price of upward or downward regulating services. In
this case, inelastic customers include all the BRPs that ‘chose’ to be imbalanced despite the imbalance
price being higher than the marginal cost of upward or downward regulation. Wind generators usually
belong to this category. Allocation of both energy and capacity payments through the real-time energy price
is summarised in the Table 3.1 below.
Table 3.1: Allocation of Capacity Payments via the imbalance price
System Imbalance
Short Long
BRP imbalance Short +MPu + componentcap +MPd + componentcap
Long - (MPu - componentcap) - (MPd - componentcap)
where: MPu = marginal price of upward regulation - MPd = marginal price of downward regulation
componentcap = additive component
Source: Mott MacDonald
It must be noticed that the resulting imbalance pricing system exhibits characteristics of both a one-price
and a two-price system for energy imbalances (as discussed below). It is similar to a one-price system in
that it allocates energy costs using marginal procurement prices only. It is also similar to a two-price system
in that it entails different imbalance prices depending on the sign of the BRP’s imbalance but, contrary to a
two-price system, it does not include non-market-based components.

299949/TRD/EFR/01/E 28 March 2013 PiMS/299949/EU Balancing Market/Reports/Issued Reports
24
Impact Assessment on European Electricity Balancing Market
To ensure a cost-reflective imbalance price, it is vital to determine the additive component accurately.
Spreading out of capacity payments over all imbalanced BRPs during the time period of capacity
reservation, the additive component can only be calculated using historical figures on the amount and
extent of BRP imbalances. Consequently, an exact recovery of capacity payments using the additive
component is unattainable. Moreover, the longer the terms of capacity reservation, the less accurate the
additive component will be. Therefore, from a cost allocation point of view, capacities are preferably
procured on a short-term basis, e.g. daily rather than yearly capacity payments. Short capacity reservation
periods also involve a fast learning curve with respect to the necessary amount of reserves, making
capacity payments a more ‘controllable’ cost. However, the impact of shorter reservation periods on
competition is uncertain. On the one hand, short-term capacity payments reduce market foreclosure, but on
the other hand, they might provide incumbents with the opportunity to game on a more regular basis. For
this reason, the optimal length of the reservation period should be defined taking into account the impact on
both cost allocation and competition. The preferences of BSPs and TSOs should also be considered. It is
likely that they would both prefer longer reservation periods as this reduces the risks they face.
Following the discussion above, it is recommended to use an additive component in the imbalance price to
allocate capacity payments for services delivering a significant amount of real-time energy. Socialisation of
these capacity payments among grid users or BRPs should be discouraged as it results in relatively too low
imbalance prices and a potential over- reliance of BRPs on the balancing market. Implementation of this
recommendation may however have a negative impact on wind generation. The additive component mainly
affects inelastic consumers like wind generators, given their limited predictability and variability, that have
no other possibility than relying on the balancing market for their last resort energy needs. As such, wind
generators are very likely to bear a significant part of the capacity payments carried out by the TSO, having
an uplifting effect on their imbalance costs. However, these capacity costs are also partly caused by wind
and, as indicated above the higher the wind power penetration level is, the less bearable it becomes for
the system not to allocate these ‘‘hidden’’ costs to the responsible parties. Consequently, in order to avoid
barriers to entry, a cap should be imposed on the amount of reserves, so that the share of componentcap in
the final imbalance price is small compared to the marginal upward or downward regulation price.
Reservation of balancing services mainly deployed for real-time energy delivery should therefore be kept to
a minimum and the incentives framework described above for the TSOs will be a contributing factor. As a
rule of thumb, reservations of services should only be accepted when needed to compensate for the higher
revenue volatility in balancing markets compared to whole sale markets24
. The appropriateness of the level
of the imposed cap can be verified by monitoring whether (1) the real-time energy delivery of the reserves
concerned is marginal in comparison to the total delivered real-time energy and (2) the additive component
has only a marginal effect on the imbalance price. Furthermore, the implementation of capping the amount
of reserves dampens the increasing impact on imbalance prices.
To summarise, it is recommended that the capacity payments for the procurement of BS should not be
socialised but integrated into the energy imbalance price as an additive component and allocated among
imbalanced BRPs only, in order to ensure a market-based and cost-reflective design.

299949/TRD/EFR/01/E 28 March 2013 PiMS/299949/EU Balancing Market/Reports/Issued Reports
25
Impact Assessment on European Electricity Balancing Market
3.4 Ensuring cost-reflective imbalance prices: allocation of energy payments -
"one-price" versus "two-price" systems
The task of balancing the system in real-time is performed by the use of accepting Balancing Energy
Bids/Offers and the TSOs should be revenue neutral overall. The cost of procuring balancing energy
should be recoverable from those causing the imbalance, the Balance Responsible Parties (BRPs). This
also means that balancing the system in real-time should be a neutral financial activity (a zero-sum game)
for the TSO, who should only act as a “high technical performing broker” for solving the residual imbalance
of the system.
Figure 3.3: Linkages in Balancing Markets
Source: TenneT NL, Balance-IT symposium, Eindoven 18/10/2011, E-Price Project
In terms of imbalance settlement – i.e. balancing costs which are allocated to BRPs “ex post” of real-time,
there are two alternatives and below we examine the relative merits and drawbacks of each:
“A Dual Imbalance Price system” whereupon BRPs pay or receive cash-out for differences between the
“contracted positions” and physical volumes they generate or demand. The price that participants face
depends on whether they are long or short of physical energy compared to their contracts, and whether this
imbalance is in the same or in the opposite direction from the system. The dual cash-out price incentivises
participants to balance their positions ahead of gate closure and minimise the residual balancing role of the
SO. The partially marginal calculation of the main price and the market-based calculation of the reverse
price aim to ensure that participants are not better off by paying or receiving the cash-out price than trading
TSO: Financial Neutrality
Market: Profitability
Single Buyer Market for
Balancing Reserves (mandatory/voluntary)
Adjustments close to real-time
Imbalance Settlement
Compulsory: Imbalances “ex post”
Whole Sale Markets
Free: “ex ante” positions
Average
Result
Positive
Non-Delivery
Result
Negative
Average
Result
Negative

299949/TRD/EFR/01/E 28 March 2013 PiMS/299949/EU Balancing Market/Reports/Issued Reports
26
Impact Assessment on European Electricity Balancing Market
ahead of gate closure. Another strong rationale for a dual imbalance price system: if a BRP inadvertently
helps the system with an imbalance, it is not providing any flexibility but only energy. It should therefore be
compensated at the price of energy (for instance the Spot price). In a one price system, BRPs with
imbalances helping the system are unduly rewarded for flexibility they have not provided. This may result in
distortions in imbalance pricing. On the other hand one can argue that by delivering this “energy”, those
BRPs reduce the need for “flexibility” by the TSO. Therefore they should be rewarded at the opportunity
cost. Economic theory suggests there should only be one price for one commodity at a time and location.
Different prices generally lead to distortions and reduced efficiency. However, some have argued that
electricity is not like other commodities and that short imbalance and long imbalance can be seen as
different products. It is generally cheaper to turn generation down than to turn it up.
“A Single Price system”, based on the principle of “marginal pricing or pay-as-cleared” (i.e. highest
accepted price or the weighted average of a top-percentile of the prices in the Bids/offers “ladder”) or “pay-
as-bid” during a given settlement period. A single cash-out price would eliminate the spread between the
two cash-out prices. However the uncertainty with regards to cash-out prices due to uncertainty about
whether the system will be short or long may increase with a move to a single price. This is because the
difference between the two potential main prices (if the system is long or short) is larger than the difference
between a reverse price and a main price. With a single cash-out price participants would always face a
main price but would not know whether it would be based on the SO’s actions to address a positive or
negative imbalance. Greater uncertainty could increase the incentives to balance (to avoid uncertainty) but
could also deter some new entrants to the market.
Table 3.2 and Table 3.3 below; represent typical one- and two-price systems.
Table 3.2: Imbalance settlement through a typical one-price system
System Imbalance
Short Long
BRP imbalance Short +MPu +MPd
Long - MPu - MPd
where: MPu = marginal price of upward regulation - MPd = marginal price of downward regulation
Source: Mott MacDonald
Table 3.3: Imbalance settlement through a typical two-price system
System Imbalance
Short Long
BRP imbalance Short +APu * (1 + penaltyu) +PDA
Long - PDA -APd / (1 + penaltyd)
where: APu = average price of upward regulation - APd = average price of downward regulation
PDA = Day-ahead Power Exchange price
Source: Mott MacDonald
Under a single imbalance pricing scheme or one-price system, imbalance prices correspond to the
marginal procurement price of balancing services, i.e. either upward or downward regulating services
depending on the overall status of the system. The same imbalance price, though with a different sign, is

299949/TRD/EFR/01/E 28 March 2013 PiMS/299949/EU Balancing Market/Reports/Issued Reports
27
Impact Assessment on European Electricity Balancing Market
applied for remaining short and long positions, making the imbalance settlement theoretically a zero-sum
game for the TSO.
Under a double imbalance pricing scheme or two-price system, a different imbalance price is applied for
positive and negative BRP imbalances. While BRP imbalances contributing to the system imbalance are
settled at prices based on the (usually average) procurement costs of balancing services, BRP imbalances
counteracting the system imbalance are settled on the basis of wholesale price indices, typically power
exchange prices.

299949/TRD/EFR/01/E 28 March 2013 PiMS/299949/EU Balancing Market/Reports/Issued Reports
28
Impact Assessment on European Electricity Balancing Market
In general we advocate more a single marginal price system, for the reasons presented below however a
careful consideration of the system characteristics and dynamic effects of the imbalance pricing
mechanism (for example congestions within the control area) will determine the choice of model.
Some arguments for single marginal pricing: (A) is considered “cheaper” for balanced BRPs. A balanced BRP (with low correlation with system imbalances) should in the long run have a small imbalance cost. This is clearly not the case with double pricing. With double pricing a balancing margin is created which needs to be paid back to the BRPs. The balancing margin is mainly created on BRPs which were helping to resolve the imbalances. This margin is than socialized amongst bad and good BRPs. So one might argue that double imbalance pricing mechanisms are not giving the correct incentives to the BRPs, (in particular for those which are causing the biggest imbalances) to be in balance. A part of the activation costs caused by bad BRPs are socialized and paid by the balanced BRPs. (B) the "balanced position" is and will be hard to monitor for BRPs in the future In the near future BRPs will face more and more problems to have a correct estimation of their exact imbalance position due to the increase of the intermittent sources of generation. In such a situation a BRP will know more or less an interval in which probably their imbalance is situated, but it will not know the exact position. Only in single pricing, will a BRP make an effort to reduce its possible imbalance which it is aggravating the system “position”; an example: Producer knows his imbalance is between +200MW & -200MW and that he has flexibility with a marginal cost of € 100/MWh. Assume his real imbalance is -150MW. Assume also that the marginal cost is € 120 / MWh (area is short) and the day-ahead price is € 60/MWh In a double pricing mechanism the producer will do nothing and let the TSO resolve the imbalance. Indeed if he would use his unit he faces a risk of losing money as the cost of his unit (€ 100/MWh) is a lot higher than the price (€ 60/MWh) he might get. In a single pricing mechanism he will always react as he will never lose money. A double pricing mechanism will lead to a system where BRPs will have less balanced positions and where TSOs need to activate more balance energy as the residual imbalance increases. This is having an impact on the balancing costs but also on the amount of the pre-contracted reserves which need to be procured. This is also the main reason why some countries need to procure replacement reserves. (C) Might be the only way to develop demand side response (price reactions) Currently some TSOs (like Elia in Belgium) are having a single marginal price mechanism which is published close to real time. Based on contacts they know that some end consumers (with small CHPs < 3MW) with back-to-back contracts are in real time monitoring the imbalance tariffs and are reacting on it if prices are profitable. All clients could potentially react individually on the imbalance prices.
This is a real life example how small “embedded” consumers might participate in balancing markets without
complex administrative set-up for the settlement of aggregated bids. The entry barrier seems also to be
low.

299949/TRD/EFR/01/E 28 March 2013 PiMS/299949/EU Balancing Market/Reports/Issued Reports
29
Impact Assessment on European Electricity Balancing Market
Strictly dual Imbalance pricing penalizes all imbalances, thus effectively blocking the potential of flexibility
that may reside within the market but outside the portfolio of the Balance Service Providers. Permanent
dual pricing can stifle innovation and hamper participation of load in the balancing market. Single
imbalance pricing based on average rather than marginal FRR prices has a similar effect.
However, one must not underestimate the risks particularly in larger control areas, of overreaction or
congestion between local Monitoring Areas within a Control Area, Therefore in order to prevent such
situation it might be worthwhile to have within the design the ability to change to dual pricing. A functioning
example is the Dutch Imbalance pricing system: a dual pricing system, but with both prices being equal
most of the time (like in single pricing). Obviously close to real time information on prices is required: the
price signal should advise the market when to stay put (not to act), but also when there might be an
opportunity to act. In that case it also should provide the direction in which to act, regardless of the position
the BRP is actually in (long or short, or well balanced; this information is in real time more often than not
unknown to most BRPs.
Compared to a one-price system, under which settlement of BRP imbalances opposing the system
imbalance is based on marginal costs i.e the additional cost the TSO would have incurred if the BRP
concerned was not imbalanced – the latter is often implemented to avoid generators speculating on the
direction of the system imbalance — i.e. creating a short position if they expect the system imbalance to be
long and vice versa. However, it is rather doubtful whether generators would change their position on the
basis of a very short-term settlement period. Such ‘‘gaming’’ actions are unlikely to be profitable for
generators and endangering the system security at the same time or, in other words, profitable actions will
normally go hand in hand with actions increasing the system security.
Given the presence of power exchange prices (and possibly penalties), a two-price system no longer
implies a zero sum game for the TSO, which should not have financial interest in the imbalance
settlement. Accordingly, in so far as the difference is not used by the TSO to cover other costs in real-time
(e.g. staffing and IT costs), it should result in a reduction of transmission tariffs. But, even if this is done, it
still entails a transfer of money from inflexible users (such as wind generators) to average users.
Furthermore, a two-price system puts small market parties (again often including wind/solar generators) at
a disadvantage as it involves lower imbalance costs for larger market parties due to netting. For that reason
small market parties are ‘gently forced’ to outsource their balance responsibility. On the contrary, under a
one-price system no extra discrimination is made according to the size of market participants.
Finally a two-price system sometimes includes a multiplicative component or so-called ‘penalty’ that affects
BRPs with regard to their position before real-time. This penalty typically affects negative imbalances more
than positive ones, thus encouraging BRPs to avoid short positions. Other than for BRP motivation to be
balanced (and associated security safeguarding) penalties are imposed for practical reasons such as
accounting (for instance to generate extra revenues for the recovery of intra- settlement period imbalances)
and the recovery of capacity payments.
In so far as they are not cost-reflective, penalties can give rise to undesirable BRP behaviour, including
over-contracting in the wholesale market withholding services for own use and nominating less than the
expected injections. While marginal prices for upward regulation are higher than day-ahead prices,
marginal prices for downward regulation are lower. Note, that in practice, the supply curve for balancing
services is typically not linear. In thermal power systems (contrary to power systems with substantial
amounts of hydro and/or wind power (e.g.Nordicl)) downward regulation is usually relatively easier and
these services are consequently cheaper—i.e. their marginal price deviates less from the day- ahead price
compared to upward-regulating services. Because of this, BRPs in such systems already exhibit a natural

299949/TRD/EFR/01/E 28 March 2013 PiMS/299949/EU Balancing Market/Reports/Issued Reports
30
Impact Assessment on European Electricity Balancing Market
tendency to strive for long rather than balanced positions. For the moment, marginal procurement prices for
upward regulation are usually higher than day-ahead prices. However, the better markets continue to
function, (and the more arbitrage opportunities are exploited) the more day-ahead and imbalance prices will
converge. We note however, that even if both prices are equal, BRPs would still make a difference
between buying energy on the wholesale market or the balancing market. They would rather buy wholesale
to hedge against typically higher and more volatile imbalance prices. This is the case as not all generation
resources can be controlled fast enough to deliver energy in the real-time.
In an ideal situation the TSO should not need to activate any real-time regulating power, or in other words
the theoretical assumption that all BRPs are balanced implies that the market should convey the
appropriate incentives (to be balanced and/or to keep or help restore the system balance). This is achieved
through a single (One) marginal pricing system.
� It provides an incentive to favour imbalances which are helping to resolve the system (own imbalance
position is not relevant)
� Lower balancing costs for "balanced BRPs"
� Facilitates the participation of DSR and local (embedded) generation units
� Incentivises to execute requested power, i.e. inject the amount of power as notified to the TSO
Following the discussion above, our recommendation is to avoid the use of non-market based components
such as power exchange prices and penalties in the imbalance settlement. Implementation of this
recommendation positively affects intermittent generation in three ways. First, an abolition of penalties has
a reductive effect on overall imbalance prices. Secondly, given that the correlation between system
imbalance and individual intermittent power imbalances rises with increasing wind penetration level, wind
generation’s imbalance costs are lower under an imbalance settlement without penalties, (payable only by
those BRPs aggravating the system imbalance (Weber,2009)22
. Third, strategies to avoid short real-time
positions in the case of penalties are often more easily executable and profitable for conventional
generation resources than for say wind generation.
It is important to note that if implementing a pure “one – price” system, TSOs can only pass-on energy
costs via the imbalance price and have no choice but to allocate capacity costs via a socialisation among
grid users or BRPs (as discussed above).
With regards to the choice between “marginal” or “pay-as-bid”;In marginal pricing, also known as uniform
pricing, prices arise from collecting all bids for a specified control action and determining the highest price
(or the average of a top-percentile) as a uniform price for all activated control energy. Auction theory with
regards to a comparative analysis of different pricing methods (i.e. “pay-as-bid” v. “pay-as-cleared or
marginal”) suggests the theoretical outcome is the same whatever rules are used. However, there is a
widely held view that marginal pricing is economically more correct and will lead to a more efficient
allocation of resources than average pricing - Littlechild (2007). In theory, if participants had perfect
foresight, outcomes could be similar under pay-as-bid and pay-as-clear auction models. Under pay-as-bid
all participants would be incentivised to price at the marginal bid/offer to maximise revenue. Awarding all
participants a clearing price set by the marginal plant under pay-as-clear would have the same outcome.
However, participants do not have perfect information and this could lead to pricing and despatch
inefficiencies. A clearing price could produce the more efficient outcome as participants would be
incentivised to bid in at closer to their marginal cost, knowing that if a more expensive reserve capacity
offer is accepted they will receive that price. Price signals would be based on underlying economics, rather
than on participants� imperfect expectations of the system imbalance and the SO’s balancing actions.
Pricing at marginal cost could make it easier to submit bids and offers as parties no longer need to

299949/TRD/EFR/01/E 28 March 2013 PiMS/299949/EU Balancing Market/Reports/Issued Reports
31
Impact Assessment on European Electricity Balancing Market
anticipate the most expensive balancing action in order to maximise revenue. This could create a more
level playing field to participate in the BM.
A cleared price is better in our view because it encourages a single imbalance price model. In comparison
to pay-as-bid, a balancing mechanism with marginal pricing should facilitate more efficient dispatch, make it
easier to prepare bids (and therefore reduce entry barriers and facilitate smaller BSPs), and provide
accurate price signals to all BRPs.
3.5 Other Balancing Market design attributes - linkages with intra-day markets
TSOs may use the same procured products from the Balancing Energy market either to balance the
system or to solve internal grid congestions (local grid constraints). However, when it comes to cost
recovery a distinction must be made between the balancing of the system operations (imbalance/cash out
prices), targeted on individual BRPs, and the transmission service (solving grid constraints) which should
be financed by grid tariffs.
BRPs should be the parties which bear the financial risk (as opposed to the technical risk) of balancing the
grid; they are responsible for imbalances. BRPs may also be BSPs in other words, they have their own
reserve offering plant or load, or they may also have contracts with third parties. In some cases, they do not
have the opportunity to participate in the market (i.e. retailers), but are nonetheless exposed to the financial
risk of being ‘imbalanced’.
Previously in Section 1, it has been discussed that all market segments are different steps of a single
trading process and in reality the physical trade of electricity only takes place in real-time, which is thus the
only true "spot market". The other markets are all "forward markets" that trade derivative products maturing
in real-time on the spot market. The European "target model" provisions for the operation of a liquid intra-
day market as the market that is operating between gate closure of the day-ahead market the physical gate
closure, i.e. the time after which schedules submitted to the system operator may no longer be changed.
The shorter the time lead between intra-day gate closure and the physical gate closure may be, the more
efficient the whole electricity market becomes and this currently is discussed to be set at 1 hour ahead of
real-time operation. There is emphasis in the elusive concept of "liquidity" as in fact liquidity is directly
linked to transaction costs. Without sufficient liquidity, any market participant must fear that his purchases
(or sales) move the market price and make him pay more (respectively earn less) than the unperturbed
market price. In fact, this kind of transaction cost is much more important for energy trade than the pure
transaction fees paid to power exchanges or brokers, which usually are far below 1% of the price. Also for
larger energy companies, the potential liquidity costs are far more relevant than the internal transaction
costs related e.g. to IT systems or trading staff.
In section 2.2 regarding the integration of RES-E, we discussed the concept of how intermittent generation
would expect to use markets for the re-planning process as nearer to the real-time new information arrives
regarding wind speed, temperature, load expectation and generation unit outages. Another use of intraday
markets in competitive environments is to allow for adjustment of infeasible schedules resulting from spot
In our opinion a single pricing system based on marginal costs conveys the appropriate incentives and
encourages maximum participation into the BM.
299949/TRD/EFR/01/E 28 March 2013 PiMS/299949/EU Balancing Market/Reports/Issued Reports
32
Impact Assessment on European Electricity Balancing Market
(day-ahead) markets with simplified designs (linear bid curves, no block bids, etc.). Indeed in Germany and
other European countries there has been a move from in house and informal solutions for handling intra-
day scheduling deviations towards organized markets.22.
Figure 2.3 above demonstrated the statistical correlation between installed wind/intermittent capacity and
total error which would require "adjustments". Given this increasing correlation, wind energy operators will
pay in any market-based short-term adjustment mechanism more for their forecast errors if the wind
penetration increases. With a linear price function on the short-term (intra-day) market the adjustment costs
are simply a linear function of the variance of the (absolute) wind forecast error. If the relative wind forecast
error does not change with the installed wind power capacity the variance and hence the adjustment cost
will increase quadratically with the installed wind power capacity. Moreover, they linearly depend on the
slope of the price function. This slope will be the higher the lower the liquidity in the corresponding market
is.
Consequently, a key issue is to ensure enough intra-day market liquidity. A wind power producer facing the
choice between selling/purchasing in the intraday market or going for imbalance settlement, will usually opt
for the intraday market, given that imbalance prices are typically higher, (or at least they should be).
Whereas in the reserve markets the available bids are substantially predetermined by the reserve
quantities contracted by the grid operators, the liquidity on the intra-day market is not predetermined but is
dependent on market structure and market design and the resulting attractiveness for the power plant
operators to enter the intra-day market. From the view point of a power plant operator, there is also a
potential trade off between entering the intraday market and providing reserves.
An obvious alternative for these operators is not to compensate the errors through market transactions but
rather to use balancing energy provided by the system operator. Which alternative is chosen depends on
the prices on both markets. Also on the supply side, bidding into the reserve market is clearly a substitute
for the power plant owners to short-term sales of power on the spot and intraday markets (Maupas, 2008;
Just and Weber, 2008). Hence the two markets are closely interlinked. From a market design perspective,
the two markets and their interaction should thus be designed in a way to provide incentives to all market
participants for achieving globally efficient market results.
The main difficulty for market actors is that in most European power markets, power-plant owners must
commit their capacities day-ahead either to spot/intraday trading or to balancing services. Changing this
commitment closer to real-time is not possible. Smeers (2008)25
points out that the current designs of day-
ahead, intraday markets and the balancing system in the EU are based on three different organizational
schemes. Smeers argues that “these multiple arrangements violate the finance view that day-ahead,
intraday and real-time are just different steps of a single trading process and hence require a single trading
platform.”
At present it appears to be difficult to implement an intraday market that efficiently processes both energy
and bids for balancing capacity. The difficulties arise primarily because balancing services are acquired by
the TSOs, while electricity in spot and intraday is traded on the power exchange and bilaterally. An
alternative option for joint provision of energy and balancing/intraday services is a fully bilateral market that
allows actors to jointly trade energy and balancing services. It is difficult, however, to see how market
participants could match their supply/demand to a complex set of energy/balancing products with specific
temporal and spatial requirements.
Figure 3.4 below depicts such joint optimisation of balancing capacities and intraday markets and actual
use of balancing energy. In this example, the day-ahead forecast in t-24 underestimates the actual wind

299949/TRD/EFR/01/E 28 March 2013 PiMS/299949/EU Balancing Market/Reports/Issued Reports
33
Impact Assessment on European Electricity Balancing Market
load in t0. The TSO trades positive and negative capacity reserve for balancing at the level of wind forecast
uncertainty that is updated on a continuous basis up to the physical gate closure 1h ahead of real-time
operations. The deviation of wind output from intra-day forecasts is then balanced close to real-time within
the last hour before dispatch (t). Thus the provision of reserve and response capacity adapts to improved
forecasts. Without the benefit of trading capacities in the intra-day market then at t-1, large amounts of
positive and negative balancing reserve capacities would have to be withheld from the market.
Effective implementation of a cross border intra-day market will facilitate an efficient balancing market on a
cross-border basis. An increase in liquidity in the intraday market reduces the impact of distortions in the
balancing markets. With liquid intraday markets, market participants including the TSO will be less obliged
to rely on the balancing markets where distortions from market power may occur.
The linkage between intra-day and balancing markets becomes all the more clear if one considers that
system flexibility increases with increasing lead time.
The lead time that is available to pursue system adjustments determines the generation and demand
technologies that can respond. Within the one hour timeframe, the system offers as we examined above,
three types of response: primary response is available to match unpredicted deviations in time frames from
30 seconds to 15 minutes, secondary response is available within 5 minutes and tertiary response requires
lead times from 15 minute to 1 hour. Only gas turbines, hydro plants, and pump storage have the technical
Figure 3.4: Joint optimisation of balancing capacities and intraday market
Source: Neuhoff

299949/TRD/EFR/01/E 28 March 2013 PiMS/299949/EU Balancing Market/Reports/Issued Reports
34
Impact Assessment on European Electricity Balancing Market
capacity to provide a full start within 15 minutes. Coal and nuclear power stations must already be
operating on part load to be able to contribute short-term responsiveness. With lead times of one hour to
four hours it is possible to start-up combined cycle gas turbines and coal power stations, but longer lead
times are necessary to start up nuclear power stations. With increasing lead-time more types of generation
assets are available to adjust their output.
Many generation assets can only adjust their output close to real-time, if they are already operating
(nuclear, lignite, coal, and certain gas power plants). Only the plants that are operating can provide
negative balancing reserve, while these plants have to operate in part-load to be able to provide positive
balancing power (power plants such as gas turbines that can provide positive balancing power with a cold
start of the turbine often face high variable cost of operation.). Moreover, a power plant is only willing to
decrease its energy sales to provide reserve capacities for balancing markets if the expected price it gets
for actually providing those reserves is able to compensate for the foregone margin (price minus marginal
cost) in the energy market.
Adjustable capacity is therefore highly dependent on the commitment of conventional generation units as
part of energy sales in day-ahead and longer-term markets and the ability to adapt this day-ahead
commitment to the changes in the market within the last 24h before physical dispatch. Therefore, when
information on the wind/solar output increases during the day, reserve capacity no longer required in the
balancing market must be made accessible within the intraday electricity market. At the same time it must
be possible to react to changes in the electricity market by changing reserve capacities to suppliers that are
no longer needed and able to offer their capacity to the balancing markets at lower costs.
Market design needs to allow generators to adjust their energy production and provision of balancing
services in a joint bid, so that they can contribute to an efficient system operation.
3.6 Harmonisation issues
In the Consultant’s opinion cross-border integration of balancing markets requires a defined level of
harmonisation in order to avoid market distortions which may aggravate the already existing distortions
within IEM. In the discussion below we will present some evidence that the implementation of a Common
Merit Order List (full CMO) of the aggregated bids/offer “ladder” between markets which are not
harmonised to a certain level, may lead to increased market distortions and macroeconomic inefficiencies.
In fact, the worry for a CMO and cross-border activation of control reserves is that they might introduce
perverse incentives and/or eliminate present incentives to market parties, without implementing first as a
“pre-requisite” a defined level of harmonisation between the national balancing market arrangements. A full
CMO might actually increase the volumes of control energy demand. Given that the price of control energy
available should increase with the volume required, the impact of a full CMO might therefore be negative.
As mentioned previously there are still important differences between the various existing national
balancing markets arrangements in the IEM. The most important ones are:
� Not harmonized System Operation, control concept of the TSOs, which may even include different
criteria for Security of Supply
� Lack of harmonisation of market design (methodologies for reserve and balancing pricing, imbalance
settlement, procurement time horizons, nominations)
� Regulatory regime differences, like for instance the differences in Regulatory Incentives to TSOs and/or
Market Participants, costs allocation principles, variations in the treatment of intermittent resources (e.g.

299949/TRD/EFR/01/E 28 March 2013 PiMS/299949/EU Balancing Market/Reports/Issued Reports
35
Impact Assessment on European Electricity Balancing Market
full or partial release from balance responsibility for wind) and freedom of dispatch up to real time in
some countries versus an obligation to stick to final nodal notifications in others.
� Lack of harmonisation of reserve products and levels.
These variations entail a distinct division of risks and responsibilities between TSOs and BRPs in different
control areas. These are the four areas where harmonisation efforts should be focused between national
market characteristics. In particular the two most important impacts such lack of harmonisation can induce
are:
1.The reserve capacities and balancing energy market design (and linkages with the other market
segments) should avoid any possibility for BRPs to arbitrage an imbalance position against the position
they took in the wholesale market e.g. by selling day ahead (i.e. having a short position) and then buying
the energy they need in real-time via the balancing mechanism because they might have a cheaper
procurement of their energy needs in the balancing market than on the wholesale market. This has already
been discussed in some detail in the sections above.
2. Differences in the way that imbalance settlement is calculated and apportioned may lead to the
“migration of imbalances” from one country to another with a less punitive imbalance settlement framework.
BRPs in markets with premia/penalties for imbalances will be more inclined to hedge against short
positions by purchasing on forward markets – which has the effect of increasing associated market prices –
and/or by keeping services for own use – which has the effect of reducing the supply of balancing services.
If the forward markets of countries with differing balancing market arrangements are integrated, the impact
on forward market prices is spread over both. Following cross-border balancing implementation, distortions
might become worse and manifest as a “migration of imbalances” from the country with the more punitive
framework for imbalances, to be settled under the less stringent one in the neighbouring market.
An important key design element in our opinion, supported by analytical evidence discussed below, is that
all BRPs including Retail Suppliers and RES-E producers must participate fully in markets and in the
balancing mechanisms. This means they should have the same responsibilities as conventional generators
and be allowed to provide balancing services subject to common rules. To provide a level playing field and
to ensure security of supply, the same principle of imbalance settlement must be applied for load and
generation, for example through a unique common balancing group. This means that all BRPs face a price
risk. In case of an imbalance in their portfolio, they are obliged to obtain “balancing services” from the TSO
at prices that are dependent on the current bids/offers in the Balancing Energy Market. Since these prices
could be very volatile, non-predictable in general, and out of their control, this price risk is significant and
provides incentives to the BRPs to stay in balance. Such an incentivised behaviour by BRPs result in
reduced costs and improved macroeconomic benefits for the market in the whole.
The average transactions on the market for control reserves should be more attractive than average
transactions on the wholesale market. Otherwise the power capacities and volumes would be offered to the
wholesale market. For imbalance settlement (which is compulsory) the opposite should be true. It should
be less attractive to have a transaction on the imbalance market than one on the wholesale market. Non-
response (non- delivery) to a request for control reserves should not be rewarded better than the
corresponding 'penalty' for imbalance.
These incentives do not currently exist to all national balancing markets arrangements. In order to
harmonise towards cross-border integration of the balancing markets the following recommendations are
made for the various regulatory and institutional frameworks to align:

299949/TRD/EFR/01/E 28 March 2013 PiMS/299949/EU Balancing Market/Reports/Issued Reports
36
Impact Assessment on European Electricity Balancing Market
� More flexibility and competition in the bidding results in reduced balancing cost
� Balancing energy Market must also accept the bids of pre-qualified parties that are not participating in
the supply of contracted reserve capacity;
� Incentives for self-balancing of BRPs reduce the required control energy of market parties:
� Enable reduction of system imbalance using passive contribution of BRPs by considering to share more
real-time system balance and balance energy price information with the market;
Prevent creation of additional imbalance caused by arbitrage opportunities for control energy suppliers.
presents the different Regulatory and Institutional Frameworks for Imbalance management. Harmonisation
to facilitate integration on a XB basis and mitigate distortions, should attempt to converge the various
national arrangements towards the model on the upper right hand corner.
Figure 3.5: Different Institutional Frameworks for Imbalance management
Source: TenneT NL
Another example of distortions that differences in regulatory & institutional arrangements may introduce is
the issue of internal congestion management. Grid congestion will result in some balancing offers having to
be accepted “out of merit” due to locational (internal congestion) reasons which may have nothing to do
with actually “balancing” the system. A good example of the process for "tagging out" those bids & offers
into the BM is the mechanism in the GB Energy Balancing Mechanism; when a plant not located in a
congested area is activated for resolving grid congestion then its remuneration is disregarded when
calculating the overall imbalance price. Such an approach has the advantage that it does not “contaminate”
the imbalance price with the impact of other actions by the System Operator. This approach however
implies that there are other transparent mechanisms for recovering and allocating the costs of internal
congestion in the respective national transmission tariffs. An integrated approach to the principle of
“tagging out” for Balancing Energy exchanges would imply “inter-alias” a harmonisation of how internal
congestion is priced in the national arrangements.
299949/TRD/EFR/01/E 28 March 2013 PiMS/299949/EU Balancing Market/Reports/Issued Reports
37
Impact Assessment on European Electricity Balancing Market
However, in the integrated balancing markets of the Nordic region, the four TSOs do not have aligned
regulatory arrangements or as a matter of fact clearly defined rules of how to handle congestions. The
market model is based on co-operation between the TSOs and described as a “TSO-to-TSO model with
Common Merit Order (CMO)”, referred to as the Nordic Regulation Power Market. Balancing energy
markets for replacement reserves are fully integrated while reserve capacity markets are not integrated and
operate separately within each control area. As the same resources that are used for balancing are usually
used for congestion management that means that congestion will sometimes limit the possibilities of using
balancing resources in merit order. Bids that are activated for the purpose of managing congestion are
designated as “special regulation” and are not considered in calculating the balancing price for the
particular hour. However, it should be noted that although special regulation is not supposed to influence
the balancing price for the hour, it still has an indirect effect. Bids that are selected for special regulation will
no longer be available for normal balancing purposes. If mostly cheap bids are used for special regulation,
the remaining bids on the Nordic Common Merit Order Ladder list - NOIS, will be more expensive and the
balancing price will go up. At the same time, if expensive bids are used for special regulation, the
balancing price will go down. However in the 2009 report the Nordic regulators noticed that it is not exactly
clear on what basis and on what rules this selection for relieving congestions is happening apart from
empirical experience of the National Dispatchers. This may create a different market outcome than
intended and introduce distortions. It should be noted that it is not obvious that the lowest price bids will
always be those that minimize the total cost of regulation. Because there are no clearly defined rules on
how to handle congestion, congestion is handled on the basis of operator experience. When balancing
markets over several control areas are integrated, it becomes more and more difficult to assess which
actions will affect congestion, as in general congestion is more prevalent between control areas than within.
This means that there is a possibility that congestion is not handled in an optimal way. A transparent
harmonized framework and concrete common rules are required to resolve the situation.
Special regulation bids are settled pay-as-bid which means that all BSPs whose offers have been accepted
will receive a remuneration equivalent to the price of their actual bid, rather than the bid of the highest
priced bid selected to provide special regulation. TSOs recuperate their costs for special regulation
through network tariffs.
Another issue is that the balancing periods across Europe should be harmonised, and preferably have the
same duration as the period used for imbalance settlement. The choice of duration of the balancing period
is a trade-off between the dynamics of the power system and the possibility of metering. A period of 15
minutes seems currently to be a satisfactory solution to this trade-off.
Finally another important issue of harmonisation is obviously the standardisation of gate closure across all
markets.
In Table 3.4 below we summarise minimum harmonisation pre-requisites (both market/institutional and
technical) and have classified them under two modalities of cross-border exchanges of Balancing Services;
a bilateral or multilateral TSO-TSO model for the exchanges of surpluses (S) of Balancing Services and a
multi-lateral TSO-TSO model with a Common Merit Order (CMO) .

299949/TRD/EFR/01/E 28 March 2013 PiMS/299949/EU Balancing Market/Reports/Issued Reports
38
Impact Assessment on European Electricity Balancing Market
Table 3.4 List of harmonisation pre-requisites for two models of XB – balancing
Exchange of Surpluses Full Common Merit Order
Standardised BS products Market Time Unit (Settlement Period)
A common platform, IT, and remuneration method for exchanges of BS
Common Procurement Rules and Time- Frames
Management of transmission capacity close to or in real time and co-ordination with intra-day time frame
Imbalance Pricing & Settlement mechanisms aligned
Gate Closure Times Netting of Imbalances
BRPs responsibilities harmonised
Merging Re-dispatch and Balancing Markets
Common methodology for sharing of reserves and capacity reservation rules
Alignment of TSO regulatory incentives
Source: Mott MacDonald
3.7 Reservation and use of cross border capacity for Balancing Services
According to the FG the Network Code on Electricity Balancing shall forbid TSOs to reserve cross-border
capacity for the purpose of balancing, except for cases where TSOs can demonstrate that such reservation
would result in increased overall social welfare and provide a robust evaluation of costs and benefits. This
in practice means that exchanges of Balancing Energy can happen if capacity is available post the last
Intraday Gate Closure either because capacity has remained unused by the market or that counter-flows
create such conditions of available interconnection capacity.
With regards to the sharing of Balancing Reserves the FG stipulate that TSOs should consider "potential
benefits from reserve sharing and “CMO" when procuring reserves. Potential means stochastic.
For example:
Assume a TSO needs for N-1 reasons 1000 MW of reserves. On the same time one might be almost 100%
sure that for the next day he can share a part of the required reserves with a neighbour TSO without any
security issue because;
� Stochastically the chance that both of TSOs need those reserves at the same time is really low (ex.
0,5%)
� Day ahead markets cleared in one direction; so one knows that the chance to have congestion in the
other direction on intraday/balancing will be low.

299949/TRD/EFR/01/E 28 March 2013 PiMS/299949/EU Balancing Market/Reports/Issued Reports
39
Impact Assessment on European Electricity Balancing Market
� As transit countries, 99.9% of the time you never have congestion on both borders on the same time in
normal conditions. So it should be possible in such a case to share a part of its reserves without reserving cross border capacity. Moreover, we highlight the differences between dimensioning of reserves and sharing of reserves. While the dimensioning should be performed at LFC Block level and is associated with Security of Supply and responsibilities regarding legal aspects the sharing of reserves main target is to share between several LFC Blocks a part of the dimensioned reserves in order to decrease the total amount of required reserves. The sharing of reserves could be deployed when respecting the following pre requisites:
� Develop cross border balancing energy exchange,
� Perform stochastic studies to define the volume of shared reserve while keeping the same level of risk,
� Define costs/benefits assessment methodology and capacity reservation rules to guarantee that these
shared reserves are available.
The development of cross border energy exchange is a real opportunity to develop the competition
between markets parties (in the limit of real time capacities) and then reduce the overall cost of balancing.
Nevertheless, it will not affect the dimensioning of reserves.
Larger regions reduce the overall demand for balancing and reduce costs for providing balancing power
through a broader portfolio of power plants and additional sources for balancing power. However, larger
regions also include more potential transmission constraints that need to be considered. In some instances
this might imply that at times when transmission lines are congested in one direction, no upward balancing
services can be provided in this direction. At the same time, however, twice the volume of transmission
capacity can be used to provide upward balancing services in the opposite direction against the prevailing
energy flow. This might be more valuable, because in a region with lots of wind output, only limited
amounts of thermal generation capacity are operating and the region would therefore not be in a position to
provide balancing services and upward response capacity. In contrast, the importing country is likely to
have more thermal capacity operating and is therefore potentially better suited to provide upward balancing
services from this capacity.
System Balancing with cross-border products imposes even more taxing responsibilities for TSOs to
assess the physical capabilities of the network and make the most efficient use of these network
capabilities. Both deterministic and probabilistic calculation methods should be used with as much detail as
possible including locational information of balancing resources to be used to further optimise the balancing
of the system and avoid congestions. The functioning of common merit order list shall technically enable
TSOs to benefit from locational information of balancing resources.
Cross-border exchange of Balancing Energy can only be activated subject to grid availability. If energy
cannot be exchanged across borders in real-time, adequate reserves must be committed locally (either in
the form of redundant local reserves or by implementing dedicated system protection schemes such as
interruptible loads). Finally, for both types of services, preventive security rules applied in Europe require
that the feasibility of grid operations is guaranteed and checked in advance.
If we approach the problem from a classic deterministic power system analysis and consideration, then the
following challenges are faced by TSOs:

299949/TRD/EFR/01/E 28 March 2013 PiMS/299949/EU Balancing Market/Reports/Issued Reports
40
Impact Assessment on European Electricity Balancing Market
1. Depending on the choice of generation companies and random events like generation or line outages,
there is a multitude of possible generation dispatch situations to realise a specific export/import exchange.
Consequently, the resulting power flows differ significantly. In other words, with higher cross-border
exchange levels, generation dispatch within one control area has a greater impact on the flows in other
control zones, increasing as such interdependencies between the control zones. As a result, insufficient
coordination and information exchange between the system operators might have an impact on system
security. Finally, the pattern of power flows in the interconnected grid can affect the availability of reserves.
The same resources may be used for congestion management and frequency restoration. Hence, if more
resources must be committed to congestion management, they are not available for restoring post-
contingency security. Furthermore, it is likely that some of the reserves would be unavailable in the event of
congestion within the control zone.
2. In order to realise cross-border balancing exchanges, (entailing new physical exchanges) cross-border
exchange schedules need to be adapted. However, schedule changes are subject to technical feasibility. In
other words, one must be sure that an additional cross-border exchange is both feasible and secure. The
requirements in real time contingency analysis and information exchange between TSOs will grow
exponentially in comparison to the current situation. However, the key issue still lies in the
interdependencies of power flows in the meshed grid and the situational awareness. It is important to
ensure that a perfectly safe transaction on one border does not impair the situation in another part of the
grid.
3. Impact of increased variability of generation dispatch (RES-E impact). The variability of generation
dispatch is closely related to the level of cross-border exchanges. More specifically, it is an aggravating
factor. If a highly variable dispatch is accompanied by low exchange levels, the impact on the neighbouring
control zones is limited. However, if the same happens with already high levels of cross-border exchanges,
there is less capacity left on cross-border lines to accommodate the unexpected power flow variations.
Hence, a situation with high cross-border exchanges and significant variability of generation dispatch is
quite difficult for the TSO to handle. The more predictable the dispatch of a control zone is, the more
certainty can be obtained on the expected pattern of power flows. Unexpected changes. (e.g. following a
generation outage), can significantly alter the power flow pattern.
In recognition of this problem, TSOs exchange power flow data for each hour of the following day. This
allows them to identify possible insecure situations before they actually occur and leaves some time for
preventive security measures. However, in real time, the situation can be different from that expected at the
operational planning stages, e.g. due to intermittent and uncertain renewables. The security analysis
running in real time must take this into account changing dispatch to guarantee that the power system is
indeed operated securely. However, there still remains a problem of information with respect to foreign
control zones. Typically, the models used in security analysis view the outside world in a simplified manner.
This means that although TSOs have a detailed picture of their own control zones, neighbouring control
zones are modelled with a lower level of detail. These models are set to display behaviour as similar as
possible to actual system behaviour. The underlying assumption is that the contribution of the primary
response from foreign systems is quite stable and does not depend on dispatch changes within individual
control areas. In recent years, data exchange between TSOs has been significantly improved, implying
increased situational awareness, (thanks to the exchange of real-time measurements) and an improved
level of detail in the modelling of foreign systems. This increases the accuracy and effectiveness of the
security analysis.
Increasingly however there is another line of thinking and international research to support it, that of
“Predictive Control” using stochastic and probabilistic methodologies, which has not been so far part of the

299949/TRD/EFR/01/E 28 March 2013 PiMS/299949/EU Balancing Market/Reports/Issued Reports
41
Impact Assessment on European Electricity Balancing Market
debate regarding the cross-border reservation of transmission capacity for reserves. In their November
2011 paper (Doorman, Gerard et al26
) claim that it may be possible within shorter time horizons (a week up
to a month) to reasonably predict the flows between two countries. In such cases a neighbouring TSO
could pay for reserve capacity from the other TSO, without reserving transmission capacity. If the cost of
reserve in the other country is significantly lower and the probability of the inter-connection capacity being
available high, the TSO might find the deal worthwhile. The approach does not interfere with other markets,
and it should be up to the discretion of the TSO to decide on the use of this option.
Model Predictive Control (MPC) is widely recognised as a high performance, yet practical, control
technology. MPC is a model-based control strategy that uses predictions of the system response to
generate appropriate control inputs. One of the key features of MPC is its ability to incorporate constraints
into the control solution. However, the effectiveness of MPC is heavily dependent on the accuracy of the
model and its computational complexity (Venkat et al., 2008)27
. Its goal is to determine a control signal to
give as input to a system, optimising a certain objective function or performance index. The word “model” in
the acronym MPC stands for model-based which means that a model is needed to forecast the future
behaviour of the system at future instants. The future outputs depend on past values of inputs and outputs.
The word “predictive” means that optimisation is based on the open-loop prediction of the plant under
control. MPC exploits the knowledge of a dynamical model that describes the behaviour of the system in
the time domain, and is based on an optimisation problem that minimises a cost function, thus leading to
linear or non linear programming. Real systems are often subject to physical restriction and this implies the
imposition of constraints in the problem. The most important component of MPC strategy is the
mathematical model. The interactions between the state variables are described by a set of differential (for
continuous time) or difference (for discrete time) equations. In general, an MPC model should be simple
enough to catch the dynamics of the process, without overloading the optimisation algorithm.
In the context of smart grids and general problems related to power systems, MPC could find several
applications, helping TSOs/BRPs in the process of determining the optimal control signal (for example,
power flows), on the basis of measurements of the state variables (for example, price signals). The classic
MPC approach does not provide any systematic method to handle uncertainties of the prediction model. It
simply assumes that the model is exact and that it describes perfectly the system dynamics, ignoring
process disturbances and modelling errors. Robustness of MPC can rely on a min-max approach, where
the performance index is computed on the worst possible realisation of the process disturbance.
Recently, to solve the problems related to MPC, the Stochastic MPC (SMPC) has been developed
(Couchman P. et al., 2006.); (Primbs J., 2007.). In this approach, statistical information about process
disturbances is exploited to minimise the expected value of the performance index. One of the possible
approaches of SMPC is based on scenario generation, leading to find a solution to a multi-stage stochastic
optimisation problem. SMPC formulation is based on a maximum likelihood approach, where at each step
an optimisation tree is built, using information about the current state of the system. Each node of the tree
represents a predicted scenario, considered in the optimisation problem.
Another view proposed by Smeers (2008)25
is that transmission should be much more integrated in the
current European proposals under the "target model" and balancing markets. Transmission is implicitly
priced at zero in intra-day and at infinity in real time as long as there is no cross-border trade of balancing.
In other words, the fundamental link between energy and transmission that results from the basic
properties of the electricity is abandoned but the basic reasoning is that the link between energy and
transmission prices is established in the real time market and extended by standard economic and finance
arguments to the other markets. There is also no practical reason for not keeping this link between energy
and transmission at all stages of trading. The experience of the PJM interconnected system in the USA,

299949/TRD/EFR/01/E 28 March 2013 PiMS/299949/EU Balancing Market/Reports/Issued Reports
42
Impact Assessment on European Electricity Balancing Market
shows that one can re-assess grid characteristics every five minutes for a system of more than 8000 nodes
and use the information to simultaneously produce electricity and transmission prices at that frequency.
This implies that one can cast day-ahead, intra-day and real-time trading in the same architecture. Using
Power Transfer Distribution Factors - PTDFs and updating them very frequently to adapt the representation
of the grid brings us very close to the finance model that looks at the price formation process as the result
of continuous trading.
Obviously it is not the task of the current project to evaluate the validity or the practicality of such methods,
clearly however the thinking regarding cross-border transmission capacity must allow enough flexibility to
acknowledge that in the future smart system there might be alternative options to the “ex ante” reservation
of cross-border capacity for the delivery of reserves. It is a world of traded portfolios of balancing or
potential balancing energy, where companies (BSPs) can quote a capacity price for reserve and a separate
energy price, and where the capacity price remains constant once contracted but the energy element can
be updated by the BSP, can be traded on and later accepted or not by the TSO.
It is probable in a future integrated IEM, that Balancing Markets and Reserve Capacity procurement would
be combined, the procurement of balancing reserve capacity would take place in a wide range of
timeframes (daily, weekly, monthly, quarterly, yearly, multi-yearly, possibly peak/off-peak) and be backed
by a secondary market for reserves. TSOs would be asked to design their requested reserve products in a
way that enables providers of reserve to back-up each other in cases of planned or unplanned outages or
indeed of congested transmission links
3.8 Integration of demand side into balancing markets
Market liquidity can be increased if all market actors (not just conventional power plants) capable of
providing balancing services can enter the market. Demand Side Response, (DSR), energy storage and
renewable energies especially, have the technical potential to provide their services to the market. At
present, however, only a small share of demand side is actually integrated into the markets. DSR
technologies face low costs for providing reserve capacities, especially for positive balancing power, and
work well for circumstances where the probability that those reserve capacities will be used is low.
Nordpool introduced a harmonization of balance regulation in 2009. The new regulation lowered the bid
size to 10MWh to explicitly encourage demand side participation The implementation of automatic
activation for bids could further reduce the minimum bid size thus providing greater incentives for other
participants apart from conventional generation to enter the market. Denmark introduced such a system in
May 2008 and other Nordic countries are following.
In 2007 in Germany, no demand side participants were pre-qualified and were thus unable to participate in
the balancing market. An improved market design in 2008 allowed DSR technologies to provide balancing
services in the "minute reserve" (RR) market. One aspect of the improved market design was the
introduction of a day-ahead auctioning of minute reserve capacities and a reduction of the minimum
capacities for prequalification to 15 MW. Energy intensive industries made use of their DSR-potentials and
provided approximately 20% of the hourly demand for reserve capacities in the tertiary balancing market. In
the secondary reserve market technologies have to commit their balancing potentials on a monthly basis.
DSR technologies, however, strongly depend on the downstream production process. A monthly pre-
commitment cannot be met by most players with potential DSR technologies. Demand side management
might further provide load shifting from peak to off-peak and low-wind to high-wind periods.
Tight access rules still prevent large potentials of demand side from engaging in balancing markets. One
pertinent criterion to market access is the lead-time and duration of a pre-commitment to the reserve and

299949/TRD/EFR/01/E 28 March 2013 PiMS/299949/EU Balancing Market/Reports/Issued Reports
43
Impact Assessment on European Electricity Balancing Market
balancing markets. Only a day-ahead auction provides sufficient incentives for demand side to participate.
In addition, a reasonable market design must be implemented that allows small units to engage in the
market. The US experience suggests that demand side investment follows once a market design is
implemented that provides a long-term, credible framework and justifies the added cost of time and capital.

299949/TRD/EFR/01/E 28 March 2013 PiMS/299949/EU Balancing Market/Reports/Issued Reports
44
Impact Assessment on European Electricity Balancing Market
4.1 Overview and underlying Principles
Quantification of the costs and benefits of cross-border exchange of Balancing Energy and exchanging and
sharing of Balancing Reserves has proven challenging due to the complexity of real world systems and the
required granularity of the data. To give an example of the magnitude of the problem, the balancing data for
the GB system alone with its approximately 350 active BMUs submitting 5 pairs of bids/offers together with
technical constraints provided for every settlement period (30 minutes), requires processing of
approximately 150 million data points for a single year of operation. A comparative analysis of balancing
markets integration would require this amount of data to be coupled and processed with that of each and
any other jurisdictions that were being considered as part of the integrated balancing market.
Nevertheless and despite the difficulties in securing historical data which were eventually resolved with the
help of ACER, the quantitative analysis considered the benefits of cross-border balancing coupling in two
important European regions which have so far implemented some kind of integration of their Balancing
markets; Great Britain - France and the Nordic Countries encompassing the Finnish, Swedish, Norwegian
and parts of the Danish systems. For the analysis we have used the historical Balancing Data for the year
2011.
We have also developed a “generic model” representing two typical large European Systems with various
levels of penetration of wind generation capacity, to analyse the benefits of exchanging balancing energy
and Reserves and the linkages with the interconnection capacity. Additionally we have developed a pan-
European model “representative” of future EPS data, in order to assess the benefits of exchanging and
sharing Balancing Reserves across borders.
The objective of these analyses was to estimate the magnitude of the welfare gains available through the
integration of balancing markets – i.e. whether they are they negligible or material and the comparative
benchmarking of different models of integration. The Consultant has used four different approaches to
determine the benefits of integrating the European Balancing markets; these approaches are:
� Using historical bid/offer data and interconnector availability between France-Great Britain & the Nordic
countries to model the impact of exchanging balancing energy on balancing costs.
� Time series (regression) analysis of the relationship between balancing prices and market indices for
two interconnected jurisdictions (UK, France), where trading of balancing energy has been introduced.
� Modelling two similarly sized jurisdictions with varying levels of penetration of intermittent generation
� Modelling the benefits of cross-border exchanging and sharing of balancing reserves services between
member states of a projected future (2030) pan-European power system.
The exchange and sharing of reserves aims to optimize the provision of the required amount of reserves
capacity (in MW) resulting from the reserves dimensioning processes. It is important to understand the
distinction between “exchanging” and “balancing” of reserves. By exchange of reserves we mean a TSO
can procure part of its reserves within the area of another TSO in order to ensure the provision of the
4. Quantitative Analysis – Benefits of Balancing Markets Integration

299949/TRD/EFR/01/E 28 March 2013 PiMS/299949/EU Balancing Market/Reports/Issued Reports
45
Impact Assessment on European Electricity Balancing Market
required amount of reserves resulting from the reserve dimensioning process. The exchange of reserves
changes the geographical distribution of reserves without changing the total amount of reserves in the
system.
The sharing of reserves allows two or more TSOs to rely on the same reserves in order to ensure the
provision of the required amount of reserves. As it is very unlikely that a couple of TSOs would need to
activate their full amount of reserves at the same time, this may result in a potential to reduce the amount
of reserves to be provided by these TSOs and to make common use of part of the reserves. This is called
the ‘sharing’ of reserves. The sharing of reserves may change the total amount of reserves in the system.
The following sections describe the methodologies in detail and provide the underlying principles that
underpin them. The results for the four quantitative analyses are provided, while model validations are
included in Appendix A.
4.2 Modelling analysis of welfare gains from trading Balancing Energy using
historical data (2011) from the GB – France systems
We have simulated the operation of balancing markets in Great Britain and France operating on a stand-
alone basis and running on a coupled basis to assess the potential gains from trading balancing energy
using historical data for the calendar year 2011. A non-linear optimisation algorithm has been applied to
determine the least cost mix of offers and bids submitted by Balancing Service Providers (BSPs) in each
country that resolved each system imbalance for every Settlement Period. For the “stand alone” case we
have assumed no internal transmission constraints and no exchanges with other neighbouring systems.
For the coupled system scenarios the optimiser assumed a role of a “super TSO” finding the least cost
solution to system imbalances drawing upon all offers/bids, subject to not breaching the available
interconnector capacity (for both directions) at each settlement period.
Price offers and bids are made in reference to a balancing unit’s physical position and constrained by the
maximum (export) capacity and minimum stable generation limits. In the cases where trading (cross-border
exchanges) were allowed the model assumed no automatic netting of imbalance positions, but aimed to
resolve imbalances through available bid offers. This is an important point worth emphasizing that our GB-
France model has not assumed any “netting of imbalances effect”.
The model’s objective function is the cost of resolving the energy imbalances in two systems using own
resources and trading, where the costs are the bid and offer prices. Since accepted bids represent
negative costs these are “netted-off” the total system costs.
The main data inputs for the modelling were:
� BSP unit level data:
− Bid/offer prices including the capacity step for each trading period (PTU is assumed equal to 30
minutes for the purpose of this exercise)
− Maximum output and minimum stable generation (MSG) limits for each BSP
− Final physical position valid for each settlement period

299949/TRD/EFR/01/E 28 March 2013 PiMS/299949/EU Balancing Market/Reports/Issued Reports
46
Impact Assessment on European Electricity Balancing Market
� Overall system level data:
− Net physical position of system at gate closure for each trading period.
− Net available interconnector transmission capacity (expressed for two directions) for each trading
period.
� Exchange rates:
− Daily spot currency exchange rates obtained from the Bank of England - applied to bid and offer
prices.
After conducting trials using a simple Excel based add-in optimiser (Lindo’s What’s Best) the model was
converted to AIMMS modelling suite to facilitate optimisation over a full year.
Despite the sizable computational task the data has presented, the model still offers a simplification of the
optimisation algorithms used by TSO’s. The major limitation is that in the real world, offers and bids are
dynamically adjusted, in other words, any change in the rules regarding who can participate in a market
and any change in the size and scope of the market itself, would also lead to parties modifying their
offer/bid prices strategy and behaviour. Secondly, the model treats each settlement period discretely and
does assume the imbalance is ex-ante known to the TSO. This completely removes the need to activate
counter-bids to deal with unforeseen events, which is what happens in the real world. Furthermore, the
half-hourly time resolution of system imbalance used as the demand variable in the optimisation, hides the
true variability present in balancing supply and demand in the real time. Large scale occurrences which are
short in duration are misrepresented or hidden from view and hence impossible to replicate within the
modelling environment.
This does not however mean that our partial static analysis is invalid, but it suggests that it does not show
the whole picture. On balance, we believe that it passes the test for showing the broad magnitudes of the
available benefits from trading balancing energy cross-border.
The next two sections outline the methodological steps and assumptions we applied in order to complete
the analysis for the GB and France. We then discuss the three modelling scenarios and present the
results. The model validation is included in the Appendix A.
4.2.1 Data and modelling assumptions for the UK
A number of assumptions and adaptations were made in order to prepare the data sets for modelling:
� Power plant start-up costs were not available and were consequently not included. Similarly, the
technical constraints on plant ramp profiles were not known.
� Downward regulation was assumed to be delivered only by plants that were in operation - plant de-
loading. The demand side of the market was not modelled.
� The DMAT, NIV, PAR adjustments as well as the Transmission Loss Multiplier have not been applied as
they are not material for the purpose of this analysis.

299949/TRD/EFR/01/E 28 March 2013 PiMS/299949/EU Balancing Market/Reports/Issued Reports
47
Impact Assessment on European Electricity Balancing Market
� The plant technical constraints notified at gate closure (and included in the bid offers) were reconciled
with subsequent revisions. This removed inconsistencies between maximum export limits achievable
and generation outputs contained in the notifications. Bid offers which did not include a full set of
constraints were completed using best available knowledge.
These modifications were necessary to take account of real world occurrences (power plant trips, etc) and
the lack of care on part of plant operators in submitting the bids. The process was very time consuming, but
was needed to remove all data inconsistencies preventing the solving of the model.
To confirm the expectation of net system position bias, given the punitive dual cash-out regime in the UK,
we have plotted its distribution for the full year (2011). The vertical axis represents the number of trading
periods (frequency) and the horizontal axis the total MWs of net system imbalance. The visible bias for
downward regulation might have implications for applicability of findings (trade benefits) to other
jurisdictions. Furthermore, the chart illustrates that demand for balancing services is frequently very low in
comparison to the existing interconnector capacity, which indicates that most benefits of balancing energy
trade should be achievable with existing infrastructure.
To gain an insight into expected patterns of trade between France and UK we also looked at average
balancing prices that occurred in 2011. The volume-weighted balancing prices for upward and downward
regulation are shown in Figure 4.2
This shows that there is a significant price differential between the two jurisdictions with UK being the
higher cost one. On this basis we would expect the following trading pattern:
− UK importing lower cost offers from France (upward regulation)
− France exporting surplus energy to the UK (downward regulation)

299949/TRD/EFR/01/E 28 March 2013 PiMS/299949/EU Balancing Market/Reports/Issued Reports
48
Impact Assessment on European Electricity Balancing Market
Figure 4.1: Frequency of Net system position in the UK for 2011 (number of trading periods vs MW of net
imbalance)
Source: Mott MacDonald, based on data from National Grid
Figure 4.2: Historical volume weighted imbalance price (€/MWh)
Source: Mott MacDonald
0
10
20
30
40
50
60
70
80
Upward regulation Downward regulation
UK France

299949/TRD/EFR/01/E 28 March 2013 PiMS/299949/EU Balancing Market/Reports/Issued Reports
49
Impact Assessment on European Electricity Balancing Market
4.2.2 Data and modelling assumptions for France
Out of the three types of balancing bids for Replacement Reserves in France only Implicit Offers (balancing
bids from generators able to offer bids higher than 10 MW, according to current applicable rules on the
French Balancing Mechanism) have been utilised. Explicit Offers, which are balancing bids for other
balancing entities defined by volume (loads, balancing entities at connection points, aggregate set of
balancing units & balancing entities connected to the distribution network), have been excluded due to
partial data unavailability (downward bids) and the difficulty of implementing them in our model
simultaneously with other types of offers. Similarly, data (balancing bids for thermal generators that have a
nominal generation quantity of 100MW or more and can have a production equal to 0MW during a part of
the day) proved difficult to obtain.The volume of Explicit Offers can represent about 25% of the yearly
upward regulation, whereas downward explicit offers are negligible at 5%.
Similarly to the UK market,, “manual intervention” was necessary to remove any inconsistencies and
incompleteness related to plant technical constraints that were preventing solving the model.
Under normal circumstances the full Implicit Offers include the following parameters:
� Price of Bid/Offer pair
� Generation schedule (physical position)
� Maximum available power (maximum export limit)
� Technical minimum of power generation (stable export limit)
� Maximal duration (of reserve utilisation) for hydro-power and thermal-power units
� Maximal offered quantity of balancing power (i.e. maximal generation increase, in case of up-regulation,
or maximal generation increase, in case of up-regulation)
� “Mobilisation delay”: time delay between the beginning of regulation power delivery and the time of bid
activation.
However, the dataset we received from the RTE included only price information, generation schedule and
maximum available power. As a good approximation minimum stable generation was manually derived
according to the following rule: 0 for hydro generation units and 1/3 of MEL for thermal (including nuclear)
units.
Although the start-up costs for thermal and nuclear plants were received, this information was not used so
as to maintain parity with the UK system for which the data was not available.
Furthermore, the validity period of French bid offers varies with time of the day, whereas in the UK all bid
offers are valid for 30 minute time blocks only. For this reason the French dataset with 11 Gates at: 0:00,
2:00, 4:00, 6:00, 8:00, 10:00, 12:00, 14:00, 16:00, 18:00 and 20:00 was manipulated to match the half-
hourly time resolution of bid offers in the UK.
Frequency distributions of net system positions for France are plotted in Visibly, there is no discernible bias
in any direction and the magnitude of imbalances, although larger than in UK, is still reasonably small in
relation to interconnection infrastructure.

299949/TRD/EFR/01/E 28 March 2013 PiMS/299949/EU Balancing Market/Reports/Issued Reports
50
Impact Assessment on European Electricity Balancing Market
Figure 4.3: Net system position for France in 2011 (number of trading periods vs MW of net imbalance)
Source: Mott MacDonald, based on data from RTE
It should be noted that due to the fact that the datasets for both countries did not contain dynamic data we
did not take dynamic constraints into consideration. It is also unclear what type of bids and offers the TSOs
would want to reserve, in terms of their dynamic characteristics.
4.2.3 Description of scenarios
Three scenarios of trading arrangements were considered:
� Unconstrained trade (Common Merit Order – full CMO):
Under this model participating TSOs (in our analysis NGC and RTE) are assumed to construct a Common
Merit Order List of all their Bids & Offers in their respective Balancing Mechanism. Then an “activation
optimisation function” shall optimise the activation of Balancing Energy Bids from the Common Merit Order
List through a non-discriminatory, fair, objective and transparent mechanism by optimization of the use of
Balancing resources and of the transmission infrastructure and minimizes the costs of Balancing whilst
taking into account all TSO activation requests, technical and network constraints.

299949/TRD/EFR/01/E 28 March 2013 PiMS/299949/EU Balancing Market/Reports/Issued Reports
51
Impact Assessment on European Electricity Balancing Market
Each TSO submits activation requests for Standard Balancing Energy Products to the Activation
Optimisation Function. The matched bids out of the Activation Optimization Function shall be activated by
the “Connecting” TSO. The activated BSPs are responsible for delivering the requested volume until the
end of the delivery period. The Activation Optimisation Function shall submit confirmation of activated bid to
the TSO requesting the activation of the bid
Obviously a Common Merit Order List shall consist of Balancing Energy Bids for standardised Balancing
Energy product utilised by both TSOs. Upward and downward Balancing Energy Bids shall be separated in
different Common Merit Order Lists. In this model TSOs are assumed to include all the bids/offers received
or contracted from BSPs and shall not modify or withhold any bids.
Furthermore and on the basis of “fairness” a TSO should be entitled to request Balancing Energy from
other TSO(s) up to the total volume of all Balancing Energy Bids submitted to the CMO list by the
requesting Transmission System Operator.
In our analysis no constraints other than actual interconnector availability for balancing purposes (priority is
provided to day-ahead / intraday trades and their respective capacity reservations)
� Exchange of surpluses:
Under this model (which is the current Balit mechanism in implementation between GB and France) each
TSO separately calculates the total amount of reserves required in a merit order (cost optimisation) basis.
In the case the amount of total bids/offers exceeds the reserve requirements, then the respective TSO
makes available those bids/offers to the neighbouring TSO. In the specific case of our analysis that means:
− exclude 2200MW of lowest cost offers in UK from trade (domestic use only)
− exclude 1500MW of lowest cost offers in France from trade (domestic use only)
− exclude 1000 MW of most beneficial bids in UK from trade (domestic use only)
− exclude 1000 MW of most beneficial bids in France from trade (domestic use only).
All other remaining bids/offers in each country were made available for trade under an “assumed CMO” list.
� Common Merit Order (CMO) with Margins (not fully modelled – simulation run for 1 month only):
Under this model each TSO is assumed to withhold (not share) an amount for reserves from the total of
bids/offers received, equal to its minimum calculated requirements, but on an “inverse merit order” basis
(i.e. the least cost effective) and make all the others bids/offers available to a CMO list with neighbouring
TSO(s).
In our analysis this means:
− exclude 2200MW of most expensive offers in UK from trade (domestic use only)
− exclude 1500MW of most expensive offers in France from trade (domestic use only)
− exclude 1000 MW of least beneficial bids in UK from trade (domestic use only)
− exclude 1000 MW of least beneficial bids in France from trade (domestic use only)

299949/TRD/EFR/01/E 28 March 2013 PiMS/299949/EU Balancing Market/Reports/Issued Reports
52
Impact Assessment on European Electricity Balancing Market
4.2.4 All other bids/offers were assumed to be made available for trade under CMO
list Trading with Margins
At the screening stage it was determined that the “trade with margins” scenario would produce very similar
results as the scenario where trade was unconstrained. This was based on two model runs which were
needed to flag the bids and offers that were to be reserved for domestic use. Examination of the reserved
bids and offers revealed that the bid offers to be excluded were extremely uneconomical and would never
be traded nor accepted domestically. Figure 4.4 and Figure 4.5 show the price duration curves for the
excluded prices for upward regulation and downward regulation respectively. To confirm this we performed
a model run for one month and obtained nearly identical volumes of energy traded between the two
countries.
Furthermore, it was thought that given the fact that neither of the datasets reviewed contained the dynamic
constraints on plant ramping it would be impossible to truly determine the bid offers that a TSO would want
to reserve for domestic use to maintain secure margins. Under the both systems, plant operators have a
freedom of avoiding the participation in the balancing market by either pricing themselves out or through
notification of technical constraints (i.e. very slow ramp rate). Hence, the reservation of unattractive offers
solely on the basis of price omitting the dynamic constraints could result in selecting the offers that were
otherwise not technically achievable. This clearly applies to the surpluses scenario as well. It also highlights
an important point about the scenario definition, namely that bid/offer reservation should take account of
achievable response times to be more representative of the real world needs.
Figure 4.4: Average price for the upward regulation offers that have been reserved for domestic use
under the ‘margins scenario’
Source: Mott MacDonald

299949/TRD/EFR/01/E 28 March 2013 PiMS/299949/EU Balancing Market/Reports/Issued Reports
53
Impact Assessment on European Electricity Balancing Market
Figure 4.5: Average price for the downward regulation bids that have been reserved for domestic use under
the ‘margins scenario’
Source: Mott MacDonald
4.2.5 Results
Annual welfare benefits from unconstrained (full CMO) balancing energy trade (exchanged between two
Annual welfare benefits from unconstrained (full CMO) balancing energy trade (exchanged between two
countries) for the year 2011 were estimated at € 51 million a year and are shown in Figure 4.6 (in other
words Balancing is achieved on the combined system with reduced costs of such an amount which reflects
the increased allocative efficiency enabled through the extended application of the CMO List). These
savings correspond to the case where balancing trades can be made on the available interconnector
capacity after normal energy trading. Furthermore, balancing trade with reservation of the most economical
bid offers (exchange of surpluses) reduces the benefits to the still very substantial € 40 million a year
(Figure 4.6). It is worth mentioning that the hypothetical case, where full interconnector capacity was
reserved for balancing (2 GW) the annual benefits would have been a little higher than € 56 million / year
(not shown in graph).
The annual benefits appear to be an order of magnitude larger than the costs of introducing the new
systems in terms of project management & quality control, new hardware, communications links, costs of
settlement between TSOs and new software. NGC reports that the implementation of cross-border trading
considered for a large information systems project by a large corporation would be in the order of £1
million, while the similar project for the new South Ireland Interconnector was approximately € 1 million. No
significant annual operational costs are observed beyond the initial capital investment. TenneT -
Netherlands reports that the estimated costs for the implementation of the new IGCC with Germany is of
the order of € 300 k. The clear conclusion is that trading in Balancing Energy could generate considerable
net benefits.
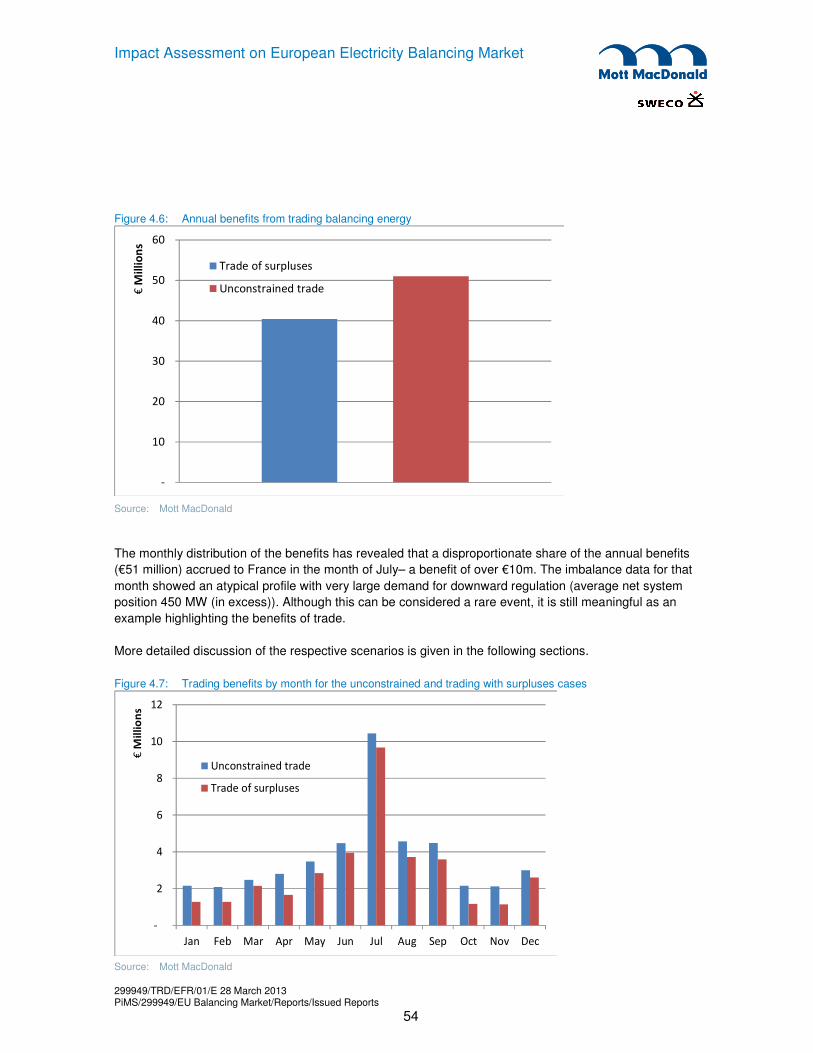
299949/TRD/EFR/01/E 28 March 2013 PiMS/299949/EU Balancing Market/Reports/Issued Reports
54
Impact Assessment on European Electricity Balancing Market
Figure 4.6: Annual benefits from trading balancing energy
Source: Mott MacDonald
The monthly distribution of the benefits has revealed that a disproportionate share of the annual benefits
(€51 million) accrued to France in the month of July– a benefit of over €10m. The imbalance data for that
month showed an atypical profile with very large demand for downward regulation (average net system
position 450 MW (in excess)). Although this can be considered a rare event, it is still meaningful as an
example highlighting the benefits of trade.
More detailed discussion of the respective scenarios is given in the following sections.
Figure 4.7: Trading benefits by month for the unconstrained and trading with surpluses cases
Source: Mott MacDonald
-
10
20
30
40
50
60
€M
illi
on
s
Trade of surpluses
Unconstrained trade
-
2
4
6
8
10
12
Jan Feb Mar Apr May Jun Jul Aug Sep Oct Nov Dec
€M
illi
on
s
Unconstrained trade
Trade of surpluses

299949/TRD/EFR/01/E 28 March 2013 PiMS/299949/EU Balancing Market/Reports/Issued Reports
55
Impact Assessment on European Electricity Balancing Market
4.2.5.1 Projected benefits from trading under CMO and “Surpluses” cases
The total annual benefits from trade are estimated at approximately €51m for the unconstrained (full CMO)
trading cases and €40m for the case trading with surpluses. However, if one were to dismiss the July
imbalance occurrence as an extremely rare event the annual figure would be approximately €6 million less
in both cases.
The monthly distribution of benefits from trade are shown in , with the July event clearly visible.
4.2.5.2 Pattern of trading
Unconstrained trading (full CMO) case below shows the volume of trade between France and UK under
the Common Merit Order scenario. As expected the trade of French surplus energy in the month of July is
an outlier.
One interesting aspect is the presence of ‘counterintuitive’ trades (contrary to predominant price
differential): France importing UK offers and UK exporting excess to France. These trades represent very
infrequent trade opportunities between the two countries that were identified thanks to the use of high
frequency data.
Figure 4.8: The monthly volumes of balancing products traded under the unconstrained trade scenario
Source: Mott MacDonald
0
50
100
150
200
250
300
350
400
January February March April May June July August September October November December
En
erg
y t
ran
spo
rte
d (
MW
h)
Th
ou
san
ds
UK importing French offers
France exporting excess to UK
France importing UK offers
UK exporting excess to France

299949/TRD/EFR/01/E 28 March 2013 PiMS/299949/EU Balancing Market/Reports/Issued Reports
56
Impact Assessment on European Electricity Balancing Market
The corresponding annualised figures are shown in Figure 4.9: The annual volumes of balancing
products traded under the unconstrained trade scenario. The significant amount of the ‘counterintuitive’
trades is notable (the two bars on the right hand side).
Figure 4.9: The annual volumes of balancing products traded under the unconstrained trade scenario
Source: Mott MacDonald
The following and Figure 4.11, show the ratio of total balancing energy demand to balancing energy
imported (i.e. the share of energy demand satisfied through trade) for France and UK, respectively,
achieved under the unconstrained trade scenario. For France we see very high dependence on exporting
surpluses to the UK, while for the UK we see a high dependence on importing offers from France. Both
graphs confirm the expected pattern of trade based on price differentials between these two countries, but
also necessitate the question whether such high dependence on trade for system security is possible.
0.00
0.20
0.40
0.60
0.80
1.00
1.20
1.40
1.60
UK importing
French offers
France
exporting excess
to UK
France
importing UK
offers
UK exporting
excess to France
MW
h M
illi
on
s

299949/TRD/EFR/01/E 28 March 2013 PiMS/299949/EU Balancing Market/Reports/Issued Reports
57
Impact Assessment on European Electricity Balancing Market
Figure 4.10: The annual volumes of balancing products traded under the unconstrained trade scenario
Source: Mott MacDonald
Figure 4.11: Share of UK balancing demand obtained through trade under the unconstrained trade
scenario
Source: Mott MacDonald
Trading with Surpluses
The monthly pattern of trade under the “surpluses” scenario is shown in Figure 4.12, while the annual
average is shown in Figure 4.13.
0.00
0.20
0.40
0.60
0.80
1.00
1.20
1.40
1.60
UK importing
French offers
France
exporting excess
to UK
France
importing UK
offers
UK exporting
excess to France
MW
h M
illi
on
s
0%
10%
20%
30%
40%
50%
60%
70%
80%
90%
100% Upward regulation
Downward regulation

299949/TRD/EFR/01/E 28 March 2013 PiMS/299949/EU Balancing Market/Reports/Issued Reports
58
Impact Assessment on European Electricity Balancing Market
Figure 4.12: The monthly volumes of balancing products traded under the trade of surpluses scenario
Source: Mott MacDonald
Figure 4.13: The annual volumes of balancing products traded under the trade of surpluses scenario
Source: Mott MacDonald
The notable feature here is that in comparison to the unconstrained trade scenario, there is a marked
reduction in the “counterintuitive” trades (France importing energy, UK exporting surplus), while the firm
trades, based on the average price differentials, have barely changed.
The point to be drawn from this is that the trade benefit for two jurisdictions where there is little significant
price differential is uncertain, and even more so if the countries engage in protection of the most
economical bids and offers.
0
50
100
150
200
250
300
350
400
January February March April May June July August September October November December
En
erg
y t
ran
spo
rte
d (
MW
h)
Th
ou
san
ds
UK importing French offers
France exporting excess to UK
France importing UK offers
UK exporting excess to France
Series1, UK
importing
French offers, 1
Series1, France
exporting
excess to UK, 1
Series1, France
importing UK
offers, 0
Series1, UK
exporting
excess to
France, 0
En
erg
y t
ran
spo
rte
d (
TW
h)

299949/TRD/EFR/01/E 28 March 2013 PiMS/299949/EU Balancing Market/Reports/Issued Reports
59
Impact Assessment on European Electricity Balancing Market
Figure 4.14 and Figure 4.15 show the share of trade in meeting the total demand in France and UK,
respectively. This shows broadly the same reduction for the two countries, in relation to the unconstrained
case.
Figure 4.14: Share of French balancing demand obtained from trade under the surpluses trade
scenario
Source: Mott MacDonald
Figure 4.15: Share of UK balancing demand obtained from trade under the surpluses trade scenario
Source: Mott MacDonald
0%
10%
20%
30%
40%
50%
60%
Upward regulation
Downward regulation

299949/TRD/EFR/01/E 28 March 2013 PiMS/299949/EU Balancing Market/Reports/Issued Reports
60
Impact Assessment on European Electricity Balancing Market
4.3 Time series analysis utilising “aggregated data”
We have carried out a regression analysis of the relationship between the balancing prices and the market
indices and the volumes of imbalance energy under short or long system positions. This approach closely
follows that of K. Skytte (“The regulating power market on the Nordic power exchange Nord Pool,” Energy
Economics, vol. 21, Issue 4, pp. 295–308, Aug. 1999). Our econometric model describes the dependence
of the balancing market price on the regulating volume and the spot market price. This model definition
enables the disentangling of the impact of day-ahead spot market prices, which reflect the equilibration of
aggregate demand and supply, from the real-time power imbalance volume.
It was anticipated that the most important correlation would be between the balancing market price
premium and the day-ahead market price. The relevant regression coefficients would then be interpreted
as the marginal regulating power prices per unit of regulated power.
Skytte’s approach differentiates between times when the system is short and long. This is particularly
important for our analysis as it is expected that the effect of cross-border exchange on balancing prices is
negative when the system is short (cross-border exchange reduces the balancing prices bringing them
closer to the day-ahead price) and positive when the system is long.
The mathematical expression of the model which was used is:
ttPPR ⋅=φ
])([1 ηκµλ +⋅+−⋅+⋅⋅+
>XBDSP
tttDS tt (1)
])([1 βγδα +⋅+−⋅+⋅⋅+
<XBDSP
tttDS tt (2)
Where PRt is the balancing price, Pt is the day-ahead price, St is the amount announced at the spot market
and Dt the actual delivery. (St-Dt) is the amount of balancing. Cross-border is a variable indicating when
the balancing exchange became available. Equation (1) describes a long system and therefore κ is
expected to be positive whilst in equation 2 the equivalent constant, γ is expected to be negative. In other
words the expectation is that the existence of the cross-border exchange will force the prices towards the
day-ahead price no matter if the system is short or long.
The same model has been used for both UK and France. In order to run our analysis we have used SPSS
v20 by IBM.
The following results were obtained:

299949/TRD/EFR/01/E 28 March 2013 PiMS/299949/EU Balancing Market/Reports/Issued Reports
61
Impact Assessment on European Electricity Balancing Market
Table 4.1: Regression Results for France
FRANCE
Un-standardised Coefficients
Standardised Coefficients
t Sig. B Std. Error Beta
1 Φ 0.988 0.006 0.967 178.146 0.00
Α 0.063 0.006 0.040 10.387 0.00
Μ -0.005 0.000 -0.029 -21.890 0.00
∆ -0.014 0.000 -0.073 -55.750 0.00
Λ -0.758 0.006 -0.555 -130.255 0.00
Β 18.264 0.171 0.198 106.860 0.00
Κ 1.740 0.207 0.008 8.392 0.00
Γ -2.963 0.212 -0.013 -13.944 0.00
Η 17.940 0.143 0.208 125.686 0.00
Source: Mott MacDonald
Table 4.2: Regression Results for UK FRANCE Un-standardised
Coefficients Standardised Coefficients
t Sig.
B Std. Error Beta
1 Φ 0.889 0.005 0.793 183.315 0.000
Α 0.593 0.006 0.312 92.920 0.000
Μ 0.003 0.000 0.017 10.968 0.000
∆ 0.036 0.000 0.115 79.412 0.000
Λ -0.562 0.006 -0.389 -94.228 0.000
Β 0.398 0.243 0.004 1.636 0.102
Κ 6.517 0.138 0.055 47.126 0.000
Γ -14.061 0.204 -0.081 -68.927 0.000
Η 16.394 0.195 0.236 84.011 0.000
Source: Mott MacDonald
Both of the models had very low F- values (“Sig.” values, which indicate that the models were statistically
significant) and all of the variables entered into the models were significant with the exception of β in the
UK model. As expected the introduction of the cross-border exchanges of balancing services had a
statistically significant impact in both countries. In both countries as expected, the introduction of the cross
border forced the balancing prices towards the day-ahead prices as in both cases κ was negative while γ
was positive.

299949/TRD/EFR/01/E 28 March 2013 PiMS/299949/EU Balancing Market/Reports/Issued Reports
62
Impact Assessment on European Electricity Balancing Market
For the French system it can be concluded that the introduction of cross-border increased the balancing
price by €1.74 when the system was long and reduced it by €2.96 when the system was short (“K” and “Γ”
coefficients respectively). These figures are the results from the regression model as described above.
The results of the UK cannot be interpreted with the same confidence because the intercept of the
regression for the cases when the system was short is statistically insignificant. This means that the effect
of the introduction of cross-border exchanges cannot be differentiated from the system short position.
Nevertheless the introduction of cross-border exchanges was shown to increase prices by £6.52 in the
cases when the system was long. The difference in significance between the short and the long cases can
be attributed to the fact that the UK system is usually long and therefore more data-points were available
for analysis in the long cases (two thirds of half-hourly periods were long).
In both cases φ was very close to unity (France 0.988 and UK 0.889) which means that the variation of the
balancing price when the system is neither long nor short can be attributed to the variation of the day-
ahead price.
The predictive power of both models was high. The UK model had an R2 of 94.1% and the France model
had an R2 of 91.2%.
The figures below show a good fit between the predicted and the real observed balancing prices.
Figure 4.16: Model Predicted versus observed balancing prices France
Source: Mott MacDonald
-500
0
500
1000
1500
2000
2500
3000
3500
20
05
20
05
20
05
20
06
20
06
20
06
20
06
20
07
20
07
20
07
20
07
20
08
20
08
20
08
20
08
20
09
20
09
20
09
20
09
20
10
20
10
20
10
20
10
20
11
20
11
20
11
20
11
€/Μ
Wh
Balancing Price Predicted Balancing Price

299949/TRD/EFR/01/E 28 March 2013 PiMS/299949/EU Balancing Market/Reports/Issued Reports
63
Impact Assessment on European Electricity Balancing Market
Figure 4.17: Model Predicted versus observed balancing prices UK
Source: Mott MacDonald
A longer dataset was available for France (April 2005 to December 2011). The dataset for the UK covered
the period from June 2008 to March 2012). The cross-border exchange started its operation in December
2010 and the κ and γ coefficients of our models carried the expected signs for both countries.
The dataset for the French system was obtained from RTE (Réseau de transport d’électricité) in
combination with some information from the EPEXSPOT (European Power Exchange). The source of the
UK dataset was Elexon.
Both datasets were adjusted for inflation with the GDP deflator of each country. The relevant indices were
retrieved from the IMF and the HM Treasury. The following table shows the indices which were used for
the adjustment of the obtained prices.
Table 4.3: GDP Deflators
UK France
2005 85.84 90.70
2006 88.61 92.88
2007 90.62 95.21
2008 93.46 97.54
2009 95.01 98.36
2010 97.73 98.66
2011 100 100
2012 100 n/a
Source: Mott MacDonald
-200
0
200
400
600
800
1000
2008 2008 2008 2009 2009 2009 2009 2010 2010 2010 2010 2011 2011 2011 2011 2012
£/M
Wh
Balancing Price Predicted Balancing Price

299949/TRD/EFR/01/E 28 March 2013 PiMS/299949/EU Balancing Market/Reports/Issued Reports
64
Impact Assessment on European Electricity Balancing Market
It is recognised that the nature of causality has not been comprehensively established in this simplistic
framework. Furthermore, the analysis has not approximated the full extent of market integration benefits,
but provided an estimate of historic performance of existing arrangements. Even so, we believe that this
type of analysis has provided some useful insights with modest computational effort (compared with
building full system models) and scarce data availability that is often an impediment.
4.4 Analysis of the Nordic countries Balancing Markets
4.4.1 Background – Data utilised
The scope of the assessment is to determine the monetary benefits of the integrated Nordic balancing
market compared to the theoretical case of domestic “stand alone” balancing markets. The Nordic
balancing market is today fully integrated. By the term ‘integrated’ we refer to two mechanisms currently in
implementation: a) the common price ladder (CMO) for upwards and downwards regulation bids used for
tertiary regulation. In our opinion however the Nordic balancing market is more near to the concept of
“CMO with Margins” as the Nordic TSOs individually may keep some Bid/Offers and plants outside the
Common Merit Order List. It must be mentioned that this is an area that has been delegated to the system
operators and is not subject to detailed regulation, furthermore the Nordic tradition has been to be rather
light handed when it comes to these types of issues.The other mechanism of “integration” is with reference
to the methods used for netting of imbalances in the planning phase.
� NOIS bid data. The bid data consisted of quantities, prices, region of origin, whether it was flagged as a
special bid and whether it was cleared by the market. This data was not publicly available, but retrieved
via request.
� Nord pool spot regulating volumes. The dataset consisted of the cleared regulating volumes per region,
price of the regulating power. This data was publicly available via www.nordpoolspot.com
� Scheduled and actual exchange per cross-border interconnector from Nord Pool Spot. The scheduled
flow was the market cleared exchange from Nord Pool Spot (day-ahead market) and Nord Pool Elbas
(intraday market). This data was publicly available via www.nordpoolspot.com
� Energinet.dk planned and observed trade. This was used mainly for verifying the exchange data from
Nord Pool Spot. Publicly available via www.energinet.dk
� Svenska Kraftnät planned and observed cross-border exchange. This was used for verifying the data
retrieved from Nord Pool Spot - publicly available via request.
The time resolution of all the data sources was hourly and the assessed period was 1 January –
31 October 2011. The total number of received data records was approximately 8,500,000.

299949/TRD/EFR/01/E 28 March 2013 PiMS/299949/EU Balancing Market/Reports/Issued Reports
65
Impact Assessment on European Electricity Balancing Market
4.4.2 Methodology
The power grid in Sweden, Norway, Finland and Denmark1 are synchronously interconnected & operated.
The balancing of the market is mainly delegated to the market participants but of course there is a need for
real time adjustments by the system operator. To have resources for this real time balancing the TSO´s
operate the “Regulating Power Markets” (RPM). Resources at the RPM should be able to be activated
within 15 minutes (these types of resources are often referred to as tertiary reserves). In the system there
are also a number of power stations that will respond automatically and momentarily to frequency
deviations (frequency reserve or primary reserve). Resources at the RPM can either be utilized to prevent
the frequency reserve from being activated or to restore the frequency reserve if activated.
In the Nordic market the BSPs bid into the RPM market in for each country. The offers/bids are shared
meaning all the TSO’s are sharing the same bid ladder (CMO). The system used for this is called the NOIS
system. The methodology for clearing a bid on the Nordic integrated market for tertiary reserves is (briefly)
as follows:
� The need for tertiary power results in clearing bids from the shared bid ladder. It can be both up and
down regulation. The TSOs identify the next bid in the ladder (sorted by merit-order) which is feasible
(i.e. sufficient transmission capacity, not endangering the grid stability, etc.). The respective national
TSO clears the bid, i.e. a Norwegian bid is cleared by the Norwegian TSO, while a Swedish bid is
cleared by the Swedish TSO etc.
Therefore, the cleared volume of tertiary power is not necessarily the same as the actual imbalance in that
particular region as the imbalance could occur in another region of the synchronous area.
Data from both the planned and actual cross-border exchange was retrieved from Nord Pool Spot and
Svenska Kraftnät. The deviation in the scheduled and observed cross-border exchange was assumed to
correspond to the transmitted regulating power, i.e. when a country net exported more than the planned
export this was assumed to correspond to the transmitted tertiary power. Mathematically it can be
formulated as:
����,� = ����,�,�� + ����ℎ�,����,��� − ���ℎ�,����,��������
���!"#
Where
����,�: %�&'()*�+()(,�-./00-1*/,0, &*�-2&-3& ����,�,��: ��+()(,�-.0/��)-(0-4+*42*,0-1*/,0, &*�-2&-3&
_________________________
1 Except DK1 which is synchronous with the continental grid. DK2 is synchronous with the grid in Sweden, Norway and Finland. Due
to this Denmark was divided into two regions for this analysis, DK1 and DK2.

299949/TRD/EFR/01/E 28 March 2013 PiMS/299949/EU Balancing Market/Reports/Issued Reports
66
Impact Assessment on European Electricity Balancing Market
���ℎ�,����,���: 5)(,,-4-��ℎ(,1-+-&6--,0-1*/,0(,40-1*/,0!*,&*�-2&-3& ���ℎ�,����,���: %�&'()-��ℎ(,1-+-&6--,0-1*/,0(,40-1*/,0!*,&*�-2&-3&
�7(��: 8'�+-0/.*,&-0�/,,-�&/02./00-1*/,0 0 − 0!: �,&-0�/,,-�&/0+-&6--,0-1*/,0(,40′
The scheduled exchange is the planned flow after the day-ahead and intraday market (Nord Pool Spot and
Nord Pool Elbas, respectively).
The scope of this study is to asses an integrated regulating power market compared to domestic-only
markets. This was assessed by calculating the system costs for settling historical imbalances for the
integrated and domestic market schemes, and comparing these two system costs. The integrated market
scheme was assumed to correspond to the historical market outcome. This means the system cost of the
integrated market regime corresponds to the actual cost of the cleared bids from the historical market data.
The cost of a single bid was assumed to be the cleared volume multiplied by the difference from the
corresponding spot price. Mathematically this is formulated as:
:�;<= = |85?3/&� − 50*�-@;<=| ∙ BCDEF��F<G�E,�;<=B
Where
CBid Y: Cost of bid Y.
NP Spotr : The spot price for the given hour for the given region
PriceBid Y: The price of bid Y.
QCleared Vol, bid Y: The cleared volume for bid Y.
The system cost for a single time step (hour) was defined to be the sum of the bid costs, mathematically
formulated as:
?:� = :@;<�,�����
�"#
Where
SCh: System cost for a particular region in hour h.
bMax: Total number of bids in a particular region that were cleared for a given time step

299949/TRD/EFR/01/E 28 March 2013 PiMS/299949/EU Balancing Market/Reports/Issued Reports
67
Impact Assessment on European Electricity Balancing Market
Furthermore, all the cleared bids marked as “special” bids, meaning they were cleared because of grid
stability/congestion issues and not necessarily due to market mechanism (the next available bid in the
Merit-order) or actual imbalances, were disregarded.
For the domestic “stand alone” market scheme, the corresponding bid and system costs were calculated in
the same manner as for the integrated market scheme. However, a domestic imbalance was resolved by
only using the domestic bids. The system cost was calculated as the sum of all the regional system costs.
The system cost of the domestic-only market scheme was then compared to the calculated system cost for
the integrated market scheme. The difference between these two was assumed to reflect the monetary
benefit of having an integrated balancing market compared to a domestic-only.
It should be noted that the result of the calculation derives from two sources, a common bid ladder for
tertiary regulation and the use of “netting”. Netting means that an imbalance in one country can be
balanced out by an imbalance (in the opposite direction) in another country. Doing nothing is of course
cheaper than taking counteractive actions in both countries.
Limitations of the methodology:
The scope of the work was to quantify the monetary benefit from having an integrated market scheme. The
methodology used for calculating the imbalances for each region disregards some of the cross-border
interconnectors due to lack of data2. As most of the disregarded interconnectors are DC links, this should
provide a relatively small deviation from the true imbalances. The disregarded interconnectors were:
� NO2 - NL (700 MW)
� FI - RU (1460 MW)
� NO4 - RU (56 MW)
A sudden failure of one of the DC-links should yield a substantial imbalance, which is not taken into
account with the applied methodology. This is only the case during a limited amount of hours during the
assessed time period, and this is why it was disregarded.
As previously mentioned the deviations from the forecasted generation and consumption are sometimes
settled via automated frequency power. This power has not been included in the data, however are
included in the deviation between planned and actual cross-border exchange flows. This yields an error
which was assumed to be relatively small.
It was assumed that there were no internal bottlenecks within a country region for the domestic-only market
scheme. This means that the imbalance within a country is net, and that all the bids placed in a country are
available for the imbalance market. This is different from the actual integrated market results as the
clearing of this market takes transmission constraints into account. By disregarding internal bottlenecks the
system cost of domestic-only market scheme is underestimated.
_________________________
2 Either scheduled or observed exchange flows.

299949/TRD/EFR/01/E 28 March 2013 PiMS/299949/EU Balancing Market/Reports/Issued Reports
68
Impact Assessment on European Electricity Balancing Market
Results
The applied methodology (in sequence) was:
1. Retrieving data of the cleared imbalance volumes, planned and observed cross-border flows
2. Calculating the actual imbalance per country
3. Calculating the system costs for the two different market schemes
4. Comparing the system costs
Step 2 was to calculate the imbalance per region. This was verified by comparing the net imbalance for all
the regions compared to the volume of cleared tertiary power. If the calculations were correct, no rounding
errors and all components included, then the sum of the cleared bids and sum of the imbalances per region
should be equal. However, as not all components were included (see section ‘limitations’ above) this was
not expected. The correlation between these two datasets was 0.952 for the investigated period (1 January
2011 – 31 October 2011). This provides a reasonable correlation, verifying the methodology applied. See
and The level of correlation is 0.95, indicating good correlation for the chronological and scattered plots of
the two time series (calculated and actual imbalances) per region.
As not all interconnectors are included deviations between the two values was expected. Another less
significant source of error is numerical rounding errors.
Comparing system cost for integrated and domestic “stand alone” only markets:
The results indicated a significant difference between the two market setups. The total system costs for the
integrated market setup was estimated to be € 27 million for the assessed time period. The total system
costs for the domestic-only market scheme was estimated at € 211 million. The system costs per region
and sum for all the countries can be observed in below.
Comparing the integrated system cost to the domestic-only market setup between countries should not
provide a good comparison. This is because the volume of tertiary power is accounted for in the country
where the bids were placed, and not due to the actual imbalance. See section 4.4.2 above (‘Methodology’)
for further descript
By extrapolation the annual costs of tertiary power correspond to approximately € 32 and 253 million for
the integrated and domestic-only market schemes, respectively. This corresponds to annual savings of
approximately € 221 million between the two cases.
4.4.3 Conclusion & discussion
The difference in costs of balancing between the two market schemes is significant. The results indicate
that the cost of “tertiary power” is approximately 8 times greater (€ 184 million) with a “domestic-only
balancing market” compared to the integrated balancing market scheme (January – October 2011).

299949/TRD/EFR/01/E 28 March 2013 PiMS/299949/EU Balancing Market/Reports/Issued Reports
69
Impact Assessment on European Electricity Balancing Market
The two main drivers for the results are:
� The result of netting. As described in the methodology, it is always "cheaper" to net imbalances in two
regions than it is to settle imbalances for two regions. This is considered the major reason for the large
savings. In the domestic-only scenario netting is not an option, which will incur system costs as
imbalances are resolved via the clearing of regulating bids.
� More efficient allocation of (cheaper) “hydro” regulating power. As briefly described above, the cost of
regulation power from hydropower producers is low compared to regulating power from conventional
thermal technologies. This is because of plant characteristics (relatively fast capability of
reducing/increasing the water flow and the generator output is revised accordingly without significant
increase of maintenance costs) and due to the fact that downwards regulation means that the reservoir
water is still available for later use. Both Norway and Sweden have substantial hydropower resources,
which are effectively used to settle imbalances all over the Nordic integrated area for the integrated
market scheme. This is indicated via the results for the two market regimes for the Denmark Region 1
(DK1) & Denmark Region 2 (DK2) areas and which indicate the highest savings potential.
4.5 Assessing the benefits of Exchanging short term operating reserves and cross-
border balancing in systems with increased penetration of intermittent wind
generation
4.5.1 Objectives
The purpose of this analysis is to:
Assess the increases in imbalance volumes and corresponding short term operating costs in systems with
increased contribution of wind generation and to estimate the benefits of the Common Merit Order
approach of exchanging short term balancing resources (by which in this analysis we mean FCR, FRR
and RR). Although the focus of the analysis is on reduced short term operating costs, we have also
estimated the benefits that exchanging of balancing services across the interconnection may deliver in
reducing the installed generation capacity, if the adequacy of supply is to be shared.
The exchange and sharing of reserves aim to optimize the provision of the required amount of reserves
capacity (in MW) resulting from the reserves dimensioning processes. The difference between
“exchanging” and “sharing” of reserves is explained in more detail in section 4.1 of this report.
The analysis also provides some indicative insights into trade-offs between the amount of short term
balancing energy exchanged between two markets and the benefits achieved in terms of reduced operating
costs.

299949/TRD/EFR/01/E 28 March 2013 PiMS/299949/EU Balancing Market/Reports/Issued Reports
70
Impact Assessment on European Electricity Balancing Market
4.5.2 Approach
In this exercise we simulated short-term operation of two markets (A & B) over a yearly time horizon,
considering the impact of different levels of penetration of wind generation on imbalance volumes. We are
focusing on the impact of two identical systems/markets which are subject to growing levels of penetration
of wind generation; (i) operating in “stand alone” and then (ii) exchanging cross-border short-term balancing
resources. We examined the reduction in short-term imbalance volumes arising from different volumes of
energy being exchanged and investigated the operating costs savings that may be associated with the
exchanging of balancing services cross-border.
Figure 4.18: Cross Border System
Source: Mott MacDonald
It is important to note that the two markets are identical as they are assumed to have exactly the same
generation mix and demand profiles so that the opportunities for “locational arbitrage” between the markets
outside real-time balancing are eliminated. The only reason for exchange of energy between the two
markets is due to short term imbalances driven by forecasting errors of wind, demand and random
generation outages. Hence the benefits from the exchange of energy between the two markets originate
only due to exchange of short-term balancing services and hence reduced short term operating costs.
We carried out several generation scheduling exercises, considering hourly operation of the system across
the time horizon of 1 year, using stochastic scheduling model. We quantified the change in short-term
imbalance volumes in individual systems as a result of different levels of penetration of wind generation
and different volumes of balancing services being available for exchange (this is achieved by carrying out
the analysis for different capacities of interconnection). We then assessed the reduction in the level of
short-term imbalances that would need to be managed if cross-border resources are shared (CMO). It is
important to note that the cross-border transmission capacity between the two markets is in this case used
for exchanging short-term balancing resources only, as the two systems are assumed to be identical in
order to exclude any benefits that may arise from “pre-gate closure” energy trades / arbitrage.

299949/TRD/EFR/01/E 28 March 2013 PiMS/299949/EU Balancing Market/Reports/Issued Reports
71
Impact Assessment on European Electricity Balancing Market
4.5.3 System parameters and assumptions
For the purpose of illustrating the importance of exchanging short-term balancing resources in systems with
significant penetration of wind generation we considered two areas with an energy requirement of 450TWh
and 95 GW peak demand each. The generation mix involves technologies listed in Table 4.4 below.
Table 4.4: Installed capacities of conventional plant
Nuclear CCGT Peaker
Capacity (GW) 15 60 30
Source: Mott MacDonald
We assumed some generic operating cost characteristic of the plant, that are inclusive of CO2 prices. For
each of the technologies these are presented in Table 4.5. Similarly, generic plant dynamic parameters of
the plant of different technologies used in this study are presented in Table 4.6.
Table 4.5: Cost characteristics of conventional plant
Generation Technology Marginal Cost (€/MWh) No Load (€/MWh) Start Up Cost (€/startup)
CCGT 70 11,000 42,000
Peaker 90 33,000 19,000
Nuclear 7 300 N/A
Source: Mott MacDonald
Table 4.6: Key dynamic parameters of the plant
Generation Technology Min Stable Generation (%)
Minimum Up Time (h)
Minimum Down Time (h)
Ramp Rate (%/h)
Response Slope (%)
CCGT 60 4 4 50 40
Peaker 40 <1 <1 100 30
Nuclear 80 must run must run 50 0
Source: Mott MacDonald
In this exercise, Replacement Reserve (RR) response capability is determined by the ramp rates while
FCR and FRR reserve power is modelled as a single service defined by “frequency response”. As indicated
in Figure 4.19 below, the amount of frequency response that a generator can provide (Rmax) is generally
significantly lower than the headroom created from part-load operation (Pmax – MSG), and is defined by the
response slope.

299949/TRD/EFR/01/E 28 March 2013 PiMS/299949/EU Balancing Market/Reports/Issued Reports
72
Impact Assessment on European Electricity Balancing Market
Figure 4.19: Provision of response services
Source: Mott MacDonald
For example, consider a CCGT plant of 500MW capacity, running at MSG=300MW (60%). Only a
proportion of the headroom created of 200MW (=500MW-300MW) can be delivered as fast response. In
this case, 80MW can be provided as primary and secondary response given that the response slope is
40% (see last column in Table 4.6.
In this exercise we utilised a stochastic short-term generation scheduling model. Unlike traditional
scheduling simulations, where deterministic wind and demand time series would be used as inputs to the
cost minimisation algorithm, stochastic scheduling accounts for the uncertainties explicitly, by providing the
commitment algorithm with a range of possible outcomes (e.g. wind realisations) that are weighted
according to their probability of occurrence. This stochastic scheduling simulation tool is designed to
provide optimised generation schedules in the light of wind uncertainties, together with demand
uncertainties and generator outage uncertainties, with the Value of Lost Load (VoLL) as the only security
parameter. 3
Wind realisations, wind forecast errors and generator outages are synthesised from appropriate models
and fed into a short-term scheduling model, that optimally schedules available generation to meet demand,
schedules spinning reserves, (provided through partly-loaded plant), standing reserves (provided by fast
peaking plant) and frequency response requirements (from partly-loaded plant), so that the total expected
operating costs, composed of generation fuel cost and demand curtailment cost, are minimised. The
decisions are found using a scenario tree, which represents a separation of the range of outcomes of the
stochastic variables (e.g. available wind output), with each path through the tree representing a possible
outcome or scenario. A set of feasible control decisions is obtained for each node on the tree, such that the
expected total operating cost is minimised. Because the actual realisation will differ from all the scenarios in
the tree, the scheduling is performed using rolling planning, in which only the ‘here-and-now’ decisions are
set in stone, with all subsequent decisions discarded. For this reason, the full tree, extending to usually 24
hours ahead, must be solved at every time step.
We stress that operating reserves (RR) and frequency response (FCR & FRR) are implicit within the
scenario tree, which includes worst-case scenarios that force the scheduling of sufficient headroom in
_________________________
3 In this work we used a generic value of VOLL of €30,000/MWh

299949/TRD/EFR/01/E 28 March 2013 PiMS/299949/EU Balancing Market/Reports/Issued Reports
73
Impact Assessment on European Electricity Balancing Market
thermal and/or storage units in order to avoid load shedding when economic to do so, so that no explicit
reserve requirements are needed.
4.5.4 Case studies & Key results
Four levels of penetration of wind generation are considered, namely, 10%, 15%, 30% and 45%. The
benefits of exchanging short-term balancing resources is analysed considering 0, 2GW, 5GW and 10GW of
shared balancing reserves. Given that the imbalance volumes will be directly driven by forecasting errors of
wind output and given uncertainty associated with the ability to predict wind, we investigated two cases with
low and high imbalance volumes. Regarding wind output uncertainty over a 4-hour time horizon, we have
assumed that the standard deviation of forecasting error of wind output to be between 10% and 15%4.
Figures below present probability density functions of imbalances for different cases analysed – left column
of figures represents cases analysed with 10% standard deviation of forecasting error of wind output and
figures on the right a standard deviation of 15%. Range of possible hourly imbalance volumes with low (left)
and high (right) of imbalance volumes, in the cases shared balancing capacity (as a result of
interconnection availability) were:
T=0GW (top), T= 2GW (second top), T =5GW (second from the bottom) and T = 10GW (bottom).
_________________________
4 A number of TSOs use the standard deviation of forecasting error of wind output at 15% although this is expected to reduce in
future. Hence the standard deviation of forecasting error of 10% is analysed.

299949/TRD/EFR/01/E 28 March 2013 PiMS/299949/EU Balancing Market/Reports/Issued Reports
74
Impact Assessment on European Electricity Balancing Market
Figure 4.20: Range of possible hourly imbalance volumes: minimum (left) and maximum (right), in case shared
balancing capacity T=0GW, T=2GW, T=5 GW and T=10GW
Source: Mott MacDonald
We observe that, as expected, the volumes of short-term imbalances increases with the level of penetration
of wind generation. On the other hand, combining the two systems and allowing exchange of balancing
resources reduces the total imbalance volumes.

299949/TRD/EFR/01/E 28 March 2013 PiMS/299949/EU Balancing Market/Reports/Issued Reports
75
Impact Assessment on European Electricity Balancing Market
Given the probability density functions of imbalances presented in Figure 4.20, the range of average hourly
volumes are calculated and presented in Table 4.7. We observe that exchanging balancing resource
reduces the average hourly imbalance volumes, although significant “saturation” effects can be seen. For
example, in the case of 30% wind penetration increasing the volumes of shared balancing resources from
0GW to 2GW reduces short-term imbalance volumes significantly more than increasing the capacity for
exchanging of balancing resources from 2GW to 5GW.
Table 4.7: Average volumes of hourly imbalances in GWh/h for different levels of wind penetration and different
capacities available for sharing of balancing resources (0GW, 2GW, 5GW and 10GW)
10% Wind penetration
15% Wind penetration
30% Wind penetration
45% Wind penetration
0 GW 1.1 – 2.2 GWh/h 1.7 – 3.2 GWh/h 3.4 – 6.4 GWh/h 5.1 – 9.7 GWh/h
2 GW 0.8 – 1.6 GWh/h 1.2 – 2.3 GWh/h 2.6 – 5.2 GWh/h 4.0 – 8.3 GWh/h
5 GW 1.1 – 1.5 GWh/h 1.2 – 2.3 GWh/h 2.4 – 4.7 GWh/h 3.7 – 7.3 GWh/h
10 GW 1.1 – 1.5 GWh/h 1.2 – 2.3 GWh/h 2.4 – 4.6 GWh/h 3.7 – 7.0 GWh/h
Source: Mott MacDonald
Finally, we evaluated the cost savings that can be obtained from exchanging balancing resources between
the two systems. These savings originate from the reduced cost of delivery of balancing services, i.e. lower
cost of supplying energy shortfalls. For example, overestimates of wind production, in the case of shared
balancing resource, would be possible to more frequently compensate through partly-loaded generation
rather than by high cost standing plant6. Hence, the changes in the difference in cost between spinning and
standing plant will affect the level of savings achieved through exchanging of balancing services. The
corresponding ranges of estimated savings in €m are presented in Table 4.8. As expected, we observe that
the levels of imbalances to be managed are directly correlated with the balancing cost and hence
exchanging of balancing resources will generate savings.
Table 4.8: Ranges of annual savings (m€/annum) that can be made from sharing of balancing resources
10% Wind penetration
15% Wind penetration
30% Wind penetration
45% Wind penetration
2 GW 82.5 – 158.7 110.5 – 198.9 223.4 – 402.1 265.5 – 477.9
5 GW 90.2 – 162.4 121.4 – 216.2 363.4 – 655.7 424.5 – 764.1
10 GW 90.2 – 162.4 121.5 – 216.4 405.3 – 729.5 574.3 – 1033.7
Source: Mott MacDonald
These savings are achieved in the context of the wind uncertainty cost with approximate ranges of values
presented in table below. In this exercise, wind uncertainty costs are defined as the difference in system
operating costs with wind uncertainty being explicitly accounted for in the generation schedule against the
cost achieved when wind generation is perfectly predictable (no uncertainty). For the full detailed modelling
methodology please review IEEE paper “Efficient Stochastic Scheduling for Simulation of Wind-Integrated
_________________________
6 It is important to bear in mind that scheduling higher levels of spinning reserve than optimal would reduce the ability of the system to
absorb wind power and increase the amount of wind curtailment.

299949/TRD/EFR/01/E 28 March 2013 PiMS/299949/EU Balancing Market/Reports/Issued Reports
76
Impact Assessment on European Electricity Balancing Market
Power Systems” - Alexander Sturt and Goran Strbac, (IEEE Transactions on Power Systems, vol 27, no 1,
February 2012 – no: 14 on our Reference List below).
Table 4.9: Ranges of wind uncertainty cost (m€/annum)
10% Wind penetration
15% Wind penetration
30% Wind penetration
45% Wind penetration
Uncertainty costs 350 - 400 600 - 750 1600 - 2100 2900 - 3500
Source: Mott MacDonald
It is interesting to compare the savings in Table 4.8 with the cost of interconnection. For example, an
interconnector, based on 500 km undersea cable of 2 GW, would have an annuitized cost in the order of
€180m/annum. In many of the above cases, with significant penetration of wind it may be cost effective to
build interconnection only for short-term balancing purposes, particularly for higher levels of wind
generation penetration, even if the forecasting errors of wind output reduces in future.
These illustrative studies clearly demonstrate that the benefits of exchanging of short-term balancing
resources will significantly increase with an increase in the penetration of wind generation. We also
observe the savings saturate with the increase of the volume of balancing resources available for
exchanging. However, improved forecasting of wind output (lower standard deviation applied by utilities in
their estimates) will reduce the benefits of exchanging balancing services cross-border.
The above analysis considered benefits from exchanging short-term balancing services across
interconnector, in terms of reduced generation operating costs. In the long term, exchanging and sharing
of balancing services through integrated balancing market will also bring benefits in terms of reduced
generation capacity margins, without comprising the security performance of the system. Assuming the
interconnection can displace 2GW of generation capacity, and assuming the annuitized investment cost of
backup generation (e.g. OCGT) of 40€/kW, this would bring additional benefits of market integration of
potentially € 80m/annum.
4.6 Assessing the benefits of Exchanging & Sharing Reserve Services cross-
border in future (2030) EU electricity system
We have discussed in Chapter that the operating reserve requirements and the need for flexibility at high
levels of penetration of intermittent renewable generation increase significantly above those in the
“conventional” systems. Additional operating reserves are delivered through increased amount of plant
operating part loaded, i.e. less efficiently, and/or through plant with higher costs and CO2 content, leading
to an increase in real time system management costs. The need for additional reserves and lack of
flexibility (for example nuclear, CHP and CCS plant) may also decrease the ability of the future EU system
to absorb intermittent generation, particularly if the balancing services are not optimized across the system.
This may be interpreted as follows; the amount of “frequency response” (within the timeframes of Primary
and Secondary Control Reserves as per “UCTE Handbook P1”) that a generator can provide is generally
significantly lower than the headroom created from part-load operation, and is defined by the response
slope. In particular CCGT plant’s response slope is of the order of 40%. In order, therefore to deliver
“frequency response”, a substantial number of flexible plant needs to operate part-loaded (the amount is
determined by the single “most severe incident” on a system but also depends on the amount of
intermittent generation plant in operation at any moment). A partly-loaded plant however does not only
“carry response” but delivers energy, which can be considered inflexible. If to this one adds other

299949/TRD/EFR/01/E 28 March 2013 PiMS/299949/EU Balancing Market/Reports/Issued Reports
77
Impact Assessment on European Electricity Balancing Market
generation inflexibility (nuclear, CCS, CHP), then the Operator may have no other option but to curtail the
amount of intermittent generation, in order for the system to be able to absorb the “must run” energy for
security reasons.
This may lead to the curtailment of renewable power at high penetration levels, particularly when high
outputs of renewable generation coincide with low demand. Effectively this means curtailing generation of
zero variable cost (and high sunk costs) and increasing system operating costs.
Figure 4.21: EU system topology used in the study
Source: Mott MacDonald
Given the increased need for flexibility and reserve services in future, it will become increasingly important
to optimize the provision of these services cross-border and to benefit from the diversity of renewable
generation outputs and demand in the short term. In order to examine the importance and benefits of
sharing the provision of reserve and frequency regulation services in future EU system we simulated a
simplified equivalent European Power System (48 nodes as presented in Figure 4.21 above) and have
carried out EU grid integration studies to test the impacts of different balancing polices, as indicated in
Figure 4.22. We used the Imperial Dynamic System Investment Model and considered EU 2030
scenarios8. In the scenarios analysed, renewable generation production meets about 45% of the total
energy requirements.
_________________________
8 Assumptions, data and modeling used is based on the analysis carried out in “Power Perspectives 2030”
(http://www.roadmap2050.eu/attachments/files/PowerPerspectives2030_FullReport.pdf)

299949/TRD/EFR/01/E 28 March 2013 PiMS/299949/EU Balancing Market/Reports/Issued Reports
78
Impact Assessment on European Electricity Balancing Market
Figure 4.22: Assessing the benefits of sharing reserve across EU regions in future systems with significant
contribution of renewable generation
Source: Mott MacDonald
Our model minimises the total annual generation operating cost across the technology mix that consists of:
(i) marginal variable cost which is a function of the electricity output, (ii) no-load cost which represents
efficiency losses due to part load operation and (iii) start-up cost. Generation operating cost is determined
by two input parameters: fuel prices (presented in Table 4.11 below) and carbon prices relevant for
technologies that emit carbon.
Table 4.10: Fuel price assumptions in 2030
Fuel Type Fuel Price (€/GJ)
Coal 3.18
Natural Gas 9.41
Oil 13.83
Uranium 3.22
Biomass 4.13
Source: Mott MacDonald
Carbon price assumed for 2030 is €84.62/tonne of CO2.
The model includes requirements for operating reserves, namely Replacement Reserves - RR, while FCR
and FRR is modelled as a single service defined by “frequency response”9 on the basis of “Single Major
_________________________
9 The model captures the fact that the provision of frequency response is more demanding than providing operating reserve and that
only a proportion of the headroom created by part-loaded operation will be available for delivery for FCR and FRR.

299949/TRD/EFR/01/E 28 March 2013 PiMS/299949/EU Balancing Market/Reports/Issued Reports
79
Impact Assessment on European Electricity Balancing Market
Incident”. The amount of RR required is calculated as a function of uncertainty in generation and demand
across the time horizons of 4 hours, as it is assumed that 4 hours is required to synchronise a CCGT plant
that was not scheduled to run (“start – up”). Regarding wind output uncertainty over a 4-hour time horizon -
we have assumed that the standard deviation of forecasting error of wind output is in the order of 10% of
wind output. When calculating the total reserve requirements we have further assumed that forecasting
errors of wind, demand and plant availability are independent.
DSIM then schedules the optimal provision of reserve and response services, taking into account the
capabilities and costs of potential providers of these services, including (i) efficiency losses of part loaded
plant, (ii) minimum stable generation (iii) ramp rates, (iv) minimum up and down times (v) response slopes.
This involves finding an optimal trade-off between the cost of generating electricity to supply a given
demand profile, and the cost of procuring sufficient levels of reserve and response, including alternative
balancing options such as energy storage and demand response if available. The allocation of spinning
and standing reserve is optimized ex-ante to minimise the expected cost of providing these services.
Our analysis of the annual operation of the EU system shows that regional sharing of frequency regulation
and reserve services using cross-border capacity reduces operating costs by about €2.5-3bn/annum, when
compared with a policy of each member state providing the services to meet their own requirements. There
are two key reasons for the reduction in costs:
− Reduction in total reserve requirements: when reserve can be exchanged & shared across EU
regions rather than every member state providing reserve services for its own needs, this would
reduce the total reserve requirements from a level of 120-160 GW to a level of approximately 75-95
GW in 2030, depending on the assumed forecasting errors of wind and demand. This reduction is
driven by increased diversity in demand and renewable output and hence reduced overall
uncertainty, as presented in Figure 4.23 below.

299949/TRD/EFR/01/E 28 March 2013 PiMS/299949/EU Balancing Market/Reports/Issued Reports
80
Impact Assessment on European Electricity Balancing Market
Source: Mott MacDonald
− We observe (as expected) that the variability of renewable generation output is reduced (in relative
terms) when an EU wide perspective is adopted. This will reduce the cost associated with reserve
provision (less partly-loaded generation and hence reduced operating costs). More importantly
however this will also enhance the ability of the system to integrate renewable generation. This is
because the need for the provision of increased amounts of reserve can cause renewable generation
curtailment, as the providing reserve through part loading generation will be accompanied with “must
run” energy delivery. During high renewable generation output and low demand condition, this may
result in a surplus of generation production leading to renewable generation curtailment, which is
indeed costly.
− Optimised allocation of reserve across regions: there are potentially significant benefits of reserve
exchanging and sharing that can be achieved by shifting the requirements to provide reserve from
areas with high renewable production (exporting areas) to areas with low production or demand-
dominated areas (importing areas) by making use of cross-border transmission. This is important, as
scheduling reserves in the areas with significant renewable production will limit the ability of that area
to absorb renewable generation and may potentially lead to the curtailment of renewable generation
output (as discussed above). If however reserve needed by areas that export renewable generation
can be provided by areas that import renewable generation, this may deliver operational cost
savings11
. It is important to note that exercising the reserve that is allocated to importing areas and in
order to meet generation shortfalls in exporting areas, will result in counter flows on cross-border
links, hence reducing, rather than increasing, the cross-border power flows.
_________________________
11
This is generally the case, although in special circumstances it may be desirable to constrain the cross-border energy trades for reserve exchanges.
Figure 4.23: Short term variability of wind: benefits of an EU wide balancing perspective
0
1000
2000
3000
4000
5000
6000
7000
8000
9000
-0.4 -0.3 -0.2 -0.1 0 0.1 0.2 0.3 0.4
Fre
qu
en
cy
Output Variation (fraction of installed)
Frequency Distribution of hourly Variation UK & Ireland
France
Iberia
Nordel
Central-Europe
Mid-Europe
Poland & Baltic
Eastern Europe
South Europe
Total

299949/TRD/EFR/01/E 28 March 2013 PiMS/299949/EU Balancing Market/Reports/Issued Reports
81
Impact Assessment on European Electricity Balancing Market
The savings could further increase in the case that the overall flexibility of generating plant reduces, i.e. if
penetration of nuclear and less flexible CCS generation increases. We also observe that the impact of
adopting EU wide reserve sharing policy on the requirement for additional cross-border network investment
is generally small (cross-border transmission investment requirement continues to be driven by energy
flows). This is because the benefits of reserve exchanging and sharing are achieved by the shifting of
reserve provision from areas with high renewable production (exporting areas) to areas with low production
or demand-dominated areas (importing areas). As the exercising reserves will generally result in counter
flows on cross-border links there will be no significant need to increase cross-border capacity to facilitate
EU wide reserve sharing.
In addition to the benefits associated with the exchanging of balancing services (discussed and quantified
above), cross-border network capacity will also lead to the reduction in capital expenditure associated with
reduction in the overall generation capacity needed for the provision of long term supply adequacy (as the
regions will be able to share generation capacity for security of supply purposes).
4.7 Conclusions of the Quantitative Analysis
The quantitative analysis reported here supports the view that there are significant potential welfare
benefits from allowing cross-border trading of balancing energy and exchanging and sharing balancing
reserve services across the European MS borders.
This is based on an analysis of the current Balancing Market of the Nordic Borders which already operates
in an integrated way and the UK and French systems (hypothetically harmonising their Balancing
Mechanisms and sharing a CMO of their bids/offers over various levels of interconnection capacity
availability). We have also examined the potential benefits which will accrue in a future EU electricity
system where 45% of its total energy demand will be provided by intermittent generation.
Annual benefits from balancing energy trade (shared between the case study of GB-France for the year
2011) are potentially of the order of € 51 million (in other words balancing is achieved on the combined
system with reduced costs of such an amount which reflects the increased allocative efficiency enabled
through the extended application of the CMO List).
These savings correspond to the case when the balancing trades can use all remaining (available)
interconnector capacity (after energy trading. i.e. last intraday Gate Closure) up to the technical capacity
(2GW). In the hypothetical case where the full interconnector capacity was available for balancing trades
then the trading gains from the CMO would have been a little higher at € 56m a year. About half of those
benefits are realised when interconnector capacity is constrained to 20% of full capacity (i.e. only 400 MW).
This important conclusion demonstrates the diminishing returns on the usage of interconnector, due to the
balancing market being of much less “depth” than the interconnecting capacity itself. Taking into
consideration that in general Balancing Markets represent 2-3% of the total turnover volume of Wholesale
Markets, while interconnectivity as an average is around 10% of peak demand amongst member states, we
can conclude that this phenomenon of “diminishing returns” will hold true across most borders.

299949/TRD/EFR/01/E 28 March 2013 PiMS/299949/EU Balancing Market/Reports/Issued Reports
82
Impact Assessment on European Electricity Balancing Market
The results from the Nordic countries integrated market, demonstrate annual savings of approx. € 221 million from what would have been the case if each country operated its own “stand alone” balancing market.
It is important to emphasise that our analysis has been conducted using historical fixed bids and offers.
However, in practice one would expect that market power dilution through cross-border integration of
Balancing markets and increased international competition would lead to some further reduction in offer
prices (into the BM) and therefore increased benefits.
Our view is that comparable benefits would be realisable in other jurisdictions, though this will be weighted
by the volume of imbalances. That said smaller systems, with a high degree of concentration in the
balancing market, might be expected to see greater proportionate gains as monopoly power is eroded.
The time series analysis (only run for the UK and France),shows a comparable level of benefit from the
introduction of the Balit Mechanism. The analysis shows a real gain of around €20-30m a year, which is
consistent with the numbers coming from the full trading based on common merit order, but operating on a
20% of interconnector capacity. This is despite the fact that the Balit mechanism only allows for the trading
of “Surpluses”. The implication is that the dynamic competition benefits are significant.
In the future, European Power Systems with a very high percentage of its generation being intermittent and
unpredictable, imbalance volumes will be mainly driven by forecasting errors of generation output. Wind
generation predictions in particular introduce uncertainties until close to real time, causing the need for
additional system reserve to be held. Of course development of liquid and efficient intraday markets,
interconnection capacity, fast response products and more accurate forecasting techniques are all
important tools to allow BRPs to be balanced. Within Europe, these issues are most critical for places such
as the GB market which is relatively lightly interconnected, with little hydro capacity (a natural balance to
wind generation) and which enjoys significant wind resource. In particular, a system with very large
amounts of wind, wave and solar generation requires lots of flexible price-sensitive generation to provide
back-up. However, much of the non-wind, solar and marine generation that is likely to be built in the future
European power system, will be nuclear, CCS coal and biomass, all of which are designed and financed to
function at baseload operation, and can provide only limited flexibility. There is a distinction between
commercial and technical flexibility – a unit may be capable of providing significant flexibility, but may
choose not to do so due to the underlying economics and market design. This is why it becomes very
important to design a correct BM which conveys the appropriate economic signal to all market participants.
Our analysis included “hypothetical” scenarios of the future EPS (c. 2030) with arrangements for cross-
border trading of balancing energy and exchanging and sharing of balancing reserves. Results
demonstrate significant benefits which increase in correlation to the percentage of the penetration factor of
wind generation and which justify the cost of investment for enhanced interconnectivity.
Integration of Balancing Markets and sharing of reserves could achieve operational costs savings of the
order of € 3bn/year and reduced (up to 40% less) requirements for reserve capacity
These trading benefits are seen to be substantial compared with the costs of introducing new IT and
related systems, which is likely to be in the order of a one-off cost of €2m (across a single border), with
operating costs perhaps in the region of €100,000-€200,000 a year.

299949/TRD/EFR/01/E 28 March 2013 PiMS/299949/EU Balancing Market/Reports/Issued Reports
83
Impact Assessment on European Electricity Balancing Market
5.1 Cross border exchanges of Balancing Energy and Balancing Reserves
In previous Chapters we have defined a Balancing Market (BM) as the entirety of institutional, commercial
and operational arrangements that establish market-based management of the function of System
Balancing within the framework of a liberalised electricity market, This consists of three main parts:
� Balance responsibility,
� Balancing services provision, and
� imbalance settlement
We have discussed above the roles and responsibilities of the BM participants and the key design
elements to facilitate the establishment of a BM on a cross-border basis and its integration with the other
organised market segments of the "target model", mainly day-ahead and intra-day markets. Furthermore
we have attempted to quantify some of the economic benefits such integration may offer in a future EPS.
We consider that the results provide a solid evidence of an increase in social welfare and facilitation of
integration of intermittent generation.
We turn now to the discussion of the policy options and models for exchanges of Balancing Reserves (BR)
and Balancing Energy (BE) across European electrical borders. With regards to the latter, the following
discussion refers to only BE from FRR and RR. FCR can be procured on a market basis in the Reserves
Capacity markets, however it is an “essential system service” offered on the principle of joint action and for
which cross-border capacity must have been reserved; this is accomplished over the capacity not-allocated
by TSOs to the market and retained as TRM (Transmission Reliability Margin).
In order for BE to be exchanged over borders, common standard products must be defined by TSOs so
that their procurement cross-border can achieve a certain liquidity and their technical attributes (including
technical constraints, speed of activation, duration, minimum bid size, etc.) shall satisfy the needs of the
TSOs to balance the system. TSOs should also define common principles regarding the pricing method
and the selection process, to enable an efficient balancing of the system on a non-discriminatory, fair,
objective and transparent basis. The activation mechanism should be based on a merit order list and
optimises the use of balancing resources and maximises overall social welfare, taking into account network
constraints.
Referring back to we observe:
The general challenge for TSO's is to decide on the needed amount of BS (vertical axis) and to attract that
amount from a transparent and efficient market (horizontal axis). If the demand by the TSO is larger than
the market is prepared to offer, the system is inadequate (red triangle). If the demand by the TSO equals
what the market is prepared to offer, there is no competition and hence absolute market power (red line).
The challenge of a market design is to move away from the red line (green arrow), to increase competition,
and (likely) efficiency. There are two fundamentally different ways to increase competition: either to
increase the Control Energy Supply of the market (bids from adjacent control areas through a CMO list.
Another option is to decrease the required Control Energy Demand, for example by avoiding counteracting
activation of control reserves in separate control areas. For a better market design it is required that the
next two requirements are both satisfied:
5. Qualitative analysis of key policy options

299949/TRD/EFR/01/E 28 March 2013 PiMS/299949/EU Balancing Market/Reports/Issued Reports
84
Impact Assessment on European Electricity Balancing Market
� the absolute demand does not increase;
� the ratio of the demand to the available supply decreases;
5.2 Common Merit Order List - CMOL
The CMOL concept’s “building blocks” are:
� A common market area for control reserve bidders (FRR/SCR, RR/TCR)
� common tendering and purchase of balancing power via IT platform (SCR, TCR)
� unique market price for deviations of balancing responsible parties (BRPs)
� inter-TSO settlement concept. A methodology for compensation and settlement for exchanged amounts
of energy must be developed and ICT infrastructure put in place. This methodology must take into
account the fact that X-border balancing involves the following problem; The ”reserve requesting” TSO
gets a firm and accurate product, whereas the “reserve connecting” TSO will have to face all control
inaccuracies (production noise, within PTU power imbalances). This must be compensated by the
settlement system.
With regards to the Information and Communication Technology implementation costs, NGET quoted us a
cost of circa € 1.0 mil for the implementation of a BALIT type mechanism with France (similar costs were
quoted for the cross-border balancing mechanism on the “south corridor” interconnection with Ireland), so
that means around € 2.0 mil per border. However the BALIT type arrangements is with regards to the
exchange of surpluses, which is much less sophisticated than CMOL. Even if one doubles the
implementation cost to allow for the sophistication of a CMOL mechanism, the potential benefits far
outweigh the costs which are easily recovered within a year as demonstrated by our analytical results.
The design framework for cross-border exchanges of Balancing Energy shall require TSOs to perform and
share amongst them close-to-real-time short-term forecasts of system conditions (generation, load, reserve
requirements, transmission network, etc.) in a harmonised way, in order to coordinate and optimise the
balancing actions taken. TSOs should allow the participation of non-contracted reserves at least to provide
balancing energy that are used as replacement reserves, as well as from manually-activated frequency
restoration reserves.
The worry for a CMOL and cross-border activation of control reserves is that they might introduce perverse
incentives and/or eliminate present incentives to market parties, incentives that the “netting of imbalances”
concept does not affect. A CMOL without proper harmonisation and alignment of incentives might actually
increase the volumes of control energy demand. Given that the price of Control Energy available should
rise with the volume required, the impact of a CMOL might therefore be negative.
The other issue that raises concern is that is not clear how to combine a CMOL with local responsibilities of
TSOs and local balancing incentives on the basis of price signals. Balancing (including cross-border
balancing) by TSOs should interfere as little as possible with balancing actions by the market. As long as
individual TSOs are responsible for frequency restoration (materialised by Area Control Error quality), local
imbalance prices/incentives should reflect the balance situation of the specific control area/block where
they apply. The imbalance price is one of the main tools of a TSO to ensure its Load Frequency Control
(LFC) obligation by incentivising market players to be balanced and/or to respond to help restore the
balance of the system, triggering DSR.

299949/TRD/EFR/01/E 28 March 2013 PiMS/299949/EU Balancing Market/Reports/Issued Reports
85
Impact Assessment on European Electricity Balancing Market
Under the CMOL model, the global system will be in balance but individual control blocks will be
imbalanced and individual TSOs need to react to resolve local imbalances. This issue makes the alignment
of policies and harmonisation of rules for balancing all the more important to resolve who is paying what
and the impact of the planning of reserves.
Balancing Incentives need to be consistent with balancing responsibilities of the TSO.
5.3 Netting of Imbalances
The Imbalance Netting Process is designed to reduce the amount of simultaneous counteracting FRR
activation of different participating and adjacent LFC Areas by Imbalance Netting Power exchange. The
Imbalance Netting Process is applicable between LFC Areas which are part of one or different LFC Blocks
within one Synchronous Area or between LFC Areas of different Synchronous Areas.
TSOs co-ordinate in order to minimise, when economically efficient, counteracting activation of balancing
energy between adjacent control areas, taking into account cross-border capacities (i.e. netting of
imbalances). This scheme is basically “avoidance of counteracting secondary (Power) Control in separate
Control Areas”. The scheme is graphically depicted in Figure 5.1 and Figure 5.2.
Figure 5.1: Principle of “Netting of Imbalances”
Source: TenneT DE

299949/TRD/EFR/01/E 28 March 2013 PiMS/299949/EU Balancing Market/Reports/Issued Reports
86
Impact Assessment on European Electricity Balancing Market
Figure 5.2: Avoidance of counteracting SCR activation – Reduction of secondary control energy. Cheaper control
energy due to the merit order ranking
Source: TenneT DE
The principles of operation are as follows:
� In ENTSO-E RG Continental Europe, secondary control reserve (SCR or FRR) is activated
automatically and in accordance with the source of imbalances
� Within a region with several control areas, for a given point in time a counteracting deployment of
reserves is possible and not unusual.
� Netting of imbalances aims to prevent these counteracting deployment of reserves by exchanging
opposing imbalances between TSOs
How does it work?
This scheme modifies input to each Control Area’s LFC. The ACE (input signal to secondary controller) will
be corrected with the exchanged power via the Netting of Imbalances scheme
∆P + k∆f (Power Exchange Scheduled – Measured) + (gridconstant * frequency deviation)
Netting of Imbalances adjusts ∆P by incorporating a virtual tie-line exchange value representing the control
as avoided by netting all Market Imbalances. Its advantages include:
� No need for the short-term change of schedules between control areas;
� Decreased risk related to tight-timeframe for LFC change (automatic process);
� Clear separation of commercial business (forward, day-ahead, intra-day markets and balancing
mechanism changes among TSOs);
� It is dynamic, in real time
� Can be limited to remaining ATC after intra-day closure; which means it remains within security limits
available to the market, but unused; and does not use TRM
� Does not affect control reserve capacity required by TSO
� Does not affect internal pricing arrangements in Control Areas
� In the case of multi-lateral integration, distribution between different TSOs will be done pro rata based
on the demand (function of ACE and FRR already activated)
� Resulting power flows will not hamper grid access of market participants and system security.
Exchanges will be limited to the free cross border capacity, after closure of the market.
� The remaining ACE has to be balanced with secondary/tertiary reserves

299949/TRD/EFR/01/E 28 March 2013 PiMS/299949/EU Balancing Market/Reports/Issued Reports
87
Impact Assessment on European Electricity Balancing Market
The pilot project of implementation between TenneT NL and TenneT DE produced savings of 25% of the
Control Energy per year. TenneT quoted a cost of implementation of circa € 600k and savings of the order
of € 8mil/year. However further analysis would be required before its implementation to other control areas.
One still unresolved problem with "netting of imbalances" is that whilst settlement between TSOs occurs
ex-post (within 1 month), the actual impact on real-time imbalance prices is not reflected.
Nevertheless “Netting of Imbalances” has few negative attributes and it should be the first step of cross-
border integration of BM. It results in less “control energy” being activated and therefore less control energy
needs as well as “better” control quality. The co-operation of the four German TSOs in avoidance of
counteracting of FRR, claims savings in the order of € 200 million / year.
5.4 Exchange of Replacement Reserves
This is perhaps the most “straight forward” of the options and some methodologies and standard products
under a model of “exchanges of surpluses”, have already been proposed by ENTSO-E.
However, it is our opinion that a more ambitious approach can be taken and that a TSO-TSO model with
Common Merit Order List can be implemented within 3 to 5 years, the main delays in our view being the
alignment of the regulatory frameworks and the harmonisation of the pre-requisite key issues. In Chapter 3
we discussed minimum harmonisation pre-requisites for such model in order to avoid market distortions,
while in Chapter 4 above we demonstrated that the exchange of surpluses produce a modest benefit
compared to the CMOL model.
Under this scheme TSOs share their balancing resources and optimise their activation in order to minimise
the cost of balancing by gathering in a common list balancing bids and offers that are available in their
control areas and activate them according to the common merit order list subject to technical constraints,
including the availability of transmission capacities. We have described in section 3.7 above the modalities
of co-operation of TSOs to maximise the usage of interconnecting capacity up to near real time. As the first
and most easily implementable step, basically netted or unused capacity post intraday Gate Closure can be
allocated for the exchanges of Balancing Energy.
Access of balancing bids and offers to the common list and their activation shall be non-discriminatory, fair,
objective and transparent. An optimisation process shall be used to allow for a concrete and efficient
implementation of a common merit order list with different products and technical constraints.
A robust framework of rules regarding products, the activation of bids, the principles according to which
TSOs share and activate balancing bids and offers, settlement between TSOs, processes and
responsibilities of the different parties has to be put in place. The pre-requisites with regards to the
alignment of national balancing markets arrangements have been discussed under Chapter.3.
The cross-border exchange of RR coupled to a more “pro-active” operational planning process could
realise important benefits for the TSOs.
It has been already discussed that we expect in the future EPS to experience highly-volatile wind energy
production. In order to solve the imbalances caused by wind production, FCR and FRR control should be

299949/TRD/EFR/01/E 28 March 2013 PiMS/299949/EU Balancing Market/Reports/Issued Reports
88
Impact Assessment on European Electricity Balancing Market
avoided as this would lead to significant cost increases (automatically activated fast reserve is the most
expensive); Therefore, proper prediction of the expected system imbalances would help TSOs to decrease
forecast error and allow manually activated (cheaper) reserves to be used for the ”long-term“ balancing.
This will leave the automatically (fast) activated and more expensive reserves to be used for “short-term”
balancing and coverage term of smaller system deviations or outage of the power plants (unforeseen
events);
A TSO needs to estimate, based on the good grid security calculations (forecasts), system’s needs on a
day-ahead level, and based on this estimation procures FCR, FRR and RR as we have already discussed
in previous chapters.
Improved Operational Planning allow TSOs to handle the system imbalances proactively (with slow and
cheaper regulation = RR), and due to that, to minimise activation of fast-reserve FRR (total costs
reduction). In other words the more the TSO “balances the system” by using RR, the more efficient is the
control of the costs.
Figure 5.3 depicts graphically that if wind production forecasts at d-1 level, is brought closer to the real-time
situation (forecast intraday morning/afternoon), and based on that lower amount of reserve (MW) to be
used for the balancing services procured by TSOs is required.
Figure 5.3: Improved Operational Planning on intra-day basis – lower amounts of reserve
Source: Source Austrian Power grid
What Improvements in market design can add value to improved Operational Planning procedures?
� XB balancing energy exchange based on CMOL as discussed

299949/TRD/EFR/01/E 28 March 2013 PiMS/299949/EU Balancing Market/Reports/Issued Reports
89
Impact Assessment on European Electricity Balancing Market
� Decrease of planning forecast error from 15 minutes to 5 minutes (This is especially important for wind
production);
� Decrease of settlement period for schedules from 1hour to 15-minutes;
5.5 Exchange of Frequency Restoration Reserves
As the final step it can be considered under a TSO-TSO model with CMO, that TSOs co-ordinate and
optimise the activation of balancing energy from resources that are used as frequency restoration reserves.
With regards to FRR, some countries prefer to have the simultaneous activation of several SCR/FRR
offers, as they rely on the rate of change in the power output of generators (c 7 – 8% per minute for a
modern day CCGT) rather than the price. Under such practices the advantages of a CMOL for the
exchange of energy from FRR resources become less obvious.
5.6 Cross-border exchanges of contracted Reserves
With regards to procurement and exchanges cross-border of contracted reserves, this issue hinges on the
decision with regards to the utilisation of cross-border transmission capacity, in other words whether the
reservation of cross-border capacities for reserves will be allowed, or in the future move to flow-based
market coupling for the intra-day and real-time trading.
TSOs subject to regulatory incentives will be dissuaded to over-contract and will co-ordinate in determining
the amounts of reserves which are necessary in their control area taking into account potential gains from
sharing of reserves. Cross-border sharing of reserves (in case there are no congestions or there is
reserved interconnecting transmission capacity) effectively results in common dimensioning of reserves
(FRR/SCR, RR/TCR) along ENTSO-E rules. The German GCC scheme claims savings of approximately.
€100 million./ year because of common dimensioning of reserves. However in order to be able to resize the
required BR across international borders that might necessitate the merging of Control Areas or the change
of the current ENTSO-E security of supply criteria and standards.
5.7 Assessing the four Policy Options
We have conducted a qualitative analysis of the benefits, costs and implementation challenges of the four
alternative policy options that ACER has presented in its IIA study of 24/04/2012.
It should be noted that because of the heterogeneity of national markets, a qualitative assessment of EU-
wide integration carries significant uncertainty. Balancing market integration involves a complex interplay of
multiple factors. The particular characteristics of each national power system, different initial balancing
markets designs and different initial wholesale market conditions such as structure, liquidity, bid-offer
spread, as well as the efficiency of cross-border capacity allocation will significantly affect the results of a
qualitative assessment of balancing market integration. Ideally, each balancing market integration project
should be analysed separately. However, for the purpose of this report our work is restricted to a qualitative
high level analysis of ACER’s four policy options.
An important aspect that should be taken into account for all of the proposed measures is the role of the
TSOs and the necessity to have their “buy-in” in order to achieve a successful implementation. Due to the
complexity of the balancing and reserve mechanisms, it is unlikely to make any significant progress if the
TSO has an “indifferent” view on the proposed changes. This became easily evident to the Consultant by
the diversity of answers we received to our “TSO Questionnaire”, responses which were mainly based on
individual system conditions, practices for balancing and “balancing services products” each TSO makes

299949/TRD/EFR/01/E 28 March 2013 PiMS/299949/EU Balancing Market/Reports/Issued Reports
90
Impact Assessment on European Electricity Balancing Market
use of. It is, for example important to formally include the market based aspects in the operational
guidelines of the TSOs, if the intention was to develop the TSOs’ operations also from a socioeconomic
perspective. The key for the latter are the regulatory arrangements around the issues of who pays and
how, and what are the incentives in place to keep those balancing costs at a minimum. This process has to
be performed in a sensitive way; the risk otherwise is that the TSO’s interfere with the activities of the
market players. For these reasons it is the consultant’s view that it will be very difficult to harmonise the
European electricity markets in a very strict way, e.g. by proposing detailed rules and imposing solutions. It
is likely that significantly more progress will be made if the TSOs find their own ways to improve their
operations from a socioeconomic perspective if they have relevant incentives for doing so. It is of
paramount importance therefore that alignment of the regulatory incentives for TSOs in balancing the
power system is achieved before the development and putting into operation of a harmonised cross-border
BM framework.
If only limited progress is made even with relevant incentives, there are two alternative ways to achieve
such changes. One is to regulate the TSO’s or at least certain processes within their operations. The
second alternative is to implement these changes through structural efforts. Both of these proposals have a
quite significant impact on market functionality and should only be considered if all other efforts have
proven to be in vain. The four policy options for achieving the integration of European balancing markets
are described below.
5.7.1 A description of the four Policy Options
� Option A: Status Quo.
Under this option balancing market integration is solely driven by individual TSOs voluntarily co-operating
with neighbouring TSOs on the exchange of balancing services, without a binding European regulation in
place.
� Option B: Creating a European exchange of balancing services through a legally binding regulation
defining minimum harmonization requirements necessary to develop cross-border exchanges.
Under this option, the EU would introduce binding regulation forcing Member States to harmonize those
aspects of national balancing markets that are required for the development of cross-border exchanges of
balancing services. It is essentially an option for removing obstacles to balancing market integration and
does not contain any requirements that mechanisms for cross-border balancing services are in fact
established.
In practice, this option would involve imbalance netting plus mechanisms that allow TSOs to share
surpluses – both balancing energy and balancing reserve capacity - with neighbouring TSOs on a voluntary
basis.
Imbalance netting involves sharing information about control zone imbalances and automatic netting of
opposing (long and short) energy imbalances of these control zones in real time, subject to available
transmission capacity.
Surplus sharing of balancing energy could be implemented in various ways. For instance, it could be
possible for BSPs to sell balancing services to neighbouring TSOs provided the local TSO does not veto

299949/TRD/EFR/01/E 28 March 2013 PiMS/299949/EU Balancing Market/Reports/Issued Reports
91
Impact Assessment on European Electricity Balancing Market
the sale. Alternatively, a TSO could offer surplus balancing energy it has acquired on a surplus merit order
list that it shares with a set of neighbouring TSOs.
Similarly, a TSO that has contracted too much balancing capacity could sell excess capacity to
neighbouring TSOs via bilateral trading provided of course that the required cross-border transmission
capacity is available.
� Option C: Creating a European exchange of balancing services through a legally binding regulation
imposing a defined level of harmonization of the balancing mechanisms adopted by each Member State
to facilitate cross-border exchanges.
Under this option, the EU would introduce binding regulation forcing Member States to harmonize national
balancing regulation to make it possible for TSOs to share most balancing resources with neighbouring
TSOs.
TSOs would be required to place all balancing energy bids from their control areas on a common list.
Resources would be activated according to merit order but subject to technical constraints including the
availability of transmission capacities.
For security of supply purposes, TSOs would still be allowed to keep a limited set of balancing resources
for national use. However, TSOs would only be allowed to use the most expensive resources for this
purpose – the cheapest resources must be placed in the common merit order list.
With a common merit order list, TSOs would probably be required to harmonize rules for imbalance
settlement – how BRPs are charged for imbalances, and how BSPs are paid for their balancing services.
In this option, TSOs would use bilateral trading to exchange surplus balancing capacity procured in national
markets, but the establishment of cross-border capacity procurement mechanisms is also a possibility.
� Option D: Creating a European exchange of balancing services through a legally binding regulation
defining a single European balancing mechanism, including creating one or several regulated entities to
perform the tasks of supranational balancing operators.
Under this option, the EU would introduce binding regulation to ensure that all Member States implement a
single balancing market design. All aspects of balancing markets would be fully harmonized across the EU,
and existing balancing markets would be merged into larger, regional balancing markets operated by
supranational balancing market operators that would cooperate with national TSOs in balancing their
respective regions.
5.7.2 Operational challenges of Policy Options – Security of Supply
Security of supply can be analysed under two timeframes: short-term (reliability) and longer-term
(adequacy). Here we only address short-term availability.
On a general note, the success of policy options that facilitate cross-border balancing will largely depend
on how much unused transmission capacity is available after intraday gate closure.

299949/TRD/EFR/01/E 28 March 2013 PiMS/299949/EU Balancing Market/Reports/Issued Reports
92
Impact Assessment on European Electricity Balancing Market
There is thus a need to make a distinction between exchange of balancing energy and cross-border
procurement of reserve capacity. In the latter case there is a need to secure that the procured reserves are
actually available which makes it necessary to also reserve transmission capacity. For the former purpose
the need to reserve transmission capacity is not present, but the degree to which cost reductions for
balancing energy can be achieved will depend on the availability of unused transmission capacity. We
primarily focus on this operational perspective.
Balancing of the electricity system is core to any TSO operation. The primary responsibility for the TSOs is
to maintain security of supply. Integration of balancing markets provides a possibility for the TSOs to
achieve this in a more cost efficient manner.
Successful integration of balancing markets will require the active involvement of the TSOs, and it is
important that the TSOs have incentives for this.
There are two different approaches to balancing. The first approach we label “reactive”. This implies that
the automatic reserves are first used to secure the balance and this is then restored using manual
reserves. An alternative approach is to be more “proactive”. This implies that the TSOs try to foresee
imbalances and through using the manual reserves reduces the need for using the automatic reserves. In a
cross-border perspective, successful TSO cooperation involves coordinating such activities between TSOs.
From a purely theoretical perspective this could probably be achieved through the use of markets. In
practice there may be several obstacles, such as grid congestions and differences in timing between the
TSO (particularly assuming continuous trading on the balancing markets). A model based on strong
relationships between the TSO and a cooperative approach is thus likely to be more successful.
Option A.
Over time, balancing market integration can develop without dedicated regulation, especially if TSOs are
encouraged to reduce costs and neighbouring countries have cheaper balancing resources. A further
incentive is that not all reserve capacity resources are equally flexible, i.e. can be activated to provide
balancing energy equally fast. It might, for example, make sense for a TSO with predominantly high short-
run marginal cost thermal resources and large volumes of intermittent generation to seek cooperation with
neighbouring countries if these can offer cheap hydropower resources that can ramp up or down from zero
to full capacity or vice versa in a matter of minutes. Such is the case in the Nordic countries. The Nordic
Balancing Energy Market for the exchange of manually activated balancing energy was initiated solely
under the initiative of the Nordic TSOs. The market model is based on cooperation between the TSOs and
described as a “TSO-to-TSO model with Common Merit Order (CMO)”. Balancing energy markets for
tertiary reserves are fully integrated while reserve capacity markets are not integrated and operate
separately within each control area.
However, if efficiency gains are not as large, development will take more time, if it happens at all. For
instance, Denmark is also keen on increasing balancing cooperation with Germany, but is facing several
obstacles. Although a pilot to examine the possibility of automatic avoidance of automatic counter
activation of reserves is being carried out, further cooperation with Germany would require a change in
German rules. For instance, current German rules do not allow the activation of unreserved capacity, nor
do they allow the cross-border activation of secondary reserve by the TSO that holds the responsibility over
the control area in which the plant is located. These types of regulatory barriers may prevent the
development of cross-border cooperation.

299949/TRD/EFR/01/E 28 March 2013 PiMS/299949/EU Balancing Market/Reports/Issued Reports
93
Impact Assessment on European Electricity Balancing Market
To summarize, under option A it is likely that cooperation will arise in cases where there are large efficiency
gains, as long as national regulatory barriers does not prevent this from happening. It is also likely that
national regulations will gradually adapt to facilitate harvesting of these gains, but that process may be
slow.
As the TSOs typically have operational reliability as their primary concern it is unlikely that voluntary
cooperation will worsen security of supply for a given resource base. However, in a system where each
TSO independently solve the balancing problem each TSO may have to secure a larger resource base.
When the balancing is based on cooperation the combined resources may be smaller or distributed
differently, which is part of the efficiency gains. A net provider of balancing services may then see
increased security of supply, while a net buyer of balancing services may see reduced security of supply.
Option B
Option B is based on imbalance netting and exchange of surplus balancing resources, with binding EU
regulations. Concerning the former, netting of imbalances may significantly reduce the need for activation
of frequency restoration reserves, thus leading to a better availability of such reserves and thus enhanced
security of supply.
However, imbalance netting is not without risks since it involves acting (or rather not acting) on prognosis,
and if used without proper communication and proper risk assessment it may jeopardize system stability.
Concerning the exchange of surplus balancing resources, Option B is similar to Option A – it may or may
not enhance security of supply for the involved TSO’s and is dependent upon availability of transmission
capacity. Since the sharing of balancing resources is optional, a TSO that is in control of a resource may
withhold it from its neighbours if it feels that sharing it threatens security of supply in its own control area. If
there is low liquidity in the common pool of shared resources, such removals from the pool could leave the
other TSO’s without access to the resources they need. Security of supply will therefore only be enhanced
if there is sufficient liquidity in the shared pool to make the occasional removal of individual resources an
insignificant event. Fundamental for the system to work is that there is an atmosphere of trust among the
TSO´s and a common goal to maintain security of supply at minimum joint costs.
Option C
Option C involves both imbalance netting and the creation of common balancing energy pools (CMOL) that
are jointly operated by a set of TSOs. This means that a market model very similar to the one that has
developed in the Nordic countries as a TSO initiative would be imposed on the rest of Europe. However,
BSPs are in general not required to submit balancing energy bids to the Balancing Energy Market and
there is always a risk that there will not be a sufficient volume of reserves available to handle imbalances
that occur. The different TSOs have different mechanisms to handle this – as mentioned before, reserve
capacity markets operate separately within each country.
The comments above about the impact of imbalance netting on security of supply are as valid for Option C
as for Option B. Concerning the sharing of balancing resources, even though individual TSO’s may keep a
limited set of resources for use only in their own control area, each TSO must place most of the resources
from its control area on the common merit order list and cooperate with the other TSO’s on how these
resources are activated. Due to local bottlenecks in the transmission network the ability to keep some
resources for internal use is important from a security of supply perspective. Since balancing resources are
used for counter purchase within a country all of these resources should not be placed on the common
merit order list.

299949/TRD/EFR/01/E 28 March 2013 PiMS/299949/EU Balancing Market/Reports/Issued Reports
94
Impact Assessment on European Electricity Balancing Market
Option D
Option D involves common rules and management of security of supply. The supranational regional
balancing market operators become responsible for security of supply in each control area that belongs to
their respective regions.
In theory, provided that proper mechanisms for the sharing of responsibilities between such supranational
actors and the remaining national TSO’s are put in place, Option D should provide the largest efficiency
gains. However, this option rests to a very high degree on a top-down approach in which the TSOs are
forced into a common solution, rather than incentivizing the TSOs to cooperate and find workable practical
solutions.
Cross-border procurement of reserve capacity
Some TSOs argue that it can make socioeconomic sense to reserve transmission capacity in order to
procure not just cheaper but in some cases also faster-ramping balancing reserve capacity, even though
this may interfere with the ability to use cross-border links for transfer power for commercial purposes. For
instance, Denmark and Norway have agreed to reserve transmission capacity for system and balancing
purposes in the Skagerrak 4 interconnector that will become operational in 2014/2015. Skagerrak 4 will
have a capacity of 700 MW, with 100 MW reserved so that Norwegian hydropower can more easily be
used to remedy imbalances due to wind power in Western Denmark’s power system. The Danish TSO has
signed an agreement with the Norwegian TSO for the delivery, under 5 years, of +/-100 MW of secondary
reserves. In the case of secondary reserve, which requires more commitment and involves higher costs
than tertiary reserve, the reservation of transmission capacity is more relevant than for tertiary reserve.
As the volume of intermittent generation such as wind power continues to increase, more flexibility in the
form of modified generating schedules for other units or more demand flexibility will be required in order to
continually balance the electricity system to match supply and demand. Illiquid balancing markets and very
volatile balancing prices may prove too risky for new entrants and intermittent generation.
In our review of the four policy options we assume that the reservation of transmission capacity for
balancing purposes is not allowed, so we only consider the exchange of balancing energy coming from
balancing energy bids placed on balancing energy markets by market participants, or from procured
reserves to be used in case transmission capacity is available at the time of activation.
Option C seems to offer the best balance between ease of implementation and economic gains, although in
the long term Option D is the target model which requires higher degrees of harmonisation.
5.7.3 Harmonization issues – Products, Procedures, Gate Closures,
Hardware/Software
In this section we will analyse the need for harmonisation between control areas that are associated with
each of the four policy options.
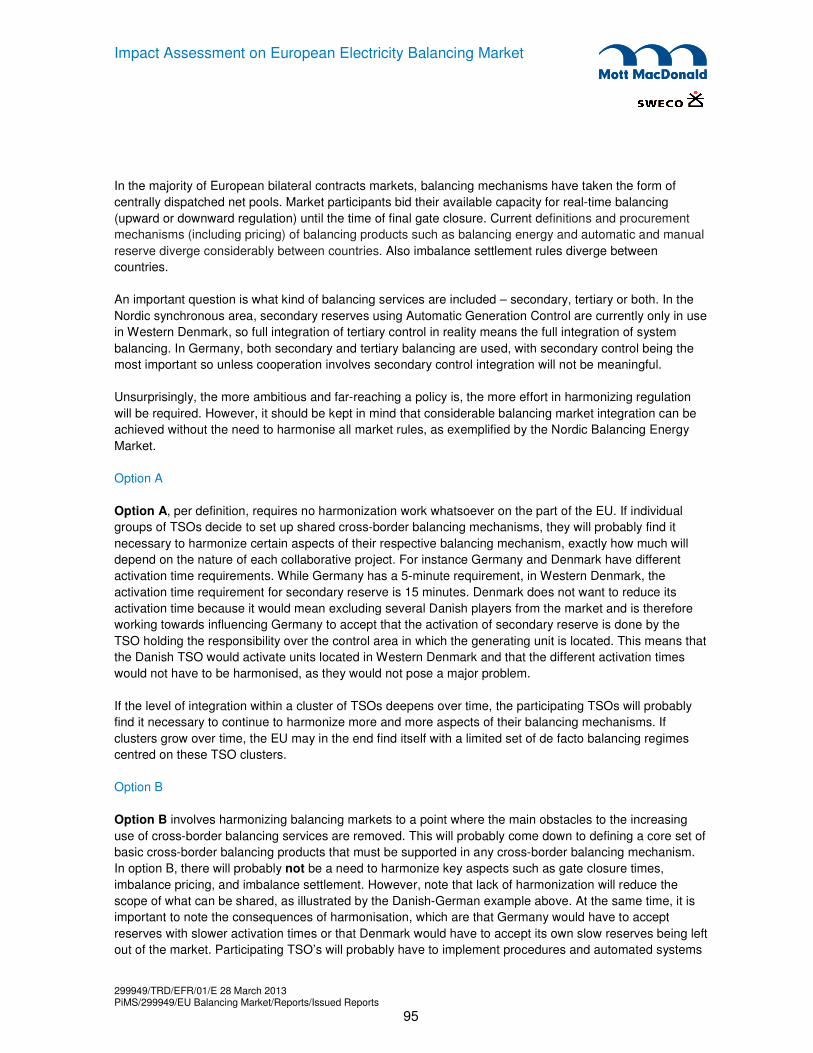
299949/TRD/EFR/01/E 28 March 2013 PiMS/299949/EU Balancing Market/Reports/Issued Reports
95
Impact Assessment on European Electricity Balancing Market
In the majority of European bilateral contracts markets, balancing mechanisms have taken the form of
centrally dispatched net pools. Market participants bid their available capacity for real-time balancing
(upward or downward regulation) until the time of final gate closure. Current definitions and procurement
mechanisms (including pricing) of balancing products such as balancing energy and automatic and manual
reserve diverge considerably between countries. Also imbalance settlement rules diverge between
countries.
An important question is what kind of balancing services are included – secondary, tertiary or both. In the
Nordic synchronous area, secondary reserves using Automatic Generation Control are currently only in use
in Western Denmark, so full integration of tertiary control in reality means the full integration of system
balancing. In Germany, both secondary and tertiary balancing are used, with secondary control being the
most important so unless cooperation involves secondary control integration will not be meaningful.
Unsurprisingly, the more ambitious and far-reaching a policy is, the more effort in harmonizing regulation
will be required. However, it should be kept in mind that considerable balancing market integration can be
achieved without the need to harmonise all market rules, as exemplified by the Nordic Balancing Energy
Market.
Option A
Option A, per definition, requires no harmonization work whatsoever on the part of the EU. If individual
groups of TSOs decide to set up shared cross-border balancing mechanisms, they will probably find it
necessary to harmonize certain aspects of their respective balancing mechanism, exactly how much will
depend on the nature of each collaborative project. For instance Germany and Denmark have different
activation time requirements. While Germany has a 5-minute requirement, in Western Denmark, the
activation time requirement for secondary reserve is 15 minutes. Denmark does not want to reduce its
activation time because it would mean excluding several Danish players from the market and is therefore
working towards influencing Germany to accept that the activation of secondary reserve is done by the
TSO holding the responsibility over the control area in which the generating unit is located. This means that
the Danish TSO would activate units located in Western Denmark and that the different activation times
would not have to be harmonised, as they would not pose a major problem.
If the level of integration within a cluster of TSOs deepens over time, the participating TSOs will probably
find it necessary to continue to harmonize more and more aspects of their balancing mechanisms. If
clusters grow over time, the EU may in the end find itself with a limited set of de facto balancing regimes
centred on these TSO clusters.
Option B
Option B involves harmonizing balancing markets to a point where the main obstacles to the increasing
use of cross-border balancing services are removed. This will probably come down to defining a core set of
basic cross-border balancing products that must be supported in any cross-border balancing mechanism.
In option B, there will probably not be a need to harmonize key aspects such as gate closure times,
imbalance pricing, and imbalance settlement. However, note that lack of harmonization will reduce the
scope of what can be shared, as illustrated by the Danish-German example above. At the same time, it is
important to note the consequences of harmonisation, which are that Germany would have to accept
reserves with slower activation times or that Denmark would have to accept its own slow reserves being left
out of the market. Participating TSO’s will probably have to implement procedures and automated systems

299949/TRD/EFR/01/E 28 March 2013 PiMS/299949/EU Balancing Market/Reports/Issued Reports
96
Impact Assessment on European Electricity Balancing Market
to handle imbalance netting, management of the shared voluntary pool of balancing resources, balancing
reserve trading, and inter-TSO settlement.
Option C
Option C involves harmonizing balancing regulation to the point where it becomes possible for participating
TSO’s to share a non-voluntary common pool of balancing resources. Standardized balancing products
have to be defined, and regulation concerning key aspects of balancing markets such as such as gate
closure times, program time units, BSP roles and responsibilities, imbalance pricing and settlement, and
quite possibly balancing reserve procurement mechanisms may have to be harmonized. Participating
TSO’s will have to develop procedures and automated systems to handle imbalance netting, procurement
of energy balancing products, management of the shared pool of energy balancing resources, balancing
reserve trading and procurement, and inter-TSO settlement.
As mentioned before, this option is similar to the arrangements in the Nordic countries, where the different
national balancing arrangements have been harmonised in a stepwise way. After discussing balance
settlement over several years, the harmonisation measures that were agreed to were: to harmonise gate
closure for the balancing market to 45 minutes, a harmonised cost base for balance settlement and a
common model for the settlement of imbalances. These measures were introduced in January 2009 in
Denmark, Finland and Sweden, and in September 2009 in Norway.
Even though gate closure has been harmonised with all bids becoming legally binding after gate closure,
the rules for when bids can be submitted to the balancing market still differ from country to country. How
activation orders are communicated to BSPs also varies from country to country. While Denmark has an
automated computer network for placing and activating bids, the other countries rely on phone calls for
activating bids.
Option D
Option D involves determining the necessary level of harmonization required for the development of single
balancing market design for the whole EU. It must be kept in mind that it may not be possible to harmonize
all design factors of each national balancing markets, and that it may be challenging to determine what is
necessary and what is not necessary.
This option requires far-reaching harmonization of almost all (but not all) balancing market design factors -
roles of BSPs and BRPs, definition and procurement of balancing services, and balance responsibility and
imbalance settlement rules. It will also involve development of completely new procedures and automated
systems used by the new regional balancing market operators to manage the new regional balancing
markets.
5.8 Implementation Roadmap & Costs of various policy options
In this section we describe various potential implementation roadmaps for each of the four policy options. In
this section we describe various potential implementation roadmaps for each of the four policy options. We
will also briefly describe the costs involved and how these costs vary from option to option. Again, the
unsurprising result is that the more ambitious and far-reaching and option is, the more complex and
expensive it is to implement.

299949/TRD/EFR/01/E 28 March 2013 PiMS/299949/EU Balancing Market/Reports/Issued Reports
97
Impact Assessment on European Electricity Balancing Market
On a general note, the benefits of cross-border balancing may only manifest themselves if transmission
grid bottlenecks are eliminated, or procedures to manage congestion are improved. These issues become
especially pressing in the non-voluntary options C and D, and may make the successful implementation of
these options dependent on grid infrastructure development.
Option A
Option A is the cheapest option, at least as far as the EU as a whole is concerned. TSOs that decide to
participate in voluntary integration projects will of course be faced with implementation costs that depend
on how ambitious the project is, but for non-participants there is no work and zero direct costs. This option
also allows for each project to be assessed individually. For instance the Danish TSO studied the possibility
of establishing a new interconnector between Eastern and Western Denmark with a view to establishing a
common, harmonised manual reserves market in Denmark. The study concluded (26-01-2012) that there
would be no immediate socioeconomic benefits from the action, and the project could be abandoned.
Option B
Option B involves imbalance netting and voluntary sharing of surplus balancing resources. Depending on
the definition of “voluntary”, this option is either nearly as cheap and easy to implement as option A, or
somewhat more expensive and complex to implement. If TSO’s are required to cooperate with other TSO’s
in setting up voluntary shared pools, then they will face implementation costs even if they later choose not
to actually use these pools. However, if it is entirely voluntary to participate in cross-border projects, non-
participants will again face no work and no direct costs. For TSO’s that do participate, costs will again
depend on how ambitious individual projects are, but the presence of minimal EU-wide requirements on
standardized balancing cross-border balancing products will impose minimum costs and implementation
complexity. Participating TSO’s will face costs and implementation work related to management of
imbalance netting, management of the pool of voluntary shared balancing resources, management of
trading of surplus balancing reserve capacity, and inter-TSO settlement.
Option C
Option C involves mandatory participation in the cross-border exchange of balancing energy, and thus
involves more work and higher costs for the EU as a whole than the previous two options. Costs and
implementation complexities relating to imbalance netting will be similar to those of option B. However,
costs related to the operation of a shared pool of balancing resources will be higher than in option B, since
the pool is no longer based on voluntary sharing. Participating TSO’s will have to pay for systems that are
required to make all balancing services available on a shared common merit order list that is jointly
operated by all participating TSO’s. TSO’s will also have to invest in common procedures and systems for
imbalance settlement. Finally, there will be costs related to the shared procurement of balancing reserves if
such mechanisms are included in the project.
The costs and benefits of the cross-border exchange of balancing energy in the Nordic region have never
been quantified. It is generally believed that Denmark, and to a lesser degree Sweden, profit from cross-
border balancing, as well as the Norwegian producers that provide the balancing resources. Finland
operates rather independently balancing with its own resources. However, due to a lack of transparency
from the part of the TSOs this cannot be verified. Notwithstanding transparency issues, evaluating benefits
might still be very complicated, as bids included in the common merit order list are used for both balancing
and congestion management, and there are no clear rules concerning deviations from the merit order.
Activation of bids due to congestion management is done relying on “operator experience”. There is a

299949/TRD/EFR/01/E 28 March 2013 PiMS/299949/EU Balancing Market/Reports/Issued Reports
98
Impact Assessment on European Electricity Balancing Market
possibility that the TSOs modus operandi could be having a significant impact on balancing prices, as bids
that are used for managing congestion are designated as “special regulation”, and are not considered when
calculating the balancing price for the particular hour. For instance, if expensive bids are regularly used for
special regulation, the balancing price goes down – benefiting smaller players that might otherwise not
survive high imbalance costs.
Option D
Option D, being the most ambitious option, is naturally also the option that is most expensive and difficult
to implement. Harmonizing and standardizing more or less every important aspect of balancing is both
costly and complicated to implement. Furthermore, the merging of national balancing markets into larger
regional markets operated by new supranational actors is also very expensive and complex to implement.
Not only must new organizations be created from scratch, but also the way responsibilities are shared
between these organizations and existing TSOs must be defined, and mechanisms that allow the new
actors to interact in a safe manner with the TSOs must be put in place. Finally, difficulties associated with
the funding, staffing and placement of supranational agencies in a continent composed of nation states
should not be underestimated.

299949/TRD/EFR/01/E 28 March 2013 PiMS/299949/EU Balancing Market/Reports/Issued Reports
99
Impact Assessment on European Electricity Balancing Market
This report demonstrated and quantified that cross border integration of balancing markets captures
substantial benefits and increases social welfare, as larger regions reduce the overall demand for
balancing and reduce costs for providing balancing services through a broader portfolio of power plants
and additional sources for balancing services. All cases analysed indicate that gains far exceed the costs of
implementation.
The integration of balancing markets facilitates the integration of intermittent generation from renewable
energy sources and contributes to the reduction of the costs associated with the management of
uncertainty of their output. In fact it has been demonstrated that without the integration of balancing
markets across borders it is very likely that many jurisdictions which have RES potential may have to
restrict their development or ending up at operational level to their curtailment.
The report argued about the close linkages between Balancing Market and other Market Segments (intra-
day and Day-ahead) in fact there is no reason to deviate from the theoretical principle of continuous trading
and the theoretical integration of congestion management with day-ahead, intra-day energy and balancing
markets. The whole point in subjecting the electricity sector to competition is to allow the market to deal
with as many choices as possible and as near “real-time” operations as system physical attributes and IT
capabilities will allow it..The more “day-ahead” and “intra-day” markets are integrated across borders the
more important integration of balancing to the rest of the markets becomes. By using the potential to trade
balancing energy against the flow of transmission lines or reserve transmission capacities for intraday
trading, the integration of congestion management and energy and balancing services markets can
enhance the value of the transmission network and reduce system operation costs.
Albeit this may be a longer term objective, in the mid-term, we recommend therefore that balancing market
key design attributes should encompass the following:
1. Balancing including cross-border balancing by TSOs should interfere as little as possible with
balancing actions by the market (intra-day markets, real-time reaction by price signals). However
TSOs will remain the sole counterparty and entity responsible for balancing the system in real time
2. The most efficient balancing market is a market where ‘minimal’ residual imbalances remain to be
solved by the TSO. This is maximised by a combination of incentives and liquid and efficient intra-
day market
3. All market participants across borders should ultimately face the same incentives, obligations and
responsibilities
4. A single marginal price based mechanism for imbalances is the best practice to incentivise real-time
participation of market actors, however this must be carefully considered vis-à-vis the alternative of
a dual imbalance pricing system and with reference to the specificities of the individual power
system.
5. The regulatory framework concerning TSOs should include incentives to minimise the overall cost of
balancing and optimise the procurement of Balancing Reserves
6. Conclusions and Recommendations

299949/TRD/EFR/01/E 28 March 2013 PiMS/299949/EU Balancing Market/Reports/Issued Reports
100
Impact Assessment on European Electricity Balancing Market
Optimally designed balancing markets should bring forth reliable imbalance prices reflecting all
costs imbalanced BRPs incur to the system.
6. Measures for the improvement of the functionality of intra-day markets have been proposed as: a)
to change from day-ahead spot auction to continuous spot trading until close to physical gate
closure; b) move gate closure time for the spot auction e.g. to 6p.m.on the day before; c) Bundling
of liquidity by introducing auctions in the intraday market; d) to increase of liquidity by obliging
market partners to bid into the intraday market
7. The closing of intra-day market must be no more than 1 hr ahead of the physical gate closure and
the PTU moving to 15 minutes will help reduce balancing costs
8. Incentivisation of BRPs through a harmonised price signal and alignment of the framework for
imbalance settlement coupled to a level playing field on responsibilities to be balanced for all market
participants are perhaps the most important elements of harmonisation. To avoid market distortions
& false incentives for operation (e.g. arbitrage) in CMO list model, a set of common incentive
schemes would be advisable. Differences in the national imbalance settlement mechanisms need to
be tackled. The difference in market rules must not jeopardize security of supply due to cross border
exchange of balancing resources for economic optimization purposes
9. The implementation of a Common Merit Order List must follow careful harmonisation of policies
rules and responsibilities as the balancing incentives need to be consistent with balancing
responsibilities of the TSOs. A CMOL model must resolve the question of how local responsibilities
and local balancing incentives in function of price signals are combined with a global marginal
pricing mechanism
10. The Consultant believes that in mid-term (4 years) the most efficient policy would be the
implementation of a multilateral “TSOs to TSOs” platform for the exchange of balancing energy
(standard products initially for RR and manually activated FRR) based on a Common Merit Order
where “security margins” can be imposed which balances out the implementation challenges
against minimum loss of economic efficiency. A scheme of avoidance of counteracting activation of
balancing energy between control areas, should precede the CMOL

299949/TRD/EFR/01/E 28 March 2013 PiMS/299949/EU Balancing Market/Reports/Issued Reports
101
Impact Assessment on European Electricity Balancing Market
Appendix A. Validation of models _________________________________________________________________ 102
Appendix B. List of References ___________________________________________________________________ 108
Appendix C. Systems control approach and definitions ________________________________________________ 109
Appendices

299949/TRD/EFR/01/E 28 March 2013 PiMS/299949/EU Balancing Market/Reports/Issued Reports
102
Impact Assessment on European Electricity Balancing Market
Appendix A. Validation of models A number of tests have been conducted to test the predictive power of the modelling framework.
All tests were performed on data for both countries in turn with no trade allowed. The bases for validation
were the outturn balancing prices published by Elexon and RTE.
At first stage we have looked at the total cost of balancing the respective systems in 2011 and compared it
against the cost derived by the model.
UK validation – cost of regulation
The cost of upward regulation for the UK for the year 2011, defined as SBP x Volumes of upward regulation,
as shown below. The graph compares predicted costs with actual costs. On the whole, the predictive power
is high, although there is a systematic downward bias – under prediction of costs. On the whole, the ratio of
predicted to actual costs for the full year was 85%. This translates to a slight underestimation of the SBP.
This has been attributed to the modelling framework shortcomings listed in section 3.2.1.
The graph shows that on average the model predicts the prices fairly accurately. However, the graph hides
the real prediction accuracy on a period by period basis, i.e. the prices are sometimes under-predicted and
sometimes over-predicted. Hence the Root-Mean-Square Error (RMSE) and Mean Absolute Error (MAE),
both discussed below, are thought to capture the true magnitude of errors better.
Figure 6.1: The cost of meeting upward regulation in the UK
Source: Mott MacDonald
The cost of downward regulation for the UK, defined as SSP x Volumes of downward regulation, is shown
in . Again, the predictive power, on average, is very high. On the whole, the ratio of predicted to actual
costs for the full year was 103% - a slight overestimation bias. This translates to a slight overestimation of
SSP. However, the true variation is hidden, hence RMSE and MAE are better indicators.
0.0
2.0
4.0
6.0
8.0
10.0
12.0
14.0
16.0
18.0
€M
illi
on
s Predicted Actual

299949/TRD/EFR/01/E 28 March 2013 PiMS/299949/EU Balancing Market/Reports/Issued Reports
103
Impact Assessment on European Electricity Balancing Market
Please note that the cost of downward regulation is shown as a positive number, although in practice this
represents income to the TSO (negative cost).
Root Mean Squared Error (RMSE)
The RMSE, is defined as below:
( )
∑
∑ ⋅−n
i i
n
i iii
volumeregulating
volumeregulatingpricepredictedpriceactual
_
___2
Where:
“i” is the settlement period
“n” is the total number of settlement periods (17520)
actual price – SBP or SSP (Euro/MWh)
predicted price – SBP or SSP (Euro/MWh)
regulating volume – system imbalance, regulating volume activated in a given settlement period (MWh)
The RMSE is a quadratic scoring rule which measures the average magnitude of errors in a set of
forecasts. It is important to note the fact that errors are squared before they are averaged, hence the metric
gives a relatively high weight to large errors.
The RMSE has the same units as the quantity measured (Euro/MWh).
We obtained the volume-weighted RMSE for the UK sample for every month of 2011. However, the RMSE
is only meaningful in relation to the average prices of the underlying variable. Hence the ratio of RMSE to
the average volume weighted regulating price (actual) was calculated for both upward and downward
regulation – the graph below contains the RMSE/volume-weighted price for every month of 2011. Annual
Volume-weighted regulating price is shown in the section 3.2.1.

299949/TRD/EFR/01/E 28 March 2013 PiMS/299949/EU Balancing Market/Reports/Issued Reports
104
Impact Assessment on European Electricity Balancing Market
Figure 6.2: The ratio of RMSE to average balancing price (UK)
Source: Mott MacDonald
Visibly, the accuracy of upward regulation prices is lower than downward regulation.
MAE - Mean Absolute Error
The MAE is defined as below:
( )
∑
∑ ⋅−n
i i
n
i iii
volumeregulating
volumeregulatingpricepredictedpriceactualABS
_
___
Where:
“i” is the settlement period
“n” is the total number of settlement periods (17520)
actual price – SBP or SSP (Euro/MWh)
predicted price – SBP or SSP (Euro/MWh)
regulating volume – system imbalance, regulating volume activated in a given settlement period (MWh)
The MAE measures the average magnitude of the errors in a set of forecasts, without considering their
direction. The MAE is a linear score which means that all the individual differences are weighted equally in
the average. Hence, the RMSE will always be larger or equal to the MAE. The greater the difference
between them, the greater the variance in the individual errors in the sample. If the RMSE=MAE, then all
the errors are of the same magnitude.
MAE also has the same units as the underlying variable (Euro/MWh).
We obtained the volume-weighted MAE for the UK sample for every month of 2011. However, the MAE is
only meaningful in relation to the average prices of the underlying variable. Hence we obtained the ratio of
MAE to the volume weighted regulating price (actual) for both upward and downward regulation.
0%
5%
10%
15%
20%
25%
30%
35%
40%
45%
50%
Upward regulation (SBP)
Downward regulation (SSP)

299949/TRD/EFR/01/E 28 March 2013 PiMS/299949/EU Balancing Market/Reports/Issued Reports
105
Impact Assessment on European Electricity Balancing Market
Figure 6.3 shows the MAE/volume-weighted price for every month of 2011. Annual Volume-weighted
regulating price is shown in the section 3.2.1. The magnitude of errors is seen to be a little smaller than
RMSE, but the overall pattern is similar.
Figure 6.3: The ratio of MAE to average balancing price (UK)
Source: Mott MacDonald
France validation – cost of regulation
The cost of upward regulation for France for the year 2011, defined as SBP x Volumes of upward
regulation is shown in Figure 6.4 below. The chart compares predicted costs with actual costs. On the
whole, the predictive power is high. On the whole, the ratio of predicted to actual costs for the full year was
94%. This translates to a slight underestimation of SBP.
The graph shows that on average the model predicts the prices fairly accurately. However, the graph hides
the real prediction accuracy on period by period basis, i.e. the prices are sometimes under-predicted and
sometimes over-predicted. Hence the Root-Mean-Square Error (RMSE) and Mean Squared Error (MSE),
both discussed above, are thought to capture the true magnitude of errors better.
0%
5%
10%
15%
20%
25%
30%
35%
40%
45%
50%
Upward regulaton (SBP)
Downward regulation (SSP)

299949/TRD/EFR/01/E 28 March 2013 PiMS/299949/EU Balancing Market/Reports/Issued Reports
106
Impact Assessment on European Electricity Balancing Market
Figure 6.4: The cost of meeting upward regulation in France
Source: Mott MacDonald
On the whole, the ratio of predicted to actual costs for the full year was 85%. This translates to a slight
underestimation of SBP.
The cost of meeting downward regulation in France is shown in the Figure 6.5. The predictive power, on
average, is high with one exception – the month of July. The difference between the predicted and outturn
cost for that month was €12.5m. The demand for downward regulation was exceptionally high, more than
double the demand seen in the other 11 months. This suggests something unusual was happening during
that month.
As before, the true variation is hidden, hence RMSE and MAE provide more insight.
Figure 6.5: The cost of meeting downward regulation in France
0
5
10
15
20
25
30
€M
illi
on
s
Predicted Actual
0
5
10
15
20
25
30
€M
illi
on
s
Predicted Realised

299949/TRD/EFR/01/E 28 March 2013 PiMS/299949/EU Balancing Market/Reports/Issued Reports
107
Impact Assessment on European Electricity Balancing Market
Source: Mott MacDonald
RMSE
The same approach has been applied as for the UK results, with the results reported in Figure 6.6
Figure 6.6: The ratio of RMSE to average balancing price (France)
Source: Mott MacDonald
In this case the errors are visibly much larger than for the UK. This has been attributed to a number of
factors discussed before: omission of certain bid offers, technical constraints, required modifications to the
data, etc. However, it is important to note, that on average the predicted prices were fairly accurate.
0%
10%
20%
30%
40%
50%
60%
70%
80%Upward regulation (SBP) Downward regulation (SSP)

299949/TRD/EFR/01/E 28 March 2013 PiMS/299949/EU Balancing Market/Reports/Issued Reports
108
Impact Assessment on European Electricity Balancing Market
MAE
The results from the MAE expressed as a ratio to the average balancing price are shown in Figure 6.7. The
values for MAE are lower than RMSE, as would be expected.
Figure 6.7: The ratio of MAE to average balancing price (France)
Source: Mott MacDonald
0%
10%
20%
30%
40%
50%
60%
70%
80%
Upward regulation (SBP) Downward regulation (SSP)
299949/TRD/EFR/01/E 28 March 2013 PiMS/299949/EU Balancing Market/Reports/Issued Reports
109
Impact Assessment on European Electricity Balancing Market
• B.1 System Control methodologies and products
Typically, a distinction is made between several types of Balancing Services utilised by different TSOs.
These differ mainly in terms of activation method and response speed. The reason for this lies in the
technical limitations of generating units, entailing a trade-off between speed (dynamics) and sustainability
of response (steady state efficiency). For the purpose of this project, the discussion regarding the control
philosophy of European Power Systems and the tools at the disposal of the TSOs to maintain system
security and balance the system in real time needs to make only one distinction between the following two
generic categories of Balancing Services:
1. “Balancing Reserves” – (BR – Capacity in MW) are services procured in advance of real-time as
“Security insurance” and mainly deployed for capacity purposes and usually delivering only a marginal
amount of energy in real time. Technically reserves can be either automatically or manually operated.
2. “Balancing Energy” – (BE – MWh): energy activated by the TSO to maintain the balance of the
system in real time.
The Reserve Capacity can be activated in real-time when encountering disturbances or imbalances.
Depending on the type of imbalance, positive or negative, the activation of these reserves would result in
production plants respectively reducing or increasing their energy output (thus delivering "positive/negative"
Balancing Energy) or conversely flexible demand being curtailed or increased in order to restore the overall
system power balance. In addition Balancing Energy can be also offered freely into the “Balancing
Mechanism” (explanations below) by other plants/loads the capacity of which has not been pre-contracted.
In this concept the Reserve Capacity Market refers to the market where the TSO buys in advance the
reserve capacities for its security of supply needs, whereby selected BSPs take the commitment to reserve
this capacity from their portfolio. This capacity can be contracted before day-ahead market closure and as
early as year-ahead or in some cases based on capacity tenders on even longer time horizons. The
Balancing Mechanism (Market for Balancing Energy), refers to the real-time energy market where the TSO
balances the system by accepting, energy bids/offers received from the BM participants. All TSO's have to
react on actual occurring imbalances;under certain national balancing market mechanisms however, the
activation of BE offers is “scheduled” in advance of real-time as a result of TSOs role in resolving residual
imbalances post last Intra-day (ID) Gate Closure. Those two distinct roles characterise the BM
arrangements as either “reactive” or “proactive”. It is of course of paramount importance whether the
market design and the Grid Code of the respective system, allow for the notification of “imbalance
positions“ at Gate Closure or explicitly prohibit them, in which case the TSO has only to deal with
“inadvertent” imbalances.
A “proactive TSO“ would usually rely on “ex-ante“ / preventative actions for balancing through the use of
manual reserves and slow reserves (Replacement Reserves as we will describe below). The TSO deals
Appendix B. Systems control approach and definitions

299949/TRD/EFR/01/E 28 March 2013 PiMS/299949/EU Balancing Market/Reports/Issued Reports
110
Impact Assessment on European Electricity Balancing Market
with congestion issues through the use of the BM and therefore there is generally less flexibility for the
market ; a typical example of a “proactive“ TSO is National Grid Company (NGC) in the GB market.
A “reactive TSO“, would usually rely on ‘real-time’ balancing by mainly resorting to automatic and fast
reserves (Frequency Containment and Frequency Restoration reserves as will be described below).
Network congestions are dealt with ex-ante. In such market conditions, flexibility, transparency of balancing
market data and market incentives for the BSPs are tools which facilitate the task of the TSO. Typical
examples of “reactive“ TSOs are Elia in Belgium and TenneT in the Netherlands.
• B.1.1 European TSO policies in System Control
Because all TSO control areas within the continental Europe (CE) synchronous area are interconnected,
disturbances affect system performance of the pan-European power system. For this reason ENTSO-E
policy specifies a framework for the Load-Frequency-Control processes by setting technical requirements
for the technical control structure and the responsibilities of the TSOs to which individual national
implementations must adhere.
The European Power Systems control philosophy to cope with contingencies is based on operating the
system with Preventive Security Margins (i.e. N-1 for CE and Nordic synchronous areas, double circuit fault
for UK), meaning that the system is able to sustain a single or double normative event(s) without causing
overloads or other operational problems. Maintaining system security requires the TSOs to keep sufficient
operational reserves to meet security standards. In order to calculate (dimensioning) the volume of the
required operational reserves and safeguard system security, TSOs perform a feasibility check of the
dispatch in their control zone for different time horizons. Time horizons range from months and weeks
ahead – i.e. for planning and coordination of power plants’ maintenance and transmission lines – down to
minutes, with usually an automatic contingency analysis performed as integral part of the overall SCADA
system at each Control Area’s “control centre”.
The second pillar of the control philosophy is that European TSOs operate in a “decentralised” way,
basically responsible for the planning, organisation, procurement and deployment of Frequency Restoration
- FRR and Replacement Reserves - RR (old Secondary and Tertiary reserves respectively) within each
one’s control area with the principle of co-operation and sharing basically applied only to Frequency
Containment Reserve – FCR (old Primary Control) – principle of Joint Action. The main rule of this
decentralised security management structure consists in the TSO of each control zone being responsible
for the security of its own system, for instance by implementing preventive N-1 security, ensuring that there
are enough reserves, etc. However, such ‘local’ actions by TSOs guarantee that all participating control
areas are secure under normal and post-contingency conditions. In the moments directly following a
disturbance – for instance, the loss of a large generator– all control areas provide help proportionally to
compensate for the load-generation disequilibrium, this is within the domain of FCR This is a fully
automated procedure aiming to stabilise the system frequency in the time-frame of seconds at an
acceptable stationary value after a disturbance or incident, by using a control variable that is identical for all
control zones, allowing as such for an instantaneous and coordinated reaction by the system. Overall
system security is, however, based on the local responsibilities of individual TSOs. According to the
“Principle of Responsibility”, the affected TSO is obliged to restore preventive security by compensating for
the lost unit and bearing the associated costs. Thanks to the limited time horizon in which the control zone
must compensate for generation loss (up to 15 minutes), financial flows between the control zones are
limited.

299949/TRD/EFR/01/E 28 March 2013 PiMS/299949/EU Balancing Market/Reports/Issued Reports
111
Impact Assessment on European Electricity Balancing Market
The scheme described above lies at the core of security planning in all control areas. It presumes that the
post-contingency state for control areas, other than the one where the disturbance took place, is usually
more or less equal to the pre-contingency state. Though the internal dispatch of the affected system is
most likely different, it is assumed that this will not have a significant impact on other control areas. A
control area experiencing a mismatch between its scheduled and measured cross-border exchanges is
responsible for restoring its area balance within 15 minutes. The balance must be restored using local
resources – i.e. within the control area – so that the affected TSO reduces the costs that other control
areas face as regards regulating power delivery and starts bearing these costs itself.
TSO’s are responsible for the system’s power balance by maintaining and activating Frequency
Containment Reserve (FCR), Frequency Restoration Reserve (FRR) and Replacement Reserves (RR).
Furthermore the decentralised control philosophy applies strict sequential rules about the deployment and
exhaustion times of the successive layers of control (FCR, FRR, RR) and the “replenishment” (or releasing)
of those reserves, once the next “layer” takes over. This is because those reserves with the fastest
response time are usually the more valuable and therefore should be replaced by successively “cheaper”
resources, The timescales, procurement principles, method and activation times are presented in .
Figure B.1: Different kinds of Reserve and Sourcing
Source: ENTSO-E

299949/TRD/EFR/01/E 28 March 2013 PiMS/299949/EU Balancing Market/Reports/Issued Reports
112
Impact Assessment on European Electricity Balancing Market
Figure C.2 diagrammatically depicts the conceptual hierarchy of System Control but can be also slightly
misleading. All products in the whole time framework are components of the Balancing Market used by the
TSO to procure Balancing Services
All the steps from automatically activated Frequency Containment Reserve & Frequency Restoration
Reserve, manually activated FRR, manually activated “fast” & “slow” RR and manually activated
Bids/Offers of Balancing Energy (either pre-contracted by TSOs or not), follow the rules and are part of the
“Balancing Market”. The situation is explained more in detail below.
Figure B.2: Application Concept of Reserves
Source: ENTSO-E

299949/TRD/EFR/01/E 28 March 2013 PiMS/299949/EU Balancing Market/Reports/Issued Reports
113
Impact Assessment on European Electricity Balancing Market
• B.1.2 Markets for Balancing Services
After a disturbance of the balance between generation and demand the following steps are performed:
� Automatic procedures:
− Frequency Containment (0 – 30 sec)
− Automatic Frequency Restoration (30 sec – 15 minutes) - replaces FCR
� Manual procedures:
− Manual Frequency Restoration
− Replacement of Frequency Restoration by RR - (5min – 15 min) in some countries – use of “slower
reserves” in others
− Balancing Energy – selection of Bids/Offers from Balancing Mechanism Participants
Commercially, as for market participants, the activities of TSOs to procure these services within their
control areas differ across time periods. All of these activities can be referred to as “System Balancing”. We
describe below generic System Balancing activities in the various timeframes.
a. Procurement of Balancing Reserves before Intra-Day Gate Closure
Prior to intra-day Gate Closure, before production and consumption schedules are known in relation to a
particular delivery time, the TSO has no need (or ability to judge accurately the requirement for) delivery of
Balancing Services. In this time period, the TSO therefore undertakes Balancing Reserves (Capacity)
procurement with longer term arrangements to ensure that:
� sufficient Balancing Services will be available in relation to delivery periods;
and
� where relevant, they are hedged against volatility in the price at which those services (mainly
Replacement Reserve or Tertiary control reserve) are offered.
The TSO will therefore strike long, medium and short term contracts with participants, under which the
participants agree to be available to provide FCR, FRR or RR, usually in a market basis arrangement like
competitive tenders (annual, quarterly, weekly etc). These contracts typically specify the technical
characteristics of the service required (e.g. automatic FCR or RR providing energy within a fixed time
period of call off etc.), a required availability to provide the service (e.g. must be available for a certain
number of hours, must be available between defined time periods), a capacity price for availability and
often a price for the mandatory submission into the Balancing Mechanism of energy bids/offers. Capacity
(availability) payments usually are on a “pay-as-bid” basis while balancing energy procured through the
Balancing Mechanism is usually (but not necessarily) settled on a “marginal” price basis.
In some systems, near to intra-day Gate Closure, the System Operator will also undertake limited trading
with participants to manage anticipated network congestions and to start to call-off contracts to provide
reserve (in anticipation of participants’ scheduled production and consumption).
b. Energy Balancing after the “last” intra-day Gate Closure – Balancing Mechanism
299949/TRD/EFR/01/E 28 March 2013 PiMS/299949/EU Balancing Market/Reports/Issued Reports
114
Impact Assessment on European Electricity Balancing Market
Following the last intra-day Gate Closure for the relevant trading period, TSOs are in a position to start to
refine the production and consumption schedules submitted by participants to ensure secure supply (by
accepting bids/offers from the BM, and then to continue to manage the system during the period of delivery
(by using all reserve categories). While some bids/offers into the BM are RR which may have been
contracted in advance, as described above, within the context of a liberalised energy market, there is
typically a mechanism by which participants who have not been contracted to provide FCR/RR can
voluntarily place short-term bids/offers to the TSO or to provide incremental and decremental production at
their particular grid location. This mechanism to which we have already referred to as “Balancing
Mechanism”, allows all market participants to submit bids to the TSO which assist them in balancing overall
supply and demand and in managing locational issues (i.e. congestion). This is a limited form of trading, in
which the TSO is always the counterparty.
Therefore, after intra-day Gate Closure, and in order to refine participants’ schedules in advance of the
delivery time period, the TSO may accept bids to the Balancing Mechanism to increase or decrease
production. The System Operator will typically continue to refine production and consumption schedules
from Gate Closure through to the real-time of actual delivery.
Once delivery commences, all three categories of balancing reserves will be in use – FCR to respond
automatically to system events, FRR to replace FCR and to control boundary flows (FRR can act as a
centralised Automatic Generation Control system (AGC) that alters the generation). The main role of FRR
is to restore inter-area exchanges (and consequently overall frequency) to their target values following an
imbalance within a timeframe of under 15 minutes). Finally RR, is instructed manually through the
Balancing Mechanism to replace FCR and FRR as required. In fact there is no distinction between
balancing energy coming from contracted reserves or from balancing energy bids into the Balancing
Mechanism placed freely by non-contracted market participants.
The Balancing Mechanism therefore includes the market for both types of balancing energy bids as well as
for balancing reserves. In this respect contracting balancing reserves is one way to ensure enough volume
of energy bids in balancing mechanism, i.e. to meet the security criteria.
In accepting offers/bids in balancing mechanism timescales, TSOs are conceptually at least trying to solve
two problems:
3. ensuring overall supply and demand balance – replacing FCR, FRR with cheaper resources which are
capable of providing power over longer timescales; and
4. addressing network congestion.
below summarises the characteristics of all types of Reserves employed in the continental European
synchronous zone (ex-UCTE).

299949/TRD/EFR/01/E 28 March 2013 PiMS/299949/EU Balancing Market/Reports/Issued Reports
115
Impact Assessment on European Electricity Balancing Market
Figure B.3: Characteristics of Reserves
Time ≤ 1 min
1 …15 minutes
≥ 15 minutes
Frequency Containment Reserves – FCR
De-centralised automatic activation (at BSP)
Fast activation (ramping to 50% in 15 sec – 100% within 30 sec) And be able to remain active for at least 15 mins.
Common responsibility of TSOs within Synchronous zone – total 3000 MW, each TSO is obliged to maintain proportion to its size
Different ways of procurement
Frequency Restoration Reserves - FRR
Central automatic / manual activation (at TSO level)
Intended to replace FCR, restore frequency and maintain exchange schedules
Activation in the area of disturbance within 30 sec and completed within 1 PTU
Responsibility of each TSO in its respective control area
Replacement Reserves - RR
Central Manual activation (at TSO level)
Responsibility of each TSO – Replaces FRR
Activation within 15 mns for "fast" RR or longer lead times (30mns, 1 hr, etc)
Source: Mott MacDonald
FCR is an initial and automatic response to imbalances, which is activated by all TSOs throughout the
entire ENTSO-E area. The cross-border exchange of FCR is secured through the Transmission Reserve
Margin. On the other hand FRR and RR type of Balancing Reserves are used to supplant the use of FCR
within individual TSO control areas and if procured on a cross-border basis they will need to secure cross-
border transmission rights. The rest of this report will not consider issues around FCR.

299949/TRD/EFR/01/E 28 March 2013 PiMS/299949/EU Balancing Market/Reports/Issued Reports
116
Impact Assessment on European Electricity Balancing Market
1. UCTE, “P1 – Policy 1: Load-Frequency Control and Performance [C],” part of UCTE Operation
Handbook, March 2009.
2. ETSO, “Balance Management Harmonisation and Integration - 4th Report,” Jan. 2007.
3. Eurelectric, “Towards Market Integration of Reserves & Balancing Markets,” July 2008.
4. ERGEG, "Revised ERGEG Guidelines of Good Practice for Electricity Balancing Markets Integration
(GGP-EBMI)," Ref: E09-ENM-14-04, Sep. 2009.
5. KU Leuven en Tractebel Engineering, “Study of the interactions and dependencies of balancing
markets, intraday trade and automatically activated reserves,” final report, TREN/C2/84/2007, Feb.
2009.
6. ETSO, “Current State of Trading Tertiary Reserves Across Borders in Europe,” Nov. 2005.
7. ETSO, “Key Issues in Facilitating Cross-border Trading of Tertiary Reserves and Energy Balancing,”
May 2006.
8. R. A. C. van der Veen, A. Abbasy, and R. A. Hakvoort, “A qualitative analysis of main cross-border
balancing arrangements,” presented at the 7th Int. Conf. on the European Energy Market, Madrid,
Spain, 2010.
9. A. Abbasy, R. A. C . van der Veen, and R. A. Hakvoort, “Effect of Integrating Regulating Power
Markets of Northern Europe on Total Balancing Costs,” presented at the PowerTech Conference,
Bucharest, Romania, 2009.
10. A. Abbasy, R. A. C . van der Veen, and R. A. Hakvoort, “Possible Effects of Balancing Market
Integration on Performance of the Individual Markets,” paper for the 8th Int. Conf. on the European
Energy Market, Zagreb, Croatia, 2011 (forthcoming).
11. R. A. C . van der Veen, A. Abbasy, and R. A. Hakvoort, “Analysis of the Impact of Cross-border
Balancing Arrangements for Northern Europe,” paper for the 8th Int. Conf. on the European Energy
Market, Zagreb, Croatia, 2011 (forthcoming).
12. S. Jaehnert and G. L. Doorman, “Modelling An Integrated Northern European Regulating Power
Market Based On a Common Day-Ahead Market,” conference paper, IAAE’s Rio 2010 International
Conference, Rio de Janeiro, Brazil, 2010.
13. O. S. Grande, G. L. Doorman, and B. H. Bakken, “Exchange of balancing resources between the
Nordic synchronous system and the Netherlands / Germany / Poland,” SINTEF Energy Research,
technical report, Feb. 2008.
14. ACER, New Expert Group on Gas Interoperability Annex 1, “Terms of reference for the ad hoc expert
group on interoperability rules”, Ref: A11-AGWG-06-03, Sep 2011
15. ACER, Open letter on establishment of an ad hoc expert group, Ref: A11-AEWG-04-04, Jul 2011
16. ACER, “3rd meeting of the ACER Stakeholders Advisory Group”, Ref: E11-AESAG-03-02, May 2011
Appendix C. List of References

299949/TRD/EFR/01/E 28 March 2013 PiMS/299949/EU Balancing Market/Reports/Issued Reports
117
Impact Assessment on European Electricity Balancing Market
17. ACER, “4th meeting of the ACER Stakeholders Advisory Group”, Ref: E11-AESAG-04-02, Jul 2011
18. TenneT website, http://www.tennet.org/english/index.aspx
19. German digital platform for reserve tenders, www.regelleistung.net
20. NordPool website, http://www.nordpoolspot.com
21. ENTSO-E data website, http://www.entsoe.net/home.aspx
22. Adequate intraday market design to enable the integration of wind energy into the European power
systems - Christoph Weber (2009)
23. Balancing and Intraday Market Design: Options for Wind Integration Frieder Borggrefe and Karsten
Neuhoff, 2011
24. Well-functioning balancing markets: A prerequisite for wind power integration Leen Vandezande, _,
Leonardo Meeus,, Ronnie Belmans, Marcelo Saguan,,Jean-Michel Glachant.
25. Study, on the general design of electricity market mechanisms close to real time (Yves Smeers,
2008)
26. Hossein Farahmand, Gerard Doorman, “Balancing Market Integration in the Northern European
Continent”, Applied Energy, Volume 96, August 2012, Pages 316-326,
10.1016/j.apenergy.2011.11.0
27. Venkat A. N. Distributed MPC Strategies With Application to Power System Automatic Generation
Control – IEEE Transactions on Control Systems Technology, 2008