Immunisation Supply Chain Strategies - UNICEF · PDF fileImmunisation Supply Chain Strategies...
29
Immunisation Supply Chain Strategies 2014 Vaccine Manufacturer Consultation Copenhagen, 9 October 2014
Transcript of Immunisation Supply Chain Strategies - UNICEF · PDF fileImmunisation Supply Chain Strategies...

Immunisation Supply Chain Strategies
2014 Vaccine Manufacturer ConsultationCopenhagen, 9 October 2014
Session Topics
• Why do immunisation supply chains matter?
• GAVI Alliance immunisation supply chain strategy
• UNICEF supply chain strengthening with governments
• Current activities in Zambia, Nigeria, DRC
• ViVa visibility for vaccines
• Discussion


Session Topics
• Why do immunisation supply chains matter?
• GAVI Alliance immunisation supply chain strategy
• UNICEF supply chain strengthening with governments
• Current activities in Zambia, Nigeria, DRC
• ViVa visibility for vaccines
• Discussion
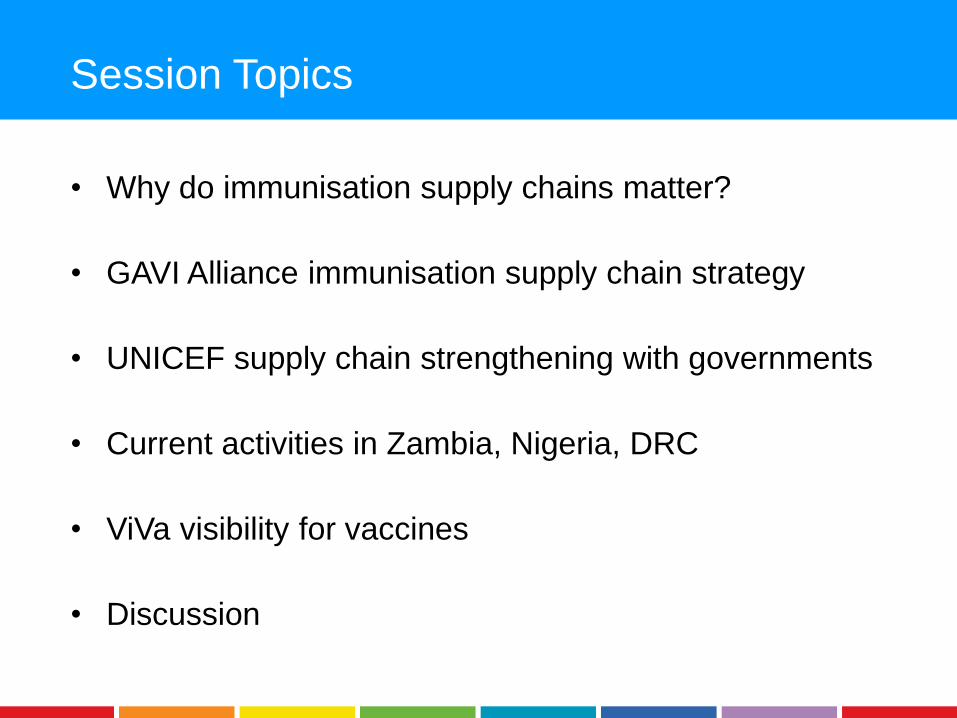
Immunisation supply chain risk will increase due
to higher volumes, doses and vaccine cost
Increasing number
of doses2
Increase in stock keeping units
per year for GAVI vaccines4
Growing volume (cm³) to
vaccinate per child1
28070
Introduction of more
expensive vaccines3
2010
Vx mix3
2020
Vx mix
(price 2013)3
$0.8$4.1
2010 2020Supply chain requirements
~4x
~2x
~6x
~5x
Note: All figures relate to GAVI-funded vaccines
1. UNICEF Supply 2012 Financial report, WHO data for Pneumo and Rota vaccines, and HPV (only for girls); 2. 2010: GAVI Shipment Data; 2020; GAVI SDF Forecast; Including volume for GAVI future graduated countries; 3. Comparison based on 2013 Price; 2020 Vaccines include: Rota, Pneumo; HPV; 2010' vaccines include:YF, Measles, DPT, OPV (UNICEF SD); 4. GAVI Background SDF Information; 2010": estimates based on 2009 data; 2020: estimates based on 2013 forecast

Vaccine introduction status and tentative plan for
Eastern & Southern Africa region: 2014-2018
CountryPe
nta
Pneu
mo
Rota
MSD
MR/
MM
R
HepB
birth
HPV
IPV YF Men
A
Angola 2006 2013 2014 2017 0 2017 2017 2015 1999 0 4
Burundi 2005 2011 2013 2013 2017 2017 2015 2015 2017 2016 6
Botswana 2009 0 0 2011 0 2000 0 2015 0 0 1
Comoros 2009 2016 2016 2015 2018 2018 2016 2015 0 0 7
Eritrea 2008 2015 2014 2012 2015 2020 2018 2015 2020 2018 5
Ethiopia 2007 2011 2013 2018 0 2018 2016 2015 2018 5
Kenya 2001 2011 2013 2013 2015 2017 2014 2015 2000 2017 5
Lesotho 2008 2014 2015 2013 0 2015 2011 2015 0 0 4
Madagascar 2008 2012 2014 2018 0 2018 2018 2015 0 0 5
Mozambique 2009 2013 2015 2015 2018 2018 2017 2015 0 0 6
Malawi 2002 2011 2012 2015 2016 2021 2015 2015 0 0 4
Namibia 2009 2014 2014 2015 0 2012 0 2015 0 0 4
Rwanda 2002 2009 2012 2014 2014 2018 2014 2015 2016 2017 7
Somalia 2013 2016 2018 0 0 0 0 2015 0 0 3
Mozambique 2009 2013 2015 2015 2018 2018 2017 2015 0 0 3
South Sudan 2014 2016 2018 2018 0 0 0 2015 2016 0 6
Swaziland 2010 0 0 2008 0 0 0 2015 0 0 1
U R of Tanzania 2009 2013 2013 2014 2014 2018 2014 2015 0 0 5
Uganda 2002 2013 2016 2016 0 2017 2015 2015 2020 2016 6
Zambia 2004 2013 2012 2013 2015 2019 2015 2015 0 0 3
Zimbabwe 2008 2012 2014 2015 2015 2019 2014 2015 0 0 5
95
Updated date:
Aug 2014Tentative year of vaccine introduction
Numb
er of
vacci
ne
intro
ducti
on pl
an
2014
-201
8
Total

On average country immunisation supply chains do
not meet WHO standards today
1. EVM (Effective Vaccine Management) Assessments – Average score of Principal, Sub-National, Local District and Service Point Level; Source: EVM assessment for 57 GAVI countries, WHO
20% 24%38%
28%16% 19% 17%
30%37%
80% 77%62%
73%85% 81% 83%
70%63%
Distribution Information
systems
Buildings
and
equipment
Storage
capacity
Temperature
monitoring
Stock
management
MaintenancePre-
shipment &
vaccine
arrival
Vaccine
management
Reaching standard
Not reaching standard
% of countries that reach 80% target on
relevant supply chain WHO standards1

0%
20%
40%
60%
80%
100%E1: Arrivage/Réception vaccin
E2: Température
E3: Capacité de stockage
E4: Bâtiments, équipement, transport
E5: MaintenanceE6: Gestion de stock
E7: Distribution
E8: Gestion des vaccins
E9: SIG, fonctions d'appui
Scores de critères
Cible % Maximum % Moyenne % Minimum % Etendu: Entier Niveau: Dépôt central (1) n: 1
0%
20%
40%
60%
80%
100%E1: Arrivage/Réception vaccin
E2: Température
E3: Capacité de stockage
E4: Bâtiments, équipement, transport
E5: MaintenanceE6: Gestion de stock
E7: Distribution
E8: Gestion des vaccins
E9: SIG, fonctions d'appui
Scores de critères
Cible % Maximum % Moyenne % Minimum % Etendu: Entier Niveau: Dépôt intermédiaire (1) n: 3
0%
20%
40%
60%
80%
100%E1: Arrivage/Réception vaccin
E2: Température
E3: Capacité de stockage
E4: Bâtiments, équipement, transport
E5: MaintenanceE6: Gestion de stock
E7: Distribution
E8: Gestion des vaccins
E9: SIG, fonctions d'appui
Scores de critères
Cible % Maximum % Moyenne % Minimum % Etendu: Entier Niveau: Dernier niveau de distribution n: 17
0%
20%
40%
60%
80%
100%E1: Arrivage/Réception vaccin
E2: Température
E3: Capacité de stockage
E4: Bâtiments, équipement, transport
E5: MaintenanceE6: Gestion de stock
E7: Distribution
E8: Gestion des vaccins
E9: SIG, fonctions d'appui
Scores de critères
Cible % Maximum % Moyenne % Minimum % Etendu: Entier Niveau: Point de prestation n: 12
Central level Regional level
District level Service Delivery level

Session Topics
• Background and problem statement
• GAVI Alliance immunisation supply chain strategy
• UNICEF supply chain strengthening with governments
• Current activities in Zambia, Nigeria, DRC
• ViVa visibility for vaccines
• Discussion

Consultations with PPC
and board members
The strategy was developed in a collaborative process
with Alliance partners
Private sector / other
partners
Consulted on strategy
with ~35 private sector
and other partners
Presentation at World
Vaccine Congress
Review of strategy in
eight Steering Committee
workshops
Alliance
Taskforce
Countries
Baseline analysis drawing
on discussion with 25
country level experts
Surveyed >25 EPI
managers
Presentations at regional
EPI managers meetings
Direct consultations
Global health community
67 members actively
involved through working
groups
Presentation at workshops
and conferences
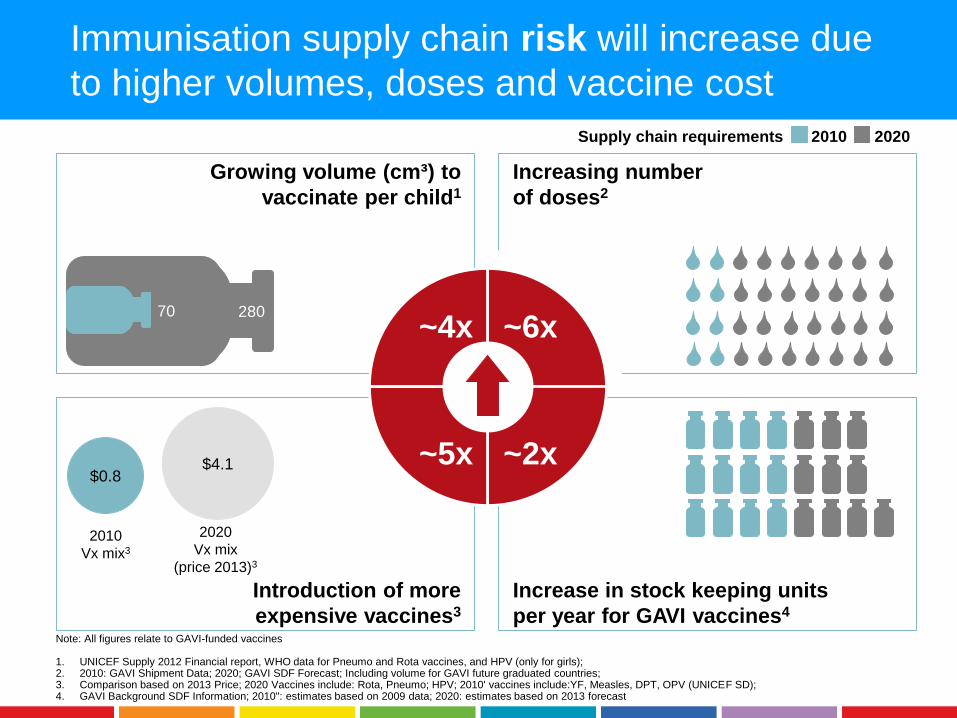
The task of moving vaccines and immunisation
products to beneficiaries involves many challenes:
Evidence points to issues in seven areas:
• Limitations in supply chain system design
• Insufficient and misallocated human resources
• Ineffective use of data for management
• Weak distribution systems
• Inadequate budget and distribution systems
• Deficient cold chain equipment
• Increasing volume and value

Priorities
and
Initiatives
Change
Objectives
Vision 2020
The resulting strategy framework builds on a number of
critical priorities and initiatives
1. Currently EVMSource: GAVI Alliance Task Force
• Use resources efficiently
Immunisation supply chains provide potent vaccines efficiently to all
Save children's lives and protect people's health by
increasing access to immunisation in poor countries
• Maintain vaccine potency
• Ensure availability of right
vaccines and supplies
1 2
System Design & Optimisation
Distribution
& Transport
People &
Practices
Cold Chain
Equipment
Data for
Management
Alliance-wide theory of change
Implementation
mechanisms
Funding
mechanisms
Technical
assistance
Roles &
responsibilities
Policy changes
and guidance
In-country
change
process
Implementation roadmap Budget

Managing change in countries will build upon
existing mechanisms
CSOs PartnersPrivate
sector
Support & Funding
Donors
2. Country supply chain
plan
3. Grant application(HSS /NVI)
4. IRC and High level
panel review
5. Implemen-tation of impro-
vement plan
6. Monitoring & evaluation
Partners aligned to
promote and support
implementation
Supply chain management
dashboard to support
monitoring
Increased support for applications.
Improved guidelines to strengthen
link with improvement plans
Improvement plan based
on assessments and tools
Right supply
chain expertise
on IRC and high
level panel
1. Country change team
Country-led team to
manage implementation;
supply chain manager is
key participant

Session Topics
• Background and problem statement
• GAVI Alliance immunisation supply chain strategy
• UNICEF supply chain strengthening with governments
• Current activities in Zambia, Nigeria, DRC
• ViVa visibility for vaccines
• Discussion
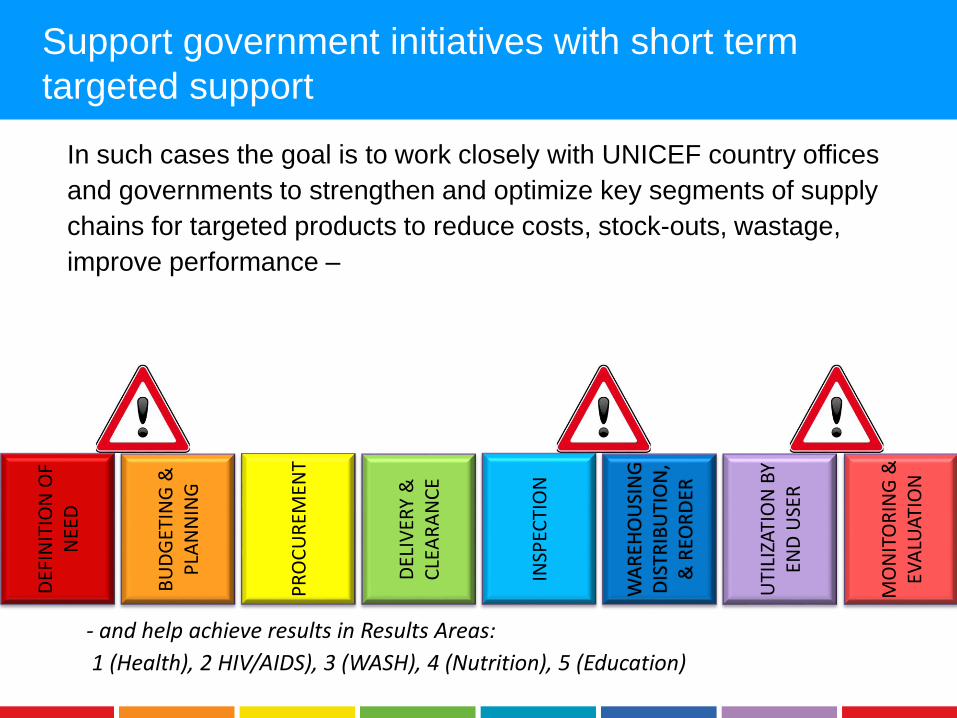
Support government initiatives with short term
targeted support
In such cases the goal is to work closely with UNICEF country offices
and governments to strengthen and optimize key segments of supply
chains for targeted products to reduce costs, stock-outs, wastage,
improve performance –
- and help achieve results in Results Areas:
1 (Health), 2 HIV/AIDS), 3 (WASH), 4 (Nutrition), 5 (Education)
DEF
INIT
ION
OF
NEE
D
BU
DG
ETIN
G &
P
LAN
NIN
G
PR
OC
UR
EMEN
T
DEL
IVER
Y &
C
LEA
RA
NC
E
INSP
ECTI
ON
WA
REH
OU
SIN
GD
ISTR
IBU
TIO
N,
& R
EOR
DER
UTI
LIZA
TIO
N B
Y EN
D U
SER
MO
NIT
OR
ING
&
EVA
LUA
TIO
N
Funding & Policies
Investments & Infrastructure
Systems & Data
People & Practices
Sustainable National Supply Chains
DEF
INIT
ION
OF
NEE
D
BU
DG
ETIN
G &
P
LAN
NIN
G
PR
OC
UR
EMEN
T
DEL
IVER
Y &
C
LEA
RA
NC
E
INSP
ECTI
ON
WA
REH
OU
SIN
GD
ISTR
IBU
TIO
N,
& R
EOR
DER
UTI
LIZA
TIO
N
BY
EN
D U
SER
MO
NIT
OR
ING
&
EV
ALU
ATI
ON
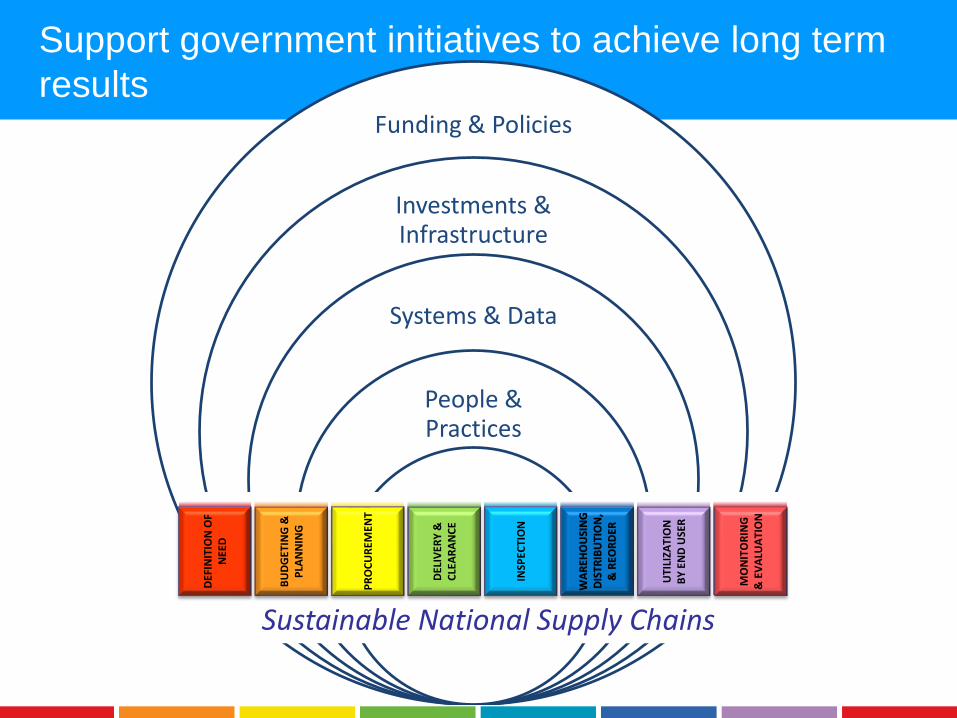
Support government initiatives to achieve long term
results

What does success look like in 2017?
Increased number of countries implementing national supply chain systems strengthening/capacity
development strategies, led by government and aligned with national strategic health plans
Strong networks created with increased collaboration, sharing
and co-ordination in supply chain activities at global, regional and
country level
Global Learning Centre
is recognized as a platform for supply chain resources and
learning
> 20 Government supply chains strengthened and optimized for
targeted products
Increased use of supply chain data to support decision making,
from determination of need through to delivery to the last
mile

Success in 2017
Phase 1 Phase 2 Phase 3 Phase 4
Monitoring and Evaluation
Results of SC assessments and improvement plans
published
SC assessments and improvement plans
Accepted govtrequests come to pre-defined end
objectives
Courses available and delivered in GLC
Product specific SC performance monitoring
Ad
voca
cy /
Co
mm
un
icat
ion
Too
ls a
nd
Gu
idan
ce
Skills/Learning & Development
Global networking and
collaboration
Comms tools for creating internal and external awareness
Advocacy for increased SC
engagement in ICCs & NTWGs
Advocacy for SC collaboration and
co-ordination.
Integratedcampaign guidance
SC analysis and management toolkits
Project management
Technical assistanceand training of COs
and partners
WIM training
Guidance for adopting innovative technologies
National SC strategies
Enhanced CO VISION
WH module
Conceptual development of CD strategies
Knowledge sharing portal / platform
Distribution and transportation
guidance
In-country champions for effective supply chains
Landscape analysis of
existing SC tools
SCM essentials and reference materials
Quality assurance and CAPA in SCs
SCM partnerships
Designing SC improvement
plans
Project engagement progress reporting
SC standards and KPIs
South-to-SourhexchangecEVM

Session Topics
• Background and problem statement
• GAVI Alliance immunisation supply chain strategy
• UNICEF supply chain strengthening with governments
• Current activities in Zambia, Nigeria, DRC
• ViVa visibility for vaccines
• Discussion
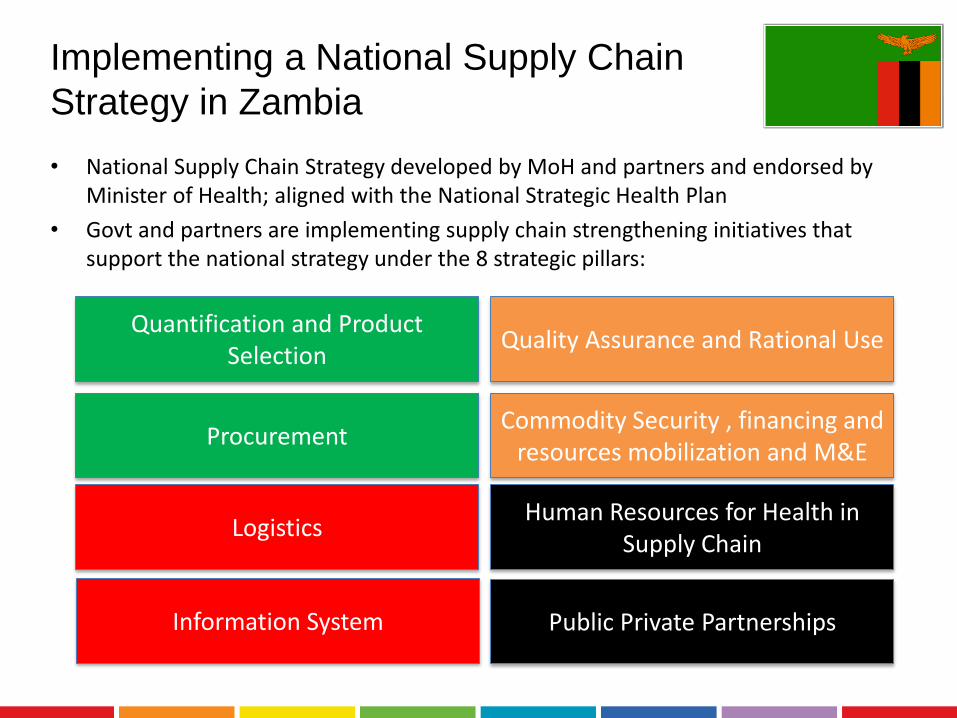
• National Supply Chain Strategy developed by MoH and partners and endorsed by Minister of Health; aligned with the National Strategic Health Plan
• Govt and partners are implementing supply chain strengthening initiatives that support the national strategy under the 8 strategic pillars:
Quantification and Product Selection
Quality Assurance and Rational Use
ProcurementCommodity Security , financing and
resources mobilization and M&E
LogisticsHuman Resources for Health in
Supply Chain
Information System Public Private Partnerships
Implementing a National Supply Chain
Strategy in Zambia

Context
Scope
LMIS: Microsoft Dynamics Navision warehouse module in Nigeria
Currently warehouse management at national level in Nigeria does not provide real time, accurate data.
The high volume of incoming and outgoing stock necessitates the need for an integrated, robust LMIS system for all levels of warehouse management in Nigeria
The deployment of Microsoft Dynamics Navision 2013 will be limited to:
1 Central Store6 Zonal Stores37 State Stores (36 states and FCT)
The system includes the modules:
Vaccine RequisitionsVaccine IssuanceStock Movement Stock Location Transfers Stock Level ManagementStock Expiry Date Tracking Audit & Inspection
Warehouse Module Structure
Objectives
Increase vaccine supply chain visibility and improve stock management and communication between the supply chain tiers.
Transfer the ownership to the government after installation, training, etc to ensure sustainable use and maintenance of the system.

Decentralisation of international vaccine
shipments to reduce bottlenecks
632 million doses
Data: UNICEF Supply Division 2013
111 million doses
Problems observed today:
• High frequency of international shipments to the capital airports
• Large cold room capacity required
Potential solutions:
• Support the decentralization of international shipments and destination points to provincial international airports
• Contribute to analyse the benefits of a decentralised distribution network
• Contribute to capacity development of human resources at multiple levels

Session Topics
• Background and problem statement
• GAVI Alliance immunisation supply chain strategy
• UNICEF supply chain strengthening with governments
• Current activities in Zambia, Nigeria, DRC
• ViVa visibility for vaccines
• Discussion

25
ViVa is a stock monitoring projection and early
warning / advocacy tool

ViVa enables identification and communication of
potential upcoming vaccine supply constraints
weeks
doses
3 months alert

ViVa evaluation of pilot phase:
success criteria and result of feedback survey
Criteria of success
1 Visual Aspect: Is the graphics acceptable?
2 Usability: Is the tool user friendly?
3Frequency of use as monitoring tool: How frequently was the tool used as monitoring tool?
4Frequency of use as advocacy tool: How frequently was the tool used as advocacy tool?
5Utility of the tool as monitoring tool: How useful was the tool as monitoring tool?
6Utility of the tool as advocacy tool: How useful was the tool as advocacy tool?
7Stock level information requirement update: How difficult it is to provide the information required?
8 Frequency of stock level update requirement: Is the frequency adequate?
PILOT PHASE
Feedback survey result / CommentsScore Comments
4 84% Very appropriate – 5% Extremely appropriate
3.9 68% Very easy – 11% Extremely appropriate
Frequency not assessed in the feedback survey; but slides extracted from ViVa used during monthly CCIA meetings in DRC and Niger
4.2 68% Very useful – 26% Extremely useful
4.3 53% Very useful - 37% Extremely useful
Not assessed in the feedback survey; but weekly stock level were provided at 85%.

The Supply Chain Ends Here

Session Topics
• Background and problem statement
• GAVI Alliance immunisation supply chain strategy
• UNICEF supply chain strengthening with governments
• Current activities in Zambia, Nigeria, DRC
• ViVa visibility for vaccines
• Discussion