Immigrant Physical Activity Study - VicHealth
70
Immigrant Physical Activity Study A Report to The Victorian Health Promotion Foundation W R Payne J T Harvey S C Dharmage February 2011
Transcript of Immigrant Physical Activity Study - VicHealth
Immigrant Physical Activity Study
A Report to The Victorian Health Promotion Foundation
W R Payne J T Harvey
S C Dharmage
February 2011

Immigrant Physical Activity Study
A Report to The Victorian Health Promotion Foundation
W R Payne J T Harvey
S C Dharmage
February 2011
CONTACT
Dr Jack Harvey School of Human Movement and Sport Sciences
University of Ballarat PO Box 663 Ballarat Victoria 3353
Phone: 03 5327 9065 Email: [email protected]

Immigrant Physical Activity Study 2010: Report to the Victorian Health Promotion Foundation
ii
ACKNOWLEDGEMENTS The authors acknowledge the organisational assistance of Dr Jayantha Dassanayake, whose previous study led to the development of this project, and who initiated the contact with many organisations and individuals within the three immigrant communities. We thank Jill Boatman for her invaluable administrative contribution throughout the project. We acknowledge the support and assistance provided by the following organisations, representatives and individuals. Association of Indian Origin Tamils of Sri Lanka (AIOTS) Siva Sivagnanam Association of Italian Senior Citizens' Clubs in Victoria Dr Francesco Pascalis Australia Ceylon Fellowship Inc Rohan Pragnasekera Australian Druze Community of Victoria (Druze Women’s Group)
Sonia Daou
Australian Electoral Commission Staff Burgher Association (Australia) Doyne Caspersz Centre of Italian Studies Staff Ceylonese Welfare Organisation Inc Bevil Jansz Co.As.It - Melbourne Italian Assistance Association Dr Walter Petrali Sinhala Cultural & Community Services Foundation Inc Dr Olga Mendis Sri Lankan German Technical Training Institute Old Boys Association of Australia
Sanny Joseph Appansu
Sri Lankan Youth Sports Association Roshanara Perera Tamil Culture Dance School Shyaunoda Sivagnanam Tamil Friendship society Siva Sivagnanam Temple & Trinity College Old Boys Siva Sivagnanam Victorian Arabic Social Services Iman Allaf Victorian Lebanese Community Council Inc Carol Makhoul Victorian Multicultural Commission Gianfranco Spinoso Suresh Anthonypillai Dr Ahmed Bani-Mustafa Dr Singarayer Florentine Suhinthan Maheswararajah Carla Woodruff
We also thank the members of the Italian-born, Lebanese-born, Sri Lankan-born and Australian-born communities who participated in the study.

Immigrant Physical Activity Study 2010: Report to the Victorian Health Promotion Foundation
iii
CONTENTS ACKNOWLEDGEMENTS........................................................................ ii LIST OF TABLES ................................................................................... iv
THE AUTHORS ...................................................................................... vi EXECUTIVE SUMMARY ....................................................................... vii
1 INTRODUCTION .............................................................................. 1
1.1 Background to the study ....................................................................... 1 1.2 Objectives of the study ......................................................................... 3 1.3 Scope of this report ............................................................................... 3
2 METHODOLOGY ............................................................................. 5
2.1 Study design .......................................................................................... 5 2.2 Sample size and statistical power ........................................................ 5 2.3 Study sample and recruitment ............................................................. 5 2.4 Data collected ........................................................................................ 7 2.5 Limitations and biases .......................................................................... 7 2.6 Statistical analysis ................................................................................. 8 2.7 Ethics ...................................................................................................... 8
3 RESULTS ......................................................................................... 9
3.1 Introduction ............................................................................................ 9 3.2 Participant characteristics .................................................................. 10 3.3 Participation in sport and physical activity ....................................... 15 3.4 Factors that might influence participation in sport and PA ............. 17 3.5 Health and wellbeing ........................................................................... 24 3.6 Level of physical activity ..................................................................... 26 3.7 Relationship between level of physical activity and health and
wellbeing .............................................................................................. 30 4 DISCUSSION ................................................................................. 32
5 CONCLUSION AND RECOMMENDATIONS ................................ 37
REFERENCES ...................................................................................... 38
ATTACHMENTS .................................................................................... 41
Attachment 1. Survey form

Immigrant Physical Activity Study 2010: Report to the Victorian Health Promotion Foundation
iv
LIST OF TABLES Table 1. Summary of distribution and return of survey forms ........................................... 9
Table 2. Summary of age distributions: by country of birth ............................................... 9
Table 3. Summary sample sizes: by country of birth ...................................................... 10
Table 4. Age: by country of birth ..................................................................................... 10
Table 5. Gender: by country of birth ................................................................................ 11
Table 6. Years since immigration: by country of birth ..................................................... 11
Table 7. Age at immigration: by country of birth .............................................................. 11
Table 8. Languages other than English spoken at home: by country of birth ................. 12
Table 9. Religion: by country of birth ............................................................................... 12
Table 10. BMI category: by country of birth ...................................................................... 12
Table 11. Dieting: by country of birth ................................................................................ 13
Table 12. Smoking: by country of birth .............................................................................. 13
Table 13. Living arrangements: by country of birth ........................................................... 13
Table 14. Highest education level: by country of birth ...................................................... 14
Table 15. Current or former paid occupation: by country of birth ...................................... 14
Table 16. Employment status: by country of birth ............................................................. 14
Table 17. Types of group memberships: by country of birth ............................................. 15
Table 18. Membership of sports clubs and fitness centres: by country of birth ................ 15
Table 19. Sports played during past year: by country of birth ........................................... 16
Table 20. Types of PA participated in during past year: by country of birth ...................... 16
Table 21. Influence of environmental factors: by country of birth ...................................... 17
Table 22. Types of transport used: by country of birth ...................................................... 17
Table 23. Type of transport used most often: by country of birth ...................................... 18
Table 24. Easy access to facilities: by country of birth ...................................................... 18
Table 25. Affordability of facilities: by country of birth ....................................................... 19
Table 26. Influences on participation in a fitness centre or sports club: by country of birth ................................................................................................................... 19
Table 27. Self-perceptions regarding sport and PA: by country of birth ............................ 20
Table 28. Knowledge about health benefits of PA: by country of birth .............................. 20
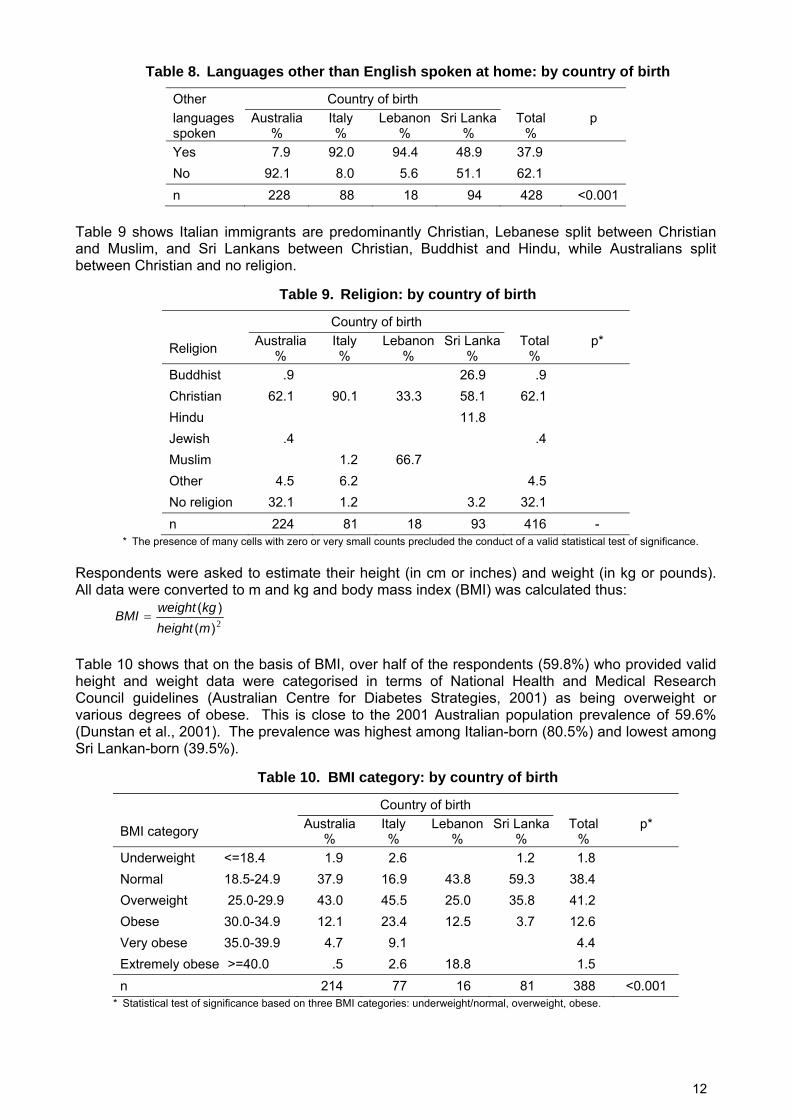
Table 29. Opinions regarding promotion of PA: by country of birth .................................. 21
Table 30. Attitudes to exercise: by country of birth ........................................................... 21
Table 31. Barriers to participation in sport and PA: by country of birth ............................. 22
Table 32. Support and encouragement from household members: by country of birth .... 23
Table 33. Support and encouragement from friends: by country of birth .......................... 23
Table 34. Self efficacy: by country of birth ........................................................................ 24
Table 35. Disability and disease: by country of birth ......................................................... 25
Table 36. Summary of SF-12 Physical and Mental Component Scores: by country of birth ................................................................................................................... 25

Immigrant Physical Activity Study 2010: Report to the Victorian Health Promotion Foundation
v
Table 37. Self-assessed PA level: by country of birth ....................................................... 26
Table 38. Self-assessed PA level prior to emigration: by country of birth ......................... 26
Table 39. Summary of energy expenditure (MET-minutes/week): by country of birth ...... 27
Table 40. IPAQ PA category: by country of birth .............................................................. 29
Table 41. IPAQ PA category by self-assessed PA category ............................................. 29
Table 42. Satisfaction with PA level: by country of birth ................................................... 29
Table 43. Satisfaction with PA level by IPAQ PA category ............................................... 30
Table 44. Satisfaction with PA level by self-assessed PA category .................................. 30
Table 45. Correlations between IPAQ scales and SF-12 scales ...................................... 31
Table 46. Results of ANOVAs of SF-12 scales by PA category and country of birth ........ 31

Immigrant Physical Activity Study 2010: Report to the Victorian Health Promotion Foundation
vi
THE AUTHORS Professor Warren Payne is Pro-Vice Chancellor (Research and Research Training) at Victoria University and Adjunct Professor of Human Movement Science at the University of Ballarat. He is an exercise physiologist with over 20 years of research and consulting experience. He has conducted research into the physical activity patterns of adults and children and has extensive experience in working with community groups responsible for health promotion including Primary Care Partnerships and Regional Sports Assemblies. Dr Jack Harvey is a Senior Research Fellow in the School of Human Movement and Sport Sciences at the University of Ballarat. He is a statistician with 25 years experience in collaborative research and consultancy across the spectrum of the social, physical, health and environmental sciences and engineering, with particular expertise in the design, management and analysis of sample surveys. He has extensive experience in community consultations, and in the design and evaluation of health promotion interventions. Associate Professor Shyamali Dharmage is a clinical epidemiologist with a strong track record in conducting population based research, and analysing complex data sets. She is currently based in the Centre for MEGA Epidemiology at the University of Melbourne and leads a large externally funded research program on Allergies and Chronic Respiratory Diseases while collaborating with multiple institutions over other chronic diseases including cardiovascular disease and diabetes.
Immigrant Physical Activity Study 2010: Report to the Victorian Health Promotion Foundation
vii
EXECUTIVE SUMMARY Introduction High levels of physical inactivity in adult Victorians contribute to diseases such as cardiovascular disease. Both physical inactivity and cardiovascular disease are particularly prevalent in first generation immigrants; especially immigrants from Southern Europe, the Middle East and South Asia. Among the largest foreign-born communities from each of these three zones, which thereby represent the largest population attributable risk in Victoria, are those born in Italy, Lebanon and Sri Lanka, respectively. Small groups of migrants from these countries have reported many factors that cause high physical inactivity levels. This study set out to determine whether these factors are present across these migrant communities. Members of these communities are keen to improve their physical activity levels. Therefore, the knowledge gained from this study will increase the likely success of future programs by ensuring they meet the needs of the participants. The objectives of the Immigrant Physical Activity Study were: 1. to identify and quantify the effects of barriers and facilitators to participation in sport and physical activity (PA) by adult first generation members of the Victorian Italian, Lebanese and Sri Lankan migrant communities and Australian born counterparts, as well as to investigate whether these factors vary across these groups; and 2. to quantify the relationships between sport and PA participation and the mental and physical health status of adult first generation members of the Victorian Italian, Lebanese and Sri Lankan migrant communities and Australian born counterparts, as well as to investigate whether these factors vary across these groups, with allowance for the effects of socio-demographic characteristics of individuals and access to and characteristics of sport and PA facilities and organisations. This report represents an initial broad review of the data collected in the study. It identifies barriers and facilitators to participation in sport and PA by adult first generation members of the Victorian Italian, Lebanese and Sri Lankan migrant communities and Australian born counterparts, and shows how these factors vary across the groups. It also quantifies PA participation and the mental and physical health status of adult first generation members of the Victorian Italian, Lebanese and Sri Lankan migrant communities and Australian born counterparts, shows how these measures vary across the groups, and describes relationships between the measures. The results presented in this report will provide a general knowledge base which can immediately inform policy development to facilitate the promotion of physical activity in migrant groups at risk of physical inactivity and cardiovascular disease. Results of the second phase of analysis, involving multivariate analyses of more complex relationships and adjustment for socio-demographic characteristics and other confounders, will further inform policy development and will be submitted in the coming months for publication in leading peer-reviewed scientific journals. Copies of all publications will be made available to VicHealth in due course as supplements to this report. Methodology The study employed a cross-sectional survey of three migrant communities (Italian, Sri Lankan, Lebanese) and the Australian-born community, conducted within the Melbourne metropolitan area of Victoria. Adult (18 years of age and over) first-generation migrants were identified from the contact lists of community organisations within the three migrant communities who agreed to mail a questionnaire to selected persons on their contact lists on behalf of the research team, in order to protect the privacy of participants. In each of the immigrant communities, 600 survey packages were distributed. An Australian-born reference sample was recruited by direct mail to a random sample of 2400 names from the Electoral Roll in electoral divisions within the Melbourne metropolitan area. Completed forms were received from 548 persons (325 Australian-born; 91

Immigrant Physical Activity Study 2010: Report to the Victorian Health Promotion Foundation
viii
Italian-born, 20 Lebanese-born, 99 Sri Lankan-born). In order to match the Australian-born reference sample to the age profile of the foreign-born respondents, the comparative analyses reported herein are based on data from the 432 respondents aged 40 years or more (229 Australian-born; 90 Italian-born, 18 Lebanese-born, 95 Sri Lankan-born). Summary of key findings Migration Most immigrant respondents reported that they had migrated to Australia many years ago, and had a wide range of educational experience. The most long standing group of migrants was the Italians who generally migrated to Australia between 1950 and 1970. This group also reported the lowest level of formal education. The low level of education experienced by the Italian group was also reflected in the type of occupations undertaken, with low skilled occupations being most commonly reported. Although each of the migrant groups reported living in Australia for long periods of time, all three migrant groups reported they commonly spoke a language other than English at home. Notwithstanding the continuing use of native languages, it is likely that acculturation over time to the Australian lifestyle had a significant effect on the health of these migrant groups. The four groups (three migrant groups and the Australian control) reported a range of religious beliefs, with the most common religions reported being Christianity and Buddhism. Risks of disease The risks of cardiovascular disease and associated diseases can be categorized as either behavioural or biomedical risks. Behavioural risks include factors such as smoking and physical inactivity. Biomedical risks include obesity, hypertension and hypercholesterolemia and may be related to behavioural and environmental risks, as well as genetic factors. Behavioural risks The two key behavioural risks examined in the current study were smoking and physical inactivity. The smoking rates reported by the respondents were generally lower than those generally reported by Victorian adults. This finding may also indicate the possibility that the survey respondents were a self-selected sample more ‘health conscious’ than the overall population. Nevertheless, the prevalence of smoking was higher in the migrant groups than the Australian-born reference group. The high number of respondents who reported having given up smoking is also reflective of the overall decrease in adult smokers within the Victorian population over the past decade. Physical activity (and physical inactivity) was assessed using two measures: a simple self assessment scale and the more detailed but complex International Physical Activity Questionnaire (IPAQ). The IPAQ was used to record physical activity (PA) in a range of settings including recreational, occupational, domestic and as a form of transport. No difference was found between the overall levels of physical activity reported by the migrants from different countries and the Australian-born reference group, but the Australian-born group reported significantly higher levels of vigorous recreational PA. In terms of IPAQ categories of PA level, respondents were classified as: low 8.8%; moderate 35.8%; and high 55.4%. Given that the IPAQ ‘high’ category is roughly equivalent to 12,500 steps per day, it is apparent that our sample was, on average, undertaking at least sufficient PA to achieve a health benefit. This finding was in keeping with the findings of the 2006 Victorian Population Health Survey, where 64.1% of the adult population self reported that were undertaking adequate physical activity to achieve a health benefit. Biomedical risks The biomedical markers assessed in the survey included obesity, hypertension and hypercholesterolemia. The level of overweight and obesity reported of 59.8% across all groups was close to the overall 2001 Australian prevalence of overweight and obesity of 59.6%. The level of overweight and obesity reported in the Italian group was higher than for the other migrant groups and the Australian-born reference sample, and the prevalence of hypertension was significantly greater in Italian- and Sri Lankan-born cohorts than in the Australian-born cohort. Although the self reported level of overweight and obesity in our study sample was similar to the national average,

Immigrant Physical Activity Study 2010: Report to the Victorian Health Promotion Foundation
ix
the level of hypertension reported was substantially higher than the national average of 10.3% for those aged 45-54 and 23.6% for those aged 55-64 reported by the Australian Institute of Health and Welfare in 2010. Likewise the proportion of respondents reporting high cholesterol levels (average of 37.6%) was substantially higher than the national prevalence of 15% in the 55-64 year age group. Overall, therefore, it was apparent that our sample of migrants from Italy, Lebanon and Sri Lanka, together with our Australian-born reference sample, reported similar levels of overweight and obesity and these were similar to the national average. However, the reported levels of hypertension and hypercholesterolemia were substantially higher than the national sample and there were significantly higher levels of hypertension in the migrant sample than the Australian reference sample. Disease Behavioural and biomedical risks factors are often manifested in diabetes, heart attack and stroke. The overall prevalence of the respondents, aged 40 years and over, who reported having been diagnosed with diabetes was 14.3% and the Australian-born reference population reported a prevalence of 6.4%. These data are in keeping with the data presented in the 2001 AusDiab report where 6.2% and 13.1% of their nation-wide sample aged between 45-54 and 55-64 years, respectively indicated they had been diagnosed with diabetes. Of considerable interest, however was the approximately four-fold difference in the diabetes prevalence between the migrant groups and the Australian sample. Coronary heart disease (CHD) which includes angina and heart attack is the leading specific disease burden (9%) in Australia. The national prevalence of CHD was 4.4% for males and 2.3% for females. The prevalences of angina and heart attack in the study sample were quite variable, ranging from 2.3% (angina) and 3.7% (heart attack) for the Australian-born cohort to 17.6% (angina) and 10.0% (heart attack) for the Italian cohort. Perceived health and wellbeing Ultimately, risk of disease and presence of disease affect one’s perception of health. Health was measured in the current study using the SF-12 health questionnaire. The two composite scores derived from the questionnaire responses were the Physical Component Score (PCS) and the Mental Component Score (MCS); measures of perceived physical and mental health, respectively. There was a significant difference in the physical health scores with the PCS for the Italian cohort being the lowest of the four groups, with a mean value 8 points below the population norm of 50. In a review of research studies which utilised the SF-12, it has been reported that conditions which produced “moderate to large” decrements of 5 to 10 points in PCS included hip fracture, low back pain, mild asthma and allergic rhinitis; it is apparent from this that the deficit in PCS for the Italian group was of a clinically relevant magnitude. These data indirectly support the higher prevalence of CHD and diabetes in the Italian cohort in comparison to the Australian-born reference group. There were no differences between the groups for MCS and all groups scored close to the standardized mean score of 50.0. Barriers and facilitators This study also sought to identify the barriers and facilitators to participation in sport and physical activity (PA), as well as to investigate whether these factors vary across these groups. Generally the migrant groups reported a greater prevalence of barriers to participation in physical activity. These are outlined in terms of five elements of the socio-ecological model: intrapersonal, interpersonal, environmental, institutional and public policy. Intrapersonal barriers and facilitators There was a significant difference in the knowledge relating to physical activity and health of the groups. In particular, the Italian respondents displayed the lowest level of knowledge of all the groups. This low level of knowledge by the Italians was in keeping with the low response to questions designed to determine attitude towards physical activity. A telling response from the Italian group was to the statement, “I can’t see why I should bother exercising” where 40% of respondents agreed with the statement. Further, 52.2% of the Italian cohort agreed with the statement, “I think exercising is a waste of time”. The lower level of knowledge and poor attitude
Immigrant Physical Activity Study 2010: Report to the Victorian Health Promotion Foundation
x
towards physical activity by the Italian group was further reflected in their generally poor levels of self efficacy and self perception. However, it should be noted that in general the migrant groups responded less positively to questions of self efficacy than the Australian-born reference group. A final and very important barrier to participation in physical activity was difficulty with language, which particularly related to the Italian and Lebanese groups. Interpersonal barriers and facilitators The key interpersonal barriers included conflict with cultural expectations or beliefs, conflict with religious rules, beliefs or expectations and conflict about clothes that should be worn. Each of these three barriers was significantly more prevalent in the migrant groups than the Australian-born reference group. In particular, the Italian and Lebanese immigrants agreed with the statements up to 20 times more often than the reference group. These results are in agreement with those which have focused upon cultural limitations associated with the Muslim religion, but in this case they extend to groups where either Christian or Buddhist religions predominate. The interpersonal element often focuses upon the influence of family and friends upon participation in PA. In this study these matters were explored in a number of ways. There was general agreement in all groups that they received support from members of their household and from friends to participate in PA. However there was a key difference between the groups when it came to their perception as to whether family friendly PA facilities were available. The migrant groups reported a lack of family friendly facilities twice as often as the Australian-born reference group. Environmental barriers and facilitators Access to PA facilities is one of the strongest environmental predictors of PA participation, and in the current study between 37% and 72% of respondents indicated that distance to a park, playground or walking/running/cycling tracks influenced their participation in PA. However, there was little difference between the migrant groups and the Australian-born reference population in this regard. Affordability of facilities was significantly more likely to be a barrier for Italian-born respondents than for the other groups. Perceptions of security while participating in PA is often thought to be a factor affecting PA participation. In the current study a high proportion of respondents (up to 79.4%) reported a fear of crime was an important determinant of their PA behavior and importantly there was a significant difference between the responses of the migrant groups and the Australian-born reference group; with fear of crime being reported up to twice as often in the migrant groups. Other areas in which the migrant groups indicated that the environment was more important than the reference group included: adequacy of street lighting, air quality, cleanliness, fear of dogs, presence of other people around, fear of traffic and type of terrain. In general, these results reflect the greater importance of environment to the migrant groups than for the reference population, and this was particularly the case for the Italian migrants. Institutional barriers and facilitators As discussed with regard to interpersonal factors above, there was a key difference between the groups when it came to their perception as to whether family friendly PA facilities were available. The preference of migrant groups to undertake PA as a family group needs to be recognized by those responsible for facility planning and management. All groups reported a strong preference for friendly and smoke free facilities. However, a much lower proportion of the respondents indicated strong influence of Sunsmart practices or the responsible serving of alcohol. Public policy barriers and facilitators As discussed under institutional factors above, all groups reported a strong preference for friendly and smoke free facilities, but were much less influenced by policies regarding Sunsmart practices and the responsible serving of alcohol. There was modest to strong support for government to subsidize the cost of PA participation, and this was greatest in the migrant groups. However, there was only modest support in all groups for media PA promotion campaigns to be tailored to reflect the interests of particular ethnic groups.

Immigrant Physical Activity Study 2010: Report to the Victorian Health Promotion Foundation
xi
Conclusion and recommendations This report has identified a large range of barriers and facilitators to participation in PA by the selected migrant groups in comparison to the Australian-born reference group. In general, most of these barriers and facilitators were similar for all of the migrant groups, although some differences were observed between the migrant groups. The report also explored the level of PA, physical health and mental health of the groups. No significant differences were found between the overall level of PA undertaken by the various groups and the level of PA reported was similar to that observed in other studies. The mental health status was also similar in all groups. In contrast, physical health was substantially and clinically lower in the Italian group when compared to the other migrant groups and the Australian-born reference sample. A significant relationship was observed between the physical health and the extent of vigorous leisure activities in particular, which in turn was shown to be significantly lower among the migrant groups than the Australian born cohort. Many significant and substantive differences were found in this study between the three migrant groups and the Australian-born reference sample, ranging across all dimensions of the socio-ecological model. These findings will provide guidance to practitioners developing interventions within particular migrant communities. The findings reinforce the importance of using a broad range of strategies which take account of all elements of the socio-ecological model. Other less pronounced but nevertheless important potential differences and relationships were indicated in the results of the study, but were not found to be statistically significant in light of sample size shortfalls, particularly in the Lebanese community. It is recommended that: • pilot intervention programs to promote participation in physical activity based on the key
findings of this study should be developed and implemented in the Italian and Sri Lankan communities; and
• this study should be supplemented by a follow-up study employing different recruitment strategies to enable larger representative samples to be obtained, especially in the Lebanese community.

Immigrant Physical Activity Study 2010: Report to the Victorian Health Promotion Foundation
xii
This page has been intentionally left blank.

1
1 Introduction High levels of physical inactivity in adult Victorians contribute to diseases such as cardiovascular disease. Both physical inactivity and cardiovascular disease are particularly prevalent in first generation immigrants; especially immigrants from Southern Europe, the Middle East and South Asia. Among the largest foreign-born communities from each of these three zones, which thereby represent the largest population attributable risk in Victoria, are those born in Italy, Lebanon and Sri Lanka, respectively. Small groups of migrants from these countries have reported many factors that cause high physical inactivity levels. This study set out to determine whether these factors are present across these migrant communities. Members of these communities are keen to improve their physical activity levels. Therefore, the knowledge gained from this study will increase the likely success of future programs by ensuring they meet the needs of the participants.
1.1 Background to the study Migration, Health and Acculturation Immigrants from different cultural backgrounds appear to demonstrate good, if not better health on arrival to Australia compared to the Australian-born population; this is known as the ‘healthy migrant effect’ (Australian Institute of Health and Welfare, 2004). The healthy migrant effect is, however, mitigated by a range of factors that result in the development of poor health and disease. These include such factors as sub-group of origin, as well as an individual’s health conditions, birthplace, age, socioeconomic status, fluency in English and satisfaction with their job and life in Australia (Kliewer, 1997). Immigrants also bring pre-existing risk factors such as poor diet, socio-cultural disposition and gene–environment interactions, all of which influence the prevalence of disease (Reddy, 2002, Murray and Lopez, 1997). Further complicating the healthy migrant effect is the increasing prevalence of risk factors for a number of diseases in some of the source migrant populations. For example, the prevalence of cardiovascular disease (CVD) risk factors in India has increased rapidly in recent decades, predominantly among the urban population (Gupita, 1997). Furthermore, the sedentary and stressful lifestyle often encountered by migrants in their new homeland act to increase CVD risk factors such as obesity, hypertension, diabetes mellitus and hyperlipidemia (Rissam et al., 2001). It is apparent that immigrants bring personal and socio-demographic characteristics such as age, sex, education, and genetic composition to their new environment. These variables are associated with biomedical conditions and particular health outcomes. Both biomedical conditions and health outcomes may be affected by behaviour or lifestyle factors; for example, sudden and rapid dietary changes from ‘high fibre, low fat’ diets to ‘low fibre, high fat’ diets may impact negatively upon cardiovascular health (Ramachandran et al., 1999). In addition, migrant acculturation from a non-Western to a Western lifestyle may involve increased tobacco smoking and alcohol consumption, both of which are associated with increased CVD risk (Feskens et al., 1999). Moreover, migration is inevitably associated with increased levels of stress as the individual attempts to adapt to the new environment. This stress is the outcome of a variety of social, economic and cultural factors and psychosocial strains. The immigration process typically involves a lack of, or reduction in, social support mechanisms (family, friends, peer groups, community), and this may negatively affect the coping ability of the migrant in difficult situations. In addition, the economic consequences that often come with migration, such as poverty, long-term unemployment, and ongoing high workloads, are predictors of poor health outcomes (World Health Organization [WHO], 2003). Psychosocial factors (such as social isolation) are also linked to lifestyle risk factors, such as poor diet, increased incidence of tobacco smoking and alcohol consumption, and decreased rates of physical activity (PA). Immigrants, especially those migrating from more physically active non-Western environments to less physically active Western industrial societies, have an increased exposure to CVD risk factors in the adopted environment than in their country of origin. The decrease levels of PA may be due to a reduction in some or all of active transport, incidental PA and occupational activity as well as an increase in sedentary recreational behaviour (Syed et al., 2004).

2
Cardiovascular Disease, Physical Activity and Migration Cardiovascular disease (CVD) is one of the leading causes of death in Australia (Australian Institute of Health and Welfare, 2010). Unfortunately, the contribution of immigrants to the the 16.5% of Australians who suffer rom CVD is unknown. Similarly, it is not known what proportion of the 33.3% of males and 36.5% of females who die from CVD are immigrants. Although Australia is home to more than 200 ethnic groups, only a small number of studies have been conducted to investigate the association between CVD risk factors among immigrants. Those studies reported that immigrant groups were at risk of: high blood pressure - Italian (Ireland et al., 1983); high cholesterol and triglyceride levels - Chinese (Hsu-Hage and Wahlqvist, 1993); smoking and poor diet - Greek (Wilson, et al., 1993); and smoking - Vietnamese (Rissel and Russel, 1993). More broadly, Bennet, (1993) reported that the majority of immigrants living in Australia experienced an increase in systolic blood pressure, and that Asian immigrants experienced an increase in body mass index. In addition to these specific studies, a recent review published by the Australian Institute of Health and Welfare examined the relationship between excessive weight, obesity, CVD occurrence and mortality, and the association between CVD and biomedical risk factors in the Australian population. An important finding of this review was that most of the studies failed to consider the role of PA and physical fitness as mediating factors in the development of CVD or its risk factors. One key recommendation of this review was that further research needs to be carried out among migrant groups into the specific risk factors of blood pressure, blood cholesterol, Type 2 diabetes, CVD, and levels of PA to reduce the negative health consequences of excessive weight and obesity (Australian Institute of Health and Welfare and National Heart Foundation of Australia, 2004). The report on Physical Activity and Building Strong Communities by the New South Wales Centre for Physical Activity and Health has suggested that culturally and linguistically diverse (CALD) individuals have been overlooked for physical activity programs in the recent past (Chau, 2007). The participation in leisure-time physical activity among immigrant adult subgroups is less frequent compared to the rest of the population. The United States Department of Health and Human Services (USDHHS) (1999) suggested that immigrants who were physically active associated positively with the acculturation process, while the less well-acculturated immigrants were more likely to remain sedentary. Still, very little is known about the factors affecting participation in PA among immigrant sub-groups (Belza et al., 2004). Importantly, Napolitano and Marcus (2000) concluded that in order to encourage migrant sub-groups to become more active, it is necessary to understand the specific barriers which exist to participation in exercise or PA. Recent studies conducted by the research team Given this background, we have recently completed a series of studies to explore the determinants and risk factors of health in first generation adult migrants to Victoria (Dassanayake, 2009; Dassanayake et al., 2010; Dassanayake et al., in press). In the first two studies, the team explored the effect of migration on cardiovascular disease (heart attack and stroke) prevalence and levels of physical inactivity using data from the Victorian Admitted Episode Data Set (VAED) and the National Health Survey (NHS) Data Set. In these two studies we demonstrated that: • The acculturation of first generation migrants into Victoria often results in their cardiovascular
health status changing from one that is better than the Australian-born population (the healthy migrant effect) to one which is worse than the Australian born population.
• The majority of first generation immigrants from the various regions of the world to Victoria are at a high risk of physical inactivity compared to the Australian born population.
• The three regions of the world from which migrants to Victoria have the greatest risk of cardiovascular disease (risk ratio) and physical inactivity in comparison to the Australian born population are Southern and Eastern Europe, the Middle East and Southern Asian regions.
• The country from each of these three regions that has the highest burden of cardiovascular disease is Italy (Southern and Eastern European region), Lebanon (Middle Eastern region) and Sri Lanka (Southern Asian region).
The published international literature confirms that migrants from Italy, Lebanon and Sri Lanka to countries such as Australia, Canada and Sweden have a high risk of physical inactivity (Bennett, 1995; Lindstrom and Sundquist, 2001; Tremblay et al., 2006).

3
The final study in this series involved undertaking a number of in-depth community-level focus group interviews to identify and explore the barriers and facilitators to participation in sport and PA by the adult first generation migrants in these three high risk Victorian communities (Italian, Lebanese and Sri Lankan). These interviews were based on the socio-ecological model (McLeroy et al., 1988) and explored the intrapersonal, interpersonal, organisational and community factors affecting participation in sport and PA. This study revealed that the major barriers to participation in sport and PA by the participants included parental sacrifice, poverty, high cost of participation in sport and facility-based non-competitive active recreation, lack of family focused opportunities for sport and PA, and an unwelcoming atmosphere in many sporting clubs and PA facilities. Interviews with a range of key organisational stakeholders, including state government, statutory bodies, local government and migrant advocacy groups, revealed that most public policy related to the promotion of sport and PA was untargeted. Further, there was a severe lack of information that would enable public funded sport and PA programs and facilities to be targeted to the needs of high risk migrant communities. It is critical that this high quality community-based qualitative data is verified using quantitative research methodologies to provide a solid, generalisable foundation upon which to base targeted public health interventions designed to level of PA in these high risk communities.
1.2 Objectives of the study The objectives of the Immigrant Physical Activity Study were: 1. to identify and quantify the effects of barriers and facilitators to participation in sport and physical activity (PA) by adult first generation members of the Victorian Italian, Lebanese and Sri Lankan migrant communities and Australian born counterparts, as well as to investigate whether these factors vary across these groups; and 2. to quantify the relationships between sport and PA participation and the mental and physical health status of adult first generation members of the Victorian Italian, Lebanese and Sri Lankan migrant communities and Australian born counterparts, as well as to investigate whether these factors vary across these groups, with allowance for the effects of socio-demographic characteristics of individuals and access to and characteristics of sport and PA facilities and organisations.
1.3 Scope of this report This report represents an initial broad review of the data collected in the Immigrant Physical Activity Study. It identifies barriers and facilitators to participation in sport and PA by adult first generation members of the Victorian Italian, Lebanese and Sri Lankan migrant communities and Australian born counterparts, and shows how these factors vary across the groups. It also quantifies PA participation and the mental and physical health status of adult first generation members of the Victorian Italian, Lebanese and Sri Lankan migrant communities and Australian born counterparts, shows how these measures vary across the groups, and describes relationships between the measures. The report includes full details of the project methodology, and results from the first data analysis phase. This phase includes initial data preparation (editing, validation and scoping) and initial data analysis. The initial data analysis consists of: • tabular summaries of all survey responses • generation of derived measures of physical activity (IPAQ scales and categories) and health
and wellbeing (SF-36 scales) • breakdowns of all survey responses and derived measures by cohort (country of birth) • significance tests for differences between cohorts • statistical analysis of relationships between measures of physical activity and health and
wellbeing.

4
The results of the initial data analysis presented in this report will provide a general knowledge base which can immediately inform policy development to facilitate the promotion of physical activity in migrant groups at risk of physical inactivity and cardiovascular disease. The results of the initial data analysis will also provide the researchers with a broad knowledge base from which to design and implement more specifically focused in-depth statistical investigations, involving multivariate analyses of more complex relationships and adjustment for socio-demographic characteristics and other confounders. Results of this second phase of analysis will further inform policy development, and will be submitted in the coming months for publication in leading peer-reviewed scientific journals. Copies of all publications will be made available to VicHealth in due course as supplements to this report.

5
2 Methodology 2.1 Study design The study employed a cross-sectional survey of three migrant communities (Italian, Sri Lankan, Lebanese) and the Australian-born community, conducted within the Melbourne metropolitan area of Victoria.
2.2 Sample size and statistical power The target sample sizes were established using two power analyses. Firstly, with respect to the relationship between barriers and facilitators and sufficient PA to incur a health benefit, so long as the prevalence of barriers and facilitators and of sufficient PA in controls both lie within the range 30-70% (which, on the basis of data from the Active Australia Survey (Australian Institute of Health and Welfare, 2003) and prior experience of the researchers, we considered would generally be the case), then at the worst-case extremes of these ranges of prevalence, sample sizes of 300, 606, 912 and 1193 would be sufficient to detect odds ratios of 2.4, 1.8, 1.6 and 1.5 respectively for sufficient PA those for whom the barrier/facilitator is present or absent, with a power of 0.80 and two-tailed tests with α=0.05. Secondly, with respect to the relationship between wellbeing and PA, there is evidence to indicate that a difference of around 2-3 points on the standardised Mental Component Score (MCS) scale (for which the normative SD=10) represents a clinically significant difference in well-being (Lee and Russell, 2002; Australian Bureau of Statistics, 1997). Setting alpha=0.05, power=0.80, SD=10 and a difference of two points between means in the “sufficient PA” and “insufficient PA” cohorts leads to a target sample size of 788 (equal sized groups i.e. prevalence of sufficient PA=50%) or 938 (unequal size groups - prevalence of sufficient PA=30% or 70%). In light of these calculations, the target sample size was set at 300 in each of the four study groups, or a total sample size of 1200. For the relationship between a specific barrier or facilitator and sufficient PA, this would provide power to detect an OR of 1.5 for the combined sample, 1.6 for the three immigrant groups combined, and 2.4 for each of the groups individually. Further, for the relationship between a specific barrier or facilitator and immigrant status, this would provide power to detect an OR of 1.5 for immigrants generally vs Australian-born, 1.8 for a particular immigrant group vs. Australian-born, and 1.6 and 2.4 respectively for the same comparisons within the insufficient PA sub-population (for barriers) or the sufficient PA sub-population (for facilitators). For the relationship between sufficient PA and wellbeing, there would be power to detect a clinically important difference (2 points in mean MCS) for the combined sample and for the three immigrant groups combined.
2.3 Study sample and recruitment Adult (18 years of age and over) first-generation migrants were identified from the contact lists of community organisations within the three migrant communities. The research team had previously established relationships with relevant community organisations, who had agreed to mail a questionnaire to selected persons on their contact lists on behalf of the research team, in order to protect the privacy of participants. With the approval of the Australian Electoral Commission, an Australian-born reference sample was recruited by direct mail to a random sample of names from the Electoral Roll in electoral divisions corresponding to the Melbourne metropolitan area. The target sample size was 300 participants from each of the four groups. On the basis of our previous experience, and considering the endorsement of community organisations, two waves of publicity in their newsletters and other relevant community publications (pre- and during survey period), together with a reminder letter to participants midway through the survey period, a return rate of 50% was assumed for each immigrant community. Hence, the survey form was distributed to approximately 600 members of each immigrant community for self completion and return mail

6
direct to the researchers. The sampling unit was a household, selected on the basis of inclusion on the contact list of an immigrant community organisation. The accompanying instructions requested that in each selected household, one of the eligible household members (18 years of age and over) was randomly selected (using the “next birthday” method) and invited to participate. To compensate for the lack of the motivational effect of a mediating community organisation, the Australian born reference sample was offered the chance to win an incentive prize to the value of $100. Notwithstanding this, it was anticipated that the members of this sample would have a lower response rate of 20%. Combined with the fact that only an estimated 60% of the sample would be Australian-born (Australian Bureau of Statistics, 2007), an overall return rate of 12% was assumed for this sample. Hence a random sample 2500 electors were approached. Members of the electoral roll sample who were born in Italy, Lebanon and Sri Lanka were also invited to participate, and be allocated into the relevant immigrant group. Because of the fact that all returns were anonymous, the researchers have no way of knowing whether or to what extent this occurred. For the immigrant communities, privacy considerations precluded identification by the researchers of which households had responded and which had not. Because of this, to maximise the response rate while minimising the demands on the monitoring and record-keeping capacities of our partner community organisations, a reminder postcard was distributed midway through the survey period to all selected households, regardless of whether or not they had already responded. It was considered that there may also be duplication in the households selected from the contact lists of different community organisations because privacy considerations precluded the researchers setting up a single master list. In the event, the researchers were assured by the community organisations that there was little or no duplication of membership. The Australian-born participants were surveyed anonymously. Again, there was one reminder mail-out to all recipients (with the exception of persons “not known at this address” and a few cases who had contacted the research team to request exclusion) one month after the initial distribution. In the event, the methods of distribution differed in detail within the three migrant communities. In the Sri Lankan community, the distribution proceeded as planned. Twelve community organisations were identified, with an estimated membership totalling around 2000, and little overlap. Group representatives were briefed about the study at a meeting convened for the purpose. An advance package of survey materials was sent to each organisation during the design phase, and in some cases the generic introductory letter was customised in consultation with group representatives. Finally, 600 survey packages were distributed to organisations on a proportional basis, for distribution to approximately one third of their membership. Organisations were requested to randomise by selecting every third recipient from an alphabetical list. In the Lebanese community, only three community organisations were identified, with an estimated membership totalling around 600. Group representatives were briefed about the study at a meeting convened for the purpose. An advance package of survey materials was sent to each organisation during the design phase, and in some cases the generic introductory letter was customised in consultation with group representatives. Finally, 600 survey packages were distributed to organisations on a proportional basis, for distribution to all of their membership. The Italian community is larger, and has been well established for a much longer period, than the other two communities. The age profile is also very different, with a high proportion beyond retirement age. It was decided to distribute survey materials via the Italian Association of Assistance (CO.AS.IT), which is the peak co-ordinating body for 81 Italian Senior Citizens clubs in Victoria. Researchers attended a meeting of club representatives at meeting at CO.AS.IT, explained the study and distributed survey packages, in sets of 10, 20 or 30 according to the size of each club, to representatives of 25 metropolitan clubs. Fifty survey packages remained, which were subsequently distributed to representatives of a further five clubs who were contacted by telephone. Each club representative was asked to distribute the survey packages to a convenience sample of club members. For five out of each set of 10 packages, recipients were requested to pass the package on to a younger Italian-born adult family member or acquaintance. This was to provide representation of all age groups in the sample.

7
2.4 Data collected The survey form included five sections: 1. Characteristics of participants including potential health-related confounders (including self reported height and weight, smoking, personal history of diabetes & cardiovascular disease). 2. Participation in sport and PA; 3. Barriers and facilitators to participation in sport and PA; 4. In the week preceding the survey; and 5. Health related quality of life. The questions regarding barriers and facilitators were based upon the socio-ecological model (McLeroy et al., 1988) and the ecological model (Sallis and Owen, 2002), the information and constructs presented in major reviews such as that by Trost et al. (2002), and the findings of the preceding qualitative study (Dassanayake, 2009). PA in the preceding week was measured using the long form of the International Physical Activity Questionnaire (IPAQ) (Craig et al., 2003). Health-related quality of life was measured using the Physical Component Score (PCS) and Mental Component Score (MCS) summary scores of the SF-12 (Ware et al., 2002). The survey form was pilot tested using a convenience sample of English speakers, principally from the Australian-born and the Sri Lankan immigrant communities, and a number of revisions were made. The survey package consisted of a C4 envelope containing covering letter, information sheet, survey form, return C4 reply-paid envelope. The survey form, information sheet and covering letter were presented in English and also in Italian, Lebanese, Sinhalese or Tamil, as appropriate. The translation was carried out by professional translators recruited from within the migrant communities, and validated by independent back-translation.
2.5 Limitations and biases Our power calculations were based on random sampling from a large population. The Australian-born community and all three migrant communities are sufficiently large (>>10 times the sample size) to make it unnecessary to apply a “finite population correction” to the power calculations. Privacy and confidentiality requirements precluded direct control of selection and recruitment by the research team, and made communication, distribution and follow-up dependent on the commitment and capacity of a wide range of community organisations. Inevitably, the ideal of random selection of households was compromised to varying degrees. We also acknowledge that we have to rely on the recipient to follow the correct protocol for randomly selecting the participant within each household. Consequently, there is potential for both selection bias and response bias in the sample. Nevertheless, we are confident that a broad and reasonably representative cross-section of each immigrant community was contacted. For the immigrant community samples, minimisation of response bias was addressed by the use of strategies (questionnaire design and presentation, translation, distribution and endorsement by community organisations, community-based media campaign, reminder postcards) designed to achieve broad community representation and maximise the response rate. However, the community organisations, while being supportive and enthusiastic about the survey, were unable to motivate their respective communities to the degree anticipated, and the response rates and sample sizes achieved for each of the immigrant groups fell well short of the targets. Our key strategies for the Australian-born reference sample were respondent choice of anonymity or eligibility for incentive prizes, and a reminder mailout. The target response rate was achieved for this cohort. Selection and response bias in all samples was examined by comparing the demographic profiles of respondents to relevant population profiles (Victorian Multicultural Commission, 2007; Australian Bureau of Statistics, 2007). Biases can also occur if data collection instruments are subject to errors which are differentially influenced by exposure or outcome status (presence or absence of barriers/facilitators and level of PA) or by other moderators (e.g. age, community). The potential community bias was addressed by using validated translations of the survey materials. The instruments for measuring PA and
8
mental and physical health status have been widely used and validated in a wide range of adult populations. The questions to be used regarding barriers and facilitators and socio-demographic and health-related confounders have been widely reported in the research literature. With regard to the relationships between sport and PA participation and mental and physical health status (Research question 2), it is acknowledged that a cross-sectional study can determine the presence and strength of a relationship, but it cannot unequivocally establish the presence or direction of causality in the relationship (i.e. does participation in sport and PA make people healthier, or do healthier people participate more in sport and PA).
2.6 Statistical analysis Statistical analysis for this report is focused on comparisons between the four birthplace groups. Methods included: cross-tabulations and associated Pearson chi-square tests of association (for breakdowns by country of birth); McNemar-Bowker chi-square tests (for categorical changes over time); correlation analysis (for for wellbeing vs PA level); measures of ordinal association (for comparison of PA categories based on different criteria); and analysis of variance (for wellbeing vs country of birth and sufficient PA). Except where indicated otherwise, the significance level adopted was p<0.05. Non-significant results are designated NS.
2.7 Ethics The research was approved by the University of Ballarat Human Research Ethics Committee, and registered with the University of Melbourne in accordance with its established procedures.

9
3 Results 3.1 Introduction Table 1 shows that, after exclusion of 13 completed questionnaires from respondents who did not indicate their place of birth, 535 valid responses were received. The target sample size of 300 was achieved for Australian-born, while the Italian-born and Sri Lankan-born samples of just under 100 represented one-third of the target. In spite of distribution to all identified households in the Lebanese community, the Lebanese-born sample of 20 represented only a small fraction of the target.
Table 1. Summary of distribution and return of survey forms Country of
birth Estimated
membership Forms
distributed Uncontactable
or out of Completed
forms Response rate
% scope received Achieved Target Australia NA 2500 101 325 13.0 12 Italy >>600 570 NA 91 16.0 50 Lebanon 600 600 NA 20 3.3 50 Sri Lanka 2000 612 NA 99 16.2 50 Unknown 13 Total 4252 101 548 Table 2 summarises the age distributions of the samples from each community. These were similar in profile to the corresponding components of the Victorian population at the 2006 census (Victorian Multicultural Commission, 2007). While there were differences of around 10 years in the median ages of each of the four groups, the three immigrant groups were rather less spread out than the Australian born group, which had a substantial lower “tail” extending all the way down to 18 years of age.
Table 2. Summary of age distributions: by country of birth
Age (years) Country of birth N Mean Std. Dev. Minimum Maximum Median Australia 324 49.06 16.33 18 90 49.00 Italy 90 72.02 8.64 48 89 72.50 Lebanon 19 56.63 11.67 38 89 56.00 Sri Lanka 99 62.52 13.94 24 89 63.00 Total 532 55.72 17.20 18 90 56.00
From the perspective of scientific enquiry, age is a key determinant of many health and PA characteristics, and it is common practice to make adjustments for age differences when investigating other determinants. However from the perspective of public health policy, the fact that there are age differences between the four groups is immaterial – the extent of the overall differences (attributable to all determinants including age) is the primary focus. Notwithstanding this, in the present study the reference group (Australian-born) included a cohort of younger people who were almost totally unrepresented in the three primary target cohorts. In light of this, it was decided to take a position midway between the “pure science” and “pure policy” positions, and exclude this younger cohort. This was effected by excluding all persons younger than 40 years (103 in all: 96 Australian-born, 1 Italian-born, 2 Lebanese-born and 6 Sri Lankan born). Table 3 shows the effect of this exclusion. The other consideration was completion of two crucial sections of the survey form relating to second research objective: “… to quantify the relationships between sport and PA participation and mental and physical health status…”. These are the International Physical Activity Questionnaire (IPAQ) (Craig et al., 2003) and the SF-12 health questionnaire (Ware et al., 2002). In the case of

10
IPAQ, not only must the responses be complete, but to be regarded as valid the reported daily durations of various types of PA must not exceed 16 hours in total. The IPAQ is designed to elicit breakdowns of PA by both settings (employment, active transport, domestic and leisure) and intensity (walking, moderate and vigorous), in terms of both duration per day and days per week. To achieve this level of detail about patterns of PA, the time and cognition demands on respondents are considerable (see Section 3.5 for more details), and it is not surprising that substantial numbers in all four cohorts did not validly complete this section of the survey form. Ideally, all reported results would be based on the same sample of respondents. However, the low completion rates for the IPAQ section of the form would result in much valuable information about respondent characteristics and barriers and facilitators to PA being discarded if this approach were adopted. Consequently, Sections 3.2-3.4 are based on the age-limited sample of 432, Section 3.5 is based on the sub-sample of 408 who completed the SF-12 section of the form, and Sections 3.6 and 3.7 are based on the sub-sample of 204 who completed both the SF-12 and IPAQ sections of the form.
Table 3. Summary sample sizes: by country of birth
Characteristics Australia Italy Lebanon Sri
Lanka TOTAL Total returns 325 91 20 99 535 Age ≥ 40 yrs 229 90 18 95 432 Age ≥ 40 yrs and SF-12 complete 223 78 18 89 408 Age ≥ 40, SF-12 & IPAQ & complete and valid 134 25 6 39 204
3.2 Participant characteristics Tables 4 to 9 summarise the characteristics of the 323 respondents. Refer to Attachment 1 for the survey form; personal characteristics can be found in Section D. The p-values displayed in the final column of each table indicate significant differences between prevalences in the four cohorts. However, the prevalences for Lebanon in particular should be interpreted with caution because of the very small sample size. Furthermore, in some of the larger tables, while the differences between the prevalences in the four cohorts might be quite marked, the presence of many cells with very small counts can make it make it impossible to conduct valid statistical tests of significance without collapsing/combining row categories to the point where the table loses much of its descriptive value. In most cases, no such post-hoc collapsing of categories has been undertaken in this report. Table 4 gives confirmatory detail regarding the differences in age distributions discussed above and summarised in Table 2.
Table 4. Age: by country of birth
Country of birth
Age (yrs) Australia %
Italy %
Lebanon%
Sri Lanka%
Total % p
40-49 30.1 1.1 27.8 18.9 21.5
50-59 34.5 7.8 38.9 23.2 26.6
60-69 17.9 28.9 22.2 22.1 21.3
70-79 12.7 43.3 5.6 22.1 20.8
80-89 4.4 18.9 5.6 13.7 9.5
90-99 .4 .2
n 229 90 18 95 432 <0.001 Median 55 72.5 56.5 64 60

11
Table 5 shows that, as is usual in Australian mail-back surveys, females predominated overall, and in Australian- and Italian-born cohorts. The Sri Lankan-born cohort trended oppositely.
Table 5. Gender: by country of birth
Country of birth
Gender Australia %
Italy %
Lebanon%
Sri Lanka%
Total % p
Male 42.5 37.8 50.0 70.2 47.9
Female 57.5 62.2 50.0 29.8 52.1
n 228 90 18 94 430 <0.001 Table 6 indicates that Italian immigration peaked 50-59 years ago in the 1950s, while Lebanese immigration peaked 20-29 years ago (1980s). Sri Lankan immigration displays two peaks 40-59 years ago (1950s & 1960s) and 20-29 years ago (1980s).
Table 6. Years since immigration: by country of birth
Years Country of birth since immigration
Australia %
Italy %
Lebanon%
Sri Lanka%
Total %
p*
10-19 1.2 5.6 24.5 12.6
20-29 1.2 44.4 31.9 19.7
30-39 2.3 22.2 13.8 9.6
40-49 29.1 22.2 24.5 26.3
50-59 58.1 5.6 4.3 27.8
60-69 7.0 1.1 3.5
70-79 1.2 .5
n 86 18 94 198 - Median 53 31 23 42
* The presence of many cells with zero or very small counts precluded the conduct of a valid statistical test of significance. Table 7 indicates that at the time of immigration, Italian immigrants were mostly aged between 10 and 29, Sri Lankans mostly 10 years older between 20 and 39, and Lebanese predominantly between 20 and 29.
Table 7. Age at immigration: by country of birth
Age (yrs) Country of birth at immigration
Australia %
Italy %
Lebanon%
Sri Lanka%
Total %
p*
10-19 45.3 16.7 5.3 23.7
20-29 41.9 50.0 34.0 38.9
30-39 10.5 22.2 36.2 23.7
40-49 2.3 11.1 13.8 8.6
50-59 3.2 1.5
60-69 7.4 3.5
n 86 18 94 198 - Median 21 25 32 25.5
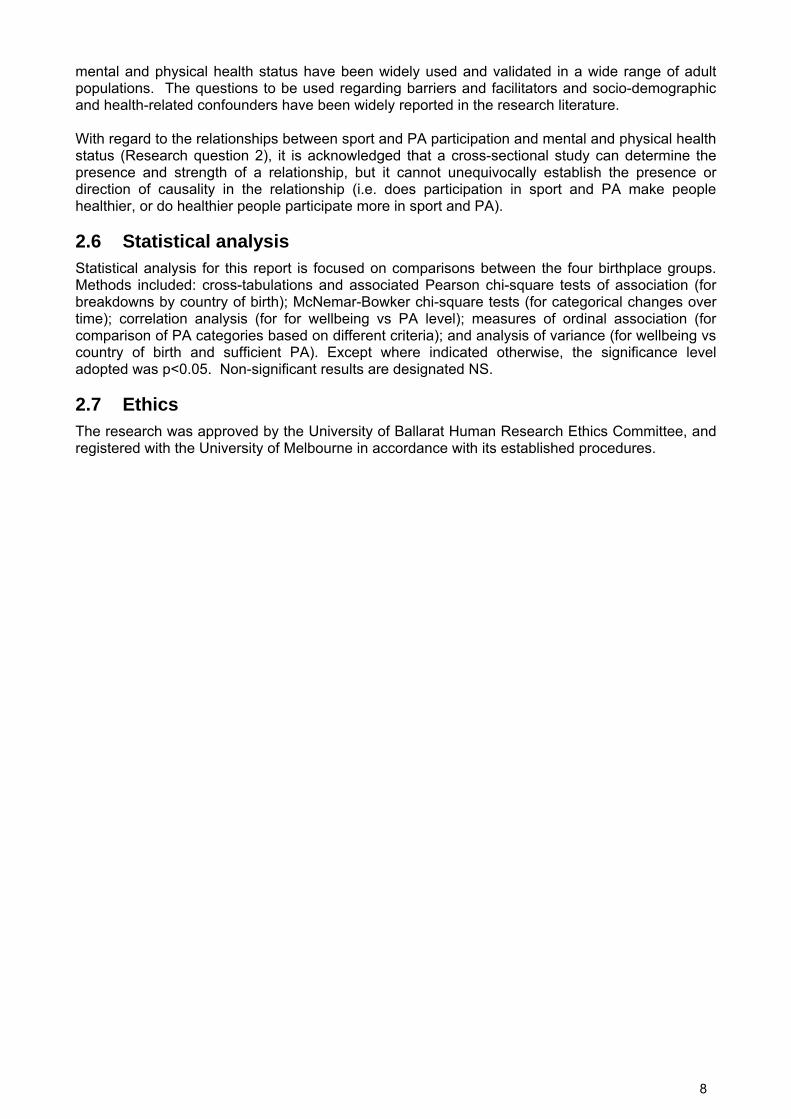
* The presence of many cells with zero or very small counts precluded the conduct of a valid statistical test of significance. Table 8 shows that notwithstanding long periods of residence in Australia, the great majority of Italian and Lebanese immigrants continue to use Languages other than English. The lower prevalence among Sri Lankan immigrants reflects the fact that many Sri Lankans learn the English language in Sri Lanka.
12
Table 8. Languages other than English spoken at home: by country of birth
Other Country of birth languages spoken
Australia %
Italy %
Lebanon%
Sri Lanka%
Total %
p
Yes 7.9 92.0 94.4 48.9 37.9
No 92.1 8.0 5.6 51.1 62.1
n 228 88 18 94 428 <0.001 Table 9 shows Italian immigrants are predominantly Christian, Lebanese split between Christian and Muslim, and Sri Lankans between Christian, Buddhist and Hindu, while Australians split between Christian and no religion.
Table 9. Religion: by country of birth
Country of birth
Religion Australia %
Italy %
Lebanon%
Sri Lanka%
Total %
p*
Buddhist .9 26.9 .9
Christian 62.1 90.1 33.3 58.1 62.1
Hindu 11.8
Jewish .4 .4
Muslim 1.2 66.7
Other 4.5 6.2 4.5
No religion 32.1 1.2 3.2 32.1
n 224 81 18 93 416 - * The presence of many cells with zero or very small counts precluded the conduct of a valid statistical test of significance.
Respondents were asked to estimate their height (in cm or inches) and weight (in kg or pounds). All data were converted to m and kg and body mass index (BMI) was calculated thus:
2)()(
mheightkgweightBMI =
Table 10 shows that on the basis of BMI, over half of the respondents (59.8%) who provided valid height and weight data were categorised in terms of National Health and Medical Research Council guidelines (Australian Centre for Diabetes Strategies, 2001) as being overweight or various degrees of obese. This is close to the 2001 Australian population prevalence of 59.6% (Dunstan et al., 2001). The prevalence was highest among Italian-born (80.5%) and lowest among Sri Lankan-born (39.5%).
Table 10. BMI category: by country of birth
Country of birth
BMI category Australia%
Italy %
Lebanon%
Sri Lanka%
Total %
p*
Underweight <=18.4 1.9 2.6 1.2 1.8 Normal 18.5-24.9 37.9 16.9 43.8 59.3 38.4 Overweight 25.0-29.9 43.0 45.5 25.0 35.8 41.2 Obese 30.0-34.9 12.1 23.4 12.5 3.7 12.6 Very obese 35.0-39.9 4.7 9.1 4.4 Extremely obese >=40.0 .5 2.6 18.8 1.5 n 214 77 16 81 388 <0.001
* Statistical test of significance based on three BMI categories: underweight/normal, overweight, obese.

13
Table 11 reveals no significant differences between dieting patterns in the four cohorts, but Table 12 shows that the smoking patterns were significantly different. The prevalence of smoking was higher among Australian- and Lebanese-born cohorts, a lower proportion of Lebanese-born than the other cohorts had never smoked, and higher proportions of immigrants than Australian-born had given up.
Table 11. Dieting: by country of birth
Country of birth
Are you on a diet? Australia%
Italy %
Lebanon%
Sri Lanka%
Total %
p
No, my weight is fine 45.6 47.1 33.3 56.8 47.9 No, but I need to lose weight 41.2 40.0 55.6 34.7 40.1 Yes 13.2 12.9 11.1 8.4 12.0 n 228 85 18 95 426 NS
Table 12. Smoking: by country of birth
Country of birth
Do you smoke? Australia%
Italy %
Lebanon%
Sri Lanka%
Total %
p
Yes 10.1 1.2 22.2 3.2 7.3 No, gave up smoking 36.8 40.7 44.4 42.1 39.1 No, never smoked 53.1 58.1 33.3 54.7 53.6 n 228 86 18 95 427 0.009
Table 13 shows many subtle differences in the profiles of living arrangements for the four cohorts. The oldest Italian cohort exhibits the highest prevalences of living as a couple without children and of living alone, presumably as a result of the death of a spouse or partner.
Table 13. Living arrangements: by country of birth
Country of birth
Living arrangements Australia%
Italy %
Lebanon%
Sri Lanka %
Total %
p*
Living with parents .9 2.3 5.6 1.2
Living with spouse or partner 40.5 48.8 22.2 29.0 38.9
Living with spouse or partner & children 35.2 20.9 50.0 44.1 34.9
Single parent living with children 4.8 1.2 16.7 4.3 4.5
Living with other members of family 1.8 3.5 2.2 2.1
Shared accommodation .9 .5
Living alone 15.0 22.1 5.6 18.3 16.7
Other .9 1.2 2.2 1.2
n 227 86 18 93 424 0.013 * Statistical test of significance based on four living arrangement categories: spouse/partner, spouse/partner/children, alone, other. For Australian-born respondents, Table 14 shows a very even distribution across the educational spectrum, whereas the three immigrant profiles are narrower and different. Lebanese- and Sri Lankan-born respondents had predominantly completed Year 12, and had similar rates of University education as the Australian-born. By contrast, the great majority of the Italian cohort had relatively little education. These differences are also reflected in the different occupational distributions in Table 15, with low proportions of professionals and managers, and high proportions of machinery operators, drivers and labourers among the Italian-born cohort. The main differences in employment status shown in Table 16 are the higher proportions of retirees among the Italian and Sri Lankan cohorts, consistent with the age distributions shown in Tables 2 and 4.

14
Table 14. Highest education level: by country of birth
Country of birth
Highest education level Australia%
Italy %
Lebanon%
Sri Lanka %
Total %
p*
Did not go to school 10.3 1.1 2.4 Year 10 or below 17.3 57.5 16.7 4.3 22.7 Year 11 or equivalent 10.7 9.2 4.3 8.5 Year 12 or equivalent 11.1 11.5 22.2 24.7 14.7 Trade certificate/apprenticeship or equivalent 8.9 4.6 12.9 8.5 Vocational diploma or equivalent 14.7 2.3 16.7 20.4 13.5 University bachelors degree 19.1 2.3 22.2 19.4 15.8 University postgraduate degree 18.2 2.3 22.2 12.9 13.9 n 225 87 18 93 423 <0.001 * Statistical test of significance based on four education categories: less than year 12, year 12, trade/vocational, university.
Table 15. Current or former paid occupation: by country of birth
Country of birth
Current or former paid occupation Australia%
Italy %
Lebanon%
Sri Lanka %
Total %
p*
Managers 20.6 5.1 23.5 11.8 16.2 Professionals 29.4 8.5 35.3 25.9 25.5 Technicians & trades workers 5.9 6.8 5.9 15.3 8.2 Community & personal service workers 5.9 6.8 7.1 6.0 Clerical & administrative workers 21.1 10.2 11.8 16.5 17.8 Sales workers 7.8 3.4 5.9 4.7 6.3 Machinery operators & drivers 2.0 22.0 11.8 5.9 6.6 Labourers 1.5 20.3 3.5 4.9 Other 5.9 16.9 5.9 9.4 8.5 n 204 59 17 85 365 <0.001
* Statistical test of significance based on three occupational categories: managers/professionals, white-collar, blue-collar/other.
Table 16. Employment status: by country of birth
Country of birth
Employment status Australia%
Italy %
Lebanon%
Sri Lanka%
Total %
n* p**
Full-time paid employment 40.4 6.4 50.0 41.0 36.6 372 <0.001Part-time paid employment 17.5 4.3 14.3 10.0 14.1 368 NSCasual paid employment 5.7 6.1 14.3 5.1 6.0 369 -Seeking employment 3.1 .0 .0 3.9 2.7 364 -Not in the paid labour force 2.6 21.8 7.1 1.3 5.4 373 -Unpaid/volunteer work 7.0 13.7 7.7 7.7 8.1 370 -Home duties/homemaker 14.0 29.6 28.6 7.7 15.5 374 0.003Studying .9 .0 .0 .0 .6 363 -Retired 23.1 79.5 23.1 48.8 39.3 400 <0.001Other 2.2 4.3 .0 2.6 2.5 364 -n 229 78 13 80 400
* Because the employment categories are not mutually exclusive, each category was presented as a separate question. Not all respondents explicitly answered all questions. Consequently, total numbers are not exactly equal for each row and column totals for each country are indicative.
** A dash (-) indicates that the prevalences were too low to enable a valid statistical test of significance to be conducted.

15
Table 17 shows differences between Australian-born and immigrant groups with regard to church group membership, in keeping with the considerable prevalence of no religion in the Australian cohort (Table 9). Differences in professional group membership mirror occupational and employment profiles (Table 15 and 16). While the obvious difference in Immigrant community organisation membership is between Australian-born and immigrant groups, it is also noted that there were differences between the three immigrant cohorts, which may or may not be related to differences in methods of distribution of survey forms in the three immigrant communities.
Table 17. Types of group memberships: by country of birth
Country of birth
Type of group Australia%
Italy %
Lebanon%
Sri Lanka %
Total %
p
Church group 17.3 35.3 26.7 39.1 25.6 <0.001School group 8.2 8.0 6.4 NSProfessional group 20.9 1.5 26.7 13.8 16.2 0.001Immigrant community organisation .9 33.8 20.0 28.7 13.6 <0.001Other community or action group 23.6 14.7 20.0 29.9 23.3 NSn 220 68 15 87 390
3.3 Participation in sport and physical activity Tables 18-20 present the prevalences of various sport and PA participation characteristics among respondents in the four cohorts. Refer to Attachment 1 for the survey form; these characteristics can be found in Section A6. In tables where each row represents the responses to a separate question, the number of respondents is shown in each row. In these cases, the numbers of respondents for each cohort shown at the bottom of each column are indicative only. In some cases, the differences between the prevalences in the four cohorts might be quite marked, the presence of many cells with very small counts makes it impossible to conduct valid statistical tests of significance. Table 18 shows that current sports club membership was significantly higher among the Australian-born cohort than the immigrant cohorts, particularly Lebanese and Sri Lankan. Significantly higher proportions of immigrants had never been members of a sports club or a fitness centre.
Table 18. Membership of sports clubs and fitness centres: by country of birth
Country of birth
Australia
% Italy %
Lebanon%
Sri Lanka%
Total %
n* p
Current member of sports club 23.6 18.9 7.7 6.6 18.9 371 0.008Current member of fitness centre 24.5 33.8 26.7 19.5 25.1 386 NSNever member of sports club 14.5 56.9 46.2 37.3 26.4 383 <0.001Never member of fitness centre 18.0 62.5 66.7 44.0 32.1 375 <0.001n* 229 65 15 77 386
* Each row represents the responses to a separate question. Generally, not all respondents answered all questions. Consequently, total numbers are not exactly equal for each row and column totals for each country are indicative.
Table 19 shows the sports played during the past year. Overall, golf and tennis predominated in this older segment of the population, bocce was clearly predominant in the Italian community, as was cricket in the Sri-Lankan community. While the differences between the four cohorts were quite marked for most sports, in most cases the small numbers of respondents who played the sport rendered statistical tests of significance invalid.

16
Table 19. Sports played during past year: by country of birth
Country of birth
Australia
% Italy %
Lebanon%
Sri Lanka %
Total %
p*
Athletics 4.7 7.1 4.0 4.9 -Australian Rules Football 3.5 3.6 16.7 3.5 -Basketball 3.5 3.6 16.7 3.5 -Bocce 7.1 67.9 17.4 <0.000Bowls 11.8 14.3 9.7 -Cricket 11.8 3.6 40.0 14.6 -Football (Soccer) 4.7 7.1 33.3 12.0 7.6 -Golf 48.2 3.6 16.7 32.0 35.4 0.010Hockey 1.2 .7 -Netball 3.5 4.0 2.8 -Swimming (competitive) 2.4 7.1 .0 8.0 4.2 -Tennis 32.9 7.1 16.7 20.0 25. 0.024Volleyball 1.2 16.7 8.0 2.8 -Other sports 16.5 17.9 66.7 8.0 17.4 -n 225 83 16 91 415
* A dash (-) indicates that the prevalences were too low to enable a valid statistical test of significance to be conducted. Table 20 shows the types of leisure PA other than sport participated in during the past year. Overall, walking clearly predominated in all four cohorts of this older and predominantly female segment of the population. The differences between the four cohorts were quite marked and statistically significant for most types of PA. The patterns of difference were specific to each type of PA. Some of the more specifically favoured activities were: dancing (all immigrant groups), jogging/running (all but Italians), swimming (Australian, Lebanese), and cycling and weights/circuit training (Australian, Sri Lankan). In two cases the small numbers of respondents who participated rendered statistical tests of significance invalid.
Table 20. Types of PA participated in during past year: by country of birth
Country of birth
Australia
% Italy %
Lebanon%
Sri Lanka %
Total %
p*
Aerobics 11.7 11.8 33.3 8.8 11.7 NSCycling 28.6 4.4 8.3 18.8 21.3 <0.000Dancing 15.5 39.7 33.3 25.0 22.7 0.004Jogging / running 20.4 8.8 41.7 28.8 20.8 0.009Karate / martial arts / judo / boxing 3.4 1.5 3.8 3.0 -Stationary exercises (treadmill, cycle) 37.9 19.1 50. 28.8 32.8 0.008Surfing / boogie boarding 9.7 1.5 1.3 6.0 -Swimming 33.0 11.8 41.7 6.3 23.5 <0.001Walking 89.3 82.4 100.0 86.3 87.7 NSWeights / circuit training 29.1 4.4 18.8 21.3 <0.001Other PA 19.4 10.3 16.7 12.5 16.1 0.020n 225 83 16 91 415
* A dash (-) indicates that the prevalences were too low to enable a valid statistical test of significance to be conducted.

17
3.4 Factors that might influence participation in sport and PA Tables 21 to 34 present the prevalences of various factors that might influence sport and PA participation in the four cohorts. Refer to Attachment 1 for the survey form; these factors can be found in Section B. In tables where each row represents the responses to a separate question, the number of respondents is shown in each row. In these cases, the numbers of respondents for each cohort shown at the bottom of each column are indicative only. Table 21 shows the proportions of respondents in each cohort who reported that each of the listed factors had an influence, either positive or negative, on their level of outdoor PA in their neighbourhood. Immigrants were more likely than the Australian-born to be influenced by most of the listed factors, and most markedly by issues of fear and security, and by perceived air quality and cleanliness. The differences were most pronounced for the oldest cohort - Italian immigrants.
Table 21. Influence of environmental factors: by country of birth
Country of birth
Factor Australia %
Italy %
Lebanon %
Sri Lanka %
Total %
n* p
Adequacy of street lighting 40.8 74.3 58.8 60.7 51.9 389 <0.001Air quality 41.0 69.0 64.7 60.2 51.3 388 <0.001Bicycle lanes on roads 37.8 52.5 41.2 41.8 41.2 374 NSCleanliness of the neighbourhood 48.6 70.1 58.8 72.6 58.0 386 <0.001Distance to a park 60.5 72.9 58.8 61.4 62.8 390 NSDistance to a playground 37.7 60.3 41.2 42.7 42.8 374 0.017Distance to a walking/running/cycling track 50.9 54.8 52.9 39.8 49.2 378 NSDistance to shops 57.2 76.7 50.0 60.5 61.2 397 0,021Fear of dogs 22.6 56.7 55.6 53.4 36.8 394 <0.001Fear of crime 37.0 79.4 66.7 58.0 50.4 393 <0.001Presence of other people around 36.0 66.2 50.0 50.6 45.0 382 0.001Quality of footpaths / walking surfaces 60.1 75.8 72.2 74.1 66.4 387 0.027Quality of scenery 65.6 68.8 66.7 62.8 65.6 389 NSFear of traffic 24.9 51.6 55.6 37.6 33.6 384 0.004Type of terrain (e.g. not too hilly) 41.1 60.7 58.8 51.2 47.2 381 0.029
n* 222 73 16 86 397 * Each row represents the responses to a separate question. Generally, not all respondents answered all questions. Consequently, total
numbers are not exactly equal for each row and column totals for each country are indicative.
Table 22. Types of transport used: by country of birth
Country of birth
Type of transport Australia %
Italy %
Lebanon %
Sri Lanka %
Total %
p*
Drive a car 91.7 60.9 100.0 82.8 83.8 <0.001
Passenger in car 35.8 42.5 22.2 11.8 31.4 <0.001
Taxi 9.2 9.2 4.3 7.7 NS
Bus 15.7 34.5 11.1 9.7 18.0 <0.000
Train 43.2 23.0 16.7 18.3 32.6 <0.001
Tram 24.9 26.4 11.1 5.4 20.4 <0.001
Bicycle 17.9 2.3 5.6 3.2 11.0 <0.001
Walk 62.9 50.6 22.2 26.9 50.8 <0.001
Other transport 3.5 2.3 5.6 3.5 -
n 229 87 18 93 427 * A dash (-) indicates that the prevalences were too low to enable a valid statistical test of significance to be conducted.

18
Tables 22 and 23 respectively summarise all the types of transport used and the type of transport used most frequently. Driving and walking clearly predominate in Table 22, which also reveals significantly different usage profiles for the four cohorts. In Table 23, while the differences between the four cohorts were quite marked, the small numbers in many of the cells of the table rendered a statistical test of significance invalid. With regard to active transport, Australian-born were more likely to ride a bicycle than were immigrants, and Australian- and Italian-born were more likely to walk than Lebanese- or Sri Lankan-born.
Table 23. Type of transport used most often: by country of birth
Country of birth
Type of transport Australia %
Italy %
Lebanon%
Sri Lanka%
Total %
p*
Drive a car 80.5 55.6 88.2 81.0 76.7
Passenger in car 6.2 20.6 5.9 6.0 8.6
Taxi .5 1.2 .5
Bus 1.0 4.8 1.3
Train 5.2 6.3 6.0 5.3
Tram 1.9 1.6 1.3
Bicycle 1.6 .3
Walk 4.3 7.9 6.0 5.1
Other transport .5 1.6 5.9 .8
n 210 63 17 84 374 0.002 * Statistical test of significance based on three transport categories: drive, passenger/other, active transport (walk/bicycle).
Table 24. Easy access to facilities: by country of birth
Country of birth
Facility Australia%
Italy %
Lebanon%
Sri Lanka %
Total %
n* p
Aerobic dance studio / dance school 53.1 32.1 35.3 41.0 46.4 362 0.018Fitness centre / gym 88.5 56.9 88.9 79.5 81.7 372 <0.001Golf course 81.0 25.5 60.0 51.4 66.5 352 <0.001Martial arts studio 42.0 23.5 50.0 25.0 36.3 347 0.009Swimming pool 84.5 64.5 93.8 68.6 78.5 367 0.009Courts (e.g. netball, tennis, basketball) 81.0 37.5 56.3 49.3 66.9 357 <0.001Playing field (e.g. football, soccer, softball) 86.4 42.6 62.5 62.0 73.8 355 <0.001
Athletics track 59.3 20.8 50.0 32.9 47.8 356 <0.001Beach 50.9 39.7 70.6 29.5 46.6 378 0.001Park, playground 94.1 75.4 88.2 86.7 89.2 380 <0.001Walking/running/cycling tracks 85.1 61.5 88.2 80.0 80.2 383 <0.001n* 221 65 17 80 383 * Each row represents the responses to a separate question. Generally, not all respondents answered all questions. Consequently, total
numbers are not exactly equal for each row and column totals for each country are indicative. Table 24 shows the proportions of respondents in each cohort who reported that they knew where each of the listed facilities was and could easily access it. Broadly, Australian- and Lebanese-born were most likely to report easy access to facilities, with Italian-born least likely and or Sri Lankan-born intermediate. Table 25 shows the proportions of respondents in each cohort who reported that they knew the cost of each of the listed facilities and could afford it. While there were some variations, broadly the profiles were similar for Australian-, Lebanese- and Sri Lankan-born, with much lower proportions of Italian-born reporting affordability in each case.

19
Table 25. Affordability of facilities: by country of birth
Country of birth
Facility Australia%
Italy %
Lebanon%
Sri Lanka %
Total %
n* p
Aerobic dance studio / dance school 32.5 17.0 53.3 32.0 30.9 346 0.035Fitness centre / gym 51.6 20.4 62.5 37.5 44.4 363 <0.001Golf course 43.8 13.0 57.1 32.9 37.9 340 <0.001Martial arts studio 24.9 6.7 75.0 25.8 24.4 316 <0.001Swimming pool 72.0 40.7 62.5 44.9 61.5 353 <0.001Courts (e.g. netball, tennis, basketball) 54.5 15.6 53.8 42.4 46.6 326 <0.001n* 213 54 16 80 363 * Each row represents the responses to a separate question. Generally, not all respondents answered all questions. Consequently, total
numbers are not exactly equal for each row and column totals for each country are indicative. Table 26 shows the proportions of respondents in each cohort who reported that they would be influenced to participate in a fitness centre or sports club by each of the listed characteristics. Most of the overall prevalences were in the range 60-75%, but those regarding healthy practices –Sunsmart practices, responsible serving of alcohol and healthy food options – were much lower. There was no consistent pattern in the significant differences between the four cohorts; the patterns were specific to each characteristic. Put another way, the four cohorts displayed different profiles of susceptibility to influence.
Table 26. Influences on participation in a fitness centre or sports club: by country of birth
Country of birth
Influential characteristic Australia %
Italy %
Lebanon %
Sri Lanka %
Total %
n* p
Access to information about facilities and programs 64.2 51.1 56.3 53.5 59.8 338 NS
Family-friendly facilities and services 60.2 57.7 75.0 60.0 60.5 349 NS Knowing someone at a centre or club 64.2 71.2 75.0 54.2 63.8 359 NS Friendliness of reception staff 75.4 57.7 66.7 61.1 69.4 346 0.027 Friendliness of the coach/ instructor 81.2 47.8 80.0 65.2 73.3 337 <0.001 Skill and/or experience of the coach/instructor 81.7 41.3 81.3 64.1 72.8 334 <0.001 The centre or club is smokefree 74.5 57.9 62.5 62.5 68.9 357 0.045 The centre or club has Sunsmart practices 33.3 45.5 46.7 29.1 34.9 312 NS The centre or club is friendly 84.5 62.3 73.3 68.0 77.2 356 0.001 The centre or club is responsible in the serving of alcohol 47.6 38.3 50.0 34.8 43.8 333 NS
The centre or club has injury prevention strategies in place 70.7 58.8 64.3 62.5 67.1 334 NS
The centre or club has healthy food options available 54.8 49.0 60.0 55.4 54.3 328 NS
The day/time of competition/practice sessions 76.6 47.9 68.8 62.1 69.5 344 0.001
n* 212 59 16 72 359 * Each row represents the responses to a separate question. Generally, not all respondents answered all questions. Consequently, total
numbers are not exactly equal for each row and column totals for each country are indicative.

20
Tables 27-31 show the prevalence of agreement with five sets of statements regarding different aspects of sport, PA and exercise. These questions specifically provided for “Don’t know” or “No opinion” responses. Such responses have been excluded from Tables 27-31. Table 27 shows that Australian- and Sri Lankan-born cohorts were very similarly positive with regard to a range of self-perceptions regarding sport and PA. The Italian-born cohort was more negatively inclined and the Lebanese-born cohort was more ambivalent..
Table 27. Self-perceptions regarding sport and PA: by country of birth
Country of birth
Agreement with statement: Australia%
Italy %
Lebanon%
Sri Lanka%
Total %
n* p
I am confident in my abilities in physical activity and sport 74.9 29.9 64.3 87.7 68.7 361 <0.001I am not very good at physical activity and sport 28.4 58.9 52.9 33.8 35.6 348 <0.001I am satisfied with my performance in physical activity and sport 68.4 38.0 61.5 76.4 65.3 331 <0.001I prefer to watch TV or play electronic games rather than play sport or do physical activity
15.5 42.3 22.2 19.5 20.6 354 <0.001
I don't have the proper clothing or shoes to play sport 11.7 40.4 27.8 15.5 17.8 338 <0.001I don't like being physically active because of my body shape 7.7 42.6 11.8 7.5 13.1 359 <0.001I don't like how being physically active makes me feel (eg. hot, sweaty, out of breath)
11.8 44.1 16.7 10.3 17.0 358 <0.001
n* 207 67 14 73 361 * Each row represents the responses to a separate question. Generally, not all respondents answered all questions. Consequently, total
numbers are not exactly equal for each row and column totals for each country are indicative. Table 28 shows the prevalences of agreement with five true statements regarding health benefits of PA from the Active Australia Survey (Australian Institute of Health and Welfare, 2003). While there is some volatility, particularly for the small Lebanese-born cohort, the prevalence of agreement was consistently lowest in the Italian-born cohort.
Table 28. Knowledge about health benefits of PA: by country of birth
Country of birth
Agreement with statement: Australia%
Italy %
Lebanon%
Sri Lanka%
Total %
n* p
Taking the stairs at work or generally being more active for at least 30 minutes each day is enough to improve your health.
80.2 44.4 53.3 68.5 70.1 348 <0.001
Half an hour of brisk walking on most days is enough to improve your health. 89.4 56.4 93.8 88.8 82.8 390 <0.001To improve your health it is essential for you to do vigorous exercise for at least 20 minutes each time, three times a week.
66.0 50.7 93.3 74.4 66.0 362 0.002
Exercise doesn't have to be done all at one time-blocks of 10 minutes are okay. 75.8 57.7 88.2 67.6 71.1 356 0.011Moderate exercise that increases your heart rate slightly can improve your health. 98.1 56.6 94.1 94.5 89.0 381 <0.001
n* 216 78 16 80 390 * Each row represents the responses to a separate question. Generally, not all respondents answered all questions. Consequently, total
numbers are not exactly equal for each row and column totals for each country are indicative. Table 29 shows the prevalence of agreement with five statements regarding promotion of the health benefits of PA. Overall, there were moderate levels of agreement with all five propositions, the least supported being the ethnic tailoring of media campaigns, and the most support being for the importance of role models. There were no significant differences between the four cohorts with regard to ethnic tailoring, and only marginally significant with regard to role models. The most
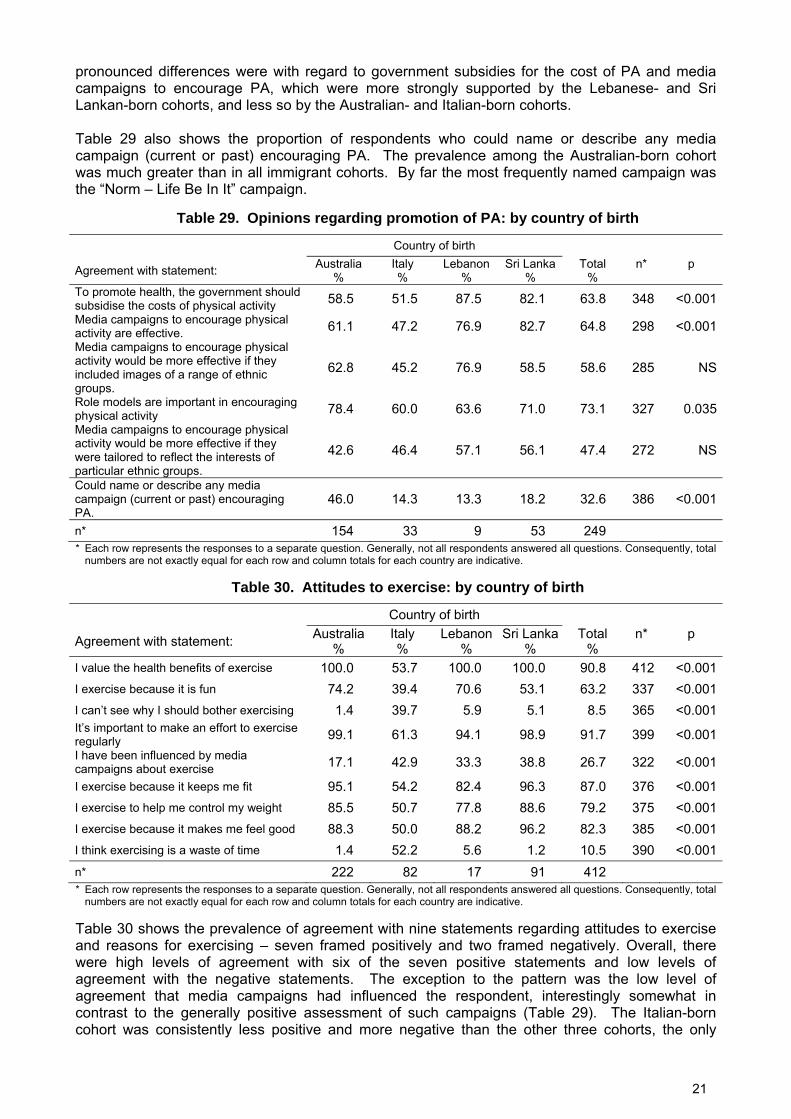
21
pronounced differences were with regard to government subsidies for the cost of PA and media campaigns to encourage PA, which were more strongly supported by the Lebanese- and Sri Lankan-born cohorts, and less so by the Australian- and Italian-born cohorts. Table 29 also shows the proportion of respondents who could name or describe any media campaign (current or past) encouraging PA. The prevalence among the Australian-born cohort was much greater than in all immigrant cohorts. By far the most frequently named campaign was the “Norm – Life Be In It” campaign.
Table 29. Opinions regarding promotion of PA: by country of birth
Country of birth
Agreement with statement: Australia %
Italy %
Lebanon %
Sri Lanka %
Total %
n* p
To promote health, the government should subsidise the costs of physical activity 58.5 51.5 87.5 82.1 63.8 348 <0.001Media campaigns to encourage physical activity are effective. 61.1 47.2 76.9 82.7 64.8 298 <0.001Media campaigns to encourage physical activity would be more effective if they included images of a range of ethnic groups.
62.8 45.2 76.9 58.5 58.6 285 NS
Role models are important in encouraging physical activity 78.4 60.0 63.6 71.0 73.1 327 0.035Media campaigns to encourage physical activity would be more effective if they were tailored to reflect the interests of particular ethnic groups.
42.6 46.4 57.1 56.1 47.4 272 NS
Could name or describe any media campaign (current or past) encouraging PA.
46.0 14.3 13.3 18.2 32.6 386 <0.001
n* 154 33 9 53 249 * Each row represents the responses to a separate question. Generally, not all respondents answered all questions. Consequently, total
numbers are not exactly equal for each row and column totals for each country are indicative.
Table 30. Attitudes to exercise: by country of birth
Country of birth
Agreement with statement: Australia%
Italy %
Lebanon%
Sri Lanka%
Total %
n* p
I value the health benefits of exercise 100.0 53.7 100.0 100.0 90.8 412 <0.001I exercise because it is fun 74.2 39.4 70.6 53.1 63.2 337 <0.001I can’t see why I should bother exercising 1.4 39.7 5.9 5.1 8.5 365 <0.001It’s important to make an effort to exercise regularly 99.1 61.3 94.1 98.9 91.7 399 <0.001I have been influenced by media campaigns about exercise 17.1 42.9 33.3 38.8 26.7 322 <0.001
I exercise because it keeps me fit 95.1 54.2 82.4 96.3 87.0 376 <0.001I exercise to help me control my weight 85.5 50.7 77.8 88.6 79.2 375 <0.001I exercise because it makes me feel good 88.3 50.0 88.2 96.2 82.3 385 <0.001I think exercising is a waste of time 1.4 52.2 5.6 1.2 10.5 390 <0.001n* 222 82 17 91 412 * Each row represents the responses to a separate question. Generally, not all respondents answered all questions. Consequently, total
numbers are not exactly equal for each row and column totals for each country are indicative. Table 30 shows the prevalence of agreement with nine statements regarding attitudes to exercise and reasons for exercising – seven framed positively and two framed negatively. Overall, there were high levels of agreement with six of the seven positive statements and low levels of agreement with the negative statements. The exception to the pattern was the low level of agreement that media campaigns had influenced the respondent, interestingly somewhat in contrast to the generally positive assessment of such campaigns (Table 29). The Italian-born cohort was consistently less positive and more negative than the other three cohorts, the only

22
exception being the influence of media campaigns, which interestingly was reportedly highest in the Italian-born cohort. Table 31 shows the prevalence of agreement that each of 21 potential barriers to participation in sport and PA do arise or would be likely to arise. Overall, the four most frequently identified barriers (in descending order of frequency) – injury; feeling tired or lacking energy; lack of time due to home and family responsibilities; and unpleasant weather – were common to all four cohorts. Of the remaining 17 barriers for which there were significant differences between the cohorts, in every case the barrier was more frequently identified by at least one immigrant cohort than was the case for the Australian-born cohort (all three cohorts in 14 cases, two cohorts in one case and one cohort in two cases; see underlined entries in Table 31).
Table 31. Barriers to participation in sport and PA: by country of birth
Country of birth
Barrier Australia%
Italy %
Lebanon%
Sri Lanka%
Total %
n* p
Conflict with cultural expectations or beliefs 1.0 20.4 20.0 9.5 6.6 346 <0.001
Conflict with religious rules, beliefs or expectations 2.4 14.3 22.2 9.1 6.8 365 <0.001
Conflict with rules about clothes that should be worn 5.3 14.3 22.2 12.7 9.2 369 0.014
Cost of participation (e.g. buying equipment, hiring facilities) 31.3 48.3 44.4 56.0 40.2 371 0.001
Difficulties with language (e.g. do not understand English well enough) 2.9 35.2 27.8 9.0 11.5 384 <0.001
Difficulty finding someone to participate with 23.2 51.5 41.2 34.6 31.6 373 <0.001
Feeling tired or lacking energy 56.3 63.9 58.8 51.2 56.8 384 NSHaving injuries, disabilities or illnesses 60.2 69.2 43.8 59.7 61.0 364 NSLack of family-friendly facilities 11.3 34.4 41.2 33.3 21.5 363 <0.001Lack of information about programs or facilities 18.3 43.8 43.8 36.4 27.9 359 <0.001
Lack of programs or facilities 19.4 45.2 41.2 37.2 28.8 358 <0.001Lack of time due to home and family responsibilities 53.2 51.4 56.3 47.6 51.8 388 NS
Lack of time due to other leisure activities (e.g. other interests, socialising)
27.1 38.7 38.9 43.9 33.3 372 0.032
Lack of time due to study 7.1 3.3 29.4 23.2 11.1 371 <0.001Lack of time due to work outside the home 36.1 20.3 25.0 44.6 34.8 379 0.017
Transport difficulties 6.5 26.1 5.9 23.8 13.8 384 <0.001Not being fit or strong enough 25.7 57.7 35.3 37.3 34.6 381 <0.001Not having enough skills in physical activities 22.2 48.5 25.0 34.5 29.6 378 <0.001
Rules about males and females participating together 4.8 19.0 23.5 9.8 9.2 370 0.001
Self consciousness about my looks when I exercise 11.6 25.8 16.7 13.6 14.7 381 0.041
Unpleasant weather (hot, cold, rainy) 48.8 58.9 43.8 53.5 51.5 392 NSn* 217 73 16 86 392 * Each row represents the responses to a separate question. Generally, not all respondents answered all questions. Consequently, total
numbers are not exactly equal for each row and column totals for each country are indicative.

23
Table 32 shows the prevalence of support and encouragement from household members. The question was presented as a trichotomy (never, sometimes, often); however, the small number of “often” responses have been combined with the “sometimes” responses in Table 32. Overall, the prevalences ranged from 76.8% for encouragement down to 35.2% for watching participation. The strongest difference between cohorts was for participation together, which was most prevalent among the Australian-born cohort and least prevalent among the Italian-born cohort.
Table 32. Support and encouragement from household members: by country of birth
Country of birth Members of your household sometimes or often…
Australia%
Italy %
Lebanon%
Sri Lanka%
Total %
n* p
Encourage you to do physical activities or sport? 78.7 73.3 76.5 75.6 76.8 410 NS
Put pressure on you to exercise? 30.5 39.0 41.2 53.5 37.5 400 0.003Do physical activity or play sport with you? 71.1 42.9 70.6 57.0 62.6 398 <0.001
Watch you participate in physical activities or sports? 33.3 22.8 35.3 51.2 35.2 401 0.002
Tell you that you are doing well in physical activities or sports? 59.4 56.8 58.8 57.6 58.5 402 NS
n* 221 86 17 86 410 * Each row represents the responses to a separate question. Generally, not all respondents answered all questions. Consequently, total
numbers are not exactly equal for each row and column totals for each country are indicative. Table 33 shows the prevalence of support and encouragement from friends. This question too was presented as a trichotomy (never, sometimes, often); however, the small number of “often” responses have been combined with the “sometimes” responses in Table 33. Overall, the prevalences were rather lower than for household members, ranging from 58.3% for encouragement down to 27.3% for watching participation. As for household members, the strongest difference between cohorts was for participation together, which was most prevalent among the Australian-born cohort and least prevalent among the Italian-born cohort.
Table 33. Support and encouragement from friends: by country of birth
Country of birth Members of your household sometimes or often…
Australia%
Italy %
Lebanon%
Sri Lanka%
Total %
n* p
Encourage you to do physical activities or sport? 57.3 53.8 58.8 64.4 58.3 412 NS
Put pressure on you to exercise? 13.8 21.8 11.8 25.6 17.8 410 NSDo physical activity or play sport with you? 62.2 30.8 35.3 47.8 52.0 410 <0.001
Watch you participate in physical activities or sports? 28.0 17.3 11.8 36.7 27.3 407 0.020
Tell you that you are doing well in physical activities or sports? 50.0 41.0 41.2 45.1 46.8 410 NS
n* 225 80 17 90 412 * Each row represents the responses to a separate question. Generally, not all respondents answered all questions. Consequently, total
numbers are not exactly equal for each row and column totals for each country are indicative.

24
Table 34 concerns self-efficacy, and shows the prevalence of moderate or greater confidence of maintaining sport and PA activities when circumstances are not ideal. This question was presented as a five-point semantic differential scale (not at all, slightly, moderately, very, extremely) but has been recoded as a dichotomy in for the purpose of presentation in Table 34. Overall, close to half of the respondents expressed moderate or greater confidence with regard to each of the five situations listed. There were significant differences between cohorts with regard to four of the five situations, with Australian-born respondents being more likely than immigrants to report being confident.
Table 34. Self efficacy: by country of birth
Moderately/very/extremely confident Country of birth of maintaining sport and PA activities…
Australia%
Italy %
Lebanon%
Sri Lanka%
Total %
n* p
When you are tired 61.5 32.5 37.5 38.9 49.9 415 <0.001When you are in a bad mood 66.2 29.9 37.5 37.8 52.0 408 <0.001When you feel you don’t have time 49.1 40.8 25.0 37.8 44.1 406 NSWhen you are on vacation 62.7 42.0 64.7 61.1 58.4 413 0.011When it is raining 51.1 29.6 37.5 37.8 43.4 412 0.004n* 226 83 16 90 415 * Each row represents the responses to a separate question. Generally, not all respondents answered all questions. Consequently, total
numbers are not exactly equal for each row and column totals for each country are indicative.
3.5 Health and wellbeing Respondents were asked whether they had a permanent disability, and also whether they had, or had ever been told by a doctor or nurse that they had, any of 15 diseases which are potentially impinged upon, either positively or negatively, by participation in sport and PA, and which may in turn impinge upon one’s capacity to participate in sport and PA. The reported prevalences for the Australian-born cohort are close to those to those for the Australian population (Australian Institute of Health and Welfare, 2010). It was not possible to conduct significance tests for diseases with the lowest prevalences because of small cell counts. The prevalences of angina, high blood pressure and diabetes were greater in all immigrant cohorts than in the Australian cohort. The prevalence of muscle/joint/bone conditions was higher in the Italian-born cohort and lower in the Lebanese- and Sri Lankan-born cohorts than in the Australian-born cohort, perhaps due in part to the occupational profiles shown in Table 15. The survey form incorporated the 12 items which make up the SF-12 health questionnaire (Ware et al., 2002). See questions C1-C7 in Attachment 1. Table 36 shows a statistical summary of two composite summary scales derived from the SF-12 – the Physical Component Score (PCS) and the Mental Component Score (MCS). These two summary scales have been calibrated (with reference to the general American population in 1998) to have a mean of 50 and a standard deviation of 10. Table 36 shows that the average values (means and medians) for all three immigrant cohorts were lower than the corresponding statistics for the Australian-born cohort in every case. The standard deviations indicate that the spread of the PCS and MCS scores within each cohort were similar to that of the general population. The average level of mental health and wellbeing of respondents in all cohorts was close to that of the general population, but the mean level of physical health and wellbeing of Italian immigrants was 8.1 points, or close to one standard deviation, below that of the general population, i.e. around the 20th percentile of the general population. There is evidence to suggest that a difference of 2 points on these scales is associated with clinical differences in health status (Lee and Russell 2003; Australian Bureau of Statistics, 1997). An analysis of variance with post-hoc pairwise tests confirmed that the mean value of PCS for Italian immigrants was significantly lower than the means of Australian-born (p<0.001) and Sri Lankan-born (p=0.006) cohorts. Because of the relatively small sample size of the Lebanese cohort, the difference between Italian- and Lebanese-born cohorts was not statistically significant. The differences between the MCS means were not statistically significant.

25
Table 35. Disability and disease: by country of birth
Country of birth
Condition Australia%
Italy %
Lebanon%
Sri Lanka%
Total %
n* p**
Permanent disability 14.9 20.2 5.9 11.7 14.9 417 NSCardiovascular disease Angina 2.3 17.6 7.1 8.6 6.7 386 <0.001Heart attack (includes a ‘coronary’, coronary occlusion, coronary thrombosis, myocardial infarction)
3.7 10.0 .0 9.0 5.8 379 -
Stroke 1.9 7.4 .0 4.9 3.4 378 -High blood pressure 31.5 57.1 47.1 44.4 39.9 406 0.001Low blood pressure 9.8 15.9 6.7 5.4 9.9 372 NSHigh cholesterol 33.6 45.6 40.0 44.7 38.7 390 NSDiabetes 399Diabetes 6.4 25.3 29.4 21.6 14.3 357 <0.001Risk of diabetes 14.3 19.0 21.4 21.3 16.8 390 NSOther disease 395Anxiety/depression 22.6 33.8 12.5 22.5 24.4 382 NSMuscle/joint/bone conditions 52.0 65.0 26.7 36.7 50.6 394 0.001Cancer 6.5 4.1 12.5 2.6 5.5 381 -Asthma 12.8 11.8 12.5 10.8 12.2 388 NSFood allergy 8.5 12.3 6.3 3.8 8.1 389 NSEczema 11.1 1.4 6.3 3.6 7.5 386 0.020Hayfever or allergic rhinitis 33.2 18.7 26.7 24.4 28.3 379 NSn* 222 84 17 94 417 * Each row represents the responses to a separate question. Generally, not all respondents answered all questions. Consequently, total
numbers are not exactly equal for each row and column totals for each country are indicative. ** A dash (-) indicates that the prevalences were too low to enable a valid statistical test of significance to be conducted.
Table 36. Summary of SF-12 Physical and Mental Component Scores: by country of birth
Country of birth
Disease Australia %
Italy %
Lebanon%
Sri Lanka%
Total %
p
Physical component summary (PCS) Median 52.3 42.4 48.8 49.3 50.0 Mean 49.1 41.9 47.1 47.2 47.2 <0.001 Std. Deviation 10.4 11.1 8.3 9.7 10.6 N 223 78 18 89 408 Mental component summary (MCS) Median 53.8 48.3 51.3 51.9 52.2 Mean 50.8 47.8 50.0 50.6 50.2 NS Std. Deviation 9.5 10.1 8.6 10.3 9.8 N 223 78 18 89 408

26
3.6 Level of physical activity As discussed in Section 3.1, results in Sections 3.6 and 3.7 are based on the sample of 204 respondents who completed the IPAQ and SF-12 sections of the survey form. In this study, each respondent’s level of physical activity was assessed by self report, in two ways: one quick, simple and undemanding; and the other time-consuming, complex and demanding. First, respondents were asked to indicate on a five point scale (not at all, a bit, moderately, very, extremely) how physically active they are now (Table 37). Immigrants were asked the same question with reference to before they emigrated to Australia (Table 38). Around 80% of Australian- and Sri Lankan-born respondents and 65% of Italian- born indicated that they are at least moderately physically active now. The different figures for the small Lebanese sample are unreliable. Somewhat higher proportions of each Italian- and Lebanese-born cohorts reported being at least moderately active before emigration. After recoding into three categories to eliminate small cell sizes, chi-square tests showed no significant differences between the profiles of the cohorts in either case. Unsurprisingly, a McNemar-Bowker chi-square test established that there were significant decreases (p=0.002) in self-assessed PA level between the time of emigration and the present.
Table 37. Self-assessed PA level: by country of birth
Country of birth
PA level Australia %
Italy %
Lebanon%
Sri Lanka%
Total %
p
Not at all 3.0 8.0 .0 .0 3.0
A bit 13.5 28.0 50.0 18.4 17.3
Moderately 56.4 48.0 33.3 55.3 54.5
Very 24.8 16.0 16.7 23.7 23.3
Extremely 2.3 .0 .0 2.6 2.0
n 133 25 6 38 202 NS
Table 38. Self-assessed PA level prior to emigration: by country of birth
Country of birth
PA level Australia %
Italy %
Lebanon%
Sri Lanka%
Total %
p
Not at all 4.2 .0 2.6 2.9
A bit .0 .0 17.9 10.1
Moderately 29.2 16.7 41.0 34.8
Very 50.0 66.7 30.8 40.6
Extremely 16.7 16.7 7.7 11.6
n 24 6 39 69 NS
Second, the survey form incorporated the 31 items which make up the long version of the International Physical Activity Questionnaire (IPAQ) (Craig et al., 2003). Refer to Sections A1-A5 in Appendix 1. This was designed to collect detailed information about PA during the week (7 days) prior to administration, within the domains of: occupational activity; active transport; domestic yard/garden and household work activities; and leisure-time PA, in order to enable the calculation of time- and intensity-weighted quantitative measures of PA. The respondent is asked to report, within each of the four domains, and at each of three levels of intensity (walking, moderate PA and vigorous PA), two pieces of time information: number of days during the previous 7 days; and usual duration per day, in hours and/or minutes. It is stipulated that only PA that took place in periods of at least 10 minutes duration should be reported. There is also a question about duration of sedentary activity. The IPAQ was designed to be used by adults aged 18–65 yr, and its necessarily multi-dimensional nature makes considerable cognitive demands on the respondent. It

27
is not surprising that the trade off for such rich and fine-grained information might be a substantial rate of non-completion (as tabulated and discussed in Table 3 and Section 3.1), particularly among respondents of advanced age with low levels of literacy and/or reduced cognitive function. Here we present statistical summaries based on the two key outcomes IPAQ: energy expenditure in MET-minutes/week (quantitative), and PA level (three categories). These were calculated in accordance with IPAQ scoring protocols (International Physical Activity Questionnaire, 2005), by weighting each type of activity by specified energy requirements defined in metabolic units (METs) to yield a score in MET-minutes. METs are multiples of the resting metabolic rate, and a MET-minute is computed by multiplying the MET score of an activity by the duration of the activity in minutes. Summing over a 7-day period results in MET-minutes/week. Table 39 shows breakdowns by country of birth of 15 energy expenditure scales: a grand total; sub-totals for each of vigorous, moderate and walking; and 11 domain-specific component scales – two vigorous, six moderate and three walking. Note that vigorous yard and garden work is included in the moderate category, the reasoning apparently being that such work is likely to be intermittent and less intensive than vigorous activities undertaken in occupational and leisure contexts. In almost every instance in Table 37, the mean is greater than the median (indeed many median values are zero, indicating that at least half of the respondents reported no activity in the particular category), and the standard deviation is greater than the mean. This indicates highly positively skewed distributions which are typical of energy expenditure data, with a small proportion of individuals having very high energy expenditures. In light of this, tests of differences between cohorts were conducted using the non-parametric Kruskal-Wallis test rather than analysis of variance (ANOVA). Because of the very small size of the Lebanese-born sample and the very high variability in a number of the component scales, the Lebanese averages are unreliable and will not be discussed. While there were no significant differences between the cohorts in overall energy expenditure, there were significant differences between the vigorous sub-total, and marginally significant differences (p<0.10) between a number of the domain-specific component scales, indicating different patterns of PA in the four cohorts. Australian- and Sri Lankan-born respondents reported higher levels of vigorous PA than Italian-born respondents in both occupational and recreational contexts (though the former was not statistically significant because of greater variability between individuals). The Italian immigrants stood out from the other cohorts with much higher levels of moderate intensity domestic PA (vigorous yard & garden activities, moderate yard & garden activities and moderate household activities), while Australian-born respondents reported higher levels of moderate intensity leisure activities than for the immigrants. Finally, Australian- and SriLankan-born respondents walked more for leisure than Italian-born respondents.
Table 39. Summary of energy expenditure (MET-minutes/week): by country of birth
Country of birth
Australia
% Italy %
Lebanon %
Sri Lanka %
Total %
p
Total PA NSMedian 3222 3884 3919 2888 3213
Mean 4069 4689 6529 4434 4287 Std. Deviation 3581 4576 6891 4004 3905
Vigorous PA 0.037Median 0 0 240 0 0
Mean 802 451 2240 641 771 Std. Deviation 1523 1395 4001 1949 1713
N 134 25 6 39 204

28
Table 39. Summary of energy expenditure (MET-minutes/week): by country of birth (cont.)
Country of birth
Disease Australia %
Italy %
Lebanon %
Sri Lanka %
Total %
p
Vigorous occupational PA NSMedian 0 0 0 0 0
Mean 324 240 2160 512 404 Std. Deviation 1302 1200 4047 1847 1557
Vigorous leisure PA 0.011Median 0 0 0 0 0
Mean 478 211 80 129 367 Std. Deviation 922 782 196 393 826
Moderate PA NSMedian 1185 2310 1140 1710 1390
Mean 2101 3332 3483 2602 2388 Std. Deviation 2418 3569 5148 3063 2820
Moderate occupational PA NSMedian 0 0 240 0 0
Mean 255 318 460 676 350 Std. Deviation 783 1510 560 2102 1238
Cycling for transport NSMedian 0 0 0 0 0
Mean 88 10 0 0 59 Std. Deviation 384 48 0 0 314
Vigorous yard/garden PA NSMedian 0 0 0 0 0
Mean 447 1014 1760 595 584 Std. Deviation 1384 1739 2758 915 1426
Moderate yard/garden PA 0.064Median 240 840 0 480 240
Mean 574 1186 1213 827 716 Std. Deviation 1031 1624 2933 1246 1249
Moderate household PA 0.089Median 180 540 0 270 180
Mean 615 695 50 443 575 Std. Deviation 912 850 122 530 835
Moderate leisure PA 0.081Median 0 0 0 0 0
Mean 122 108 0 61 105 Std. Deviation 260 426 0 201 273
Walking NSMedian 710 594 479 1040 734
Mean 1166 906 806 1191 1128 Std. Deviation 1370 1007 961 1085 1267
Occupational walking NSMedian 0 0 50 0 0
Mean 246 75 242 240 224 Std. Deviation 749 304 468 552 666
Walking for transport NSMedian 198 396 50 462 248
Mean 526 647 465 551 544 Std. Deviation 812 744 690 617 763
Walking for leisure 0.062Median 198 0 0 297 198
Mean 394 183 99 399 360 Std. Deviation 594 245 242 445 533
N 134 25 6 39 204

29
The IPAQ classification of respondents into three categorical levels of PA (low, moderate, high) is based on a complex set of criteria including three levels of energy expenditure (600, 1500 and 3000 MET-minutes/week) in association with criteria regarding number of days per week and minutes per day of activities of various intensities. Refer to International Physical Activity Questionnaire (2005) for details. Table 40 shows a summary of IPAQ PA categories. Over half of the survey respondents were categorized as “high” and less than one in 10 as “low”. There was no significant difference between the profiles of the four cohorts.
Table 40. IPAQ PA category: by country of birth
Country of birth IPAQ PA category
Australia %
Italy %
Lebanon%
Sri Lanka%
Total %
p
Low 8.2 8.0 16.7 10.3 8.8
Moderate 35.1 36.0 16.7 41.0 35.8
High 56.7 56.0 66.7 48.7 55.4
n 134 25 6 39 204 NS Table 41 shows a cross-tabulation of 3-category PA classifications based on IPAQ (rows) and self assessment (columns). A chi-square test shows significant degree of association between the two classifications (p<0.001). Correlation-like measures of categorical association Somers’ d (0.40), Kendall’s tau B (0.40), Kendall’s tau B (0.35) and gamma (0.65) all indicate a moderate level of concordance between the two classifications. This moderate level of agreement is similar to reported levels of agreement between scores from IPAQ and other PA questionnaires and a range of comparison measures (van Poppel et al., 2010; Forsén et al., 2010). The consistently high counts (underlined) below the counts of agreement on the diagonal (boldface) support the notion that the IPAQ estimates of PA are inflated.
Table 41. IPAQ PA category by self-assessed PA category
Self-assessed PA category IPAQ PA category
Not at all/ a bit
Moderately
Very/ extremely n
p
Low 9 8 1 18
Moderate 23 42 7 72
High 9 60 43 112
n 41 110 51 204 <0.001 Table 42 shows that somewhat less than half the respondents were satisfied with their level of PA, and around a quarter would like to exercise more. There were no significant differences between cohorts.
Table 42. Satisfaction with PA level: by country of birth
Country of birth
Satisfaction with PA level Australia%
Italy %
Lebanon%
Sri Lanka %
Total %
p
I would like to exercise more 25.4 20.0 50.0 19.4 24.0 I probably should exercise more 33.9 28.8 25.0 32.3 32.2 I am satisfied 40.6 51.3 25.0 48.4 43.8 n 224 80 16 93 413 NS

30
Tables 43 and 44 show cross-tabulations of the respondents’ degree of satisfaction with their PA level against the PA classifications based on IPAQ (Table 43) and self assessment (Table 44). Chi-square tests show a significant degree of association in each case (IPAQ: p<0.017, self assessment: p<0.001). For self assessed PA level, correlation-like measures of categorical association Somers’ d (0.43), Kendall’s tau B (0.43), Kendall’s tau B (0.41) and gamma (0.65) all indicate a moderate level of concordance between the levels of PA and satisfaction. For IPAQ PA level, the relationship is somewhat weaker: Somers’ d (0.20), Kendall’s tau B (0.203), Kendall’s tau B (0.18) and gamma (0.32). The consistently high counts (underlined) above the concordant counts on the diagonal (boldface) support the notion that the IPAQ estimates of PA are inflated.
Table 43. Satisfaction with PA level by IPAQ PA category
IPAQ PA category
Satisfaction with PA level Not at all/ a bit
Moderately
Very/ extremely n
p
I would like to exercise more 6 30 25 61 I probably should exercise more 6 24 33 63 I am satisfied 6 18 54 78 n 18 72 112 202 0.017
Table 44. Satisfaction with PA level by self-assessed PA category
Self-assessed PA category
Satisfaction with PA level Not at all/ a bit
Moderately
Very/ extremely n
p
I would like to exercise more 21 35 4 60 I probably should exercise more 18 37 8 63 I am satisfied 2 37 38 77 n 41 109 50 200 <0.001
3.7 Relationship between level of physical activity and health and wellbeing
Table 45 shows correlations between each of the 15 IPAQ energy expenditure scales (see Section 3.6) and the SF-12 PCS and MCS scores (see Section 3.5). The only significant correlation was between vigorous leisure PA and PCS (r=0.24, p=0.001). Two further correlations approached significance (p<0.10): those between cycling for transport and PCS (r=0.12, p=0.080) and between vigorous yard/garden and MCS (r=0.14, p=0.054); however, two such results out of 36 tests is close to the chance rate of one in 20 “false positives”, and cannot be given much credence. Table 46 shows the results of four 2-factor analyses of variance (ANOVAs) which examined the combined effects of PA category (IPAQ and 3-category self-assessed – see Section 3.5) and country of birth on SF-12 PCS and MCS scores. Consistent with the results in Table 36, country of birth had a significant effect on PCS but not on MCS in these analyses. Self-assessed PA category (but not IPAQ PA category) had a significant effect on MCS. Post-hoc pairwise tests confirmed that the mean value of MCS was significantly higher (p=0.001) for the “moderately” and “very/extremely” self-assessed activity categories than for the “not at all/a bit” activity category. There were no significant interactive effects between PA category and country of birth.

31
Table 45. Correlations between IPAQ scales and SF-12 scales
SF-12 PCS
SF-12 MCS
IPAQ scale r p r p
Total PA 0.11 NS 0.07 NS Vigorous PA 0.09 NS 0.01 NS Vigorous occupational PA -0.03 NS -0.02 NS Vigorous leisure PA 0.24 0.001 0.06 NS Moderate PA 0.07 NS 0.11 NS Moderate occupational PA -0.07 NS 0.05 NS Cycling for transport 0.12 0.080 0.05 NS Vigorous yard/garden PA 0.07 NS 0.14 0.054 Moderate yard/garden PA 0.06 NS 0.09 NS Moderate household PA 0.07 NS -0.10 NS Moderate leisure PA 0.08 NS 0.03 NS Walking 0.07 NS -0.04 NS Occupational walking 0.05 NS -0.10 NS Walking for transport -0.03 NS 0.00 NS Walking for leisure 0.13 NS 0.04 NS N 204 204
Table 46. Results of ANOVAs of SF-12 scales by PA category and country of birth
p-value
Dependent variable
Type of PA category PA category Country of
birth
PA category × Country of
birth SF-12 PCS IPAQ NS 0.001 NS Self-assessed NS <0.001 NS SF-12 MCS IPAQ NS NS NS Self-assessed 0.006 NS NS

32
4 Discussion This is the is the first study conducted in Australia to explore in detail the factors affecting participation in PA by three cohorts of middle and older aged migrant adults (Italian, Lebanese and Sri Lankan), who have previously been demonstrated to have high levels of cardiovascular and physical activity risk in comparison to an Australian-born reference group. Notwithstanding the poor survey response rate achieved in the migrant groups (particularly the Lebanese-born group), a range of differences were observed between the cohorts which can be used to guide policy and practice aimed at promoting participation in PA. Most immigrant respondents reported that they had migrated to Australia many years ago, and had a wide range of educational experience. The most long standing group of migrants was the Italians who generally migrated to Australia between 1950 and 1970. This group also reported the lowest level of formal education. The low level of education experienced by the Italian group was also reflected in the type of occupations undertaken, with low skilled occupations being most commonly reported. Although each of the migrant groups reported living in Australia for long periods of time, all three migrant groups reported they commonly spoke a language other than English at home. Notwithstanding the continuing use of native languages, it is likely that acculturation over time to the Australian lifestyle had a significant effect on the health of these migrant groups (Evenson and Ayala, 2004). The four groups (three migrant groups and the Australian control) reported a range of religious beliefs, with the most common religions reported being Christianity and Buddhism. The risks of cardiovascular disease and associated diseases can be categorized as either behavioural or biomedical risks (Bennett, 1993). Behavioural risks include factors such as smoking and physical inactivity. Biomedical risks include obesity, hypertension and hypercholesterolemia and may be related to behavioural and environmental risks, as well as genetic factors. Ultimately these behavioural and biomedical risks may become manifest as cardiovascular disease, diabetes and other diseases such those affecting muscles, joints and bone. The presence or absence of these risks and the associated diseases will impact upon the various migrant groups’ perceptions of their health. The two key behavioural risks examined in the current study were smoking and physical inactivity. The smoking rates reported by the respondents were generally lower than those generally reported by Victorian adults (Victorian Population Health Survey, 2006) where over one in five adults aged 18 years or over (20.5 %) were current smokers. This finding may also indicate the possibility that the survey respondents were a self-selected sample more ‘health conscious’ than the overall population. Nevertheless, the prevalence of smoking was higher in the migrant groups than the Australian-born reference group and these data support those reported by Bennett (1993) for an Australian sample. The high number of respondents who reported having given up smoking is also reflective of the overall decrease in adult smokers within the Victorian population over the past decade (Victorian Population Health Survey, 2006). Physical activity (and physical inactivity) was assessed using two measures: a simple self assessment scale and the more detailed but complex IPAQ. The self assessment scale has been used previously by Payne et al. (2010) and has been found to correlate well with other measures of ‘usual’ physical activity. When using this measure, no difference was found between the overall levels of physical activity reported by the migrants from different countries and the Australian-born reference group. The IPAQ was used to record PA in a range of settings including recreational, occupational, domestic and as a form of transport. The median level of PA reported in MET-minutes/week was 3213 and ranged from 2888 to 3919 MET-minutes/week across the four study groups; however no significant difference was observed between the study groups. This median level of total physical activity was similar to that of 3699 MET-minutes/week reported in the 12 country validation of the IPAQ (Craig et al., 2003) but less than that reported by Graff-Iversen et al. (2007) for groups of Norwegians including those of Western and non-Western origin. In the study by Graff-Iversen et al. (2007) the median MET-minutes/week for men and women of non-Western origin was 5158 and 5519 MET-minutes/week, respectively and men and women of Western origin was 4248 and 4232 MET-minutes/week, respectively. These comparisons are important as the

33
same tool was used in each study, and as it is generally acknowledged that PA is overestimated in detailed self report instruments such as the IPAQ (Craig et al., 2003; Sallis and Saelens, 2000). It is difficult to relate the PA data to the National Physical Activity Guidelines for Adults and the levels of physical activity required result in a health benefit. However, given that the IPAQ scoring document (International Physical Activity Questionnaire. 2005) indicates that a ‘high’ level of PA is roughly equivalent to 12,500 steps per day, it is apparent that our sample was, on average, undertaking at least sufficient PA to achieve a health benefit. This finding was consistent with the findings of the Victorian Population Health Survey, where 64.1% of the adult population self reported that were undertaking adequate physical activity to achieve a health benefit (Victorian Population Health Survey 2006). With regard to the context and intensity of PA, there were a number of indicative but non-significant differences between the patterns of PA in the four cohorts. However, the most striking and potentially important finding was a significant difference in the level of vigorous recreational PA, with the Australian-born respondents reporting substantially higher levels than the migrant groups. The biomedical markers assessed in the self report survey included obesity, hypertension and hypercholesterolemia. The level of overweight and obesity reported of 59.8% across all groups was close to the overall Australian prevalence of overweight and obesity of 59.6% reported by Dunstan et al. (2001). The level of overweight and obesity reported in the Italian group was higher than for the other migrant groups and the Australian-born reference sample. Worldwide, hypertension is responsible for more deaths and disease than any other biomedical risk factor (Lopez et al. 2006). There was a significant difference between the reported prevalence of hypertension between the four cohorts, where the prevalence of hypertension was greater in Italian- and Sri Lankan-born cohorts than in the Australian-born cohort. The data from the Italian sample contrast with those reported by Ireland and Giles (1996) where the incidence of hypertension in Italian and Australian adults was similar. Although the self reported level of overweight and obesity in our study sample was similar to the national average, the level of hypertension reported was substantially higher than the national average of 10.3% for those aged 45-54 and 23.6% for those aged 55-64 (Australian Institute of Health and Welfare, 2010). Likewise the proportion of respondents reporting high cholesterol levels (average of 37.6%) was substantially higher than the national prevalence of 15% in the 55-64 year age group (Australian Institute of Health and Welfare, 2010). Overall, therefore, it was apparent that our sample of migrants from Italy, Lebanon and Sri Lanka, together with our Australian-born reference sample reported similar levels of overweight and obesity and these were similar to the national average. However, the reported levels of hypertension and hypercholesterolemia were substantially higher than the national sample and there were significantly higher levels of hypertension in the migrant sample than the Australian reference sample. The behavioural and biomedical risks factors are often manifest in diabetes, heart attack and stroke. The overall prevalence of the respondents, aged 40 years and over, who reported having been diagnosed with diabetes was 14.3% and the Australian-born reference population reported a prevalence of 6.4%. These data are in keeping with the data presented in the AusDiab report (Dunstan et al., 2001) where 6.2% and 13.1% of their nation-wide sample aged between 45-54 and 55-64 years, respectively indicated they had been diagnosed with diabetes. Of considerable interest, however was the approximately four-fold difference in the diabetes prevalence between the migrant groups and the Australian sample. Coronary heart disease (CHD) which includes angina and heart attack is the leading specific disease burden (9%) in Australia (Australian Institute of Health and Welfare, 2010). The national prevalence of CHD was 4.4% for males and 2.3% for females. The prevalences of angina and heart attack in the study sample were quite variable, ranging from 2.3% (angina) and 3.7% (heart attack) for the Australian-born cohort to 17.6% (angina) and 10.0% (heart attack) for the Italian cohort. Ultimately, risk of disease and presence of disease affect one’s perception of health. Health was measured in the current study using the SF-12 questionnaire. The two composite scores derived

34
from the questionnaire responses were the Physical Component Score (PCS) and the Mental Component Score (MCS); measures of perceived physical and mental health, respectively. There was a significant difference in the physical health scores with the PCS for the Italian cohort being the lowest of the four groups, with a mean value 8 points below the population norm of 50. In a review of research studies which utilised the SF-12, Ware et al. (2002) reported that conditions which produced “moderate to large” decrements of 5 to 10 points in PCS included hip fracture, low back pain, mild asthma and allergic rhinitis; it is apparent from this that the deficit in PCS for the Italian group was of a clinically relevant magnitude. These data indirectly support the higher prevalence of CHD and diabetes in the Italian cohort in comparison to the Australian-born reference group. There were no differences between the groups for MCS and all groups scored close to the standardized mean score of 50.0. To our knowledge, this is the first study to report the relationships between PCS and MCS scores and PA as measured using the IPAQ, for a population which included a high proportion of migrant adults. Data from 204 respondents were used in this analysis. These data revealed that PCS was significantly related to vigorous leisure PA, which in turn was shown to be significantly lower among the migrant groups than the Australian born cohort. The strong relationship between PCS and vigorous leisure PA is consistent with the results of Eime et al. (2010), who showed that female participants in club sport had significantly higher PCS scores (calculated from the SF-36 questionnaire) than a general female population reference sample, while for gymnasium participants and walkers the difference from the reference sample was less marked. This study also sought to identify the barriers and facilitators to participation in sport and physical activity (PA) by adult first generation members of the Victorian Italian, Lebanese and Sri Lankan migrant communities and Australian born counterparts, as well as to investigate whether these factors vary across these groups. The barriers and facilitators will be discussed with reference to the socio-ecological model of McLeroy et al. (1988) and the ecological model of Sallis and Owen (2002), specifically with respect to the following levels: intrapersonal, interpersonal, environmental, institutional, and public policy. These elements include the following characteristics and factors: • Intrapersonal factors: characteristics of the individual such as knowledge, attitudes, behavior,
self-concept, skills, etc. This includes the developmental history of the individual (McLeroy et al., 1988).
• Interpersonal processes and primary groups: formal and informal social network and social
support systems, including the family, work group, and friendship networks (McLeroy et al., 1988).
• Environmental factors: access to exercise settings and facilties in the home, the neighbourhood
and community; safety or difficulty in walking in the neighbourhood during the day (Booth et al., 2000).
• Institutional factors: social institutions with organizational characteristics, and formal (and
informal) rules and regulations for operation (McLeroy et al., 1988). • Public policy: local, state, and national laws and policies (McLeroy et al., 1988). Generally the migrant groups reported a greater prevalence of barriers to participation in physical activity; these barriers and any relevant facilitators will be explored in detail with reference to each of the elements of the ecological models. Intrapersonal There was a significant difference in the knowledge relating to physical activity and health of the groups. In particular, the Italian respondents displayed the lowest level of knowledge of all the groups. This low level of knowledge by the Italians was in keeping with the low response to questions designed to determine attitude towards physical activity. A telling response from the

35
Italian group was to the statement, “I can’t see why I should bother exercising” where 40% of respondents agreed with the statement. Further, 52.2% of the Italian cohort agreed with the statement, “I think exercising is a waste of time”. The lower level of knowledge and poor attitude towards physical activity by the Italian group was further reflected in their generally poor levels of self efficacy and self perception. However, it should be noted that in general the migrant groups responded less positively to questions of self efficacy than the Australian-born reference group. A final and very important barrier to participation in physical activity was difficulty with language, which particularly related to the Italian and Lebanese groups. Interpersonal The key interpersonal barriers included conflict with cultural expectations or beliefs, conflict with religious rules, beliefs or expectations and conflict about clothes that should be worn. Each of these three barriers was significantly more prevalent in the migrant groups than the Australian-born reference group. In particular, the Italian and Lebanese immigrants agreed with the statements up to 20 times more often than the reference group. These data are in agreement with those which have focused upon cultural limitations associated with the Muslim religion (Farooqi et al., 2000). However, in this case they extend to groups where either Christian or Buddhist religions predominate. The interpersonal element often focuses upon the influence of family and friends upon participation in PA. In this study these matters were explored in a number of ways. There was general agreement in all groups that they received support from members of their household and from friends to participate in PA. However there was a key difference between the groups when it came to their perception as to whether family friendly PA facilities were available. The migrant groups reported a lack of family friendly facilities twice as often as the Australian-born reference group. These data reflect those reported by Dassanayake (2009) in which qualitative data from focus group discussions were reported. The preference of migrant groups to undertake PA as a family group needs to be recognized by those responsible for facility planning and management. Environment The physical environment has been shown to have a modest impact on PA participation (Trost et al., 2002). However, most studies in this area have not explored the potential differential effect of environment upon migrant PA participation compared to those born in the host country. Access to PA facilities has been reported to be one of the strongest environmental predictors of PA participation (Trost et al., 2002). This was also the case in the current study with between 37% and 72% of respondents indicating that distance to a park, playground or walking/running/cycling tracks influenced their participation in PA. However, there was only a difference between the migrant groups and the Australian-born reference population in relation to the distance to a playground, with the migrant groups perceiving this to be more important. Affordability of facilities was significantly more likely to be a barrier for Italian-born respondents than for the other groups. Perceptions of security while participating in PA is often thought to be a factor affecting PA participation although only a weak association has been reported in the literature between neighbourhood safety and PA participation (Trost et al., 2002). In the current study a high proportion of respondents (up to 79.4%) reported a fear of crime was an important determinant of their PA behavior and importantly there was a significant difference between the responses of the migrant groups and the Australian-born reference group; with fear of crime being reported up to twice as often in the migrant groups. Other areas in which the migrant groups indicated that the environment was more important than the reference group included: adequacy of street lighting, air quality, cleanliness, fear of dogs, presence of other people around, fear of traffic and type of terrain. In general, these data reflect the greater importance of environment to the migrant groups than for the reference population, and this was particularly the case for the Italian migrants. Institutional As discussed with regard to interpersonal factors above, there was a key difference between the groups when it came to their perception as to whether family friendly PA facilities were available. The preference of migrant groups to undertake PA as a family group needs to be recognized by those responsible for facility planning and management.

36
All groups reported a strong preference for friendly and smoke free facilities. However, a much lower proportion of the respondents indicated strong influence of Sunsmart practices or the responsible serving of alcohol. Public policy As discussed under institutional factors above, all groups reported a strong preference for friendly and smoke free facilities, but were much less influenced by policies regarding Sunsmart practices and the responsible serving of alcohol. There was modest-strong support for government to subsidize the cost of PA participation, and this was greatest in the migrant groups. This finding is in line with that reported by Dassanayake (2009) in a qualitative study,.However, in contrast to the findings of Dassanayake (2009), there was only modest support in all groups for media PA promotion campaigns to be tailored to reflect the interests of particular ethnic groups.
37
5 Conclusion and Recommendations This report has identified a large range of barriers and facilitators to participation in PA by the selected migrant groups in comparison to the Australian-born reference group. In general, most of these barriers and facilitators were similar for all of the migrant groups, although some differences were observed between the migrant groups. The key intrapersonal barriers and facilitators identified included: lack of knowledge of the role of PA in achieving and maintaining good health; negative attitude towards PA; poor levels of self-efficacy and self perception. As expected, difficulty in speaking English was also reported as a barrier to participation in PA. Interpersonal barriers included specific issues regarding culturally-related expectations and religious rules about clothing and PA participation. A key interpersonal facilitator was participation with family members along with support from family and friends to participate in PA. Environmental barriers included distance to recreational facilities, fear of crime and concerns about safety in general while participating in PA. Public policy factors that were perceived to support PA participation by migrant groups included access to subsidised facilities and the provision of Smokefree facilities. Importantly, policies related to provision of Sunsmart settings and having settings governed by Responsible Serving of Alcohol were not perceived as major facilitators to participation in PA. The report also explored the level of PA, physical health and mental health of the groups. No significant differences were found between the overall level of PA undertaken by the various groups and the level of PA reported was similar to that observed in other studies. With regard to the setting and intensity of PA, there were a number of indicative but non-significant differences between the patterns of PA in the four cohorts. However, the most striking and potentially important finding was a significant difference in the level of vigorous recreational PA, with the Australian-born respondents reporting substantially higher levels than the migrant groups. The mental health status as measured by the Mental Component Score of the SF-12 questionnaire was also similar in all groups. In contrast, physical health as assessed by the Physical Component Score of the SF-12 was substantially and clinically lower in the Italian group when compared to the other migrant groups and the Australian-born reference sample. A significant relationship was observed between the Physical Component Score and the extent of vigorous leisure activities in particular, which in turn was shown to be significantly lower among the migrant groups than the Australian born cohort. Many significant and substantive differences were found in this study between the three migrant groups and the Australian-born reference sample, ranging across all dimensions of the socio-ecological model. The findings of the study will provide guidance to practitioners developing interventions within particular migrant communities. The findings reinforce the importance of using a broad range of strategies which take account of all elements of the socio-ecological model. Other less pronounced but nevertheless important potential differences and relationships were indicated in the results of the study, but were not found to be statistically significant in light of sample size shortfalls, particularly in the Lebanese community. It is recommended that: • pilot intervention programs to promote participation in physical activity based on the key
findings of this study should be developed and implemented in the Italian and Sri Lankan communities; and
• this study should be supplemented by a follow-up study employing different recruitment strategies to enable larger representative samples to be obtained, especially in the Lebanese community.

38
REFERENCES Australian Bureau of Statistics. (1997). National Health Survey Australia, 1995: SF-36 population
norms. Canberra, Australian Government Publishing Service.
Australian Bureau of Statistics (2007). Basic Community Profile. 2006 Community Profile Series: Melbourne (Statistical Division). Cat. No. 2001.0. Accessed from www.abs.gov.au 23 March 2009.
Australian Institute of Health and Welfare. (2003). The Active Australia Survey: A guide and manual for implementation, analysis and reporting. Canberra: AIHW.
Australian Institute of Health and Welfare. (2004). Australia’s Health 2004. Canberra: AIHW.
Australian Institute of Health and Welfare (2010). Australia’s health 2010. Australia’s health series no. 12. Cat. no. AUS 122. Canberra: AIHW.
Australian Institute of Health and Welfare and National Heart Foundation of Australia. (2004). The relationship between overweight, obesity and cardiovascular disease. AIHW Cat. No. CVD 29. Canberra: AIHW (Cardiovascular Disease Series No. 23).
Australian Centre for Diabetes Strategies. (2001). National Evidenced Based Guidelines for the Management of Type 2 Diabetes Mellitus. Sydney: Prince of Wales Hospital.
Belza, B., Walwick, J.,Thornton, S., Schwartz, S., Taylor, M. and LoGerfo, J. (2004). Older adult perspectives on physical activity and exercise: voices from multiple cultures. Prevention of Chronic Disease, 1, 9.
Bennett, S. (1993). Inequalities in risk factors and cardiovascular mortality among Australia's immigrants. Australian and New Zealand Journal of Public Health, 17, 251-61.
Bennett, S. (1995). Cardiovascular risk factors in Australia: Trends in socioeconomic inequalities. Journal of Epidemiology and Community Health, 49, 363–372.
Booth, M.L., Owen, N., Bauman, A., Clavisi, O. and Leslie E. (2000). Social–cognitive and perceived environment influences associated with physical activity in older Australians. Preventive Medicine 31, 15–22. doi:10.1006/pmed.2000.0661 [cited 2011 January 31]. Available online at http://www.idealibrary.com
Craig CL, Marshall AL, Sjostrom M, Bauman A, Booth ML, Ainsworth BE, et al. (2003). International Physical Activity Questionnaire: 12-country reliability and validity. Med Sci Sports Exerc 35,1381-95.
Chau, J. (2007). Physical Activity and Building Stronger Communities: CPAH07-001. NSW Centre for Physical activity and Health, Sydney.
Dassanayake, J. (2009). Physical Activity Patterns and Cardiovascular Disease Risk among Immigrants in Australia. Unpublished doctoral thesis, Melbourne: The University of Melbourne.
Dassanayake, J., Gurrin, L., Payne, W.R., Sundararajan, V. and Dharmage, S.C. (2010). Cardiovascular disease risk of immigrants: What is the evidence and where are the gaps? Asia-Pacific Journal of Public Health. Dec 15, 2010 (Epub ahead of print).
Dassanayake, J., Gurrin, L., Sundararajan, V., Dharmage, S. and Payne, W.R. Are Australian immigrants at risk of being physically inactive? International Journal of Behavioral Nutrition and Physical Activity. (In Press).
Dunstan, D., Zimmet, P., Welborn, T., Sicree, R., Armstrong,T., Atkins, R., Cameron, A., Shaw, J., and Chadban, S. on behalf of the AusDiab Steering Committee. (2001). Diabesity & Associated Disorders in Australia – 2000. The Accelerating Epidemic. The Australian Diabetes, Obesity and Lifestyle Study (AusDiab). Melbourne: International Diabetes Institute.
Eime, R M., Harvey, J T., Brown, W.J. and Payne, W R. (2010). Club sport: Contributing to health-related quality of life? Medicine and Science in Sports and Exercise, 42(5), 1022-1028.

39
Evenson, K. and Ayala, G. (2004). Acculturation and physical activity among North Carolina Latina immigrants. Soc Sci Med, 59(12), 2509-2522.
Farooqi, A., Nagra, D., Edgar, T. et al. (2000). Attitude to lifestyle risk factors for coronary heart disease among south Asians in Leicester: focus group study. Family Practice, 17, 293-297.
Feskens, E.J., and Dam, R.M. (1999). Dietary fat and aetiology of Type 2 diabetes: an epidemiology perspective. Nutrition, Metabolism and Cardiovascular Health, 9, 87-95.
Forsen, L., Loland, N.W., Vuillemin, A., Chinapaw, M.J.M., van Poppel, M.N.M., Mokkink, L.B., van Mechelen, W. and Terwee, C.B. (2010). Self-Administered Physical Activity Questionnaires for the Elderly: A Systematic Review of Measurement Properties. Sports Medicine, 40(7), 601-623.
Graff-Iversen, S., Anderssen, S.A., Holme, I.M, Jenum, A.K. and Raastad, T. (2007). An adapted version of the long International Physical Activity Questionnaire (IPAQ-L): construct validity in a low-income, multiethnic population study from Oslo, Norway. International Journal of Behavioral Nutrition and Physical Activity, 4(13) doi:10.1186/1479-5868-4-13
Gupita, R. (1997). Epidemiological evolution and rise of coronary heart disease in India. South Asian Journal of Preventive Cardiology, 1, 14-20.
Harvey, J.T., Payne, W.R. and Eime, R. Effectiveness of the 2006 Commonwealth Games 10,000 Steps Walking Challenge. In press. Med Sci Sports Exerc..
Hus-Hage, B. and Walqvst, M. (1993). Cardiovascular risk in adult Melbourne Chinese. Australian and New Zealand Journal of Public Health, 17, 306-313.
International Physical Activity Questionnaire. (2005). Guidelines for the Data Processing and Analysis of the International Physical Activity Questionnaire (IPAQ) – Short and Long Forms. November 2005. [cited 2011 February 1]. Available from http://www.ipaq.ki.se/scoring.htm
Ireland, P. and Giles, G. (1996). Blood pressure in the Australian-and Italian-born: a Melbourne suburb revisited after 20 years. Australian and New Zealand Journal of Public Health, 20, 143-148.
Kliewer, E. J. (1997). Immigrant health and the use of medical services: results from the longitudinal survey of immigrants to Australia, Australian National University, Canberra.
Lee C, Ed. (2001). Women's Health Australia: What do we know? What do we need to know? Brisbane, Australia, Australian Academic Press.
Lee, C. and A. Russell (2002). Effects of physical activity on emotional well-being among older Australian women cross-sectional and longitudinal analyses. Journal of Psychosomatic Research, 54, 155-160.
Lindstrom, M. and Sundquist, J. (2001). Immigration and leisure-time physical inactivity: a population-based study. Ethnic Health, 6, 77-85.
Lopez, A.D., Mathers, C.D., Ezzati, M., Jamison, D.T. and Murray, C.J.L. (2006). Global and regional burden of disease and risk factors, 2001: systematic analysis of population health data. Lancet, 367(17),1747–57.
McLeroy, K. R., Bibeau, D., Steckler, A. and Glanz, K. (1988). An ecological perspective on health promotion programs. Health Education Quarterly, 15, 351–377.
Murray, C. J., Lopez A.D. (1997). Global mortality, disability, and the contribution of risk factors: Global Burden of Disease Study. Lancet, 349, 1436-42.
Napolitano, M. and Marcus, B. H. (2000). Breaking barriers to increased physical activity. The Physician and Sports Medicine, 28, 88–93.
Payne, W., Harvey, J., Eime, R., Symons, C. and Craike, M. (2010). Relationships between different self-report measures of physical activity. Journal of Science and Medicine in Sport. 13(6) (Suppl.) 97.
Ramachandran, A., Snehalatha, C., Latha, E., Manoharan, M. and Vijaya, V. (1999). Impacts of urbanisation on the lifestyle and on the prevalence of diabetes in native Asian Indian population. Diabetes Research Clinical Practice, 44, 207-13.

40
Reddy, K. S. (2002). Cardiovascular disease in the developing countries: dimension, determinants, dynamics and direction for public health action. Public Health Nutrition, 5, 231-237.
Rissam, H. S., Kishore, S. and Trehan, N. (2001). Coronary artery disease in young Indians: The missing link. Journal of the Indian Academy of Clinical Medicine, 2, 128-132.
Rissel, C. and Russel, C. (1993). Heart disease risk factors in the Vietnamese community of south western Sydney. Australian and New Zealand Journal of Public Health, 17, 71-73.
Sallis, J.F., and Owen, N. (2002). Ecological models of health behavior. pp. 462-484. In K. Glanz, B.K. Rimer, and F.M. Lewis (Eds.), Health Behavior and Health Education: Theory, Research, and Practice, third edition. San Francisco: Jossey-Bass.
Sallis, J.F. and Saelens, B.E. (2000). Assessment of physical activity by self reports: Status, limitations, and future directions. Res Q Exerc Sport, 71,1-14.
Syed, A. A., Irving, J. A., Redfern, C. P., Hall, A. G., Unwin, N. C., White, M., Bhopal, R. S., Alberti, K. G. and Weaver, J. U. (2004). Low prevalence of the N363S polymorphism of the glucocorticoid receptor in South Asians living in the United Kingdom. Journal of Clinical Endocrinology and Metabolism, 89, 232-5.
Tremblay, M. S., Bryan, S.N., Perez, C.E., Arden, C.I. and Katzmarzyk, P.T. (2006). Physical activity and immigrant status: Evidence from the Canadian Community Health Survey. Canadian Journal of Public Health, 97, 277-282.
Trost, S.G., Owen, N., Bauman, A.E., Sallis, J.F. and Brown W. (2002). Correlates of adults’ participation in physical activity: Review and update. Medicine and Science in Sports and Exercise, 34, 1996–2001.
United States Department of Health and Human Services (USDHHS). (1999). The link between physical activity and morbidity and mortality. Atlanta: USDHHS, Center for Disease Control and Prevention, and the National Center for Chronic Disease Prevention and Health Promotion.
van Poppel, M.N.M., Chinapaw, M.J.M., Mokkink, L.B., van Mechelen, W. and Terwee, C.B. (2010). Physical Activity Questionnaires for Adults: A Systematic Review of Measurement Properties. Sports Medicine, 40(7), 565-600.
Victorian Multicultural Commission. (2007). Victorian Community Profiles: 2006 Census. Italy-born. [cited 2009 March 3]. Available from www.multicultural.vic.gov.au.
Victorian Multicultural Commission. (2007). Victorian Community Profiles: 2006 Census. Lebanon-born. [cited 2009 March 3]. Available from www.multicultural.vic.gov.au.
Victorian Multicultural Commission. (2007). Victorian Community Profiles: 2006 Census. Sri Lanka-born. [cited 2009 March 3]. Available from www.multicultural.vic.gov.au.
Victorian Population Health Survey 2006. Department of Human Services, Victoria, 2006.
Ware, J.E.Jr., Kosinski, M.A., Turner-Bowker, D.M. and Gandek, B. (2002) SF-12v2™: How to Score Version 2 of the SF-12® Health Survey Lincoln, RI: QualityMetric Inc.
Wilson, A., Bekiaris, J., Wise, M. and Hawe, P. (1993). The good heart, good life survey. self reported cardiovascular disease risk factor, health knowledge and attitudes among Greek Australians in Sydney. Australian and New Zealand Journal of Public Health, 17, 215-221.
World Health Organization (WHO). (2003). Social determinants of health: the solid facts. Geneva: WHO.

41
ATTACHMENTS

42

1
Attachment 1.
Immigrant Physical Activity Study
Survey of Physical Activity
PLEASE READ THE ENCLOSED INFORMATION SHEET BEFORE PROCEEDING Please answer the questions by placing a cross (X) in the appropriate box or by writing in numbers or
comments where appropriate.
SECTION A. PHYSICAL ACTIVITY The first set of questions is about all the kinds of physical activities that people do as part of their everyday lives. Please think about the activities you do at work, as part of your house and garden/yard work, to get from place to place, and in your spare time for recreation, exercise or sport. 1. In general, how physically active would you say you are? (Please cross one box)
Not at all A bit Moderately Very Extremely
2. If you were not born in Australia, how physically active would you say you were before you emigrated to Australia? (Please cross one box)
I was born in Australia Skip to Question3 Not at all A bit Moderately Very Extremely
The following questions will ask you about the time you spent being physically active in the last 7 days. Please answer each question even if you do not consider yourself to be an active person. We know that some weeks you might be more active than others. We would still like you to tell us about the physical activity you did in the last 7 days. 3. Thinking about how much physical activity you did in the last 7 days, was this a typical week
for you? (Please cross one box)
Yes No, I am usually MORE active No, I am usually LESS active In answering the following Parts A1-A5, think about all the vigorous and moderate activities that you did in the last 7 days. Vigorous physical activities refer to activities that take hard physical effort and make you breathe much harder than normal. Moderate activities refer to activities that take moderate physical effort and make you breathe somewhat harder than normal. PART A1: JOB-RELATED PHYSICAL ACTIVITY This first part is about your work. This includes paid jobs, farming, volunteer work, study, and any other unpaid work that you did outside your home. Do not include unpaid work you might do around your home, like housework, garden/yard work, general maintenance, and caring for your family. These are asked in Part A3. Throughout this section of the survey form, whenever a question does not apply to you, cross the “No” box and then skip to the next relevant question or section as instructed. 1. Do you currently have a job or do any unpaid work outside your home?
Yes No If No Skip to Part A2 TRANSPORTATION
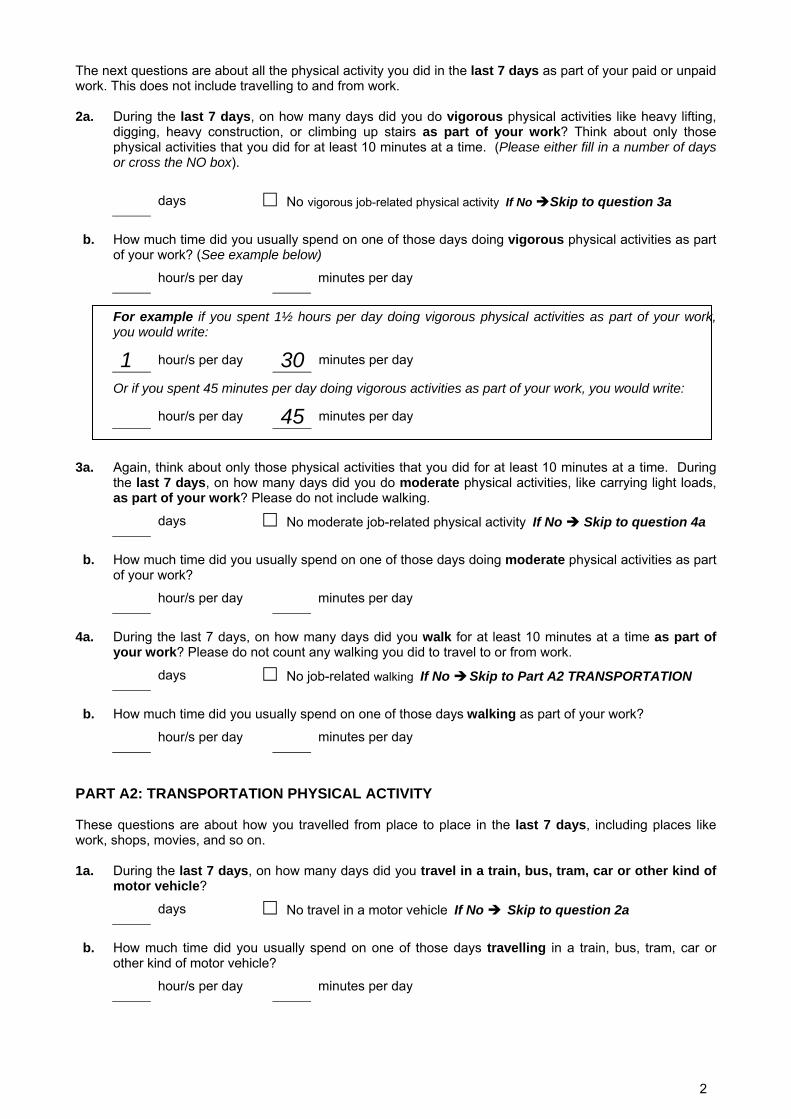
2
The next questions are about all the physical activity you did in the last 7 days as part of your paid or unpaid work. This does not include travelling to and from work. 2a. During the last 7 days, on how many days did you do vigorous physical activities like heavy lifting,
digging, heavy construction, or climbing up stairs as part of your work? Think about only those physical activities that you did for at least 10 minutes at a time. (Please either fill in a number of days or cross the NO box).
days No vigorous job-related physical activity If No Skip to question 3a
b. How much time did you usually spend on one of those days doing vigorous physical activities as part
of your work? (See example below) hour/s per day minutes per day
For example if you spent 1½ hours per day doing vigorous physical activities as part of your work, you would write:
1 hour/s per day 30 minutes per day
Or if you spent 45 minutes per day doing vigorous activities as part of your work, you would write:
hour/s per day 45 minutes per day 3a. Again, think about only those physical activities that you did for at least 10 minutes at a time. During
the last 7 days, on how many days did you do moderate physical activities, like carrying light loads, as part of your work? Please do not include walking. days No moderate job-related physical activity If No Skip to question 4a
b. How much time did you usually spend on one of those days doing moderate physical activities as part
of your work? hour/s per day minutes per day
4a. During the last 7 days, on how many days did you walk for at least 10 minutes at a time as part of
your work? Please do not count any walking you did to travel to or from work. days No job-related walking If No Skip to Part A2 TRANSPORTATION
b. How much time did you usually spend on one of those days walking as part of your work?
hour/s per day minutes per day
PART A2: TRANSPORTATION PHYSICAL ACTIVITY These questions are about how you travelled from place to place in the last 7 days, including places like work, shops, movies, and so on. 1a. During the last 7 days, on how many days did you travel in a train, bus, tram, car or other kind of
motor vehicle? days No travel in a motor vehicle If No Skip to question 2a
b. How much time did you usually spend on one of those days travelling in a train, bus, tram, car or
other kind of motor vehicle? hour/s per day minutes per day

3
Now think only about the bicycling and walking you might have done to travel to and from work, to do errands, or to go from place to place. 2a. During the last 7 days, on how many days did you bicycle for at least 10 minutes at a time to go from
place to place? days No bicycling from place to place If No Skip to question 3a
b. How much time did you usually spend on one of those days bicycling from place to place?
hour/s per day minutes per day
3a. During the last 7 days, on how many days did you walk for at least 10 minutes at a time to go from
place to place? days No walking from place to place If No Skip to PART A3 HOUSEWORK
b. How much time did you usually spend on one of those days walking from place to place?
hour/s per day minutes per day
PART A3: HOUSEWORK, HOUSE MAINTENANCE AND CARING FOR FAMILY This section is about some of the physical activities you might have done in the last 7 days in and around your home, like housework, gardening, yard work, general maintenance work, and caring for your family. 1a. Think about only those physical activities that you did for at least 10 minutes at a time. During the last
7 days, on how many days did you do vigorous physical activities like heavy lifting, chopping wood or digging in the garden or yard? days No vigorous activity in garden or yard If No Skip to Question 2a
b. How much time did you usually spend on one of those days doing vigorous physical activities in the
garden or yard? hour/s per day minutes per day
2a. Again, think about only those physical activities that you did for at least 10 minutes at a time. During
the last 7 days, on how many days did you do moderate physical activities like carrying light loads, sweeping, washing windows, and raking in the garden or yard? days No moderate activity in garden or yard If No Skip to Question 3a
b. How much time did you usually spend on one of those days doing moderate physical activities in the
garden or yard? hour/s per day minutes per day
3a. Once again, think about only those physical activities that you did for at least 10 minutes at a time.
During the last 7 days, on how many days did you do moderate physical activities like carrying light loads, washing windows, scrubbing floors and sweeping inside your home? days No moderate activity inside home If No Skip to Part A4 RECREATION
b. How much time did you usually spend on one of those days doing moderate physical activities inside
your home? hour/s per day minutes per day

4
PART A4: RECREATION, SPORT, AND LEISURE-TIME PHYSICAL ACTIVITY This section is about all the physical activities that you did in the last 7 days solely for recreation, sport, exercise or leisure. Please do not include any activities you have already mentioned. 1a. Not counting any walking you have already mentioned, during the last 7 days, on how many days did
you walk for at least 10 minutes at a time in your leisure time? days No walking in leisure time If No Skip to Question 2a
b. How much time did you usually spend on one of those days walking in your leisure time?
hour/s per day minutes per day
2a. Think about only those physical activities that you did for at least 10 minutes at a time. During the last
7 days, on how many days did you do vigorous physical activities like aerobics, running, fast bicycling, or fast swimming in your leisure time? days No vigorous activity in leisure time If No Skip to Question 3a
b. How much time did you usually spend on one of those days doing vigorous physical activities in your
leisure time? hour/s per day minutes per day
3a. Again, think about only those physical activities that you did for at least 10 minutes at a time. During
the last 7 days, on how many days did you do moderate physical activities like bicycling at a moderate pace, swimming at a moderate pace, or doubles tennis in your leisure time? days No moderate activity in leisure time If No Skip to Part A5 SITTING
b. How much time did you usually spend on one of those days doing moderate physical activities in your
leisure time? hour/s per day minutes per day
PART A5: TIME SPENT SITTING These questions are about the time you spend sitting, while at work, at home, while doing study and during leisure time. This may include time spent sitting at a desk, visiting friends, reading or sitting or lying down to watch television. Do not include any time spent sitting in a train, bus, tram, car or other kind of motor vehicle that you have already mentioned. 1. During the last 7 days, on a weekday how much time did you usually spend sitting?
hour/s per day minutes per day
2. During the last 7 days, on a weekend day how much time did you usually spend sitting?
hour/s per day minutes per day

5
PART A6. TYPES OF RECREATION, SPORT, AND LEISURE-TIME PHYSICAL ACTIVITY
1. Have you ever been a member of a fitness centre or an active member of a sports club? (Please cross ANY which apply)
Fitness
centre Sports club
I am currently a member I used to be a member (not in Australia) I used to be a member (in Australia) I have never been a member
2. This question is about the particular types of recreation, sport and leisure-time physical activity that you GENERALLY participate in (at any time in the LAST 12 MONTHS). For each sport and physical activity listed, please indicate whether or not you have participated in it in the last 12 months. There is space for you to add up to two sports and two physical activities if your preferred sports or physical activities are not on the list.
Sports Yes No Physical Activities Yes No
Athletics Aerobics Australian Rules Football Cycling Basketball Dancing Bocce Jogging / running Cricket Karate / martial arts / judo / boxing Bowls Stationary exercises (treadmill, cycle) Golf Surfing / boogie boarding Hockey Swimming Netball Walking Football (Soccer) Weights / circuit training Swimming (competitive) Tennis Volleyball Other sports (specify) Other physical activities (specify) 1. …………………………… 1.
………………………………………… 2. …………………………… 2.
…………………………………………

6
SECTION B. FACTORS THAT INFLUENCE PARTICIPATION IN PHYSICAL ACTIVITY
1. The following is a list of possible environmental factors IN YOUR NEIGHBOURHOOD, good and bad, that might influence whether or not you are physically active outdoors. For each one, indicate whether it has an influence, either positive or negative, on your level of physical activity. (Please cross one box on each line) Please note that some of these factors may have either a positive or negative influence in your particular neighbourhood. For example, if there is a park close by, then “distance to a park” may have a positive influence on you, but if there is no park close by, then “distance to a park” may have a negative influence on you.
Positive
influence Negative influence
Little or no influence
Adequacy of street lighting Air quality Bicycle lanes on roads Cleanliness of the neighbourhood Distance to a park Distance to a playground Distance to a walking/running/cycling track Distance to shops Fear of dogs Fear of crime Presence of other people around Quality of footpaths / walking surfaces Quality of scenery Fear of traffic Type of terrain (e.g. not too hilly) Other (Please specify) …………………………………
2. What types of transport do you use. (Please cross ANY boxes which apply)
Drive a car
Passenger in car
Taxi
Bus
Train Tram
Bicycle
Walk Other (please specify) ……………………………………..…
3. What one type of transport do you use MOST OFTEN. (Please cross ONLY ONE box)
Drive a car
Passenger in car
Taxi
Bus
Train Tram
Bicycle
Walk Other (please specify) ……………………………………..…

7
4. For each of the following types of facilities, indicate whether you have convenient ACCESS to it , and for those which involve a cost, whether you can AFFORD it. (Please cross one box on each line for ACCESS and one box for COST where appropriate) ACCESS COST
I do not know
where it is
I cannot easily get
there
I can easily get
there
I do not know
what it costs
I cannot afford it
I can afford it
Aerobic dance studio / dance school Fitness centre / gym Golf course Martial arts studio Swimming pool Courts (e.g. netball, tennis, basketball) Playing field (e.g. football, soccer, softball) Athletics track Beach Park, playground Walking/running/cycling tracks
5. Do each of the following characteristics influence you to participate in a fitness centre or sports
club? (Please cross one box on each line). Please answer this question even if you do not participate in a sports club or fitness centre. If you do not participate, think about what might influence you if you did participate or wanted to participate.
No
influence Some
influence Don’t know
Access to information about facilities and programs Family-friendly facilities and services Knowing someone at a centre or club Friendliness of reception staff Friendliness of the coach or instructor Skill and/or experience of the coach or instructor The centre or club is smokefree The centre or club has Sunsmart practices The centre or club is friendly The centre or club is responsible in the serving of alcohol The centre or club has injury prevention strategies in place The centre or club has healthy food options available The day/time of competition/practice sessions
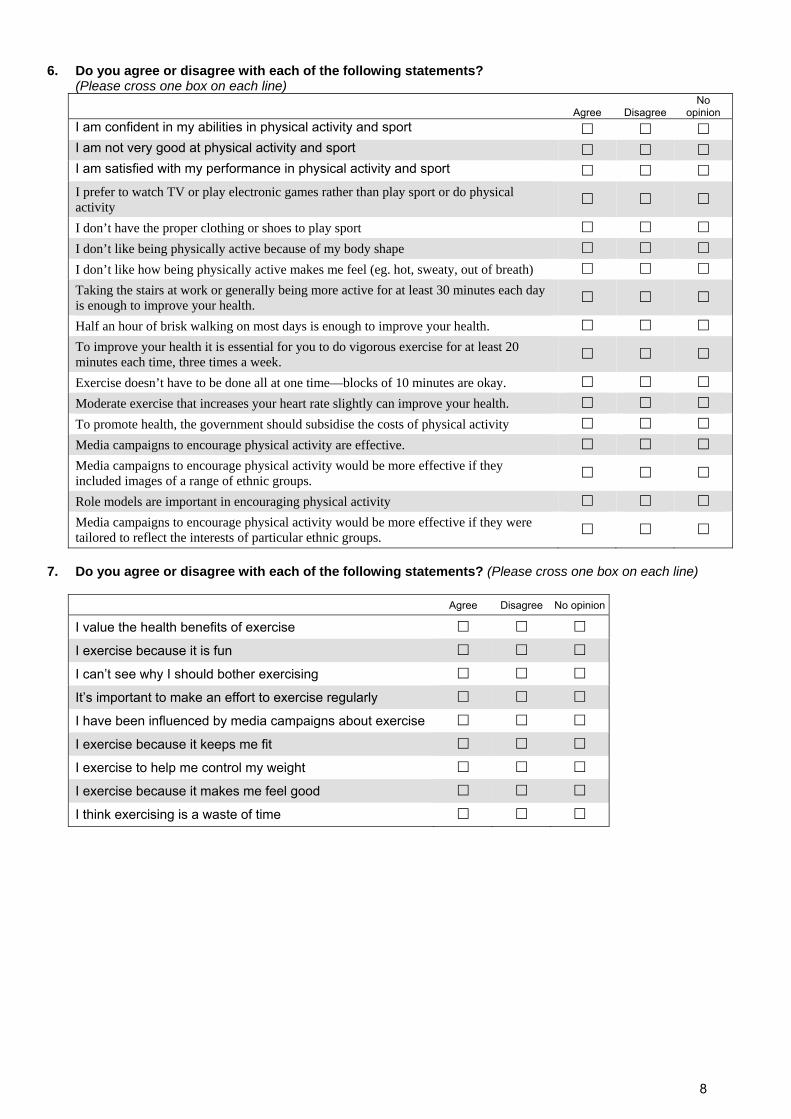
8
6. Do you agree or disagree with each of the following statements? (Please cross one box on each line)
Agree Disagree No
opinion I am confident in my abilities in physical activity and sport I am not very good at physical activity and sport I am satisfied with my performance in physical activity and sport I prefer to watch TV or play electronic games rather than play sport or do physical activity
I don’t have the proper clothing or shoes to play sport I don’t like being physically active because of my body shape I don’t like how being physically active makes me feel (eg. hot, sweaty, out of breath) Taking the stairs at work or generally being more active for at least 30 minutes each day is enough to improve your health.
Half an hour of brisk walking on most days is enough to improve your health. To improve your health it is essential for you to do vigorous exercise for at least 20 minutes each time, three times a week.
Exercise doesn’t have to be done all at one time—blocks of 10 minutes are okay. Moderate exercise that increases your heart rate slightly can improve your health. To promote health, the government should subsidise the costs of physical activity Media campaigns to encourage physical activity are effective. Media campaigns to encourage physical activity would be more effective if they included images of a range of ethnic groups.
Role models are important in encouraging physical activity Media campaigns to encourage physical activity would be more effective if they were tailored to reflect the interests of particular ethnic groups.
7. Do you agree or disagree with each of the following statements? (Please cross one box on each line)
Agree Disagree No opinion
I value the health benefits of exercise I exercise because it is fun I can’t see why I should bother exercising It’s important to make an effort to exercise regularly I have been influenced by media campaigns about exercise I exercise because it keeps me fit I exercise to help me control my weight I exercise because it makes me feel good I think exercising is a waste of time

9
8. Do members of your household (for example your husband, wife, partner, child, parent or other relative) … (Please cross one box on each line)
Never Sometimes Often
Encourage you to do physical activities or sport? Put pressure on you to exercise? Do physical activity or play sport with you? Watch you participate in physical activities or sports? Tell you that you are doing well in physical activities or sports?
9. Do your friends … (Please cross one box on each line)
Never Sometimes Often
Encourage you to do physical activities or sport? Put pressure on you to exercise? Do physical activity or play sport with you? Watch you participate in physical activities or sports? Tell you that you are doing well in physical activities or sports?
10. How confident are you that can maintain your sporting and other physical activities when
circumstances are not ideal? Indicate for each situation how confident you are. (Please cross one box on each line) How confident are you? Situation Not at all Slightly Moderately Very Extremely
When you are tired When you are in a bad mood When you feel you don’t have time When you are on vacation When it is raining

10
11. When you participate in sport or physical activity (or if you were to participate) do any of the following issues arise (or are they likely to arise)? (Please cross one box on each line)
Yes, likely
No, not likely
Don’t know
Conflict with cultural expectations or beliefs Conflict with religious rules, beliefs or expectations Conflict with rules about clothes that should be worn Cost of participation (e.g. Buying equipment, hiring facilities) Difficulties with language (e.g. do not understand English well enough) Difficulty finding someone to participate with Feeling tired or lacking energy Having injuries, disabilities or illnesses Lack of family-friendly facilities Lack of information about programs or facilities Lack of programs or facilities Lack of time due to home and family responsibilities Lack of time due to other leisure activities (e.g. other interests, socialising) Lack of time due to study Lack of time due to work outside the home Transport difficulties Not being fit or strong enough Not having enough skills in physical activities Rules about males and females participating together Self consciousness about my looks when I exercise Unpleasant weather (hot, cold, rainy)
12. Can you name or describe any media campaigns (current or past) encouraging physical activity?
No Please skip to Question 13 Yes Name(s) or description(s) of campaign(s) …………………………………………………...……….
…………………………………………………………………………………………………………………..
13. How satisfied are you with your overall level of physical activity? (Please cross one box)
I am satisfied Skip to Section C HEALTH AND WELLBEING I probably should exercise more
I would like to exercise more
14. If you could change ONE THING to help you increase your level of physical activity, what would it
be?
……………………………………………………………………………………………………………………………… ………………………………………………………………………………………………………………………………

11
SECTION C. HEALTH AND WELLBEING The next group of questions is about your physical and emotional health and wellbeing.
1. In general, would you say your health is…
Excellent Very Good Good Fair Poor 2. The following questions are about activities you might do during a typical day. Does your
health now limit you in these activities? If so, how much?
a. Moderate activities such as moving a table, pushing a vacuum cleaner, bowling or playing golf.
Yes, limited a lot Yes, limited a little No, not limited at all
b. Climbing several flights of stairs.
Yes, limited a lot Yes, limited a little No, not limited at all 3. During the past 4 weeks, how much of the time have you had any of the following problems
with your work or other regular daily activities as a result of your physical health?
All of the
time Most of the time
Some of the time
A little of the time
None of the time
a. Accomplished less than you would like b. Were limited in the kind of work or other activities
4. During the past 4 weeks, how much of the time have you had any of the following problems with your work or other regular daily activities as a result of any emotional problems (such as feeling depressed or anxious)?
All of the time
Most of the time
Some of the time
A little of the time
None of the time
a. Accomplished less than you would like b. Did work or other activities less carefully than usual
5. During the past 4 weeks, how much did pain interfere with your normal work (including both work outside the home and housework)?
Not at all A little bit Moderately Quite a bit Extremely
6. These questions are about how you feel and how things have been with you during the past 4 weeks. For each question, please give the one answer that comes closest to the way you have been feeling. How much time during the past 4 weeks…
All of the time
Most of the time
Some of the time
A little of the time
None of the time
a. Have you felt calm and peaceful? b. Did you have a lot of energy? c. Have you felt downhearted and depressed?
7. During the past 4 weeks, how much of the time has your physical health or emotional problems
interfered with your social activities (like visiting friends, relatives etc.)? All of the time Most of the time Some of the time A little of the time None of the time

12
8. Do you have any permanent disability? Yes No If YES, please specify:
…………………………..……………………………..……………………………..………………… 9. Do you have, or have you ever been told by a doctor or nurse that you have any of the
following conditions? (Please cross one box on each line) Yes No Not sure
Cardiovascular Angina Heart attack (includes a ‘coronary’, coronary occlusion, coronary thrombosis, myocardial infarction) Stroke High blood pressure Low blood pressure High cholesterol Diabetes Diabetes Risk of diabetes Other Anxiety / depression Muscle/joint/bone conditions Cancer Asthma Food allergy Eczema Hayfever or allergic rhinitis
SECTION D. ABOUT YOU 1. Your age? ….… years 2. Your gender? Male Female
3. What is the postcode of your home address?
If you don’t know the postcode, what is the town/suburb/locality?
………………………………………………. 4. What is your country of birth?
Australia (Skip to Question 6) Italy Lebanon Sri Lanka
5. What year did you arrive in Australia? (Skip to Question 7) 6. Are you an Aboriginal or Torres Straight Islander? Yes No 7. Are any languages other than English spoken at home? Yes No
If YES, main other language …………………… Any other language(s) ……………………

13
8. What is your religion? (Please cross one box)
Buddhist
Christian
Hindu
Jewish
Muslim Other (Please specify)
No religion …………………………..…
9. What is your height (without shoes)? (Estimate if you are not sure) ……… cm OR ……. inches 10. What is your weight (with minimal clothing)? (Estimate if you are not sure) …… kg OR …… pounds If you arrived in Australia as an adult, what was your weight when you arrived in Australia?
(Estimate if you are not sure) ……… kg OR …… pounds 11. Are you on a diet to lose weight?
No, my weight is fine No, but I need to lose weight Yes
12. Do you smoke? Yes No, gave up smoking No, never smoked If YES, how many cigarettes a day on average? ………
13. Which of the following best describes your current living arrangements? (Please cross one box)
Living with your parents
Living with your spouse or partner
Living with your spouse or partner and children
Single parent living with your children
Living with other members of your family (e.g. brother or sister)
Shared accommodation (group of unrelated people)
Living alone
Other - please specify ________________________________________________________ 14. What is the highest level of education you have completed? (Please cross one box)
Did not go to school Trade certificate/apprenticeship or equivalent
Year 10 or below Vocational diploma or equivalent
Year 11 or equivalent University bachelors degree
Year 12 or equivalent University postgraduate degree 15. What is your current employment status? “Employment” includes self-employment. (Please cross
ANY that apply)
Full-time paid employment Unpaid/volunteer work
Part-time paid employment Home duties/homemaker
Casual paid employment Studying
Seeking employment Retired
Not in the paid labour force (e.g. on a disability pension) Other - please specify ________________
If you are currently in paid employment Skip to Question 17. 16. If you are NOT currently in paid employment, have you ever been in paid employment?
Yes No If No Skip to Question 18.

14
17. Which of the following categories does (or did) your main job fall into? (Please cross one box)
Managers Sales workers
Professionals Machinery operators & drivers
Technicians & trades workers Labourers
Community & personal service workers Other (please specify)
Clerical & administrative workers 18. Are you a member of any of the following types of group? (Please cross one on each line)
Yes No
Church group
School group
Professional group
Immigrant community organisation
Other community or action group
That completes our questions! Thank you for taking the time to participate in the survey.
If you have any other comments about issues relating to participation in sport and physical activity, please write them here. If you need more space, please use the following page.
Please post this form to the research team as soon as possible in the
reply-paid envelope provided