Thesis for Masters degree in Organizational Leadership 2.15.13

1
IMMACULATA UNIVERSITY
BUSINESS, FASHION, and LEADERSHIP DEPARTMENT
QUALITY ASSURANCE REPORT Accreditation of Accounting Program
Accreditation Council for Business Schools and Programs (ACBSP)
September 2017

2
Immaculata University 2017 Quality Assurance Report
Accreditation Council for Business Schools and Programs
Table of Contents
Title Page
I Institutional Information 3
II Status Report on Conditions and Notes 4
III Public Information 4
1 Standard 1 Leadership 6
2 Standard 2 Strategic Planning 7
3 Standard 3 Student and Stakeholder Focus 12
4 Standard 4 Measurement and Analysis of Student Learning and Performance
18
5 Standard 5 Faculty and Staff Focus 26
6 Standard 6 Educational and Business Process Management 30

3
Accreditation Council for Business Schools and Programs (ACBSP) Quality Assurance (QA) Report & Accounting Quality Assurance (QA) Report
for Baccalaureate/Graduate Degree Programs
Overview (O) 1. Complete all information requested. Submit your report as an attachment to [email protected] on or before February 15th or September 15th. O 2. Institution Name: Immaculata University Date: September, 2017 Address: 1145 King Road
P.O. Box 724
Immaculata, Pennsylvania 19345-0724 O 3. Year Accredited/Reaffirmed: 2011 This Report Covers Years: 2015-2017 O 4. List All Accredited Programs (as they appear in your catalog):
• Accounting (BS)
• Business Management (BS)
• Finance (BS)
• Human Resource Management (BS)
• Marketing Management (BS)
• Business Administration with Business, Computers and Information Technology and K-12 Certification (BA)
• Accounting (AS)
• Business Administration (AS)
O 5. List all programs that are in your business unit that are not accredited by ACBSP and how you distinguish accurately to the public between programs that have achieved accredited status and those that have not.

4
A Bachelor of Science in Business Leadership degree and a Master of Science in Management and Leadership degree are being
launched in the fall 2017 semester. It is specifically noted that the degrees are not accredited by ACBSP in the catalog and on
the program website.
O 6. List all campuses that a student can earn a business degree from your institution:
Immaculata University – Immaculata, Pennsylvania campus
O 7. Person completing report Name: Elizabeth Faunce, Ph.D., CFP Phone: 610-647-4400 x3431 E-mail address: [email protected]
ACBSP Champion name: Elizabeth Faunce, Ph.D., CFP
ACBSP Co-Champion name: Mark McFadden, Ed.D. O 8. Conditions or Notes to be Addressed: You do not need to address Opportunity for Improvement (OFI).
Please explain and provide the necessary documentation/evidence for addressing each condition or note since your last report.
In this section, information is provided for the Overview Item O 9.
Condition on Overview Item O 9 Describe how you routinely provide reliable information to the public on your performance, including student achievement such as assessment
results and program results.
1. Student Learning Outcome Assessment Results: Such as what you report in standard #4, ETS, MFT, accounting assessment, management
assessment, critical thinking, communication, etc. How do you make the results public?
2. Program Results: Such as what you report in standard #6, graduation rates, retention rates, job placement, etc. How do you make the
results public?
In an effort to be highly transparent and provide reliable information to the public regarding student learning outcome assessment and
program results, the department has posted the 2015 and the 2017 QAR on its website under a tab labeled Accreditation QA Report
5
http://www.immaculata.edu/sites/default/files/file/Academics/Departments/Business%20Accounting%20Economics/ACBSP-
accreditation-QA-Report-2015.pdf?1501516831451.
In addition to the public disclosure on the website, the QAR is routinely shared with the Business Advisory Board (BAB) and the
Student Advisory Board (SAB) during the semester meetings. The reports are reviewed with these stakeholders and their feedback is
then discussed with faculty with appropriate action taken based on the stakeholder feedback.
Data regarding student retention and graduation rates are compared with the overall Immaculata rates in the summary information
provided. On the University website, the student learning outcomes and highlights of results are available at
http://www.immaculata.edu/academics/departments/business. The highlights currently read, “Immaculata Business and Accounting
Program graduates demonstrate particular strengths and knowledge acquisition with regard to Business Ethics, Economics and Business
Integration/Strategic Management as evidenced by external assessment administered by Peregrine Academic Services. Furthermore,
internship supervisors are satisfied with the initiative and preparedness of student interns.”
Removal of this Condition is Requested.
As demonstrated above, the condition related to Overview Item O 9 has been effectively addressed. Removal of this note is
requested.

6
Standard #1 Leadership
Organization a. List any organizational or administrative personnel changes within the business unit since your last report.
Organizational and administrative personnel changes since our last report include the following new leadership:
• Barbara Lettiere, President
• Dr. Angela Tekely, Interim Vice President for Academic Affairs
• Dr. Elizabeth Faunce, Department Chair
Additionally, Immaculata University’s Academic Affairs division underwent a restructuring of its academic departments to reflect
program synergies, undergraduate/graduate linkages, and national best practices. The Business and Accounting department name
has changed to Business, Fashion, and Leadership. The new affiliations provide excellent synergies and opportunities for our
programs from a marketing perspective and enhanced ability to employ and leverage technology solutions. However, while the
departments have merged for administrative convenience, controls have been implemented to ensure the business and accounting
programs maintain their own focus and identity therefore eliminating any confusion regarding the accreditation of specific
programs. These controls include such items as maintaining designated business and accounting faculty; retaining separate business
and accounting program websites; restricting student advising for accredited business programs by designated business and
accounting faculty; etc.
b. List all new sites where students can earn an accredited business degree (international campus, off-campus or on
campus, on-line) that have been added since your last report?
There are no new sites.

7
Standard #2 Strategic Planning
Identify any major changes to the key strategic goals/objectives during this QA reporting period:
New strategic goals and objectives adopted include the following:
Key Strategic Goals/Objectives Any Major Changes Establish and unify the newly aligned business, fashion, and leadership programs as a cohesive, mutually supportive department while maintaining separate focus and identity for the ACBSP accredited programs thereby preventing any confusion regarding the accreditation of specific programs.
As stated above, effective July 1, 2017, Immaculata University Academic Affairs division underwent a restructuring of its academic departments to reflect program synergies, undergrad/grad linkages, and national best practices.
• Evaluate any potential for adding professionals from the fashion industry to the Business Advisory Board and fashion students to the Student Advisory Board.
• Evaluate and if deemed appropriate, seek ACBSP accreditation for BS degree completion program in Business Leadership and MS in Management and Leadership upon conferring initial degrees from those programs.
• Evaluate and consider accreditation options for the Fashion program.

8
2. Report the top 3-5 short/long term strategic goals/objectives, summarize the key measures used and progress toward achieving each objective during the current QA reporting period.
Strategic Objectives Key Measures Progress Toward Achievement Maintain ACBSP Accreditation, academic rigor and vibrant programs by actively seek technology platform for integration to courses, considering links with other departments thereby leveraging cross functional buying power.
• New technology applications integrated into curriculum
Two new major technology initiatives are currently in the process of being integrated into the Business and Accounting curriculum.
• SAP: In July 2017, IU signed an agreement to enter the global SAP University Alliance program that includes 3,200 educational institutions. This agreement allows IU to integrate the latest SAP technologies into the curriculum to prepare students with knowledge and skills for the digital future. Two faculty members were trained in the summer of 2017. A cross functional team including members of IT support, Academic Affairs administration and faculty from various academic departments has been commissioned to ensure the successful implementation and execution of the project. The University will begin integrating learning experiences into curriculum in Fall 2017 for 2 courses with wider curriculum enrichment in 2018-19.
• Bloomberg Market Concepts (BMC): IU has identified a void in technical educational for students pursuing Finance careers. To fill this gap, faculty is pursuing a grant to evaluate the feasibility of integrating Bloomberg into the curricula through the Bloomberg Market Concepts (BMC) training course. One faculty will be certified and BMC will be piloted in the Spring 2018 Finance Investment class.
Implement attractive new programs to contribute to the overall goal of doubling the number of Business and Accounting students.
• New Programs designed, approved and implemented
In consultation with our stakeholders including IU administration, IU alum, the IU Business Advisory Board, adjunct faculty and other business professionals, the Business and Accounting faculty, undertook a degree and curriculum review during the fall 2016

9
semester. The major outcomes of that endeavor were identification of three new program initiatives. Following is a summary of those initiatives and the status of each.
• MS in Management and Leadership: A competitive MS program was developed and received full University approval in May 2017. Marketing and recruiting for Fall 2017 was initiated in July 2017. In addition, a 5th year MS in Management and Leadership will be offered to current traditional students starting in Spring of 2018. Upon successful execution of graduates, the program will be documented in the Fall 2021 QA report and Immaculata will pursue ACBSP accreditation of the program.
• BS in Business Leadership: A BS Leadership competitive program was developed and received full approval at IU in May 2017. Marketing and recruiting for Fall 2017 was initiated in July 2017. Upon successful execution of graduates, the program will be documented in the Fall 2021 QA report and Immaculata will pursue ACBSP accreditation of the program.
• Project management certification: A pilot course in project management is being executed in the Spring 2018 semester to research the feasibility of implementing a Project Management certification course at the University. It is anticipated that the students will prepare for and complete the CAPM examination towards certification as part of the pilot.
Deliver an undergraduate education infused with the combination of liberal arts and career preparation
• Programs implemented The University identified a need to integrate a greater breadth of liberal arts offering within

10
the Business and Accounting Professions studies curriculum.
To facilitate this goal, IU in conjunction with the Southeastern Pennsylvania Consortium for Higher Education (SEPCHE) secured a Teagle Foundation grant. The purpose of this grant is to explore substantive integration of the liberal arts into undergraduate preparation in teacher education, business, and technology. The aim is to deliver integrated courses collaboratively in a hybrid mode as part of the strategy of making the curricular redesign financially sustainable in the long term using a seamless approach.
In 2016-17, IU piloted incorporating elements of the liberal arts curriculum into the internship practicum required of all graduating Business and Accounting students. The TEAGLE Foundation grant enables the department to expand this pilot in more depth to four other core business courses for 2018. For these courses, the Business and Accounting faculty has collaborated with liberal arts faculty to review curriculum and identify, design and imbed programs of study that effectively prepare the liberally educated business professional. The faculty also will collectively devise a consortium rubric to assess institutional proposals for curricular reform.
IU Business and Accounting faculty presented an update on this research entitled “Integrating Liberal Arts and the Professions” as part to the Teaching Excellence track at the ACBSP 2017 Annual Conference on June 26th in Anaheim California.

11
Increase the overall accounting knowledge for all business majors
• Accounting knowledge as measured by the Peregrine assessment for all business majors
Baseline 2014-year assessment for IU Total Accounting Out Bound scores was 46.98; that was below the ACBSP benchmark of 51.51. For 2016 IU results were 51.20 showing significant year-on-year improvement and fast approaching the ACBSP benchmark.
Two major programs were implemented toward achieving this goal included:
• Establishing high accounting instructor professional and academic standards for both full time and adjunct instructors. These standards were achieved 100% for this 2-year reporting period (Note: See Accounting Q&A report for standards).
• Examined curriculum requirements for business non-accounting majors and found inconsistencies regarding the accounting requirements. Curriculum was changed to a two-semester accounting requirement as part of the business core for all non-accounting majors effective with fall 2016 enrollees.
3. If there have been any significant changes to your strategic planning process (for example, new stakeholders, new process steps, etc.) during the QA reporting period, please report them in a table similar to this.
No significant changes have been implemented in the strategic planning process.
Strategic Planning Process Changes Summary

12
NO CHANGES
Standard #3 Student and Stakeholder Focus Complete the following table. Provide three or four examples, reporting what you consider to be the most important data. It is not necessary to provide results for every process. Standard 3 - Student and Stakeholder-Focused Results
Student- and Stakeholder-Focused Results
Student- and stakeholder-focused results examine how well your organization satisfies students and stakeholders key needs and expectations.
Performance
Measurement
Measurement
Instrument or
Process
Current Results
(Successes)
Analysis of
Results
Action Taken or
Improvement
Made
Resulting Trend (s)
Student satisfaction
with advising support
and academic support
services will be
above 3.2 on 5.0
point scale and at or
above the university
average.
Trend analysis will
show continuous
results or
improvement.
CUS and CLL
exit surveys
allow a
comparison of
students in the
department to
all IU students.
Satisfaction with
academic advising
for CUS has
fluctuated since
2010; however,
these figures
remain well above
the 3.2 minimum benchmark
established by the
department.
Survey results for
2013 and 2014
were 4.0 and 4.75,
respectively,
which is slightly
higher than the
2013 and 2014
findings of 3.5
and 4.1.
CUS exit
surveys indicate
an overall
satisfaction in
the academic
advisement
process.
While The College of Life
Long Learning
underwent an
advisement
shift during the
2013/ 2014
academic year,
the stability of
the academic
advisement
services may
account for the
Immaculata
University
incorporated
Ellucian’s
Degree Works
into the
2015/2016
advising process. This
comprehensive
academic
advising and
degree audit
program has
been critical to
providing the
highest possible
advising process
to our students.
Both CUS and
CLL students
have benefit
0.0
1.0
2.0
3.0
4.0
5.0
2012 2013 2014 2015 2016
Like
rt S
cale
Mea
n
Year
CUS Student Satisfaction with Academic Advising
BusinessStudents
All IUStudents

13
Performance
Measurement
Measurement
Instrument or
Process
Current Results
(Successes)
Analysis of
Results
Action Taken or
Improvement
Made
Resulting Trend (s)
Satisfaction with
academic advising
for CLL continues
to meet the
department
benchmark,
spiking to 4.11 in
2015 and then
spiking to 4.63 in 2016.
recent surge in
satisfaction.
greatly from this
new service.
CUS and CLL
Senior
Satisfaction
surveys continue
to highlight
overall
satisfaction with the business
department
advising. The
advising process
continues to
include
developing
course schedules,
reviewing grade
performance,
monitoring early
warning
information on
student progress,
and
encouragement
to use math and
writing centers
and tutoring
services.
Internship employer
survey reflecting
satisfaction with
preparedness of
students on average will be 3.2 or above
on a 5.0 point scale.
Moreover, employer
surveys will reflect
satisfaction with
Survey of
internship
employers
Employer
Satisfaction rating
for student
preparedness
averaged 4.49 on a 5.0 point scale,
with the score at
or above 4.0 for
all semesters since
2011.
While student
initiative and
leadership was
a lagging skill
for IU students prior to 2011,
student
initiative rating
continues to
hovers at
approximately
The department
intentionally
created
assignments and
activities in the practicum course
and dialogue in
didactic
meetings to
address specific
skills such as
0.0
1.0
2.0
3.0
4.0
5.0
2011 2012 2013 2014 2015 2016
Like
rt S
cale
Mea
n
Year
CLL Student Satisfaction with Academic Advising
BusinessStudents
All IUStudents

14
Performance
Measurement
Measurement
Instrument or
Process
Current Results
(Successes)
Analysis of
Results
Action Taken or
Improvement
Made
Resulting Trend (s)
student initiative and
leadership with an
average of 3.2 or
higher on a 5.0 scale.
Employer
satisfaction of
student initiative
and leadership
averaged 4.21 on
a 5.0 point scale,
with the score at
or above 4.0 for
all semesters since 2011.
It should also be
noted that when
asked if the
employer would
hire the IU intern
again, the answer
was yes 94.7% of
the time since
2009.
4.4. This
improved
statistic is likely
a result of the
Leadership
Dynamics
course that is
offered during a
student’s senior year.
In addition,
employer
satisfaction
with student
preparedness
for internships
has a weighted
average of 4.49
since 2009.
student
initiatives and
leadership,
communications
styles, and
problem solving
skills that lagged
in prior years.
The increased focus on these
areas has yielded
impressive
results from IU
business students
during their
internships.

15
Performance
Measurement
Measurement
Instrument or
Process
Current Results
(Successes)
Analysis of
Results
Action Taken or
Improvement
Made
Resulting Trend (s)
Over 50% of
Immaculata
University Business
students will indicate
on exit surveys that
they would
“definitely” or
“probable” choose
Immaculata again (CUS) or would
recommend
Immaculata to others
(CLL).
Overall performance
will be at least on par
with the NSSE peer
group averages.
NSSE data were
collected for 2014
and will be again in
2017.
Surveys of
graduating
students.
National Survey
of Student
Engagement
(NSSE) data is
used to compare IU to small and
large peer
groups as well
as Catholic
Colleges and
Universities.
This transitional
approach
provides
benchmarking
with other
universities
regarding
student
satisfaction in
the Department
of Business and
Accounting.
The number of
CUS business
students that
would
recommend IU
again was 53%
and 55% for 2015
and 2016,
respectfully, slightly above the
department
benchmark and
just below the
2014 NSSE
comparison
school data of
74%.
CLL responses
indicated that
95% of 2015
graduating seniors
and 100% of 2016
seniors would
recommend IU
again.
The percent of
CUS students
that would
recommend
Immaculata
again has
hoovered just
above the
benchmark of 50% for the
past four years.
However, these
figures fall
considerably
below the 2011
and 2012
percentages,
indicating room
for
improvement in
the level of
student
satisfaction.
Immaculata
University
recognizes the
need to improve
student retention
and satisfaction
and continues to
work on areas to
improve social activities.
The Business
Department has
also actively
engaged in social
activities during
2015 and 2016 to
improve student
satisfaction by
increasing
student driven
field trips such
as: the
Constitution
Center,
Philadelphia,
PA, to hear a
0%
20%
40%
60%
80%
100%
2012 2013 2014 2015 2016
Per
cen
t w
ho
res
po
nd
ed "
yes"
Employer Satisfaction
Employers that Would Hire the Intern Again
0
20
40
60
80
100
2011 2012 2013 2014 2015 2016
Per
cen
t w
ho
Exit Survey Year
CUS Students who would recommend Immaculata again
BusinessStudents
All IUStudents

16
Performance
Measurement
Measurement
Instrument or
Process
Current Results
(Successes)
Analysis of
Results
Action Taken or
Improvement
Made
Resulting Trend (s)
debate on the
Constitutionality
of President
Obama’s
Immigration
Policy, and The
Philadelphia
Flyers College
Night. The Business Club,
with the full
support of the
BAB, co-
sponsored
various events
such as Pizza,
Pitch, and a
Panel, a
transition to the
work force
event, and the
Mocktail Social
Networking
Event.
The Business
Department also
began offering a
speaker series on
global
sustainability in
2015 and 2016.
Student engagement
in academically related extra
curricular activities
stays the same or
increases.
Number of
participants in Enactus,
Business Club,
and Student
Advisory Board.
Enactus:
2015 – 26
Participation in
extracurricular activities in 2015
and 2016 remains
at the highest
level since 2008.
Furthermore, the
unique
experiences have
The IU Enactus
Team was recognized as
champions in
their league at
the Regional
Competition in
2015 and 2016
and competed
While the IU
Enactus team has been recognized
on campus for
strong leadership
skills, recent
actions have
been taken to
strengthen and
0%
20%
40%
60%
80%
100%
2011 2012 2013 2014 2015 2016
CLL Students who would recommend Immaculata again
BusinessStudents
All IUStudents

17
Performance
Measurement
Measurement
Instrument or
Process
Current Results
(Successes)
Analysis of
Results
Action Taken or
Improvement
Made
Resulting Trend (s)
2016- 31
Business Club:
2015 – 18
2016 - 22
SAB:
2015- 6
2016- 6
significantly
improved the
student’s ability to
obtain quality
internships and
jobs upon
graduation.
on a National
Level for both
years.
The Business
Club has
retained high
levels of
involvement as a result of the
engaging
activities,
presentations,
and field trips
that are taken
each year.
The SAB
maintains a
membership of
6 students (min)
seeking various
business
degrees.
develop the
leadership skills
for all members
of the team.
Team Leaders
for each service
project have
been identified
for the 2017/2018
academic year.
The Business
Club will
continue to offer
informative and
engaging field
trips and, with
the support of
the BAB, offer
alumni
networking and
speaking events.
Beginning in
2013/2014, a
representative
from the SAB
attends the BAB
meetings to
report their
findings and for
student
representation.
Business Advisory
Board engagement is
demonstrated by
Advisory Board
involvement beyond
Involvement of
board members
as class
speakers,
finding
Highlights of
BAB activities are
summarized in the
right column.
Substantive
The BAB
engagement
remains strong,
with new
members
The Business
Department
continues to
develop the
relationship with
2015/2016
• $7,000 scholarship funded by the BAB and given to four
freshman and/or sophomore students.
0
10
20
30
40
50
60
2012 2013 2014 2015 2016
Number of Academic Activity Involvement Students Student
AdvisoryBoardBusinessClub
Enactus

18
Performance
Measurement
Measurement
Instrument or
Process
Current Results
(Successes)
Analysis of
Results
Action Taken or
Improvement
Made
Resulting Trend (s)
board meetings with
over half of board
engaging outside of
the meeting times.
additional
resources/activit
ies, contributing
to scholarship,
etc.
support of the
university is
evidenced.
joining and
continuing to
encourage the
department, its
programs and
outreach efforts.
BAB members
and leverage
their ideas.
• BAB supported the community outreach program with
East Goshen Township – IU/East Goshen Entrepreneurial
Academy summer camp.
2016/2017
• $5,000 scholarship funded by the BAB and given to three
freshman and/or sophomore students.
• Funded 3 scholarships for low-income high school
students to attend the IU/East Goshen Entrepreneurial
Academy summer camp.
• BAB members initiated a mentoring program for IU
business students.
• Recommended and participated in the Business
Department Curriculum Review
Standard #4 Measurement and Analysis of Student Learning and Performance a. Program Outcomes List outcomes, by accredited program. Many of the program outcomes should be used as part of a student learning assessment plan and be measurable.
Student learning objectives at a high level for all of the bachelor degrees are as follows for Immaculata University programs:
Upon successful completion of the program, students will be able to:
1. Demonstrate knowledge, skills and capabilities essential to the major (accounting, business management, finance, human
resource management, and marketing management, respectively)
2. Understand the balance of theory and practice as it applies to the various sectors of the world of business, accounting, finance,
marketing and economics.
3. Exercise effective interpersonal, communication, and analytical skills.
4. Use technology effectively to enhance productivity on both individual and organizational levels.
5. Use your business skills to make a difference in the world with the highest level of integrity and ethics.
Additional detail by program and delineating definitions for measurement and assessment of these learning objectives follow.
Accounting Major Student Learning Outcomes

19
1. Demonstrate knowledge, skills and capabilities essential to Accounting
a) Create, analyze and evaluate the four basic financial statements (Balance Sheet, Income Statement, Statement of Cash Flows and Statement of Owners Equity).
b) Understand, assess and evaluate internal accounting controls for a company applying Professional Auditing Standards and Practices. Specific skills should include: an ability to develop an audit plan; apply audit sampling techniques to audit plans; demonstrate familiarity with the fundamentals of ACL audit software.
c) Prepare transactions and analyze accounts applying financial and managerial accounting standards and utilizing appropriate terminology. d) Understand and apply accounting transactions for advanced accounting topics including corporate consolidations, partnership accounting, governmental
accounting and international considerations. e) Prepare individual and corporate tax returns including the appropriate research and application of current tax code regulations.
2. Understand the balance of theory and practice as it applies to the various sectors of the world of business, accounting, finance, marketing and economics a) Theory & Practice in Sectors
• Uses appropriate vocabulary
• Articulates the connection between theory and practice
• Assesses market positioning of firms
• Evaluates financial prospects for initiatives or organizations
• Applies knowledge of legal and regulatory dynamics in business decision making
• Examines the macroeconomic impacts on business success • Analyzes business responses to consumer behavior
• Evaluates organizational behavior (structure, management, leadership, culture, etc.)
• Considers and balances variant viewpoints on business issues
• Assesses business potential of emerging technology
• Integrates cross-discipline approach in developing recommendations and solutions
• Reflects on outcomes and performance assessment
• Reflects on personal applications of theories b) Global Awareness
• Knows about relevant current events
• Demonstrates cultural awareness
• Integrates international perspective 3. Exercise effective interpersonal, communication, and analytical skills
a) Effective Communication
• Covers relevant topics in communications
• Conveys ideas clearly
• Organizes ideas effectively • Uses correct written construction (grammar, sentence structure, punctuation)
• Appropriately cites sources
• Writes persuasively
• Maintains effective eye contact
20
• Communicates with confidence b) Effective Interpersonal Skills
• Demonstrates initiative
• Employs active listening and listens critically
• Engages in discussion and dialog
• Contributes to team
• Demonstrates leadership c) Effective Analytical Skills
• Identifies the right problem to be solved
• Evaluates legitimacy and relevance of information and data from multiple sources
• Demonstrates competence in applications of mathematics
• Draws conclusions and inferences
• Interprets statistical and numerical information with competence
• Develops recommendations, alternatives or solutions 4. Use technology effectively to enhance productivity and efficiency on both individual and organizational levels
a) Effective Use of Technology
• Effectively creates Excel spreadsheets with computation functionality and presentation quality
• Develops PowerPoint presentations with content, visual presentation and functionality that complement the oral component
• Creates high quality Word documents and reports with professional elements incorporated
• Locate legitimate academic resources including those from electronic sources 5. Use your business skills to make a difference in the world with the highest level of integrity and ethics
a) Professionalism, Integrity & Ethics
• Dresses appropriately for situation/professional
• Exercises professional demeanor in all modes of communication
• Arrives in timely fashion for commitments
• Maintains positive/ethical approach
• Identifies ethical issues
• Is prepared
b. Performance Results
Complete the following table. Provide three or four examples, reporting what you consider to be the most important data. It is not necessary to provide results for every process.
Assessment of student learning outcomes is presented below incorporating assessment from Peregrine and Capstone Assessments
for our programs.

21
Exhibit 4.1
Student Learning Results (Required for each accredited program, doctorate, masters, and baccalaureate)
Performance Indicator Definition
1. Student Learning Results
A student learning outcome is one that measures a specific competency attainment. Examples of a direct assessment (evidence) of student learning attainment that might be used include: capstone performance, third-party examination, faculty-designed examination, professional performance, licensure examination). Indicate measurement information (Direct, Indirect, Formative, Summative, Internal, External, and Comparative).
Analysis of Results
Performance
Measure
Measurable goal
What is your
goal?
What is your
measurement
instrument or
process?
Do not use
grades.
(Indicate length
of cycle)
Current
Results
What are your
current
results?
Analysis of
Results
What did you
learn from the
results?
Action Taken
or
Improvement
made
What did you
improve or
what is your
next step?
Insert Graphs or Tables of Resulting Trends
(3-5 data points preferred)
IU Outbound test
scores on Peregrine
will be on par with
Peregrine outbound
test scores for peer
institutions.
External
comparative
formative and
summative
assessment. Test
score comparison of Peregrine
outbound testing is
performed in
capstone courses.
As shown in the
chart, IU
outbound
average score
had remained in
line with peer institutions.
There was a dip
in the
2016/2017
results which
are being
investigated and
action plans are
being developed
and
implemented.
In the recent past,
IU was close or
slightly above
peer institutions in
outbound score
results. There was a dip in the most
recent year that
will be examined
in the upcoming
year, noticeably in
the areas of
Operations and
Production
Management,
Information
Management, and
Quantitative
Research.
Faculty
responsible for
specific
business
programs are
reviewing the results by
functional area
and
developing
appropriate
action plans to
improve
scores. IU’s
new
membership in
the SAP
University
Alliance will
better prepare
students for
topics in
Operations and
Production
Management,
48.02
50.7749.79
43.42
48.9 48.9 48.9 48.9
38
40
42
44
46
48
50
52
13/14 14/15 15/16 16/17
Outbound Score
IU Traditional Campus Based

22
Performance
Measure
Measurable goal
What is your
goal?
What is your
measurement
instrument or
process?
Do not use
grades.
(Indicate length
of cycle)
Current
Results
What are your
current
results?
Analysis of
Results
What did you
learn from the
results?
Action Taken
or
Improvement
made
What did you
improve or
what is your
next step?
Insert Graphs or Tables of Resulting Trends
(3-5 data points preferred)
Information
Management,
and
Quantitative Research by
giving students
hands-on and
real life data,
used to make
decisions.
IU Inbound/
Outbound test
difference scores
on Peregrine will
be on par with
Peregrine peer
institutions
External
comparative
formative and
summative
assessment, along
with test score
comparison of
Peregrine testing
performed in IU
cornerstone and
capstone courses.
As
demonstrated by
the graph, the
difference
between IU
inbound and
outbound tests
have generally
remained on par
for three of the
last four years.
There was a dip
in the
2016/2017
results which
are being
investigated and
action plans are
being developed and
implemented.
Aggregate scores
benchmarked
show positive
results in three of
the last four years.
Students
displayed low
scores in the areas
of Operations and
Production
Management,
Information
Management, and
Quantitative
Research.
Faculty
responsible for
specific
business
programs are
reviewing the
results by
functional area
and
developing
appropriate
action plans to
improve
scores. IU’s
new
membership in
the SAP
University
Alliance will better prepare
students for
topics in
Operations and
Production
Management,
Information
30.07
57.33
44.91
25.1734.31 34.31 34.31 34.31
0
20
40
60
80
13/14 14/15 15/16 16/17
Inbound/Outbound Percent Change
IU Traditional Campus Based
23
Performance
Measure
Measurable goal
What is your
goal?
What is your
measurement
instrument or
process?
Do not use
grades.
(Indicate length
of cycle)
Current
Results
What are your
current
results?
Analysis of
Results
What did you
learn from the
results?
Action Taken
or
Improvement
made
What did you
improve or
what is your
next step?
Insert Graphs or Tables of Resulting Trends
(3-5 data points preferred)
Management,
and
Quantitative
Research by giving students
hands-on and
real life data,
used to make
decisions.
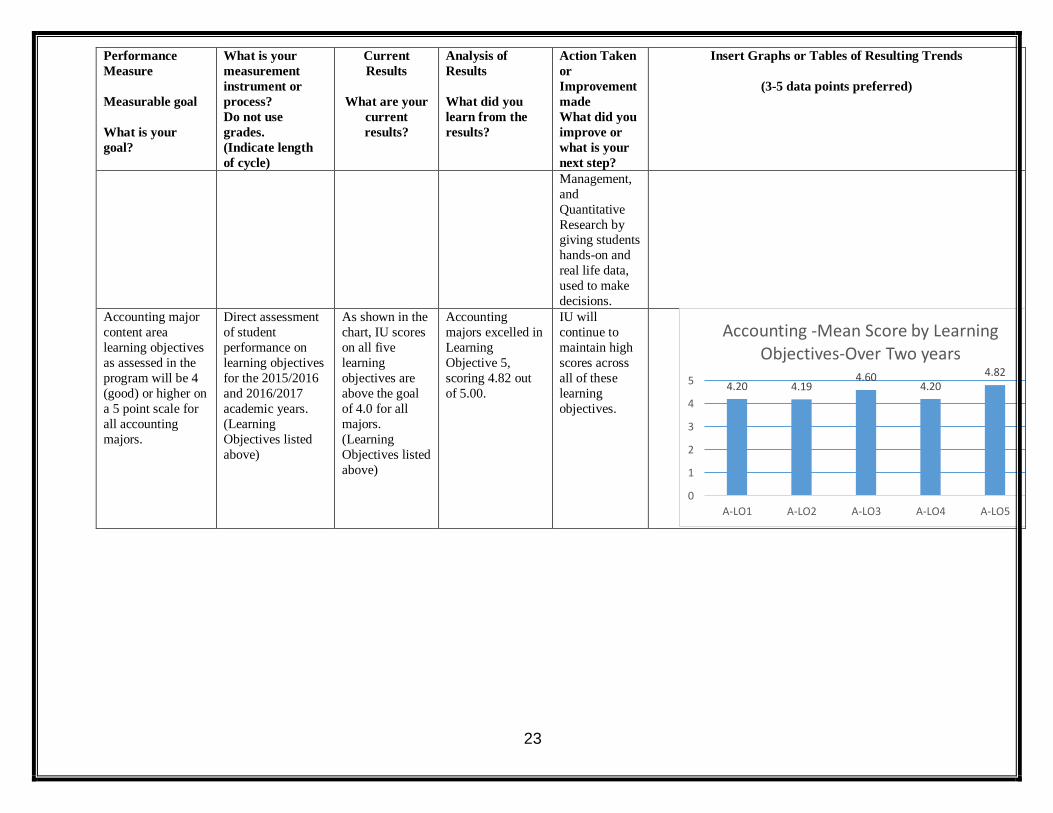
Accounting major
content area
learning objectives
as assessed in the
program will be 4
(good) or higher on
a 5 point scale for
all accounting
majors.
Direct assessment
of student
performance on
learning objectives
for the 2015/2016
and 2016/2017
academic years.
(Learning
Objectives listed
above)
As shown in the
chart, IU scores
on all five
learning
objectives are
above the goal
of 4.0 for all
majors.
(Learning
Objectives listed
above)
Accounting
majors excelled in
Learning
Objective 5,
scoring 4.82 out
of 5.00.
IU will
continue to
maintain high
scores across
all of these
learning
objectives.
4.20 4.194.60
4.204.82
0
1
2
3
4
5
A-LO1 A-LO2 A-LO3 A-LO4 A-LO5
Accounting -Mean Score by Learning Objectives-Over Two years

24
Performance
Measure
Measurable goal
What is your
goal?
What is your
measurement
instrument or
process?
Do not use
grades.
(Indicate length
of cycle)
Current
Results
What are your
current
results?
Analysis of
Results
What did you
learn from the
results?
Action Taken
or
Improvement
made
What did you
improve or
what is your
next step?
Insert Graphs or Tables of Resulting Trends
(3-5 data points preferred)
Target overall
scores on
Accounting
Capstone Assessment of 4.0
(good) or higher on
a 5.0 scale for ACC
422 (Capstone
course for
Accounting)
Direct, summative,
internal,
comparative
assessment. Capstone
assessment
performed by
instructors on
students in
capstone courses
following a
detailed rubric
Average scores
for all
Accounting
majors have strengthened in
the last five
years. The
Accounting
major is very
strong and the
2017 class was
exceptional.
Global awareness
has been
strengthened with
concurrent strengthening in
several other
areas.
The academic
focus areas are
getting
emphasis aligned with
the learning
outcomes
targeted.
4.274.69 4.77 4.52
4.96
0.00
1.00
2.00
3.00
4.00
5.00
2013 2014 2015 2016 2017
Learning Outcomes Average in ACC 422
0.00 1.00 2.00 3.00 4.00 5.00
Theory & Practice in Sectors
Global Awareness
Effective Communication
Effective Interpersonal Skills
Effective Analytical Skills
Effective Use of Technology
Professionalism, Integrity &…
Average score
ACC 422 Capstone Assessment
2017 2016 2015 2014 2013

25
Performance
Measure
Measurable goal
What is your
goal?
What is your
measurement
instrument or
process?
Do not use
grades.
(Indicate length
of cycle)
Current
Results
What are your
current
results?
Analysis of
Results
What did you
learn from the
results?
Action Taken
or
Improvement
made
What did you
improve or
what is your
next step?
Insert Graphs or Tables of Resulting Trends
(3-5 data points preferred)
Internship
employer survey
reflecting
satisfaction with preparedness of
students on average
will be 3.2 or
above on a 5.0
point scale.
Moreover,
employer surveys
will reflect
satisfaction with
student initiative
and leadership with
an average of 3.2
or higher on a 5.0
scale.
Survey of
internship
employers
Employer
Satisfaction
rating for
student preparedness
averaged 4.39
on a 5.0 point
scale, with the
score at or
above 4.0 for all
semesters since
2009,
Employer
satisfaction of
student initiative
and leadership
averaged 4.27
on a 5.0 scale
since Fall 2013.
Although this
number was
lower in the
past, survey data
indicates a score
above 4.0 since
2011.
When asked, employers
routinely say
they would hire
an IU intern
again. In some
years, ALL
responders
Student initiative
in the internship
continues to be a
strength for IU students. This is a
strong reason for
high levels of
employer
satisfaction with
IU interns.
The Business
Department
Practicum
continues to be a high quality
part of the
curriculum and
leads to the
success of the
department
majors.
012345
Spr10
Fall10
Spr11
Fall11
Spr12
Fall12
Spr13
Fall13
Spr14
Fall14
Spr15
Fall15
Spr16
Fall16
Like
rt S
cale
Mea
n
Semester
Employer Satisfaction with Student Preparedness for Internships

26
Performance
Measure
Measurable goal
What is your
goal?
What is your
measurement
instrument or
process?
Do not use
grades.
(Indicate length
of cycle)
Current
Results
What are your
current
results?
Analysis of
Results
What did you
learn from the
results?
Action Taken
or
Improvement
made
What did you
improve or
what is your
next step?
Insert Graphs or Tables of Resulting Trends
(3-5 data points preferred)
would like to
rehire IU
interns.
3.4 3.64.3 4.1 4.2 4 4 4.4 4.4 4.34.25 4 4.24.33
0
2
4
6
Spr10
Fall10
Spr11
Fall11
Spr12
Fall12
Spr13
Fall13
Spr14
Fall14
Spr15
Fall15
Spr16
Fall16Li
kert
Sca
le M
ean
Semester
Employer Satisfaction with Student Initiative
91%100% 100%
88%100%
0%
20%
40%
60%
80%
100%
2012 2013 2014 2015 2016
Per
cen
t w
ho
res
po
nd
ed "
yes"
Employer Satisfaction
Employers that Would Hire the Intern Again
27
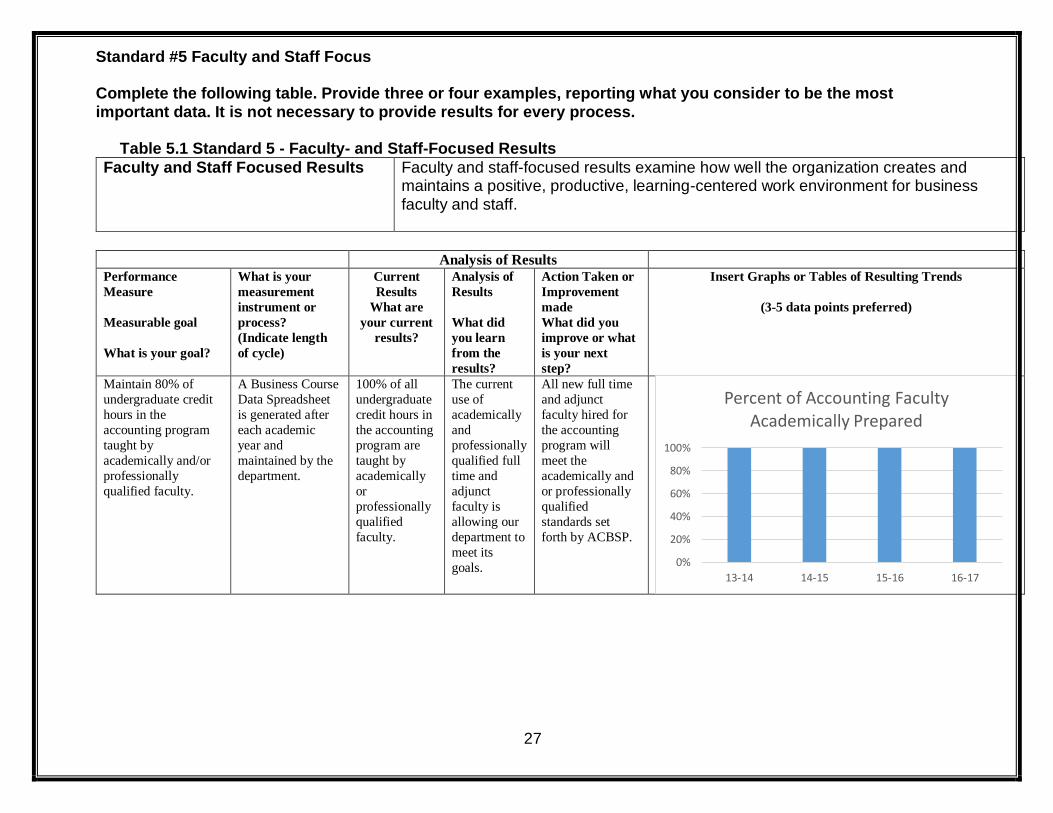
Standard #5 Faculty and Staff Focus
Complete the following table. Provide three or four examples, reporting what you consider to be the most important data. It is not necessary to provide results for every process.
Table 5.1 Standard 5 - Faculty- and Staff-Focused Results
Faculty and Staff Focused Results Faculty and staff-focused results examine how well the organization creates and maintains a positive, productive, learning-centered work environment for business faculty and staff.
Analysis of Results Performance
Measure
Measurable goal
What is your goal?
What is your
measurement
instrument or
process?
(Indicate length
of cycle)
Current
Results
What are
your current
results?
Analysis of
Results
What did
you learn
from the
results?
Action Taken or
Improvement
made
What did you
improve or what
is your next
step?
Insert Graphs or Tables of Resulting Trends
(3-5 data points preferred)
Maintain 80% of
undergraduate credit
hours in the
accounting program
taught by
academically and/or
professionally
qualified faculty.
A Business Course
Data Spreadsheet
is generated after
each academic
year and
maintained by the
department.
100% of all
undergraduate
credit hours in
the accounting
program are
taught by
academically
or
professionally
qualified
faculty.
The current
use of
academically
and
professionally
qualified full
time and
adjunct
faculty is
allowing our
department to
meet its
goals.
All new full time
and adjunct
faculty hired for
the accounting
program will
meet the
academically and
or professionally
qualified
standards set
forth by ACBSP.
0%
20%
40%
60%
80%
100%
13-14 14-15 15-16 16-17
Percent of Accounting Faculty Academically Prepared

28
Analysis of Results Performance
Measure
Measurable goal
What is your goal?
What is your
measurement
instrument or
process?
(Indicate length
of cycle)
Current
Results
What are
your current
results?
Analysis of
Results
What did
you learn
from the
results?
Action Taken or
Improvement
made
What did you
improve or what
is your next
step?
Insert Graphs or Tables of Resulting Trends
(3-5 data points preferred)
Maintain 80% of
undergraduate credit
hours in the
accounting program
taught by faculty with
the CPA designation.
A Business Course
Data Spreadsheet
is generated after
each academic
year and
maintained by the
department.
100% of all
undergraduate
credit hours in
the accounting
program are
taught by
faculty with
the CPA
designation.
The current
use of faculty
with a CPA
designation is
allowing our
department to
meet its
goals.
All new full time
and adjunct
faculty hired for
the accounting
program will hold
a CPA
designation.
Maintain 80% of
undergraduate credit
hours in the
accounting program
taught by faculty
professional with
sufficient accounting
practice experience or
accounting consulting
experience to ensure
appropriate emphasis
on accounting
practice.
Annual faculty
profile reports and
adjunct faculty
surveys of
accounting
practice and/or
consulting
experience.
100% of all
undergraduate
credit hours in
the accounting
program are
taught by
faculty
professionals
with
accounting
practice
experience or
accounting
consulting
experience.
The current
use of faculty
with
accounting
practice
experience or
accounting
consulting
experience is
allowing our
department to
meet its
goals.
All new full time
and adjunct
faculty hired for
the accounting
program will
have sufficient
accounting
practice
experience or
accounting
consulting
experience to
ensure
appropriate
emphasis on
accounting
practice.
0%
20%
40%
60%
80%
100%
13-14 14-15 15-16 16-17
Percent of Accounting Faculty with CPA
0%
20%
40%
60%
80%
100%
13-14 14-15 15-16 16-17
Percent of Accounting Faculty with Professional Accouting Experience

29

30
Faculty Qualifications Complete Table 5.2 and 5.3 for new full-time and part-time faculty members since last self-study or QA report. Do not include faculty members previously reported.
NAME MAJOR TEACHING FIELD COURSES TAUGHT EARNED DEGREES PROFESSIONAL
CERTIFICATION CRITIERA
ACBSP QUALIFICATION
Pelzer, Richonda
Accounting/Finance/Economics ACC317 Cost Accounting
MBA BA
CPA PMP
Professionally
Stockton, Mary Lou
Accounting ACC 313 Federal Income Tax ACC 314 Advanced Tax
MBA BA
CPA Personal Finance Specialist
Professionally

31
Table 5.3 Standard 5, Criterion 5.8 Scholarly and Professional Activities
Codes for Scholarly Activities:
A = Scholarship of Teaching
B = Scholarship of Discovery
C = Scholarship of Integration
D = Scholarship of Application
Faculty Member
Highest Degree Earned
Professional Certification
Scholarly Activities Professional Activities
Papers
Presented
Published Articles/
Manuscripts/ Books
Consulting
Professional
Related Service
Professional Conferences/ Workshops
Professional
Meetings
Professional
Memberships
Other
Pelzer Richonda
MBA D-2 C-1 C-1 D-3
Stockton Mary Lou
MBA D-1 C-2 D-3
32
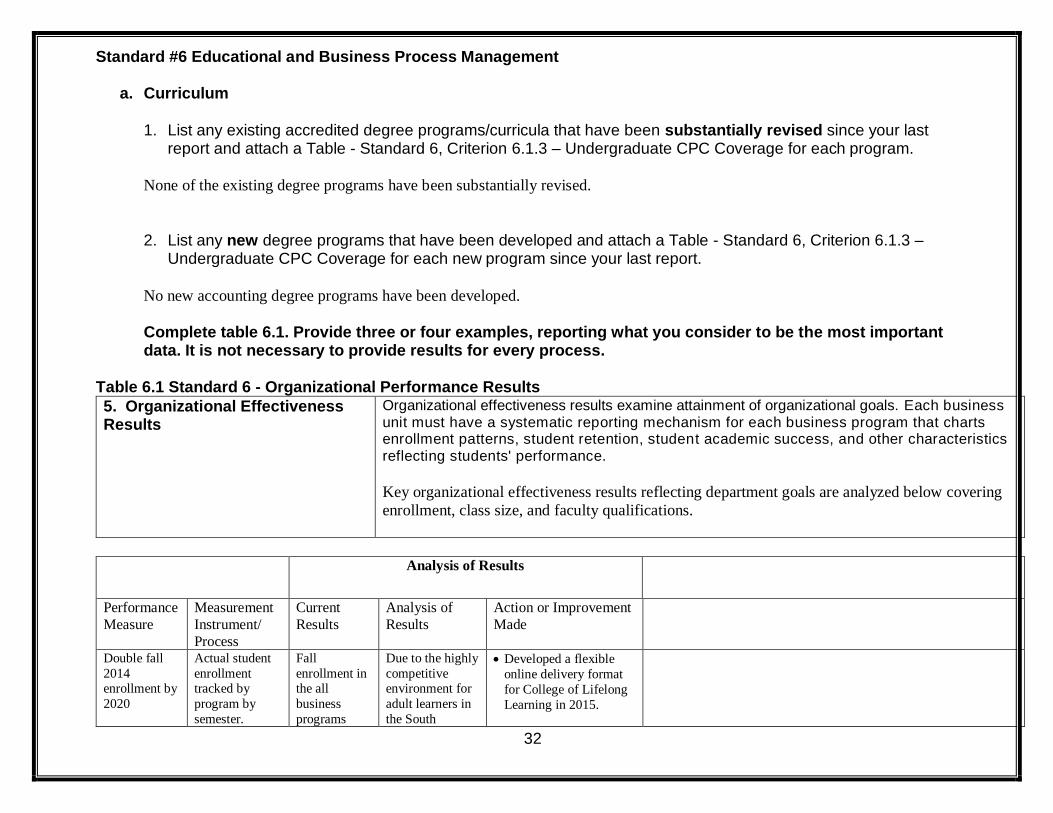
Standard #6 Educational and Business Process Management
a. Curriculum
1. List any existing accredited degree programs/curricula that have been substantially revised since your last report and attach a Table - Standard 6, Criterion 6.1.3 – Undergraduate CPC Coverage for each program.
None of the existing degree programs have been substantially revised.
2. List any new degree programs that have been developed and attach a Table - Standard 6, Criterion 6.1.3 –
Undergraduate CPC Coverage for each new program since your last report. No new accounting degree programs have been developed.
Complete table 6.1. Provide three or four examples, reporting what you consider to be the most important data. It is not necessary to provide results for every process.
Table 6.1 Standard 6 - Organizational Performance Results
5. Organizational Effectiveness Results
Organizational effectiveness results examine attainment of organizational goals. Each business unit must have a systematic reporting mechanism for each business program that charts enrollment patterns, student retention, student academic success, and other characteristics reflecting students' performance.
Key organizational effectiveness results reflecting department goals are analyzed below covering
enrollment, class size, and faculty qualifications.
Analysis of Results
Performance
Measure
Measurement
Instrument/
Process
Current
Results
Analysis of
Results
Action or Improvement
Made
Double fall
2014 enrollment by
2020
Actual student
enrollment tracked by
program by
semester.
Fall
enrollment in the all
business
programs
Due to the highly
competitive environment for
adult learners in
the South
• Developed a flexible
online delivery format
for College of Lifelong
Learning in 2015.

33
Analysis of Results
Performance
Measure
Measurement
Instrument/
Process
Current
Results
Analysis of
Results
Action or Improvement
Made
continues to
remain flat or
decline
slightly. Traditional
undergraduat
e enrollment
has fluctuated
slightly
between 118
and 130
students over
the past three
years. While
the CE
program did
experience a
spike in 2014,
fall
enrollment
numbers
returned to a
stable level in
2015 and
2016. While
ACCEL
enrolment
numbers
continues to decline, 2015
and 2016 saw
the addition
of 43 and 37
new online
students.
Eastern
Pennsylvania
area and the
decreased financial support
for tuition
reimbursement
from businesses,
enrollment in
ACCEL has
steadily declined.
• Increased department program marketing
including radio, print,
billboard, and
electronic.
• Created plethora of
tangible hand-outs
evidencing the depth of
learning experiences in
the curriculum.
• E-Blast messages
developed to promote
programs.
• Based on feedback
from the BAB and
local community, the
department is launching a new
Business Leadership
program for College of
Lifelong Learning
in fall 2017.
Incoming enrollment for traditional students has flattened, while the
adult/continuing education programs (CE and ACCEL) have
dropped off markedly. The new flexible and online degree programs have gained some momentum, but unfortunately have not made up
for the prior ACCEL enrollment.
Maintain
small
accounting
Actual student
enrollment in
classes tracked
Class sizes
have
remained
Maximum class
sizes have
remained at 22
Monitor class sizes and
offer additional sections
23 24 29 2154 38 32 24
136130 164
145
2933
3024
0 45
9
0
50
100
150
200
250
300
13-14 14-15 15-16 16-17
Fall Enrollment in Business Programs
MKT FIN BUS ACC HRM

34
Analysis of Results
Performance
Measure
Measurement
Instrument/
Process
Current
Results
Analysis of
Results
Action or Improvement
Made
class
averaging 20
or fewer
students.
by academic
year.
small,
continuing to
meet the
performance goal.
or lower, and the
average class
size has stayed in
the range of 11-12 students.
of courses when
enrollment grows.
Monitor student satisfaction associated
with class size.
Maintain
accounting student
engagement
in business
academic
honors.
Count of
students inducted and
invited.
Accounting
students continue to
accept
invitations to
academic
honor
societies and
appreciate the
professional
recognition.
The university
continues to invite the top
20% of junior
and senior
students to be
honored as
members of its
business honor
society.
Upon accreditation,
Immaculata joined Delta Mu Delta Honor Society.
Sigma Beta Delta honor
recognitions preceded
this. Accounting students
continue to accept
invitations relative to total
eligible. Over the past
four years, the number of
student inductees have
averaged approximately
25% of those invited. The
students indicated that the
cost of membership is the
primary reason for not
joining the honor society.
0
5
10
15
20
Fall 15 Spring 16 Fall 16 Spring 17
Average Class Size
BUS FIN HRM MKT ACC
0
1
2
3
14-15 15-16 16-17
Accounting Students in Honor Society
Academically Eligible Inducted