IMF Country Report No. 16/50 AUSTRIA - Startseitef933972e-5454-46d7-ac89-e741e6564a7c/cr... · IMF...
58
© 2016 International Monetary Fund IMF Country Report No. 16/50 AUSTRIA 2015 ARTICLE IV CONSULTATION—PRESS RELEASE; STAFF REPORT; AND STATEMENT BY THE EXECUTIVE DIRECTOR FOR AUSTRIA Under Article IV of the IMF’s Articles of Agreement, the IMF holds bilateral discussions with members, usually every year. In the context of the 2015 Article IV consultation with Austria, the following documents have been released and are included in this package: A Press Release summarizing the views of the Executive Board as expressed during its February 10, 2016 consideration of the staff report that concluded the Article IV consultation with Austria. The Staff Report prepared by a staff team of the IMF for the Executive Board’s consideration on February 10, 2016, following discussions that ended on December 14, 2015 with the officials of Austria on economic developments and policies. Based on information available at the time of these discussions, the staff report was completed on January 19, 2016. An Informational Annex prepared by the IMF staff. A Staff Statement updating information on recent developments. A Statement by the Executive Director for Austria. The documents listed below have been or will be separately released. Selected Issues The IMF’s transparency policy allows for the deletion of market-sensitive information and premature disclosure of the authorities’ policy intentions in published staff reports and other documents. Copies of this report are available to the public from International Monetary Fund Publication Services PO Box 92780 Washington, D.C. 20090 Telephone: (202) 623-7430 Fax: (202) 623-7201 E-mail: [email protected] Web: http://www.imf.org Price: $18.00 per printed copy International Monetary Fund Washington, D.C. February 2016
Transcript of IMF Country Report No. 16/50 AUSTRIA - Startseitef933972e-5454-46d7-ac89-e741e6564a7c/cr... · IMF...

© 2016 International Monetary Fund
IMF Country Report No. 16/50
AUSTRIA 2015 ARTICLE IV CONSULTATION—PRESS RELEASE; STAFF REPORT; AND STATEMENT BY THE EXECUTIVE DIRECTOR FOR AUSTRIA
Under Article IV of the IMF’s Articles of Agreement, the IMF holds bilateral discussions
with members, usually every year. In the context of the 2015 Article IV consultation with
Austria, the following documents have been released and are included in this package:
A Press Release summarizing the views of the Executive Board as expressed during its
February 10, 2016 consideration of the staff report that concluded the Article IV
consultation with Austria.
The Staff Report prepared by a staff team of the IMF for the Executive Board’s
consideration on February 10, 2016, following discussions that ended on
December 14, 2015 with the officials of Austria on economic developments and
policies. Based on information available at the time of these discussions, the staff
report was completed on January 19, 2016.
An Informational Annex prepared by the IMF staff.
A Staff Statement updating information on recent developments.
A Statement by the Executive Director for Austria.
The documents listed below have been or will be separately released.
Selected Issues
The IMF’s transparency policy allows for the deletion of market-sensitive information and
premature disclosure of the authorities’ policy intentions in published staff reports and
other documents.
Copies of this report are available to the public from
International Monetary Fund Publication Services
PO Box 92780 Washington, D.C. 20090
Telephone: (202) 623-7430 Fax: (202) 623-7201
E-mail: [email protected] Web: http://www.imf.org
Price: $18.00 per printed copy
International Monetary Fund
Washington, D.C.
February 2016
Press Release No. 16/58
FOR IMMEDIATE RELEASE
February 12, 2016
IMF Executive Board Concludes 2015 Article IV Consultation with Austria
On February 10, 2016, the Executive Board of the International Monetary Fund (IMF) concluded
the 2015 Article IV consultation1 with Austria.
Austria is stable and affluent. It has weathered the global financial crisis well, and output and
employment have recovered to pre-crisis levels. The budget deficit has been well contained in
recent years. Nevertheless, as in other countries, budget support for bank restructuring and
resolution has ratcheted up public debt, which stands now at about 86 percent of GDP. Crisis
legacies also still weigh on the balance sheets of large Austrian banks, which must raise
profitability and further improve capital cushions.
Following the lackluster growth in recent years, Austria’s economy is projected to expand by 1.4
percent in 2016, driven by a large personal income tax cut, recovering investment, and
accelerating exports. Unemployment, although rising, is expected to remain moderate, while
headline inflation will gradually reach 2 percent in the medium term. The main risks to the
outlook stem from lower-than-expected growth in important trading and financial partners in the
euro area and emerging markets.
The elevated public debt level leaves little fiscal room for absorbing increasing aging cost or
further reducing high labor taxes. Broad reform-based expenditure cuts in areas with obvious
inefficiencies, such as health care, education, and subsidies, as well as further pension reforms,
would allow rapid debt reduction and additional cuts in labor taxation.
The surge in refugee inflows offers both risks and opportunities. Historically, Austria has always
received a sizeable number of immigrants. The unrest in the Middle East, however, has propelled
the estimated number of asylum seekers in 2015 to an exceptional 90,000, or about 1 percent of
1 Under Article IV of the IMF's Articles of Agreement, the IMF holds bilateral discussions with members, usually every year. A staff team visits the country, collects economic and financial information, and discusses with officials the country's economic developments and policies. On return to headquarters, the staff prepares a report, which forms the basis for discussion by the Executive Board.
International Monetary Fund
700 19th Street, NW
Washington, D. C. 20431 USA
2
Austria’s population. While the influx of refugees is posing numerous challenges, their
successful integration can help reignite potential growth and eventually reduce fiscal imbalances.
In the financial sector, large Austrian banks are changing their business models by focusing more
on core markets and improving efficiency to raise profitability and capital ratios. This is
necessary and timely as capital cushions, while improving, appear thin in comparison with peers.
The authorities have been revamping the regulatory and supervisory framework in line with the
implementation of the EU Banking Union. Considerable progress has also been made in the
resolution of nationalized banks.
Executive Board Assessment2
Executive Directors commended Austria for preserving macroeconomic and financial stability
after the global financial crisis. While the outlook is positive, resolving post-crisis legacies and
ensuring the successful integration of refugees requires further reforms. Directors encouraged the
authorities to address these challenges over the medium term through fiscal consolidation,
structural reforms to increase productivity growth and labor force participation, and measures to
further strengthen the financial sector.
Directors noted that the high public debt to GDP ratio constrains the room for fiscal maneuver,
especially in the context of the projected increase in age-related spending. While a neutral fiscal
stance in the near term would support economic activity and facilitate the integration of refugees,
over the medium term fiscal policy should target a structural surplus until public debt falls below
60 percent of GDP. Directors suggested that this fiscal consolidation be delivered through
efficiency-boosting reforms in health care, education, and subsidies as well as further pension
reforms. They recommended combining these reforms with tighter links between revenue and
expenditure at the subnational level. Sufficient expenditure rationalization would also create
room for further reducing the tax burden on labor.
Directors commended Austria’s efforts to absorb and integrate accepted asylum seekers. They
noted that these flows create challenges but also provide opportunities to improve the fiscal
position and raise growth over the medium term. Directors encouraged the authorities to sustain
and strengthen their efforts to swiftly and effectively integrate immigrants into the labor force.
More broadly, they recommended product and service market reforms to boost potential growth
by raising total factor productivity and labor force participation.
Directors commended the significant progress made in revamping the regulatory and supervisory
framework and in bank resolution. Nevertheless, banking sector resilience can be strengthened
2 At the conclusion of the discussion, the Managing Director, as Chairman of the Board, summarizes the views of Executive Directors, and this summary is transmitted to the country's authorities. An explanation of any qualifiers used in summings up can be found here: http://www.imf.org/external/np/sec/misc/qualifiers.htm.

3
further, and Directors underlined the need to continue to monitor and reassess large banks’
capital cushions, which remain low relative to peers. In this context, they welcomed plans to
phase in a systemic capital surcharge and recommended that the authorities implement additional
measures, if needed, to ensure adequate capital buffers in the banks. Directors also underscored
the need for banks to proactively mitigate risks from their cross-border exposures and domestic
mortgage loans in foreign currency. They supported an expansion of the macroprudential toolkit
with respect to real estate-specific instruments. Regarding the ongoing wind-down of a
restructured bank, Directors stressed the importance of balancing the benefits of a quick
resolution with risks associated with a retroactive change of contracts.

4
Austria: Selected Economic Indicators, 2010–15
2011 2012 2013 2014 2015 2016
Projections
(change in percent unless indicated otherwise)
Demand and supply
GDP 2.8 0.8 0.3 0.4 0.7 1.4
Total domestic demand 2.9 0.3 -0.4 -0.2 0.5 1.1
Consumption 0.9 0.5 0.2 0.3 0.5 1.1
Gross fixed capital formation 6.7 1.3 -0.3 -0.2 -0.5 1.4
Net exports (growth contribution in pp) 0.1 0.3 0.4 0.5 0.3 0.3
Exports of goods and nonfactor services 6.0 1.7 0.8 2.1 1.1 3.2
Imports of goods and nonfactor services 6.2 1.1 0.0 1.3 0.6 3.0
Output gap (percent of potential GDP) 0.2 -0.1 -0.8 -1.6 -1.4 -0.9
Unemployment (in percent; Eurostat definition) 4.6 4.9 5.3 5.6 5.8 6.2
Prices
Consumer price index (period average) 3.6 2.6 2.1 1.5 0.8 1.4
General government finances (percent of GDP)
Revenue 48.3 48.9 49.7 50.0 50.3 49.4
Expenditure 50.8 51.1 50.9 52.7 51.9 51.2
Balance (EDP-definition) -2.6 -2.2 -1.3 -2.7 -1.6 -1.8
Structural Balance 1/ -2.5 -1.7 -1.0 -0.3 -0.2 -1.0
Gross debt (end of period) 82.1 81.6 80.8 84.2 86.2 85.4
Balance of payments
Current account (percent of GDP) 1.6 1.5 2.0 1.9 2.6 2.6
Sources: Austrian authorities; and IMF staff estimates and projections.
1/ The structural balance excludes the following one-offs (as percent of GDP): (a) capital transfers to banks: 0.2 in 2011; 0.5
in 2012; 0.5 in 2013; 1.6 in 2014; 0.6 in 2015; 0.2 in 2016; (b) flood related expenditure: 0.1 in 2013; (c) revenues from the
sale of mobile telecommunication licenses: 0.6 in 2013; (d) tax revenues from treaties with Switzerland and Luxembourg: 0.1
in 2012; 0.2 in 2013; 0.1 in 2014; (e) revenue from the adjustment in EU contributions: 0.1 in 2014.
AUSTRIA STAFF REPORT FOR THE 2015 ARTICLE IV CONSULTATION
KEY ISSUES
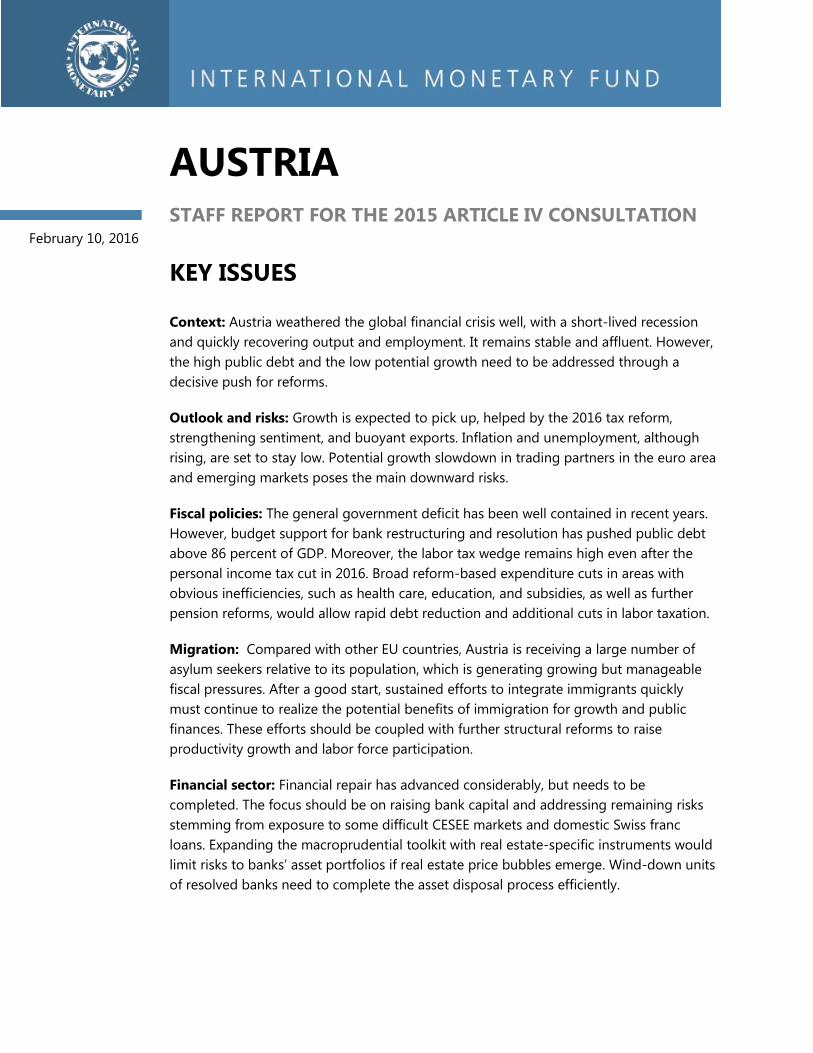
Context: Austria weathered the global financial crisis well, with a short-lived recession
and quickly recovering output and employment. It remains stable and affluent. However,
the high public debt and the low potential growth need to be addressed through a
decisive push for reforms.
Outlook and risks: Growth is expected to pick up, helped by the 2016 tax reform,
strengthening sentiment, and buoyant exports. Inflation and unemployment, although
rising, are set to stay low. Potential growth slowdown in trading partners in the euro area
and emerging markets poses the main downward risks.
Fiscal policies: The general government deficit has been well contained in recent years.
However, budget support for bank restructuring and resolution has pushed public debt
above 86 percent of GDP. Moreover, the labor tax wedge remains high even after the
personal income tax cut in 2016. Broad reform-based expenditure cuts in areas with
obvious inefficiencies, such as health care, education, and subsidies, as well as further
pension reforms, would allow rapid debt reduction and additional cuts in labor taxation.
Migration: Compared with other EU countries, Austria is receiving a large number of
asylum seekers relative to its population, which is generating growing but manageable
fiscal pressures. After a good start, sustained efforts to integrate immigrants quickly
must continue to realize the potential benefits of immigration for growth and public
finances. These efforts should be coupled with further structural reforms to raise
productivity growth and labor force participation.
Financial sector: Financial repair has advanced considerably, but needs to be
completed. The focus should be on raising bank capital and addressing remaining risks
stemming from exposure to some difficult CESEE markets and domestic Swiss franc
loans. Expanding the macroprudential toolkit with real estate-specific instruments would
limit risks to banks’ asset portfolios if real estate price bubbles emerge. Wind-down units
of resolved banks need to complete the asset disposal process efficiently.
February 10, 2016
AUSTRIA
2 INTERNATIONAL MONETARY FUND
Approved By Mahmood Pradhan
(EUR) and Catherine
Pattillo (SPR)
Discussions took place in Vienna from December 3–14, 2015. The
staff team comprised Mr. Nikolay Gueorguiev (head), Ms. Nicoletta
Batini and Messrs. Siegfried Steinlein and Ara Stepanyan (all EUR).
Ms. Terri Chen provided research and Ms. Luisa Calixto
administrative support from headquarters. Mr. Just (OED)
participated in the discussions. The mission met with Minister of
Finance Schelling, OeNB Governor Nowotny, Labor and Social Affairs
Minister Hundstorfer, Minister of Arts, Culture, Constitution and
Media Ostermayer, other senior officials, parliamentarians, and
representatives of the social partners, the banking sector and think
tanks.
CONTENTS
CONTEXT_________________________________________________________________________________________ 4
RECENT ECONOMIC DEVELOPMENTS, OUTLOOK, SPILLOVERS, AND RISKS _________________ 5
POLICY DISCUSSIONS ___________________________________________________________________________ 6
A. Restoring Fiscal Buffers via Structural Fiscal Reforms ___________________________________________ 8
B. Migration, Optimizing Integration Policies, and Other Measures to Boost Potential Growth __ 13
C. Further Enhancing Financial Sector Resilience and Finalizing Bank Restructuring _____________ 15
RISK ASSESSMENT MATRIX _____________________________________________________________________ 7
STAFF APPRAISAL ______________________________________________________________________________ 18
FIGURES
1. Recent Economic Developments ______________________________________________________________ 20
2. Selected Financial Market Indicators __________________________________________________________ 21
3. External Sector ________________________________________________________________________________ 22
4. Banking Sector ________________________________________________________________________________ 23
5. Corporate and Household Indebtedness and House Prices____________________________________ 24
6. Fiscal Developments and Outlook _____________________________________________________________ 25
7. Migrants Integration Policies and Economic Impact of Immigrants ____________________________ 26
8. Tax Revenue, PIT and Special Contributions — Advanced OECD Countries ____________________ 27
9. Potential Growth and Productivity _____________________________________________________________ 28
10. Structural Indicators __________________________________________________________________________ 29
TABLES
1. Selected Economic Indicators, 2011–16 _______________________________________________________ 30
2. Medium-Term Macroeconomic Framework, 2011–21 _________________________________________ 31
AUSTRIA
INTERNATIONAL MONETARY FUND 3
3. Balance of Payments, 2011–21 ________________________________________________________________ 32
4. General Government Operations, 2011–21 ____________________________________________________ 33
5. General Government Balance Sheet, 2007–14 _________________________________________________ 34
6. Financial Soundness Indicators, 2010–15 ______________________________________________________ 35
7. Authorities’ Response to Past IMF Policy Recommendations __________________________________ 36
ANNEXES
I. Macroprudential Policies _______________________________________________________________________ 37
II. Public Debt Sustainability Analysis (DSA) ______________________________________________________ 39

AUSTRIA
4 INTERNATIONAL MONETARY FUND
CONTEXT
1. Austria has recovered from the global financial crisis, but the crisis’ legacy still weighs
on bank and public sector balance sheets. Both output and employment exceed pre-crisis levels.
However, most CESEE–active Austria-based banks needed government support, and three mid-sized
banks had to be fully or partly nationalized and subsequently resolved. Budget support for bank
restructuring and resolution has been the main driver in pushing up general government debt
relative to GDP by almost one third to 86 percent between 2007 and 2015.
2. Major banks have been striving to strengthen their capital and profitability positions
amid regulatory and supervisory reforms. Capital cushions of major banks, while improving,
remain thin in comparison with peers and profitability is recovering only slowly (Figure 4). To
address these challenges, large banks are refocusing their business models on core markets and
engaging in cost-cutting strategy to prop up profitability and capital. In parallel, the authorities have
been revamping the regulatory and supervisory framework in line with EU Banking Union
requirements. These developments do not seem to hamper credit supply, as the stable but low
credit growth in the past few years has been moving in line with domestic demand (Figure 5).
3. Despite lackluster growth, economic slack is limited as potential growth has fallen as
well. Growth stagnated below 1 percent in 2012–14 due to trade and confidence spillovers from the
euro area crisis, weak recovery in CESEE, and geopolitical tensions further to the East (Figure 1). Staff
estimates that potential growth has dropped below 1 percent as well, constrained by limited
investment, stagnant labor input in terms of hours worked, and lack of productivity growth (Figure
9). As a result, the output gap never exceeded 1½ percent, unemployment, although rising,
remained below 6 percent, and core inflation was at nearly 2 percent in December 2015 (the
headline inflation was 1.1 percent owing to falling fuel prices).
4. The surge in refugee inflows into EU countries has significantly affected Austria. The
authorities expect asylum applications to reach an exceptional 90,000 in 2015, some 1 percent of
Austria’s population, placing it third in the EU by the number of asylum seekers per 1000
inhabitants. While Austria has historically had a sizeable share of immigrants in the population, the
immigrant inflow has strengthened since 2011 reflecting the labor market liberalization for workers
from the EU’s New Member States and unrest in the Middle East.
5. The governing coalition of Social Democrats and the right-of-center People’s Party
holds a constructive dialogue on economic policy issues. The coalition was re-elected in
December 2013 with a small parliamentary majority and confirmed several fiscal expenditure reform
steps that had been taken previously. In spite of diverging views on several policy issues, the
coalition was able to agree on an income tax reform in spring 2015. Discussions on further pension
reforms and the implementation of an already decided education reform are planned for early 2016.

AUSTRIA
INTERNATIONAL MONETARY FUND 5
RECENT ECONOMIC DEVELOPMENTS, OUTLOOK,
SPILLOVERS, AND RISKS
6. Growth is set to pick up. Growth is estimated at 0.7 percent in 2015, a slight improvement
over the ½ percent average in 2012–14, on the back of strengthening external and domestic
demand. In 2016, staff projects further growth acceleration to 1.4 percent on the back of the large
personal income tax cut, recovery in investment as business sentiment improves, and a further pick-
up in exports thanks to the weaker euro. While the pick-up in growth would support continuing
employment expansion, unemployment would still rise to 6½ percent by 2017, elevated by higher
migration-related labor supply, and then decline to some 6¼ percent in the medium term. Potential
growth should slightly exceed 1 percent by 2019–20 supported by a pick-up in investment and a
boost to employment from the recent tax reform and integration of refugees in the labor market.
Headline inflation is expected to gradually rise to 2 percent in the medium term.
7. Adverse developments abroad could reduce growth and bank profits (see Risk
Assessment Matrix, p.7). Lower-than-expected growth in the euro area or emerging markets would
predominantly be transmitted via the strong export and financial ties with Germany, Italy, and
CESEE, adversely affecting public debt dynamics and bank profitability. Other banking sector risks
include higher bank taxation in CESEE. On the upside, stronger ECB easing could support growth
mainly through its effects on the euro and consumer and business confidence. Moreover, should oil
prices stay low for longer than expected, disposable income and private consumption would get a
boost while headline inflation may surprise on the downside.
8. As regards outward spillovers, efforts to rebuild capital could weigh on Austrian
banks’ willingness to lend in CESEE. Going forward, cost rationalization and asset-reduction efforts
could constrain credit growth in some host countries if sustained over a longer period and if other
banks do not pick up the slack.
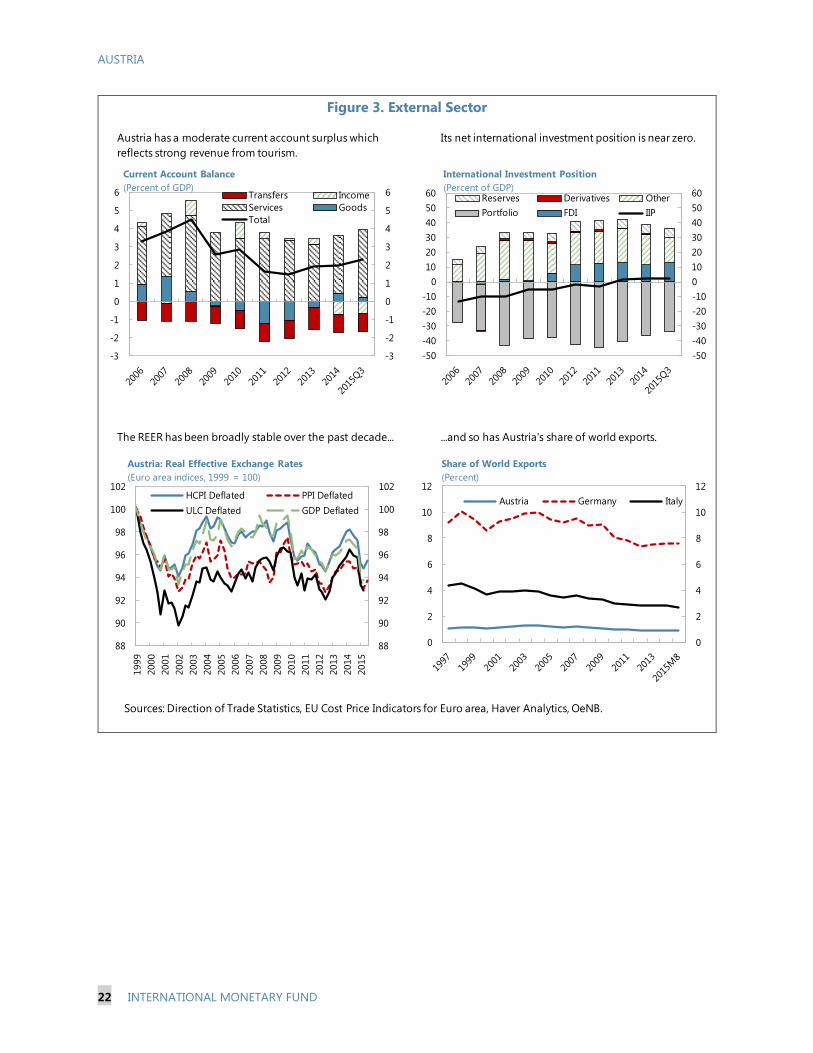
9. Austria’s external position is broadly in line with fundamentals and desirable policies.
Austria’s current account surplus is expected to settle around 2½ percent of GDP in 2015 and over
the medium term, at the average over the past ten years (Figure 3). A broadly stable real exchange
rate has contributed to Austria’s satisfactory export performance. Austria’s IIP is slightly positive,
giving it an intermediate position among euro area countries. The IMF External Balance Assessment
(EBA) finds that the current account balance in 2015 is somewhat below the norm, with the policy
gap––mainly too high health expenditures as a proxy for social benefits in general––explaining
about half the difference. While EBA finds the REER modestly overvalued in mid-2015 (by 9 percent),
this is mainly due to an unexplained residual (6¾ percent).
10. Staff’s macroeconomic projections are consistent with those of the Ministry of Finance
while the central bank (OeNB) and some research institutes are more optimistic. The
2016 budget is based on a macroeconomic framework similar to staff’s, including growth of
1.4 percent, unemployment of 6 percent, and consumer price inflation at 1.7 percent. The central
AUSTRIA
6 INTERNATIONAL MONETARY FUND
bank predicts growth of 1.9 percent in 2016, driven by a strong fiscal expansion based on an
underfinanced 2016 income tax reform and higher expenses for refugees. With the same growth
drivers, two research institutes (IHS and WIFO) have recently revised their growth forecast for
2016 up to 1.6–1.7 percent. Projection differences for inflation between these institutions and staff
are small.
11. The authorities broadly agreed on the risks identified by staff. In particular, they
pointed to external risks to growth stemming from developments in emerging markets. Some also
noted the risk of financial sector bubbles and misallocation of capital as a potential unintended
consequence of the low interest rate environment in the euro area and supported staff’s
recommendation for expanding the macroprudential toolkit from this perspective (see below).
POLICY DISCUSSIONS
12. The discussions focused on the three major areas, in which further progress could be
made to enhance the economy’s resilience to shocks and raise growth :
Restoring fiscal buffers via structural fiscal reforms. While Austria’s public debt level is
not an outlier in the euro area, it is much higher than pre-crisis. The need to regain space for fiscal
maneuver given also the expected rise in age-related public spending calls for further reform-based
fiscal consolidation in the medium term.
Fostering rapid integration of immigrants and implementing additional structural
reforms to boost potential growth. A surge of asylum seekers is pressuring public spending in
the short term but can help propel the economy’s productive potential and improve public finances
in the medium term. In addition, Austria would benefit from further structural reforms to raise
productivity growth and labor force participation.
Further strengthening financial sector resilience and resolving remaining crisis legacy
issues. Building on progress already made, capital and profitability levels of some major banks could
be strengthened further, while the well-advanced resolution of banks nationalized during the crisis
needs to be completed.
AUSTRIA
INTERNATIONAL MONETARY FUND 7
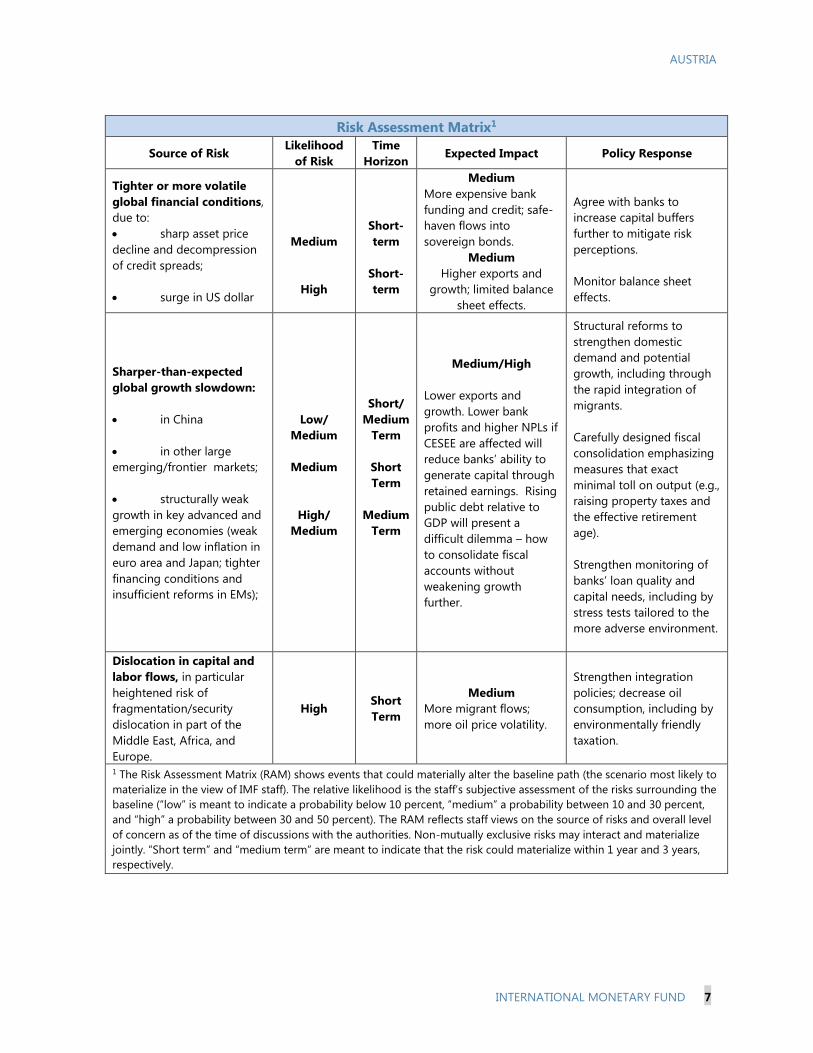
Risk Assessment Matrix1
Source of Risk Likelihood
of Risk
Time
Horizon Expected Impact Policy Response
Tighter or more volatile
global financial conditions,
due to:
sharp asset price
decline and decompression
of credit spreads;
surge in US dollar
Medium
High
Short-
term
Short-
term
Medium
More expensive bank
funding and credit; safe-
haven flows into
sovereign bonds.
Medium
Higher exports and
growth; limited balance
sheet effects.
Agree with banks to
increase capital buffers
further to mitigate risk
perceptions.
Monitor balance sheet
effects.
Sharper-than-expected
global growth slowdown:
in China
in other large
emerging/frontier markets;
structurally weak
growth in key advanced and
emerging economies (weak
demand and low inflation in
euro area and Japan; tighter
financing conditions and
insufficient reforms in EMs);
Low/
Medium
Medium
High/
Medium
Short/
Medium
Term
Short
Term
Medium
Term
Medium/High
Lower exports and
growth. Lower bank
profits and higher NPLs if
CESEE are affected will
reduce banks’ ability to
generate capital through
retained earnings. Rising
public debt relative to
GDP will present a
difficult dilemma – how
to consolidate fiscal
accounts without
weakening growth
further.
Structural reforms to
strengthen domestic
demand and potential
growth, including through
the rapid integration of
migrants.
Carefully designed fiscal
consolidation emphasizing
measures that exact
minimal toll on output (e.g.,
raising property taxes and
the effective retirement
age).
Strengthen monitoring of
banks’ loan quality and
capital needs, including by
stress tests tailored to the
more adverse environment.
Dislocation in capital and
labor flows, in particular
heightened risk of
fragmentation/security
dislocation in part of the
Middle East, Africa, and
Europe.
High Short
Term
Medium
More migrant flows;
more oil price volatility.
Strengthen integration
policies; decrease oil
consumption, including by
environmentally friendly
taxation.
1 The Risk Assessment Matrix (RAM) shows events that could materially alter the baseline path (the scenario most likely to
materialize in the view of IMF staff). The relative likelihood is the staff’s subjective assessment of the risks surrounding the
baseline (“low” is meant to indicate a probability below 10 percent, “medium” a probability between 10 and 30 percent,
and “high” a probability between 30 and 50 percent). The RAM reflects staff views on the source of risks and overall level
of concern as of the time of discussions with the authorities. Non-mutually exclusive risks may interact and materialize
jointly. “Short term” and “medium term” are meant to indicate that the risk could materialize within 1 year and 3 years,
respectively.

AUSTRIA
8 INTERNATIONAL MONETARY FUND
A. Restoring Fiscal Buffers via Structural Fiscal Reforms
Background
13. General government debt exceeds 86 percent of GDP and is expected to decline only
slowly in the next few years (Table 4 and the DSA). Gross debt has increased by almost
20 percentage points of GDP since the global financial crisis (Figure 6). Under the staff baseline, it
will still be as high as 78 percent of GDP in 2020, reducing the ability of the public sector to smooth
the effects of large unanticipated shocks.
14. Elevated debt levels leave Austria ill-prepared for the increase in age-related spending
in the next decades. According to the European Commission’s 2015 Ageing Report, ageing implies
an expenditure increase of 1.6 percentage points of GDP by 2030 and over 3 percentage points by
2060––2½ percentage points in healthcare and long term care for the elderly and the chronically ill,
and ½ percentage points in pensions. Staff simulations of a multi-generational model of Austria
confirm these findings. In the absence of reforms, the debt-to-GDP ratio would start rising in the
mid–2020s, reaching about 130 percent by 2060.
15. In addition, fiscal space is needed
to reduce taxation levels further. Even
after the 2016 PIT tax cut, Austria’s overall
and labor tax revenue remains considerably
above the OECD’s advanced countries
average (OECD ACA) (Figure 8). Further cuts
in labor taxes, especially the hefty social
security contributions, would reduce the still
high labor tax wedge and thus support
employment and growth.
16. A high expenditure-to-GDP ratio
and expenditure inefficiencies suggest considerable room for savings. Austria leads OECD
countries in terms of public expenditure relative to GDP (52.7 percent of GDP in 2014 compared to
the OECD ACA of 45.8 percent), while the outcomes achieved with this level of spending are not
better, and in some cases are worse than best results in this group. The largest share of expenditure
(42 percent, 5 percentage points above the OECD ACA) comprises social protection. Moreover,
education spending per student exceeds the OECD ACA by about 30 percent, while health spending
per capita is about 20 percent higher than the OECD ACA after adjusting for demographic factors.
Spending on general public services and economic affairs exceeds the average in terms of GDP by
around one-fifth as well.
17. An ambitious tax reform in 2016 coupled with the fiscal costs related to the wave of
asylum seekers may jeopardize the authorities’ deficit targets. The structural balance fell below
½ percent of GDP in 2014–2015 (Table 1), and tax revenues have been buoyant in 2015, a trend that
is expected to carry over to next year. However, a personal income tax reform that mainly cuts the
0
10
20
30
40
50
60
BEL
AU
T
DEU
FRA
ITA
AU
T-1
6*
EU
21
ESP
DN
K
NLD
LUX
NO
R
ISL
JPN
USA
CA
N
GB
R
IRL
AU
S
CH
E
* AUT-16 is calculated by applying the 2016 personal income tax schedule to the
wage structure of 2014.
Sources: OECD and IMF staff calculations.
Labor Tax Wedge, 2014
(Percent of labor cost for a single taxpayer, receiving the average wage)
AUSTRIA
INTERNATIONAL MONETARY FUND 9
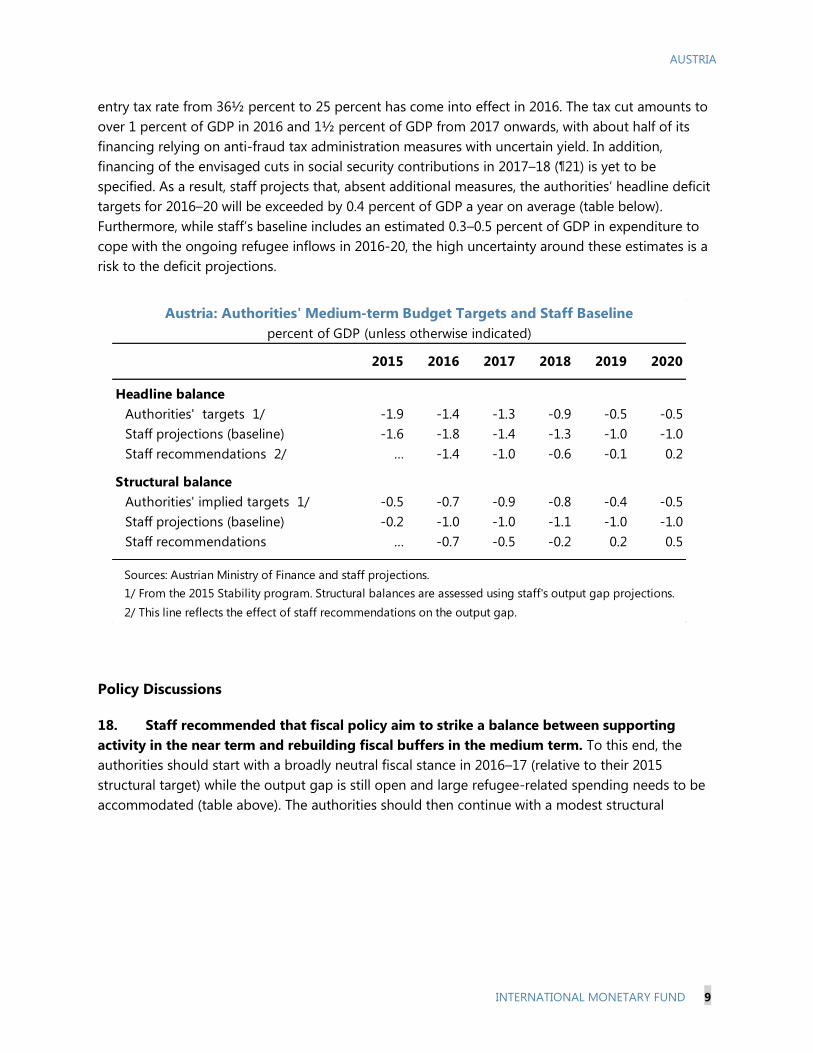
entry tax rate from 36½ percent to 25 percent has come into effect in 2016. The tax cut amounts to
over 1 percent of GDP in 2016 and 1½ percent of GDP from 2017 onwards, with about half of its
financing relying on anti-fraud tax administration measures with uncertain yield. In addition,
financing of the envisaged cuts in social security contributions in 2017–18 (¶21) is yet to be
specified. As a result, staff projects that, absent additional measures, the authorities’ headline deficit
targets for 2016–20 will be exceeded by 0.4 percent of GDP a year on average (table below).
Furthermore, while staff’s baseline includes an estimated 0.3–0.5 percent of GDP in expenditure to
cope with the ongoing refugee inflows in 2016-20, the high uncertainty around these estimates is a
risk to the deficit projections.
Policy Discussions
18. Staff recommended that fiscal policy aim to strike a balance between supporting
activity in the near term and rebuilding fiscal buffers in the medium term. To this end, the
authorities should start with a broadly neutral fiscal stance in 2016–17 (relative to their 2015
structural target) while the output gap is still open and large refugee-related spending needs to be
accommodated (table above). The authorities should then continue with a modest structural
Austria: Authorities' Medium-term Budget Targets and Staff Baseline
percent of GDP (unless otherwise indicated)
2015 2016 2017 2018 2019 2020
Headline balance
Authorities' targets 1/ -1.9 -1.4 -1.3 -0.9 -0.5 -0.5
Staff projections (baseline) -1.6 -1.8 -1.4 -1.3 -1.0 -1.0
Staff recommendations 2/ … -1.4 -1.0 -0.6 -0.1 0.2
Structural balance
Authorities' implied targets 1/ -0.5 -0.7 -0.9 -0.8 -0.4 -0.5
Staff projections (baseline) -0.2 -1.0 -1.0 -1.1 -1.0 -1.0
Staff recommendations … -0.7 -0.5 -0.2 0.2 0.5
1/ From the 2015 Stability program. Structural balances are assessed using staff's output gap projections.
2/ This line reflects the effect of staff recommendations on the output gap.
Sources: Austrian Ministry of Finance and staff projections.

AUSTRIA
10 INTERNATIONAL MONETARY FUND
adjustment of ⅓ percentage points of GDP per year in 2018–20.2 This implies a 1¼ percent of GDP
higher headline fiscal balance than the baseline by 2020 (text table on p. 9) and is well within reach
provided that at least part of the feasible expenditure savings of about 4 percentage points of GDP
are realized (see below).3 Once achieved, this surplus should be maintained until debt falls below
60 percent of GDP (projected for 2026). Thereafter, the authorities could revert to their MTO target
(a structural deficit of ½ percent of GDP). Once debt falls well below 60 percent of GDP and ageing
costs decline (projected for 2040), the MTO target can be relaxed to a deficit of 1 percent of GDP.
Sources: Austrian authorities; EC; IMF WEO; and IMF staff calculations and projections.
1/ The trajectory "Currently Envisaged Policies" shows debt dynamics in 2014-2060 under the staff’s baseline projections
and currently envisaged policies after 2020. From the mid-2020s, debt rises faster than nominal GDP, driven by ageing and
healthcare costs and snow-balling interest expenditure.
2/ The trajectory “Staff Recommendation” assumes that a structural surplus of ½ percent of GDP is reached by 2020 and
maintained until debt falls below 60 percent of GDP in 2026. Then the structural balance reverts to a deficit of ½ percent of
GDP until 2040 and 1 percent of GDP thereafter, consistent with the Fiscal Compact.
3/ The “Staff Recommendation” scenario accounts for the effect of structural adjustment on growth, using a multiplier of
0.5. See Batini, Eyraud and Weber (2012) for the method used to derive this fiscal multiplier.
19. This policy would deliver several benefits:
It would increase the space for countercyclical fiscal response to any large growth shocks in
the next ten years;
2 Staff estimates that its recommended fiscal adjustment path would reduce the GDP level in 2020 by 0.4 percentage
points in real terms relative to the baseline. As this is a demand shock that should not affect potential output (as long
as public investment is unaffected by the expenditure cuts and the currently low unemployment does not succumb
to hysteresis effects), this loss should be offset by higher growth in a few years after 2020.
3 The feasible expenditure savings envelope also leaves ample room for financing additional cuts in labor taxation, as
discussed in ¶21.
30
60
90
120
150
30
60
90
120
150
2014
2018
2022
2026
2030
2034
2038
2042
2046
2050
2054
2058
Currently Envisaged Policies
Staff recommendation
Austria: Debt Dynamics Under Alternative Fiscal Stance Scenarios
(Percent of GDP)
-8
-6
-4
-2
0
2
-8
-6
-4
-2
0
2
2014
2017
2020
2023
2026
2029
2032
2035
2038
2041
2044
2047
2050
2053
2056
2059
Currently Envisaged Policies
Staff recommendation
Austria: Structural BalanceFiscal Stance Scenarios
(Percent of GDP)
AUSTRIA
INTERNATIONAL MONETARY FUND 11
It would allow absorbing potential materialization of tail risks in Austria’s large banking
sector while the European Resolution Fund is still being created, as well as other contingent
liabilities (e.g., from the sizable export guarantees (over 12 percent of GDP));
It would help Austria regain its AAA rating, and thus keep borrowing costs low in the long
term;
Importantly, it would also improve Austria’s structural fiscal position ahead of rising ageing
costs starting in the mid-2020s;
Finally, by ensuring that fiscal sustainability is firmly entrenched for the long run, it may
foster higher consumer and investor confidence and thus support growth.4
20. The authorities’ views were mixed. The authorities agreed that in the short run a broadly
neutral stance was appropriate. They acknowledged risks to the budget, but believed that state
institutions and local governments would reduce spending as needed to meet their budget
allocations. While some saw merit in further consolidation as recommended by staff, others noted
that the Stability Program from April 2015 targeted a structural deficit just below 0.5 percent of GDP
throughout the medium term. The next update of the Program will review these targets and the
measures to achieve them in view of changing realities and coalition discussions.
21. Further lowering of the tax burden on labor would strengthen employment and
growth. In this regard, staff welcomed the planned modest social security contributions cuts in
2017–18, while suggesting that larger cuts would better support employment and growth. The lost
revenue could be offset by a combination of expenditure cuts and hikes in consumption and
property taxes (e.g., by bringing the property taxes to the OECD ACA level and raising the reduced
VAT rates from 10–13 percent to the main rate of 20 percent over time). A revenue-neutral tax
rebalancing of this kind will be worth undertaking on its own, independent of expenditure cuts.
22. The authorities agreed that the tax burden of labor was still too high. They maintained
that further cuts would depend mainly on the ability to reduce expenditure in parallel, but noted
that at present there were no plans to impose new taxes or raise property or consumption taxes.
23. Staff argued that room for further consolidation and tax cuts could be gained by
efficiency-boosting reforms in health care, education, pensions, and subsidies. While the
authorities already started some reforms of the healthcare and pension systems in 2013, savings are
4 In the 2014 consultation, staff––led by similar arguments––recommended a structural surplus of ½ percent of GDP
to be achieved by 2018 so that debt can fall below 60 percent of GDP already by 2022. Given that growth in 2014–15
disappointed and the output gap widened relative to the 2014 projections, staff sees an argument to recommend a
slower pace of adjustment now, even though debt in 2015 is now estimated to be higher than the 2014 projections
on a comparable basis.

AUSTRIA
12 INTERNATIONAL MONETARY FUND
modest so far.5 Staff analysis suggests that spending could be reduced by up to 4 percentage points
of GDP in the medium term (text table) by increasing efficiency in the provision of key public
services where advanced country comparators have found ways to achieve the same or better
outcomes with less spending.6 Against this background, staff recommended the following menu of
specific measures:
Aligning spending to the
OECD ACA could save about a quarter
of current health expenditure. Shifting
care from hospitals to outpatient
services, better matching over time
the number of doctors to the
population’s healthcare needs in line
with best practices in advanced
countries, and reducing the number
of hospital beds (currently 60 percent
above the OECD ACA per
1,000 residents) where they are
underutilized can go a long way in
this direction.
In education, aligning spending per student to the OECD ACA would save up to
2 percentage points of GDP. Part of these savings should be spent to improve outcomes in certain
segments of the education system (e.g., early childhood and tertiary education, where attendance
and attainment are below peers’ averages, respectively).
In pensions, indexing the statutory retirement age to longevity would lower total public
pension expenditures by 1 percentage point of GDP by 2060. In the shorter run, raising the effective
retirement age by (i) enhancing incentives to work longer, (ii) better controlling disability retirement,
and (iii) bringing forward the increase in women’s retirement age (planned for 2024–2033), while
grandfathering employees close to retirement, could produce further (and faster) savings.
Continuing to reduce subsidies and tax breaks in the transport sector and fossil-fuel
industries, and avoiding duplication of subsidies at the federal and state level by introducing more
transparency and better targeting at all levels of government.
Reforming fiscal federalism by strengthening the link between revenue and expenditure at
the province and municipalities’ level. A key part of the strategy would be to benchmark spending
targets for subnational governments to the best domestic and international practices, linking tax
5 See Annexes 1–2 of Chapter I of the Selected Issues and the EC’s Austria Country Report, February 2015.
6Austria lies well away from the spending efficiency frontier of peer OECD advanced countries in key areas of
spending such as health and education (see Chapter I of the Selected Issues). To reduce the influence of idiosyncratic
factors that may affect spending, quality, and effectiveness of services in individual countries, this report compares
Austria’s spending in these areas to the average spending levels in its OECD peers.
By 2020
Health care 1/ 2.0
Education 1/ 2/ 1.0
Pensions and other social protection 0.5
Subsidies 0.5
Total Savings 4.0
Source: Staff calculations.
1/ By moving to the efficiency frontier of OECD Advanced Countries.
2/ After setting aside funds to improve outcomes.
Austria: Potential Expenditure Savings by 2020
(in percentage points of GDP)

AUSTRIA
INTERNATIONAL MONETARY FUND 13
transfers to performance relative to these targets. This would also create powerful incentives to
reduce inefficiencies.
24. The authorities agreed that spending could be trimmed in the areas indicated by staff.
They argued, however, that doing so is going to be complicated, as in key areas, like healthcare and
education, competencies pertain primarily to subnational governments. They added that a number
of reforms have already been passed to cap spending (see Appendices 1 and 2 in Chapter I of the
Selected Issues), although acknowledged that some measures did not meet saving expectations on
several grounds,7 and other reflected limits given the coalition’s members’ different perspectives on
the matter (e.g., on targets for pensions’ statutory and effective retirement age). For pensions, views
were especially divided, with some arguing that no more is needed since the pension system is now
fully sustainable thanks also to the increase in migration; and others aiming for a bolder agenda
ahead of the expected increase in the old age dependency ratio in the next decade. In addition, they
argued, negotiations between the federal and subnational governments are underway to review the
system of tax equalization, with the aim of better aligning responsibilities and supervisory powers.
B. Migration, Optimizing Integration Policies, and Other Measures to Boost Potential Growth
Background
25. On balance, the immigrants Austria attracts improve the characteristics of its labor
force. Immigrants are younger than native-born Austrians, offsetting the loss of labor force created
by ageing population. While in secondary education immigrants lag behind the native population,
the share of immigrants with tertiary education is comparable with that of native-borns. Austria also
appeals to immigrants from other EU countries, and receives more high-skilled migrants than the
average for the EU labor recipient countries.
26. Staff’s analysis suggests that with the right integration policies, immigrants can boost
potential growth and have a positive net fiscal contribution in the long run (see Chapter II of
the Selected Issues). Staff’s baseline macroeconomic projections reflect increased immigrant inflows
of about 1 percent of the working-age population on average in 2014–20. Relative to a scenario
based on the pre-2014 migration trends, by 2020 potential GDP growth would be higher by
0.2 percentage points, net pension spending would be lower by 0.3 percent of GDP, and net health-
care spending––by 0.1 percent of GDP, with the gains steadily increasing over the long run as more
immigrants get employed (Figure 7). The overall net fiscal effect of the increased immigration
inflows, taking into account all related expenditure and revenue, will remain a negative 0.2–0.3
percent of GDP in 2016–20 and turn positive in 2023. As regards the labor market, the expected
impact on wages and employment of native-born Austrians is small and positive, as the demand
7 Notably, in healthcare, caps to expenditure under the Health Reform Action Plan for 2013–2016 were formulated in
nominal terms. With inflation undershooting the assumptions, caps have not been binding in real terms.

AUSTRIA
14 INTERNATIONAL MONETARY FUND
effects created by the expansion of the population outweigh, under the most plausible
parameterization, any substitution effects for both low- and high-skilled native-born workers.
27. Staff estimates that potential growth has dropped below 1 percent in 2010–15
compared with 2.5 percent in 1990–2005. This sizeable slowdown, which started before the global
crisis, reflects slower accumulation of physical and human capital, declining labor input, and flat total
factor productivity (TFP) despite a steady increase in the capital-to-labor ratio (Figure 9). Economic
uncertainty since the onset of the financial crisis has depressed investment. While product market
regulations are not restrictive, relatively slow adoption of information and communication
technologies and excessive regulation in services appear responsible for the stagnation of TFP.
Policy Discussions
28. Staff commended the authorities for their prompt design of measures to promote
early and effective integration. These measures, which are already underway, include language
training, steps to certify job skills, and the arrangement of temporary accommodation and
healthcare. In addition, €70 million are set aside for active labor market policies in 2016. The
authorities are aware that there is a long way to go, however, before immigrants are fully integrated
in the economy and society.
29. Staff stressed that successful integration based on early, intensive, and sustained
policy response is key to reaping the benefits from immigration. In this regard, staff advised
strengthening and expanding the measures already in place by:
reducing legal obstacles to find jobs swiftly, such as restrictions on asylum seekers to take
up work while their case is being processed;
targeting active labor market policies such as training and apprenticeship contracts, work
placement programs, and skill-bridging courses to help migrants leverage and build skills;
working actively with employers to boost refugees’ chances of employment;
further modifying labor taxation of lower-wage workers—a category in which immigrants
often fall—to make work more financially attractive than receiving social benefits and thus
prevent “inactivity traps”;
providing affordable housing in the areas where labor demand is highest.
30. The authorities concurred that while the influx of refugees poses challenges in the
short-term, it is an opportunity in the medium-term. They broadly agreed with staffs’
assessment of the economic impact of immigrants for Austria. The authorities noted that the
measures they undertook are part of a comprehensive policy agenda —“Fifty Action Points”—to
facilitate the integration of immigrants along the lines suggested by staff. This agenda focuses on
early provision of language courses, assessment of immigrants’ skills, and enabling immigrants to
acquire new skills as well as continue their education in Austria. Alongside, apprenticeship programs
targeted to refugees are about to be launched. The authorities added that the government’s
initiative to secure long-term funding from the European Investment Bank for the construction of

AUSTRIA
INTERNATIONAL MONETARY FUND 15
30,000 additional dwellings would increase the supply of affordable housing across the country,
facilitating the integration of immigrants.
31. Staff also reiterated its previous advice that a strategy to boost potential growth
should rely on raising total factor productivity (TFP) and the labor input:8
To boost TFP, staff advised enhanced IT penetration, improved access to financing for start-
ups, and reduced administrative barriers for new business. Specifically, lower entry barriers in
network industries and easier regulations in professional services and retail trade would improve
competition and strengthen innovation, raising Austria’s use of high-skilled labor and ICT inputs
(Figure 10).
To propel labor supply, staff recommended further cuts in labor taxation to support a
recovery of hours worked by reducing the high marginal effective tax rate between part-time and
full-time work. Other measures aimed at strengthening labor force participation include integrating
migrant workers, raising the effective retirement age, providing more child care facilities, and
buttressing incentives for the retention of older workers in the labor force.
32. The authorities agreed that stagnant TFP growth is responsible for potential growth
slowdown. They acknowledged that financing conditions for startups are a problem in Austria and
there is a need to facilitate funding for these companies outside the banking sector. Regarding labor
supply, the authorities have introduced the so-called part-time retirement to encourage older
people to remain in the labor force longer. This gives an opportunity for people of age 62 and
higher to reduce their working hours by half instead of early retirement and receive 75 percent of
their previous wages, including 25 percent as social assistance.
C. Further Enhancing Financial Sector Resilience and Finalizing Bank
Restructuring
Background
33. Capital cushions of the major CESEE-active banks appear thin in comparison with
peers, and profitability is recovering only slowly. The CET-1 ratio of the top three banks currently
hovers around 11 percent, below their European peers (Figure 4). Profitability have turned positive in
2015, but remains subdued. Profitability in the domestic market has traditionally been low and the
current low interest rate environment generates further pressures. In CESEE, profitability remains
generally higher, but more volatile, as political and economic shocks take their toll. Examples include
state-mandated conversion of Swiss franc loans into other currencies in Hungary and Croatia and
the recessions in Russia and Ukraine.
34. Corporate and household debt levels are comparatively low, but household loans in
Swiss francs remain a concern. Corporate and household debt is below the euro area average
8 See IMF Country Report No. 14/278.

AUSTRIA
16 INTERNATIONAL MONETARY FUND
(Figure 5). However, the share of Swiss franc loans in total household mortgage loans remains
around 20 percent even after a gradual decline since 2007. These bullet loans, the bulk of which
start to mature around 2019, are usually accompanied by the accumulation of funds in a “repayment
vehicle” to be used when the loan matures. However, the OeNB estimates that the average
“repayment gap” for Swiss franc loans has increased to some 23 percent (€6 billion, some
1½ percent of banks’ risk-weighted assets) on the back of the Swiss franc’s appreciation in 2015. As
a mitigating factor, the loans are mostly owed by affluent households.9
35. Real estate price dynamics have moderated, although there are signs of overvaluation
in Vienna. Annual price increases have dropped below 5 percent recently. On the back of strong
price dynamics in previous years (Figure 5), the OeNB’s fundamentals-based indicator still suggests
an overvaluation of about 20 percent in Vienna.
36. Against this backdrop, large Austrian banks are changing their business models in
several dimensions. To rebuild capital buffers, the top three banks have been refocusing their
international presence on core markets and activities. The leader in this respect is Raiffeisen Bank
International (RBI), which plans to bring its CET-1 ratio to 12 percent of risk-weighted assets (RWA)
by end-2017 mainly by selling subsidiaries and scaling down assets in Asia and the US. Moreover,
comprehensive cost-cutting strategies are being implemented domestically and in CESEE.
37. So far, these developments would not appear to have hampered credit supply in
Austria or the CESEE. In Austria, stable but low credit growth in the past few years has been moving
in line with weak domestic aggregate demand. In CESEE, the reduction of overall exposure of
Austrian banks since the global financial crisis has been limited. Going forward, there is a risk that
cost rationalization and asset reduction efforts could constrain credit growth in some host countries
if sustained over a longer period and if credit demand strengthens, but this risk would only
materialize if other banks did not fill the void. The risk is reduced if asset reduction takes place
through the sale of subsidiaries, which is for instance a major component in the restructuring plan of
RBI and was the case in the sale of the SEE subsidiaries of former Hypo Alpe Adria bank. Ultimately,
successful restructuring should increase profitability and capital generation capacity in the medium-
term and reinforce Austrian banks’ ability to support growth and financial stability in the region.
38. In parallel, the authorities have made significant progress in revamping the regulatory
and supervisory framework for the banking sector. Key elements of the EU Banking Union have
been put in place, including the SSM framework, the Bank Recovery and Resolution Directive
(BRRD), and a pre-funded deposit guarantee scheme. On the macroprudential front, the Austrian
Financial Market Stability Board (FMSB) was created in 2014 and, upon its recommendation, the
Financial Market Authority recently introduced a systemic risk buffer of up to 2 percent of RWA to
be phased in over 2016–19. This adds to earlier macroprudential measures focusing on stronger
local funding of Austrian banks’ subsidiaries abroad and less foreign-currency loans (Annex 1).
9 More than 4/5 of the relevant households earn above median income and almost all of them have above median
wealth. Altogether, 4 percent of all Austrian households have foreign-currency-denominated debt.
AUSTRIA
INTERNATIONAL MONETARY FUND 17
However, the macroprudential toolkit still lacks sector-specific instruments, such as caps on loan-to-
value (LTV), debt-to-income (DTI), and debt-service-to-income (DSTI) ratios for mortgage loans.
39. The resolution of the banks nationalized during the crisis has progressed significantly.
The apex institution of the cooperative Volksbanken association was transformed into a wind-down
unit with bad assets of around €6 billion (1.8 percent of GDP), and part of Kommunalkredit has been
re-privatized. The remaining part of €6.3 billion (1.9 percent of GDP) was merged with the
government-owned “bad bank” KA Finanz of similar size. The sale of the CEE network of Hypo Alpe
Adria to the U.S. equity fund Advent and the EBRD was completed in July 2015, and a
government-owned wind-down entity (“HETA”) for the remaining assets had already been
established in 2014.
40. However, certain options to resolve HETA raise difficult trade-offs. In March 2015, the
Financial Market Authority issued a moratorium until May 2016 on the debt service on €13 billion of
HETA debt, €11 billion of which is guaranteed by the Austrian province of Carinthia. The moratorium
is the first step of a resolution procedure based on the Austrian transposition law of the European
Bank Recovery and Resolution Directive (BRRD). In parallel, the authorities intend to seek agreement
on a debt buyback with at least two-thirds of the HETA creditors and impose the negotiated haircut
on the rest through a retroactive collective action clause (CAC). Effectively, this would also imply the
retroactive voidance of part of Carinthia’s guarantees underlying the debt.
Policy Discussions
41. Staff commended the authorities on progress in revamping the regulatory and
supervisory framework and bank resolution but emphasized that:
The systemic capital surcharge is welcome, but banks’ capital adequacy will need to be
continuously re-assessed. The authorities should swiftly press for alternative measures if banks’
capital-building plans falter. They should also stand ready to tighten capital requirements, including
by modifying the size and phasing-in the systemic risk buffer, if early warning indicators or stress
tests flag intensified future risks.
Banks should be further encouraged to pro-actively mitigate risks from domestic Swiss franc
mortgage loans, for instance by promoting conversion to euro-denominated mortgages with
gradual amortization, loan reduction through early repayment, or higher contributions to existing
repayment vehicles.
The macroprudential toolkit should be further strengthened by introducing sector-specific
caps on LTV and DTI/DSTI ratios, possibly regionally differentiated. While not binding at present,
such caps would be useful if house prices pick up strongly in parts of the country.
Regarding HETA, the authorities need to judiciously balance the obvious benefits of a quick
resolution with the reputational and financial risks associated with a retroactive change of contracts.
The latter could, for instance, call into question the credibility of guarantees issued by some
subnational bodies and raise funding costs for some banks.

AUSTRIA
18 INTERNATIONAL MONETARY FUND
42. The authorities broadly agreed with the staff assessment. They acknowledged the need
for some banks to strengthen their capital position, and they plan to carefully monitor the
implementation of plans to this effect, standing ready to ask for additional measures in case capital-
building objectives are not met. Counterparts were also in favor of further risk-mitigating measures
by banks related to Swiss franc loans but noted that debtors would need to agree voluntarily. The
authorities welcomed the proposal of sector-specific macroprudential instruments and reported that
discussions on the design of such tools have started. As for HETA, the authorities confirmed their
preferred solution of a voluntary agreement with creditors, while acknowledging the associated
trade-offs.
STAFF APPRAISAL
43. Austria is stable and affluent. With a high income per capita and relatively low
unemployment, it is not surprising that Austria attracts immigrants from other EU member states as
well as asylum seekers from all over the world.
44. However, growth has stalled and public debt has risen. While output and employment
have risen above pre-crisis levels, actual and potential growth has fallen and public debt has risen to
86 percent of GDP. With the ongoing surge of asylum seekers, unemployment is expected to rise.
45. A decisive push for reforms is needed to address these issues and preserve Austrians’
high living standards. This requires: (i) a gradual but sustained fiscal consolidation that rebuilds
fiscal buffers by cutting inefficient expenditure; (ii) rapid integration of immigrants and other
measures to raise productivity and labor force participation, and (iii) vigilance regarding risks in the
large financial sector, and efficient asset disposal by wind-down units of resolved banks.
46. The fiscal stance needs to strike a balance between supporting activity and rebuilding
buffers. Until the output gap closes, this means a broadly neutral fiscal stance, as envisaged in the
2016 budget. However, complying with the budget plans will likely require additional measures to
counteract risks related to the financing of the 2016 personal income tax reform. In the medium
term, high public debt and looming ageing costs call for further fiscal consolidation.
47. Moving gradually to a structural surplus of ½ percent of GDP by 2020 and keeping it
until the debt-to-GDP ratio reaches 60 percent of GDP would have several advantages. It
would regain space early on for countercyclical fiscal policy and the absorption of tail risks, improve
Austria’s structural fiscal position ahead of rising ageing costs, and allow faster return of the AAA
credit rating and sustained low borrowing costs in the long run.
48. Needed fiscal consolidation should be delivered by broad reform-based cuts in large
expenditure areas where Austria spends more than peers without achieving better outcomes.
Indeed, staff estimates potential savings at 4 percentage points of GDP by 2020. Crucial areas are
health care, education, subsidies, and pensions.

AUSTRIA
INTERNATIONAL MONETARY FUND 19
49. To reap these gains, a national strategy to reduce costs, fully coordinated across
government levels, is essential. A key part of the strategy would be to benchmark spending
targets to the best domestic and international practices. A concerted effort should also be made to
avoid duplication of services between the various levels of government and ensure their effective
and efficient provision.
50. Decisive expenditure reforms would also make room for further reduction of the labor
tax wedge. In particular, the high social security contributions could be reduced more substantially
beyond the modest cuts envisaged for 2017–18 to support demand for labor and help absorb the
rising labor supply. Such cuts are desirable even if expenditure is not reduced sufficiently, and could
be financed in a revenue-neutral way by hikes in consumption, wealth, and environment-friendly
taxes, which remain below international averages.
51. Efforts to integrate immigrants and advance structural reforms to raise potential
growth and improve the fiscal accounts need to be sustained. An early, intensive, and sustained
policy response is key for reaping the benefits from immigration, which could raise potential growth
by ¼ of a percentage point by 2020 and produce steady fiscal gains in the long term. In addition, as
emphasized in previous consultations, policies to raise total factor productivity growth and labor
force participation are needed to bolster potential growth.
52. The authorities have made significant progress in revamping the regulatory and
supervisory framework of the banking sector. Key elements of the EU Banking Union have been
put in place. On the macroprudential front, the Austrian Financial Market Stability Board is up and
running and, upon its proposal, a systemic risk buffer will be phased in during 2016–19.
53. Nevertheless, financial sector resilience should be further strengthened. Banks’ capital
adequacy will need to be continuously monitored and re-assessed. The authorities should swiftly
press for alternative measures if banks’ capital-building plans falter. They should also stand ready to
tighten capital requirements if early warning indicators or stress tests flag intensified future risks. In
addition, banks need to be further encouraged to proactively mitigate risks related to Swiss franc
mortgage loans. Furthermore, macroprudential preparedness should be strengthened by
introducing instruments such as caps on loan-to-value, debt-to-income, and debt-service-to-income
ratios for mortgage loans, possibly regionally differentiated.
54. It is recommended that the next Article IV consultation with Austria be held on the standard
12–month cycle.

AUSTRIA
20 INTERNATIONAL MONETARY FUND
Figure 1. Recent Economic Developments
Sources: Austrian authorities; WIFO; Eurostat; Haver Analytics; WEO; and IMF staff calculations.
-5
-4
-3
-2
-1
0
1
2
3
-5
-4
-3
-2
-1
0
1
2
3
2007Q
1
2007Q
3
2008Q
1
2008Q
3
2009Q
1
2009Q
3
2010Q
1
2010Q
3
2011Q
1
2011Q
3
2012Q
1
2012Q
3
2013Q
1
2013Q
3
2014Q
1
2014Q
3
2015Q
1
2015Q
3
Austria
France
Euro area
Germany
Real GDP Growth
(qoq, percent change)
-3
-2
-1
0
1
2
3
4
75
80
85
902007Q
1
2007Q
3
2008Q
1
2008Q
3
2009Q
1
2009Q
3
2010Q
1
2010Q
3
2011Q
1
2011Q
3
2012Q
1
2012Q
3
2013Q
1
2013Q
3
2014Q
1
2014Q
3
2015Q
1
2015Q
3
Output gap (RHS)
Capacity utilization
Capacity Utilization
(In percent, SA)
-1
0
1
2
3
4
5
-1
0
1
2
3
4
5
2007M
1
2007M
7
2008M
1
2008M
7
2009M
1
2009M
7
2010M
1
2010M
7
2011M
1
2011M
7
2012M
1
2012M
7
2013M
1
2013M
7
2014M
1
2014M
7
2015M
1
2015M
7
Austria - Headline Austria - Core
Euro area - Headline Euro area - Core
Harmonized CPI
(Annual percentage change)
Growth remains positive...
The output gap is moderate.
While core inflation is close to 2 percent, headline
inflation remains well below the ECB's objective.
Unemployment, although rising, remains low.
-3
-2
-1
0
1
2
3
-3
-2
-1
0
1
2
3
2007Q
1
2007Q
3
2008Q
1
2008Q
3
2009Q
1
2009Q
3
2010Q
1
2010Q
3
2011Q
1
2011Q
3
2012Q
1
2012Q
3
2013Q
1
2013Q
3
2014Q
1
2014Q
3
2015Q
1
2015Q
3
Total domestic demand
Net exports
Real GDP growth
Real GDP Growth and Growth Contributions
(qoq, in percent)
-5
-4
-3
-2
-1
0
1
2
-50
-40
-30
-20
-10
0
10
20
2007M
1
2007M
7
2008M
1
2008M
7
2009M
1
2009M
7
2010M
1
2010M
7
2011M
1
2011M
7
2012M
1
2012M
7
2013M
1
2013M
7
2014M
1
2014M
7
2015M
1
2015M
7
Economic Sentiment
(dev. fr. 100)
PMI Manufacturing (dev.
fr. 50)
WIFO Composite (RHS,
sd)
Leading Indicators
... broadly in line with peers...
...and appears set to strengthen.
0
2
4
6
8
10
12
14
0
2
4
6
8
10
12
14
2007Q
1
2007Q
3
2008Q
1
2008Q
3
2009Q
1
2009Q
3
2010Q
1
2010Q
3
2011Q
1
2011Q
3
2012Q
1
2012Q
3
2013Q
1
2013Q
3
2014Q
1
2014Q
3
2015Q
1
2015Q
3
Austria France
Euro area Germany
Harmonized Unemployment Rate
(In percent)

AUSTRIA
INTERNATIONAL MONETARY FUND 21
Figure 2. Selected Financial Market Indicators
Sources: Bloomberg and Thomson Financial/DataStream.
0
20
40
60
80
100
120
0
20
40
60
80
100
120
1/1
/07
7/1
/07
1/1
/08
7/1
/08
1/1
/09
7/1
/09
1/1
/10
7/1
/10
1/1
/11
7/1
/11
1/1
/12
7/1
/12
1/1
/13
7/1
/13
1/1
/14
7/1
/14
1/1
/15
7/1
/15
1/1
/16
Equities
(1/1/07 = 100)
Erste Bank
Raiffeisen
Euro area banks
ATX
0
50
100
150
200
250
300
350
400
450
500
0
50
100
150
200
250
300
350
400
450
500
1/1
/07
7/1
/07
1/1
/08
7/1
/08
1/1
/09
7/1
/09
1/1
/10
7/1
/10
1/1
/11
7/1
/11
1/1
/12
7/1
/12
1/1
/13
7/1
/13
1/1
/14
7/1
/14
1/1
/15
7/1
/15
1/1
/16
Credit Default Swaps, 5-year
(Basis points, 30-day moving average)
Deutsche Bank
Erste Bank
Raiffeisen
Unicredit
0
50
100
150
200
250
300
0
50
100
150
200
250
300
1/1
/07
7/1
/07
1/1
/08
7/1
/08
1/1
/09
7/1
/09
1/1
/10
7/1
/10
1/1
/11
7/1
/11
1/1
/12
7/1
/12
1/1
/13
7/1
/13
1/1
/14
7/1
/14
1/1
/15
7/1
/15
1/1
/16
Sovereign CDS, 5-year
(Basis points)
Austria
Netherlands
France
0
50
100
150
200
0
50
100
150
200
1/1
/07
7/1
/07
1/1
/08
7/1
/08
1/1
/09
7/1
/09
1/1
/10
7/1
/10
1/1
/11
7/1
/11
1/1
/12
7/1
/12
1/1
/13
7/1
/13
1/1
/14
7/1
/14
1/1
/15
7/1
/15
1/1
/16
10-year Sovereign Spread with Germany Bund
(Basis points)
Austria
Netherlands
France
-1
0
1
2
3
4
5
-1
0
1
2
3
4
5
1/1
/07
7/1
/07
1/1
/08
7/1
/08
1/1
/09
7/1
/09
1/1
/10
7/1
/10
1/1
/11
7/1
/11
1/1
/12
7/1
/12
1/1
/13
7/1
/13
1/1
/14
7/1
/14
1/1
/15
7/1
/15
1/1
/16
Austrian Government Interest Rates
(Percent)
10 year
2 year
0.0
0.5
1.0
1.5
2.0
2.5
3.0
0.0
0.5
1.0
1.5
2.0
2.5
3.01/1
/13
3/1
/13
5/1
/13
7/1
/13
9/1
/13
11/1
/13
1/1
/14
3/1
/14
5/1
/14
7/1
/14
9/1
/14
11/1
/14
1/1
/15
3/1
/15
5/1
/15
7/1
/15
9/1
/15
11/1
/15
1/1
/16
Austrian Bank Bond Yield
(Percent, Bond maturity in 2016/17)
Raiffeisen Erste Bank
Unicredit
Sovereign spreads have narrowed.
So do bank spreads. However, bank equity valuations are mixed.
Sovereign and bank bond yields remain low.
AUSTRIA
22 INTERNATIONAL MONETARY FUND
Figure 3. External Sector
-3
-2
-1
0
1
2
3
4
5
6
-3
-2
-1
0
1
2
3
4
5
6 Transfers Income
Services Goods
Total
Current Account Balance
(Percent of GDP)
Sources: Direction of Trade Statistics, EU Cost Price Indicators for Euro area, Haver Analytics, OeNB.
Austria has a moderate current account surplus which
reflects strong revenue from tourism.
The REER has been broadly stable over the past decade... ...and so has Austria's share of world exports.
Its net international investment position is near zero.
88
90
92
94
96
98
100
102
88
90
92
94
96
98
100
102
1999
2000
2001
2002
2003
2004
2005
2006
2007
2008
2009
2010
2011
2012
2013
2014
2015
HCPI Deflated PPI Deflated
ULC Deflated GDP Deflated
Austria: Real Effective Exchange Rates
(Euro area indices, 1999 = 100)
0
2
4
6
8
10
12
0
2
4
6
8
10
12
Austria Germany Italy
Share of World Exports
(Percent)
-50
-40
-30
-20
-10
0
10
20
30
40
50
60
-50
-40
-30
-20
-10
0
10
20
30
40
50
60Reserves Derivatives Other
Portfolio FDI IIP
International Investment Position
(Percent of GDP)

AUSTRIA
INTERNATIONAL MONETARY FUND 23
Figure 4. Banking Sector
Sources: OeNB; Bloomberg; SNL Financial; BIS consolidated banking statistics; and IMF staff calculations.
1/ Austrian banks are shown in red and non-Austrian banks are shown in blue. The set of "large European banks"
includes 2 Belgian banks, 1 Danish bank, 4 French banks, 3 German banks, 2 Irish banks, 5 Italian banks, 1 Dutch bank,
1 Norwegian bank, 5 Spanish banks, 4 Swedish banks, 1 Swiss bank, and 6 British banks.
2/ Series includes foreign-owned banks and is adjusted for currency movements and provisions.
0
5
10
15
20
25
0
5
10
15
20
25
2014 2011
Selected Large European Banks: Tier I Ratio 2011-2014 1/
(Percent)
0
10
20
30
40
50
60
70
80
0
10
20
30
40
50
60
70
80
SRB HRV UKR BIH ROM BGR RUS HUN CZE SVN SVK
Share of Foreign Currency Loans in the Lending of
Austrian Banks’ Subsidiaries
Bank capitalization remains low relative to peers... ... and so are market valuations.
Returns have come down... ...and NPLs remain high...
0
2
4
6
8
10
12
14
0
2
4
6
8
10
12
14
CZE
HR
V
RO
M
RU
S
HU
N
SV
K
PO
L
SV
N
UK
R
BG
R
TU
R
SR
B
BIH
KA
Z
ALB BEL
2008
2015Q1
CESEE Exposures
(Percent of 2013 GDP)
...with high CESEE exposure... ...and legacy foreign currency lending.
0.0
0.5
1.0
1.5
0.0
0.5
1.0
1.5
Austria Peers
2011 2015
Price to Book Ratio of Austrian Banks
-3.0
-2.5
-2.0
-1.5
-1.0
-0.5
0.0
0.5
1.0
1.5
2.0
-3.0
-2.5
-2.0
-1.5
-1.0
-0.5
0.0
0.5
1.0
1.5
2.0
2014 2007
Selected Large European Banks: Return on Assets 2007-14
2/ (Percent)
0
5
10
15
20
25
30
35
40
0
5
10
15
20
25
30
35
40
2014 2011
Selected Large European Banks: Nonperforming loans
ratio, 2011-14 1/ (Percent)

AUSTRIA
24 INTERNATIONAL MONETARY FUND
Figure 5. Corporate and Household Indebtedness and House Prices
Sources: ECB, Eurostat, Haver Analytics, OeNB, and Statistics Austria.
1/ Up-to-one-year fixed rate for house purchases loans to household.
2/ Up-to-one-year fixed rate for new loans over 1 million euros to non-financial corporations.
3/ For household time deposits with maturity up to one year.
4/ Includes total of short-term and long-term loans.
Corporate and household debt is below the euro area average...
...with a high foreign currency (Swiss franc) share for
households, however.
House price growth was strong over recent years but
has moderated recently.
0
5
10
15
20
25
30
35
0
5
10
15
20
25
30
35
2007
2008
2009
2010
2011
2012
2013
2014
2015
Austria Euro area
Household foreign currency loans
(Percent of total loans)
60
65
70
75
80
85
90
95
100
105
110
60
65
70
75
80
85
90
95
100
105
110
2000
2001
2002
2003
2004
2005
2006
2007
2008
2009
2010
2011
2012
2013
2014
Austria Euro Area
Corporate Debt
(Percent of GDP)
30
35
40
45
50
55
60
65
70
30
35
40
45
50
55
60
65
70
2000
2001
2002
2003
2004
2005
2006
2007
2008
2009
2010
2011
2012
2013
2014
Austria Euro Area
Household Debt 4/
(Percent of GDP)
-40
-30
-20
-10
0
10
20
30
40
50
60
-40
-30
-20
-10
0
10
20
30
40
50
60
ESP
HR
V
IRL
CYP
NLD
DN
K
MLT
BEL
EST
DEU
ISL
FIN
GBR
AU
T
SW
E
NO
RChange in House Prices Index, 2008-14
(Percent)
Credit growth remains stable but low...
-2
0
2
4
6
8
10
-2
0
2
4
6
8
10
2007M
1
2007M
7
2008M
1
2008M
7
2009M
1
2009M
7
2010M
1
2010M
7
2011M
1
2011M
7
2012M
1
2012M
7
2013M
1
2013M
7
2014M
1
2014M
7
2015M
1
2015M
7
Corporate
Household
Credit Growth
(y-o-y percent change, exchange rate-adjusted)
0
1
2
3
4
5
6
7
0
1
2
3
4
5
6
7
2007M
1
2007M
7
2008M
1
2008M
7
2009M
1
2009M
7
2010M
1
2010M
7
2011M
1
2011M
7
2012M
1
2012M
7
2013M
1
2013M
7
2014M
1
2014M
7
2015M
1
2015M
7
HH lending rate 1/
NFC lending rate 2/
HH deposit rate 3/
Interest Rates
(Percent)
...in spite of low interest rates.

AUSTRIA
INTERNATIONAL MONETARY FUND 25
Figure 6. Fiscal Developments and Outlook
Figure 6. Austria: Fiscal Developments and Outlook
Sources: Austrian authorities; EC; IMF WEO; and IMF staff calculations and projections.
-6
-5
-4
-3
-2
-1
0
-6
-5
-4
-3
-2
-1
0
2007 2008 2009 2010 2011 2012 2013 2014 2015
Structural deficit
Headline Deficit
Deficit
(Percent of GDP)
50
55
60
65
70
75
80
85
90
50
55
60
65
70
75
80
85
90
2007 2008 2009 2010 2011 2012 2013 2014 2015
Public Debt
(Percent of GDP)
0
20
40
60
80
100
120
0
20
40
60
80
100
120
2007 2009 2011 2013 2015 2017 2019
AUT DEU DNK
FIN LUX SWE
CHE NOR
General Government Debt, 2007-20
(Percent of GDP)
...but debt has increased substantially, driven by bank
restructuring expenses.
Current fiscal plans leave Austria's debt above
peers...
The structural deficit has narrowed...
70
75
80
85
90
95
100
70
75
80
85
90
95
100
2016 2017 2018 2019 2020 2021
Baseline
Real GDP Growth Shock
Contingent Liability Shock
DSA Debt Stress Tests
(Percent of GDP)
…and standard DSA growth and contingent liability
shocks would increase debt significantly.

AUSTRIA
26 INTERNATIONAL MONETARY FUND
Figure 7. Migrants Integration Policies and Economic Impact of Immigrants
Oesterreichische Nationalbank.
Sources: Eurostat, MIPEX index database, and IMF staff calculations.
1/ Migrant Integration Policy Index (MIPEX) benchmarks current laws and policies of individual countries against the highest
relevant standards through consultations with top scholars and institutions.
2/The baseline scenario reflects migrant inflows of 1 percent of the working-age population (WAP) a year, the higher inflow
scenario assumes 1.7 percent of the WAP, while the low inflow scenario corresponds to pre 2014 migration trends.
3/ Net pension and health care spending are net of the respective social security contributions generated by employed
immigrants.
The share of potential output generated by immigarnts
has been increasing.
Successful integration of migrants can raise Austria's
potential growth.
Austria's position on the MIPEX index has improved since
2007...
...however, Austria is still modestly lagging the EU average
on some policies to integrate the migrants.
Successful integration of immigrants in the economy could
reduce notably net pension cost relative to GDP...
0
10
20
30
40
50
60
70
80
90
0
10
20
30
40
50
60
70
80
90
Po
rtu
gal
Sw
ed
en
Can
ad
a
No
rway
Fin
lan
d
Neth
erl
an
ds
Belg
ium
Italy
Sp
ain
Germ
an
y
Un
ited
Kin
gd
om
Fra
nce
Irela
nd
Den
mark
Luxe
mb
ou
rg
Sw
itze
rlan
d
Au
stri
a
Gre
ece
MIPEX Index 1/
2014 2007
010203040506070
Overall MIPEX
Family reunion
Political
participation
Permanent
residency
Access to
citizenship
Anti-
discrimination
Labor market
mobility
Access to
education
Access to health
MIPEX index 1/
Austria
EU28
-
0.5
1.0
1.5
2.0
2.5
3.0
3.5
-
0.5
1.0
1.5
2.0
2.5
3.0
3.5
2015 2025 2035 2045 2055
Reduction in Net Pension Spending Relative to Pre
2014 Migration Trends, 2015-60 2/ 3/
Baseline
High migration scenario
-
0.5
1.0
1.5
-
0.5
1.0
1.5
2015 2025 2035 2045 2055
Reduction in Net Health Care Spending Relative to
Pre 2014 Migration Trends, 2015-60 2/ 3/
Baseline
High migration scenario
93
94
95
96
97
98
99
100
93
94
95
96
97
98
99
100
Distribution of Potential Output, 1995-2015
Natives Immigrants
0.0
0.2
0.4
0.6
0.8
1.0
1.2
1.4
1.6
0.0
0.2
0.4
0.6
0.8
1.0
1.2
1.4
1.6
2015 2016 2017 2018 2019 2020
Potential Growth Projections, 2015-2020 2/
Baseline scenario
High migration inflow scenario
Low migration inflow scenario
... and to a lesser extent net health care cost.
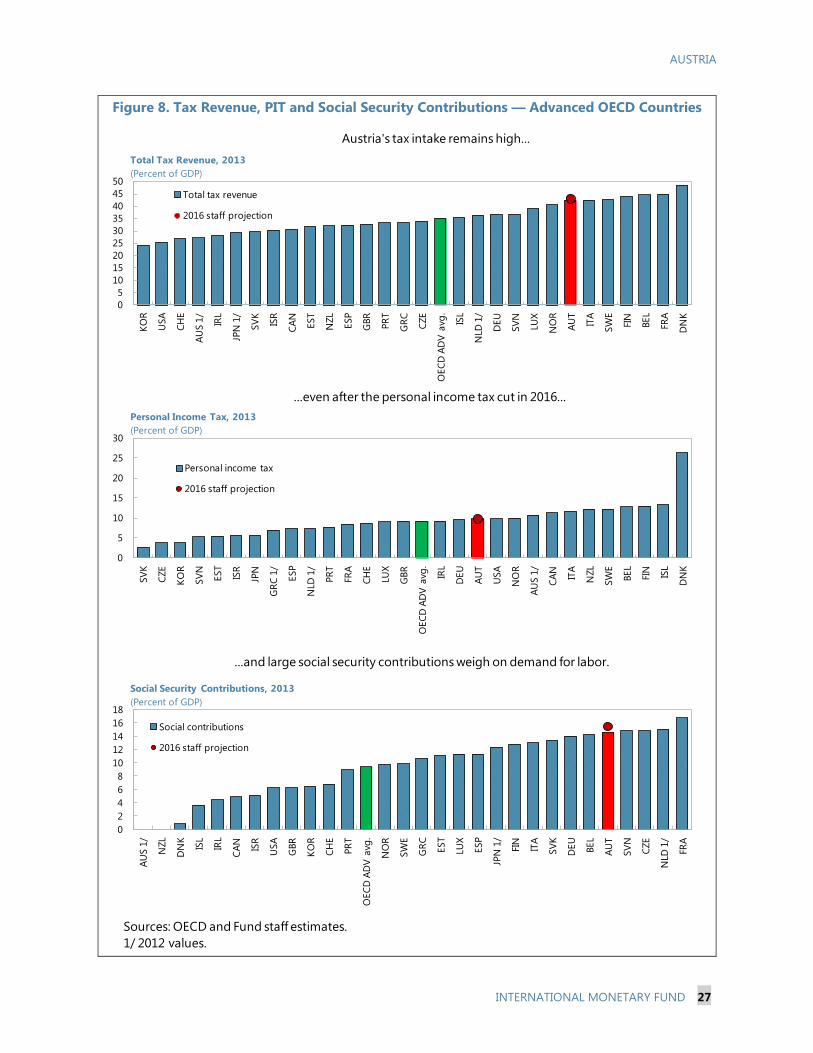
AUSTRIA
INTERNATIONAL MONETARY FUND 27
Figure 8. Tax Revenue, PIT and Social Security Contributions — Advanced OECD Countries
Sources: OECD and Fund staff estimates.
1/ 2012 values.
0
5
10
15
20
25
30
35
40
45
50
KO
R
USA
CH
E
AU
S 1
/
IRL
JPN
1/
SV
K
ISR
CA
N
EST
NZL
ESP
GBR
PR
T
GR
C
CZE
OEC
D A
DV
avg
.
ISL
NLD
1/
DEU
SV
N
LUX
NO
R
AU
T
ITA
SW
E
FIN
BEL
FRA
DN
K
Total tax revenue
2016 staff projection
Total Tax Revenue, 2013
(Percent of GDP)
0
5
10
15
20
25
30
SV
K
CZE
KO
R
SV
N
EST
ISR
JPN
GR
C 1
/
ESP
NLD
1/
PR
T
FRA
CH
E
LUX
GBR
OEC
D A
DV
avg
.
IRL
DEU
AU
T
USA
NO
R
AU
S 1
/
CA
N
ITA
NZL
SW
E
BEL
FIN
ISL
DN
K
Personal income tax
2016 staff projection
Personal Income Tax, 2013
(Percent of GDP)
0
2
4
6
8
10
12
14
16
18
AU
S 1
/
NZL
DN
K
ISL
IRL
CA
N
ISR
USA
GBR
KO
R
CH
E
PR
T
OEC
D A
DV
avg
.
NO
R
SW
E
GR
C
EST
LUX
ESP
JPN
1/
FIN
ITA
SV
K
DEU
BEL
AU
T
SV
N
CZE
NLD
1/
FRA
Social contributions
2016 staff projection
Social Security Contributions, 2013
(Percent of GDP)
Austria's tax intake remains high...
...even after the personal income tax cut in 2016...
...and large social security contributions weigh on demand for labor.

AUSTRIA
28 INTERNATIONAL MONETARY FUND
Figure 9. Potential Growth and Productivity
Sources: Eurostat, Haver Analytics, and IMF staff calculations.
Potential growth decelerated driven by slower accumulation of physical and human capital, negative contribution from
the labor force, and lackluster productivity growth.
GDP per person employed has stagnated since 2007... ...despite the steady increase in the stock of capital...
-1.5
-1.0
-0.5
0.0
0.5
1.0
1.5
2.0
2.5
3.0
3.5
4.0
-1.5
-1.0
-0.5
0.0
0.5
1.0
1.5
2.0
2.5
3.0
3.5
4.0
1990
1991
1992
1993
1994
1995
1996
1997
1998
1999
2000
2001
2002
2003
2004
2005
2006
2007
2008
2009
2010
2011
2012
2013
2014
2015
Potential Growth Decomposition, 1990-2015
(Percent)
Capital Human capital Labor TFP potential growth
...reflecting sluggish growth in total factor productivity... ...and declining average hours worked...
70
75
80
85
90
95
100
105
70
75
80
85
90
95
100
105
1990
1992
1994
1996
1998
2000
2002
2004
2006
2008
2010
2012
2014
GDP per Person Employed
(2007=100)
70
75
80
85
90
95
100
105
110
70
75
80
85
90
95
100
105
1101990
1992
1994
1996
1998
2000
2002
2004
2006
2008
2010
2012
2014
Net Capital Stock per Person Employed
(2007=100)
80
85
90
95
100
105
80
85
90
95
100
105
1990
1992
1994
1996
1998
2000
2002
2004
2006
2008
2010
2012
2014
Total Factor Productivity
(2007 = 100)
85
90
95
100
105
110
85
90
95
100
105
110
1990
1992
1994
1996
1998
2000
2002
2004
2006
2008
2010
2012
2014
Average Hours Worked
(2007=100)
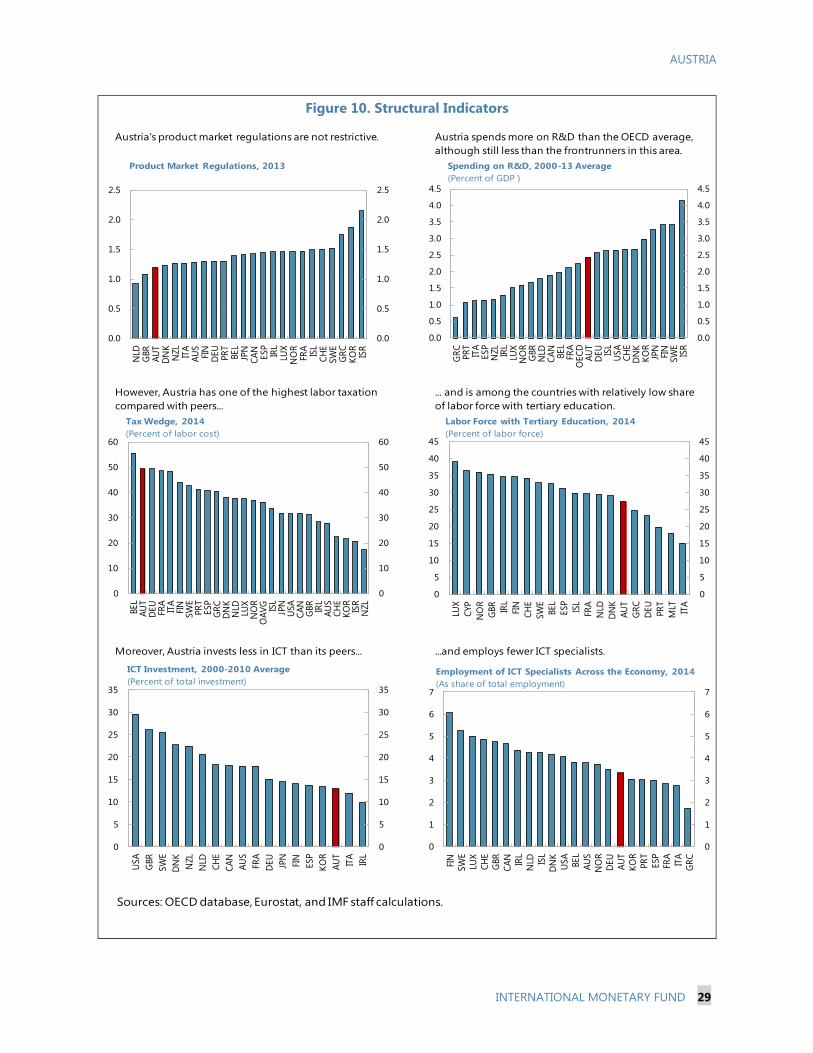
AUSTRIA
INTERNATIONAL MONETARY FUND 29
Figure 10. Structural Indicators
Sources: OECD database, Eurostat, and IMF staff calculations.
Moreover, Austria invests less in ICT than its peers... ...and employs fewer ICT specialists.
Austria's product market regulations are not restrictive. Austria spends more on R&D than the OECD average,
although still less than the frontrunners in this area.
0.0
0.5
1.0
1.5
2.0
2.5
0.0
0.5
1.0
1.5
2.0
2.5
NLD
GBR
AU
TD
NK
NZL
ITA
AU
SFI
ND
EU
PR
TBEL
JPN
CA
NESP
IRL
LUX
NO
RFR
AIS
LC
HE
SW
EG
RC
KO
RIS
R
Product Market Regulations, 2013
0.0
0.5
1.0
1.5
2.0
2.5
3.0
3.5
4.0
4.5
0.0
0.5
1.0
1.5
2.0
2.5
3.0
3.5
4.0
4.5
GR
CPR
TIT
AESP
NZL
IRL
LUX
NO
RG
BR
NLD
CA
NBEL
FRA
OEC
DA
UT
DEU
ISL
USA
CH
ED
NK
KO
RJP
NFI
NSW
EIS
R
Spending on R&D, 2000-13 Average
(Percent of GDP )
However, Austria has one of the highest labor taxation
compared with peers...
... and is among the countries with relatively low share
of labor force with tertiary education.
0
10
20
30
40
50
60
0
10
20
30
40
50
60
BEL
AU
TD
EU
FRA
ITA
FIN
SW
EPR
TESP
GR
CD
NK
NLD
LUX
NO
RO
AV
G ISL
JPN
USA
CA
NG
BR
IRL
AU
SC
HE
KO
RIS
RN
ZL
Tax Wedge, 2014
(Percent of labor cost)
0
5
10
15
20
25
30
35
40
45
0
5
10
15
20
25
30
35
40
45
LUX
CYP
NO
R
GBR
IRL
FIN
CH
E
SW
E
BEL
ESP
ISL
FRA
NLD
DN
K
AU
T
GR
C
DEU
PR
T
MLT ITA
Labor Force with Tertiary Education, 2014
(Percent of labor force)
0
5
10
15
20
25
30
35
0
5
10
15
20
25
30
35
USA
GBR
SW
E
DN
K
NZL
NLD
CH
E
CA
N
AU
S
FRA
DEU
JPN
FIN
ESP
KO
R
AU
T
ITA
IRL
ICT Investment, 2000-2010 Average
(Percent of total investment)
0
1
2
3
4
5
6
7
0
1
2
3
4
5
6
7
FIN
SW
E
LUX
CH
E
GBR
CA
N
IRL
NLD IS
L
DN
K
USA
BEL
AU
S
NO
R
DEU
AU
T
KO
R
PR
T
ESP
FRA
ITA
GR
C
Employment of ICT Specialists Across the Economy, 2014
(As share of total employment)
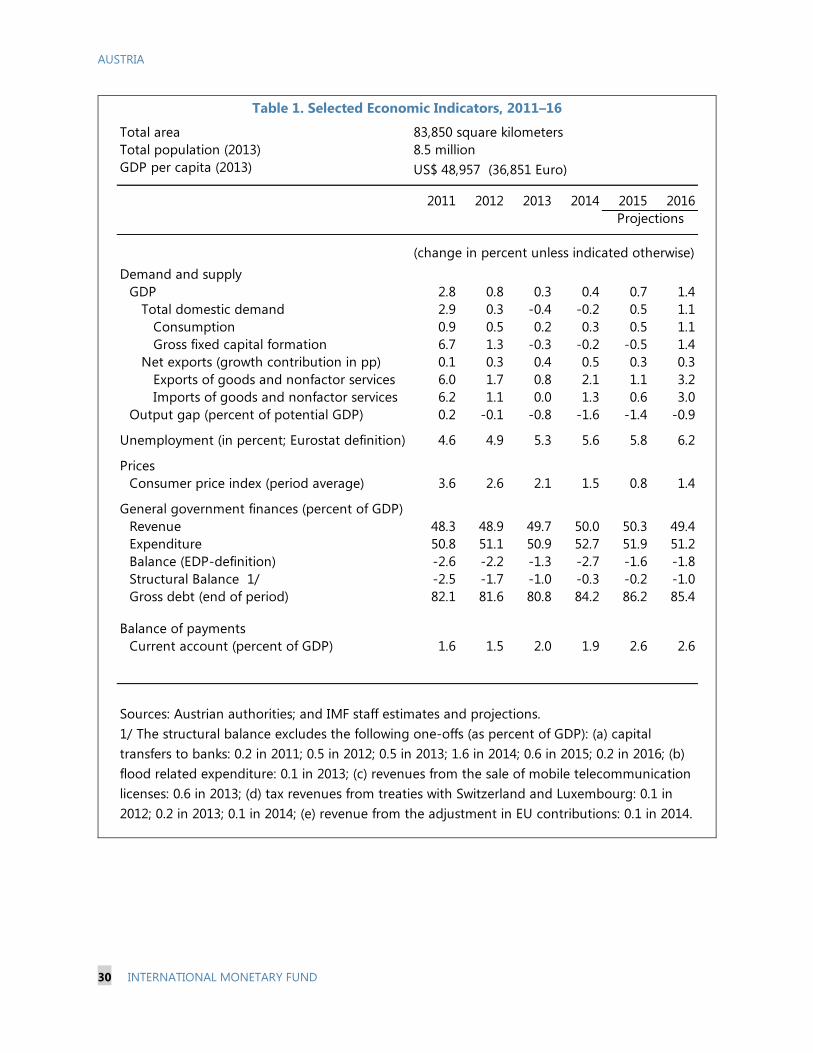
AUSTRIA
30 INTERNATIONAL MONETARY FUND
Table 1. Selected Economic Indicators, 2011–16
Total area 83,850 square kilometers
Total population (2013) 8.5 million
GDP per capita (2013) US$ 48,957 (36,851 Euro)
2011 2012 2013 2014 2015 2016
Demand and supply
GDP 2.8 0.8 0.3 0.4 0.7 1.4
Total domestic demand 2.9 0.3 -0.4 -0.2 0.5 1.1
Consumption 0.9 0.5 0.2 0.3 0.5 1.1
Gross fixed capital formation 6.7 1.3 -0.3 -0.2 -0.5 1.4
Net exports (growth contribution in pp) 0.1 0.3 0.4 0.5 0.3 0.3
Exports of goods and nonfactor services 6.0 1.7 0.8 2.1 1.1 3.2
Imports of goods and nonfactor services 6.2 1.1 0.0 1.3 0.6 3.0
Output gap (percent of potential GDP) 0.2 -0.1 -0.8 -1.6 -1.4 -0.9
Unemployment (in percent; Eurostat definition) 4.6 4.9 5.3 5.6 5.8 6.2
Prices
Consumer price index (period average) 3.6 2.6 2.1 1.5 0.8 1.4
General government finances (percent of GDP)
Revenue 48.3 48.9 49.7 50.0 50.3 49.4
Expenditure 50.8 51.1 50.9 52.7 51.9 51.2
Balance (EDP-definition) -2.6 -2.2 -1.3 -2.7 -1.6 -1.8
Structural Balance 1/ -2.5 -1.7 -1.0 -0.3 -0.2 -1.0
Gross debt (end of period) 82.1 81.6 80.8 84.2 86.2 85.4
Balance of payments
Current account (percent of GDP) 1.6 1.5 2.0 1.9 2.6 2.6
Sources: Austrian authorities; and IMF staff estimates and projections.
Projections
(change in percent unless indicated otherwise)
1/ The structural balance excludes the following one-offs (as percent of GDP): (a) capital
transfers to banks: 0.2 in 2011; 0.5 in 2012; 0.5 in 2013; 1.6 in 2014; 0.6 in 2015; 0.2 in 2016; (b)
flood related expenditure: 0.1 in 2013; (c) revenues from the sale of mobile telecommunication
licenses: 0.6 in 2013; (d) tax revenues from treaties with Switzerland and Luxembourg: 0.1 in
2012; 0.2 in 2013; 0.1 in 2014; (e) revenue from the adjustment in EU contributions: 0.1 in 2014.

AUSTRIA
INTERNATIONAL MONETARY FUND 31
Table 2. Medium-Term Macroeconomic Framework, 2011–21
2011 2012 2013 2014 2015 2016 2017 2018 2019 2020 2021
National accounts
GDP (growth in percent) 2.8 0.8 0.3 0.4 0.7 1.4 1.4 1.3 1.1 1.1 1.1
Total domestic demand 2.9 0.3 -0.4 -0.2 0.5 1.1 1.2 1.1 1.0 1.0 1.0
Consumption 0.9 0.5 0.2 0.3 0.5 1.1 1.2 1.0 0.9 0.9 1.0
of which: Private consumption 1.3 0.6 0.1 0.0 0.4 1.2 1.2 1.1 1.0 1.0 1.0
Gross fixed capital formation 6.7 1.3 -0.3 -0.2 -0.5 1.4 1.4 1.3 1.1 1.1 0.9
Exports of goods and nonfactor services 6.0 1.7 0.8 2.1 1.1 3.2 3.8 3.8 4.0 4.0 4.0
Imports of goods and nonfactor services 6.2 1.1 0.0 1.3 0.6 3.0 3.7 3.8 3.9 4.1 4.1
Growth contributions (percentage points)
Final domestic demand 2.2 0.6 0.1 0.1 0.3 1.1 1.1 1.0 0.9 0.9 0.9
Net exports 0.1 0.3 0.4 0.5 0.3 0.3 0.2 0.2 0.2 0.2 0.2
Inventories and statistical discrepancies 0.6 -0.2 -0.2 -0.3 0.2 0.0 0.0 0.0 0.0 0.0 0.0
Prices and unemployment
CPI inflation (pa; annual percent change) 3.6 2.6 2.1 1.5 0.8 1.4 1.8 1.9 2.0 2.0 2.0
Unemployment rate (percent) 4.6 4.9 5.3 5.6 5.8 6.2 6.4 6.3 6.2 6.2 6.2
Current account balance 1.6 1.5 2.0 1.9 2.6 2.6 2.7 2.6 2.5 2.4 2.4
Goods and services balance 2.2 2.4 2.8 3.7 3.4 3.5 3.6 3.5 3.5 3.4 3.3
General government accounts
Revenue 48.3 48.9 49.7 50.0 50.3 49.4 49.2 49.1 49.1 49.2 49.3
Expenditure 50.8 51.1 50.9 52.7 51.9 51.2 50.6 50.3 50.1 50.2 50.4
Balance -2.6 -2.2 -1.3 -2.7 -1.6 -1.8 -1.4 -1.3 -1.0 -1.0 -1.1
Gross debt 82.1 81.6 80.8 84.2 86.2 85.4 83.7 81.9 80.1 78.3 77.0
Structural balance 1/ -2.5 -1.7 -1.0 -0.3 -0.2 -1.0 -1.0 -1.1 -1.0 -1.0 -1.1
Memorandum items:
Overall balance (EDP-definition) -2.6 -2.2 -1.3 -2.7 -1.6 -1.8 -1.4 -1.3 -1.0 -1.0 -1.1
Gross national saving 25.5 25.4 25.1 23.5 24.8 24.9 24.9 24.9 24.9 24.7 24.7
Gross domestic investment 24.2 24.0 23.3 22.8 22.3 22.3 22.2 22.3 22.3 22.3 22.3
Real effective exchange rate (percentage change) 1.8 -1.6 2.2 1.5 … … … … … … …
International investment position -1.8 -3.2 0.7 2.0 4.8 7.3 9.7 12.0 14.2 16.4 18.8
Potential output (growth in percent) 0.8 1.1 1.0 1.1 0.6 0.8 0.9 0.9 1.1 1.1 1.1
Output gap (in percent of potential output) 0.2 -0.1 -0.8 -1.6 -1.4 -0.9 -0.4 0.0 0.0 0.0 0.0
GDP (current prices, in billion euro) 308.6 317.1 322.9 329.3 337.2 346.9 357.6 368.2 378.9 389.8 401.0
1/ The structural balance excludes the following one-offs (as percent of GDP): (a) capital transfers to banks: 0.2 in 2011; 0.5 in 2012; 0.5 in 2013;
1.6 in 2014; 0.6 in 2015; 0.2 in 2016; and 0.1 in the years 2017-19; (b) flood related expenditure: 0.1 in 2013; (c) revenues from the sale of mobile
telecommunication licenses: 0.6 in 2013; (d) tax revenues from treaties with Switzerland and Luxembourg: 0.1 in 2012; 0.2 in 2013; 0.1 in 2014;
(e) revenue from the adjustment in EU contributions: 0.1 in 2014.
(in percent of GDP unless indicated otherwise)
Sources: Austrian authorities; and IMF staff estimates and projections.
Projections
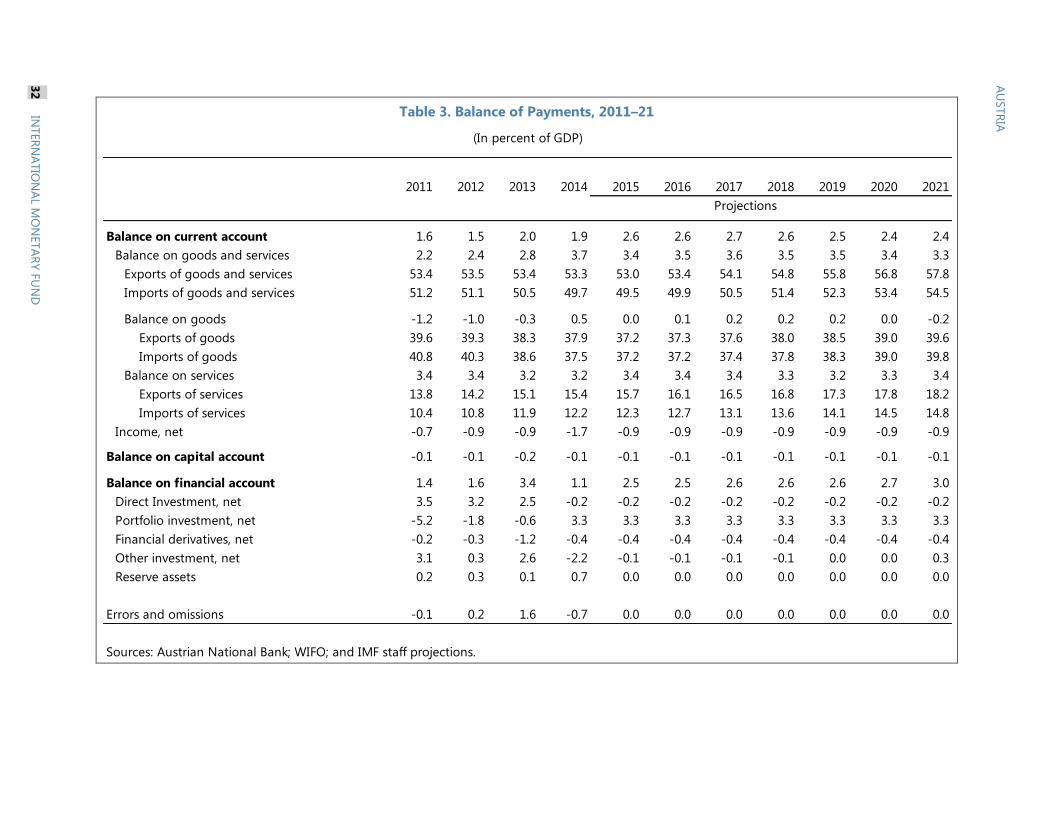
Table 3. Balance of Payments, 2011–21
2011 2012 2013 2014 2015 2016 2017 2018 2019 2020 2021
Balance on current account 1.6 1.5 2.0 1.9 2.6 2.6 2.7 2.6 2.5 2.4 2.4
Balance on goods and services 2.2 2.4 2.8 3.7 3.4 3.5 3.6 3.5 3.5 3.4 3.3
Exports of goods and services 53.4 53.5 53.4 53.3 53.0 53.4 54.1 54.8 55.8 56.8 57.8
Imports of goods and services 51.2 51.1 50.5 49.7 49.5 49.9 50.5 51.4 52.3 53.4 54.5
Balance on goods -1.2 -1.0 -0.3 0.5 0.0 0.1 0.2 0.2 0.2 0.0 -0.2
Exports of goods 39.6 39.3 38.3 37.9 37.2 37.3 37.6 38.0 38.5 39.0 39.6
Imports of goods 40.8 40.3 38.6 37.5 37.2 37.2 37.4 37.8 38.3 39.0 39.8
Balance on services 3.4 3.4 3.2 3.2 3.4 3.4 3.4 3.3 3.2 3.3 3.4
Exports of services 13.8 14.2 15.1 15.4 15.7 16.1 16.5 16.8 17.3 17.8 18.2
Imports of services 10.4 10.8 11.9 12.2 12.3 12.7 13.1 13.6 14.1 14.5 14.8
Income, net -0.7 -0.9 -0.9 -1.7 -0.9 -0.9 -0.9 -0.9 -0.9 -0.9 -0.9
Balance on capital account -0.1 -0.1 -0.2 -0.1 -0.1 -0.1 -0.1 -0.1 -0.1 -0.1 -0.1
Balance on financial account 1.4 1.6 3.4 1.1 2.5 2.5 2.6 2.6 2.6 2.7 3.0
Direct Investment, net 3.5 3.2 2.5 -0.2 -0.2 -0.2 -0.2 -0.2 -0.2 -0.2 -0.2
Portfolio investment, net -5.2 -1.8 -0.6 3.3 3.3 3.3 3.3 3.3 3.3 3.3 3.3
Financial derivatives, net -0.2 -0.3 -1.2 -0.4 -0.4 -0.4 -0.4 -0.4 -0.4 -0.4 -0.4
Other investment, net 3.1 0.3 2.6 -2.2 -0.1 -0.1 -0.1 -0.1 0.0 0.0 0.3
Reserve assets 0.2 0.3 0.1 0.7 0.0 0.0 0.0 0.0 0.0 0.0 0.0
Errors and omissions -0.1 0.2 1.6 -0.7 0.0 0.0 0.0 0.0 0.0 0.0 0.0
Sources: Austrian National Bank; WIFO; and IMF staff projections.
Projections
(In percent of GDP)
AU
STR
IA
32
IN
TER
NA
TIO
NA
L MO
NETA
RY F
UN
D
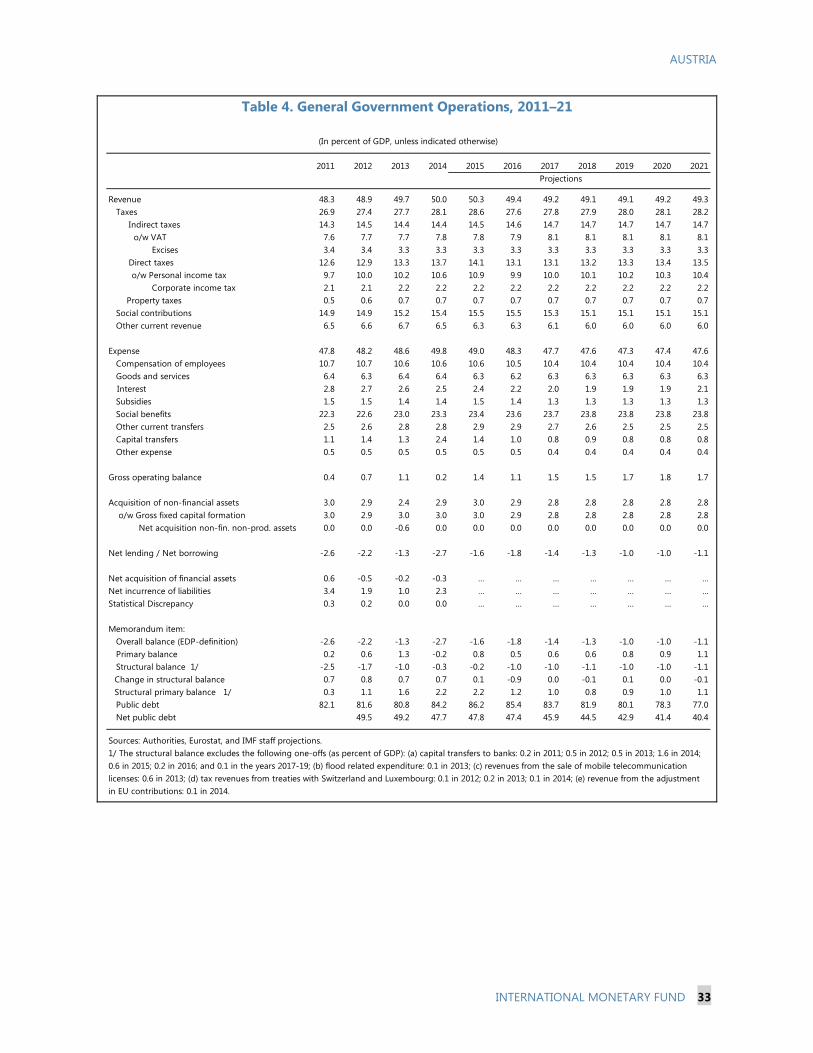
AUSTRIA
INTERNATIONAL MONETARY FUND 33
Table 4. General Government Operations, 2011–21
2011 2012 2013 2014 2015 2016 2017 2018 2019 2020 2021
Revenue 48.3 48.9 49.7 50.0 50.3 49.4 49.2 49.1 49.1 49.2 49.3
Taxes 26.9 27.4 27.7 28.1 28.6 27.6 27.8 27.9 28.0 28.1 28.2
Indirect taxes 14.3 14.5 14.4 14.4 14.5 14.6 14.7 14.7 14.7 14.7 14.7
o/w VAT 7.6 7.7 7.7 7.8 7.8 7.9 8.1 8.1 8.1 8.1 8.1
Excises 3.4 3.4 3.3 3.3 3.3 3.3 3.3 3.3 3.3 3.3 3.3
Direct taxes 12.6 12.9 13.3 13.7 14.1 13.1 13.1 13.2 13.3 13.4 13.5
o/w Personal income tax 9.7 10.0 10.2 10.6 10.9 9.9 10.0 10.1 10.2 10.3 10.4
Corporate income tax 2.1 2.1 2.2 2.2 2.2 2.2 2.2 2.2 2.2 2.2 2.2
Property taxes 0.5 0.6 0.7 0.7 0.7 0.7 0.7 0.7 0.7 0.7 0.7
Social contributions 14.9 14.9 15.2 15.4 15.5 15.5 15.3 15.1 15.1 15.1 15.1
Other current revenue 6.5 6.6 6.7 6.5 6.3 6.3 6.1 6.0 6.0 6.0 6.0
Expense 47.8 48.2 48.6 49.8 49.0 48.3 47.7 47.6 47.3 47.4 47.6
Compensation of employees 10.7 10.7 10.6 10.6 10.6 10.5 10.4 10.4 10.4 10.4 10.4
Goods and services 6.4 6.3 6.4 6.4 6.3 6.2 6.3 6.3 6.3 6.3 6.3
Interest 2.8 2.7 2.6 2.5 2.4 2.2 2.0 1.9 1.9 1.9 2.1
Subsidies 1.5 1.5 1.4 1.4 1.5 1.4 1.3 1.3 1.3 1.3 1.3
Social benefits 22.3 22.6 23.0 23.3 23.4 23.6 23.7 23.8 23.8 23.8 23.8
Other current transfers 2.5 2.6 2.8 2.8 2.9 2.9 2.7 2.6 2.5 2.5 2.5
Capital transfers 1.1 1.4 1.3 2.4 1.4 1.0 0.8 0.9 0.8 0.8 0.8
Other expense 0.5 0.5 0.5 0.5 0.5 0.5 0.4 0.4 0.4 0.4 0.4
Gross operating balance 0.4 0.7 1.1 0.2 1.4 1.1 1.5 1.5 1.7 1.8 1.7
Acquisition of non-financial assets 3.0 2.9 2.4 2.9 3.0 2.9 2.8 2.8 2.8 2.8 2.8
o/w Gross fixed capital formation 3.0 2.9 3.0 3.0 3.0 2.9 2.8 2.8 2.8 2.8 2.8
Net acquisition non-fin. non-prod. assets 0.0 0.0 -0.6 0.0 0.0 0.0 0.0 0.0 0.0 0.0 0.0
Net lending / Net borrowing -2.6 -2.2 -1.3 -2.7 -1.6 -1.8 -1.4 -1.3 -1.0 -1.0 -1.1
Net acquisition of financial assets 0.6 -0.5 -0.2 -0.3 … … … … … … …
Net incurrence of liabilities 3.4 1.9 1.0 2.3 … … … … … … …
Statistical Discrepancy 0.3 0.2 0.0 0.0 … … … … … … …
Memorandum item:
Overall balance (EDP-definition) -2.6 -2.2 -1.3 -2.7 -1.6 -1.8 -1.4 -1.3 -1.0 -1.0 -1.1
Primary balance 0.2 0.6 1.3 -0.2 0.8 0.5 0.6 0.6 0.8 0.9 1.1
Structural balance 1/ -2.5 -1.7 -1.0 -0.3 -0.2 -1.0 -1.0 -1.1 -1.0 -1.0 -1.1
Change in structural balance 0.7 0.8 0.7 0.7 0.1 -0.9 0.0 -0.1 0.1 0.0 -0.1
Structural primary balance 1/ 0.3 1.1 1.6 2.2 2.2 1.2 1.0 0.8 0.9 1.0 1.1
Public debt 82.1 81.6 80.8 84.2 86.2 85.4 83.7 81.9 80.1 78.3 77.0
Net public debt 49.5 49.2 47.7 47.8 47.4 45.9 44.5 42.9 41.4 40.4
Sources: Authorities, Eurostat, and IMF staff projections.
Projections
1/ The structural balance excludes the following one-offs (as percent of GDP): (a) capital transfers to banks: 0.2 in 2011; 0.5 in 2012; 0.5 in 2013; 1.6 in 2014;
0.6 in 2015; 0.2 in 2016; and 0.1 in the years 2017-19; (b) flood related expenditure: 0.1 in 2013; (c) revenues from the sale of mobile telecommunication
licenses: 0.6 in 2013; (d) tax revenues from treaties with Switzerland and Luxembourg: 0.1 in 2012; 0.2 in 2013; 0.1 in 2014; (e) revenue from the adjustment
in EU contributions: 0.1 in 2014.
(In percent of GDP, unless indicated otherwise)

AUSTRIA
34 INTERNATIONAL MONETARY FUND
Table 5. General Government Balance Sheet, 2007–14
2007 2008 2009 2010 2011 2012 2013 2014
Net worth … ... ... ... ... … … …
Nonfinancial assets … ... ... ... ... … … …
Net financial worth -39.6 -43.7 -46.5 -49.1 -51.0 -58.6 -58.1 -61.6
Financial assets 35.1 36.1 42.3 44.7 43.7 49.8 47.4 52.5
Currency & deposits 4.4 7.5 5.4 5.9 6.9 6.1 6.2 8.2
Securities other than shares 1.0 1.3 5.4 4.9 4.3 3.7 2.9 2.6
Loans 10.3 10.2 10.7 10.9 10.6 11.0 11.0 13.7
Shares and other equity 15.6 14.0 17.2 18.9 18.1 17.7 15.8 16.0
Insurance technical reserves 0.0 0.0 0.0 0.0 0.0 0.0 0.0 0.0
Financial derivatives 0.9 0.2 0.5 0.5 0.4 0.5 0.2 0.3
Other accounts receivable 2.8 2.9 3.1 3.5 3.3 10.9 11.3 11.8
Liabilities 1/ 74.7 79.9 88.8 93.8 94.7 108.4 105.5 114.1
Securities other than shares 54.4 60.5 68.2 72.7 73.3 78.2 75.2 82.2
Loans 11.5 10.5 11.7 12.5 13.3 13.3 13.2 14.7
Shares and other equity 4.9 4.7 4.9 4.8 4.6 4.5 4.4 4.3
Insurance technical reserves 0.0 0.0 0.0 0.0 0.0 0.0 0.0 0.0
Financial derivatives 1.0 1.2 1.2 0.9 0.8 0.5 0.4 0.2
Other accounts payable 2.8 3.1 2.7 2.8 2.8 12.0 12.3 12.6Sources: Statistical Office of Austria and Eurostat.
Sources: Statistical Office of Austria and Eurostat.
1/ At market value
(In percent of GDP, unless indicated otherwise)

AUSTRIA
INTERNATIONAL MONETARY FUND 35
Table 6. Financial Soundness Indicators, 2010–15
2010 2011 2012 2013 2014 2015Q3
Capital adequacy
Regulatory capital to risk-weighted assets 1/ 15.4 15.8 17.0 18.0 16.3 16.4
Regulatory Tier I capital to risk-weighted assets 1/ 11.7 12.0 12.9 13.7 12.3 12.6
Capital to assets (percent) 2/ 7.5 7.2 7.8 8.0 6.8 7.0
Large exposures to capital 2/ 64.8 62.9 59.1 52.6 70.5 63.4
Nonperforming loans net of loan-loss provisions to capital 2/ 4/ 8.2 8.0 6.9 5.8 13.8 14.3
Asset quality
Nonperforming loans to total gross loans 2/ 4/ 2.8 2.7 2.8 2.9 3.5 3.5
Sectoral distribution of loans to total loans 3/
Residents 70.0 70.0 70.5 70.2 70.0 70.5
Deposit-takers 25.2 25.4 23.6 22.6 20.2 19.3
Central bank 1.4 2.0 2.6 1.7 1.6 2.1
Other financial corporations 3.2 2.9 2.8 2.7 3.0 2.9
General government 3.8 4.0 4.0 3.9 4.3 4.4
Nonfinancial corporations 18.4 18.1 18.9 19.8 20.0 20.2
Other domestic sectors 18.1 17.7 18.6 19.6 20.8 21.6
Nonresidents 30.0 30.0 29.5 29.8 30.0 29.5
Geographical distribution of loans to total loans 2,3/
Domestic economy 70.0 70.0 70.5 70.2 70.0 70.5
Advanced economies, excluding China 13.7 14.5 14.6 14.6 16.4 15.9
Emerging market and developing countries, including China 16.3 15.6 14.9 15.2 13.7 13.6
Africa 0.1 0.1 0.1 0.1 0.1 0.1
of which: Sub-Sahara Africa 0.1 0.1 0.1 0.1 0.1 0.1
Central and Eastern Europe 13.2 12.6 12.2 12.3 10.7 10.8
Commonwealth of Independent States and Mongolia 2.1 2.0 1.9 2.1 2.0 1.7
Developing Asia, including China 0.4 0.4 0.5 0.5 0.5 0.5
Middle East 0.4 0.3 0.1 0.1 0.1 0.2
Western Hemisphere 0.1 0.1 0.1 0.1 0.2 0.2
Earnings and profitability 1/
Return on assets 0.5 0.1 0.3 0.1 -0.2 0.4
Return on equity 7.9 1.4 5.5 1.2 -3.2 6.9
Net interest income to gross income 67.4 63.3 59.3 65.7 58.7 59.5
Noninterest expenses as a percentage of gross income 83.0 87.4 84.4 96.5 77.3 66.4
Liquidity 2/
Liquid assets to total assets 23.5 25.4 24.8 24.5 22.8 24.9
Liquid assets to short-term liabilities 68.0 71.6 73.4 68.9 67.0 71.3
Net open position in foreign exchange to capital 0.3 0.1 0.4 0.2 0.7 0.2
Other FSIs 2/
Trading income as a percentage of gross income 3.4 1.7 3.3 2.6 1.8 1.9
Personnel expenses as a percentage of noninterest expenses 50.2 51.2 51.2 50.7 53.1 47.6
Spread between reference lending and deposit rates (basis points) 197.0 208.0 180.0 181.0 196.0 191.0
Foreign currency-denominated loans to total loans 22.1 21.4 19.7 18.8 18.8 17.7
Foreign currency-denominated liabilities to total liabilities 11.3 12.0 10.6 10.0 9.9 10.5
Sources: IMF FSI.
1/ Domestically controlled, cross-border and cross sector consolidation basis.
2/ Domestic consolidation basis.
3/ Total loans include loans to financial institutions.
4/ Starting in 2014, NPLs are reported on a borrower rather than single loan basis, which results in a break in the series.
(Percent)
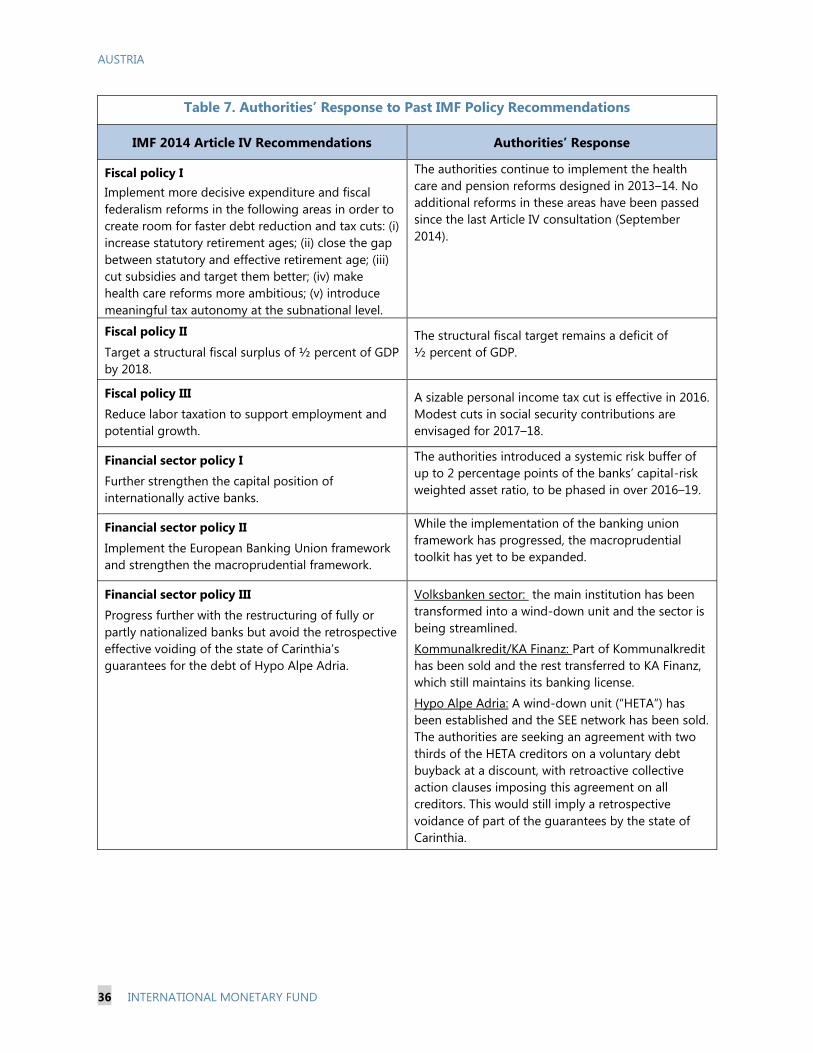
AUSTRIA
36 INTERNATIONAL MONETARY FUND
Table 7. Authorities’ Response to Past IMF Policy Recommendations
IMF 2014 Article IV Recommendations Authorities’ Response
Fiscal policy I
Implement more decisive expenditure and fiscal
federalism reforms in the following areas in order to
create room for faster debt reduction and tax cuts: (i)
increase statutory retirement ages; (ii) close the gap
between statutory and effective retirement age; (iii)
cut subsidies and target them better; (iv) make
health care reforms more ambitious; (v) introduce
meaningful tax autonomy at the subnational level.
The authorities continue to implement the health
care and pension reforms designed in 2013–14. No
additional reforms in these areas have been passed
since the last Article IV consultation (September
2014).
Fiscal policy II
Target a structural fiscal surplus of ½ percent of GDP
by 2018.
The structural fiscal target remains a deficit of
½ percent of GDP.
Fiscal policy III
Reduce labor taxation to support employment and
potential growth.
A sizable personal income tax cut is effective in 2016.
Modest cuts in social security contributions are
envisaged for 2017–18.
Financial sector policy I
Further strengthen the capital position of
internationally active banks.
The authorities introduced a systemic risk buffer of
up to 2 percentage points of the banks’ capital-risk
weighted asset ratio, to be phased in over 2016–19.
Financial sector policy II
Implement the European Banking Union framework
and strengthen the macroprudential framework.
While the implementation of the banking union
framework has progressed, the macroprudential
toolkit has yet to be expanded.
Financial sector policy III
Progress further with the restructuring of fully or
partly nationalized banks but avoid the retrospective
effective voiding of the state of Carinthia’s
guarantees for the debt of Hypo Alpe Adria.
Volksbanken sector: the main institution has been
transformed into a wind-down unit and the sector is
being streamlined.
Kommunalkredit/KA Finanz: Part of Kommunalkredit
has been sold and the rest transferred to KA Finanz,
which still maintains its banking license.
Hypo Alpe Adria: A wind-down unit (“HETA”) has
been established and the SEE network has been sold.
The authorities are seeking an agreement with two
thirds of the HETA creditors on a voluntary debt
buyback at a discount, with retroactive collective
action clauses imposing this agreement on all
creditors. This would still imply a retrospective
voidance of part of the guarantees by the state of
Carinthia.
AUSTRIA
INTERNATIONAL MONETARY FUND 37
Annex I. Macroprudential Policies
The Austrian authorities have been implementing the new EU-wide macro-prudential framework.
Drawing from the lessons from the global financial crisis, their earlier focus was on strengthening
the business model of CESEE-active banks and reducing foreign currency loans.
Institutional Setup
An Austrian Financial Market Stability Board (FMSB) was created in 2014 and has a consultative role.
The Austrian authorities regard financial stability as a shared responsibility of the Financial Market
Authority (FMA), the Austrian National Bank (OeNB), and the Federal Ministry of Finance (MoF). The
FMSB serves as forum for exchanging views and encouraging cooperation among these actors. It
can issue risk warnings and recommendations and eventually make them public. It also reports
annually to parliament.
The Austrian Financial Market Authority remains the implementing authority for macro-prudential
measures. The FMSB recommendations need to be legally implemented by the FMA under a
“comply or explain” rule.
The Austrian National Bank is in charge of operational bank supervision in the Austrian supervisory
setup and provides macro-prudential analysis for the FMSB such as the identification of systemic
risks and the evaluation of the effectiveness of implemented measures. The OeNB can make
proposals for risk warnings and recommendations to the FMSB.
The Ministry of Finance has two representatives at the FMSB and chairs it. In addition, two other
representatives come from the Fiscal Council. OeNB and FMA have one representative each. The
Board decisions are made with simple majority, with the chair deciding in case of a tied vote.
Reports have to be agreed on unanimously.
Currently Available Tools
So far, the available macro-prudential toolkit remains limited to instruments as foreseen in the EU
Capital Requirement Directive (CRDIV). The toolkit includes various capital buffers, such as the
counter-cyclical and systemic risk buffer, and the possibility to change risk weights on exposures
secured by mortgages on immovable property.
Additional sector-specific macro-prudential tools would be beneficial. In particular, caps on the
loan-to-value (LTV) ratios, debt-to-income (DTI), or debt service-to-income (DSTI) ratios specifically
targeted to the housing market and possibly regionally differentiated could help moderate
periodically occurring strong house price hikes. Legally, this would be possible on the basis of
national legislation as in several other EU countries.
Forthcoming Activation of the Systemic Risk Buffer
The FMSB issued a recommendation to the FMA to activate the systemic risk buffer in September
2015. The measure targets structural systemic risks that arise from the size of banks and the banking
sector as a whole, banks’ ownership structure, interconnectedness, and the concentrated foreign risk
exposure to CESEE. The buffer, to be phased in over 2016–19, applies to twelve large and

AUSTRIA
38 INTERNATIONAL MONETARY FUND
medium-size banks, consists of CET-1 capital, and ranges from 1 to 2 percent of risk-weighted
assets. The three major CESEE-active banks will face the maximum requirement of 2 percent of RWA
additional capital.
2012 “Sustainability Package”
In March 2012, the Austrian supervisory authorities issued macro-prudential guidance to strengthen
the resilience of their large internationally active banks (“sustainability package”). The objective was
to strengthen the sustainability of these banks’ business models and foreign operations in particular
in CESEE. The guidance applies to the three large CESEE-active Austria-based banks, and its most
important component relates to the promotion of a more stable local funding base for their foreign
operations. As another component of the package, Basel III CET-1 capital rules were already
introduced as of 2013 without transitional provisions.1 Furthermore, the surcharge for large
internationally active banks that was also envisaged in the “sustainability package” is now being
implemented via the introduction of a systemic risk buffer over 2016–19 (as explained above).
The key component of the “sustainability package” is the promotion of a more stable local funding
base for subsidiaries abroad. Specifically, supervisors have established a benchmark “Loan-to-Local-
Stable-Funding-Ratio (LLSFR)”.2 Subsidiaries with a stock-LLSFR higher than 110 percent have been
encouraged to achieve a sustainable flow-LLSFR to bring their stock-LLSFR to below 110 percent
over time. Exceptions apply if there is agreement between home and host supervisors that (i) there
are no impediments to liquidity transfers between parent bank and subsidiaries, including in stress
situations; and (ii) a burden sharing agreement is in place.
The guidance has largely been effective. According to the authorities, only 4 out of 35 subsidiaries
still have a stock LLSFR higher than 110 percent, and three of them have a flow LLSFR that is
correcting the situation. The adjustment in most subsidiaries was facilitated by steady deposit
growth in host countries.
Initiatives to Reduce Foreign Currency Lending
The authorities have taken various initiatives to rein in the extension and reduce the stock of
foreign-currency loans domestically and in host countries of their banks’ subsidiaries. Domestically,
the extension of new foreign-currency loans to households has become increasingly restrictive since
2008. Only naturally hedged or high-wealth households remain eligible. As for the still existing stock
of Swiss franc loans to households, banks are encouraged to offer conversion options to their
customers. As regards CESEE, Austrian banks committed themselves to refrain from the most risky
forms of foreign currency lending in 2010 in line with guiding principles issued by the authorities.
Respective ESRB recommendations were implemented in 2013.
1 Except for private and state participation capital under the Austrian bank support package, which had not yet been
repaid at that time.
2 The exact definition of the LLSFR is loans to nonbanks divided by the sum of deposits from non-banks,
supranational funding, capital from third parties, and outstanding debt securities with an original maturity of at least
one year issued by the subsidiary to investors outside the consolidation perimeter of the group.

AUSTRIA
INTERNATIONAL MONETARY FUND 39
Annex II. Public Debt Sustainability Analysis (DSA)
Debt is sustainable within the DSA medium-term projection horizon, but ageing cost pressures are
looming in the longer term. Under the baseline, debt will gradually fall from around 86 percent of GDP
at end-2015 to 77 percent of GDP by end-2021. A relatively high share of public debt held by
non-residents could increase volatility in times of adverse external developments. Lower growth and a
contingent liability shock could shift up debt significantly but would still leave it on a downward
trajectory. However, in the longer term (starting in the mid-2020s) and barring additional policy
measures, ageing cost pressures and higher interest rates would reverse the debt path as explained in
the staff report.
Baseline
With growth still subpar, fiscal consolidation has slowed. Although Austria’s structural budget
deficit is projected to have remained below ½ percent of GDP in 2015, the debt-to-GDP ratio would
peak slightly above 86 percent of GDP in 2015, propped up by the creation of a defeasance
structure for the former Hypo Alpe Adria Bank and the addition of further assets to the “bad bank”
KA Finanz, both within the general government. Under the baseline reflecting staff’s assessment of
the authorities’ current policy plans, the structural fiscal balance would widen to about 1 percent of
GDP in 2016–21.1 Debt would then gradually fall to about 77 percent of GDP by 2021. Gross
financing needs are moderate in the period 2016–21.
While debt remains sustainable in the medium term, the standard DSA heat map indicates several
vulnerabilities. The main ones are associated with the already elevated debt level (above 85 percent
of GDP, which is responsible for the red-colored top cells of the heat map) as well as the potential
impact of shocks to growth and contingent liabilities on the debt dynamics. The high share of public
debt held by non-residents is a potential vulnerability, although this should not be a source of
concern as long as Austria is perceived as a safe-haven euro area core country. However, it could
lead to higher volatility in spreads, especially once the ECB’s QE is over, depending on interest rate
dynamics outside Austria and residual risks from commercial banks’ CESEE exposure.
1 The structural balance excludes various one-offs, in particular bank restructuring cost (see Table 1 of the main
document). The cyclically-adjusted primary balance confirms that the baseline scenario is realistic (see panel “Austria
Public DSA – Realism of Baseline Assumptions” (continued), bottom LHS chart).

AUSTRIA
40 INTERNATIONAL MONETARY FUND
Stress Tests
Standardized macro-fiscal stress tests reveal lower growth and the realization of contingent
liabilities as main factors that could shift the debt-to-GDP ratio upwards, even though debt remains
on a downward trajectory.
The standardized low-growth scenario assumes that growth is reduced by one standard deviation of
the historical growth outturn and amounts to a negative ¾ of a percent in 2017–18.2 In this case, the
debt-to-GDP ratio would increase by 6 percentage points to a peak of 91 percentage points in 2018
and follow a downward trend to 87 percentage points in 2021. A purely illustrative contingent
liability shock of 10 percentage points of GDP, about 40 percent of the overall government-
guaranteed debt, would prop up the debt-to-GDP to some 97 percent before a very gradual
reduction to some 93 percent towards the end of the decade.
The other standardized macro shocks will not lead to significant deviations from the baseline debt
path. These shocks are the primary balance shock, the real exchange rate shock, and the real interest
rate shock.3 A “combined shock” for all variables is driven by assumed lower growth and leads to a
similar debt path as in the low-growth scenario.
2 The scenario also assumes that lower growth induces a reduction in the inflation rate by some ½ percentage points,
while interest rates are assumed to fall by 1/3 percentage point.
3 Compared to baseline, the primary balance shock assumes a deterioration of the balance in 2017 and 2018 by half
of the 10-year historical standard deviation; the real exchange rate shock assumes a depreciation of 13.1 percent in
2017 (largest historical depreciation over the last ten years); and the real interest rate shock assumes a spread
increase of 200 bps.
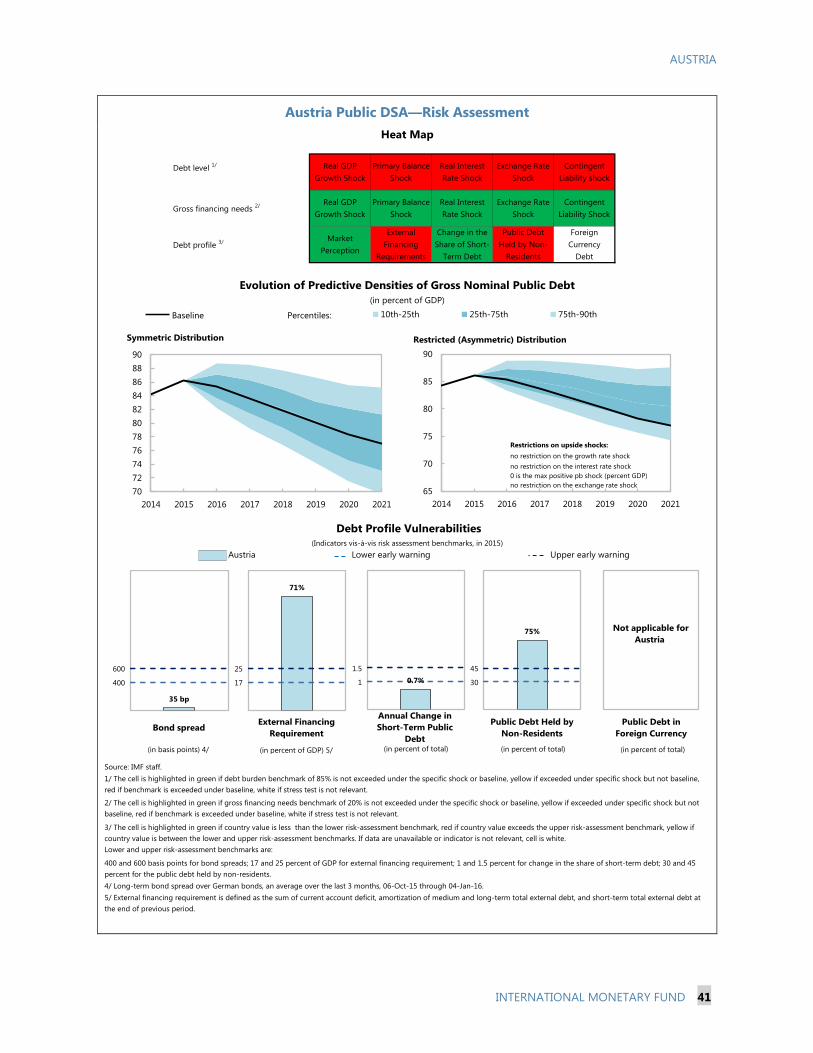
AUSTRIA
INTERNATIONAL MONETARY FUND 41
Austria Public DSA—Risk Assessment
Austria
Source: IMF staff.
1/ The cell is highlighted in green if debt burden benchmark of 85% is not exceeded under the specific shock or baseline, yellow if exceeded under specific shock but not baseline,
red if benchmark is exceeded under baseline, white if stress test is not relevant.
Real Interest
Rate Shock
External
Financing
Requirements
Real GDP
Growth Shock
Heat Map
Upper early warning
Evolution of Predictive Densities of Gross Nominal Public Debt
(in percent of GDP)
Debt profile 3/
Lower early warning
(Indicators vis-à-vis risk assessment benchmarks, in 2015)
Debt Profile Vulnerabilities
Gross financing needs 2/
Debt level 1/ Real GDP
Growth Shock
Primary Balance
Shock
3/ The cell is highlighted in green if country value is less than the lower risk-assessment benchmark, red if country value exceeds the upper risk-assessment benchmark, yellow if
country value is between the lower and upper risk-assessment benchmarks. If data are unavailable or indicator is not relevant, cell is white.
Lower and upper risk-assessment benchmarks are:
Change in the
Share of Short-
Term Debt
Foreign
Currency
Debt
Public Debt
Held by Non-
Residents
Primary Balance
Shock
Real Interest
Rate Shock
Exchange Rate
Shock
Contingent
Liability Shock
Exchange Rate
Shock
Contingent
Liability shock
5/ External financing requirement is defined as the sum of current account deficit, amortization of medium and long-term total external debt, and short-term total external debt at
the end of previous period.
4/ Long-term bond spread over German bonds, an average over the last 3 months, 06-Oct-15 through 04-Jan-16.
2/ The cell is highlighted in green if gross financing needs benchmark of 20% is not exceeded under the specific shock or baseline, yellow if exceeded under specific shock but not
baseline, red if benchmark is exceeded under baseline, white if stress test is not relevant.
400 and 600 basis points for bond spreads; 17 and 25 percent of GDP for external financing requirement; 1 and 1.5 percent for change in the share of short-term debt; 30 and 45
percent for the public debt held by non-residents.
Market
Perception
1 2
Not applicable for
Austria
400
600
35 bp
1 2
17
25
71%
1 2
1
1.5
0.7%
1 2
Bond spreadExternal Financing
Requirement
Annual Change in
Short-Term Public
Debt
Public Debt in
Foreign Currency
(in basis points) 4/ (in percent of GDP) 5/ (in percent of total) (in percent of total)
70
72
74
76
78
80
82
84
86
88
90
2014 2015 2016 2017 2018 2019 2020 2021
10th-25th 25th-75th 75th-90thPercentiles:Baseline
Symmetric Distribution
65
70
75
80
85
90
2014 2015 2016 2017 2018 2019 2020 2021
Restricted (Asymmetric) Distribution
no restriction on the growth rate shock
no restriction on the interest rate shock
0 is the max positive pb shock (percent GDP)
no restriction on the exchange rate shock
Restrictions on upside shocks:
30
45
75%
1 2
Public Debt Held by
Non-Residents
(in percent of total)
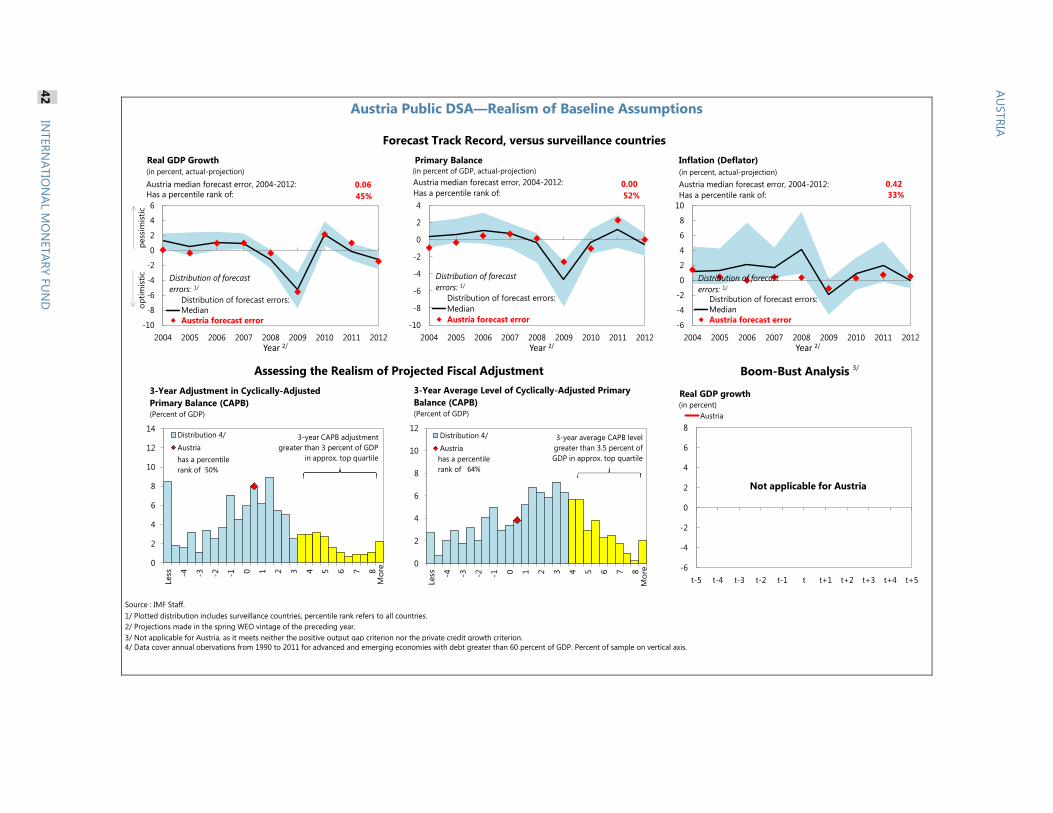
Austria Public DSA—Realism of Baseline Assumptions
Source : IMF Staff.
1/ Plotted distribution includes surveillance countries, percentile rank refers to all countries.
2/ Projections made in the spring WEO vintage of the preceding year.
3/ Not applicable for Austria, as it meets neither the positive output gap criterion nor the private credit growth criterion.
4/ Data cover annual obervations from 1990 to 2011 for advanced and emerging economies with debt greater than 60 percent of GDP. Percent of sample on vertical axis.
Forecast Track Record, versus surveillance countries
Boom-Bust Analysis 3/Assessing the Realism of Projected Fiscal Adjustment
-10
-8
-6
-4
-2
0
2
4
6
2004 2005 2006 2007 2008 2009 2010 2011 2012
Year 2/
Real GDP Growth
Distribution of forecast errors:
Median
Austria forecast error
0.06
45%Has a percentile rank of:
Austria median forecast error, 2004-2012:
Distribution of forecast
errors: 1/
(in percent, actual-projection)
-10
-8
-6
-4
-2
0
2
4
2004 2005 2006 2007 2008 2009 2010 2011 2012
Year 2/
Primary Balance
Distribution of forecast errors:
Median
Austria forecast error
0.00
52%Has a percentile rank of:
Austria median forecast error, 2004-2012:
Distribution of forecast
errors: 1/
(in percent of GDP, actual-projection)
-6
-4
-2
0
2
4
6
8
10
2004 2005 2006 2007 2008 2009 2010 2011 2012
Year 2/
Inflation (Deflator)
Distribution of forecast errors:
Median
Austria forecast error
0.42
33%Has a percentile rank of:
Austria median forecast error, 2004-2012:
Distribution of forecast
errors: 1/
(in percent, actual-projection)
pess
imis
tic
op
tim
isti
c
-6
-4
-2
0
2
4
6
8
t-5 t-4 t-3 t-2 t-1 t t+1 t+2 t+3 t+4 t+5
Real GDP growth
Austria
(in percent)
Not applicable for Austria
0
2
4
6
8
10
12
14
Less -4 -3 -2 -1 0 1 2 3 4 5 6 7 8
Distribution 4/
Austria
3-Year Adjustment in Cyclically-Adjusted
Primary Balance (CAPB)(Percent of GDP)
Mo
re
3-year CAPB adjustment
greater than 3 percent of GDP
in approx. top quartilehas a percentile
rank of 50%
0
2
4
6
8
10
12Less -4 -3 -2 -1 0 1 2 3 4 5 6 7 8
Distribution 4/
Austria
3-Year Average Level of Cyclically-Adjusted Primary
Balance (CAPB)(Percent of GDP)
Mo
re
3-year average CAPB level
greater than 3.5 percent of
GDP in approx. top quartilehas a percentile
rank of 64%
AU
STR
IA
42
INTER
NA
TIO
NA
L M
ON
ETA
RY
FU
ND

AUSTRIA
INTERNATIONAL MONETARY FUND 43
Austria Public Sector Debt Sustainability Analysis (DSA)—Baseline Scenario
(in percent of GDP unless otherwise indicated)
As of January 04, 20162/
2014 2015 2016 2017 2018 2019 2020 2021 Sovereign Spreads
Nominal gross public debt 75.0 84.2 86.2 85.4 83.7 81.9 80.1 78.3 77.0 EMBIG (bp) 3/ 28
Public gross financing needs … 14.2 9.7 9.7 8.8 9.6 9.8 11.2 10.1 5Y CDS (bp) 22
Real GDP growth (in percent) 1.4 0.4 0.7 1.4 1.4 1.3 1.1 1.1 1.1 Ratings Foreign Local
Inflation (GDP deflator, in percent) 1.9 1.6 1.6 1.5 1.7 1.7 1.7 1.8 1.7 Moody's Aaa Aaa
Nominal GDP growth (in percent) 3.3 2.0 2.4 2.9 3.1 3.0 2.9 2.9 2.9 S&Ps AA+ AA+
Effective interest rate (in percent) 4/ 4.3 3.1 2.9 2.7 2.4 2.3 2.4 2.5 2.8 Fitch AA+ AA+
2014 2015 2016 2017 2018 2019 2020 2021 cumulative
Change in gross public sector debt 1.8 3.4 1.9 -0.8 -1.7 -1.7 -1.8 -1.8 -1.3 -9.2
Identified debt-creating flows 2.4 3.9 2.4 -0.3 -1.3 -1.3 -1.4 -1.4 -0.9 -6.7
Primary deficit 0.4 0.7 -0.3 0.0 -0.2 -0.2 -0.4 -0.6 -0.7 -2.1
Primary (noninterest) revenue and grants47.7 49.6 49.9 49.0 48.8 48.7 48.7 48.8 48.9 292.8
Primary (noninterest) expenditure 48.1 50.3 49.6 48.9 48.6 48.5 48.2 48.2 48.2 290.7
Automatic debt dynamics 5/
0.8 0.9 0.4 -0.2 -0.6 -0.5 -0.4 -0.3 -0.1 -2.0
Interest rate/growth differential 6/
0.7 0.9 0.4 -0.2 -0.6 -0.5 -0.4 -0.3 -0.1 -2.0
Of which: real interest rate 1.7 1.2 1.0 1.0 0.6 0.5 0.5 0.6 0.8 3.9
Of which: real GDP growth -1.0 -0.3 -0.6 -1.1 -1.1 -1.0 -0.9 -0.8 -0.9 -5.9
Exchange rate depreciation 7/
0.0 0.0 0.0 … … … … … … …
Other identified debt-creating flows 1.2 2.3 2.3 -0.1 -0.6 -0.6 -0.6 -0.6 -0.1 -2.6
SFA (incl. bank defeasance structure) 1.2 2.3 2.3 -0.1 -0.6 -0.6 -0.6 -0.6 -0.1 -2.6
Residual, including asset changes 8/
-0.6 -0.5 -0.5 -0.4 -0.4 -0.4 -0.4 -0.4 -0.4 -2.4
Source: IMF staff.
1/ Public sector is defined as general government.
2/ Based on available data.
3/ Long-term bond spread over German bonds.
4/ Defined as interest payments divided by debt stock (excluding guarantees) at the end of previous year.
5/ Derived as [(r - π(1+g) - g + ae(1+r)]/(1+g+π+gπ)) times previous period debt ratio, with r = interest rate; π = growth rate of GDP deflator; g = real GDP growth rate;
a = share of foreign-currency denominated debt; and e = nominal exchange rate depreciation (measured by increase in local currency value of U.S. dollar).
6/ The real interest rate contribution is derived from the numerator in footnote 5 as r - π (1+g) and the real growth contribution as -g.
7/ The exchange rate contribution is derived from the numerator in footnote 5 as ae(1+r).
8/ Includes asset changes and interest revenues (if any). For projections, includes exchange rate changes during the projection period.
9/ Assumes that key variables (real GDP growth, real interest rate, and other identified debt-creating flows) remain at the level of the last projection year.
-0.2
balance 9/
primary
Debt, Economic and Market Indicators 1/
2005-2013
Actual
Projections
Contribution to Changes in Public Debt
Projections
2005-2013
Actual
debt-stabilizing
-3
-2
-1
0
1
2
3
4
5
2014 2015 2016 2017 2018 2019 2020 2021
Debt-Creating Flows
Primary deficit Real GDP growth Real interest rate
Exchange rate depreciation Other debt-creating flows Residual
Change in gross public sector debt
projection
(in percent of GDP)
-14
-12
-10
-8
-6
-4
-2
0
2
4
6
cumulative

AUSTRIA
44 INTERNATIONAL MONETARY FUND
Austria Public DSA—Composition of Public Debt and Alternative Scenarios
Baseline Scenario 2016 2017 2018 2019 2020 2021 Historical Scenario 2016 2017 2018 2019 2020 2021
Real GDP growth 1.4 1.4 1.3 1.1 1.1 1.1 Real GDP growth 1.4 1.2 1.2 1.2 1.2 1.2
Inflation 1.5 1.7 1.7 1.7 1.8 1.7 Inflation 1.5 1.7 1.7 1.7 1.8 1.7
Primary Balance 0.0 0.2 0.2 0.4 0.6 0.7 Primary Balance 0.0 -0.4 -0.4 -0.4 -0.4 -0.4
Effective interest rate 2.7 2.4 2.3 2.4 2.5 2.8 Effective interest rate 2.7 2.4 2.5 2.6 2.9 3.3
Constant Primary Balance Scenario
Real GDP growth 1.4 1.4 1.3 1.1 1.1 1.1
Inflation 1.5 1.7 1.7 1.7 1.8 1.7
Primary Balance 0.0 0.0 0.0 0.0 0.0 0.0
Effective interest rate 2.7 2.4 2.3 2.3 2.5 2.8
Source: IMF staff.
Underlying Assumptions(in percent)
Alternative Scenarios
Composition of Public Debt
Baseline Historical Constant Primary Balance
72
74
76
78
80
82
84
86
88
2014 2015 2016 2017 2018 2019 2020 2021
Gross Nominal Public Debt
(in percent of GDP)
projection
0
2
4
6
8
10
12
14
2014 2015 2016 2017 2018 2019 2020 2021
Public Gross Financing Needs
(in percent of GDP)
projection
0
10
20
30
40
50
60
70
80
90
2016 2018 2020
By Maturity
Medium and long-term
Short-term
projection
(in percent of GDP)
0
10
20
30
40
50
60
70
80
90
2016 2018 2020
By Currency
Local currency-denominated
Foreign currency-denominated
projection
(in percent of GDP)
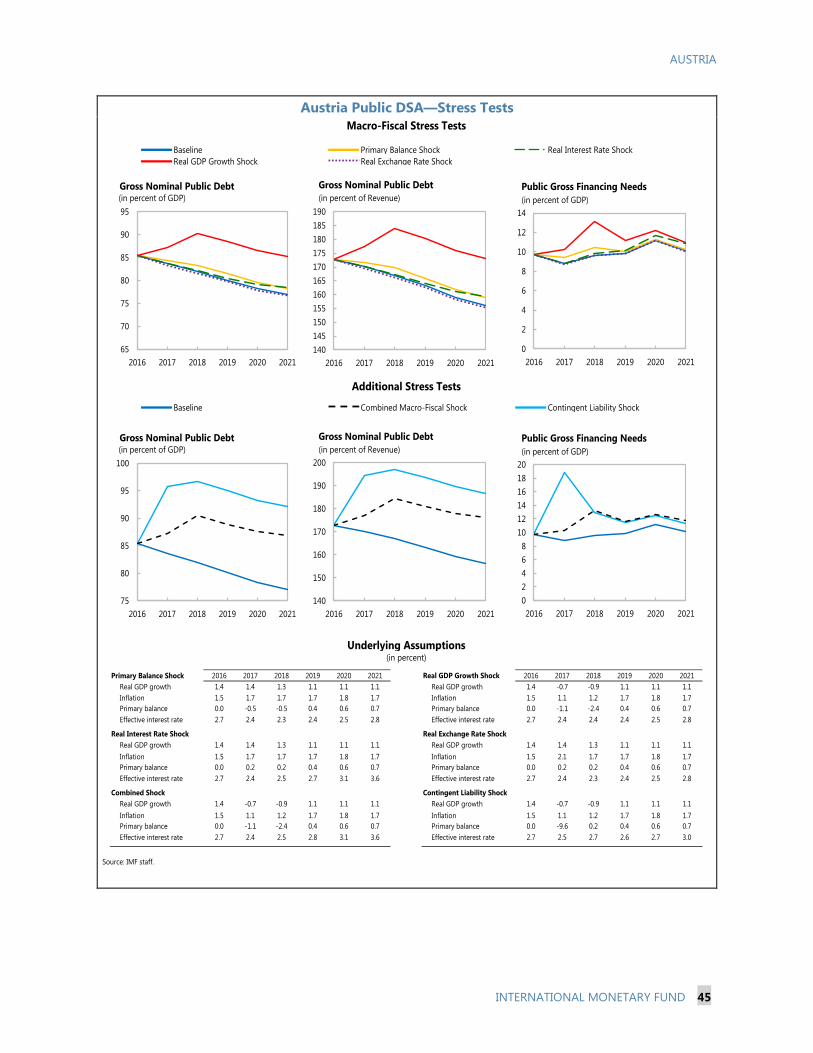
AUSTRIA
INTERNATIONAL MONETARY FUND 45
Austria Public DSA—Stress Tests
Primary Balance Shock 2016 2017 2018 2019 2020 2021 Real GDP Growth Shock 2016 2017 2018 2019 2020 2021
Real GDP growth 1.4 1.4 1.3 1.1 1.1 1.1 Real GDP growth 1.4 -0.7 -0.9 1.1 1.1 1.1
Inflation 1.5 1.7 1.7 1.7 1.8 1.7 Inflation 1.5 1.1 1.2 1.7 1.8 1.7
Primary balance 0.0 -0.5 -0.5 0.4 0.6 0.7 Primary balance 0.0 -1.1 -2.4 0.4 0.6 0.7
Effective interest rate 2.7 2.4 2.3 2.4 2.5 2.8 Effective interest rate 2.7 2.4 2.4 2.4 2.5 2.8
Real Interest Rate Shock Real Exchange Rate Shock
Real GDP growth 1.4 1.4 1.3 1.1 1.1 1.1 Real GDP growth 1.4 1.4 1.3 1.1 1.1 1.1
Inflation 1.5 1.7 1.7 1.7 1.8 1.7 Inflation 1.5 2.1 1.7 1.7 1.8 1.7
Primary balance 0.0 0.2 0.2 0.4 0.6 0.7 Primary balance 0.0 0.2 0.2 0.4 0.6 0.7
Effective interest rate 2.7 2.4 2.5 2.7 3.1 3.6 Effective interest rate 2.7 2.4 2.3 2.4 2.5 2.8
Combined Shock Contingent Liability Shock
Real GDP growth 1.4 -0.7 -0.9 1.1 1.1 1.1 Real GDP growth 1.4 -0.7 -0.9 1.1 1.1 1.1
Inflation 1.5 1.1 1.2 1.7 1.8 1.7 Inflation 1.5 1.1 1.2 1.7 1.8 1.7
Primary balance 0.0 -1.1 -2.4 0.4 0.6 0.7 Primary balance 0.0 -9.6 0.2 0.4 0.6 0.7
Effective interest rate 2.7 2.4 2.5 2.8 3.1 3.6 Effective interest rate 2.7 2.5 2.7 2.6 2.7 3.0
Source: IMF staff.
Macro-Fiscal Stress Tests
Baseline Primary Balance Shock
Real GDP Growth Shock
Real Interest Rate Shock
(in percent)
Real Exchange Rate Shock
Combined Macro-Fiscal Shock
Additional Stress Tests
Baseline
Underlying Assumptions
Contingent Liability Shock
65
70
75
80
85
90
95
2016 2017 2018 2019 2020 2021
Gross Nominal Public Debt(in percent of GDP)
140
145
150
155
160
165
170
175
180
185
190
2016 2017 2018 2019 2020 2021
Gross Nominal Public Debt
(in percent of Revenue)
0
2
4
6
8
10
12
14
2016 2017 2018 2019 2020 2021
Public Gross Financing Needs
(in percent of GDP)
75
80
85
90
95
100
2016 2017 2018 2019 2020 2021
Gross Nominal Public Debt(in percent of GDP)
140
150
160
170
180
190
200
2016 2017 2018 2019 2020 2021
Gross Nominal Public Debt
(in percent of Revenue)
0
2
4
6
8
10
12
14
16
18
20
2016 2017 2018 2019 2020 2021
Public Gross Financing Needs
(in percent of GDP)

AUSTRIA STAFF REPORT FOR THE 2015 ARTICLE IV
CONSULTATION—INFORMATIONAL ANNEX
Prepared By
European Department
FUND RELATIONS _____________________________________________________________________ 2
STATISTICAL ISSUES __________________________________________________________________ 3
CONTENTS
February 10, 2016
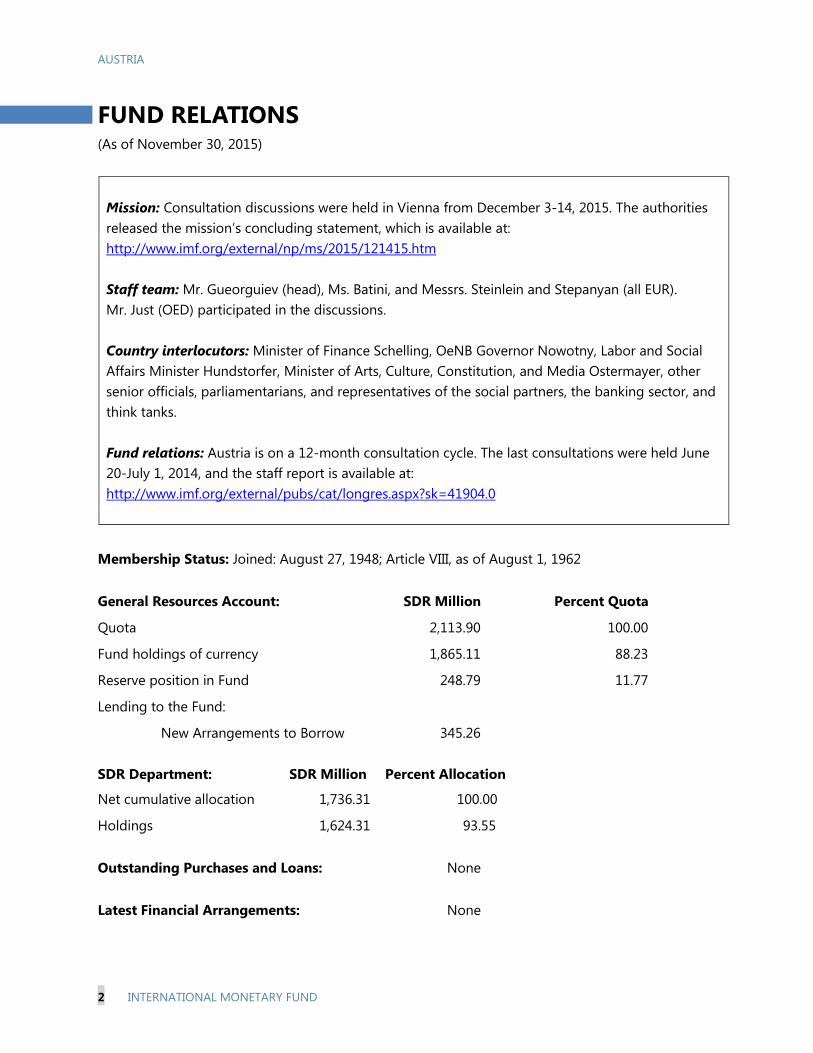
AUSTRIA
2 INTERNATIONAL MONETARY FUND
FUND RELATIONS (As of November 30, 2015)
Mission: Consultation discussions were held in Vienna from December 3-14, 2015. The authorities
released the mission’s concluding statement, which is available at:
http://www.imf.org/external/np/ms/2015/121415.htm
Staff team: Mr. Gueorguiev (head), Ms. Batini, and Messrs. Steinlein and Stepanyan (all EUR).
Mr. Just (OED) participated in the discussions.
Country interlocutors: Minister of Finance Schelling, OeNB Governor Nowotny, Labor and Social
Affairs Minister Hundstorfer, Minister of Arts, Culture, Constitution, and Media Ostermayer, other
senior officials, parliamentarians, and representatives of the social partners, the banking sector, and
think tanks.
Fund relations: Austria is on a 12-month consultation cycle. The last consultations were held June
20-July 1, 2014, and the staff report is available at:
http://www.imf.org/external/pubs/cat/longres.aspx?sk=41904.0
Membership Status: Joined: August 27, 1948; Article VIII, as of August 1, 1962
General Resources Account: SDR Million Percent Quota
Quota 2,113.90 100.00
Fund holdings of currency 1,865.11 88.23
Reserve position in Fund 248.79 11.77
Lending to the Fund:
New Arrangements to Borrow 345.26
SDR Department: SDR Million Percent Allocation
Net cumulative allocation 1,736.31 100.00
Holdings 1,624.31 93.55
Outstanding Purchases and Loans: None
Latest Financial Arrangements: None

AUSTRIA
INTERNATIONAL MONETARY FUND 3
Projected Payments to Fund:
(SDR Million; based on existing use of resources and present holdings of SDRs):
Forthcoming
2015 2016 2017 2018 2019
Principal -- -- -- -- --
Charges/Interest -- 0.09 0.09 0.09 0.09
Total -- 0.09 0.09 0.09 0.09
Implementation of HIPC Initiative: Not Applicable
Exchange System:
As of January 1, 1999, the currency of Austria is the euro, which floats freely and independently against
other currencies. Austria’s exchange system is free of restrictions on the making of payments and
transfers for current international transactions, with the exception of restrictions notified to the Fund in
accordance with decision No.144-(52/51) resulting from UN Security Council Resolutions and EU
Council Regulations.
STATISTICAL ISSUES
1. Macroeconomic statistics are adequate for surveillance. Austria subscribed to the Fund’s
Special Data Dissemination Standard (SDDS) in 1996, and its metadata are available on the Fund’s
electronic Dissemination Standards Bulletin Board. Austria is availing itself of the SDDS flexibility
option on the timeliness of the industrial production index and the merchandise trade data. Austria is
currently preparing for SDDS Plus adherence.
2. The ECB reporting framework is used for monetary statistics and data are reported to
the IMF through a “gateway” arrangement with the ECB. The arrangement provides an efficient
transmission of monetary statistics to the IMF and for publication in the IFS and IFS Supplement.
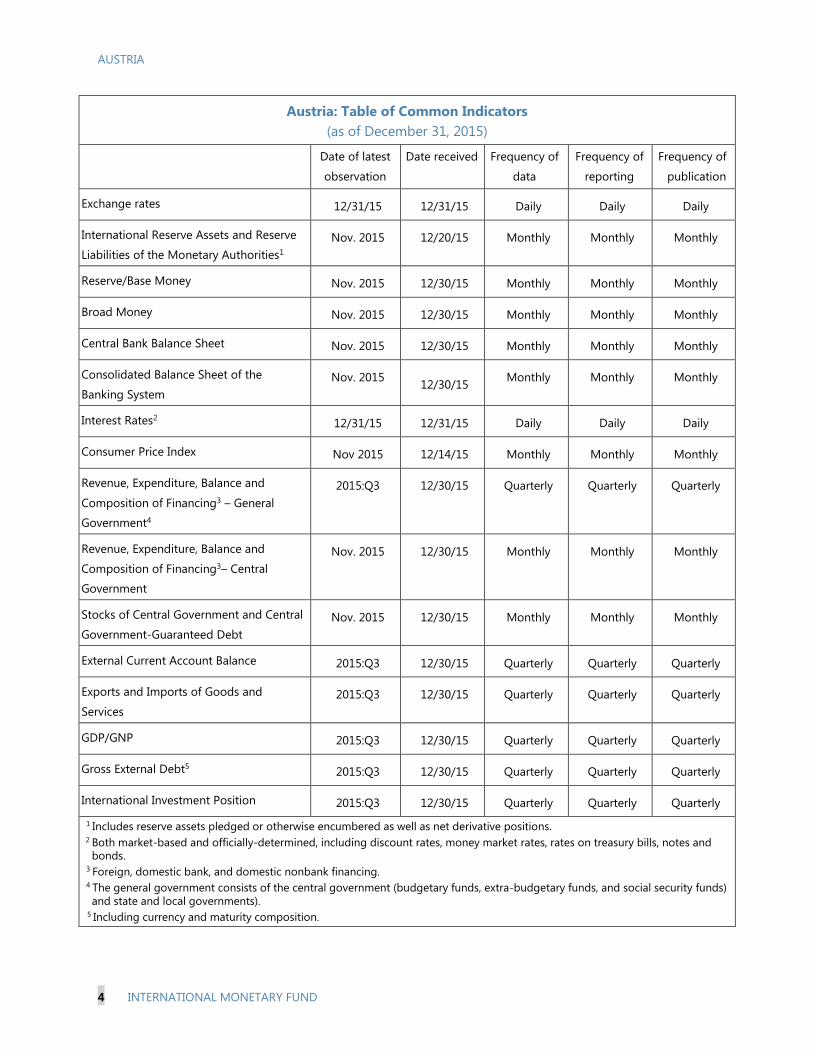
AUSTRIA
4 INTERNATIONAL MONETARY FUND
Austria: Table of Common Indicators
(as of December 31, 2015)
Date of latest
observation
Date received Frequency of
data
Frequency of
reporting
Frequency of
publication
Exchange rates 12/31/15 12/31/15 Daily Daily Daily
International Reserve Assets and Reserve
Liabilities of the Monetary Authorities1
Nov. 2015 12/20/15 Monthly Monthly Monthly
Reserve/Base Money Nov. 2015 12/30/15 Monthly Monthly Monthly
Broad Money Nov. 2015 12/30/15 Monthly Monthly Monthly
Central Bank Balance Sheet Nov. 2015 12/30/15 Monthly Monthly Monthly
Consolidated Balance Sheet of the
Banking System
Nov. 2015 12/30/15
Monthly Monthly Monthly
Interest Rates2 12/31/15 12/31/15 Daily Daily Daily
Consumer Price Index Nov 2015 12/14/15 Monthly Monthly Monthly
Revenue, Expenditure, Balance and
Composition of Financing3 – General
Government4
2015:Q3 12/30/15 Quarterly Quarterly Quarterly
Revenue, Expenditure, Balance and
Composition of Financing3– Central
Government
Nov. 2015 12/30/15 Monthly Monthly Monthly
Stocks of Central Government and Central
Government-Guaranteed Debt
Nov. 2015 12/30/15 Monthly Monthly Monthly
External Current Account Balance 2015:Q3 12/30/15 Quarterly Quarterly Quarterly
Exports and Imports of Goods and
Services
2015:Q3 12/30/15 Quarterly Quarterly Quarterly
GDP/GNP 2015:Q3 12/30/15 Quarterly Quarterly Quarterly
Gross External Debt5 2015:Q3 12/30/15 Quarterly Quarterly Quarterly
International Investment Position 2015:Q3 12/30/15 Quarterly Quarterly Quarterly
1 Includes reserve assets pledged or otherwise encumbered as well as net derivative positions. 2 Both market-based and officially-determined, including discount rates, money market rates, rates on treasury bills, notes and bonds.
3 Foreign, domestic bank, and domestic nonbank financing. 4 The general government consists of the central government (budgetary funds, extra-budgetary funds, and social security funds)
and state and local governments).
5 Including currency and maturity composition.
Statement by the IMF Staff Representative on Austria
February 10, 2016
1. This statement provides information that has become available since the Staff
Report was circulated to the Executive Board on January 20, 2016. The information does
not alter the thrust of the staff appraisal.
2. The authorities intend to restrict the number of asylum applications. After
receiving about 90,000 asylum seekers in 2015, the authorities intend to cap applications at
37,500 in 2016 and a cumulative 1.5 percent of the population (about 128,000) in 2016-19.
They are in the process of ascertaining whether such limits are in line with Austria’s
constitution and EU laws. In addition, a draft law envisages that asylum cases will be
reviewed after three years to determine whether the reason for granting asylum still exists,
while providing incentives for the applicants to actively participate in integrating measures
meanwhile. The new policy, if implemented, implies significantly less applicants for 2016
than envisaged in the staff report and Selected Issues paper, with smaller differences in future
years. However, as the reduced number of pre-screened applicants should normally lead to a
higher acceptance rate, the economic effects of migration may differ only moderately from
the estimates in the staff report. Specifically, based on the acceptance rates for high-risk
countries (Syria and Afghanistan) in 2015, staff estimates that under the new policy,
cumulative fiscal costs would be lower by up to 1/3 and potential GDP growth estimates - by
about 1/7 relative to the figures in the staff report and Selected Issues paper.
3. The province of Carinthia has published an offer to buy back HETA debt
covered by provincial guarantees. The offer affects senior bonds of € 10.1 billion with a
haircut of 25 percent and a much smaller amount of subordinated debt (€ 900 million) with a
haircut of 70 percent. These debt instruments are covered by a guarantee of the province of
Carinthia, which would become effectively void in the amount of the haircut. Carinthia
would receive liquidity support from the federal level for making the buyback. Initial creditor
reactions to the offer are negative. However, while insisting on full repayment, some
creditors indicate willingness to negotiate and hint specifically at a possible prolongation of
the repayment schedule. The deadline for creditor decisions is March 11, 2016.
4. The regular update of the IMF’s External Balance Assessment (EBA) confirms
that Austria’s external position is broadly in line with fundamentals and desirable
policies. The current account gap for 2015 has narrowed from 2 to 1.4 percentage points of
GDP, still indicating a norm somewhat higher than the expected surplus, with the high health
expenditure now explaining almost the whole gap. The estimated overvaluation gap in the
REER (levels) remains at about 9 percent.
5. The flash GDP growth estimate for 2015 came at 0.9 percent, slightly above staff’s
projection of 0.7 percent.

Statement by Mr. Christian Just, Alternate Executive Director for Austria
February 10, 2016
The Austrian authorities welcome the consultations with the Fund staff and appreciate the insightful
report, which is exemplary in clearly presenting the staff’s position. The authorities broadly agree
with the assessment of Austria's economic and financial situation and the recommendations on
economic and financial policies.
The authorities concur that economic growth in Austria is set to pick up after a period of rather
sluggish economic activity with an average growth rate of approximately 0.6 percent between 2012
and 2015. According to the European Commission’s Winter 2016 forecast, the economy appears to
have passed its cyclical trough in 2015 with the output gap expected to close by around 2019, so
that, in the current cycle, the Austrian economy would have seen its trough later than almost all
other economies in the EU. Despite this relatively long span of moderate growth in conjunction with
fiscal consolidation, no major domestic imbalances have emerged. Credit growth and private
consumption have remained low, investment activity cautious and public consumption conservative
with the external sector contributing to a persistent increase in the positive international investment
position.
The authorities also concur on the importance of a further strengthening of balance sheets and
profitability in the financial sector, including the ability to cater for potential effects of asset
revaluations of Austrian bank subsidiaries in CEEC, such that domestic banks continue providing
funding for the real sector as demanded. Indeed it will be key for the Austrian economy to secure
the long-term sustainability of public finances and safeguard a solid growth potential of the
economy.
Macroeconomic outlook
Having passed the low of the business cycle in 2015, the Austrian economy is expected to enter a
moderate recovery path, helped by the recent landmark tax reform and the impact of the refugee
crisis. Like staff, the Austrian authorities do not see any sign of discernible lack of access of the real
economy to bank finance. Due to the continued inflow of, in particular, foreign labour supply the
unemployment rate will rise slightly despite relatively robust employment growth. The Austrian
authorities agree that a swift integration of asylum seekers, once their status is cleared, into the
labour market will be crucial for maximising their input to the economy. In addition, the Austrian
authorities deem it important to further analyse and understand the underlying reason for the
persistent positive inflation differential vis-à-vis the rest of its peers in the euro area, in particular
with regard to the services sector, albeit so far this gap has not translated into a loss of external price
competitiveness.
Productivity growth
Total factor productivity growth in Austria had been on a secular downward trend in the past and
has flattened after the crisis. as is the case for most peer economies inside and outside the EU. Apart
from (shared) uncertainties surrounding data on the real capital stock and total annual hours worked
2
in the aftermath of the crisis, a number of policy actions may reverse the weaker than pre-crisis
productivity growth in Austria. The IMF staff mentions enhanced IT penetration, improved access
to risk financing for start-ups or an increase of efficiency in certain areas of the public sector. Indeed
there is still some room to raise potential output via a further increase of the input of labour supply
by improving the incentives to participate in the labour market as well as to work longer. The
government has started an initiative to foster broadband connections and earmarked significant
amounts to this end. Part-time work for the elderly, enhanced crowd-funding possibilities and some
tax relief are other measures to this end.
Fiscal Policy
Despite a series of lower than forecast growth outcomes in a low growth environment in general,
government revenues remained relatively stable and the structural balance has been improving
continuously since 2011 according to IMF calculations. The Austrian authorities intend to act in
line with the staff’s recommendation to strike a balance between supporting activity and rebuilding
buffers, in particular after the public debt level has shifted upwards following a series of bank rescue
measures.
The authorities agree that public spending on health care and education provides room for efficiency
improvements. However, they are more cautious about putting too much emphasis on a narrow set
of studies due to their methodological limitations. The authorities acknowledge the high level of
subsidies but caution about labeling them per se as inefficient since their objectives as well as the
spill-overs they are intended to achieve will have to be first weighed against prospective revenue
savings. Spending reviews are currently under consideration.
Financial Sector
Austrian banks have stepped up their efforts to address structural weaknesses in the “new normal”.
Several banks have announced, or already have started to implement, consolidation plans in order to
improve the efficiency of their activities. These adjustments include a stronger focus on markets
with a higher potential for generating sustainable returns and a reduction of risk-weighted assets to
increase capital.
Overall, the profitability of Austrian banks has already improved considerably in the first half of
2015 compared to the previous year, supported by lower credit risk provisioning and reduced write-
offs and impairments. However, the low interest rate and low growth environment will make the
longer-term sustainability of this recovery more challenging.
Rising emerging market risks might also affect Austrian banks if growth slows down in core
markets. This development could put a further drag on asset quality as well as on the profitability of
Austrian banks. The Austrian supervisors therefore continuously advise banks to adequately
provision for risks and have policies in place to deal with credit quality issues.
The Austrian authorities concur with the staff that the loss absorbing capacity of Austrian banks has
to be further strengthened with the continuous build-up of additional capital. Banks have
strengthened their capital positions in recent years through a combination of higher capital and

3
reduced risk-weighted assets; micro- and macroprudential measures will also contribute to
improving Austrian banks’ capitalization. However, compared to their peers, larger Austrian banks
still have a relatively low capitalization and therefore will need to build up capital further.
One building block in strengthening Austrian banks’ capitalization will come from macroprudential
oversight. In 2015, the Financial Market Stability Board (FMSB) decided to activate a systemic risk
buffer (SRB) of up to 2 percent to address the specific combination of systemic risks in the Austrian
banking sector. These risks arise from the relatively large size of the Austrian banking sector as
compared to the domestic economy, its high exposure to emerging markets, its below-average
capitalization in relation to its European peers and its high share of non-listed banks and leveraged
owners. The SRB will therefore contribute to alleviating those risks.
Staff rightly points out that systemic risks arising from foreign currency lending to domestic
borrowers have declined over the last years but are still significant. The outstanding volumes as well
as the number of foreign currency (FX) borrowers have declined substantially. However, 75 percent
of foreign currency loans are designed as repayment vehicle loans (i.e. bullet loans that are
redeemed only at maturity by life insurance policies and/or other capital market products; until then,
regular financial contributions are only made towards the repayment vehicle) and exhibit a non-
negligible aggregate borrowers’ funding gap. Consequently, the Austrian National Bank (OeNB)
and Financial Market Authority have stepped up their efforts to encourage banks and debtors to
timely engage in bilateral negotiations aimed at sustainable tailor-made solutions.
The Austrian authorities concur with the staff that the macroprudential toolkit needs expansion with
respect to real estate-specific instruments. As real estate price increases have not been accompanied
by excessive mortgage lending growth so far, the FMSB concluded, that there is no immediate
reason to activate macroprudential instruments regarding real estate funding. However, the FMSB
considers it necessary to extend its macroprudential toolkit with a view to aligning it with
international best practice.