IMF Country Report No. 16/244 DOMINICA · was underpinned by the collection of tax arrears (in part...
73
© 2016 International Monetary Fund IMF Country Report No. 16/244 DOMINICA 2016 ARTICLE IV CONSULTATION—PRESS RELEASE; STAFF REPORT; AND STATEMENT BY THE EXECUTIVE DIRECTOR FOR DOMINICA Under Article IV of the IMF’s Articles of Agreement, the IMF holds bilateral discussions with members, usually every year. In the context of the 2016 Article IV consultation with Dominica, the following documents have been released and are included in this package: A Press Release summarizing the views of the Executive Board as expressed during its July 13, 2016 consideration of the staff report that concluded the Article IV consultation with Dominica. The Staff Report prepared by a staff team of the IMF for the Executive Board’s consideration on July 13, 2016, following discussions that ended on April 11, 2016, with the officials of Dominica on economic developments and policies. Based on information available at the time of these discussions, the staff report was completed on June 22, 2016. An Informational Annex prepared by the IMF staff. A Staff Supplement updating information on recent developments. A Statement by the Executive Director for Dominica. The documents listed below have been or will be separately released. Selected Issues The IMF’s transparency policy allows for the deletion of market-sensitive information and premature disclosure of the authorities’ policy intentions in published staff reports and other documents. Copies of this report are available to the public from International Monetary Fund Publication Services PO Box 92780 Washington, D.C. 20090 Telephone: (202) 623-7430 Fax: (202) 623-7201 E-mail: [email protected] Web: http://www.imf.org Price: $18.00 per printed copy International Monetary Fund Washington, D.C. July 2016
Transcript of IMF Country Report No. 16/244 DOMINICA · was underpinned by the collection of tax arrears (in part...

© 2016 International Monetary Fund
IMF Country Report No. 16/244
DOMINICA 2016 ARTICLE IV CONSULTATION—PRESS RELEASE; STAFF REPORT; AND STATEMENT BY THE EXECUTIVE DIRECTOR FOR DOMINICA
Under Article IV of the IMF’s Articles of Agreement, the IMF holds bilateral discussions
with members, usually every year. In the context of the 2016 Article IV consultation with
Dominica, the following documents have been released and are included in this package:
A Press Release summarizing the views of the Executive Board as expressed during its
July 13, 2016 consideration of the staff report that concluded the Article IV
consultation with Dominica.
The Staff Report prepared by a staff team of the IMF for the Executive Board’s
consideration on July 13, 2016, following discussions that ended on April 11, 2016,
with the officials of Dominica on economic developments and policies. Based on
information available at the time of these discussions, the staff report was completed
on June 22, 2016.
An Informational Annex prepared by the IMF staff.
A Staff Supplement updating information on recent developments.
A Statement by the Executive Director for Dominica.
The documents listed below have been or will be separately released.
Selected Issues
The IMF’s transparency policy allows for the deletion of market-sensitive information and
premature disclosure of the authorities’ policy intentions in published staff reports and
other documents.
Copies of this report are available to the public from
International Monetary Fund Publication Services
PO Box 92780 Washington, D.C. 20090
Telephone: (202) 623-7430 Fax: (202) 623-7201
E-mail: [email protected] Web: http://www.imf.org
Price: $18.00 per printed copy
International Monetary Fund
Washington, D.C.
July 2016

Press Release No. 16/346
FOR IMMEDIATE RELEASE
July 20, 2016
IMF Executive Board Concludes the 2016 Article IV Consultation with Dominica
On July 13, 2016, the Executive Board of the International Monetary Fund (IMF) concluded the
Article IV consultation1 with Dominica.
The Dominican economy was hit hard by tropical storm Erika, with output estimated to have
declined by 3.9 percent in 2015. While tourism activities have largely normalized following the
resumption of full operations at the main airport, other sectors will likely need more time to be
fully restored. Agricultural output and manufacturing declined sharply, as the storm affected
crops and access to arable land, and prompted the closure of operations of the main industrial
plant. In addition, the protracted decline of banks’ credit to the private sector remains a drag on
economic activity, underpinned by high non-performing loans. Inflation has remained subdued,
mainly as a result of falling fuel prices. Notwithstanding weak exports of agriculture and
tourism, the 2015 current account deficit remained contained on the back of lower oil imports.
Output growth is expected to remain subdued in 2016 at 1.3 percent as the economy slowly
recovers from the storm and investment in reconstruction picks up. This growth, however, is
largely conditional on donor grants proceeding according to expectations. Afterwards, growth is
projected to accelerate somewhat as the economy continues to recover towards potential, and to
stabilize at 1.7 percent per year over the medium-term. The current account is projected to
deteriorate on the back of the increase in reconstruction investment, and then to gradually
improve as exports of agriculture, tourism and manufacturing activities recover. The imbalances
are expected to be financed primarily with external capital grants and official concessional loans.
The fiscal outturn for FY 2015/16 is strong, estimated at a surplus of 0.8 percent of GDP.
However, the underlying fiscal performance is somewhat weaker than the outturn suggests, as it
1 Under Article IV of the IMF's Articles of Agreement, the IMF holds bilateral discussions with members, usually
every year. A staff team visits the country, collects economic and financial information, and discusses with officials
the country's economic developments and policies. On return to headquarters, the staff prepares a report, which
forms the basis for discussion by the Executive Board.
International Monetary Fund
700 19th Street, NW
Washington, D. C. 20431 USA

was underpinned by the collection of tax arrears (in part transitory), higher ECP revenues
(subject to uncertainty), and low capital expenditure. Going forward, fiscal policy should be
calibrated to allow space for reconstruction expenditure within fiscally sustainable bounds,
consistent with the regional debt target commitment.
Executive Board Assessment2
Executive Directors noted the economic impact on Dominica caused by Tropical Storm Erika in
August 2015 and commended the authorities for their policy response. The disbursement under
the RCF program in October 2015 supported the immediate financing needs while providing
time to specify measures consistent with the fiscal consolidation targets to restore fiscal
sustainability. Looking forward, Directors underscored the importance of maintaining the reform
momentum to achieve fiscal and debt sustainability in the medium term, strengthen the financial
system, and encourage private sector-led growth in order to enhance the country’s resilience to
possible future natural disasters.
Directors supported the accommodation of reconstruction expenditures over the medium term,
and emphasized the importance of financing the reconstruction activities within fiscally
sustainable bounds. They noted that the fiscal measures already passed are appropriate and
consistent with the commitments in the RCF, and that the improvements in tax administration are
yielding additional resources. Given the uncertainty regarding revenues from the economic
citizenship program (ECP) and the implementation risk of the remaining reforms, Directors
suggested that any unanticipated revenue windfalls should be allocated to public debt reduction
and to build fiscal buffers. Directors noted that a timely implementation of the fiscal
consolidation plan is needed to attain the Eastern Caribbean Currency Union’s debt target
by 2030. They also supported the authorities’ efforts to seek additional donor grants and
concessional financing as part of their integrated fiscal consolidation strategy.
Directors encouraged the authorities to complement the fiscal measures with structural fiscal
reforms to make fiscal consolidation gains durable. Such measures should focus on strengthening
and supporting the budget process and its execution, including systems to improve public
financial management, and improving the transparency of the ECP.
Directors welcomed the progress made in strengthening the financial sector, but noted that high
levels of non-performing loans and low capitalization across the financial industry pose risks to
financial stability. They encouraged the authorities to press ahead with efforts to improve
financial regulation and supervision, and further strengthen AML/CFT legislation.
2 At the conclusion of the discussion, the Managing Director, as Chairman of the Board, summarizes the views of
Executive Directors, and this summary is transmitted to the country's authorities. An explanation of any qualifiers
used in summing up can be found here: http://www.imf.org/external/np/sec/misc/qualifiers.htm.

Directors agreed that enhancing growth prospects requires higher private sector participation and
improving the business environment. To this end, they encouraged the authorities to continue
pursuing structural reforms that facilitate an efficient operation of markets. In particular, they
emphasized the importance of reforms to boost external competitiveness, including in the areas
of labor markets, export diversification, access to finance, and energy costs. The ongoing plans
to enhance the preparedness for and resilience to natural disasters should continue, as these
shocks could be large and recurrent. In this regard, Directors encouraged the authorities to
consider establishing a saving fund, using some of the ECP revenues.

Dominica: Selected Economic and Financial Indicators, 2012-18
Projected
2012 2013 2014 2015 2016 2017 2018
Output and Prices (annual percent change, unless otherwise specified)
Real GDP 1/ -1.3 0.6 3.9 -3.9 1.3 2.8 2.7
Nominal GDP 1/ -3.3 4.4 3.5 -4.7 1.1 4.4 4.5
Consumer prices, end of period 1.3 -0.4 0.5 -0.1 -0.1 1.8 1.8
Real effective exchange rate
(period average, depreciation -)
0.2 -0.6 -0.7 … … … …
Central Government Balances 2/ (in percent of GDP, unless otherwise specified)
Revenue 30.3 30.0 28.1 36.1 35.8 34.6 33.8
Expenditure 35.7 33.0 32.5 35.1 38.2 35.7 33.6
Primary balance -3.4 -1.0 -2.9 3.3 -0.1 1.3 2.6
Excl. Economic Citizenship Program -7.2 -4.6 -4.6 -1.6 -3.7 -2.2 -0.7
Overall balance (incl. ND cost buffers) -5.4 -3.0 -4.4 0.9 -3.9 -2.6 -1.3
Excl. Economic Citizenship Program -9.2 -6.6 -6.1 -4.0 -6.0 -4.6 -3.1
Central government debt (incl. guaranteed) 3/ 72.6 74.7 83.9 85.5 87.7 87.3 85.4
External 52.6 52.6 53.4 56.6 56.4 55.8 53.2
Domestic 20.0 22.1 30.5 28.9 31.2 31.5 32.2
Balance of Payments
Current account balance -17.4 -9.8 -11.2 -9.4 -12.6 -13.7 -14.1
Exports of goods and services 4/ 32.6 38.2 41.4 41.9 41.0 40.1 39.8
Imports of goods and services 5/ 51.5 48.1 53.8 52.4 53.6 53.7 53.8
External debt (gross) 6/ 75.1 74.4 81.6 93.5 91.6 89.8 88.1
Net imputed international reserves:
Millions of U.S. dollar 91.8 85.4 99.9 125.4 116.6 118.5 120.4
Months of imports of goods and services 4.4 4.2 4.3 5.7 5.2 5.0 4.9
Savings-Investment Balance -17.4 -9.8 -11.2 -9.4 -12.6 -13.7 -14.1
Savings -2.1 3.9 3.7 3.1 4.5 3.1 0.7
Investment 15.2 13.7 14.9 12.5 17.1 16.8 14.8
Sources: Dominican authorities; Eastern Caribbean Central Bank; and Fund staff estimates and projections
1/ At market prices. Historical data reflect national accounts data revision published by the ECCB on July 2, 2015.
2/ Data for fiscal years running from July to June of the next year.
3/ Includes estimated commitments under the Petrocaribe arrangement with Venezuela.
4/ Includes revised historical data from 2014 onwards on exports of tourism services.
5/ Includes public capital expenditure induced imports from 2019 onwards, to account for possible mitigation of
natural disasters.
6/ Comprises public sector external debt, foreign liabilities of commercial banks, and other private debt.

DOMINICA STAFF REPORT FOR THE 2016 ARTICLE IV CONSULTATION
KEY ISSUES
Context. After tropical storm Erika in August 2015, the government has focused on
infrastructure rehabilitation, social support, and the identification of financing for
reconstruction. The approval of a disbursement under the RCF (SDR 6.15 million) in
October 2015 has supported immediate financing needs while providing time to specify
measures consistent with the fiscal consolidation targets committed to restore fiscal
sustainability. Measures already passed and planned for the FY2016/17 budget are in
line with the authorities’ commitment during the RCF discussions. The storm has
worsened long-standing competitiveness and fiscal sustainability problems. The
difficulties related to restraining public wage expenditures and executing public
investment further compound these challenges.
Outlook. Output is estimated to have declined by 3.9 percent in 2015 as a result of the
storm, and is projected to recover in the near term before stabilizing at a potential
growth rate of 1.7 percent per year. The recovery is underpinned by an increase in
public investment for reconstruction, and a gradual normalization of economic
activities, mainly tourism and agriculture. The current account and fiscal deficits are
projected to deteriorate during the reconstruction phase, and to improve gradually over
the medium-term on the back of the fiscal consolidation and the recovery of the main
export sectors.
Risks. Main risks to the outlook stem from recurrent natural disasters, delays in
reconstruction and grant disbursement, the increasing importance of ECP revenues that
are difficult to predict, political resistance to the remaining fiscal consolidation, further
strengthening of the US dollar weighing on competitiveness, and weaknesses in the
financial sector affected by high NPLs and insufficient regulation and supervision of
credit unions. The government has no fiscal cushion in case of another natural disaster,
and a decline of grant or ECP revenues below expectations would severely affect fiscal
and external sustainability.
June 22, 2016

DOMINICA
2 INTERNATIONAL MONETARY FUND
Approved By Charles Enoch (WHD) and Bob Traa (SPR)
Discussions were held in Roseau over March 29-April 11, 2016. The team comprised Alejandro Guerson (head), Wayne Mitchell, Saji Thomas and Balazs Csonto (all WHD). Ronald James (WHD, Barbados) joined the mission for few days. Ms. Ke Wang (RES) contributed to the preparations for the mission. The mission was assisted from headquarters by Hanlei Yun, RoseMarie Fonseca, and Joy Villacorte. The mission met with Prime Minister Roosevelt Skerrit; senior government officials; labor unions; and private sector representatives.
CONTENTS
BACKGROUND ___________________________________________________________________________________ 4
RECENT DEVELOPMENTS ________________________________________________________________________ 4
OUTLOOK AND RISKS ___________________________________________________________________________ 6
POLICY RECOMMENDATIONS _________________________________________________________________ 11
A. Fiscal Policy ____________________________________________________________________________________ 11
B. Financial Sector ________________________________________________________________________________ 16
C. Growth and Competitiveness __________________________________________________________________ 18
STAFF APPRAISAL ______________________________________________________________________________ 21 BOXES 1. Risk Assessment Matrix ________________________________________________________________________ 10 2. Structural Fiscal Reforms _______________________________________________________________________ 16 FIGURES 1. Economic Performance ________________________________________________________________________ 24 2. External Sector Developments _________________________________________________________________ 25 3. Fiscal Developments ___________________________________________________________________________ 26 4. Monetary Developments ______________________________________________________________________ 27 TABLES 1. Fiscal Measures and Expected Yields, FY2015/15 ______________________________________________ 12 2. Selected Economic and Social Indicators, Active Scenario _____________________________________ 28 3. Balance of Payments, Active Scenario _________________________________________________________ 29 4. Summary Accounts of the Banking System ____________________________________________________ 30 5a. The Statement of Operations of the Central Government, Active (EC Dollars) _______________ 31 5b. The Statement of Operations of the Central Government, Active (% GDP) ___________________ 32

DOMINICA
INTERNATIONAL MONETARY FUND 3
6. Central Government Financing Needs and Sources, Active Scenario __________________________ 33
ANNEXES
I. Debt Sustainability Analysis ____________________________________________________________________ 34
II. External Sector Assessment ___________________________________________________________________ 45

DOMINICA
4 INTERNATIONAL MONETARY FUND
BACKGROUND
1. After tropical storm Erika in August 2015, the government focused on the rehabilitation
of infrastructure and meeting the needs of those affected by the storm. Since then, the
rehabilitation efforts have restored some normality to daily activities. The main airport is now fully
operational; electricity generation has regularized; the main roads are usable; and several social and
micro-businesses support programs are in place. Moreover, the government is providing shelter to
displaced families and has made significant progress in the plans for the relocation of the affected
population into safer areas. The public investment program has been re-prioritized, and there is
progress in the identification of official lending and grant financing. However, core public
reconstruction activities have been slow to start mainly as a result of delays in the disbursement of
financing already committed and capacity constraints.
2. The government has developed a macroeconomic plan that is financially-sustainable and
accommodates the large reconstruction expenditure, estimated at 65 percent of GDP. The
broad parameters of this plan have been set out in the discussions leading to the disbursement
under the Rapid Credit Facility (RCF) approved by the IMF’s Executive Board in October 2015. Since
then, the authorities have passed measures in line with their RCF commitments, and are finalizing
the specification of measures committed under the RCF for FY2016/17; these are included in the
budget proposal under discussion.
RECENT DEVELOPMENTS
3. Output is estimated to have declined by 3.9 percent in 2015 as a result of the storm, and
the recovery is now estimated to be slower and more protracted than in the RCF estimates.
Tourism activities are returning to earlier levels following the resumption of full operations at the
main airport. Visitor arrivals have recovered, although to levels that are lower than in the previous
season, as a result of the storm and also because of a significant reduction in flights by the main
regional airline as it restructures its operations. Other sectors have been slower to rebound, and will
likely need more time to fully recover. In particular, agriculture output declined sharply as the storm
affected crops and access to arable land, and
significant areas are now in need of re-
planting and soil treatment. Manufacturing is
also significantly affected, as the storm
prompted the closure of the main industrial
plant. The protracted decline of banks’ credit
to the private sector remains a drag on
economic activity, underpinned by high non-
performing loans (NPLs) — more than 15
percent of total loans — and low profitability.
Inflation has remained subdued, within a
slightly negative range on a year-on-year
basis, mainly as a result of falling fuel prices.
-6
-4
-2
0
2
4
6
8
10
12
14
2010Q
1
2010Q
2
2010Q
3
2010Q
4
2011Q
1
2011Q
2
2011Q
3
2011Q
4
2012Q
1
2012Q
2
2012Q
3
2012Q
4
2013Q
1
2013Q
2
2013Q
3
2013Q
4
2014Q
1
2014Q
2
2014Q
3
2014Q
4
2015Q
1
2015Q
2
2015Q
3
2015Q
4Contributions to Credit Growth by Sector
(pp, y-o-y)
Construction & Land Development
Distributive Trade
Tourism
Professional & Other Services
Public Administration
Personal
Other
Total
DOMINICA
INTERNATIONAL MONETARY FUND 5
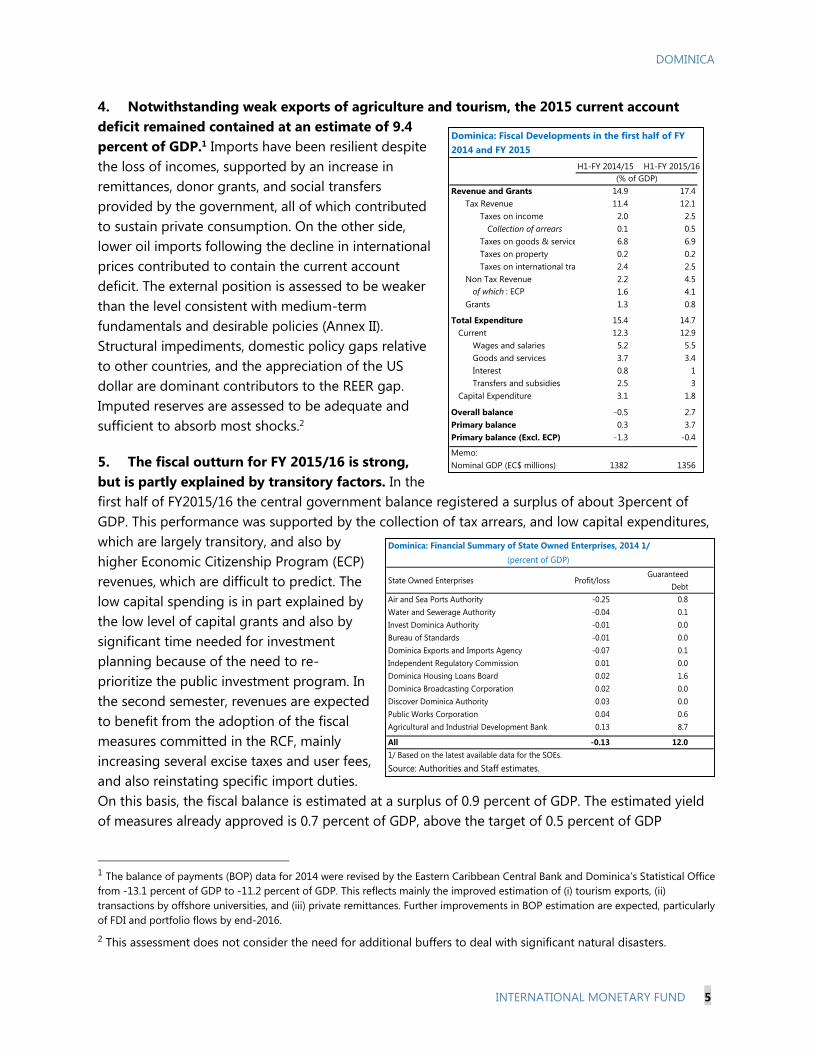
4. Notwithstanding weak exports of agriculture and tourism, the 2015 current account
deficit remained contained at an estimate of 9.4
percent of GDP.1 Imports have been resilient despite
the loss of incomes, supported by an increase in
remittances, donor grants, and social transfers
provided by the government, all of which contributed
to sustain private consumption. On the other side,
lower oil imports following the decline in international
prices contributed to contain the current account
deficit. The external position is assessed to be weaker
than the level consistent with medium-term
fundamentals and desirable policies (Annex II).
Structural impediments, domestic policy gaps relative
to other countries, and the appreciation of the US
dollar are dominant contributors to the REER gap.
Imputed reserves are assessed to be adequate and
sufficient to absorb most shocks.2
5. The fiscal outturn for FY 2015/16 is strong,
but is partly explained by transitory factors. In the
first half of FY2015/16 the central government balance registered a surplus of about 3percent of
GDP. This performance was supported by the collection of tax arrears, and low capital expenditures,
which are largely transitory, and also by
higher Economic Citizenship Program (ECP)
revenues, which are difficult to predict. The
low capital spending is in part explained by
the low level of capital grants and also by
significant time needed for investment
planning because of the need to re-
prioritize the public investment program. In
the second semester, revenues are expected
to benefit from the adoption of the fiscal
measures committed in the RCF, mainly
increasing several excise taxes and user fees,
and also reinstating specific import duties.
On this basis, the fiscal balance is estimated at a surplus of 0.9 percent of GDP. The estimated yield
of measures already approved is 0.7 percent of GDP, above the target of 0.5 percent of GDP
1 The balance of payments (BOP) data for 2014 were revised by the Eastern Caribbean Central Bank and Dominica’s Statistical Office
from -13.1 percent of GDP to -11.2 percent of GDP. This reflects mainly the improved estimation of (i) tourism exports, (ii)
transactions by offshore universities, and (iii) private remittances. Further improvements in BOP estimation are expected, particularly
of FDI and portfolio flows by end-2016.
2 This assessment does not consider the need for additional buffers to deal with significant natural disasters.
Dominica: Financial Summary of State Owned Enterprises, 2014 1/
State Owned Enterprises Profit/lossGuaranteed
Debt
Air and Sea Ports Authority -0.25 0.8
Water and Sewerage Authority -0.04 0.1
Invest Dominica Authority -0.01 0.0
Bureau of Standards -0.01 0.0
Dominica Exports and Imports Agency -0.07 0.1
Independent Regulatory Commission 0.01 0.0
Dominica Housing Loans Board 0.02 1.6
Dominica Broadcasting Corporation 0.02 0.0
Discover Dominica Authority 0.03 0.0
Public Works Corporation 0.04 0.6
Agricultural and Industrial Development Bank 0.13 8.7
All -0.13 12.0
1/ Based on the latest available data for the SOEs.
Source: Authorities and Staff estimates.
(percent of GDP)
H1-FY 2014/15 H1-FY 2015/16
Revenue and Grants 14.9 17.4
Tax Revenue 11.4 12.1
Taxes on income 2.0 2.5
Collection of arrears 0.1 0.5
Taxes on goods & services 6.8 6.9
Taxes on property 0.2 0.2
Taxes on international trade 2.4 2.5
Non Tax Revenue 2.2 4.5
of which : ECP 1.6 4.1
Grants 1.3 0.8
Total Expenditure 15.4 14.7
Current 12.3 12.9
Wages and salaries 5.2 5.5
Goods and services 3.7 3.4
Interest 0.8 1
Transfers and subsidies 2.5 3
Capital Expenditure 3.1 1.8
Overall balance -0.5 2.7
Primary balance 0.3 3.7
Primary balance (Excl. ECP) -1.3 -0.4
Memo:
Nominal GDP (EC$ millions) 1382 1356
Dominica: Fiscal Developments in the first half of FY
2014 and FY 2015
(% of GDP)

DOMINICA
6 INTERNATIONAL MONETARY FUND
committed in the RCF. The significant improvement in revenue administration and tax auditing
facilitated the identification of additional tax arrears, which is expected to broaden the tax base
going forward. The state owned enterprises (SOEs) sector is affected by financial sustainability
challenges. This sector is in general operationally balanced, but their resources are insufficient to
cover capital replacement (text table). Their debt is significant, contributing 12 percent of GDP to the
stock of public sector debt, and it is mostly concentrated in financial public entities (text table).
OUTLOOK AND RISKS
6. Output growth is expected to remain subdued in 2016 at 1.3 percent as the economy
slowly recovers from the storm and investment in reconstruction picks up. This growth,
however, is largely conditional on donor grants proceeding according to expectations –now revised
to about two-thirds of the projection at the time of
the RCF. A partial recovery of tourism and
agriculture would also contribute to growth in 2016.
Inflation is projected to remain subdued in the near
term due to lower oil prices, notwithstanding the
increase of several excise taxes.
7. Output growth is projected to accelerate in
2017 as the economy recovers towards potential,
and to stabilize at 1.7 percent per year over the
medium-term. This outlook is affected by
weakening expectations on global growth, and the
recent appreciation of the US dollar, which could
slow tourism exports going forward – including
through the indirect effects from other Caribbean
countries, the main origin of Dominica’s visitors. On
the domestic front, credit to the private sector is
projected to continue to decline as a percent of GDP given banks’ need to provision for NPLs, as
they repair their balance sheets. The lending activities of the large credit unions sector, however,
would ease private financing constraints. On the upside, the outlook could benefit from persistently
low oil prices and its pass-through to electricity costs; and the construction of two large hotel
projects that could boost construction activities and employment in the near-term while also
increasing potential output. ECP revenues could also be higher than expected if the recent surge in
demand persists, and also after recent changes to the program with a new investment option at a
higher fee.
8. The fiscal consolidation continues in line with the discussions in the RCF. The strong
implementation of measures so far and the formal requests for technical assistance for the second-
generation reforms signal the authorities’ commitment to the fiscal consolidation targets discussed
in the RCF. The authorities are finalizing the details of measures for the FY2016/17 budget, including
Dominica: Donor grants committed, FY 2015-16
Country/Agency
(US$ millions) (% of GDP)
Multilateral 0.3 0.1
FAO 0.3 0.1
Bilateral 98.6 18.9
European Union 7.3 1.4
UK 35.6 6.8
India 15.0 2.9
Turkey 0.0 0.0
Trinidad and Tobago 0.8 0.1
Venezuela 32.0 6.1
Mexico 5.0 1.0
Japan 1.7 0.3
Republic of Korea 0.1 0.0
Italy 1.2 0.2
Total 98.9 19.0
Source: Country Authorities
Amount Committed

DOMINICA
INTERNATIONAL MONETARY FUND 7
a review of fuel excises, a presumptive tax,
a departure tax, and a solid waste charge,
while maintaining the efforts on tax
compliance. The cumulative estimated
yields to FY 2016/17 could reach 2
percent of GDP, which is above the RCF
target of 1.1 percent of GDP. Given the
strong implementation of measures, the
fiscal outlook includes a gradual fiscal
consolidation of 6.7 percent of GDP by FY
2020/21, in line with the continuation of
the authorities’ fiscal consolidation plan
and with the RCF.3 This would entail
reaching a primary surplus of 3.5 percent
of GDP by FY2020/21, equivalent to an
underlying primary surplus of 1.7 percent
of GDP4.
9. In this context, the external and fiscal deficits are projected to deteriorate before
improving in the medium-term. Fiscal and external imbalances would initially deteriorate on the
back of the increase in reconstruction investment, and then gradually improve as exports of
agriculture, tourism and remaining manufacturing activities recover. Staggering the implementation
of the fiscal measures in line with RCF commitments would result in a smooth improvement of the
underlying fiscal and current account balances over the medium-term (text charts). The medium
term fiscal outlook also benefits from a new investment option in the ECP5, and from the approval of
parametric changes to strengthen the sustainability of the pension system, which has been a
significant contingent liability. The imbalances are expected to be financed primarily with external
capital grants and official concessional loans. The projected improvement of the fiscal and external
imbalances, however, is conditional on the full implementation of the government’s fiscal
consolidation plan.
3 This amount of fiscal consolidation is 0.5 percent higher than in the RCF, reflecting the additional measures taken
by the authorities and the base effect of the improvements in tax compliance.
4 The underlying primary balance is calculated as the primary balance excluding ECP revenues, one-off collection of
tax arrears, temporary storm-related reconstruction and social assistance spending, and the transitory increase in
grants projected after tropical storm Erika.
5 Any additional revenues from the higher fees would materialize starting in FY2018/19.
Current RCF Current RCF Current RCF
Revenue 36.1 33.0 35.8 35.7 34.6 37.8
Tax revenue 24.9 21.2 24.5 21.4 23.9 23.1
Non-tax Revenue 6.9 5.6 5.2 5.1 5.0 5.0
Grants 4.2 6.2 6.1 9.1 5.7 9.6
Total Expenditure 35.1 35.4 38.2 38.3 35.7 37.9
Current 27.0 27.2 26.8 26.1 26.0 25.9
Wages 11.2 10.6 11.3 10.3 10.8 10.1
Goods and Services 7.4 8.5 7.4 7.6 7.4 7.6
Interest 2.4 2.3 2.3 2.4 2.4 2.5
Transfers 5.9 5.8 5.7 5.8 5.4 5.7
Capital 8.2 8.3 11.4 12.2 9.7 12.0
Overall balance 0.9 -2.4 -2.4 -2.6 -1.1 -0.1
Primary balance 3.3 -0.1 -0.1 -0.2 1.3 2.4
Dominica: Fiscal performance, current versus RCF
(in percent of GDP)
2015/16 2016/17 2017/18

DOMINICA
8 INTERNATIONAL MONETARY FUND
10. The road ahead remains challenging and subject to significant risk. That, plus the
significant time required for investment planning under significant capacity constraints6, could delay
reconstruction and reduce growth. Natural disasters will remain a recurrent threat (see SIP). ECP
revenues are subject to increasing scrutiny from advanced economies, and are also facing increasing
regional competition. However, they can also turn out better than projected in the active policies
scenario if the higher demand observed in recent months is more durable than anticipated.
Administrative capacity constraints and political resistance could delay the implementation of more
complex structural fiscal reforms that have been committed to, especially the rationalization of tax
expenditure and restraining the wage bill7. Additional appreciation of the US dollar may reduce
competitiveness further. Petrocaribe inflows could come to a halt, especially given economic
difficulties in Venezuela and the recent victory of the opposition in Congressional elections which
supports the termination of the program. An important upside risk is the geothermal electricity
project, which has been revised to a smaller but more realistic scale, and could boost investment
above the current projections in the near term and increase potential output as result of lower
electricity costs and additional export revenues.8 Persistently low oil prices is another source of
upside and downside uncertainty. Finally, two large hotel projects are currently planned, and could
boost activity conditional on the identification of financing (Box 1).9
11. The outlook for fiscal sustainability is highly dependent on the availability of grants
and on the stability of ECP revenues. Donor grants, which are critical to finance reconstruction
6 Resilient reconstruction requires topographic and hydrologic studies, which need the identification and hiring of
specialized consultants.
7 Staff recommended the discontinuation of retroactive wage compensations during discussions for the RCF
disbursement.
8 This project has been under preparation for several years, but protracted negotiations among the interested parties
and the need to identify financing have delayed the start of investment activities.
9 This refers to projects for which the government is seeking financing (including with the new ECP investment
option), which are expected to be administered by Kempinski and Hilton.
-4
-3
-2
-1
0
1
2
3
4
2015 2017 2019 2021 2023 2025 2027 2029
Underlying Primary balances
(in percent of GDP), fiscal years
Actual Primary balance
Underlying primary balance
The underlying primary balance excludes ECP revenues and temporary factors such as reconstruction expenditures, storm related transfers, tax arrears and excess grants. 0
2
4
6
8
10
12
14
16
2013 2014 2015 2016 2017 2018 2019 2020 2021
Underlying Current Account Deficit, 2013-2021
(in percent of GDP, projections)Reconstruction by private sector
Reconstruction by public sector
Range effects
Underlying current account deficit
Current account deficit

DOMINICA
INTERNATIONAL MONETARY FUND 9
expenditure within fiscally sustainable bounds, have so far remained below expectations10. The
outlook assumes grant financing of reconstruction expenditure in the range of 5-6 percent of GDP
per year, which then tapers off to historical
levels of about 3 percent of GDP. The
underlying assumption is that grants
already committed by the donor partners
are disbursed over the first half of the
reconstruction period, and a similar amount
is disbursed in the later second half. It
should be noted, however, that the fiscal
outlook is highly sensitive to the
performance of grant financing and ECP
revenues, which are inherently uncertain
and subject to a sudden stop. Deviations
from the projected flows have sizable
implications on the need for fiscal consolidation and the space for public investment. For example,
should grants be 30 percent lower than projected, public debt would stabilize at around the current
level with the projected amounts of fiscal consolidation and public investment for reconstruction
(text chart).
12. The financial sector is also a source of risk with potential fiscal costs. The full impact of
the storm on NPLs is yet to be fully reflected in the data given the recording lags, and could be
higher than anticipated. The effect on the National Bank of Dominica (NBD) could also have fiscal
implications in the case of a recapitalization –the asset quality review conducted in 2015 by the
Eastern Caribbean Central Bank (ECCB) already points to elevated recapitalization needs of around
3 percent of GDP. The protracted decline in the share of time deposits in favor of demand and
saving deposits, if sustained, implies a higher liquidity risk for banks, which could further slow credit
to the private sector. The growth of the credit union sector, which is taking a larger share of the
overall domestic financial business (total assets are approaching 50 percent of GDP11), implies that
financial intermediation is becoming increasingly subject to weaker regulatory and supervisory
standards, a characteristic of this sector. Should a failure in the credit union sector occur, a
government bailout of depositors remains a possibility even without explicit legal requirements.
Also, a liquidity problem in the credit unions could spill over to the banking sector and ultimately to
the real economy (see selected issues paper on credit unions). De-risking by banks operating in
Dominica could result in the loss of correspondent banking relations (CBRs), affecting the ability to
make international transactions.
10 A donor conference was held in December 2015.
11 See the selected issues paper on credit unions.
30
40
50
60
70
80
90
100
2015 2017 2019 2021 2023 2025 2027 2029
Dominica: Public Debt Dynamics Under Different Assumptions
of Grants for Reconstruction Spending (percent of GDP)
Public debt (active policies scenario)
Public debt (grants 30 percent lower)
Regional debt target

DOMINICA
10 INTERNATIONAL MONETARY FUND
Box 1. Risk Assessment Matrix1
Source of risk and direction if
materialized
Likelihood
Impact
Policy response
Poor fiscal policy implementation (↓)
Remaining fiscal adjustment may be
delayed either due to weak capacity or
political resistance.
High High Implement credible multi-year fiscal
adjustment strategy in line with the active
policies scenario.
Natural disasters (↓)
Extreme events could disrupt external and
fiscal sustainability.
High High Build buffers and optimize insurance
policies, with the assistance of the World
Bank.
Petrocaribe financing (↓)
Support from Venezuela could come to a
halt.
High High Identify alternative sources of financing
while maintaining fiscal consolidation
momentum.
Persistently lower energy prices (↑)
Costs may be kept down if supply factors
reverse gradually or if demand weakens.
High Medium Take advantage of favorable conditions to
begin fiscal adjustment when
reconstruction needs permit.
Surge in US dollar (↓)
Improving U.S. economic prospects versus
the rest of the world leads to a further
dollar surge. This could also lead to real
effective appreciation in Dominica,
weakening competitiveness.
High Medium Improve competitiveness with public
sector wage restraint, which may signal to
the private sector; reduce energy prices;
improve access to finance of small firms;
improve labor productivity and the
functioning of labor markets.
Financial sector instability (↓)
Persistently high NPLs and low earnings
may further weaken the capital base
which could precipitate a systemic event.
Medium High Promptly implement remaining elements
of regional strategy to strengthen
indigenous banks in the ECCU. Strengthen
regulation and supervision of credit
unions.
Large-scale hotel constructions (↑)
Two planned large-scale hotel projects
could boost activity during construction
and increase the tourism revenues.
Medium High Continue improving the business
environment.

DOMINICA
INTERNATIONAL MONETARY FUND 11
Box 1. Risk Assessment Matrix (Conclusion)
Citizenship program demand (↑/↓)
If citizenship revenues are high, and the
program is managed prudently, it could
reduce fiscal risks and debt overhang. A
sudden stop could create a financing gap.
Medium Medium
to
High
Create a government fund to direct
receipts towards debt reduction,
infrastructure investment, and
reconstruction after natural disasters.
Reduce sudden stop risks by maintaining
strict governance standards and further
strengthening its integrity.
Bank’s de-risking (↓)
Loss of correspondent banking relations
can affect international transactions.
Medium Medium Strengthen the implementation of
customer due diligence requirements in
line with the FATF standard.
Sharp asset price decline and
decompression of credit spreads (↓)
Investors reassess underlying risk and
respond to unanticipated changes in
growth and financial fundamentals in large
economies, Fed policy rate path, and
increases in U.S. term premia, with poor
market liquidity amplifying volatility.
Medium Low Implement credible fiscal adjustment;
prioritize grant financing; and seek to
lower borrowing costs by maintaining a
high the share concessional borrowing in
public debt.
1 The Risk Assessment Matrix (RAM) shows events that could materially alter the active policies path (the scenario
most likely to materialize in the view of IMF staff). The relative likelihood of risks listed is the staff’s subjective
assessment of the risks surrounding the active policies scenario (“low” is meant to indicate a probability below 10
percent, “medium” a probability between 10 and 30 percent, and “high” a probability of 30 percent or more). The
RAM reflects staff views on the source of risks and overall level of concern as of the time of discussions with the
authorities. Non-mutually exclusive risks may interact and materialize jointly.
POLICY RECOMMENDATIONS
A. Fiscal Policy
13. Fiscal policy should be calibrated to allow space for reconstruction expenditure within
fiscally sustainable bounds. The fiscal consolidation measures identified since the RCF amount to
6.7 percent of GDP, sufficient to reduce public debt to 67 percent of GDP by 2030. This debt
trajectory is higher than in the RCF mainly because it now includes the stock of Petrocaribe
obligations which are guaranteed by the government (estimated at 9 percent of GDP).12 This
consolidation includes a provision of 1.5 percent of GDP per year to build fiscal buffers to address
future natural disasters, which are also accounted as a fiscal cost in the active scenario. New
measures with a total yield of 0.7 percent of GDP have already been passed in FY2015/16. The
12 Excluding the estimated Petrocaribe debt stock the debt trajectory would decline to below 60 percent of GDP by
2030. This amount of fiscal measures is higher than committed in the RCF, mainly as a result of additional measures
not included in the RCF and also as a result of progress in tax administration mentioned above.

DOMINICA
12 INTERNATIONAL MONETARY FUND
measures planned for the FY2016/17 budget, including a review of fuel excises, a presumptive tax,
and a solid waste charge, would yield an additional 1.3 percent of GDP. The remaining measures
amounting to 4.7 percent of GDP have been identified, and the authorities are working to introduce
them in the near term. Staff recommends a gradual adoption of the measures within the next five-
year period to smooth their impact on economic activity (Table 1). The expansionary impact of the
increase in public investment for reconstruction during this period would alleviate the drag on
economic activity.
Table 1. Dominica: Fiscal Measures and Expected Yields, FY2015/15
(Cumulative; in percent of GDP)
14. Staff recommended focusing on the full implementation of the fiscal measures already
identified, and considering the introduction of additional measures once the recovery is on
solid footing to meet the ECCU debt objective. Reducing the public debt to the regional target of
60 percent of GDP by 2030 (including Petrocaribe) would require additional fiscal consolidation of
0.8 percent of GDP. However, given the weaker recovery prospects compared with the RCF,
introducing additional measures before 2021 could be counteproductive from cyclical and structural
perspectives – especially if more consolidation crowds out investment for reconstruction. The
authorities effort should focus on delivering the fiscal consolidation plan that has already been
Fiscal Measures FY2015/16
(Est.)
FY2016/17 FY2017/18 FY2018/19 FY2019/20 FY2020/21 Status
Revenue 0.7 1.2 1.4 1.7 2.0 2.2
Increase in specific excises on alcohol, and tobacco by 10% 0.0 0.1 0.1 0.1 0.1 0.1 Done
Introduction of a highway maintenance levy 0.0 0.0 0.0 0.1 0.1 0.1 Done
Reinstatment of the import duty on meat imports at the 2008 level 0.1 0.1 0.1 0.2 0.2 0.3 Done
Increase in tax base due to better auditing and enforcement to collect tax arrears 0.5 0.6 0.7 0.7 0.7 0.7 Ongoing
Departure tax 0.0 0.1 0.1 0.1 0.1 0.1 Done
Reduction in discretionary concessions by rationalizing tax incentives 1/ 0.0 0.0 0.0 0.2 0.4 0.5 Ongoing
Property tax reform 1/ 0.0 0.0 0.0 0.0 0.0 0.0 Not done
Solid Waste charge 0.0 0.1 0.1 0.1 0.1 0.1 Budget 2016/17
Temporary reconstruction tax 1/ 0.0 0.0 0.0 0.0 0.0 0.0 Not done
Increase fuel-related taxes and import charges 1/ 0.0 0.0 0.0 0.0 0.0 0.0 Not done
Review of health care fees to improve cost-recovery 2/ 0.0 0.1 0.1 0.1 0.1 0.1 Budget 2016/18
Introduction of a residential levy on all villa owners 0.0 0.0 0.0 0.0 0.0 0.0 Not done
Introduction of a new airport security levy 0.0 0.0 0.0 0.0 0.0 0.0 Not done
Introduction of a presumptive tax 3/ 0.0 0.1 0.1 0.1 0.1 0.1 Budget 2016/19
Expenditure 0.0 0.8 1.3 2.3 3.2 4.4
Wage restraint FY2016/17 0.0 0.3 0.5 0.7 0.9 1.0 Ongoing
Unwinding of reconstruction projects and investment re-prioritization 0.0 0.5 0.5 0.8 1.5 2.0 Ongoing
Unwinding of Erika storm-related social transfers 0.0 0.0 0.3 0.8 0.8 1.4 Begins in 2017/18
Additional measures not in the RCF 0.0 0.0 0.0 0.0 0.1 0.1
Increase the excise tax on sugar confectionary, soft drinks and chocolates 0.0 0.0 0.0 0.0 0.1 0.1 Done
Introduction of new investment option in the ECP 4/ 0.0 0.0 0.0 0.0 0.0 0.0 Done
Total Yield 0.7 2.0 2.7 4.0 5.2 6.7
1/ Formally requested TA from IMF (FAD).
2/ TA requested from PAHO, expected before mid-2016.
4/ The active scenario conservatively assumes no revenues since the net effect from the ECP policy changes on revenues is not clear.
3/ TA received from CARTAC. Fiscal projections assumes no revenues for FY 2016 for prudence.
Dominica: Fiscal Measures and Expected Yields, FY2015/16 - FY2020/21
(Cummulative; in percent of GDP)

DOMINICA
INTERNATIONAL MONETARY FUND 13
identified, and if the government debt target commitment is to be reached before 2030 (inlcuding
Petrocaribe), then the remaining amount of measures could be identified and made effective after
2021. Given this, and in light of the significant risks outside the government control (significant
financing gaps could emerge depending on the performance of grants, ECP revenues or the
ocurrence of another natural disaster; see text charts), the authorities’ strategy to seek debt relief
from bilateral creditors should continue; including at the Paris Club creditors meetings13 and also by
way of bilateral negotiations on Petrocaribe debt service.14
15. The progress in the implementation of the fiscal consolidation plan is commendable,
but maintaining the reform momentum is crucial. The measures passed so far are not sufficient
to achieve fiscal sustainability. For example, if no further measures were adopted, public debt would
be on an upward trajectory (left text chart). The outlook assumes the gradual adoption of the
remaining measures in line with the government plan, including the gradual unwinding of storm-
related reconstruction investment and social assistance; further capital projects re-prioritization;
wage restraint; and an update of off-shore bank licenses. The government should also start with no
delay the specification of the second-generation fiscal measures, which are relatively more complex
and require more time to develop. These include the rationalization of tax expenditures, a property
tax reform, and a review of cost-recovery charges in the provision of health services. Technical
assistance has already been requested for these reforms, as needed for a timely implementation.
The medium term fiscal outlook also benefits from a new ECP investment option15, and from the
approval of parametric changes to strengthen the sustainability of the pension system, which has
been a significant contingent liability (right text chart).
13 Staff has supported the Dominica government request at the recent Paris Club meetings for debt cancellation and
extension of maturities.
14 Debt service payments on Petrocaribe obligations that were due in the past three years have been either
rescheduled or cancelled.
15 In 2015 the government revised the ECP by introducing a new real estate option that grants citizenship in
exchange for making investments in Dominica.
0
5
10
15
20
25
20
15
20
16
20
17
20
18
20
19
20
20
20
21
20
15
20
16
20
17
20
18
20
19
20
20
20
21
20
15
20
16
20
17
20
18
20
19
20
20
20
21
ECP revenues
lower by 50
Hurricane shock
in 2018
Dominica: Cummulative Fiscal financing gaps
under various shock scenarios
(in percent of GDP)
Grants lower by
50 percent
75
85
95
105
115
2015 2016 2017 2018 2019 2020 2021
Dominica: Public debt under various shock
scenarios (in percent of GDP)
Grants lower by 50 percent
ECP lower by 50 percent
Hurricane shock in 2018
Active policies scenario

DOMINICA
14 INTERNATIONAL MONETARY FUND
16. Given the numerous and significant risks, staff recommends a prudent approach in the
assessment of the fiscal balance required to achieve debt sustainability. In practice, this implies
the need to remain flexible to adjust the public investment program, adopt additional measures or
step up efforts to attract private investments, should grants or ECP revenues fall below expectations.
In order to make this prudent approach operational, the progress of the fiscal consolidation should
be measured in terms of the central government primary balance excluding ECP revenues and
transitory factors (see text chart above with the underlying primary fiscal balance of the active
scenario). This would support a more solid fiscal consolidation strategy, as it implies that any
additional revenues from the ECP should not substitute for fiscal consolidation. Staff strongly
recommends increasing the transparency of the ECP to protect the program’s integrity and the
sustainability of this important source of revenue, including by ensuring the effectiveness of the
background check process, publishing periodic reports of its financial flows and balances, and
elevating the risk profile of economic citizens through enhanced due diligence requirements, in
particular for politically exposed persons.
17. Staff advises the creation of a savings fund financed with ECP revenues to support the
fiscal consolidation strategy. Until a savings fund can be created, ECP revenues should initially be
used to reduce public debt. Once the savings fund has been created, the scope of the fund could
then be broadened to also allow some allocation for reconstruction after natural disasters. This
would provide a cushion against future natural disasters while ensuring that unpredictable ECP
revenues are not used for recurrent spending (which are more difficult to adjust) and as a result
strengthening fiscal sustainability. To this end, it is critical that the savings fund is supported by a
strong institutional design, including unambiguous budget contribution and disbursement rules,
with triggers based on verifiable criteria, a clearly-stated objective, and strict information disclosure
requirements to ensure the transparency of its operations. Staff simulations indicate that budget
savings of about 1.5 percent of GDP per year and a saving fund of about 8-10 percent of GDP are
40
60
80
100
120
140
2015 2017 2019 2021 2023 2025 2027 2029
Dominica: Public debt develpments
(in percent of GDP)
Public debt (active policies scenario)
Public debt (no adjustment)
(100)
0
100
200
300
400
500
600
700
800
900
1,000
1,100
0
50
100
150
200
250
300
350
400
450
2009 2014 2019 2024 2029 2034 2039 2044 2049 2054
Dominica Social Security: Financial Position
(EC$ Millions)
Reserves (right axis)
Total Income
Total expenditure
DOMINICA
INTERNATIONAL MONETARY FUND 15
appropriate to ensure the financial sustainability of the savings fund with a low probability of
depletion, while supporting public debt sustainability (text charts).16
18. The adoption of structural fiscal reforms is important to make fiscal consolidation gains
durable. The structural fiscal measures should focus on strengthening and supporting the budget
process and its execution within fiscally sustainable parameters with a solid Public Financial
Management framework. The framework should include a medium-term fiscal plan. Consideration
should also be given to the adoption of fiscal rules. Establishing a system to better monitor the
financial position of the State Owned Enterprises would also contribute to reinforce the durability of
the fiscal consolidation gains (Box 2).
16 The expected path of public debt projections in the fan chart shows a decline to 60 percent of GDP by 2030,
including Petrocaribe obligations, which is below the projected value in the active policies scenario. This is based on
estimated equations for output and government revenues and expenditures that mimic the cyclical behavior in the
historical data.
-20
-15
-10
-5
0
5
10
15
20
Off-sample Simulated Dynamics of a Fund for Natural Disasters
(In percent of GDP)
Fund stock
Budget financing flows-20
0
20
40
60
80
100
120
140
95 percent confidence
90 percent confidence
75 percent confidence
50 percent confidence
Expected
ECCU commitment by 2030
Public Debt Dynamics with a Fund for Natural Disasters 1/
(In percent of GDP)
1/ Assumes a probability threshold of natural disasters of 20 percent, and annual
budget savings of 1.5 percent of GDP in years with no ND.
Assumes fiscal consolidation in line with active policies scenario assumptions
0.0
0.5
1.0
1.5
2.0
2.5
3.0
0.1 0.15 0.20 0.25 0.30
Annual Budget Contributions to the Fund
for Natural Disasters (ND)
(percent of GDP)
Probability thresholds used to calibrate the frequency of simulated natural disasters
The blue oval indicates the calibration value in the baseline simulation
ND
occurs
every 7
years
ND
occurs
every 5
years
ND
occurs
every 4
years
ND
occurs
every 3
years
ND occurs
every 10
years
ND
occurs
every 7
years
ND
occurs
every 5
years
ND
occurs
every 4
years
ND
occurs
every 3
years
ND occurs
every 10
years
0.00
0.05
0.10
0.15
0.20
0.25
0.30
0.35
0.40
0.45
0.00 2.00 4.00 6.00 8.00 10.00 12.00
Probability of Depletion of the Saving Fund
(Average probability through 2016-25)
Size of saving fund (percent of GDP)
The red oval indicate the size of SF recommended for its financial
Assumption: annual probability of a ND = 0.20

DOMINICA
16 INTERNATIONAL MONETARY FUND
Box 2. Structural Fiscal Reforms
B. Financial Sector
19. A strategic plan should be devised to achieve a gradual reduction of NPLs, which should
be implemented without delay. The recent passing of the new Banking Act and Eastern Caribbean
Asset Management Company (ECAMC) are important steps to enhance the regulatory and
supervisory framework of the banking sector and address the NPL problem. The Banking Act
includes higher capital requirements, a more effective bank resolution framework, and stronger
protection for small depositors. The ECAMC Act will provide extraordinary powers to resolve NPLs.
The financial institutions are taking some measures to address the NPL problem, typically including
bilateral workouts with creditors in distress and significant provisioning. However, the bilateral
workouts can result in loan rescheduling or restructurings that delay an appropriate resolution.
More decisive action by the regulation authorities to enforce regulations with time-bound actions
and capitalization requirements when needed is important for a credible NPL reduction strategy that
addresses financial risk and supports growth. In order to facilitate NPL reduction further, the
government could also use its representation power at the ECCB to eliminate the deposit rate floor.
This would strengthen banks’ profitability and facilitate a NPL provisioning. It would also reduce
incentives for higher risk taking on loans as banks search for higher returns.
20. De-risking by international banks and the loss of CBRs by local institutions is an
important risk that also requires action. CBRs are essential to carry out international transactions,
● Adopt fiscal responsibility legislation establishing principles of responsible fiscal management and transparency,
with explicit links between concurrent deficits and long-term debt targets. Consider a fiscal rule to support fiscal
sustainability and anchor the formulation of the annual budget and its execution, including a correction mechanism
after deviations.
● Develop a medium-term fiscal framework to overarch the annual budget process. Include a fiscal strategy
statement in the annual budget, including a multi-year economic outlook and fiscal policy priorities.
● Restrict the use of contingency warrants used to authorize unbudgeted spending, and include in the budget a
contingency reserve for unforeseen or emergency spending.
● Create a framework for the oversight and monitoring of SOEs’ fiscal risk. SOEs should comply with the mandate
to submit audited annual financial statements and prepare an annual risk statement. As a second step, the
government should also seek to improve SOEs operational efficiency, and determine whether SOEs should remain
outside of government or be divested.
● Improve the capital budgeting process. The Government should undertake a PEFA as soon as feasible to identify
key areas of reform.
● Strengthen issuance and management of debt by modernizing debt legislation.
● Finalize the adoption of a treasury single account (TSA) and reconcile, close, or write-off outstanding advances and
below-the-line accounts.
● Undertake a strategic review of the public service that covers government functions, public hiring and specifies civil
service size, composition and remuneration structure.
● Adopt program and performance budgeting across government by linking budget allocations to economic and
social priorities, and enacting results-based budgeting.

DOMINICA
INTERNATIONAL MONETARY FUND 17
and are therefore important for international trade and investment transactions. In addition, the loss
of CBRs could affect ECP revenue prospects. Although this risk has not materialized in Dominica, it
has affected some of the ECCU members, especially in countries with significant participation of
major US banks. In order to reduce this risk, the government should (i) monitor for possible
termination or increase in cost of correspondent banking transactions; (ii) continue strengthening
AML/CFT legislation and remove possible constraints for an effective implementation; and (iii)
encourage banks to explore opportunities for mergers, since an important reason for the loss of
CBRs has been the relatively small volume of business for the international banks.
21. In light of the high NPLs, the lending
criteria of the NBD should be strengthened.
In recent years, the NBD has exhibited an
erosion of its capital base and a significant
increase in NPLs (text chart). The
implementation of the recommendations from
the Asset Quality Reviews (AQRs) by the ECCB is
a priority in order to limit financial stability risks.
Also, a recapitalization of the NBD should be
considered, as needed to set it on a solid
footing. In order to minimize the fiscal impact,
the government could explore options for
private shareholding participation.
22. The Agricultural and Industrial Development (AID) Bank should narrow its focus to
lending activities affected by missing or incomplete credit markets, in consonance with national
development strategies. This development bank provides financing to credit constrained sectors,
including small farmers and small and medium enterprises. As such, this agency is not subject to the
relatively stricter regulatory framework of the ECCB, and its loans are guaranteed by the government
(8.7 percent of GDP). However, despite its development role on paper, it engages in commercial
lending activities in search for profits, including mortgages and personal loans, which can distort the
allocation of credit in the broader economy. In addition, it can be a source of implicit subsidization
that is not transparently accounted in the budget. Although the AID Bank is legally required to
remain financially sustainable, its asset portfolio quality is poor (NPLs are equivalent to 17 percent of
total loans), which can result in fiscal costs. The strategic plan for NPL reduction should also be
applied to the AID Bank. Also, consideration should be given to the consolidation with the NBD of
the productive and commercial lending portfolio that cannot be justified on the basis of market
failures or credit constraints; or alternatively seek the divestment of this share of the lending
portfolio. The scope of AID Bank lending programs should be narrowed to ensure it targets specific
development objectives in line with national strategies.
23. Strengthening the regulation and supervision of credit unions is imperative. The credit
union sector is growing in size and it is taking an increasing share of total financial intermediation
(over 50 percent of total lending in the financial system), supporting growth by offsetting weak
6
8
10
12
14
16
18
20
2010Q
3
2010Q
4
2011Q
1
2011Q
2
2011Q
3
2011Q
4
2012Q
1
2012Q
2
2012Q
3
2012Q
4
2013Q
1
2013Q
2
2013Q
3
2013Q
4
2014Q
1
2014Q
2
2014Q
3
2014Q
4
2015Q
1
2015Q
2
2015Q
3
2015Q
4
Capital and Loans of National Bank of Dominica
(in percent)
NPLs/ Total loans, Locally Incorporated, NBD
Total Qualifying Capital/ Total Asset
Total Qualifying Capital/ Risk-weighted Assets (RHS)
Sources: ECCB and IMF staff calculation
Recommended
regulatory capital
to RWA=8%

DOMINICA
18 INTERNATIONAL MONETARY FUND
lending in the banking sector. However, the expansion of credit unions also increases the overall risk
to financial stability given the weaker regulation and supervision of this sector. The regulatory
legislation should be strengthened to allow for automatic, nondiscretionary, and effective regulatory
responses to financial distress in non-bank institutions. The powers of the FSU should be increased
to enforce timely and automatic issuance of penalties for non-compliance with the regulations.
Given the significant size of this sector and its interconnections with banks (credit unions account for
about one-third of the stock of banks’ deposits) the FSU should consider developing a framework to
monitor and manage macro-financial spillovers from this sector to banks and to the rest of the
economy, including explicitly the possibilities of liquidity and solvency problems, in coordination
with the ECCB.
24. Strengthening the regulatory framework of the off-shore banking sector is also
important. To this end, the government should expedite the approval of the revisions to the
Offshore Banking Act recommended by Caribbean Technical Assistance Center (CARTAC), which
includes a rise of capital requirements; a reform application process; and the enactment of
regulations. This would also contribute to moderating the risk of loss of CBRs.
C. Growth and Competitiveness
25. The government’s 2014-18 Growth and Social Protection Strategy identifies key areas to
increase growth, and reaffirms the role of the private sector as the main driver. The key areas
of focus include (i) diversification from traditional agriculture into non-traditional crops, promotion
of exports, and increase in value added; (ii) investment in public infrastructure; (iii) increase of labor
productivity with workfare programs that address skill mismatches through on-the-job training; and
(iv) a reduction of energy costs so as to achieve a reduction of electricity tariffs.
26. Staff supports the government’s strategy, and suggests additional areas of focus to
deepen the extent of reform and further incentivize private investment:
Enhance the business climate. Dominica has
room for improvement in most areas relevant
for business development. Dominica’s gap vis-
à-vis other countries is larger in resolving
insolvency; registering property; and obtaining
credit. Other areas with potential gains include
dealing with construction permits; and paying
taxes. Most of these gaps can be addressed
with regulatory and procedural requirements.
A thorough review of these constraints would
enable the development of a plan to (i)
improve time and cost needed to resolve
insolvency; (ii) expedite contract dispute
0
20
40
60
80
100
Starting a
BusinessDealing with
Construction
Permits
Getting
Electricity 1/
Registering
Property
Getting Credit
Protecting
Minority
Investors
Paying Taxes
Trading Across
Borders
Enforcing
Contracts
Resolving
Insolvency
Ease of doing business in Dominica
(DTF Score 1/, 2016)
Dominica
LAC Avg
OECD AvgSource: World Bank Doing Business Report
1/ Distance to frontier (DTF) score measures the deviation of a country from the best
perfomer, 0 representing the worst performer and 100 the fontier.

DOMINICA
INTERNATIONAL MONETARY FUND 19
resolution processes; and (iii) reduce the number of procedures, time, and cost of registering
property.
Devise a strategy for diversification into a
broad set of areas with competitive
advantage in addition to agriculture.
Despite the existence of a strategy and
some policies to further develop the sector,
tourism is one area with potential for
expansion. The majority of tourists visiting
Dominica are from the English-speaking
Caribbean, implying that there is room to
attract tourists from other regions to levels
closer to the Caribbean average. Also,
backward linkages are still limited, and they
could target other countries in the region for export.
Improve access and lower the cost of finance for businesses. More than 60 percent of firms rank
access to finance as a major constraint, around twice the OECS average (text chart). Also, access
to bank financing is limited to few relatively
large firms and to employers in the formal
sector with relatively high income and
sufficient collateral. This is in part explained
by the binding saving deposit rate floor at
2 percent which increases funding costs;
and also the high NPL ratio. Other
structural reasons include the difficulty to
enforce contracts; the impending loss of
value in the real-estate assets used as
collateral; lack of information about
borrowers’ quality; insufficient bankable
projects; and low capacity of firms to
comply with loan application requirements. These conditions result in high lending rates but
near-zero return on assets for the banks, weighing on banks’ capital growth and reducing
prospects for a lending-investment virtuous circle. The authorities broadly agree with this
diagnostic, which is their basis to rationalize the lending activities of the NBD and the AID bank.
In contrast, staff favors policies conducive to addressing the constraints that affect access to
finance, including the creation of a credit registry to facilitate access to credit of small firms; a
review of the legislation affecting loan contracts’ enforcement; and a review of the
administrative procedures for loan application and approval, including at the NBD.
Increase the resilience of public infrastructure to natural disasters. This would contribute to boost
investment by protecting private capital and the ability to produce, transport and export after a
0
20
40
60
80
100
Anguilla Antigua
and
Barbuda
Dominica Grenada Montserrat St. Kitts and
Nevis
St. Lucia St. Vincent
and the
Grenadines
Tourism Arrival in ECCU
(in percent)
USA Canada UK Caribbean Other Countries
Sources: CTO and IMF Staff Calculation

DOMINICA
20 INTERNATIONAL MONETARY FUND
natural disaster. Construction codes should be bolstered, and zoning procedures revised to
enhance the resilience of public and private infrastructure as soon as feasible, in line with World
Bank recommendations. Timeliness is of essence to affect the reconstruction activities, in line
with the recommendations in the World Bank damage assessment to “build back better”.
Reduce energy costs. Dominica has very high electricity costs, about twice the regional average,
and two-thirds of firms have identified the
high cost of electricity as a major
constraint to do business. The
government has been working on a
geothermal project, which would
contribute to reducing the electricity price
and the reliability of the service, while also
lowering the dependency on fossil fuels.
In addition, other forms of electricity
generation should be explored, such as
hydro, wind and solar, which can be less
demanding in terms of distribution
infrastructure and could also be eligible
for grant financing from donor conservation funds. Other measures for consideration are the
introduction of voluntary energy efficiency standards for lighting, and upgrading the building
codes for energy efficiency.
Increase labor productivity and improve the functioning of labor markets. Dominica ranks high in
terms of primary and secondary school enrollment rates (100 and 97 percent in primary and
secondary schools in 2014, respectively). However, more than ½ of Dominicans are currently
living abroad, largely seeking better
employment opportunities, leading to a
significant flow of remittances. Given the
macroeconomic relevance of these flows,
the authorities should consider measures
to facilitate transactions, including by
lowering their costs. Efforts could focus on
developing plans to improve educational
attainment, as needed to mitigate skill
mismatches identified as a constraint by
the productive sector, and to boost labor
mobility across sectors to facilitate labor
reallocation and increase employment.
Labor market legislation should be
updated to remove rigidities, including to increase labor flexibility consistent with the needs of
prominent sectors such as agriculture and tourism, and also to review the severance payments
for redundancy to increase labor market flexibility. On wage setting, legislation could be
12
5
8
19
34 34 3435
38 38 3940 40
41
0
5
10
15
20
25
30
35
40
45
Un
ited
Sta
tes
Trin
idad
Su
rin
am
e
Belize
Jam
aic
a
St. K
itts
St. L
uci
a
Barb
ad
os
St
Vin
cen
t &
Gre
n.
Bah
am
as
Nevis
An
tig
ua &
Barb
ud
a
Do
min
ica
Gre
nad
a
Domestic Electricity Tariffs, 2012(In US ₵/kWh)
Source: CARILEC Tariff Survey and World Bank
LAC Average
0
10
20
30
40
50
60
70
80
90
Number of Dominicans livingabroad, in thousands
Remittances, in USD mn.
Canada
United Kingdom
France
Caribbean
United States
Other
Emigration and remittances
Source: World Bank.

DOMINICA
INTERNATIONAL MONETARY FUND 21
adopted to remove or cap the triennial back-pay compensation of public workers, for example
by way of fiscal responsibility legislation. A periodic updating of the labor force survey should
be a priority objective, which requires additional resources and training in the Central Statistics
Office.
Authorities’ views
27. The authorities were in broad agreement with the policy recommendations and
expressed gratitude for the Fund support at this difficult juncture. They confirmed their
commitment to the fiscal consolidation plan, consistent with their formal request for technical
assistance after the mission on the second-generation fiscal reforms, but also re-stated that
Dominica would not pursue a Fund program at this stage. The government expressed commitment
to creating a saving fund for natural disasters, but explained that the immediate priority is to pursue
reconstruction in the aftermath of tropical storm Erika. On the AID Bank and the NBD lending
activities, the government underscored their importance to relieve credit constraints imposed by the
banking sector and to support growth by providing low-cost financing to targeted sectors.
STAFF APPRAISAL
28. Tropical storm Erika hit the Dominican economy hard, resulting in an estimated output
decline of 3.9 percent in 2015. Since the storm, tourism activities have largely normalized
following the resumption of full operations at the main airport, and visitor arrivals showed some
recovery. Other sectors will likely need more time to recover. Agriculture output declined sharply as
the storm affected crops and access to arable land, and significant areas are now in need of re-
planting and soil treatment. Manufacturing has taken a significant toll as the storm prompted the
closure of operations of the main industrial plant. In addition, the protracted decline of banks’ credit
to the private sector remains a drag on economic activity, underpinned by high NPLs. Inflation has
remained subdued, within a slightly negative range on a year-on-year basis, mainly as a result of
falling fuel prices. Notwithstanding weak exports of agriculture and tourism, the 2015 current
account deficit remained contained at an estimate of 9.4 percent of GDP on the back of lower oil
imports.
29. Output growth is expected to remain subdued in 2016 at 1.3 percent as the economy
slowly recovers from the storm and investment in reconstruction picks up. This growth,
however, is largely conditional on donor grants proceeding according to expectations. Afterwards,
growth is projected to accelerate somewhat as the economy continues to recover towards potential,
and to stabilize at 1.7 percent per year over the medium-term. The current account is projected to
deteriorate on the back of the increase in reconstruction investment, and then to gradually improve
as exports of agriculture, tourism and manufacturing activities recover. The imbalances are expected
to be financed primarily with external capital grants and official concessional loans.
30. The fiscal outturn for FY 2015/16 is strong, estimated at a surplus of 0.9 percent of GDP.
It is benefitting from the increase of excise taxes and user fees, and the reinstatement of specific
import duties. However, this is in part explained by transitory factors, especially the collection of tax

DOMINICA
22 INTERNATIONAL MONETARY FUND
arrears, and also by, higher ECP revenues, which are subject to uncertainty. The low execution of
public investment given delays in reconstruction activities also helped the fiscal outturn.
31. Maintaining the reform momentum is critical to ensure the financing of the
reconstruction activities within fiscally sustainable bounds. The government should continue
with its plan to adopt the reforms needed to support the recovery process and to ensure fiscal
sustainability. The measures already passed are appropriate and consistent with the commitments in
the RCF, and the improvements in tax administration are providing additional resources that are also
expected to yield some improvement in the tax base going forward. This initial effort is
commendable, but maintaining the reform momentum is critical. The government should start to
work on the specification of the second-generation fiscal measures discussed in the RCF, which
require more time to develop, in amounts consistent with public debt sustainability. The measures
under consideration include the rationalization of tax expenditures, a property tax reform, the
introduction of cost-recovery charges in the provision of health services, and measures to increase
the efficiency of public education services. Given the uncertainty affecting ECP revenues and the risk
of political resistance to the remaining reforms, any unanticipated revenue windfalls such as from
ECP or the collection of tax arrears should be allocated to public debt reduction as a first priority,
and avoid their allocation to recurrent spending.
32. Complementing the fiscal measures with structural fiscal reforms is important to make
fiscal consolidation gains durable. Such measures should focus on strengthening and supporting
the budget process and its execution, including systems to improve public financial management,
and improving the transparency of the ECP. The development of medium-term macro-framework
and fiscal projections would strengthen the control over longer-term objectives, including meeting
the ECCU debt target. Finally, given the recurrence of natural disasters, the authorities should
expedite their plans to build in sufficient fiscal space to be able to respond in case of such future
events, and consider the creation of a saving fund, using some of the ECP revenues.
33. With regard to financial activities, the government has made substantial progress to
revamp regulations, but significant risks continue to affect the sector. The recent passing of the
new Banking Act and Eastern Caribbean Asset Management Company Act are important steps to
mitigate these. Credit unions are in the process of consolidation, in agreement with the adoption of
the regional initiatives to strengthen the regulatory and supervisory framework. Moreover, there has
been significant progress in the AML/CFT legislation. However, the high level of NPLs and low
capitalization across the financial industry pose risk to financial stability. Also, there is a risk of losing
CBRs, as is currently occurring in other countries in the region. This risk requires decisive action,
aimed at improving the information position of financial institutions, monitoring for possible
termination or increase in cost of CBRs, continuing to strengthen AML/CFT legislation, and exploring
merger possibilities. A review of the lending policies of the NBD and the AID Bank aimed at
facilitating more targeted programs would minimize distortions in the allocation of credit and better
support developmental needs.
34. Improving growth prospects will depend on structural reforms to facilitate the
contribution of the private sector. The government’s Growth and Social Protection Strategy

DOMINICA
INTERNATIONAL MONETARY FUND 23
identifies key areas to increase growth, and reaffirms the role of the private sector as the main
driver. The key areas of focus include the diversification of agriculture; investment in public
infrastructure; increase of labor productivity; and the reduction in electricity tariffs. To further
support private sector investment, the government should adopt measures to enhance the business
climate; devise a strategy for diversification into a broader set of areas in addition to agriculture;
remove impediments to backward linkages in agriculture and manufacturing; improve access to
finance; increase the resilience of public infrastructure to natural disasters; improve and enforce
construction and zoning codes; explore alternative sources to reduce the cost of electricity, including
through developing the geothermal potential; and seek advice to improve education achievement
and modernize labor regulations.
35. A safeguards assessment of the ECCB was completed in April 2016. The update assessment
found that the ECCB continues to maintain a governance framework that provides for independent
oversight. Transparency in financial reporting has been maintained and the external audit
mechanism is sound. However, the involvement of internal audit in operational activities is a
safeguards concern, as noted in the previous assessment, and the function only partially conforms
to international standards.
36. Data provision has shortcomings due to capacity constraints in the statistical agency,
including weaknesses in coverage, accuracy, frequency, and timeliness of data. Although it is
broadly adequate for surveillance, these limitations constrain economic analysis and policy
formulation. Particularly, staff’s analysis would benefit from more timely and improved data
pertaining to the fiscal accounts, labor, agriculture, and the balance of payments. Efforts to prepare
national accounts at a quarterly frequency would also be welcome.
37. Staff recommends that the next Article IV Consultation for Dominica take place on the
standard 12-month cycle.
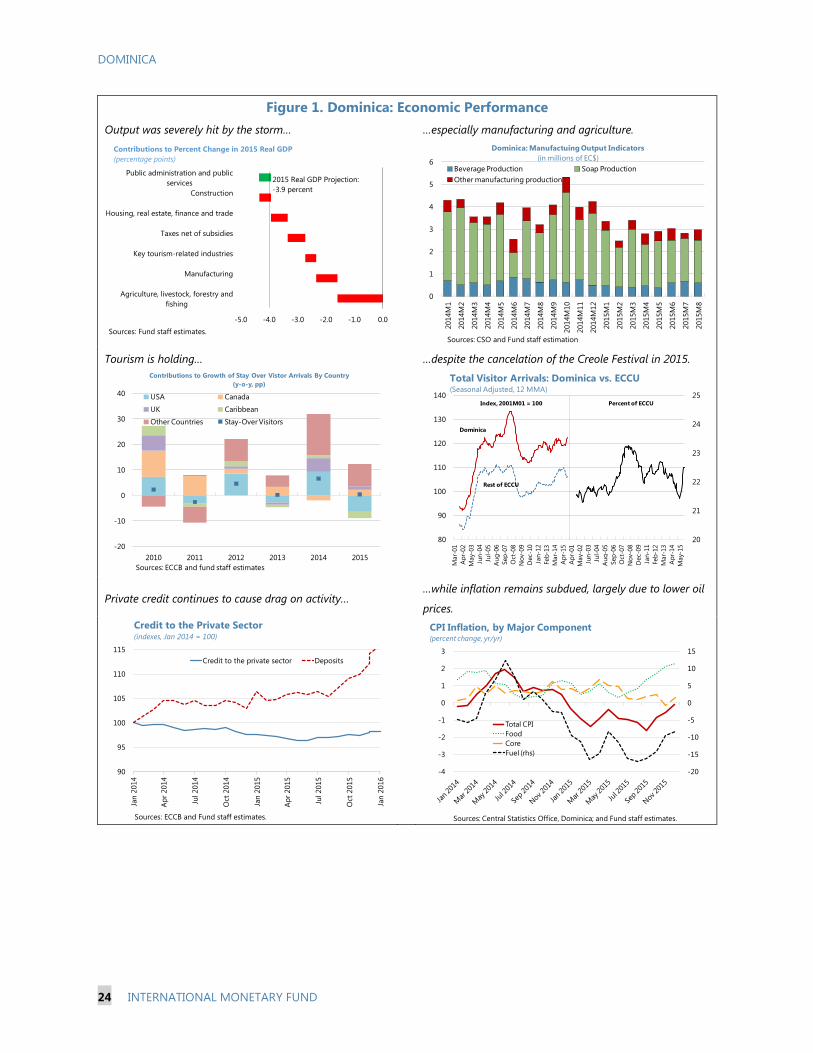
DOMINICA
24 INTERNATIONAL MONETARY FUND
Figure 1. Dominica: Economic Performance
Output was severely hit by the storm… …especially manufacturing and agriculture.
Tourism is holding… …despite the cancelation of the Creole Festival in 2015.
Private credit continues to cause drag on activity… …while inflation remains subdued, largely due to lower oil
prices.
-5.0 -4.0 -3.0 -2.0 -1.0 0.0
Agriculture, livestock, forestry and
fishing
Manufacturing
Key tourism-related industries
Taxes net of subsidies
Housing, real estate, finance and trade
Construction
Public administration and public
services
Contributions to Percent Change in 2015 Real GDP
(percentage points)
Sources: Fund staff estimates.
2015 Real GDP Projection:
-3.9 percent
0
1
2
3
4
5
6
2014M
1
2014M
2
2014M
3
2014M
4
2014M
5
2014M
6
2014M
7
2014M
8
2014M
9
2014M
10
2014M
11
2014M
12
2015M
1
2015M
2
2015M
3
2015M
4
2015M
5
2015M
6
2015M
7
2015M
8
Dominica: Manufactuing Output Indicators
(in millions of EC$)
Beverage Production Soap Production
Other manufacturing production
Sources: CSO and Fund staff estimation
-20
-10
0
10
20
30
40
2010 2011 2012 2013 2014 2015
Contributions to Growth of Stay Over Vistor Arrivals By Country
(y-o-y, pp)
USA Canada
UK Caribbean
Other Countries Stay-Over Visitors
Sources: ECCB and fund staff estimates
20
21
22
23
24
25
80
90
100
110
120
130
140
Mar-
01
Ap
r-02
May-0
3
Jun
-04
Jul-
05
Au
g-0
6
Sep
-07
Oct-
08
No
v-0
9
Dec-1
0
Jan
-12
Feb
-13
Mar-
14
Ap
r-15
Ap
r-01
May-0
2
Jun
-03
Jul-
04
Au
g-0
5
Sep
-06
Oct-
07
No
v-0
8
Dec-0
9
Jan
-11
Feb
-12
Mar-
13
Ap
r-14
May-1
5
Total Visitor Arrivals: Dominica vs. ECCU(Seasonal Adjusted, 12 MMA)
Index, 2001M01 = 100 Percent of ECCU
Dominica
Rest of ECCU
90
95
100
105
110
115
Jan
2014
Ap
r 2014
Jul 2014
Oct
2014
Jan
2015
Ap
r 2015
Jul 2015
Oct
2015
Jan
2016
Credit to the private sector Deposits
Credit to the Private Sector(indexes, Jan 2014 = 100)
Sources: ECCB and Fund staff estimates.
-20
-15
-10
-5
0
5
10
15
-4
-3
-2
-1
0
1
2
3
Total CPI
Food
Core
Fuel (rhs)
Sources: Central Statistics Office, Dominica; and Fund staff estimates.
CPI Inflation, by Major Component(percent change, yr/yr)

DOMINICA
INTERNATIONAL MONETARY FUND 25
Figure 2. Dominica: External Sector Developments
Competitiveness worsened on the back of US$
appreciation…
…and the external deficit increased due to the storm.
Exports declined significantly as a result of the storm… …while imports declined, in part due to lower fuel prices.
The storm triggered support in the form of remittances
and external grants.
Private external debt increased underpinned by
reconstruction financing and new private investments.
80
90
100
110
120
2005 2007 2009 2011 2013 2015
Dominica NEER
Dominica REER
United States REER
Nominal and Real Effective Exchange Rates
(Indexes, 2005 = 100)
0
5
10
15
20
25
30
2000 2003 2006 2009 2012 2015
Private Sector
Public Sector
Total Balance
Current Account Deficit by Sector (percent of GDP)
0
1
2
3
4
5
6
7
8
9
2011 2012 2013 2014 2015 1/
Bananas Beverage
Other food and animals Soap
Paints and Varnishes Other manufacturing
Other Re-exports
Goods Exports
Goods Exports (in percent of GDP)
0
5
10
15
20
25
30
35
40
45
2011 2012 2013 2014 2015 1/
Other
Private reconstruction related
Public expenditure-related
FDI-related
Food
Fuel
Goods Imports (in percent of GDP)Goods Imports (in percent of GDP)
0
10
20
30
40
2000 2003 2006 2009 2012 2015
Remittances
FDI
Grants
Trade deficit of goods and services
Trade Deficit and Financing (percent of GDP)
0
20
40
60
80
100
120
140
2000 2003 2006 2009 2012 2015
Public sector
Private sector 2/
Imputed Reserves (US$ m)
External Debt (percent of GDP)

DOMINICA
26 INTERNATIONAL MONETARY FUND
Figure 3. Dominica: Fiscal Developments
A process of fiscal consolidation is underway. The increase in expenditures for reconstruction has been
slow to start, as grants remained below expectations.
ECP revenues have increased significantly, providing relief
to the financing needs.
Reconstruction financing will largely depend on external
debt flows…
…putting pressure on debt sustainability in the near term… …including in the broader public sector.
85.5
79.0
3.3
2.0
1990 1995 2000 2005 2010 2015 2020
0
25
50
75
100
125
-9
-6
-3
0
3
6
Public Debt and Fiscal Primary Balance(In percent of GDP)
Source: Fund staff estimates.
Public debt
(right)
Actual primary
balance (left)
Debt-stabilizing
primary balance
(left)
0
5
10
15
20
25
30
35
40
45
2005 2006 2007 2008 2009 2010 2011 2012 2013 2014 2015
Wages
Other current
Capital expenditure
Government Expenditures(percent of GDP, fiscal years)
Sources: Dominican authorities; and Fund staff estimates.
0
1
2
3
4
5
0
5
10
15
20
25
30
2003 2004 2005 2006 2007 2008 2009 2010 2011 2012 2013 2014 2015
Economic Citizenship Program (RHS)
Tax Revenue
Revenues(In percent of GDP)
CDB
25%
Other IFI
13%
Bilateral
25%
Banks and
others
8%
T-Bills
5%
T-Bonds
9%
Others
15%
Composition of Public Sector Debt, 2014
(in percent of total)
Domestic External
-15
-10
-5
0
5
10
15
0 50 100 150
Overa
ll b
ala
nce
Debt
Emerging Economies: General Government Balance and Debt, 2015
(Percent of GDP)
St. Kitts and Nevis
Grenada
Antigua and Barbuda
St. Lucia
St. Vincent and
the Grenadines
Dominica
0.0
5.0
10.0
15.0
20.0
25.0
30.0
35.0
1995 1997 1999 2001 2003 2005 2007 2009 2011 2013 2015
Debt of Public Corporations 1/
(Percent of GDP, fiscal year)
1/ Includes own debt and debt guaranteed by central government.

DOMINICA
INTERNATIONAL MONETARY FUND 27
Figure 4. Dominica: Monetary Developments
Banks’ deposits are picking up... …but banks’ liquidity risk is growing.
Banks are allocating more assets abroad… ...and increasing their liquid assets holdings while reducing
credit to the private sector…
…in part in response to the ECCB deposit rate floor … …which incentivizes higher risk taking and might play
against the objective of reducing NPLs.
-4
-2
0
2
4
6
8
10
12
2010 2011 2012 2013 2014 2015 2016
Private resident deposits
Non-resident deposits
Other deposits 1/
Total deposits
Contributions to Real Deposits Growth (pp. y-o-y)
-4
-2
0
2
4
6
8
10
12
2010 2011 2012 2013 2014 2015 2016
DemandSavingsTimeTotal Private
Contributions to Private Deposits Growth (pp, y-o-y)
0
100
200
300
400
500
600
2006 2008 2010 2012 2014
Net Foreign Assets
Non-resident deposits
Claims on foreign banks
NFA of Commercial Banks (EC$ million)
-6-4-202468
101214161820
2010 2011 2012 2013 2014 2015
Non-Banks
Businesses
Households
Private sector
Cash reserves/total deposits (percent)
Contributions to Real Private Credit Growth (pp, y-o-y)
0
3
6
9
12
2010M
1
2010M
4
2010M
7
2010M
10
2011M
1
2011M
4
2011M
7
2011M
10
2012M
1
2012M
4
2012M
7
2012M
10
2013M
1
2013M
4
2013M
7
2013M
10
2014M
1
2014M
4
2014M
7
2014M
10
2015M
1
2015M
4
2015M
7
2015M
10
2016M
1
Deposit Rate
Interbank market rate
ECCB's discount rate
Weighted Average Lending Rate
Nominal Interest Rates
(in percent)
-1.5
-1.0
-0.5
0.0
0.5
1.0
1.5
2.0
0
5
10
15
20
25
30
2008 2009 2010 2011 2012 2013 2014 2015
Provisioning ratioNPL ratio net of provisioningCapital adequacy ratio 2/Return on assets (RHS)
Financial Soundness Indicators (percent)

DOMINICA
28 INTERNATIONAL MONETARY FUND
Table 2. Dominica: Selected Economic and Social Indicators, Active Scenario
Area (sq. km.) 754 Adult literacy rate (percent, 2004) 88
Population (2011) Unemployment rate (2011) 11
Total 71,293
Annual rate of growth (percent) -0.1
Density (per sq. km.) 94.6 Gross Domestic Product (2014)
Population characteristics Millions of E.C. dollars 1,349
Life expectancy at birth (years, 2006) 74.1 Millions of U.S. dollars 500
Infant mortality (per thousand live births, 2006) 13 U.S. dollars per capita 7,007
2012 2013 2014 2015 2016 2017 2018 2019 2020 2021
Output and prices
Real GDP 1/ -1.3 0.6 3.9 -3.9 1.3 2.8 2.7 2.5 2.3 1.7
Nominal GDP 1/ -3.3 4.4 3.5 -4.7 1.1 4.4 4.5 4.6 4.5 3.9
Consumer prices
Period average 1.4 0.0 0.8 -0.8 -0.2 1.6 1.8 2.1 2.2 2.2
End of period 1.3 -0.4 0.5 -0.1 -0.1 1.8 1.8 2.2 2.2 2.5
Potential GDP 1.2 1.1 1.1 1.1 1.2 1.3 1.5 1.6 1.7 1.7
Output gap (percent of potential GDP) -0.7 -1.2 1.6 -3.4 -3.4 -2.0 -0.9 -0.4 -0.1 0.0
Real effective exchange rate 0.2 -0.6 -0.7 … … … … … … …
(period average, depreciation -)
Central government balances 2/
Revenue 30.3 30.0 28.1 36.1 35.8 34.6 33.8 33.2 32.6 32.5
Taxes 22.2 21.9 22.9 24.9 24.5 23.9 23.7 24.0 24.1 24.1
Non-tax revenue 5.5 4.9 3.2 6.9 5.2 5.0 4.9 4.8 4.6 4.5
Grants 3/ 2.7 3.2 2.1 4.2 6.1 5.7 5.2 4.5 3.9 3.9
Expenditure 35.7 33.0 32.5 35.1 38.2 35.7 33.6 32.7 31.4 31.3
Current primary expenditure 23.3 22.0 24.0 24.6 24.4 23.6 22.8 22.6 21.5 21.4
Interest payments 2.0 2.0 1.5 2.4 2.3 2.4 2.4 2.4 2.3 2.4
Capital expenditure 10.5 9.0 7.1 8.2 11.4 9.7 8.5 7.7 7.5 7.5
Primary balance -3.4 -1.0 -2.9 3.3 -0.1 1.3 2.6 2.9 3.5 3.5
Overall balance (Incl. ND cost buffers) -5.4 -3.0 -4.4 0.9 -3.9 -2.6 -1.3 -1.0 -0.3 -0.3
Memo: cumulative fiscal adjustment measures 0.0 0.0 0.0 0.7 1.4 2.3 3.5 4.9 6.7 6.7
Central government debt (incl. guaranteed) 4/ 72.6 74.7 83.9 85.5 87.7 87.3 85.4 83.4 81.0 79.0
External 52.6 52.6 53.4 56.6 56.4 55.8 53.2 51.8 50.3 49.1
Domestic 20.0 22.1 30.5 28.9 31.2 31.5 32.2 31.6 30.7 29.9
Money and credit (annual percent change)
Broad money (M2) 9.7 2.2 7.8 4.0 1.1 4.7 4.5 4.6 4.7 4.0
Real credit to the private sector 3.0 -0.3 -2.7 0.4 -3.5 -2.6 -1.9 -1.2 -0.4 -0.5
Balance of payments
Current account balance, o/w: -17.4 -9.8 -11.2 -9.4 -12.6 -13.7 -14.1 -11.4 -9.6 -9.3
Exports of goods and services 5/ 32.6 38.2 41.4 41.9 41.0 40.1 39.8 39.7 39.5 39.5
Imports of goods and services 6/ 51.5 48.1 53.8 52.4 53.6 53.7 53.8 50.8 48.9 48.5
Capital and financial account balance 20.0 9.7 15.0 10.0 11.8 14.0 14.5 11.7 10.0 9.6
FDI 12.1 4.6 6.4 6.8 7.1 6.9 6.6 6.3 6.0 6.0
Capital grants 4.5 3.6 3.2 3.7 5.8 6.7 6.2 5.6 5.0 4.7
Other (incl. errors and omissions) 3.4 1.5 5.4 -0.5 -1.2 0.5 1.6 -0.2 -1.0 -1.1
External debt (gross) 7/ 75.1 74.4 81.6 93.5 91.6 89.8 88.1 85.1 80.9 78.0
Saving-Investment Balance -17.4 -9.8 -11.2 -9.4 -12.6 -13.7 -14.1 -11.4 -9.6 -9.3
Saving -2.1 3.9 3.7 3.1 4.5 3.1 0.7 2.0 2.7 2.9
Investment 15.2 13.7 14.9 12.5 17.1 16.8 14.8 13.3 12.3 12.2
Public 12.6 11.0 9.1 9.0 11.1 11.8 10.3 9.3 8.8 8.7
Private 2.6 2.7 5.8 3.5 6.0 5.0 4.5 4.0 3.5 3.5
Memorandum items:
Nominal GDP (EC$ millions) 1,310 1,368 1,415 1,349 1,364 1,424 1,489 1,557 1,626 1,690
Nominal GDP, fiscal year (EC$ millions) 1,339 1,392 1,382 1,356 1,394 1,456 1,523 1,592 1,658 1,721
Net imputed international reserves:
End-year (millions of U.S. dollars) 91.8 85.4 99.9 125.4 116.6 118.5 120.4 122.4 124.6 126.5
Months of imports of goods and services 4.4 4.2 4.3 5.7 5.2 5.0 4.9 5.0 5.1 5.0
Sources: Dominican authorities; Eastern Caribbean Central Bank (ECCB); and Fund staff estimates and projections.
1/ At market prices. Historical data reflect national accounts data revision published by the ECCB on July 2, 2015.
2/ Data for fiscal years running from July to June of the next year.
3/ Does not include grants received but not spent.
4/ Includes estimated commitments under the Petrocaribe arrangement with Venezuela.
5/ Includes revised historical data from 2014 onwards on exports of tourism services.
6/ Includes public capital expenditure induced imports from 2019 onwards, to account for possible mitigation of natural disasters.
7/ Comprises public sector external debt, foreign liabilities of commercial banks, and other private debt.
(in percent of GDP, unless otherwise specified)
I. Social and Demographic Indicators
Projected
(annual percent change, unless otherwise specified)
II. Economic Indicators

DOMINICA
INTERNATIONAL MONETARY FUND 29
Table 3. Dominica: Balance of Payments, Active Scenario
2012 2013 2014 2015 2016 2017 2018 2019 2020 2021
Current account balance -84.2 -49.4 -58.6 -46.9 -63.7 -72.0 -77.9 -65.5 -58.1 -58.2
Exports of goods and services 1/ 158.4 193.5 217.1 209.4 207.0 211.7 219.6 228.7 237.9 247.2
Goods 36.7 38.4 38.5 32.3 21.8 23.3 24.4 25.6 26.8 27.9
Tourism 76.1 102.6 127.2 125.2 127.0 131.7 136.8 142.0 147.2 153.0
Other services 45.5 52.5 51.4 52.8 58.2 56.7 58.4 61.1 63.9 66.4
Imports of goods and services 249.9 243.7 281.8 261.8 270.9 283.5 296.8 293.1 294.7 303.5
Fuel 41.3 40.4 42.1 29.4 24.1 28.4 31.7 33.2 34.7 36.0
Food 35.3 34.2 41.5 38.9 34.9 33.4 34.5 36.1 37.7 39.2
Other goods 2/ 106.7 104.1 127.3 126.8 143.8 150.4 155.9 147.8 144.3 147.6
Services 66.6 65.0 70.9 66.7 68.2 71.3 74.6 75.9 78.0 80.7
Net income, o/w: -9.5 -19.5 -19.3 -23.0 -24.0 -25.3 -26.9 -28.4 -29.9 -31.6
Interest payments (public sector) -5.1 -6.9 -5.9 -5.1 -5.8 -5.9 -6.1 -6.2 -6.3 -6.6
Net current transfers 16.8 20.3 25.3 28.5 24.2 25.1 26.2 27.4 28.6 29.7
Capital and financial account 96.8 48.9 78.6 50.2 59.5 73.9 79.8 67.5 60.1 60.2
Grants 3/ 21.8 18.2 16.9 18.5 29.5 35.3 34.3 32.4 29.8 29.2
Public sector flows 37.5 22.1 20.0 3.1 -0.5 8.9 5.2 3.2 5.4 4.7
PetroCaribe financing flows 6.1 5.6 4.2 2.2 0.0 0.7 0.9 0.9 0.9 0.9
Foreign direct investment 58.5 23.3 33.4 34.0 35.9 36.2 36.5 36.4 36.3 37.7
Commercial banks -15.3 -0.1 -16.6 -27.7 1.3 -3.8 -4.0 -4.1 -4.2 -4.3
Other private flows 4/ -11.7 -4.2 20.7 20.0 -6.8 -3.3 7.0 -1.3 -8.0 -7.9
Errors and omissions -5.8 -6.0 -2.2 9.5 0.0 0.0 0.0 0.0 0.0 0.0
Overall balance 6.8 -6.5 17.9 21.3 -4.2 1.9 1.9 2.0 2.0 2.0
Overall financing -6.8 6.5 -17.9 -21.3 4.2 -1.9 -1.9 -2.0 -2.0 -2.0
Change in ECCB NFA, o/w: -17.4 6.5 -14.6 -25.5 4.2 -1.9 -1.9 -2.0 -2.0 -2.0
IMF reserve liabilities -0.8 -2.7 -1.6 6.5 -1.6 -1.2 -1.5 -1.5 -0.6 -2.3
Change in foreign reserve asssets 10.6 0.0 -3.3 4.2 0.0 0.0 0.0 0.0 0.0 0.0
External financing from RCF … … … 8.7 … … … … … …
Current account balance -17.4 -9.8 -11.2 -9.4 -12.6 -13.7 -14.1 -11.4 -9.6 -9.3
Exports of goods and services 1/ 32.6 38.2 41.4 41.9 41.0 40.1 39.8 39.7 39.5 39.5
Goods 7.6 7.6 7.3 6.5 4.3 4.4 4.4 4.4 4.5 4.5
Tourism 15.7 20.3 24.3 25.1 25.1 25.0 24.8 24.6 24.4 24.4
Other services 9.4 10.4 9.8 10.6 11.5 10.8 10.6 10.6 10.6 10.6
Imports of goods and services 51.5 48.1 53.8 52.4 53.6 53.7 53.8 50.8 48.9 48.5
Fuel 8.5 8.0 8.0 5.9 4.8 5.4 5.8 5.8 5.8 5.8
Food 7.3 6.7 7.9 7.8 6.9 6.3 6.3 6.3 6.3 6.3
Other goods 2/ 22.0 20.6 24.3 25.4 28.5 28.5 28.3 25.6 24.0 23.6
Services 13.7 12.8 13.5 13.4 13.5 13.5 13.5 13.2 12.9 12.9
Net income, o/w: -2.0 -3.9 -3.7 -4.6 -4.7 -4.8 -4.9 -4.9 -5.0 -5.0
Interest payments (public sector) -1.1 -1.4 -1.1 -1.0 -1.2 -1.1 -1.1 -1.1 -1.0 -1.1
Net current transfers 3.5 4.0 4.8 5.7 4.8 4.8 4.7 4.7 4.7 4.7
Capital and financial account 20.0 9.7 15.0 10.0 11.8 14.0 14.5 11.7 10.0 9.6
Grants 3/ 4.5 3.6 3.2 3.7 5.8 6.7 6.2 5.6 5.0 4.7
Public sector flows 7.7 4.4 3.8 0.6 -0.1 1.7 0.9 0.6 0.9 0.7
PetroCaribe financing flows 1.3 1.1 0.8 0.4 0.0 0.1 0.2 0.2 0.2 0.1
Foreign direct investment 12.1 4.6 6.4 6.8 7.1 6.9 6.6 6.3 6.0 6.0
Commercial banks -3.2 0.0 -3.2 -5.5 0.3 -0.7 -0.7 -0.7 -0.7 -0.7
Other private flows 4/ -2.4 -0.8 4.0 4.0 -1.3 -0.6 1.3 -0.2 -1.3 -1.3
Errors and omissions -1.2 -1.2 -0.4 1.9 0.0 0.0 0.0 0.0 0.0 0.0
Overall balance 1.4 -1.3 3.4 4.3 -0.8 0.4 0.3 0.3 0.3 0.3
External financing from RCF … … … 1.7 … … … … … …
Memorandum items:
Trade balance (percent of GDP) -30.2 -27.7 -32.9 -32.6 -35.8 -35.8 -35.9 -33.2 -31.5 -31.1
Services balance (percent of GDP) 11.4 17.8 20.6 22.3 23.2 22.2 21.9 22.0 22.1 22.1
Net imputed international reserves:
Millions of U.S. dollars 91.8 85.4 99.9 125.4 116.6 118.5 120.4 122.4 124.6 126.5
Months of imports of goods and services 4.4 4.2 4.3 5.7 5.2 5.0 4.9 5.0 5.1 5.0
Gross external debt 5/ 75.1 74.4 81.6 93.5 91.6 89.8 88.1 85.1 80.9 78.0
Public sector 52.6 52.6 53.4 56.6 56.4 55.8 53.2 51.8 50.3 49.1
Private sector 22.5 21.8 28.3 36.9 35.1 34.0 34.9 33.3 30.6 28.9
GDP (in US$ millions) 485.1 506.6 524.2 499.6 505.0 527.5 551.3 576.6 602.4 625.9
1/ Includes revised historical data from 2014 onwards on exports of tourism services.
5/ Comprises external public sector debt, gross liabilities of commercial banks, and other private debt that covers the projected financing
needs.
(millions of U.S. dollars)
Projected
Sources: Dominican authorities; Eastern Caribbean Central Bank (ECCB); donor organizations; and Fund staff estimates and projections.
4/ Assumed to cover the residual financing needs over the projection period.
2/ Includes public capital expenditure induced imports from 2019 onwards, to account for possible mitigation of natural disasters.
3/ Differs from grants reported on the Statement of Central Government Operations (tables 2a and 2b) based on timing, as this table
reports transactions on a calendar-year basis, and the inclusion of private sector capital grants in the totals reported on this table.
(in percent of GDP)
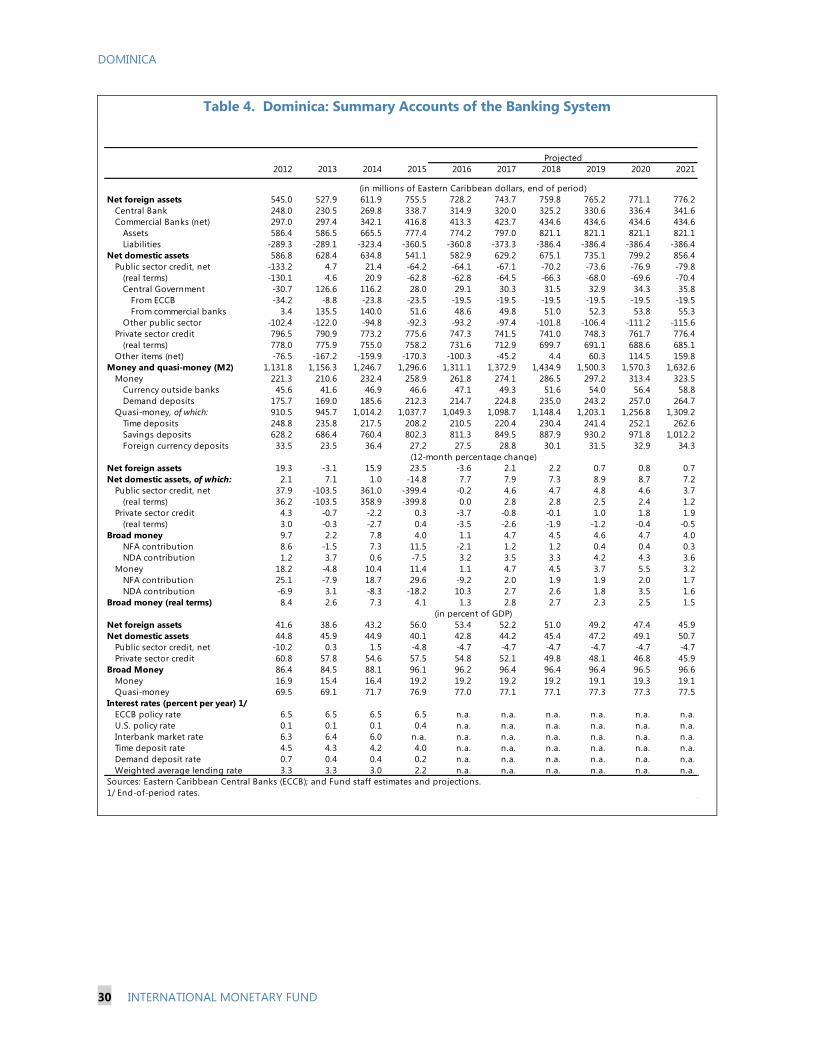
DOMINICA
30 INTERNATIONAL MONETARY FUND
Table 4. Dominica: Summary Accounts of the Banking System
2012 2013 2014 2015 2016 2017 2018 2019 2020 2021
Net foreign assets 545.0 527.9 611.9 755.5 728.2 743.7 759.8 765.2 771.1 776.2
Central Bank 248.0 230.5 269.8 338.7 314.9 320.0 325.2 330.6 336.4 341.6
Commercial Banks (net) 297.0 297.4 342.1 416.8 413.3 423.7 434.6 434.6 434.6 434.6
Assets 586.4 586.5 665.5 777.4 774.2 797.0 821.1 821.1 821.1 821.1
Liabilities -289.3 -289.1 -323.4 -360.5 -360.8 -373.3 -386.4 -386.4 -386.4 -386.4
Net domestic assets 586.8 628.4 634.8 541.1 582.9 629.2 675.1 735.1 799.2 856.4
Public sector credit, net -133.2 4.7 21.4 -64.2 -64.1 -67.1 -70.2 -73.6 -76.9 -79.8
(real terms) -130.1 4.6 20.9 -62.8 -62.8 -64.5 -66.3 -68.0 -69.6 -70.4
Central Government -30.7 126.6 116.2 28.0 29.1 30.3 31.5 32.9 34.3 35.8
From ECCB -34.2 -8.8 -23.8 -23.5 -19.5 -19.5 -19.5 -19.5 -19.5 -19.5
From commercial banks 3.4 135.5 140.0 51.6 48.6 49.8 51.0 52.3 53.8 55.3
Other public sector -102.4 -122.0 -94.8 -92.3 -93.2 -97.4 -101.8 -106.4 -111.2 -115.6
Private sector credit 796.5 790.9 773.2 775.6 747.3 741.5 741.0 748.3 761.7 776.4
(real terms) 778.0 775.9 755.0 758.2 731.6 712.9 699.7 691.1 688.6 685.1
Other items (net) -76.5 -167.2 -159.9 -170.3 -100.3 -45.2 4.4 60.3 114.5 159.8
Money and quasi-money (M2) 1,131.8 1,156.3 1,246.7 1,296.6 1,311.1 1,372.9 1,434.9 1,500.3 1,570.3 1,632.6
Money 221.3 210.6 232.4 258.9 261.8 274.1 286.5 297.2 313.4 323.5
Currency outside banks 45.6 41.6 46.9 46.6 47.1 49.3 51.6 54.0 56.4 58.8
Demand deposits 175.7 169.0 185.6 212.3 214.7 224.8 235.0 243.2 257.0 264.7
Quasi-money, of which: 910.5 945.7 1,014.2 1,037.7 1,049.3 1,098.7 1,148.4 1,203.1 1,256.8 1,309.2
Time deposits 248.8 235.8 217.5 208.2 210.5 220.4 230.4 241.4 252.1 262.6
Savings deposits 628.2 686.4 760.4 802.3 811.3 849.5 887.9 930.2 971.8 1,012.2
Foreign currency deposits 33.5 23.5 36.4 27.2 27.5 28.8 30.1 31.5 32.9 34.3
Net foreign assets 19.3 -3.1 15.9 23.5 -3.6 2.1 2.2 0.7 0.8 0.7
Net domestic assets, of which: 2.1 7.1 1.0 -14.8 7.7 7.9 7.3 8.9 8.7 7.2
Public sector credit, net 37.9 -103.5 361.0 -399.4 -0.2 4.6 4.7 4.8 4.6 3.7
(real terms) 36.2 -103.5 358.9 -399.8 0.0 2.8 2.8 2.5 2.4 1.2
Private sector credit 4.3 -0.7 -2.2 0.3 -3.7 -0.8 -0.1 1.0 1.8 1.9
(real terms) 3.0 -0.3 -2.7 0.4 -3.5 -2.6 -1.9 -1.2 -0.4 -0.5
Broad money 9.7 2.2 7.8 4.0 1.1 4.7 4.5 4.6 4.7 4.0
NFA contribution 8.6 -1.5 7.3 11.5 -2.1 1.2 1.2 0.4 0.4 0.3
NDA contribution 1.2 3.7 0.6 -7.5 3.2 3.5 3.3 4.2 4.3 3.6
Money 18.2 -4.8 10.4 11.4 1.1 4.7 4.5 3.7 5.5 3.2
NFA contribution 25.1 -7.9 18.7 29.6 -9.2 2.0 1.9 1.9 2.0 1.7
NDA contribution -6.9 3.1 -8.3 -18.2 10.3 2.7 2.6 1.8 3.5 1.6
Broad money (real terms) 8.4 2.6 7.3 4.1 1.3 2.8 2.7 2.3 2.5 1.5
Net foreign assets 41.6 38.6 43.2 56.0 53.4 52.2 51.0 49.2 47.4 45.9
Net domestic assets 44.8 45.9 44.9 40.1 42.8 44.2 45.4 47.2 49.1 50.7
Public sector credit, net -10.2 0.3 1.5 -4.8 -4.7 -4.7 -4.7 -4.7 -4.7 -4.7
Private sector credit 60.8 57.8 54.6 57.5 54.8 52.1 49.8 48.1 46.8 45.9
Broad Money 86.4 84.5 88.1 96.1 96.2 96.4 96.4 96.4 96.5 96.6
Money 16.9 15.4 16.4 19.2 19.2 19.2 19.2 19.1 19.3 19.1
Quasi-money 69.5 69.1 71.7 76.9 77.0 77.1 77.1 77.3 77.3 77.5
Interest rates (percent per year) 1/
ECCB policy rate 6.5 6.5 6.5 6.5 n.a. n.a. n.a. n.a. n.a. n.a.
U.S. policy rate 0.1 0.1 0.1 0.4 n.a. n.a. n.a. n.a. n.a. n.a.
Interbank market rate 6.3 6.4 6.0 n.a. n.a. n.a. n.a. n.a. n.a. n.a.
Time deposit rate 4.5 4.3 4.2 4.0 n.a. n.a. n.a. n.a. n.a. n.a.
Demand deposit rate 0.7 0.4 0.4 0.2 n.a. n.a. n.a. n.a. n.a. n.a.
Weighted average lending rate 3.3 3.3 3.0 2.2 n.a. n.a. n.a. n.a. n.a. n.a.
(in percent of GDP)
Sources: Eastern Caribbean Central Banks (ECCB); and Fund staff estimates and projections.
1/ End-of-period rates.
Projected
(in millions of Eastern Caribbean dollars, end of period)
(12-month percentage change)

DOMINICA
INTERNATIONAL MONETARY FUND 31
Table 5a. Dominica: The Statement of Operations of the Central Government, Active
Scenario (EC Dollars)
2012 2013 2014 2015 2016 2017 2018 2019 2020 2021
Revenue 406.3 417.6 388.8 488.9 498.7 503.4 515.2 528.9 540.0 558.5
Taxes 297.5 305.0 315.9 337.9 340.9 347.3 361.6 382.1 399.2 414.3
Taxes on income 57.3 58.9 59.8 75.3 71.8 66.1 64.6 65.2 65.8 68.2
Taxes on property 6.7 7.7 7.7 6.5 6.4 6.7 7.0 8.9 9.2 9.6
Taxes on goods and services 176.1 179.2 183.8 187.5 189.6 198.1 210.2 222.9 232.2 241.0
Taxes on international trade and transactions 57.3 59.3 64.6 68.6 73.1 76.4 79.9 85.1 92.0 95.4
Grants 3/ 35.9 43.9 28.7 57.3 85.2 82.5 79.0 71.1 64.0 66.4
Other revenue 73.0 68.6 44.2 93.8 72.5 73.5 74.6 75.7 76.8 77.8
Property income 5.0 2.0 2.0 2.0 2.0 2.1 2.2 2.3 2.4 2.5
Sales, fees, and fines 10.9 13.2 10.5 10.3 10.6 11.1 11.6 12.1 12.6 13.1
Other nontax revenue 57.1 53.4 31.7 81.5 59.9 60.4 60.8 61.3 61.8 62.3
Of which : ECP 50.7 49.7 23.0 67.0 50.0 50.0 50.0 50.0 50.0 50.0
Expenditure 478.2 459.6 449.7 476.3 531.8 520.0 512.3 520.5 519.9 538.2
Expense 338.2 334.6 351.6 365.5 372.9 379.1 383.1 397.2 395.8 409.4
Compensation of employees 146.8 144.5 159.5 152.4 158.2 157.0 158.5 163.0 163.2 169.4
Purchase of goods and services 97.0 93.1 99.9 100.9 103.7 108.3 113.3 118.4 123.4 128.0
Interest 26.6 28.1 20.6 32.0 32.3 35.1 36.6 38.2 38.7 40.5
Grants and social benefits (transfers and subsidies) 68.8 68.9 71.7 80.3 78.8 78.7 74.7 77.7 70.5 71.5
Other expense -1.0 0.0 0.0 0.0 0.0 0.0 0.0 0.0 0.0 0.0
Net lending -1.0 0.0 0.0 0.0 0.0 0.0 0.0 0.0 0.0 0.0
Net acquisition of nonfinancial assets 140.0 125.0 98.1 110.7 158.9 141.0 129.2 123.3 124.0 128.7
Grant-financed capital expenditure 35.9 43.9 28.7 52.3 85.2 82.5 79.0 71.1 64.0 66.4
Other capital expenditure 106.6 81.4 69.7 58.8 74.0 58.8 50.6 52.5 60.4 62.7
Capital revenue -2.4 -0.3 -0.3 -0.3 -0.3 -0.3 -0.3 -0.4 -0.4 -0.4
Gross operating balance 68.1 83.0 37.1 123.4 125.7 124.3 132.1 131.6 144.1 149.1
Natural disaster (ND) annualised cost 4/ 0.0 0.0 0.0 0.0 20.9 21.8 22.8 23.9 24.9 25.8
-71.9 -42.0 -61.0 12.7 -33.2 -16.6 2.9 8.4 20.1 20.4
-1.3 -4.3 -6.1 -6.5 -7.1 -7.7 -7.9 -8.3 -8.6 -8.9
-73.2 -46.2 -67.1 6.1 -40.2 -24.3 -5.0 0.1 11.5 11.5
-71.9 -42.0 -61.0 12.7 -54.1 -38.5 -19.9 -15.5 -4.8 -5.5
Net financial transactions -71.9 -42.0 -61.0 12.7 -54.1 -38.5 -19.9 -15.5 -4.8 -5.5
Net acquisition of financial assets -31.8 -16.7 18.2 0.0 0.0 0.0 0.0 0.0 0.0 0.0
Currency and deposits -31.8 -16.7 18.2 0.0 0.0 0.0 0.0 0.0 0.0 0.0
Net incurrence of liabilities 25.2 78.9 -4.9 -12.7 54.1 38.5 19.9 15.5 4.8 5.5
Domestic -15.9 23.4 13.7 -3.5 15.0 10.7 5.5 4.3 1.3 1.5
Foreign 41.1 55.5 -18.6 -9.1 39.0 27.8 14.4 11.2 3.4 3.9
Statistical discrepancy -14.9 53.6 -84.0 0.0 0.0 0.0 0.0 0.0 0.0 0.0
Gross financing needs … … … 88.6 162.3 181.7 157.1 179.4 178.6 192.4
Overall deficit … … … -12.7 54.1 38.5 19.9 15.5 4.8 5.5
Debt repayments … … … 101.3 108.2 143.2 137.2 163.9 173.8 187.0
External … … … 69.4 73.8 79.7 92.6 100.8 105.3 113.8
Domestic … … … 31.8 34.5 63.5 44.5 63.1 68.5 73.2
of which: short-term … … … 20.0 20.0 20.0 20.0 20.0 20.0 20.0
Gross financing sources … … … 65.1 162.3 181.7 157.1 179.4 178.6 192.4
Debt issuance … … … 65.1 162.3 181.7 157.1 179.4 178.6 192.4
External … … … 36.8 112.8 107.5 107.0 112.0 108.7 117.7
Domestic … … … 28.3 49.5 74.2 50.1 67.4 69.8 74.7
of which: short-term … … … 20.0 20.0 20.0 20.0 20.0 20.0 20.0
Financing Gap … … … 23.5 0.0 0.0 0.0 0.0 0.0 0.0
of which: Rapid Credit Facility … … … 23.5 … … … … … …
Memorandum items:
Primary balance -45.4 -13.9 -40.4 44.6 -0.9 18.4 39.5 46.5 58.8 60.9
Underlying primary balance 6/ -96 -64 -63 -30 -41 -38 -20 -4 26 29
Public sector debt 7/ 971 1,040 1,160 1,159 1,222 1,271 1,301 1,327 1,343 1,360
Domestic 268 308 422 392 436 459 491 503 509 515
Central Governement 207 230 244 240 255 266 272 276 277 279
Rest of public sector 61 78 178 151 180 193 220 227 232 236
Foreign 704 732 738 768 787 812 810 824 834 845
Central Governement 595 651 632 623 662 690 704 715 719 723
Rest of public sector 108 81 106 145 125 122 106 109 115 122
Cumulative adjustment measures 0 0 0 -10 -25 -33 -56 -81 -111 -115
Nominal GDP, fiscal year (EC$ millions) 1,339 1,392 1,382 1,356 1,394 1,456 1,523 1,592 1,658 1,721
5/ Includes state owned enterprises.
6/ The underlying primary balance is calculated as the primary balance excluding ECP revenues, one-off collection of tax arrears, temporary
storm-related reconstruction and social assistance spending, and the transitory increase in grants projected after tropical storm Erika.
Projected
(in millions of Eastern Caribbean dollars)
Sources: Ministry of Finance; and Fund staff estimates and projections.
1/ The GFSM 2001 format presentation is an approximation and is based on the GFS 1986 format data.
Net lending/borrowing (overall balance, excl ND cost)
Net lending/borrowing (overall balance, incl ND cost)
Overall balance, rest of public sector
Public sector balance 5/
2/ Fiscal year (July-June) basis. Figures shown for a given year relate to the fiscal year beginning on July 1 of that year.
3/ Does not include grants that were received but not spent.
7/ Includes debt of SOEs guaranteed by the central government, and commitments under the Petrocaribe arrangement with Venezuela.
4/ Natural disaster costs are annualised estimated costs for reconstruction expenditures. It is calculated based on the results of a Monte-
Carlo experiment that simulates natural disaster shocks and their impact on output and government finances.

DOMINICA
32 INTERNATIONAL MONETARY FUND
Table 5b. Dominica: The Statement of Operations of the Central Government, Active
Scenario (% GDP)
2012 2013 2014 2015 2016 2017 2018 2019 2020 2021
Revenue 30.3 30.0 28.1 36.1 35.8 34.6 33.8 33.2 32.6 32.5
Taxes 22.2 21.9 22.9 24.9 24.5 23.9 23.7 24.0 24.1 24.1
Taxes on income 4.3 4.2 4.3 5.6 5.1 4.5 4.2 4.1 4.0 4.0
Taxes on property 0.5 0.6 0.6 0.5 0.5 0.5 0.5 0.6 0.6 0.6
Taxes on goods and services 13.2 12.9 13.3 13.8 13.6 13.6 13.8 14.0 14.0 14.0
Taxes on international trade and transactions 4.3 4.3 4.7 5.1 5.2 5.2 5.2 5.3 5.5 5.5
Grants 3/ 2.7 3.2 2.1 4.2 6.1 5.7 5.2 4.5 3.9 3.9
Other revenue 5.5 4.9 3.2 6.9 5.2 5.0 4.9 4.8 4.6 4.5
Property income 0.4 0.1 0.1 0.1 0.1 0.1 0.1 0.1 0.1 0.1
Sales, fees, and fines 0.8 0.9 0.8 0.8 0.8 0.8 0.8 0.8 0.8 0.8
Other nontax revenue 4.3 3.8 2.3 6.0 4.3 4.1 4.0 3.9 3.7 3.6
Of which : ECP 3.8 3.6 1.7 4.9 3.6 3.4 3.3 3.1 3.0 2.9
Expenditure 35.7 33.0 32.5 35.1 38.2 35.7 33.6 32.7 31.4 31.3
Expense 25.3 24.0 25.4 27.0 26.8 26.0 25.2 25.0 23.9 23.8
Compensation of employees 11.0 10.4 11.5 11.2 11.3 10.8 10.4 10.2 9.8 9.8
Purchase of goods and services 7.2 6.7 7.2 7.4 7.4 7.4 7.4 7.4 7.4 7.4
Interest 2.0 2.0 1.5 2.4 2.3 2.4 2.4 2.4 2.3 2.4
Grants and social benefits (transfers and subsidies) 5.1 5.0 5.2 5.9 5.7 5.4 4.9 4.9 4.3 4.2
Other expense -0.1 0.0 0.0 0.0 0.0 0.0 0.0 0.0 0.0 0.0
Net lending -0.1 0.0 0.0 0.0 0.0 0.0 0.0 0.0 0.0 0.0
Net acquisition of nonfinancial assets 10.5 9.0 7.1 8.2 11.4 9.7 8.5 7.7 7.5 7.5
Grant-financed capital expenditure 2.7 3.2 2.1 3.9 6.1 5.7 5.2 4.5 3.9 3.9
Other capital expenditure 8.0 5.8 5.0 4.3 5.3 4.0 3.3 3.3 3.6 3.6
Capital revenue -0.2 0.0 0.0 0.0 0.0 0.0 0.0 0.0 0.0 0.0
Gross operating balance 5.1 6.0 2.7 9.1 9.0 8.5 8.7 8.3 8.7 8.7
Natural disaster (ND) annualised cost 4/ 0.0 0.0 0.0 0.0 1.5 1.5 1.5 1.5 1.5 1.5
-5.4 -3.0 -4.4 0.9 -2.4 -1.1 0.2 0.5 1.2 1.2
-0.1 -0.3 -0.4 -0.5 -0.5 -0.5 -0.5 -0.5 -0.5 -0.5
-5.5 -3.3 -4.9 0.5 -2.9 -1.7 -0.3 0.0 0.7 0.7
Net lending/borrowing (overall balance, incl ND cost) -5.4 -3.0 -4.4 0.9 -3.9 -2.6 -1.3 -1.0 -0.3 -0.3
Net financial transactions -5.4 -3.0 -4.4 0.9 -3.9 -2.6 -1.3 -1.0 -0.3 -0.3
Net acquisition of financial assets -2.4 -1.2 1.3 0.0 0.0 0.0 0.0 0.0 0.0 0.0
Currency and deposits -2.4 -1.2 1.3 0.0 0.0 0.0 0.0 0.0 0.0 0.0
Net incurrence of liabilities 1.9 5.7 -0.4 -0.9 3.9 2.6 1.3 1.0 0.3 0.3
Domestic -1.2 1.7 1.0 -0.3 1.1 0.7 0.4 0.3 0.1 0.1
Foreign 3.1 4.0 -1.3 -0.7 2.8 1.9 0.9 0.7 0.2 0.2
Statistical discrepancy -1.1 3.9 -6.1 0.0 0.0 0.0 0.0 0.0 0.0 0.0
Gross financing needs … … … 6.5 11.6 12.5 10.3 11.3 10.8 11.2
Overall deficit … … … -0.9 3.9 2.6 1.3 1.0 0.3 0.3
Debt repayments … … … 7.5 7.8 9.8 9.0 10.3 10.5 10.9
External … … … 5.1 5.3 5.5 6.1 6.3 6.3 6.6
Domestic … … … 2.3 2.5 4.4 2.9 4.0 4.1 4.3
of which: short-term … … … 1.5 1.4 1.4 1.3 1.3 1.2 1.2
Gross financing sources … … … 4.8 11.6 12.5 10.3 11.3 10.8 11.2
Debt issuance … … … 4.8 11.6 12.5 10.3 11.3 10.8 11.2
External … … … 2.7 8.1 7.4 7.0 7.0 6.6 6.8
Domestic … … … 2.1 3.6 5.1 3.3 4.2 4.2 4.3
of which: short-term … … … 1.5 1.4 1.4 1.3 1.3 1.2 1.2
Financing gap … … … 1.7 0.0 0.0 0.0 0.0 0.0 0.0
of which: Rapid Credit Facility … … … 1.7 … … … … … …
Memorandum items:
Primary balance -3.4 -1.0 -2.9 3.3 -0.1 1.3 2.6 2.9 3.5 3.5
Underlying primary balance 6/ -7.2 -4.6 -4.6 -2.2 -2.9 -2.6 -1.3 -0.3 1.6 1.7
Public sector debt 7/ 72.6 74.7 83.9 85.5 87.7 87.3 85.4 83.4 81.0 79.0
Domestic 20.0 22.1 30.5 28.9 31.2 31.5 32.2 31.6 30.7 29.9
Central Governement 15.4 16.5 17.6 17.7 18.3 18.3 17.8 17.3 16.7 16.2
Rest of public sector 4.6 5.6 12.9 11.2 12.9 13.2 14.4 14.3 14.0 13.7
Foreign 52.6 52.6 53.4 56.6 56.4 55.8 53.2 51.8 50.3 49.1
Central Governement 44.5 46.8 45.7 45.9 47.5 47.4 46.3 45.0 43.4 42.0
Rest of public sector 8.1 5.8 7.6 10.7 8.9 8.4 6.9 6.9 6.9 7.1
Cumulative adjustment measures 0.0 0.0 0.0 -0.7 -1.8 -2.3 -3.7 -5.1 -6.7 -6.7
Nominal GDP, fiscal year (EC$ millions) 1,339 1,392 1,382 1,356 1,394 1,456 1,523 1,592 1,658 1,721
5/ Includes state owned enterprises.
4/ Natural disaster costs are annualised estimated costs for reconstruction expenditures. It is calculated based on the results of a Monte-
Carlo experiment that simulates natural disaster shocks and their impact on output and government finances.
6/ The underlying primary balance is calculated as the primary balance excluding ECP revenues, one-off collection of tax arrears, temporary
storm-related reconstruction and social assistance spending, and the transitory increase in grants projected after tropical storm Erika.
Overall balance, rest of public sector
Public sector balance 5/
7/ Includes debt of SOEs guaranteed by the central government, and commitments under the Petrocaribe arrangement with Venezuela.
1/ The GFSM 2001 format presentation is an approximation and is based on the GFS 1986 format data.
2/ Fiscal year (July-June) basis. Figures shown for a given year relate to the fiscal year beginning on July 1 of that year.
3/ Does not include grants that were received but not spent.
Projected
(in percent of GDP)
Sources: Ministry of Finance; and Fund staff estimates and projections.
Net lending/borrowing (overall balance, excl ND cost)

DOMINICA
INTERNATIONAL MONETARY FUND 33
Table 6. Dominica: Central Government Financing Needs and Sources, Active Scenario
2015 2016 2017 2018 2019 2020 2021
Gross financing needs 88.6 162.3 181.7 157.1 179.4 178.6 192.4
Overall deficit -12.7 54.1 38.5 19.9 15.5 4.8 5.5
Debt repayments 101.3 108.2 143.2 137.2 163.9 173.8 187.0
External 69.4 73.8 79.7 92.6 100.8 105.3 113.8
Domestic 31.8 34.5 63.5 44.5 63.1 68.5 73.2
of which: short-term 20.0 20.0 20.0 20.0 20.0 20.0 20.0
Gross financing sources 65.1 162.3 181.7 157.1 179.4 178.6 192.4
Debt issuance 65.1 162.3 181.7 157.1 179.4 178.6 192.4
External 36.8 112.8 107.5 107.0 112.0 108.7 117.7
Domestic 28.3 49.5 74.2 50.1 67.4 69.8 74.7
of which: short-term 20.0 20.0 20.0 20.0 20.0 20.0 20.0
Use of deposits 0.0 0.0 0.0 0.0 0.0 0.0 0.0
Financing gap 23.5 0.0 0.0 0.0 0.0 0.0 0.0
of which: Rapid Credit Facility 23.5 … … … … … …
Memo: central government deposits 69.0 69.0 69.0 69.0 69.0 69.0 69.0
Gross financing needs 6.5 11.6 12.5 10.3 11.3 10.8 11.2
Overall deficit -0.9 3.9 2.6 1.3 1.0 0.3 0.3
Debt repayments 7.5 7.8 9.8 9.0 10.3 10.5 10.9
External 5.1 5.3 5.5 6.1 6.3 6.3 6.6
Domestic 2.3 2.5 4.4 2.9 4.0 4.1 4.3
Short-term domestic debt rollover 1.5 1.4 1.4 1.3 1.3 1.2 1.2
Gross financing sources 4.8 11.6 12.5 10.3 11.3 10.8 11.2
Debt issuance 4.8 11.6 12.5 10.3 11.3 10.8 11.2
External 2.7 8.1 7.4 7.0 7.0 6.6 6.8
Domestic 2.1 3.6 5.1 3.3 4.2 4.2 4.3
of which: short-term 1.5 1.4 1.4 1.3 1.3 1.2 1.2
Use of deposits 0.0 0.0 0.0 0.0 0.0 0.0 0.0
Financing gap 1.7 0.0 0.0 0.0 0.0 0.0 0.0
of which: Rapid Credit Facility 1.7 … … … … … …
Memo: central government deposits 5.1 4.9 4.7 4.5 4.3 4.2 4.0
Memo: nominal GDP, FY basis (EC$ millions) 1,356 1,394 1,456 1,523 1,592 1,658 1,721
Sources: Fund staff estimates and projections.
1/ Fiscal year (July-June) basis.
(in percent of GDP)
(in millions of Eastern Caribbean dollars)

DOMINICA
34 INTERNATIONAL MONETARY FUND
Annex I. Debt Sustainability Analysis1
Dominica continues to be at high risk of debt distress. The fiscal adjustment program
being pursued by the authorities (active policies scenario) would put debt on a
sustainable path but above the ECCU regional debt target. Customized scenarios
(assuming no further fiscal consolidation, lower donor grants, lower ECP revenues and a
hurricane shock in 2018) are used to inform the external risk rating, given the challenging
medium-term fiscal consolidation. Should the planned fiscal consolidation take hold and
the debt outlook move firmly along the sustainable path projected under the active
policies scenario, an improvement of the risk rating could be considered in a future
assessment.
1. Dominica’s overall public debt has been increasing steadily since 2010, reflecting the
weakening fiscal position. As of end-FY 2014/15, the stock of public sector debt (central
government and rest of the public sector, henceforth public debt) is estimated to be around
84 percent of GDP. Over 70 percent of the public debt is external, owed mainly to multilateral
creditors and the remaining is held domestically, mostly by commercial banks and other financial
institutions. The debt of the rest of public sector (state owned enterprises and Petrocaribe) is about
21 percent of GDP.
2. In accordance with the fiscal consolidation measures discussed under the RCF, public
debt is assessed to be sustainable. The authorities have committed to a gradual fiscal
consolidation over the next five years, supported by comprehensive reforms to improve revenue
collection, broaden the tax base, and contain current expenditures. They have adopted the initial
fiscal measures in the RCF, and have undertaken
new measures to further strengthen the fiscal
position. If the fiscal consolidation plan is fully
implemented, the debt outlook would improve
significantly. This consolidation includes a
provision of 1.5 percent of GDP per year to lower
debt and to build buffers to address future
natural disasters, providing a degree of resilience
to the fiscal consolidation strategy. However, if
the authorities did not take any additional fiscal
consolidation measures, public debt would be on
an upward trajectory and become unsustainable –
reaching 130 percent of GDP by 2030 (text chart, no adjustment scenario).
The main differences relative to the DSA in the RCF Staff Report are as follows:
1 This DSA has been cleared by Mr. Bob Traa (IMF) and Mr. John Panzer (World Bank).
40
60
80
100
120
140
2015 2017 2019 2021 2023 2025 2027 2029
Dominica: Public debt develpments
(in percent of GDP)
Public debt (active policies scenario)
Public debt (no adjustment)
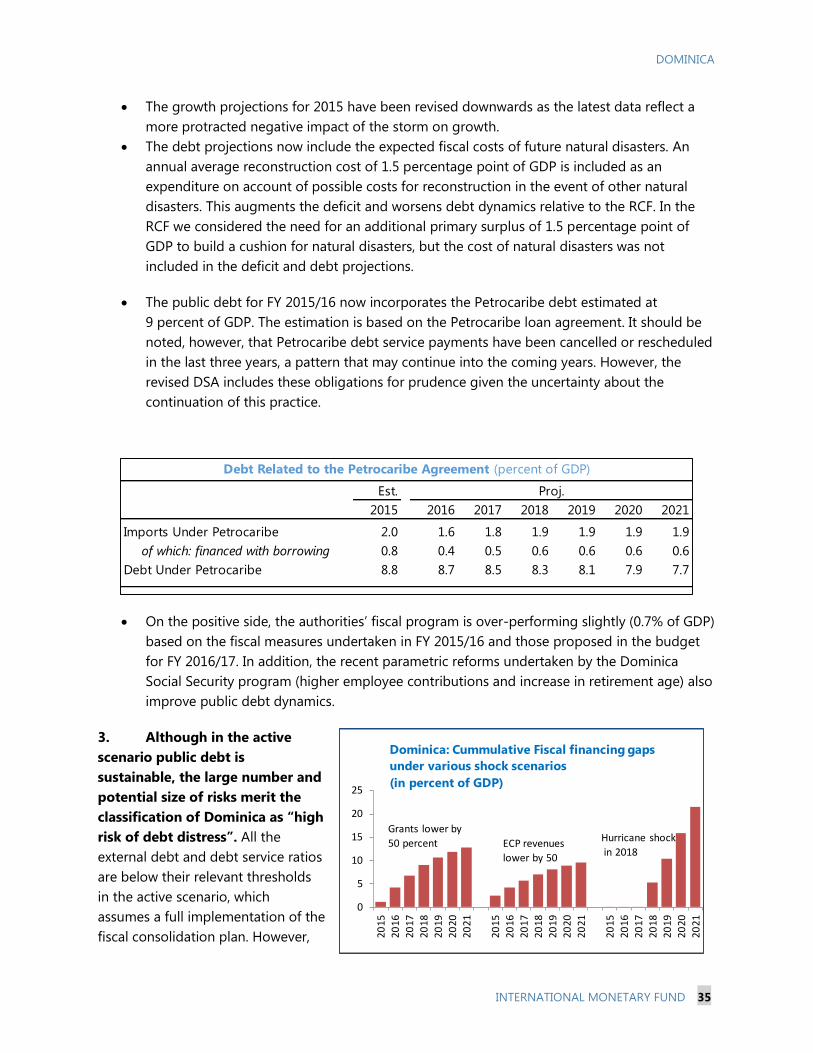
DOMINICA
INTERNATIONAL MONETARY FUND 35
The growth projections for 2015 have been revised downwards as the latest data reflect a
more protracted negative impact of the storm on growth.
The debt projections now include the expected fiscal costs of future natural disasters. An
annual average reconstruction cost of 1.5 percentage point of GDP is included as an
expenditure on account of possible costs for reconstruction in the event of other natural
disasters. This augments the deficit and worsens debt dynamics relative to the RCF. In the
RCF we considered the need for an additional primary surplus of 1.5 percentage point of
GDP to build a cushion for natural disasters, but the cost of natural disasters was not
included in the deficit and debt projections.
The public debt for FY 2015/16 now incorporates the Petrocaribe debt estimated at
9 percent of GDP. The estimation is based on the Petrocaribe loan agreement. It should be
noted, however, that Petrocaribe debt service payments have been cancelled or rescheduled
in the last three years, a pattern that may continue into the coming years. However, the
revised DSA includes these obligations for prudence given the uncertainty about the
continuation of this practice.
On the positive side, the authorities’ fiscal program is over-performing slightly (0.7% of GDP)
based on the fiscal measures undertaken in FY 2015/16 and those proposed in the budget
for FY 2016/17. In addition, the recent parametric reforms undertaken by the Dominica
Social Security program (higher employee contributions and increase in retirement age) also
improve public debt dynamics.
3. Although in the active
scenario public debt is
sustainable, the large number and
potential size of risks merit the
classification of Dominica as “high
risk of debt distress”. All the
external debt and debt service ratios
are below their relevant thresholds
in the active scenario, which
assumes a full implementation of the
fiscal consolidation plan. However,
0
5
10
15
20
25
20
15
20
16
20
17
20
18
20
19
20
20
20
21
20
15
20
16
20
17
20
18
20
19
20
20
20
21
20
15
20
16
20
17
20
18
20
19
20
20
20
21
ECP revenues
lower by 50
Hurricane shock
in 2018
Dominica: Cummulative Fiscal financing gaps
under various shock scenarios
(in percent of GDP)
Grants lower by
50 percent
Est.
2015 2016 2017 2018 2019 2020 2021
Imports Under Petrocaribe 2.0 1.6 1.8 1.9 1.9 1.9 1.9
of which: financed with borrowing 0.8 0.4 0.5 0.6 0.6 0.6 0.6
Debt Under Petrocaribe 8.8 8.7 8.5 8.3 8.1 7.9 7.7
Debt Related to the Petrocaribe Agreement (percent of GDP)
Proj.

DOMINICA
36 INTERNATIONAL MONETARY FUND
under the customized scenarios several thresholds are breached. One customized scenario (no
adjustment) assumes that fiscal performance follows passively from the current set of policies in
place and no additional measures are adopted. In the customized scenario, the average annual
external debt service obligations are estimated around US$39.3 million (7.3% of GDP) during the
next three fiscal years (FY2015-17), which could pose a financing risk. Staff simulations indicate that
the materialization of other risks would also breach the debt thresholds and render unsustainable
debt dynamics as shown in Figures A1 and A2 for other customized scenarios. This is particularly
plausible in the cases of (i) a reduction of grants (to 50 percent of the active scenario); (ii) lower ECP
revenues (to 50 percent of the active scenario); and (iii) the occurrence of a natural disaster in 2018.
It should be noted that these events are largely or completely outside the government control.
4. The precarious debt sustainability prospects, even if the fiscal consolidation plan was
fully implemented, prompted the government to seek debt relief from bilateral creditors. In
light of the high debt burden, the large fiscal costs of the reconstruction of public infrastructure
after the tropical storm, and its protracted effects on output, the authorities have formally requested
debt relief from bilateral creditors as part of their fiscal consolidation strategy – including from the
Paris Club and also on Petrocaribe debt service flows. Should any of the risks to debt sustainability
mentioned above materialize, there would be no realistic amount of fiscal consolidation that could
cover the resulting financing gap. In that case, the insuficient revenues would force a compression
government spending which would most likelly affect capital expenditures and reduce growth
prospects.
5. As a result, the public and publicly guaranteed (PPG) external debt risk rating remains
high. This assessment is based on the risks reflected in the customized scenarios and the significant
risks explained above, which carry significant weight in this assessment. Under the customized
scenario, the debt path takes an increasing trajectory and breaches two solvency thresholds (Figure
A1).
6. The authorities concurred with staff that Dominica remains at high risk of debt
distress. They agreed that the debt dynamics could easily become unsustainable even if the fiscal
consolidation committed in the RCF is fully implemented. They explained that the expenditure in
rehabilitation and reconstruction after tropical storm Erika was largely non-optional, as required to
restore normal functioning of the economy and the provision of basic public services. Given this
situation, they expressed concern that shortages in grant revenues relative to current expectations
or in other sources of revenue, or other natural disaster events, could result in higher debt issuance
(mostly concessional) and a breaching of the debt thresholds. However, they explained that they
remain fully committed to fiscal sustainability and to this end they are also pursuing debt relief from
bilateral partners as part of their debt consolidation strategy.
Conclusion
7. The risk rating assigned to PPG external debt is high. Under a customized scenario
(without further fiscal adjustment), debt would exceed two solvency thresholds in the medium term.

DOMINICA
INTERNATIONAL MONETARY FUND 37
The other customized scenarios (with lower grants, lower ECP and hurricane shock) show breaches
of debt service thresholds. Moreover, given the challenges associated with fiscal consolidation in the
wake of storm Erika, the customized scenarios are attached significant weight in the risk assessment.
Nevertheless, the authorities have expressed commitment to the fiscal adjustment program (active
scenario) that would put public debt on a sustainable trajectory. As the planned fiscal consolidation
takes hold, further increasing confidence in the active policies scenario, an upgrade of the risk rating
could be considered in a future assessment.

DOMINICA
38 INTERNATIONAL MONETARY FUND
Figure A1. Dominica: Indicators of Public and Publicly Guaranteed External Debt Under
Alternative Scenarios, 2015-35 (Active Scenario) 1/
Customized scenario (hurricane in 2018)
Customized scenario (low ECP) Customized scenario (no adjustmnet)
Customized scenario (low grants)
Active Historical scenario Most extreme shock 1/
Threshold
1/ The most extreme stress test is the test that yields the highest ratio on or before 2025. In figure b. it corresponds to a
Customized scenario (no adjustment) shock; in c. to a Customized scenario (no adjustment) shock; in d. to a Customized
scenario (no adjustment) shock; in e. to a Customized scenario (no adjustment) shock and in figure f. to a Customized
scenario (no adjustment) shock
0
5
10
15
20
25
30
35
40
2015 2020 2025 2030 2035
f.Debt service-to-revenue ratio
0
10
20
30
40
50
60
-2
0
2
4
6
8
10
12
2015 2020 2025 2030 2035
Rate of Debt Accumulation
Grant-equivalent financing (% of GDP)
Grant element of new borrowing (% right scale)
a. Debt Accumulation
0
50
100
150
200
250
2015 2020 2025 2030 2035
c.PV of debt-to-exports ratio
0
10
20
30
40
50
60
70
80
2015 2020 2025 2030 2035
b.PV of debt-to GDP ratio
0
50
100
150
200
250
300
350
2015 2020 2025 2030 2035
d.PV of debt-to-revenue ratio
0
5
10
15
20
25
30
2015 2020 2025 2030 2035
e.Debt service-to-exports ratio

DO
MIN
ICA
Table A1. Dominica: External Debt Sustainability Framework, Active Scenario, 2012-35 1/
(In percent of GDP)
Historical6/
Standard6/
Average Deviation 2015-2020 2021-2035
2012 2013 2014 2015 2016 2017 2018 2019 2020 Average 2025 2035 Average
External debt (nominal) 1/ 74.7 77.7 85.8 92.6 91.0 90.2 87.2 83.7 80.1 69.1 53.5
of which: public and publicly guaranteed (PPG) 52.6 52.6 53.4 56.6 56.4 55.8 53.2 51.8 50.3 45.8 37.5
Change in external debt 1.9 3.0 8.1 6.8 -1.6 -0.8 -3.0 -3.5 -3.6 -1.8 -3.4
Identified net debt-creating flows 7.6 7.1 3.3 9.2 2.1 2.9 3.3 5.8 4.7 3.8 3.0
Non-interest current account deficit 11.7 13.8 6.6 13.7 5.2 8.5 6.5 9.3 10.3 11.0 8.5 7.2 8.6 7.5
Deficit in balance of goods and services 14.3 11.1 11.4 11.6 13.1 13.8 12.6 10.3 9.2 9.6 9.0
Exports 35.5 39.8 41.7 41.4 40.6 40.0 39.7 39.6 39.5 39.5 37.3
Imports 49.8 51.0 53.1 53.0 53.7 53.8 52.3 49.9 48.7 49.1 46.3
Net current transfers (negative = inflow) -3.7 -4.4 -5.3 -4.3 0.7 -5.2 -4.8 -4.7 -4.7 -4.7 -4.7 -4.8 -4.5 -4.7
of which: official -0.6 -1.1 -1.1 -0.9 -0.6 -0.6 -0.6 -0.6 -0.6 -0.6 -0.5
Other current account flows (negative = net inflow) 1.2 7.1 0.4 2.1 -1.9 0.2 2.5 5.4 4.1 2.3 4.0
Net FDI (negative = inflow) -6.3 -6.4 -6.9 -9.7 2.6 -5.9 -5.8 -6.5 -7.1 -5.4 -4.2 -4.6 -4.5 -5.0
Endogenous debt dynamics 2/ 2.1 -0.3 3.6 6.6 1.5 0.1 0.2 0.2 0.3 1.2 -1.1
Contribution from nominal interest rate 2.5 2.6 3.1 3.2 2.6 2.5 2.5 2.3 2.1 2.4 0.9
Contribution from real GDP growth 0.9 -0.4 -3.0 3.4 -1.1 -2.5 -2.3 -2.1 -1.8 -1.1 0.0
Contribution from price and exchange rate changes -1.3 -2.4 3.6 -1.8 -1.4 -1.4 -1.6 -1.7 -1.5 -1.3 -2.0
Residual (3-4) 3/ -5.7 -4.1 4.8 -3.9 -2.4 -3.7 -3.7 -6.3 -9.3 -8.3 -5.6 -6.4
of which: Capital transfers 4.8 6.3 6.5 6.1 5.3 4.8 3.9 3.6
of which: Commercial Banks and other private flows -1.5 -0.9 0.5 -0.7 0.6 1.2 -0.6 0.0
of which: exceptional financing 0.0 0.0 0.0 1.7 0.0 0.0 0.0 0.0 0.0 0.0 0.0
PV of external debt 4/ ... ... 70.9 77.8 75.8 75.4 73.0 71.5 67.5 53.2 41.0
In percent of exports ... ... 170.1 187.7 186.9 188.6 183.6 180.5 170.8 134.7 109.9
PV of PPG external debt ... ... 38.4 41.8 41.2 41.0 38.9 39.5 37.7 29.8 25.1
In percent of exports ... ... 92.2 100.9 101.6 102.5 98.0 99.9 95.4 75.5 67.1
In percent of government revenues ... ... 109.9 103.0 107.6 109.2 104.5 105.7 100.9 81.1 71.2
Debt service-to-exports ratio (in percent) 16.5 13.0 16.6 19.7 16.9 17.4 16.9 16.7 16.7 15.0 7.7
PPG debt service-to-exports ratio (in percent) 11.6 8.5 12.5 15.4 12.5 13.0 12.5 12.5 12.5 11.3 6.7
PPG debt service-to-revenue ratio (in percent) 11.2 9.5 14.9 15.8 13.3 13.9 13.4 13.3 13.3 12.2 7.1
Total gross financing need (Billions of U.S. dollars) 0.1 0.1 0.0 0.1 0.0 0.1 0.1 0.1 0.1 0.1 0.1
Non-interest current account deficit that stabilizes debt ratio 9.9 10.8 -1.6 1.7 8.1 10.1 13.3 14.5 12.2 9.1 12.0
Key macroeconomic assumptions
Real GDP growth (in percent) -1.3 0.6 3.9 2.1 3.1 -3.9 1.3 2.8 2.7 2.5 2.3 1.3 1.7 0.0 1.6
GDP deflator in US dollar terms (change in percent) 1.8 3.3 -4.4 1.3 2.6 2.1 1.5 1.6 1.8 2.0 1.9 1.8 2.0 3.7 2.1
Effective interest rate (percent) 5/ 3.5 3.6 3.9 4.5 0.9 3.7 2.9 2.9 2.8 2.7 2.7 2.9 3.5 1.6 2.9
Growth of exports of G&S (US dollar terms, in percent) 1.5 16.7 3.9 5.2 6.1 -2.4 0.5 3.0 3.9 4.1 4.0 2.2 3.7 0.0 3.3
Growth of imports of G&S (US dollar terms, in percent) -4.1 6.5 3.4 4.2 7.6 -2.0 4.1 4.7 1.7 -0.4 1.8 1.6 3.5 0.2 3.4
Grant element of new public sector borrowing (in percent) ... ... ... ... ... 16.9 38.3 30.7 35.3 31.6 46.4 33.2 37.7 30.6 36.0
Government revenues (excluding grants, in percent of GDP) 36.8 35.7 35.0 40.6 38.3 37.5 37.3 37.4 37.3 36.7 35.2 36.4
Aid flows (in Billions of US dollars) 7/ 0.1 0.0 0.0 0.0 0.1 0.1 0.0 0.1 0.1 0.1 0.1
of which: Grants 0.0 0.0 0.0 0.0 0.0 0.0 0.0 0.0 0.0 0.0 0.0
of which: Concessional loans 0.0 0.0 0.0 0.0 0.0 0.0 0.0 0.0 0.0 0.0 0.0
Grant-equivalent financing (in percent of GDP) 8/ ... ... ... 5.4 8.3 7.8 6.7 6.9 6.3 5.5 4.0 4.8
Grant-equivalent financing (in percent of external financing) 8/ ... ... ... 48.5 69.9 62.0 70.7 56.4 69.2 67.3 63.2 65.0
Memorandum items:
Nominal GDP (Billions of US dollars) 0.5 0.5 0.5 0.5 0.5 0.5 0.6 0.6 0.6 0.7 1.1
Nominal dollar GDP growth 0.5 3.9 -0.7 -1.9 2.8 4.5 4.5 4.5 4.2 3.1 3.7 3.7 3.7
PV of PPG external debt (in Billions of US dollars) 0.2 0.2 0.2 0.2 0.2 0.2 0.2 0.2 0.3
(PVt-PVt-1)/GDPt-1 (in percent) 2.6 0.6 1.6 -0.3 2.4 -0.3 1.1 -0.3 1.1 0.2
Gross workers' remittances (Billions of US dollars) … … … … … … … … … … …
PV of PPG external debt (in percent of GDP + remittances) ... ... 38.4 41.8 41.2 41.0 38.9 39.5 37.7 29.8 25.1
PV of PPG external debt (in percent of exports + remittances) ... ... 92.2 100.9 101.6 102.5 98.0 99.9 95.4 75.5 67.1
Debt service of PPG external debt (in percent of exports + remittances) ... ... 12.5 15.4 12.5 13.0 12.5 12.5 12.5 11.3 6.7
Sources: Country authorities; and staff estimates and projections. 0
1/ Includes both public and private sector external debt.
2/ Derived as [r - g - ρ(1+g)]/(1+g+ρ+gρ) times previous period debt ratio, with r = nominal interest rate; g = real GDP growth rate, and ρ = growth rate of GDP deflator in U.S. dollar terms.
3/ Includes exceptional financing (i.e., changes in arrears and debt relief); changes in gross foreign assets; and valuation adjustments. For projections also includes contribution from price and exchange rate changes.
4/ Assumes that PV of private sector debt is equivalent to its face value.
5/ Current-year interest payments divided by previous period debt stock.
6/ Historical averages and standard deviations are generally derived over the past 10 years, subject to data availability.
7/ Defined as grants, concessional loans, and debt relief.
8/ Grant-equivalent financing includes grants provided directly to the government and through new borrowing (difference between the face value and the PV of new debt).
Actual Projections
INTER
NA
TIO
NA
L MO
NETA
RY F
UN
D 3
9

DOMINICA
40 INTERNATIONAL MONETARY FUND
Table A2. Dominica: Sensitivity Analysis for Key Indicators of Public and Publicly
Guaranteed External Debt, Active Scenario, 2015-35
2015 2016 2017 2018 2019 2020 2025 2035
Baseline 42 41 41 39 40 38 30 25
A. Alternative Scenarios
A1. Key variables at their historical averages in 2015-2035 1/ 42 43 45 44 44 42 40 42
A2. New public sector loans on less favorable terms in 2015-2035 2 42 43 44 44 47 46 46 55
B. Bound Tests
B1. Real GDP growth at historical average minus one standard deviation in 2016-2017 42 42 43 41 42 40 32 27
B2. Export value growth at historical average minus one standard deviation in 2016-2017 3/ 42 42 43 41 41 40 31 26
B3. US dollar GDP deflator at historical average minus one standard deviation in 2016-2017 42 42 43 41 42 40 32 27
B4. Net non-debt creating flows at historical average minus one standard deviation in 2016-2017 4/ 42 41 41 39 40 38 30 25
B5. Combination of B1-B4 using one-half standard deviation shocks 42 40 41 39 40 38 30 26
B6. One-time 30 percent nominal depreciation relative to the baseline in 2016 5/ 42 59 58 55 56 54 42 36
Baseline 101 102 102 98 100 95 75 67
A. Alternative Scenarios
A1. Key variables at their historical averages in 2015-2035 1/ 101 107 111 110 110 106 101 112
A2. New public sector loans on less favorable terms in 2015-2035 2 101 105 111 110 118 117 117 148
B. Bound Tests
B1. Real GDP growth at historical average minus one standard deviation in 2016-2017 101 102 102 98 100 95 75 67
B2. Export value growth at historical average minus one standard deviation in 2016-2017 3/ 101 104 113 108 110 105 83 73
B3. US dollar GDP deflator at historical average minus one standard deviation in 2016-2017 101 102 102 98 100 95 75 67
B4. Net non-debt creating flows at historical average minus one standard deviation in 2016-2017 4/ 101 101 103 99 101 96 76 68
B5. Combination of B1-B4 using one-half standard deviation shocks 101 96 96 92 94 90 71 65
B6. One-time 30 percent nominal depreciation relative to the baseline in 2016 5/ 101 102 102 98 100 95 75 67
Baseline 103 108 109 104 106 101 81 71
A. Alternative Scenarios
A1. Key variables at their historical averages in 2015-2035 1/ 103 113 119 117 117 112 109 119
A2. New public sector loans on less favorable terms in 2015-2035 2 103 112 118 117 124 124 126 157
B. Bound Tests
B1. Real GDP growth at historical average minus one standard deviation in 2016-2017 103 110 116 111 112 107 86 76
B2. Export value growth at historical average minus one standard deviation in 2016-2017 3/ 103 109 114 110 111 106 85 73
B3. US dollar GDP deflator at historical average minus one standard deviation in 2016-2017 103 111 115 111 112 107 86 75
B4. Net non-debt creating flows at historical average minus one standard deviation in 2016-2017 4/ 103 107 110 105 107 102 82 72
B5. Combination of B1-B4 using one-half standard deviation shocks 103 106 110 105 106 101 81 73
B6. One-time 30 percent nominal depreciation relative to the baseline in 2016 5/ 103 153 155 148 150 143 115 101
PV of debt-to-exports ratio
PV of debt-to-revenue ratio
PV of debt-to GDP ratio
Projections

DOMINICA
INTERNATIONAL MONETARY FUND 41
Table A2. Dominica: Sensitivity Analysis for Key Indicators of Public and Publicly
Guaranteed External Debt, Active Scenario, 2015-35 (concluded)
Baseline 15 13 13 13 13 13 11 7
A. Alternative Scenarios
A1. Key variables at their historical averages in 2015-2035 1/ 15 12 13 13 13 13 13 10
A2. New public sector loans on less favorable terms in 2015-2035 2 15 13 12 12 11 12 10 11
B. Bound Tests
B1. Real GDP growth at historical average minus one standard deviation in 2016-2017 15 13 13 13 13 13 11 7
B2. Export value growth at historical average minus one standard deviation in 2016-2017 3/ 15 13 14 13 13 13 12 7
B3. US dollar GDP deflator at historical average minus one standard deviation in 2016-2017 15 13 13 13 13 13 11 7
B4. Net non-debt creating flows at historical average minus one standard deviation in 2016-2017 4/ 15 13 13 13 13 13 11 7
B5. Combination of B1-B4 using one-half standard deviation shocks 15 12 13 12 12 12 11 6
B6. One-time 30 percent nominal depreciation relative to the baseline in 2016 5/ 15 13 13 13 13 13 11 7
Baseline 16 13 14 13 13 13 12 7
A. Alternative Scenarios
A1. Key variables at their historical averages in 2015-2035 1/ 16 13 14 14 14 14 14 11
A2. New public sector loans on less favorable terms in 2015-2035 2 16 13 12 12 12 12 11 12
B. Bound Tests
B1. Real GDP growth at historical average minus one standard deviation in 2016-2017 16 14 15 14 14 14 13 8
B2. Export value growth at historical average minus one standard deviation in 2016-2017 3/ 16 13 14 14 13 13 13 7
B3. US dollar GDP deflator at historical average minus one standard deviation in 2016-2017 16 14 15 14 14 14 13 7
B4. Net non-debt creating flows at historical average minus one standard deviation in 2016-2017 4/ 16 13 14 13 13 13 12 7
B5. Combination of B1-B4 using one-half standard deviation shocks 16 14 15 14 14 14 13 7
B6. One-time 30 percent nominal depreciation relative to the baseline in 2016 5/ 16 19 20 19 19 19 17 10
Memorandum item:
Grant element assumed on residual financing (i.e., financing required above baseline) 6/ 26 26 26 26 26 26 26 26
Sources: Country authorities; and staff estimates and projections.
1/ Variables include real GDP growth, growth of GDP deflator (in U.S. dollar terms), non-interest current account in percent of GDP, and non-debt creating flows.
2/ Assumes that the interest rate on new borrowing is by 2 percentage points higher than in the baseline., while grace and maturity periods are the same as in the baseline.
3/ Exports values are assumed to remain permanently at the lower level, but the current account as a share of GDP is assumed to return to its baseline level after the shock (implicitly assuming
an offsetting adjustment in import levels).
4/ Includes official and private transfers and FDI.
5/ Depreciation is defined as percentage decline in dollar/local currency rate, such that it never exceeds 100 percent.
6/ Applies to all stress scenarios except for A2 (less favorable financing) in which the terms on all new financing are as specified in footnote 2.
Debt service-to-revenue ratio
Debt service-to-exports ratio

Table A3. Dominica: Public Sector Debt Sustainability Framework, Active Scenario, 2012-35
(in percent of GDP, unless otherwise indicated)
Estimate
2012 2013 2014
Average
5/ Standard
Deviatio
n
5/
2015 2016 2017 2018 2019 2020
2015-20
Average2025 2035
2021-
35
Averag
Public sector debt 1/ 72.6 74.7 83.9 85.5 87.7 87.3 85.4 83.4 81.0 72.3 59.1
of which: foreign-currency denominated 52.6 52.6 53.4 56.6 56.4 55.8 53.2 51.8 50.3 45.8 37.5
Change in public sector debt 2.8 2.2 9.2 1.6 2.2 -0.4 -1.8 -2.1 -2.4 -1.6 -3.4
Identified debt-creating flows 5.0 -0.3 4.4 0.1 1.9 -0.8 -2.1 -2.2 -2.5 -2.3 -3.6
Primary deficit 3.7 0.5 1.6 -2.6 5.7 -4.4 1.9 0.6 -0.6 -0.8 -1.3 -0.8 -2.0 -1.7 -1.1
Revenue and grants 39.5 38.9 37.0 44.8 44.4 43.2 42.5 41.9 41.2 40.6 38.2
of which: grants 2.7 3.2 2.1 4.2 6.1 5.7 5.2 4.5 3.9 3.9 3.0
Primary (noninterest) expenditure 43.1 39.4 38.7 40.4 46.3 43.8 41.8 41.1 39.9 38.6 36.5
Automatic debt dynamics 1.4 -0.8 2.7 4.5 0.0 -1.4 -1.5 -1.5 -1.2 -0.3 -1.9
Contribution from interest rate/growth differential 1.4 0.1 -0.7 4.4 -0.3 -1.7 -1.5 -1.5 -1.3 -0.3 -1.2
of which: contribution from average real interest rate 0.5 0.5 2.1 1.1 0.7 0.8 0.7 0.6 0.6 0.9 -0.2
of which: contribution from real GDP growth 0.9 -0.4 -2.8 3.4 -1.1 -2.4 -2.3 -2.1 -1.8 -1.2 -1.0
Contribution from real exchange rate depreciation 0.0 -0.9 3.4 0.1 0.3 0.3 0.1 0.0 0.1 0.0 -0.6
Other identified debt-creating flows 0.0 0.0 0.0 0.0 0.0 0.0 0.0 0.0 0.0 0.0 0.0
Privatization receipts (negative) 0.0 0.0 0.0 0.0 0.0 0.0 0.0 0.0 0.0 0.0 0.0
Recognition of implicit or contingent liabilities 0.0 0.0 0.0 0.0 0.0 0.0 0.0 0.0 0.0 0.0 0.0
Debt relief (HIPC and other) 0.0 0.0 0.0 0.0 0.0 0.0 0.0 0.0 0.0 0.0 0.0
Other (specify, e.g. bank recapitalization) 0.0 0.0 0.0 0.0 0.0 0.0 0.0 0.0 0.0 0.0 0.0
Residual, including asset changes -2.2 2.5 4.8 1.5 0.3 0.3 0.3 0.2 0.1 0.8 0.2
Other Sustainability Indicators
PV of public sector debt ... ... 68.9 70.7 72.5 72.5 71.2 71.1 68.4 56.3 46.6
of which: foreign-currency denominated ... ... 38.4 41.8 41.2 41.0 38.9 39.5 37.7 29.8 25.1
of which: external ... ... 38.4 41.8 41.2 41.0 38.9 39.5 37.7 29.8 25.1
PV of contingent liabilities (not included in public sector debt) ... ... ... ... ... ... ... ... ... ... ...
Gross financing need 2/ 11.0 6.6 9.2 5.4 9.7 10.6 7.7 8.6 8.2 8.0 3.2
PV of public sector debt-to-revenue and grants ratio (in percent) … … 186.1 157.8 163.1 167.8 167.7 169.9 166.0 138.7 122.0
PV of public sector debt-to-revenue ratio (in percent) … … 197.2 174.2 189.2 193.1 191.0 190.2 183.1 153.3 132.4
of which: external 3/ … … 109.9 103.0 107.6 109.2 104.5 105.7 100.9 81.1 71.2
Debt service-to-revenue and grants ratio (in percent) 4/ 18.6 15.7 20.4 21.8 17.5 23.1 19.6 22.3 23.0 24.8 12.9
Debt service-to-revenue ratio (in percent) 4/ 20.0 17.1 21.6 24.1 20.3 26.6 22.4 24.9 25.4 27.4 13.9
Primary deficit that stabilizes the debt-to-GDP ratio 0.8 -1.7 -7.5 -6.0 -0.3 1.1 1.2 1.3 1.1 -0.5 1.7
Key macroeconomic and fiscal assumptions
Real GDP growth (in percent) -1.3 0.6 3.9 2.1 3.1 -3.9 1.3 2.8 2.7 2.5 2.3 1.3 1.7 1.7 1.7
Average nominal interest rate on forex debt (in percent) 1.6 1.6 2.6 2.5 0.9 2.7 1.5 1.4 1.4 1.2 1.0 1.5 2.1 1.3 1.4
Average real interest rate on domestic debt (in percent) 2.9 2.5 8.6 3.5 2.9 2.5 3.7 3.7 3.4 3.3 3.4 3.3 3.2 0.4 3.0
Real exchange rate depreciation (in percent, + indicates depreciation) -0.1 -1.7 6.7 0.7 2.7 0.1 ... ... ... ... ... ... ... ... ...
Inflation rate (GDP deflator, in percent) 1.8 3.3 -4.4 1.3 2.6 2.1 1.5 1.6 1.8 2.0 1.9 1.8 2.0 3.7 2.1
Growth of real primary spending (deflated by GDP deflator, in percent) 0.8 -8.2 1.9 -0.5 2.8 0.4 16.2 -2.8 -2.0 0.7 -0.7 2.0 3.2 -3.5 1.0
Grant element of new external borrowing (in percent) ... ... ... … … 16.9 38.3 30.7 35.3 31.6 46.4 33.2 37.7 30.6 ...
Sources: Country authorities; and staff estimates and projections.
1/ [Indicate coverage of public sector, e.g., general government or nonfinancial public sector. Also whether net or gross debt is used.]
2/ Gross financing need is defined as the primary deficit plus debt service plus the stock of short-term debt at the end of the last period.
3/ Revenues excluding grants.
4/ Debt service is defined as the sum of interest and amortization of medium and long-term debt.
5/ Historical averages and standard deviations are generally derived over the past 10 years, subject to data availability.
Actual Projections
42
INTER
NA
TIO
NA
L MO
NETA
RY
FU
ND
DO
MIN
ICA

DOMINICA
INTERNATIONAL MONETARY FUND 43
Table A4. Dominica: Sensitivity Analysis for Key Indicators of Public Debt, Active Scenario,
2015-35 (in percent of GDP)
43
IN
TER
NA
TIO
NA
L MO
NETA
RY F
UN
D
2015 2016 2017 2018 2019 2020 2025 2035
Baseline 71 72 72 71 71 68 56 47
A. Alternative scenarios
A1. Real GDP growth and primary balance are at historical averages 71 69 67 65 64 60 44 21
A2. Primary balance is unchanged from 2015 71 68 65 61 58 53 32 -2
A3. Permanently lower GDP growth 1/ 71 73 74 74 75 74 71 91
B. Bound tests
B1. Real GDP growth is at historical average minus one standard deviations in 2016-2017 71 75 80 80 81 80 76 79
B2. Primary balance is at historical average minus one standard deviations in 2016-2017 71 74 75 74 74 71 59 48
B3. Combination of B1-B2 using one half standard deviation shocks 71 72 73 73 74 71 63 59
B4. One-time 30 percent real depreciation in 2016 71 90 89 87 86 83 67 56
B5. 10 percent of GDP increase in other debt-creating flows in 2016 71 80 80 79 79 76 64 52
Baseline 158 163 168 168 170 166 139 124
A. Alternative scenarios
A1. Real GDP growth and primary balance are at historical averages 158 155 155 152 152 145 109 55
A2. Primary balance is unchanged from 2015 158 153 149 143 138 128 78 -6
A3. Permanently lower GDP growth 1/ 158 165 172 174 179 178 174 237
B. Bound tests
B1. Real GDP growth is at historical average minus one standard deviations in 2016-2017 158 168 183 187 193 193 186 205
B2. Primary balance is at historical average minus one standard deviations in 2016-2017 158 166 175 175 177 173 146 127
B3. Combination of B1-B2 using one half standard deviation shocks 158 162 169 171 175 173 156 155
B4. One-time 30 percent real depreciation in 2016 158 203 206 205 207 200 164 146
B5. 10 percent of GDP increase in other debt-creating flows in 2016 158 180 185 185 188 184 157 137
Baseline 22 18 23 20 22 23 25 13
A. Alternative scenarios
A1. Real GDP growth and primary balance are at historical averages 19 17 22 19 22 22 21 9
A2. Primary balance is unchanged from 2015 19 17 22 18 21 22 19 5
A3. Permanently lower GDP growth 1/ 19 17 23 20 23 24 25 21
B. Bound tests
B1. Real GDP growth is at historical average minus one standard deviations in 2016-2017 19 17 24 20 24 25 26 19
B2. Primary balance is at historical average minus one standard deviations in 2016-2017 19 17 23 19 22 23 23 14
B3. Combination of B1-B2 using one half standard deviation shocks 19 17 23 20 23 24 24 16
B4. One-time 30 percent real depreciation in 2016 19 20 28 24 28 28 29 20
B5. 10 percent of GDP increase in other debt-creating flows in 2016 19 17 23 20 23 23 24 15
Sources: Country authorities; and staff estimates and projections.
1/ Assumes that real GDP growth is at baseline minus one standard deviation divided by the square root of the length of the projection period.
2/ Revenues are defined inclusive of grants.
PV of Debt-to-GDP Ratio
Projections
PV of Debt-to-Revenue Ratio 2/
Debt Service-to-Revenue Ratio 2/

DOMINICA
44 INTERNATIONAL MONETARY FUND
Figure A2. Dominica: Indicators of Public Debt Under Alternative Scenarios,
2015-35 (Active Scenario) 1/
Customized scenario (low ECP) Customized scenario (low grants) Fixed Primary Balance
Sources: Country authorities; and staff estimates and projections.1/ The most extreme stress test is the test that yields the highest ratio on or before 2025.
2/ Revenues are defined inclusive of grants.
Active
Customized scenario (no adjustment)
Most extreme shock 1/
Public debt benchmark
Historical Scenario
Customized scenario (hurricane in 2018)
-100
0
100
200
300
400
500
600
2015 2017 2019 2021 2023 2025 2027 2029 2031 2033 2035
PV of Debt-to-Revenue Ratio 2/
-50
0
50
100
150
200
2015 2017 2019 2021 2023 2025 2027 2029 2031 2033 2035
PV of Debt-to-GDP Ratio
0
10
20
30
40
50
60
70
80
2015 2017 2019 2021 2023 2025 2027 2029 2031 2033 2035
Debt Service-to-Revenue Ratio 2/

DOMINICA
INTERNATIONAL MONETARY FUND 45
Annex II. External Sector Assessment
Dominica’s external position in 2015 is assessed to be weaker than the level consistent with medium-term fundamentals and desirable policy settings. Achieving a strong and sustainable external sector requires policies and structural reforms over the medium term particularly geared at increasing external competitiveness. Reserves are assessed to be adequate and sufficient to absorb most shocks.
The decline in oil prices, higher than expected tourism receipts and increased inflows of private remittances offset the decline in exports and the increase in imports for reconstruction material following the damages caused by Tropical Storm Erika last August. These developments improved Dominica’s current account to a deficit of 9.4 percent of GDP in 2015 from an 11.2 percent of GDP deficit the previous year. 1 Given the forecast for higher imports for reconstruction activity, the REER appreciation and a no-policy change scenario, the current account would worsen in the medium term.
A. Nominal and Real Effective Exchange Rate Assessment
Dominica’s nominal effect exchange rate (NEER) appreciated by 7.6 percent on average in 2015 mainly because of the strengthening of the U.S. dollar to which the EC dollar, the regional currency, is pegged. Further appreciation could continue in the near future should relatively stronger growth and higher interest rates in the United States cause the U.S. dollar to strengthen. In comparison the CPI based real effective exchange rate (REER) appreciated by 4.8 percent during the same period and its end-December 2015 index was 99.2 relative to the January 2010 base. Measures of the REER in tourism-competitor Caribbean countries suggest a mild deterioration of about 1 percent in Dominica’s competitiveness since June 2015. The recovery in manufacturing and food production following damages sustained from Tropical Storm Erika as well as low energy prices should marginally reduce the headline price level in Dominica in 2016.
1 The BOP data for 2014 was revised by the Eastern Caribbean Central Bank and Dominica’s Statistical Office the National of Trinidad and Tobago (CBTT) to reflect the improved estimation of (i) tourism expenditure, which was previously based on outdated estimates, (ii) transactions by offshore universities and (iii) private remittances. The current account deficit in 2014 has improved from -13.1 percent of GDP to -11.2 percent of GDP. The new data are incomplete. Further improvements in BOP estimation is expected, particularly to FDI and Portfolio flows, as the statistical agencies make progress in BOP compilation using BPM6 methodologies. The revisions could be finalized by the fourth quarter of 2016. CARTAC’s technical assistance in 2015 and early 2016 has been instrumental in these developments.

DOMINICA
46 INTERNATIONAL MONETARY FUND
B. External Stability Assessments
Two of the quantitative estimates of Dominica’s external position suggest that it is weaker
than the level consistent with medium-term fundamentals and desirable policy settings.
Drawing on the EBA-Lite regression model (after adjusting the results to account for
Dominica-specific factors) staff assesses the cyclically-adjusted current account balance and
cyclically-adjusted current account norm to be -7.8 percent of GDP and -3.4 percent of GDP,
respectively in 2015. The resulting current account gap is -4.4 percent of GDP. Macroeconomic
policies contributed -0.2 percent of GDP to the gap. Fiscal policy gaps in other countries contributed
-0.9 percent of GDP while reserve adequacy and private credit gaps jointly accounted for 0.8 percent
of GDP. The remaining gaps would need to be closed by structural policies to improve
competitiveness over the medium term.
The EBA-Lite methodologies suggest a
wide range of Real Effective Exchange Rate
(REER) gap estimates. The Current Account
regression estimates a REER adjustment of 17.3
percent would be needed to close the current
account gap of -4.4 percent of GDP using a
standard elasticity. The Index REER regression
uses the REER from the INS database and
includes policy and fundamental variables that
would affect the REER directly or indirectly,
through changes to the current account balance
indicates. This approach indicates that the REER
gap is -1.6 percent (undervalued) and that it is
broadly in line with its estimated current account
norm.
The external sustainability approach sets a medium-term current account norm at the level
that would bring net foreign assets-to-GDP to zero in ten years, by end-2025. On this basis, the
estimated norm is a deficit of 6.3 percent of GDP, compared to the underlying current account
CA Model ES Approach I-REER Model
CA Actual -9.4 -9.4
Cyclically Adjusted CA -7.8 -9.7
Cyclically Adjusted CA Norm -3.4 -6.3
CA Gap -4.4 -3.4
Of which: Policy Gap
Fiscal Policy -0.9
Private Credit 0.3
Change in Reserves 0.5
Capital Controls -0.1
Residual -4.2
Real Exchange Rate Gap1
17.3 13.2 -1.6
Source: IMF staff estimates.
1/ Data reflect percentage over or under valauation. Positive numbers indicate that REER
is overvalued and negative numbers indicate that the REER is undervalued.
Current Account and Real Exchange Rate Assessments
(In percent of GDP)
80
90
100
110
120
130
2012 2013 2014 2015 2016
Average, Tourism-Based Economies Ex. Dominica
Average, Commodity Exporters
Dominica
Real Effective Exchange Rates
(Indexes, January 2012 = 100)
Sources: INS and IMF staff calculations.
Range of Caribbean
Economies90
95
100
105
110
115
120
125
2010 2011 2012 2013 2014 2015 2016
Dominica REER
Dominica NEER
United States REER
Nominal and Effective Exchange Rates
(Indices January 2010 = 100)
Source: INS and IMF staff calculation

DOMINICA
INTERNATIONAL MONETARY FUND 47
forecast of a deficit of 8.5 percent of GDP over the 10-year period. A REER adjustment of 13.2 percent would be needed to close the current account gap.
C. Reserve Adequacy
Dominica’s reserve position improved in 2015. Dominica is a member of the Eastern Caribbean Currency Union. Under the quasi-currency board arrangement foreign assets and liabilities of the Eastern Caribbean Central Bank (ECCB) cannot be directly assigned to an individual country. The imputed reserves method is used as a proxy for net foreign assets held with the ECCB. 2 At US$125 million, Dominica’s imputed reserves at end-2015 covered 5.6 months of imports (forward cover) and 26 percent of broad money exceeding the typical benchmarks of reserve adequacy such as 3 months of imports and 20 percent of broad money, respectively.3,4 In the active scenario, reserve levels are expected to marginally decline to 4.9 months of imports through 2021 but are adequate for cushioning external shocks and preventing disorderly market conditions.5
D. Conclusion
Dominica’s external position in 2015 is assessed to be weaker than the level consistent with medium-term fundamentals and desirable policy settings. Notwithstanding the adequate foreign exchange reserves, staff estimates that the external position would weaken over the medium and growth would remain sub-optimal. Fiscal consolidation aiming for a small primary surplus over the medium term while providing space for infrastructure spending to ease supply bottlenecks would improve the current account position and help stabilize reserves. Supportive structural reforms - improving labor productivity, reducing the electricity costs, increasing access to finance as well as reforms to promote the business environment - are also needed to boost productivity, improve competitiveness and prospects for export diversification.
2 The computation of the imputed reserves of the individual ECCB member countries are the differences between the assets held by the member countries with the ECCB and the liabilities of the member countries to the ECCB.
3 IMF 2015, Assessing Reserve Adequacy –Specific Proposals. Reserve adequacy assessments for currency unions should consider the reserve needs of the consolidated union level. This should be supplemented by a discussion of factors that have a bearing on the size of reserves, such as the union’s financial architecture and supportive institutions, and the correlation of shocks faced by union members. 4 Information on short term debt and other liabilities is unavailable and consequently assessments against other reserve adequacy metrics such as the IMF’s composite Assessment Reserve Adequacy (ARA) metric cannot be computed.
5 This assessment does not consider the need for additional buffers to deal with significant natural disasters.
0
20
40
60
80
100
120
140
2000 2002 2004 2006 2008 2010 2012 2014 2016 2018 2020
Net Imputed International Reserves
3 months Imports
20% of Broad Money
Net Imputed International Reserves and Reserve Metrics(US$ millions)
Sources: Eastern Caribbean Central Bank and IMF staff calculation.

DOMINICA
STAFF REPORT FOR THE 2016 ARTICLE IV
CONSULTATION—INFORMATIONAL ANNEX
Prepared by
Western Hemisphere Department
(In consultation with other departments)
FUND RELATIONS _____________________________________________________________________ 2
RELATIONS WITH THE WORLD BANK _______________________________________________ 7
RELATIONS WITH THE CARIBBEAN DEVELOPMENT BANK (CDB) _________________ 10
STATISTICAL ISSUES _________________________________________________________________ 12
CONTENTS
June 22, 2016

DOMINICA
2 INTERNATIONAL MONETARY FUND
FUND RELATIONS
(As of March 31, 2016)
Membership Status Joined 12/12/78; Article VIII
General Resources Account SDR Million Percent of Quota
Quota 11.5 100.00
Fund holdings of currency 11.49 99.93
Reserve Tranche Position 0.01 0.08
SDR Department SDR Million Percent of Allocation
Net cumulative allocation 7.84 100.00
Holdings 0.62 7.91
Outstanding Purchases and Loans: SDR Million Percent of Quota
RCF Loans 8.20 71.30
ESF RAC Loan 2.30 19.97
ECF Arrangements 0.35 3.03
1/ Emergency Assistance may include ENDA, EPCA, and RFI.
Latest Financial Arrangements:
Type Approval
Date
Expiration
Date
Amount
Approved
Amount Drawn
(SDR Million)
ECF 12/29/03 12/28/06 7.69 7.69
Stand-By 08/28/02 01/02/04 3.28 2.97
SAF 11/26/86 11/25/89 2.80 2.80
Projected Payments to the Fund (SDR Million):1/
Forthcoming
2016 2017 2018 2019 2020
Principal 0.68 0.86 1.07 1.07 0.41
Charges/Interest 0.00 0.01 0.01 0.01 0.00
Total 0.68 0.87 1.07 1.07 0.41
1 Based on existing use of resources and present holdings of SDRs.

DOMINICA
INTERNATIONAL MONETARY FUND 3
Exchange Rate Arrangement: Dominica is a member of the Eastern Caribbean Currency Union, which
has a common central bank, the Eastern Caribbean Central Bank, and currency, the Eastern Caribbean
dollar. Since July 1976, the Eastern Caribbean dollar has been pegged to the U.S. dollar at the rate of
EC$2.70 per U.S. dollar. Dominica has accepted the obligations of Article VIII, Sections 2, 3, and 4.
Dominica maintains an exchange system free of restrictions on the making of payments and transfers
for current international transactions.
Safeguards Assessment: Under the Fund's safeguards policy, the Eastern Caribbean Central
Bank (ECCB) is subject to a full safeguards assessment on a four-year cycle. An update
assessment was completed in April 2016 and found that the ECCB has maintained generally
strong controls over its key operations. External audit and financial reporting practices remain
sound. The ECCB financial statements are compliant with International Financial Reporting
Standards and are published on a timely basis. The internal audit function needs to be reformed
to align it with leading international practices and oversight could be further strengthened by
enhancing the financial expertise of the audit committee.
Article IV Consultation: The last Article IV consultation was concluded by the Executive Board
on June 6, 2015; the relevant document is IMF Country Report no. 15/31. Dominica is on a 12-
month cycle.
Technical Assistance: Dominica has received significant technical assistance from Caribbean
Regional Technical Assistance Center (CARTAC) and the IMF. Technical assistance missions
focused on tax reform, revenue administration, expenditure rationalization, financial sector, and
Public Financial Management (PFM):1/
1/The most recent assessment of Dominica’s AML/CFT regime has been conducted by the Caribbean
Financial Action Task Force (CFATF) in 2008.
PFM Missions
June 2013 (CARTAC): Deliver workshop on cash flow forecasting and planning
November 2013 (CARTAC): Restructure cash flow unit and continue to build capacity
and expertise in bank reconciliation
January 2014 (CARTAC): Investigate and resolve data integrity issues with Smart-
Stream
January 2014 (CARTAC): Wrap up bank reconciliation and ascertain further needs
March 2014 (CARTAC): Work with M. Smith to review Dominica
March 2014 (CARTAC): Follow-up on earlier TA on bank account reconciliation
March 2014 (CARTAC): Introduce new Adviser
March 2014(CARTAC): Assist authorities to build capacity for new Procurement staff
April 2014 (CARTAC): Assist Dominica procurement in continuing to navigate and
implement action plan

DOMINICA
4 INTERNATIONAL MONETARY FUND
May 2014 (CARTAC): Finalize implementation of updated automated bank
reconciliation software
July-August 2014 (CARTAC): Assist in closure of 2013/14 financial year and carry
forward un-reconciled bank reconciliation discrepancies
September 2014 (CARTAC): Assist with planning of 2015/16 budget and develop draft
budget call circulars
October 2014 (CARTAC): Examine and provide recommendations to strengthen
oversight and monitoring of SOE’s
February 2015 (CARTAC): Undertake a gap analysis of the Internal Audit systems
March 2015 (CARTAC): Deliver presentations and hold discussions on redraft of PFM
Legislation
March 2015 (CARTAC): Provide TA to Budget Department with the revised budget
process and develop Cabinet Decision Table
March 2015 (CARTAC): Develop Concept Note for undertaking a PEFAQ in October
2015
Revenue Administration Missions
June 2013: Tax and Customs Administration
June 2013: Tax and Customs Administration
June 2013: To work on outline for Regional Audit Manual with STX Brian Dawe
August 2013: Assist Dominica Inland Revenue and Customs Department with their
Risk Management program (Support to SEMCAR)
September 2013: Continue to assist with IRD reorganization and capacity building in
audit
September 2013: Introductory Meetings with Senior IRD Officials; liaise with STX Dawe
on IRD reorganization
September 2013: to introduce new LTX Adviser to Senior IRD officials; liaise with STX
Dawe on IRD reorganization
October 2013: Liaise with STX Macleod on PAYE Administration support
October 2013: Deliver PAYE audit training; assist with development of Audit program
and procedures circulars
November 2013: Work at home: Development of Audit Manual
November 2013: Co-facilitate regional seminar on Tax Arrears Collections and
Enforcement

DOMINICA
INTERNATIONAL MONETARY FUND 5
November 2013: Co-facilitate the Regional Collections Enforcement Seminar for
Supervisors
November 2013: To continue to assist with IRD reorganization and capacity building in
audit
November 2013: To assist in the development and upgrade of collections enforcement
procedures
November 2013: Supporting the development of Valuation procedures and policy for
the Customs Administration
January 2014: Help design the IRD Corporate Strategic Plan
March 2014: Post Clearance Audit Training and Support to the Customs
Administration
April 2014: Extension of Tax Administration Adviser
September/October 2014: Review of Dominica Income Tax
January 2015: Building Capacity and Supporting the Establishment of the HQ Design
Monitoring and Large and Medium Taxpayer Sections (LMTS)
April 2014: Project Management Support and Building Audit Capacity – IRD
reorganization project
September 2014: To conduct Tax review
January 2015: DMS and Large and Medium Taxpayers compliance measurement
Financial Sector Supervision Missions
December 2013 (CARTAC): Insurance Supervision and Credit Union Supervision
January 2014: Follow-up mission—onsite review of offshore banks and continued
training of Supervisors
April 2014 (CARTAC): Consolidated Supervision - Training
November 2014 (CARTAC): Risk Based Supervision and Consolidated Supervision
Economic and Financial Statistics
May 2013 (CARTAC): National Accounts – Quarterly
April 2014: Joint CARTAC/STA IIP Mission
February 2015 (CARTAC): Training for Survey Respondents (ECCU Countries)
Macroeconomics and Programming Analysis
November 2013 – Needs assessment of Macroeconomic Policy Unit; create a forward
technical assistance work plan

DOMINICA
6 INTERNATIONAL MONETARY FUND
January 2014: To assist authorities with their medium-term macroeconomic framework
November 2014 – Produce framework to update macroeconomic projections on a
quarterly basis
February 2015: Technical assistance to train staff in macroeconomic and fiscal
forecasting as well as to prepare for IMF Article IV visit
FSAP: A joint IMF/World Bank team performed an assessment of the financial sector of
the member states of the ECCU, in two missions—September 1–19 and October 20–
31, 2003. The principal objective of the missions was to assist the authorities in
assessing the development needs and opportunities for the financial sector and
identifying potential vulnerabilities of financial institutions and markets to
macroeconomic shocks, as well as the risks to macroeconomic stability from
weaknesses and shortcomings in the financial sector. A detailed assessment of the
AML/CFT regimes of Dominica was conducted in September 2008 by the Caribbean
Financial Action Task Force (CFATF). The Financial System Stability Assessment (FSSA)
was discussed by the Executive Board on May 5, 2004, and subsequently published on
the IMF’s external website, including the Report on the Observance of Standards and
Codes (ROSC) on Banking Supervision.

DOMINICA
INTERNATIONAL MONETARY FUND 7
RELATIONS WITH THE WORLD BANK GROUP (As at May 2016)
World Bank Group OECS Regional Partnership Strategy: On November 13, 2014, the Board of
the Executive Directors of the World Bank Group has endorsed the new OECS Regional
Partnership Strategy (RPS) which will cover the period FY15-19. The high-level objective of the
new RPS is to contribute to lay the foundations for sustainable inclusive growth, in line with the
OECS governments’ priorities. In order to achieve this goal, the program is planned to be
organized around three main areas of engagement. Under the first one, the WBG is planning to
support “competitiveness”. Growth and job creation in the private sector will be supported both
horizontally – by improving the business environment– and vertically – by focusing on specific
sectors with a high potential to generate inclusive sustainable growth (particularly tourism,
agribusiness and their respective linkages). The second area of engagement is “public sector
modernization”, with particular focus on public financial management (PFM) and institutional
capacity, including for statistics and public private partnerships (PPPs), to better leverage private
investment in infrastructure and service provision. The third area is “resilience”, with the objective
to address both social vulnerabilities (in education, health and social protection), and exposure to
natural disasters.
Constrained in general by the small size of investments in the OECS, the IFC and MIGA will
contribute to the RPS objectives through selective investment support, depending on
opportunities. The IFC will focus on crisis response; job creation and inclusive growth; innovation,
competitiveness, and integration; and climate change. MIGA faces limited opportunities for
engagement because of the small market size of the OECS countries.
The indicative IBRD lending program for the six OECS countries is expected to be around
US$120 million, or up to a maximum of US$20 million for each OECS country for the period of
the RPS (FY15-19), subject to country and program performance, IBRD’s lending capacity, and
exposure management parameters. In addition to the IBRD envelope, four OECS countries
(Dominica, Grenada, St. Lucia, and St. Vincent and the Grenadines) can also count on an IDA
national allocation. The IDA17 (FY15-17) allocation for the OECS is equal to SDR61.3 million, an
increase of around 22 percent over the IDA16 OECS allocation (SDR50.3 million). With regard
specifically to Dominica, the IDA-17 indicative country allocation is equal to SDR14.1 million.
A. Projects
Dominica participates in only one active Bank-financed lending operation: the Regional Disaster
Vulnerability Reduction Project, which was approved by the WB Board of Executive Directors on
May 1, 2014 and declared effective on September 8, 2014. The total amount of this project is
equal to USD 38 million (of which 17 million IDA credit; and USD 12 million Grant and
USD 9 million concessional loan from the Strategic Climate Fund). The development objective of
the project is to reduce vulnerability to natural hazards and climate change impacts in Dominica
through: (i) investment in resilient infrastructure, and (ii) improved hazard data collection and
monitoring systems. The project is complex, relatively large, and requires a lot of attention by the

DOMINICA
8 INTERNATIONAL MONETARY FUND
WB team to ensure timely implementation, due to the low capacity of the country and the weak
familiarity with WB processes and procedures.
The Bank and IFC are also engaging with Dominica to provide advisory services for the
exploitation of its geothermal resources. The objective is the identification of a coordinated set of
activities where the World Bank Group could bring its global expertise in developing geothermal
renewable resources that would complement the assistance being provided by other
development partners, taking into account the Government’s priorities.
B. Non-Lending Activities
The Bank has completed a series of analytical products relating to public expenditure, fiscal and
debt sustainability, growth and competitiveness, the financial sector, public sector management
and social protection. The ongoing dissemination of these reports represents a key instrument
for policy dialogue with the OECS governments, including Dominica.
Comprehensive Debt Framework - At the request of the Heads of Government of CARICOM,
the Bank put together a Comprehensive Debt Framework that proposes a strategy for addressing
the high debt challenge faced in the OECS in a sustainable way. This Framework proposes a
holistic approach around four interdependent pillars (Supporting private sector led growth,
including private sector development and financial sector stability; Enhancing fiscal sustainability;
Improving climate change resilience and Disaster Risk Management; and Debt resolution). The
Framework has been rolled out in all the OECS, including Dominica. The Government expressed
interest in principle, in continue to work with the World Bank and other development partners to
develop policy measures that could help stimulate growth and reduce debt in the country.
The Caribbean Growth Forum (CGF)
The Caribbean Growth Forum (CGF) is a multi-stakeholder platform designed to identify,
prioritize and implement a set of activities to improve the growth enabling environment in the
Caribbean, while promoting participatory public policy making. It has so far engaged more than
2,500 representatives from business associations, civil society organizations, Government, private
sector, media, indigenous groups, and international development agencies on themes such as
Logistics and Connectivity; Investment Climate; and, Skills and Productivity.
Low growth, high unemployment, especially for youth and women, high debt ratios (eight of the
top twelve most indebted countries in the world are in Caribbean), high incidence of crime, and,
growing vulnerability to external shocks characterize the region. In the wake of the global
financial crisis, the high debt/low growth challenge has become even more acute.
A number of Caribbean countries reached out to international donors to find an innovative
approach to the growth challenge in the region. A suggestion was made to launch a genuinely
participatory growth initiative. Following consultations and some preparatory work, the program
started in mid-2012 with a regional launch event in Jamaica. The process is supported and
facilitated by the World Bank, the Inter-American Development Bank, the Caribbean
Development Bank, Compete Caribbean and the European Union.

DOMINICA
INTERNATIONAL MONETARY FUND 9
Key Outcomes
Positive outcomes are tangible: twelve countries formally joined the process by establishing their
national CGF chapter and have completed the first phase of national dialogue. This effort has led
to the prioritization of concrete and actionable activities and draft action plans are now available,
with details on each activity’ implementation plan (e.g., accountabilities, milestones, timeline,
funding).
The results of each country’s dialogue were presented at two regional forum in The Bahamas in
June 2013 and in St. Kitts and Nevis in 2014. This allowed national stakeholders from
government, private sector and civil society to compare notes on each other’s’ priorities and
exchange ideas on solutions to each identified challenges with technical specialists and peers.
The next regional forum is expected to take part in St. Lucia in mid-June 2015.
Each government involved in the CGF also committed to follow-up on implementation of the
reform agenda, to report back periodically on progress (every 4-5 months) and to enable
independent monitoring of the reforms by private sector and civil society representatives.
Financial Relations
(In millions of U.S. Dollars)
Operation
Original
Principal Available1 Disbursed1
Dominica Disaster Vulnerability
Reduction Project 38 1.58 0.73
Total 38 36.7 0.76
1/ Amounts may not add up to Original Principal due to changes in the SDR/US exchange rate since signing.
Disbursements and Debt Service (Fiscal Year)
(In millions of U.S. Dollars)
2003 2004 2005 2006 2007 2008 2009 2010 2011 2012 2013 2014 2015
Total
disbursements 2.8 3.9 1.6 0.0 1.3 1.3 0.6 1.6 0.7 0.6
0.9
0.6
0.7
Repayments 0.3 0.6 0.7 0.8 1.0 1.3 1.2 0.9 0.9 0.9 0.7 0.7 0.5
Net disbursements 2.5 3.4 0.9 -0.8 0.2 0.2 -0.6 0.6 -0.2 -0.3 0.2 -0.1 0.1
Interest and fees 0.3 0.4 0.4 0.4 0.4 0.3 0.3 0.3 0.2 0.2 0.2 0.2 0.1

DOMINICA
10 INTERNATIONAL MONETARY FUND
RELATIONS WITH THE CARIBBEAN DEVELOPMENT
BANK (CDB)
(As of May 4, 2016)
The CDB has played a significant role in Dominica’s development process. Bank support has been
provided through the provision of investment loans and technical assistance grants, as well an
economic stabilization loan during a crisis in 2003–2004. The Bank has also extensively utilized its
Basic Needs Trust Fund for poverty reduction interventions in at-risk communities. These
resources have gone towards boosting the productive capacity of the economy, strengthening
human resource development and, in particular, improving economic management systems,
expanding agricultural output, improving critical economic infrastructure, upgrading ecotourism
sites, promoting shelter development and supporting development in the territory reserved for
Dominica’s indigenous people, the Kalinago. Disaster rehabilitation works have also been a
frequent element of interventions. This is continuing with CDB support following Tropical Storm
Erika.
Total loans and grants approved over the period 1970–2015 amounted to USD272 million,
making Dominica the eighth largest beneficiary among the Bank’s 19 borrowing members. At
April 2016, CDB’s loan exposure to Dominica was approximately USD90.5 million, which
represented 5.6 percent of CDB’s total disbursed debt outstanding.
Resource flows from CDB to Dominica have fluctuated in the past ten years. Net resource flows
were negative from 2006 through 2009, reflecting some caution on the part of the Dominica
government to after a debt restructuring in 2004, particularly since efforts to maintain prudent
fiscal policies and enhance debt sustainability had been facilitated by strong inflows of grant
resources. Net resource flows were positive between 2010 and 2012, with disbursements
reflecting the implementation of key interventions programmed in CDB’s Country Strategy Paper
(CSP) for Dominica for the period 2010 to 20121. These included: a line of credit for productive
sector development and an education enhancement project. Since 2013 resource flows have
been negative, as projects neared completion. Other factors contributing to the negative outflow
are also likely to have been the authorities’ concern about ensuring fiscal sustainability given the
protracted effects of the financial crisis. With new post-Tropical Storm Erika loans agreed in 2015,
the resource flow is likely to turn positive again from 2016.
1 The Bank intends to prepare a new CSP for Dominica in 2017.

DOMINICA
INTERNATIONAL MONETARY FUND 11
Dominica: Loan Disbursement, Service and Resource Flow
(In millions of U.S. dollars)
2005 2006 2007 2008 2009 2010 2011 2012 2013 2014 2015
Net disbursement 3.8 -0.5 -1.1 -1.5 0.3 3.0 6.3 4.6 1.3 -1.0 -3.0
Disbursement 6.2 2.2 2.4 3.1 4.2 7.1 10.6 8.3 5.0 3.1 3.3
Amortization 2.4 2.8 3.4 4.7 3.9 4.1 4.3 3.7 3.6 4.1 6.2
Interest and charges 2.4 2.5 2.5 2.4 2.3 2.2 2.3 2.4 2.5 2.6 2.5
Net resource flow 1.4 -3.0 -3.6 -4.0 -1.9 0.8 4.1 2.2 -1.2 -3.6 -5.4

DOMINICA
12 INTERNATIONAL MONETARY FUND
STATISTICAL ISSUES (As of May 15, 2016)
Data provision has shortcomings due to capacity constraints in the statistical agency, including
weaknesses in coverage, accuracy, frequency, and timeliness of data. Although it is broadly
adequate for surveillance, these limitations constrain economic analysis and policy formulation.
Particularly, staff’s analysis would benefit from more timely and improved data pertaining to the
fiscal accounts, labor, agriculture, and the balance of payments. Efforts to prepare national
accounts at a quarterly frequency would also be welcome. The authorities could pursue such
improvements in a more cost-effective manner by exploring proposals to centralize statistics
collection at the regional level. Dominica participates in the General Data Dissemination System.
However, the metadata were last updated in January 2006 for the national accounts and external
sector statistics and December 2002 for the government finance statistics.
Real Sector
Nominal GDP data are compiled using the production and expenditure approaches on an annual
basis. Real GDP data are compiled only using the production approach. Since 2011, real GDP
estimates are compiled with 2006 as the new base year. GDP estimates are available about four
months after the end of the year and are usually finalized with a two-year lag. CPI data are
compiled on a monthly basis. The weights are based on the 2008/09 Household Income and
Expenditure Survey (HIES) with a base period of June 2010. There is a program to develop export
and import price indexes (XMPIs), but a shortage of staff working on price statistics limits
developments in CPI methodology and the likelihood that XMPIs will be developed in the near
future. Data on employment are sparse and there are no official data on producer prices. A
census was conducted in 2011.
Government Finance
Statistical capacity problems affect the timely production of quality government finance statistics.
Monthly data can be obtained, but they show some important shortcomings. In particular, fiscal
data should be reconciled between the Inland Revenue Department, Customs, and the Treasury
on a monthly basis. Efforts should also be directed towards reducing omissions and
misclassifications in the data, which would help reduce the need for frequent revisions. Capital
expenditure data would benefit from efforts to improve reporting and budgeting data for the
public sector investment program (e.g., project implementation rates, current expended
resources, projected resource usage, estimated completion dates, etc.), which are fragmented
and subject to continuous revisions. Attention should also be directed towards improving
statistics on the financial position of public institutions outside the central government. An
automation technology, mandatory for all ministries and suppliers of goods and services was
installed in all line ministries in 2005 and is the basis for the reporting.

DOMINICA
INTERNATIONAL MONETARY FUND 13
Although progress has been made in improving the measurement of government debt, data
show shortcomings and are not tracked continuously. Very limited financing data are available.
The authorities do not provide consolidated nonfinancial public sector data. Data for the rest of
the public sector––Dominica Social Security and the public enterprises––are obtained directly
from each entity with frequent delays and omissions. No government finance data are reported
to STA for publication in the International Financial Statistics (IFS) or the Government Finance
Statistics (GFS) Yearbook.
Monetary Statistics
Monetary statistics are compiled and reported to the Fund by the ECCB on a monthly basis
based on a standardized report adopted in 2006. The institutional coverage of monetary
statistics needs to be improved by including the accounts of mortgage companies, building
societies, credit unions, and insurance companies. The lack of published data on credit unions is
a serious shortcoming as the sector is large in Dominica. In this respect, coordination between
the ECCB and Dominica’s Financial Services Unit (which supervises financial corporations other
than those licensed under the Banking Act) could help to resolve this issue.
External Sector and the Balance of Payments
Balance of payments data are compiled by the ECCB on an annual basis and published in the IFS
through 2012. The Balance of Payments data are not produced according to the sixth edition of
the Balance of Payments Manual. External sector statistics would benefit efforts to more
accurately measure merchandise exports and resume publishing these series on a monthly basis.
Improved statistics on remittances would also be welcome. Efforts could also be directed towards
the compilation of the balance of payments on a quarterly basis and the compilation of the
international investment position on an annual basis. To this end, an external statistics expert has
been appointed by CARTAC to provide assistance to Dominica and the other ECCU members.
The authorities have received technical assistance from the Fund and are laying the groundwork
for preparing statistics on the international Investment Position.
External Debt
The ministry of finance maintains a database on public and publicly-guaranteed external loans
that provides detailed and reasonably current information on disbursements, debt service, and
debt stocks, while the Treasury maintains the data on bonds placed abroad. Data from the two
databases are not consolidated, requiring further adjustments to measure the total debt stock. In
addition, information on payments by creditor (actual and scheduled) should be available to the
compilation agencies at lease on a monthly basis, in order to produce timely debt stock data.
Data on private external debt stocks are not available, other than from the monetary survey, in
the case of the commercial banks.

DOMINICA
14 INTERNATIONAL MONETARY FUND
Dominica: Table of Common Indicators Required for Surveillance
(As of May 15, 2016)
Date of
Latest
Observation
Date
Received8
Frequency
of Data8
Frequency
of
Reporting8
Frequency
of
Publication8
Exchange Rates1 Fixed Rate NA NA NA NA
International Reserve
Assets and Reserve
liabilities of the Monetary
Authorities 1,2
12/30/2015 2/20/2015 M M M
Reserve/Base Money 2/28/2016 3/20/2016 M M M
Broad Money 2/28/2016 3/20/2016 M M M
Central Bank Balance Sheet 2/28/2016 3/20/2016 M M M
Consolidated Balance Sheet
of the Banking System
2/28/2016 3/20/2016 M M M
Interest Rates3 2/28/2016 3/20/2016 M M M
Consumer Price Index 2/28/2016 3/20/2016 M M M
Revenue, Expenditure,
Balance, and Composition
of Financing4 – Central
Government5
03/31/2016 4/20/2016 M M A
Stocks of Central
Government and Central
Government- Guaranteed
Debt6
12/31/2015 3/31/2016 M M A
External Current Account
Balance
2015 2/20/2016 A A A
Exports and Imports of
Goods and Services
2015 2/20/2016 M A A
GDP/GNP 2015 2/20/2016 A A A
Gross External Debt 2015 2/20/2016 M M A
International Investment
Position7
NA NA NA NA NA
1 Dominica is a member of the Eastern Caribbean Currency Union, in which the common currency of all member states (E.C.
dollar) is pegged to the U.S. dollar at US$1 = EC$2.70. 2 Includes reserve assets pledged or otherwise encumbered as well as net derivative positions. 3 Both market-based and officially determined, including discount rates, money market rates, rates on treasury bills, notes and
bonds. 4 Foreign, domestic bank, and domestic nonbank financing. 5 The general government consists of the central government and state and local governments. 6 Currency and maturity composition are provided annually. 7 Data is not available from the authorities. 8 Daily (D), Weekly (W), Monthly (M), Quarterly (Q), Annually (A), Irregular (I); Not Available (NA); Not Applicable (n.a.).

DOMINICA STAFF REPORT FOR THE 2016 ARTICLE IV
CONSULTATION—SUPPLEMENTARY INFORMATION
The FY2016/17 budget draft projects a deficit of 4.3 percent of GDP (staff projection is
2.4 percent of GDP). The deficit is underpinned by an unprecedented increase in public
investment for the reconstruction effort after tropical storm Erika, financed with a record
revenue projection of the Economic Citizenship Program (ECP) and an increase of
grants. Execution capacity and financing constraints, however, make it unlikely that the
FY2016/17 budget is executed as projected.
Approved By Charles Enoch
Western Hemisphere Department
July 6, 2016
DOMINICA
2 INTERNATIONAL MONETARY FUND
DRAFT BUDGET FY2016
The budget projection of revenues is optimistic, underpinned by a significant increase in ECP
revenues. Tax revenues are broadly in line with Staff estimates (Table 1). However, non-tax revenues
are significantly higher mainly as a result of the collection of ECP revenues at 11.9 percent of GDP –
which would be an historical record and an increase of 7 percent of GDP relative to FY2015/16. Non-
tax revenues are also improved by the increase of grants in support of the reconstruction effort after
tropical storm Erika. This revenue projection is highly optimistic –a significant increase in
applications has taken place but it has slowed in recent months, plus the constrains in terms of
processing capacity.1
Expenditure projections also appear optimistic given capacity constraints in the execution of
public investment. The budget proposal includes a major increase of capital spending in
FY2016/17, to 22 percent of GDP –which would be a record high for Dominica. However, achieving
this high level of execution would be very challenging, for several reasons. First, historically,
execution rates of public investment have been of around 70 percent of budget targets. Second,
capacity constraints in the administration and execution of the public investment projects is limited
–the highest investment rate in recent years has been 16 percent of GDP, and the average is closer
to 10 percent of GDP.2 Also, there is no sufficient productive capacity in Dominica (i.e. specialized
labor, machinery raw materials). The later also implies that the increase in investment would result in
inflation pressures and to private investment crowding out. Third, financing constraints could reduce
expenditure execution, especially if ECP revenues, grants, and official loans do not become available
in the amounts projected –Dominica has no access to international financial markets, and the space
for domestic borrowing is limited. Based on these reasons, staff expects lower capital expenditures
than projected in the budget.3
If the budget was executed as projected, public debt would increase to near 90 percent of
GDP, about 2 percent more than in the staff projection. This, however, is conditional on the
availability of debt financing.
1 The processing of the applications requires significant background verification and due diligence activities, which
are critical to protect the integrity of the ECP and the sustainability of this increasingly important revenue source.
2 The authorities have indicated that capacity constraints could be moderated with the hiring of external contractors.
3 The increase in capital expenditure would also result in higher expenditure in goods and services and wages
compared to staff estimates (see Table 1), although the increase in these items does not appear commensurate to
the amount of the increase of capital expenditures in the budget.
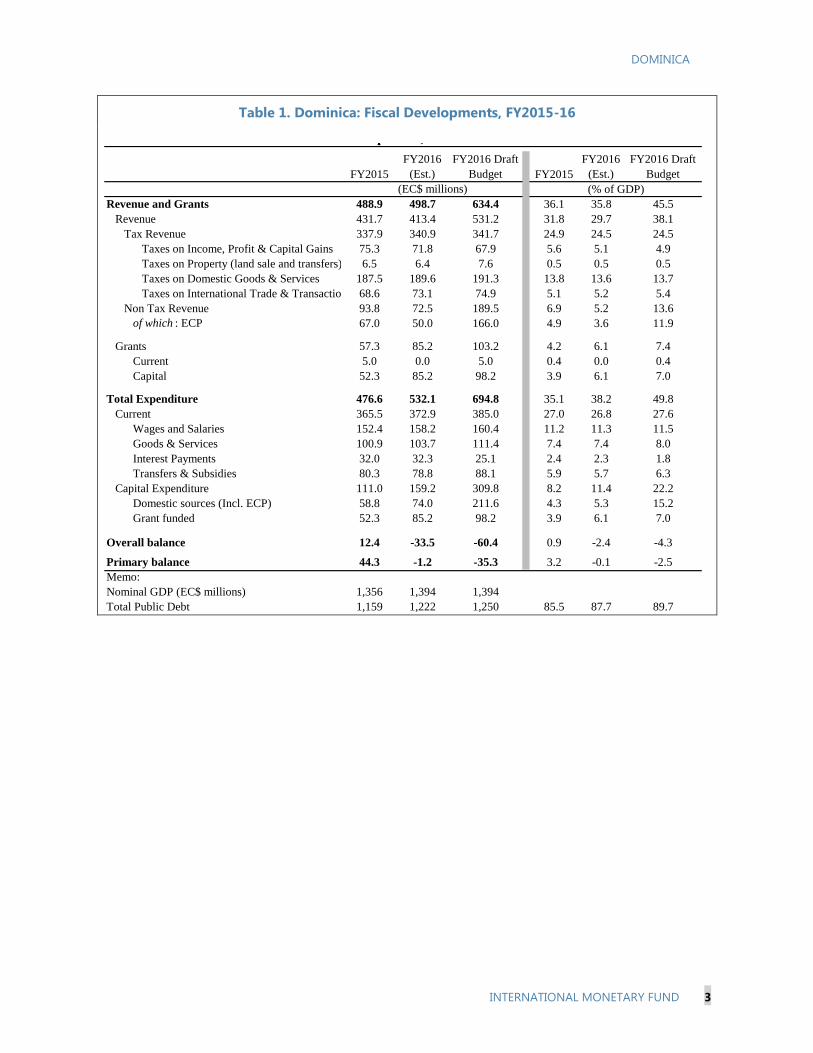
DOMINICA
INTERNATIONAL MONETARY FUND 3
Table 1. Dominica: Fiscal Developments, FY2015-16
FY2015
FY2016
(Est.)
FY2016 Draft
Budget FY2015
FY2016
(Est.)
FY2016 Draft
Budget
Revenue and Grants 488.9 498.7 634.4 36.1 35.8 45.5
Revenue 431.7 413.4 531.2 31.8 29.7 38.1
Tax Revenue 337.9 340.9 341.7 24.9 24.5 24.5
Taxes on Income, Profit & Capital Gains 75.3 71.8 67.9 5.6 5.1 4.9
Taxes on Property (land sale and transfers) 6.5 6.4 7.6 0.5 0.5 0.5
Taxes on Domestic Goods & Services 187.5 189.6 191.3 13.8 13.6 13.7
Taxes on International Trade & Transactions 68.6 73.1 74.9 5.1 5.2 5.4
Non Tax Revenue 93.8 72.5 189.5 6.9 5.2 13.6
of which : ECP 67.0 50.0 166.0 4.9 3.6 11.9
Grants 57.3 85.2 103.2 4.2 6.1 7.4
Current 5.0 0.0 5.0 0.4 0.0 0.4
Capital 52.3 85.2 98.2 3.9 6.1 7.0
Total Expenditure 476.6 532.1 694.8 35.1 38.2 49.8
Current 365.5 372.9 385.0 27.0 26.8 27.6
Wages and Salaries 152.4 158.2 160.4 11.2 11.3 11.5
Goods & Services 100.9 103.7 111.4 7.4 7.4 8.0
Interest Payments 32.0 32.3 25.1 2.4 2.3 1.8
Transfers & Subsidies 80.3 78.8 88.1 5.9 5.7 6.3
Capital Expenditure 111.0 159.2 309.8 8.2 11.4 22.2
Domestic sources (Incl. ECP) 58.8 74.0 211.6 4.3 5.3 15.2
Grant funded 52.3 85.2 98.2 3.9 6.1 7.0
Overall balance 12.4 -33.5 -60.4 0.9 -2.4 -4.3
Primary balance 44.3 -1.2 -35.3 3.2 -0.1 -2.5
Memo:
Nominal GDP (EC$ millions) 1,356 1,394 1,394
Total Public Debt 1,159 1,222 1,250 85.5 87.7 89.7
Dominica: Fiscal Developments, FY 2015-16
(% of GDP)(EC$ millions)

Statement by Mr. James Haley, Executive Director for Dominica
and Messrs. Michael McGrath, Alternate Executive Director, and Niall Feerick, Advisor to
the Executive Director
July 13, 2016
Introduction
On behalf of our authorities in Dominica, we welcome the staff report and the ongoing
constructive engagement. Our authorities are in broad agreement with staff on the content and
magnitude of challenges facing the country – the need to reduce the debt burden, massive
infrastructure reconstruction requirements, and a need to diversify the economy and ensuring that
growth is inclusive. While there is a shared recognition of the challenges, there are, as would be
expected, some nuanced differences of views on certain issues.
Background
At the outset, it is worth reiterating the devastating impact of Storm Erika in 2015, which
overarches all discussions. This storm of historic proportions resulted in the loss of human life
and displaced a significant portion of the population of Dominica. The economic cost of the
storm is estimated to have totaled 96 percent of GDP damage to the country, with two thirds of
that cost to be borne by the government. Economic growth contracted by nearly 4 percent last
year and the recovery, which is underway, is now projected to be more gradual than initially
expected.
Our authorities would like to again acknowledge the contribution made by the IMF in the
provision of the RCF (about 2 percent of GDP) which supported some immediate financing
needs. Given the scale of the necessary reconstruction and the domestic fiscal constraints, grants
were expected to fund a substantial part of the reconstruction. It is fair to say that grants have not
been as forthcoming as expected and we would ask Directors to relay a request for favorable
consideration to their authorities. Moreover, given the scale of the challenges, there is also a case
to be made for debt forgiveness / debt restructuring to be part of the toolkit to address
Dominica’s longer term sustainability. Our authorities welcome the role played by the Fund in
advocating debt restructuring for Dominica at the Paris Club.
The staff report notes that the government’s policy response since Erika has been broadly
appropriate and has helped to restore normality to daily lives of its citizens. This response
included the provision of emergency accommodation and social protection schemes to the
displaced, as well as the rebuilding of necessary infrastructure. Specifically, primary roads are
once again accessible, the main airport is now fully operational – key to reviving the important
tourist industry - while electricity generation, water and telecommunication services have been
restored. These are important and necessary first steps in the rebuilding of the country’s

2
infrastructure. Importantly, these measures have been coupled with a targeted fiscal
consolidation to underpin the sustainability of the public finances.
Fiscal Situation
Under the RCF agreed last year, Dominica agreed to pursue a fiscal adjustment package of 0.5
percent of GDP in 2015/2016. What actually has been implemented is a suite of measures which
are estimated to deliver a package of 0.7 percent of GDP, primarily composed of increases in
excise taxes, user fees and enhanced collection of tax arrears. With regard to the forthcoming
Budget, likely to be published in late July, the authorities are again targeting an over
performance relative to their RCF commitments. In conjunction with this appropriate focus on
consolidation, the Budget will not neglect the importance of the denominator for debt, with
targeted initiatives in high value added sectors such as tourism and agriculture. The forthcoming
Budget, coupled with technical assistance requests for implementation of structural fiscal
reforms, underscores the authorities’ commitment to ambitious, but necessary fiscal repair to
ensure the sustainability of the public finances.
Notwithstanding this commitment, it is clear that there are risks and challenges to fiscal
sustainability. The staff report correctly highlights the importance of donor grants on debt
sustainability. Indeed, the text box on page 9 exemplifies this better than words. If grants are 30
percent lower than expected, debt will increase and remain above 90 percent in the period to
2030. This compares to the active policies scenario, where debt is expected to fall towards the 60
percent of GDP threshold for ECCU members over the same period.
We note that as a result of a reclassification of petrocaribe debt, that Dominica’s debt-to-GDP
ratio was revised up by some 9 percentage points to 86 percent of GDP. This is higher than
originally envisaged under the RCF. While the overarching goal of returning debt to the 60
percent of debt-to-GDP threshold remains an anchor for fiscal policy over the longer term, our
authorities agree with staff, that it would be unwise to alter, at this point, the medium-term
consolidation plan in response to this statistical change given the pressing reconstruction, social
and economic needs.
There is an acknowledgement amongst our authorities that there are limited, if any, fiscal buffers
to cope with another natural disaster. Some of the ideas discussed during the Mission have
already been put in train. For example, given the prevalence and predictability of natural
disasters, it is envisaged that a savings fund be established to provide for future reconstruction
costs. Staff suggest that this savings fund could be resourced from ECP revenues, which given
their unpredictable nature, may be a sensible strategy. On this particular point, the authorities
wish to point out that they have increased staffing in the CBI Office and enhanced the robustness
of the processes. While the exact modalities for the establishment of such a fund remain unclear,
the selected issues paper is instructive in terms of funding structure. It should also be noted that

3
the Dominican authorities have requested Fund Technical Assistance to ensure the envisaged
savings fund benefits from international best practice.
Economic Growth
In terms of the economic outlook, short-term prospects are driven by reconstruction efforts with
a return to potential growth of around 1¾ percent over the medium term. Given the size of the
economy, it is quite clear that discrete developments in individual sectors can have material
impact on the potential growth rate of the economy. Indeed, staff acknowledge the significant
upside potential from tourism. In this regard, it is encouraging to note that developers
representing Kempinski, Hilton and Marriott have been discussing potential ventures in
Dominica.
It is important to note that our authorities are continually scanning the horizon to deliver a more
balanced and equitable growth model. The 2014-2018 Growth and Social Protection Strategy
identified key areas for growth and policy levers which can be used to deliver a successful
outcome. Core to this strategy is the primacy of the private sector in driving growth. A large
number of these strategies dovetail with the recommendations in the staff report for improving
the business environment, such as reducing the administrative burden on registering property,
and improving the insolvency regime. Something we would draw attention to is the recent
upgrade of the Online Business Registry as part of the Business Entry Reform Project, in
partnership with the World Bank. Indeed, Dominica is the first country in the Caribbean to have
online business registry which will make applying to set up a business more efficient and
cheaper. This is but one example of the continuous structural improvements being made in
incentivizing private sector investment. More generally, our authorities are in broad agreement
with the policy proposals from staff regarding enhancing potential growth and will study the
advice of Fund staff with due consideration.
Data
The provision of quality policy advice is dependent on reliable data on which to base analysis.
Despite best efforts, this is not presently the case in Dominica and our authorities recognize that
there are deficiencies. Given limited capacity, the authorities have requested Fund TA to enhance
statistical data collection and analysis.
Financial Sector
With regard to the financial sector, it is fair to say that the performance and outlook is mixed. On
the plus side, the authorities, including the ECCB, have undertaken a series of regulatory reforms
which will enhance the stability and resilience of the sector. The recent ECAMC Act provides
extraordinary powers to resolve non-performing loans. However, as in any other jurisdiction,
there is a delicate balancing act between loan workouts, write downs and potential

4
recapitalization of banks. Separately, staff point to the deposit floor as a barrier to bank
profitability. While noting staff’s views, this issue goes beyond our authorities’direct purview
given that the monetary policy stance is decided by the Monetary Council of the ECCU and
should be framed in the context of the ECCU Article IV.
On the remit of the Agricultural, Industrial and Development Bank (AIDB), our authorities have
a slightly different take than staff and consider that the AIDB is fulfilling a vital market function
by providing low-cost credit to targeted sectors which have limited scope to access credit from
the commercial banks or the Credit Unions. We welcome the interesting selected issues paper on
the Credit Union sector and note the findings. It is clear that the Credit Union sector is growing
in importance with regard to financial intermediation and is, given its interconnectedness with
the banking system, macrocritical. Our authorities, are continuing the efforts to enhance the
capacity of the FSU to regulate and supervise the sector.
As with the rest of the region, the potential loss of important correspondent banking relationships
(CBRs) is a significant concern to our authorities. Given the capacity constraints faced by the
administration, appropriate technical assistance has been requested to ensure that AML/CFT
legislation is amongst best in class. As this Chair has noted before, this is a necessary but not
sufficient condition to ensure the maintenance of CBRs. We would encourage the Fund to play a
leading role in conducting research to understand the underlying causes and designing solutions
to resolve the issues associated with the loss of CBRs
Conclusion
While the task ahead is substantial and challenging, rehabilitation is not optional. The resolute
actions taken by the government outlined earlier in this statement show the seriousness with
which they regard fiscal sustainability. They have requested and received technical assistance
while also seeking to overachieve commitments under the RCF to convince partner countries and
institutions of their intent to adopt appropriate and prudent policies. Our Dominican authorities
remain committed to pursuing polices that will put debt on the right path, strengthen financial
stability and encourage economic growth in an equitable manner. Finally, the authorities also
wish to place on record their appreciation for the extensive TA that they have received and to
express thanks to the mission chief in particular for his support, guidance and collaboration.