IMAS-Fish: Integrated Management System to support the sustainability of Greek Fishery resources
10
Medit. Mar. Sci., 14/1, 2013, 109-118 109 IMAS-Fish: Integrated Management System to support the sustainability of Greek Fishery resources. A multidisciplinary web-based database management system: implementation, capabilities, utilization and future prospects for fisheries stakeholders S. KAVADAS 1 , D. DAMALAS 1,5 , S. GEORGAKARAKOS 3 , C. MARAVELIAS 1,2 , G. TSERPES 4 , C. PAPACONSTANTINOU 1 and G. BAZIGOS + 1 Institute of Marine Biological Resources, Hellenic Centre for Marine Research, Agios Kosmas, Hellinikon, 16777, Athens, Greece 2 Department of Ichthyology and Aquatic Environment, School of Agricultural Sciences, University of Thessaly, Fytokou str., 384 46, Nea Ionia, Volos, Greece 3 Department of Marine Science, University of the Aegean, University Hill, 81100, Mitilene, Greece 4 Institute of Marine Biological Resources, Hellenic Centre for Marine Research, Former American Base of Gournes, 71500 Gournes Crete, Greece + deceased 5 Maritime Affairs Unit, Institute for the Protection and Security of the Citizen (IPSC), Joint Research Centre (JRC), European Commission, via E. Fermi 2749, I-21027, Ispra (VA), Italy Corresponding author: [email protected] Received: 11 October 2011; Accepted: 16 November 2012; Published on line: 4 March 2013 Abstract This article describes in detail the “IMAS-Fish” web-based tool implementation technicalities and provides examples on how it can be used for scientific and management purposes, setting new standards in fishery science. “IMAS-Fish” was developed to support the assessment of marine biological resources by: (i) homogenizing all available datasets under a relational database, (ii) facilitating quality control and data entry, (iii) offering easy access to raw data, (iv) providing processed results through a series of classical and advanced fishery statistics algorithms, and (v) visualizing the results on maps using GIS 1 technology. Available datasets cover among others: Fishery independent experimental survey data (location, species, catch composition, biological data); Commercial fishing activities (fishing gear, location, catch composition, discards); Market sampling data (species, biometry, maturity, ageing); Satellite derived ocean data (Sea surface temperature, Salinity, Wind speed, Chlorophyll-a concentrations, Photosynthetically active radiation); Oceanographic parameters (CTD 2 measurements); Official national fishery statistics; Fishing fleet registry and VMS 3 data; Fishing ports inventory; Fishing legislation archive (national and EU); Bathymetry grids. Currently, the homogenized database includes more than 100,000,000 records. The web-based application is accessible through an internet browser and can serve as a valuable tool for all involved stakeholders: fisheries scientists, state officials responsible for management, fishermen’s cooperatives, academics, students and NGOs 4 . Keywords: Database, GIS, Fisheries Information System, management, Mediterranean. 1. Geographical Information Systems 2. Conductivity Temperature Depth 3. Vessel Monitoring System 4. Non Governmental Organizations Research Article Mediterranean Marine Science Indexed in WoS (Web of Science, ISI Thomson) and SCOPUS The journal is available on line at http://www.medit-mar-sc.net http://dx.doi.org/10.12681/mms.324 Introduction FAO defines the term ‘fishery’ as follows: “people involved, species or type of fish, area of water or seabed, method of fishing, class of boats, purpose of the activities or a combination of the foregoing features” (Grainger, 2010). Although wide, this definition does not depict the actual impact of fisheries on the global economy. Fish- ery products are consumed by billions of humans being a valuable source of protein. Before end buyers can make their choice off the shelf, a series of transactions may take place (omitted in the FAO definition); for instance: transportation (maritime, land, air); processing (canning; filleting; freezing); marketing (advertising). All these ac- tivities contribute to the development of several coastal countries as well as to the maintenance of their social and economic coherence. Additionally, fishing is one of the most energy-intensive food production methods in the world, depending almost completely on fossil fuel. In
Transcript of IMAS-Fish: Integrated Management System to support the sustainability of Greek Fishery resources

Medit. Mar. Sci., 14/1, 2013, 109-118 109
IMAS-Fish: Integrated Management System to support the sustainability of Greek Fishery resources. A multidisciplinary web-based database management system: implementation,
capabilities, utilization and future prospects for fisheries stakeholders
S. KAVADAS1 , D. DAMALAS1,5, S. GEORGAKARAKOS3, C. MARAVELIAS1,2, G. TSERPES4, C. PAPACONSTANTINOU1 and G. BAZIGOS+
1 Institute of Marine Biological Resources, Hellenic Centre for Marine Research, Agios Kosmas, Hellinikon, 16777, Athens, Greece2 Department of Ichthyology and Aquatic Environment, School of Agricultural Sciences, University of Thessaly,
Fytokou str., 384 46, Nea Ionia, Volos, Greece 3 Department of Marine Science, University of the Aegean, University Hill, 81100, Mitilene, Greece
4 Institute of Marine Biological Resources, Hellenic Centre for Marine Research, Former American Base of Gournes, 71500 Gournes Crete, Greece
+ deceased 5 Maritime Affairs Unit, Institute for the Protection and Security of the Citizen (IPSC), Joint Research Centre (JRC),
European Commission, via E. Fermi 2749, I-21027, Ispra (VA), Italy
Corresponding author: [email protected]
Received: 11 October 2011; Accepted: 16 November 2012; Published on line: 4 March 2013
Abstract
This article describes in detail the “IMAS-Fish” web-based tool implementation technicalities and provides examples on how it can be used for scientific and management purposes, setting new standards in fishery science. “IMAS-Fish” was developed to support the assessment of marine biological resources by: (i) homogenizing all available datasets under a relational database, (ii) facilitating quality control and data entry, (iii) offering easy access to raw data, (iv) providing processed results through a series of classical and advanced fishery statistics algorithms, and (v) visualizing the results on maps using GIS1 technology. Available datasets cover among others: Fishery independent experimental survey data (location, species, catch composition, biological data); Commercial fishing activities (fishing gear, location, catch composition, discards); Market sampling data (species, biometry, maturity, ageing); Satellite derived ocean data (Sea surface temperature, Salinity, Wind speed, Chlorophyll-a concentrations, Photosynthetically active radiation); Oceanographic parameters (CTD2 measurements); Official national fishery statistics; Fishing fleet registry and VMS3 data; Fishing ports inventory; Fishing legislation archive (national and EU); Bathymetry grids. Currently, the homogenized database includes more than 100,000,000 records. The web-based application is accessible through an internet browser and can serve as a valuable tool for all involved stakeholders: fisheries scientists, state officials responsible for management, fishermen’s cooperatives, academics, students and NGOs4.
Keywords: Database, GIS, Fisheries Information System, management, Mediterranean.
1. Geographical Information Systems2. Conductivity Temperature Depth3. Vessel Monitoring System4. Non Governmental Organizations
Research ArticleMediterranean Marine ScienceIndexed in WoS (Web of Science, ISI Thomson) and SCOPUSThe journal is available on line at http://www.medit-mar-sc.nethttp://dx.doi.org/10.12681/mms.324
IntroductionFAO defines the term ‘fishery’ as follows: “people
involved, species or type of fish, area of water or seabed, method of fishing, class of boats, purpose of the activities or a combination of the foregoing features” (Grainger, 2010). Although wide, this definition does not depict the actual impact of fisheries on the global economy. Fish-ery products are consumed by billions of humans being a valuable source of protein. Before end buyers can make
their choice off the shelf, a series of transactions may take place (omitted in the FAO definition); for instance: transportation (maritime, land, air); processing (canning; filleting; freezing); marketing (advertising). All these ac-tivities contribute to the development of several coastal countries as well as to the maintenance of their social and economic coherence. Additionally, fishing is one of the most energy-intensive food production methods in the world, depending almost completely on fossil fuel. In

110 Medit. Mar. Sci., 14/1, 2013, 109-118
2000, the world’s fishing fleets accounted for circa 1.2% of total global fuel consumption, corresponding to 0.67 litres of fuel per Kg of fish and shellfish landed (Tyed-mers et al., 2005). As a result, managing fisheries extends far beyond the assessment of biological resources. Now-adays, fisheries worldwide are facing sizeable declines (Worm et al., 2009) and the need for effective manage-ment seems more imperative than ever.
In the eastern Mediterranean Sea, only scant infor-mation is currently available on the state of stocks, and fishery landing trends often provide the sole indication of changes that have occurred in the past. Since 2002, a data collection scheme (Data Collection Regulation - EC, 2000; Data Collection Framework - EC, 2008) has been implemented in all European Union Member States. In the eastern Mediterranean region, however, the scheme initially only included Greece; Cyprus en-tered the scheme later on, in 2005. In addition, due to administrative impediments, no data has been collected in Greece since 2007. It was recently highlighted by the STECF EWG5 that the assessments conducted in the Greek geographical subareas (GSAs 20-22-23) are not to be considered adequate and experts were invited to par-ticipate in a working group to tackle this issue. Alongside EU data collection schemes, numerous research projects in recent years have populated the datasets with valuable new data. However, lack of continuity and compatibility among the monitoring/sampling schemes is an issue. An-other important point is the multi-specificity of Mediter-ranean fishery catches, which means that identification of ‘target’ species in a fishery is a complicated task. As a result, the availability of good quality statistics remains a weak point and is a considerable handicap for research-ers (Papaconstantinou & Conides, 2007). Furthermore, these datasets have not been used as fully as they could have been to update the perception of fishery managers. This is due to a range of data management issues, in-cluding the fact that data were withheld by individuals or by multiple organizations/institutions, which treated them as their private property. Also, such data were of-ten not in electronic format, poorly maintained, and thus difficult to access and analyze. As an example, the of-ficial database6, containing data collected under the EU data collection schemes, only contains and provides ac-cess to aggregated data; raw data are indispensable for assessing the stocks, but they are still treated as national property by each Member State. The proposed reform of the Common Fisheries Policy (EC, 2011a), above and beyond setting the application of the ecosystem-based approach to fisheries management among its basic priori-
5. Scientific, Technical and Economic Committee on Fisheries Expert Work Group http://stecf.jrc.ec.europa.eu/about-stecf
6. European Commissions Joint Research Centre (JRC) fisheries data collection web site: http://datacollection.jrc.ec.europa.eu/index.htm
ties, as the previous CFP reform did (EC, 2002), aims to bring fish stocks back to sustainable levels and to provide EU citizens with a long-term stable, secure and healthy food supply. The accomplishment of such a task is time consuming, complex, costly and requires the integration of solid scientific advice, based on thorough research in-formation. A tool to support such an integrative approach was recently developed at the Hellenic Centre for Marine Research (HCMR). This article describes in detail the “IMAS-Fish” web-based application, which: (i) homog-enizes diverse datasets on Greek fisheries under a com-mon relational database management system; (ii) offers a series of on-line fishery statistical analyses and (iii) visualizes results with a spatial context on maps through a Geographical Information System. The application can be used for scientific, management and educational pur-poses setting new standards in fishery research.
Materials and Methods
In 2003, in order to improve its existing infrastructure, upgrade support, maintenance and application develop-ment services, and meet the continuous escalating needs of individual users for more sophisticated web-based ap-plications, the Fisheries Data Centre (FDC) of HCMR de-cided to move towards the implementation of a web-based Fisheries Management application, which would connect all available fisheries-related data to a GIS component, provide statistical analyses linked to statistical packages and ultimately serve as a decision-making tool for Fisher-ies managers. Its completion required the contribution of two State Universities (University of Aegean, University of Thessaly) and three private companies (Quality & Re-liability, INFOMAP, LAMANS), all of them functioning under the supervision of HCMR, which assumed scien-tific responsibility for the project. Q&R7 was involved in database design and implementation based on Oracle 9i8. INFOMAP9 (currently part of Virtual Trip Ltd.) developed the web GIS component (in ESRI ArcIMS10) and linked it to the Oracle 9i database. INFOMAP was assisted dur-ing the final stages of implementation by Mindware Tech-nologies11. LAMANS12 was responsible for dissemination and information diffusion to the scientific community; this task was achieved by constructing and maintaining a web page dedicated to the project’s progress and participating at Symposia focusing on fisheries and marine science in general. A total of 54 persons were involved in the project work packages (35 researchers and 19 technicians). The final product was delivered at the end of 2006 and named
7. www.qnr.com.gr 8. www.oracle.com 9. www.vtrip.net 10. http://www.esri.com/software/arcgis/arcims/index.html 11. www.mindware.gr 12. www.lamans.gr
Medit. Mar. Sci., 14/1, 2013, 109-118 111
“IMAS-Fish”; it is currently accessible, for authorized us-ers, through the following web link: http://amfitrion.ncmr.gr:7778/ imasfish/index.do.
The main objectives to be accomplished were: 1. Acquire and store all fisheries relevant datasets2. Join and link the datasets under a common relational
database management system3. Link the database to a web GIS component 4. Provide a secure web based user interface5. Implement algorithms to apply classical fisheries sta-
tistical analyses6. Integrate S-Plus13 statistical package for implement-
ing advanced statistical modelling
Design, architecture and componentsImplementation required a specific combination of
hardware and software so as to ensure efficiency and maintainability. Microsoft Windows14 as well as Linux15 platforms were used concurrently. System analysis was performed by the FDC specialists with the cooperation of the Q&R system analysis team. The system was original-ly developed and tested at Q&R headquarters before be-ing transferred to the HCMR computer centre. The same procedure was followed for the web GIS component, which was initially tested at the INFOMAP data centre. Evaluation of existing datasets and algorithms in order to isolate inaccuracies and improve their quality and per-formance, as well as development of new algorithms, was carried out under the supervision of an external fish-eries statistics expert (Dr. George Bazigos) (Fig. 1). The designed architecture required a series of four servers, each dedicated to a specific task: • a Database Server, storing all available alphanumeri-
cal and spatial datasets• an Application Server, running the integrated IMAS-
Fish application • a GIS Server, serving the spatial information on the
web and, • a Backup Sever, minimizing the likelihood of data
loss The entire system consisted of the following nine sub-systems:1. Access and security 2. Data entry forms and quality control3. Fisheries statistics (classical & advanced)4. GIS5. Analysis of commercial fishing fleet 6. Legislation 7. Advanced queries 8. Integration with the S-Plus statistical package 9. National Fisheries Management System (NaFMS)
13. TIBCO Software Inc. 14. http://windows.microsoft.com/en-US/windows/home 15. www.linux.org
Each sub-system forms an independent entity; how-ever, the GIS sub-system is linked to most of the sub-systems (the first two excluded) so that spatial data can be visualized in a map context.
The Database scheme Ten major data groups were incorporated; the typology of these groups was based on a conceptual classification of relevant datasets: 1. Experimental sampling (1. Benthopelagic trawls, 2.
Pelagic trawls 3. Purse seines, 4. Hooks and Lon-glines, 5. Boat seines, 6. Static nets, 7. Large pelagic fisheries, 8. Selectivity surveys, 9. Hydroacoustic sur-veys, 10. Ichthyoplankton surveys)
2. On board sampling focusing on discards (1. Benthope-lagic trawls, 2. Purse seines, 3. Hooks and Longlines, 4. Boat seines, 5. Static nets)
3. Spatial data (1. Bathymetry and Altimetry, 2. Coast-line, 3. Lakes and Rivers, 4. Fishing statistical rectan-gles, 5. Fishing ports)
4. Fisheries statistics (1. Fishing effort, 2. Fishing zeal, 3. Landings, 4. Socioeconomics, 5. State official land-ings - NSSG16, 6. Auction fish-market landings)
5. Fleet Census (Commercial fishing fleet registry)6. VMS data (VMS tracks for vessels > 15 m of length)7. Oceanographic and Meteorological Data (1. Data log-
gers: CTD, Minilog, Scanmar, 2. Winds and Precipi-tation)
8. Satellite imagery data (1. SST17, 2. Pigments: Chl-a & PAR18)
9. Species taxonomic classification and life history data10. Legislation
Data format had to comply with the EU data col-
16. National Statistical Service of Greece (current name: Hellenic Statistical Authority, EL. STAT.): www.statistics.gr
17. Sea Surface Temperature18. Photosynthetically Active Radiation
Fig. 1: IMAS-Fish workflow diagram.
112 Medit. Mar. Sci., 14/1, 2013, 109-118
lection scheme specifications (EC, 2010) and support the execution of the Data Collection Framework (EC, 2008). Considerable time was invested in the evaluation of existing data from different sources, and also to qual-ity control. The type of errors encountered, were clas-sified in order to assist the correction process. Finally, input to the databank was filtered for data format, data limits, and missing values. Overall, implementation con-sists of 167 tables and 68 data views, including more than 100,000,000 records.
GIS implementation The first stage of development was the creation of the
appropriate base maps. During this process the following base maps were created: Hellenic coastline, neighbour-ing countries, lakes, rivers, ports, sampling stations, fish-ing statistical rectangles, depth contour lines (isobaths). The next stage was dedicated to the design of the GIS application architecture. The selected system approach was based on Three Tier Architecture. This consisted of a web server, a map server and a database server. This type of system architecture can be easily upgraded to satisfy future needs. The three tiers were:• The Web server (Windows 2000 server, Apache19, Or-
acle application server 9i, ArcIMS Servlet connector) • The Map server (Windows 2000 server, ArcIMS Map
Server)• The Data server (Windows 2000 server, ArcSDE20
Server 9.0, Oracle 9i RDBMS21)The Web Server hosts the main application and is
19. http://www.apache.org/ 20. http://www.esri.com/software/arcgis/arcsde 21. Relational Data Base Management System
responsible for diffusing the information via the inter-net. The Map Server is responsible for processing and sending the requested Geographical Information to the Web Server. The Data Server contains all the information used by the application. Some innovative features of the web GIS component were: (i) data queried using spatial tools (Geobox or click point) automatically appear in the alphanumerical query and vice versa, (ii) dynamic clas-sification of Geographical features in a web environment, (iii) dynamic depiction/presentation of graphs concern-ing areas of interest, on the map, in a web environment, (iv) connection of the statistical processing sub-system with the advanced query sub-system that enables users to visualize data, with a spatial dimension, on a map
Finally, advanced statistical analyses and modelling support was also achieved through the GIS environment. The S-Plus statistical package was linked to the Oracle 9i database (via an ODBC22 connection - see Results - Sta-tistical Analyses).
ResultsUser interface
Classic interfaceThe application had to be accessible via the internet
and allow users to query, edit, analyze and obtain data. Furthermore, it was required to provide advanced statis-tical analyses & modelling capabilities, as well as data visualization in a map context. Users were divided into groups, each one with a different level of access privi-
22. Open Data Base Connectivity
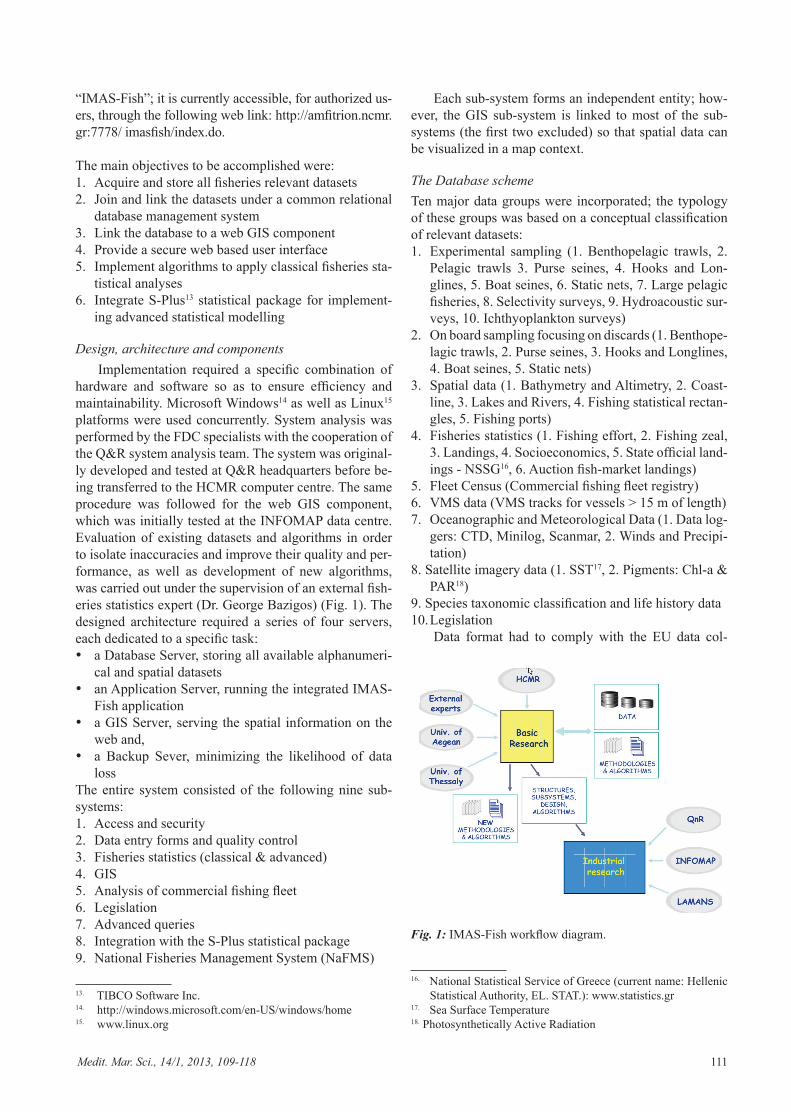
Fig. 2: IMAS-Fish initial screen upon successful log-on.

Medit. Mar. Sci., 14/1, 2013, 109-118 113
leges: Read/View, Write, and Update.The starting page of the user interface is a welcome
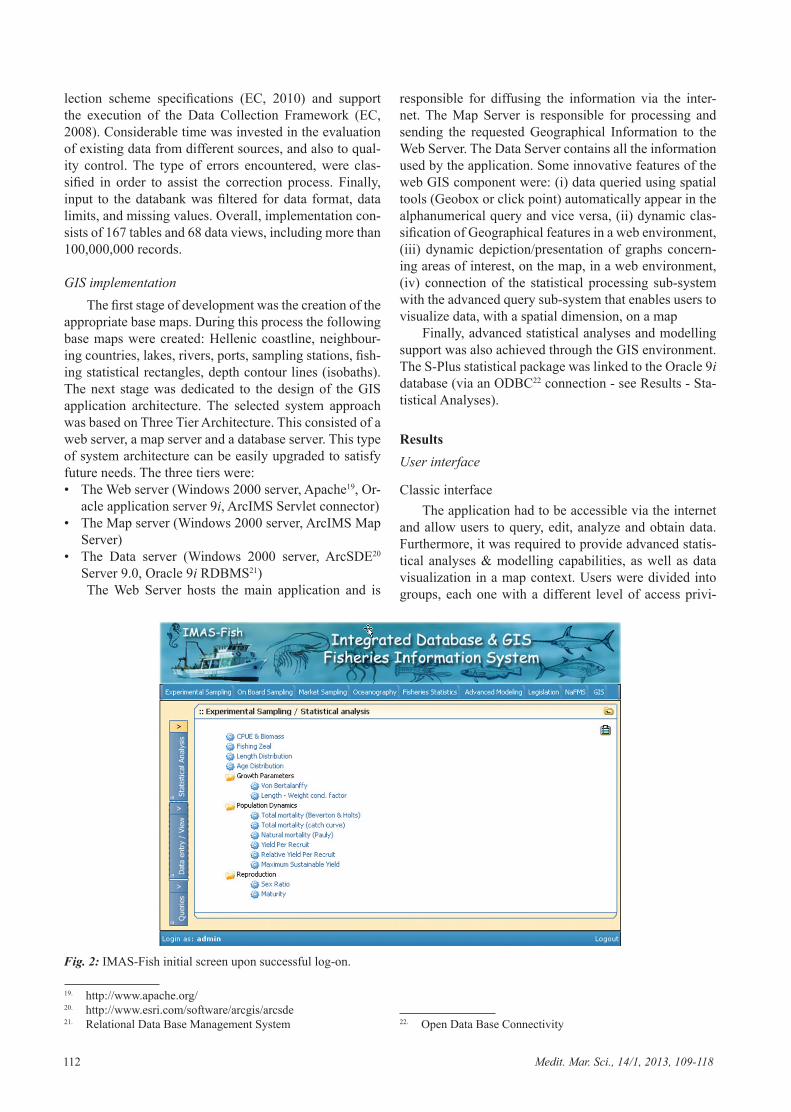
screen, which upon successful log-on redirects the user to the ‘Statistical Analyses’ page, by default (Fig. 2). Four major options are given in the left-hand side verti-cal menu (Statistical Analyses, Data Entry/View, Legis-lation, Queries). Users can make numerous combinations according to their needs. ‘Data Entry/View’ provides a series of Oracle Web-forms allowing insertion, editing, and updating of database tables (Fig. 3). ‘Legislation’ allows querying national and EU legislation for specif-ic regulations, decisions, directives, decrees, based on a list of criteria (keywords, type of legislation, region, free text). ‘Queries’ is a tool used for building queries and submitting them to the database, and extracting re-sults in various file formats. Its main component is the ‘Advanced Query’ component (Fig. 4), while the ‘Fleet analysis’ component is dedicated for querying the Fleet registry dataset.
There are eight options (tabs) in the horizontal menu located at the top of the screen (Experimental sampling, Onboard sampling, Market sampling, Selectivity, Ocea-nography, Advanced Modelling, National Fisheries Man-agement System-NaFMS, GIS). The first four are acti-vated for Statistical Analyses only. The remaining four options are realized through the GIS component.
GIS interfaceThe GIS interface design is based on a map of the
Hellenic region (terrestrial and marine). Nine options (tabs) are available in the top right of the screen (Lay-ers, Fleet Analysis, Legislation, Tasks, NaFMS, Environ-mental, Variables, Help). ‘Layers’ is activated by default,
including a series of static GIS layers: sampling stations, ports, fishing statistical rectangles, rivers, lakes, bathym-etry (isobaths by 25 m step) and land. The Toolbox on the left-hand side, allows for querying the layers using a mouse. Upon execution, all queries can be projected on any combination of existing layers. ‘Fleet Analysis’ and ‘Legislation’ form the GIS layers of the analogous com-ponents in the classical interface.
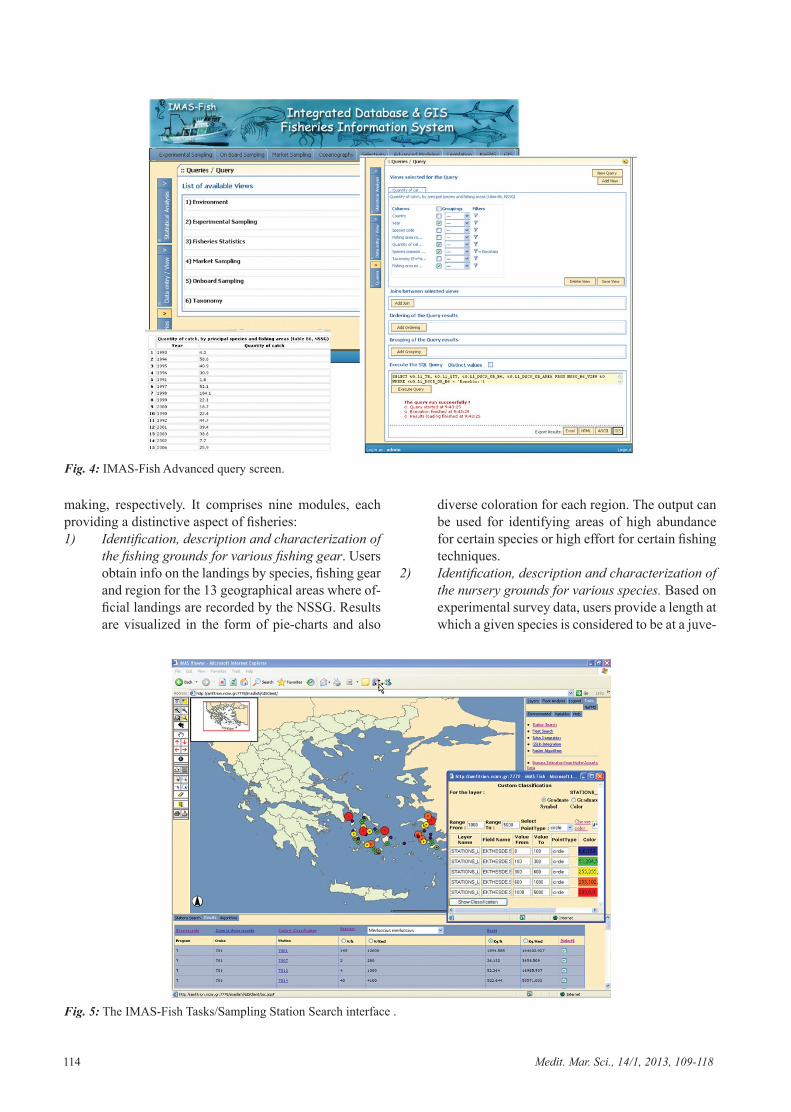
‘Tasks’ and ‘NaFMS’ are the more sophisticated ele-ments of the GIS module. ‘Tasks’, with its six sub-mod-ules (Sampling Station Search, Fishing Fleet Search, S-Plus Integration, Raster Algorithms, Biomass Estimation from Hydro-Acoustic Data), is a powerful tool for data mining, exploratory analysis and advanced modelling. ‘Sampling Station Search’ depicts, on a spatial scale, in-formation on all experimental and commercial surveys conducted. Abundance or biomass estimates for selected species are used most commonly (Fig. 5); however, it can be used in numerous other ways (e.g.: design of sampling stratification schemes by depth). ‘Fishing Fleet Search’ is the GIS version of the same classical interface module. ‘Raster Algorithms’ apply a series of environmental analy-sis algorithms (climatology, anomaly, gradient) on satellite imagery rasters, producing raster outputs for view/export. ‘Biomass Estimation from Hydro-Acoustic Data’ is a tool used for converting echo-sounder data recordings of small pelagic fish into absolute biomass estimates. ‘S-Plus Inte-gration’ is detailed in the next section (Statistical Analy-ses)..
‘National Fisheries Management System’ (NaFMS), was specifically designed to assist scientists and man-agers in the provision of scientific advice and decision-
Fig. 3: An excerpt from the IMAS-Fish Data Entry/View screen.
114 Medit. Mar. Sci., 14/1, 2013, 109-118
making, respectively. It comprises nine modules, each providing a distinctive aspect of fisheries:1) Identification, description and characterization of
the fishing grounds for various fishing gear. Users obtain info on the landings by species, fishing gear and region for the 13 geographical areas where of-ficial landings are recorded by the NSSG. Results are visualized in the form of pie-charts and also
diverse coloration for each region. The output can be used for identifying areas of high abundance for certain species or high effort for certain fishing techniques.
2) Identification, description and characterization of the nursery grounds for various species. Based on experimental survey data, users provide a length at which a given species is considered to be at a juve-
Fig. 5: The IMAS-Fish Tasks/Sampling Station Search interface .
Fig. 4: IMAS-Fish Advanced query screen.

Medit. Mar. Sci., 14/1, 2013, 109-118 115
nile stage. The proportion of juveniles by sampling location is calculated and it is depicted graphically by means of bubble plots or coloured points. The output can serve as a draft delineation of nursery grounds and indicate which areas should become a priority for further scientific study.
3) Length frequency distribution of various species and, specifically of those managed under a mini-mum landing size. Based on commercial fishery landings data, the length distribution of a certain species, caught by a certain type of fishing gear, is calculated and the minimum landing size (if exist-ent) is provided, in order to estimate the propor-tion of undersized/illegal fish landed.
4) Prohibited fishing areas as defined by depth and distance from coast, for various types of fishing gear. Based on current legislation, prohibited ar-eas for certain fishing techniques are given with shaded coloration. This module is currently imple-mented for bottom trawlers and purse seiners.
5-6-7) Spatial and Temporal distribution of fishing effort, fleet and, production.
Based on the data collected under the EU Data Collection Framework (EC, 2000; EC, 2008), fleet, effort and production temporal evolution is provided on an annual or monthly time scale. Re-sults are aggregated by region, fishing gear or spe-cies.
8) Impact of fishing gear selectivity on commercially fished populations. Parameters derived from se-lectivity experiments (L50discard: length at which 50% of the catch is discarded, SR: selection range, SF: selection factor) are given for a selected list of studied species and fishing gear.
9) Temporal variation of the most significant biologi-cal parameters for various commercially fished populations. Annual evolution for a number of significant biological parameters (Linf: asymptotic length of growth function, M: natural mortality), are given for a selected list of studied species.
Statistical Analyses
Classic statistical analyses of fisheriesA series of algorithms covering basic statistical anal-
yses of fisheries have been implemented. The sources of all algorithms were the classical textbooks of Ricker (1975), Gulland (1983), Hilborn and Walters (1992) and Quinn and Deriso (1999). All algorithms were trans-formed into code and transferred to the participating pri-vate companies responsible for software development. Some of these algorithms were already in use at the old FDC and were just re-evaluated and improved by exter-nal Fisheries experts.
The list of implemented analyses included: Catch per unit of effort (CPUE) and Biomass estimation, Length
Distribution, Age Distribution, Growth Parameters esti-mation (age & growth, length-weight factors), Population Dynamics (Total mortality, Natural mortality, Yield per Recruit, Relative Yield per Recruit, Maximum Sustain-able Yield, Virtual Population Analysis) and Reproduction (sex ratio, maturity). The analyses are accessible through the ‘Statistical Analyses’ option in the classical user inter-face (see Results - User interface). These modules cover the bulk of scientific analyses requested by the research personnel of Institutes. Many research project deliverables can be delivered directly through this interface.
Advanced ModellingBeyond simple statistical analyses, a series of other
more generic or advanced analyses may be requested, which are not limited to the narrow scope of fisheries statistics. Usually, such needs are met through the use of widely available statistical packages (commercial or open source products). During implementation, our ob-jective was to incorporate modules from independent sta-tistical packages and information libraries in the fisheries data bank and the GIS in order to support development.
These modules were: Descriptive statistics, Multi-sample comparisons, Regression (Linear), Advanced Re-gression (Generalized Linear Models, Generalized Ad-ditive Models), Artificial Neural Networks, Time Series Analysis.
The S-Plus software package is one of the most widespread statistical analysis tools worldwide. What differentiates S-Plus from other statistical analysis soft-ware and constitutes its significant advantage, is its programming capabilities, using S language (Lucent Technologies - AT&T Bell Labs). S is a programming language created exclusively to deal with problems of statistical nature. It provides a rich object-oriented envi-ronment, via a gigantic library of routines, continuously updated. The user is not limited to predetermined statisti-cal routines being “black boxes”; on the contrary, their code is accessible both for reading as for changes. The wide acceptance that S language enjoyed worldwide led to the launch of R (www.r-project.org), a free software environment for statistical computing and graphics. Cur-rently, more than 200 institutions (mainly universities) use R for their applications and allocate copious routines of statistical analysis on the internet freely. Due to the compatibility between S and R, these routines are execut-able in the S-Plus environment with minor adjustments, enabling the Advanced Modelling module to incorporate any new routine required in the future by the HCMR’s research staff.
S-Plus is called through specifically designed JSPs (Java Server Pages), translating user requests into S lan-guage scripts. Scripts are executed in real-time and results are stored in a dedicated directory on the Application Serv-er. These temporarily stored results are “on the fly” traced and served as responses to the browser (Fig. 6).

116 Medit. Mar. Sci., 14/1, 2013, 109-118
Discussion
On an international scale, the necessity for long-term data management is progressively acknowledged. In-creased availability of data over the internet is confirmed by the numerous public databases currently providing access to bio-geographic, taxonomic, biological and management information (Ocean Biogeographic Infor-mation System-OBIS: http://iobis.org/home; Fish-Base: http://www.fishbase.org; Hexacoral: http://hercules.kgs.ku.edu/hexacoral/anemone2/index.cfm; Global Man-grove Database and Information System—GLOMIS: http://www.glomis.com; Reef-Base: http://www.reef-base.org).
For fisheries, specifically, a tool named ‘FiRST’ has been launched (Garces et al., 2006). The acronym stands for Fisheries Resources information System and Tools, although often referred to as ‘TrawlBase’. It is a system for organizing, storing, retrieving and exchanging a huge amount of data from past trawl surveys carried out in the seas of Asia. The Food and Agriculture Organization of the United Nations (FAO) maintains ‘FishStat Plus’, a software application providing access to fishery statis-tics of various types to users, on a global scale (http://www.fao.org/fishery/statistics/software/fishstat/en). The French research Institute IFREMER hosts ‘ISIS-Fish’, which is a complex fishery simulator carrying out simu-lations on an embedded fisheries database (http://www.isis-fish.org/en/index.html). More recently, the Italian Ministry of Agriculture, Food and Forestry (MiPAAF) has initiated, according to Decree 479 of 24.11.2006, with the participation of numerous local academic and
research centres, the construction of a Geographic Infor-mation System, called GIS PESCA, to support decision-making in the field of marine fisheries and aquaculture. The tool was delivered in 2009 (GIS PESCA, 2009).
However, few of the aforementioned applications cover the diverse disciplines or meet the complexity of IMAS-Fish. Within the IMAS-Fish context, fisheries are combined with Oceanography, Geology, Geogra-phy, Legislation and Statistics. The spectrum of analyses spans from classic fisheries statistics to advanced model-ling techniques, all provided over the web in a GIS en-vironment.
Since 1995, the FAO Code of Conduct for Responsi-ble Fisheries urges for greater incentives to collect, store and manage reliable fishery data (FAO, 1995). In one of its reviews, the FAO-GFCM23 underlined the following: “…what is really lacking nowadays in this area is a re-gional central database system capable of incorporating what has been done…”, “…the users should find an envi-ronment where an overall facing protocol and a front-end integrated information system are fused to enable trans-fer of detailed and formatted information from the bottom to a flexible decision support system…” (Coppola, 2007). Furthermore, ‘regionalization’ is set as the cornerstone in the proposed reform package of the new EU Common Fisheries Policy (EC, 2011b). This implies that in the near future each Member State (or group of neighbour-ing Member States) will have to set up their own fisheries data storage and handling system. IMAS-Fish possesses
23. General Fisheries Commission for the Mediterranean: www.gfcm.org
Fig. 6: S-Plus integration to the IMAS-Fish Advanced modeling module.
Medit. Mar. Sci., 14/1, 2013, 109-118 117
most of the properties delineated in the aforementioned requirements and sets an example of how fisheries data can be coordinated in a way that facilitates resource man-agement, an objective that has been pursued for a long time.
Conversely, regarding the goal of FAO for effective and holistic fisheries management (Garcia et al., 2003), this application is far from achieving such an ambitious objective. Food web data and direct connections with ECOPATH24 tools would be a major future step towards realizing the ecosystem approach to fisheries manage-ment. No matter what the amount of effort that has been invested in the completion of the application, the qual-ity of the end-product is largely judged by the quality of the underlying datasets. Significant effort was devoted to checking, error-handling and ‘polishing’ the available data for inconsistencies. This work took place throughout the implementation stage and has not ended upon project completion. Maintaining and updating the datasets is a critical resource consuming task if the future needs of fisheries scientists are to be met. For instance, current legislation on fisheries (national and EU) includes a huge list of official documents with their correspond-ing headers and keywords, deterring the detailed update of the database. As a final word, certain modules were limited by currently available technology and need to be confronted in the near future when conditions are more favourable (e.g.: the ‘Raster Algorithms’ module could not be fully operational through the ESRI’s ArcIMS 9.1 version, however new GIS web Server platforms seem more promising for implementing such tasks in a web environment; the ‘Neural networks’ module in Advanced Modelling required interactive user input, not supported in this version).
IMAS-Fish strengthens the research potential of HCMR, Greece and the Mediterranean region in general, having a high scientific and administrative value. It can serve as a valuable tool for all involved stakeholders: fisheries scientists, state officials responsible for manage-ment, fishermen’s cooperatives, academics, students and NGOs. We hope that this effort will encourage or inspire other fisheries institutions to proceed in a similar way, thus leading to the creation of a network of fisheries data-bases. Uncertainties in human values, fisheries systems, and statistical methodologies will always be there to be challenged, but action needs to be taken, to enrich our imperfect knowledge.
References
Coppola, S.R., 2007. An adaptive approach for the improve-An adaptive approach for the improve-ment of fishery statistical systems in Mediterranean coun-tries. Studies and Reviews. General Fisheries Commission
24. ECOPATH with ECOSIM (EwE) is a free ecological/ecosystem modeling software suite: http://www.ecopath.org/
for the Mediterranean, No. 79. FAO, Rome, 54 pp. EC, 2000. Council Regulation (EC) No 1543/2000 of 29 June
2000 establishing a Community framework for the collec-tion and management of the data needed to conduct the Common Fisheries Policy. Official Journal of the Euro-pean Communities, L176, 1-16.
EC, 2002. Council Regulation (EC) No 2371/2002 of 20 De-cember 2002 on the conservation and sustainable exploi-tation of fisheries resources under the Common Fisheries Policy. Official Journal of the European Communities, L358, 59-80.
EC, 2008. Council Regulation (EC) No 199/2008 of 25 Febru-ary 2008 concerning the establishment of a Community framework for the collection, management and use of data in the fisheries sector and support for scientific advice re-garding the Common Fisheries Policy. Official Journal of the European Union, L60, 1-12.
EC, 2010. Commission Decision of 18 December 2009 adopt-ing a multiannual Community programme for the collec-tion, management and use of data in the fisheries sector for the period 2011-2013 (notified under document C(2009) 10121). Official Journal of the European Union, L41, 8-71.
EC, 2011a. Report from the Commission to the European Parliament, the Council, the European Economic and Social Committee and the Committee of the Regions: on reporting obligations under Council Regulation (EC) No 2371/2002 of 20 December 2002 on the conservation and sustainable exploitation of fisheries resources under the Common Fisheries Policy. COM/2011/0418 final. http://eur-ex.europa.eu/LexUriServ/LexUriServ.do?uri= CELEX:52011DC0418:EN:NOT (Accessed on 18 Feb. 2013).
EC, 2011b. Proposal for a Regulation of the European Parlia-ment and of the Council on the Common Fisheries Policy. COM/2011/0425 final - 2011/0195 (COD). http://eur-lex.europa.eu/LexUriServ/LexUriServ.do?uri=CELEX:52011PC0425:EN:NOT (Accessed on 18 Feb. 2013).
FAO, 1995. Code of Conduct for Responsible Fisheries. FAO, Rome, 41 pp. ftp://ftp.fao.org/docrep/fao/005/v9878e/v9878e00.pdf (Accessed 18 Feb. 2013).
Grainger, R., 2010. Fisheries and Aquaculture topics. History of the Coordinating Working Party. Topics Fact Sheets. In: FAO Fisheries and Aquaculture Department. FAO, Rome. http://www.fao.org/fishery/cwp/history/en (Accesed on 18 Feb. 2013).
Garces, L.R., Silvestre, G.T., Stobutzki, I., Gayanilo, F.C., Val-dez, F. et al., 2006. A regional database management sys-tem--the fisheries resource information system and tools (FiRST): its design, utility and future directions. Fisheries Research, 78 (2-3), 119-129.
Garcia, S.M., Zerbi, A., Aliaume, C., Do Chi, T., Lasserre, G., 2003. The ecosystem approach to fisheries. Issues, termi-nology, principles, institutional foundations, implementa-tion and outlook. FAO Fisheries Technical Paper, No. 443. FAO, Rome, 71 pp.
GIS PESCA, 2009. Costruzione di un sistema informativo terri-toriale (GIS) a supporto dei processi decisionali nel settore della pesca marittima e dell’acquacoltura e delle inizia-tive finanziarie ad esso collegate. Direzione Generale della Pesca e dell’Acquacoltura per la costruzione di un Sistema Informativo Territoriale (GIS). Final Report. 91 pp.
Gulland, J.A., 1983. Fish stock assessment: a manual of basic

118 Medit. Mar. Sci., 14/1, 2013, 109-118
methods. FAO/Wiley series on Food and Agriculture, Vol. 1. FAO/Wiley, Chichester, UK, 233 pp.
Hilborn, R., Walters, C.J., 1992. Quantitative fisheries stock as-sessment: choice, dynamics and uncertainty. Chapman & Hall, London, 600 pp.
Papaconstantinou, C.. Conides, A., 2007. The fisheries in the Mediterranean sea. p. 97-103. In: State of Hellenic Fisher-ies. Papaconstantinou, C., Zenetos, A., Vassilopoulou, V. Tserpes, G. (Eds). HCMR Publications, Athens, 466 pp.
Quinn, T.J., Deriso, R.B., 1999. Quantitative Fish Dynamics.
Oxford University Press, New York, 542 pp.Ricker, W.E., 1975. Computation and interpretation of biologi-
cal statistics of fish populations. Bulletin of the Fisheries Research Board of Canada, 191, 1-382.
Tyedmers, P.H., Watson, R., Pauly, D., 2005. Fueling global fishing fleets. Ambio, 34 (8), 635-638.
Worm, B., Hilborn, R., Baum, J.K., Branch, T.A., Collie, J.S. et al., 2009. Rebuilding global fisheries. Science, 325 (5940), 578-585.