Imaging spectrometer data collected over the Badakhshan area of
17
Chapter 3B. Analysis of Imaging Spectrometer Data for the Badakhshan Area of Interest By Todd M. Hoefen and Michaela R. Johnson Abstract Imaging spectrometer data collected over the Badakhshan area of interest (AOI) in northeastern Afghanistan were analyzed with spectroscopic methods to identify the occurrence of selected material classes at the surface. Absorption features in the spectra of HyMap data were compared to a reference library of spectra of known materials. The HyMap data in this AOI is limited by the northern and eastern limits of the dataset. Thus, less than one-half of the AOI has HyMap coverage. The presence of abundant dry vegetation, which has masked the surficial minerals in a significant and geologically important part of the area, have reduced the utility of the hyperspectral data for overall site characterization in the Badakhshan AOI. Carbonates, muscovite, illite, and vegetation cover most of the region. Distinct patterns of chlorite or epidote, muscovite, illite, dolomite, and serpentine occur in localized patterns throughout. Many of the faulted areas in the region have associated dolomite, epidote or chlorite, and serpentine. In the iron-bearing map, vegetation covers much of the surface mineralogy. Fe 2+ Fe 3+ Type 2, epidote, and Fe 3+ Type 1 are found in concentrations throughout most of the southwestern region of the AOI. It should be noted that the distance from a ground calibration target combined with the high elevation of the region results in residual atmospheric bands, which can affect the accuracy of results in this region. Some of the rocks in this region also lack significant amounts of minerals with diagnostic absorption features in the wavelengths covered by the HyMap sensor. Future field work to the area could result in an improvement in the overall calibration of the area and understanding of the minerals within the Badakhshan AOI. 3B.1 Introduction Past studies of geologic data of Afghanistan revealed numerous areas with indications of potential mineral resources of various types (Peters and others, 2007; Abdullah and others, 1977). Several of these were selected for follow-on studies using imaging spectroscopy to characterize surface materials. Imaging spectroscopy is an advanced type of remote sensing which is also known as hyperspectral remote sensing. One of those areas is the Badakhshan area of interest (AOI) in northeastern Afghanistan, which is approximately 350 kilometers north-northeast of Kabul (fig. 3B–1). The area is believed to have the potential for metamorphic gold vein, gold-copper skarn, iron skarn, and polymetallic vein deposits. To help assess these potential resources, high-resolution imaging spectrometer data were analyzed to detect the presence of selected minerals that may be indicative of past mineralization processes. This report contains the results of the spectroscopic data analyses and identifies sites within the Badakhshan AOI that warrant further investigation, especially detailed geological mapping, lithologic sampling, and geochemical studies. 3B.2 Data Collection and Processing In 2007, imaging spectrometer data were acquired over most of Afghanistan as part of the U.S. Geological Survey (USGS) project "Oil and Gas Resources Assessment of the Katawaz and Helmand Basins.” These data were collected to characterize surface materials in support of assessments of resources (coal, water, minerals, oil, and gas) and earthquake hazards in the country (King and others, 2010). Imaging spectrometers measure the reflectance of visible and near-infrared light from the Earth’s
Transcript of Imaging spectrometer data collected over the Badakhshan area of
Chapter 3B. Analysis of Imaging Spectrometer Data for the Badakhshan Area of Interest
By Todd M. Hoefen and Michaela R. Johnson
Abstract Imaging spectrometer data collected over the Badakhshan area of interest (AOI) in northeastern
Afghanistan were analyzed with spectroscopic methods to identify the occurrence of selected material classes at the surface. Absorption features in the spectra of HyMap data were compared to a reference library of spectra of known materials. The HyMap data in this AOI is limited by the northern and eastern limits of the dataset. Thus, less than one-half of the AOI has HyMap coverage. The presence of abundant dry vegetation, which has masked the surficial minerals in a significant and geologically important part of the area, have reduced the utility of the hyperspectral data for overall site characterization in the Badakhshan AOI. Carbonates, muscovite, illite, and vegetation cover most of the region. Distinct patterns of chlorite or epidote, muscovite, illite, dolomite, and serpentine occur in localized patterns throughout. Many of the faulted areas in the region have associated dolomite, epidote or chlorite, and serpentine. In the iron-bearing map, vegetation covers much of the surface mineralogy. Fe2+ Fe3+ Type 2, epidote, and Fe3+ Type 1 are found in concentrations throughout most of the southwestern region of the AOI. It should be noted that the distance from a ground calibration target combined with the high elevation of the region results in residual atmospheric bands, which can affect the accuracy of results in this region. Some of the rocks in this region also lack significant amounts of minerals with diagnostic absorption features in the wavelengths covered by the HyMap sensor. Future field work to the area could result in an improvement in the overall calibration of the area and understanding of the minerals within the Badakhshan AOI.
3B.1 Introduction Past studies of geologic data of Afghanistan revealed numerous areas with indications of
potential mineral resources of various types (Peters and others, 2007; Abdullah and others, 1977). Several of these were selected for follow-on studies using imaging spectroscopy to characterize surface materials. Imaging spectroscopy is an advanced type of remote sensing which is also known as hyperspectral remote sensing. One of those areas is the Badakhshan area of interest (AOI) in northeastern Afghanistan, which is approximately 350 kilometers north-northeast of Kabul (fig. 3B–1). The area is believed to have the potential for metamorphic gold vein, gold-copper skarn, iron skarn, and polymetallic vein deposits. To help assess these potential resources, high-resolution imaging spectrometer data were analyzed to detect the presence of selected minerals that may be indicative of past mineralization processes. This report contains the results of the spectroscopic data analyses and identifies sites within the Badakhshan AOI that warrant further investigation, especially detailed geological mapping, lithologic sampling, and geochemical studies.
3B.2 Data Collection and Processing In 2007, imaging spectrometer data were acquired over most of Afghanistan as part of the
U.S. Geological Survey (USGS) project "Oil and Gas Resources Assessment of the Katawaz and Helmand Basins.” These data were collected to characterize surface materials in support of assessments of resources (coal, water, minerals, oil, and gas) and earthquake hazards in the country (King and others, 2010). Imaging spectrometers measure the reflectance of visible and near-infrared light from the Earth’s

Chapter 3B. Hyperspectral Mapping Analysis for the Badakhshan Area of Interest 187
surface in many narrow channels, producing a reflectance spectrum for each image pixel. These reflectance spectra can be interpreted to identify absorption features that arise from specific chemical transitions and molecular bonds that provide compositional information about surface materials. Imaging spectrometer data can be used only to characterize the upper surface materials and not subsurface composition or structure. Subsurface processes can be indicated, however, by the distribution of surface materials.
Figure 3B–1.
3B.2.1 Collection of Imaging Spectrometer Data The HyMap imaging spectrometer (Cocks and others, 1998) was flown in Afghanistan from
August 22 to October 2, 2007 (Kokaly and others, 2008). HyMap has 512 cross-track pixels and covers the wavelength range 0.43 to 2.48 micrometers (µm) in 128 channels. The imaging spectrometer was flown on a WB-57 high-altitude aircraft at 50,000 feet. There were 207 standard data flight lines and 11 cross-cutting calibration lines collected over Afghanistan for a total of 218 flight lines, covering a surface area of 438,012 square kilometers (km2) (Kokaly and others, 2008). Data were received in scaled radiance form (calibrated to National Institute of Standards and Technology reference materials). Before processing, four channels that had low signal-to-noise ratios and (or) were in wavelength regions overlapped by adjacent detectors were removed from the HyMap data (image cubes). Each flight line was georeferenced to Landsat base imagery in Universal Transverse Mercator (UTM) projection (Davis, 2007).
Index map of the Badakhshan area of interest, northeastern Afghanistan.
188 Summaries of Important Areas for Mineral Investment and Production Opportunities of Nonfuel Minerals in Afghanistan
3B.2.2 Calibration HyMap data were converted from radiance to reflectance using a multi-step calibration process.
This process removed the influence of the solar irradiance function, atmospheric absorptions, and residual instrument artifacts, resulting in reflectance spectra that have spectral features that arise from the material composition of the surface. Because of the extreme topographic relief and restricted access to ground calibration sites, modifications to the standard USGS calibration procedures were required to calibrate the 2007 Afghanistan HyMap dataset (Hoefen and others, 2010).
In the first step of the calibration process, the radiance data were converted to apparent surface reflectance using the radiative transfer correction program Atmospheric CORrection Now (ACORN; ImSpec LLC, Palmdale, CA). The ACORN program was run multiple times for each flight line, using average elevations in 100-meter (m) increments, covering the range of minimum to maximum elevation within the flight line. A single atmospherically corrected image was assembled from these elevation-incremented ACORN results. This was done by determining the elevation of each HyMap pixel and selecting the atmospherically corrected pixel from the 100-m increment closest to that elevation.
Each assembled atmospherically corrected image was further empirically adjusted using ground-based reflectance measurements from a ground calibration site. Spectra of five ground calibration sites were collected in Afghanistan: field spectra from Kandahar Air Field, Bagram Air Base, and Mazar-e-Sharif Airport, as well as laboratory spectra of soil samples from two fallow fields in Kabul. These were used to calculate empirical correction factors using the pixels of atmospherically corrected HyMap data in the flight lines that passed over the sites. The empirical correction from the closest calibration site to each flight line was applied.
To further improve the data quality, an additional calibration step was taken to address the atmospheric differences caused, in part, by the large distances between the calibration sites and the survey areas. The large distances were a result of the lack of safe access to ground calibration sites. The duration of the airborne survey and variation in time of day during which flight lines were acquired also resulted in differences in atmospheric conditions between standard flight lines and lines over ground calibration sites, which were used to derive the empirical correction factors. Over the course of the data collection, the sun angle, atmospheric water vapor, and atmospheric scattering differed for each flight line. To compensate for this variation, cross-cutting calibration flight lines over the ground calibration areas were acquired (Kokaly and others, 2008) and used to refine the data quality of the standard data lines. A multiplier correction for each standard data line, typically oriented north-south, was derived using the pixels of overlap with the well-calibrated cross-cutting line that intersected it, subject to slope, vegetation cover, and other restrictions on pixel selection (Hoefen and others, 2010). As a result, the localized cross-calibration multiplier, derived from the overlap region, corrected residual atmospheric contamination in the imaging spectrometer data that may have been present after the ground calibration step.
While the cross-calibration procedure was successful for the Afghanistan dataset, the Badakhshan AOI is located in one of the more remote areas of Afghanistan. Because of its remote location, no ground calibration targets were measured within the region. The cross-calibration corrections limit atmospheric residuals to the best of our ability but the high elevations in this area combined with the lack of a nearby calibration site result in data that could benefit from additional information collected in future field excursions and a local calibration site.
3B.2.3 Materials Maps and Presentation After undergoing a complex and rigorous data calibration process, the georeferenced and
calibrated reflectance data were analyzed using the Material Identification and Characterization Algorithm (MICA), a module of the USGS Processing Routines in IDL for Spectroscopic Measurements (PRISM) software (Kokaly, 2011). The MICA analysis compared the reflectance spectrum of each pixel of HyMap data to entries in a reference spectral library of minerals, vegetation, water, and other materials. The HyMap data were compared to 97 reference spectra of well-characterized mineral and
Chapter 3B. Hyperspectral Mapping Analysis for the Badakhshan Area of Interest 189
material standards. The best spectral match to each pixel was determined and the results were clustered into classes of materials discussed below. The resulting maps of material distribution, resampled to a 23 x 23 square meter pixel grid, were mosaicked to create thematic maps of surface mineral occurrences over the full dataset covering Afghanistan.
The MICA module was applied to HyMap data twice to present the distribution of two categories of minerals that are naturally separated in the wavelength regions of their primary absorption features. MICA was applied using the subset of minerals with absorption features in (1) the visible and near-infrared wavelength region, producing the 1-µm map of iron-bearing minerals and other materials (King and others, 2011), and (2) in the shortwave infrared region to produce the 2-µm map of carbonates, phyllosilicates, sulfates, altered minerals, and other materials (Kokaly and others, 2011). For clarity of presentation, some individual classes in these two maps were bundled by combining selected mineral types (for example, all montmorillonites or all kaolinites) and representing them with the same color in order to reduce the number of colors required to represent the mineral classes.
The iron-bearing minerals map includes 28 classes. Iron-bearing minerals with different mineral compositions but similar broad spectral features are difficult to classify as specific mineral species. Thus, generic spectral classes, including several minerals with similar absorption features, such as Fe3+ Type 1 and Fe3+ Type 2, are depicted on the map. The carbonates, phyllosilicates, sulfates, and altered minerals map has 32 classes. Minerals with slightly different mineral compositions but comparable spectral features are less easily distinguished; therefore, some identified classes consist of several minerals with similar spectra, such as the “chlorite or epidote” class. When comparisons with reference spectra resulted in no viable match, a designation of “not classified” was assigned to a pixel.
3B.3 Geologic Setting of the Badakhshan AOI The Badakhshan AOI is within Badakhshan Province in northeastern Afghanistan. The main
Badakhshan AOI is 6,500 km2, of which the Fayz Abad District subarea covers 1,270 km2. The Ragh and Bharak District subareas are not covered by the HyMap dataset and are not discussed in this chapter. The contrast-enhanced stretch of the natural color composite of Landsat Thematic Mapper bands shown in figure 3B–2 provides a general overview of the Badakhshan AOI terrain and is useful for understanding the general characteristics and distribution of surficial material, including rocks and soil, unconsolidated sediments, vegetation, and hydrologic features.
3B.3.1 Topography Land elevation within the Badakhshan AOI ranges from 577 to 4,605 m (fig. 3B–3). The lowest
areas within the Badakhshan AOI are in the river basin in the southern region of the AOI. The highest areas are found in the central and northeastern regions of the AOI. The three population centers within the AOI are the province center of Fayzabad and the two district centers of Ragh and Baharak.
3B.3.2 Lithology and Structure The Badakhshan AOI contains known low-sulfide gold-quartz occurrences and associated
deposits in northern Badakhshan Province that are hosted in Proterozoic and cover rocks that mainly are Early Proterozoic biotite-amphibolite, garnet-biotite gneiss, migmatite, quartzite, and marble. Rocks in the Badakhshan area range in age from Early Proterozoic to Late Quaternary and Recent. Intrusive rocks of Proterozoic, Mississippian, Permian, Early Triassic and Oligocene age occur within the AOI. The Proterozoic, Mississippian, Permian and Early Triassic intrusive rocks predominantly occur in the western half of the AOI. The Oligocene intrusive rocks occur in the eastern half with only small sections having overlapping hyperspectral data. Older Precambrian rocks occur along heavily faulted terrain and are trending from the southwest to northeast. Mesozoic and Paleozoic rocks occur throughout the AOI. Cenozoic rocks generally occur in the northwest region of the AOI with the exception of Late Quaternary and Recent age rocks that are present within the river basins of the area (fig. 3B–4; Abdullah and Chmyriov, 1977).

190 Summaries of Important Areas for Mineral Investment and Production Opportunities of Nonfuel Minerals in Afghanistan
Figure 3B–2. Contrast-enhanced Landsat Thematic Mapper natural color image of the Badakhshan area of interest. Geologic units and faults from (Abdullah and Chmyriov, 1977).
Most faults in the regions are southwest to northeast trending. The entire region is highly fractured. Fault traces and geologic boundaries could be improved significantly with the addition of information from the HyMap results.
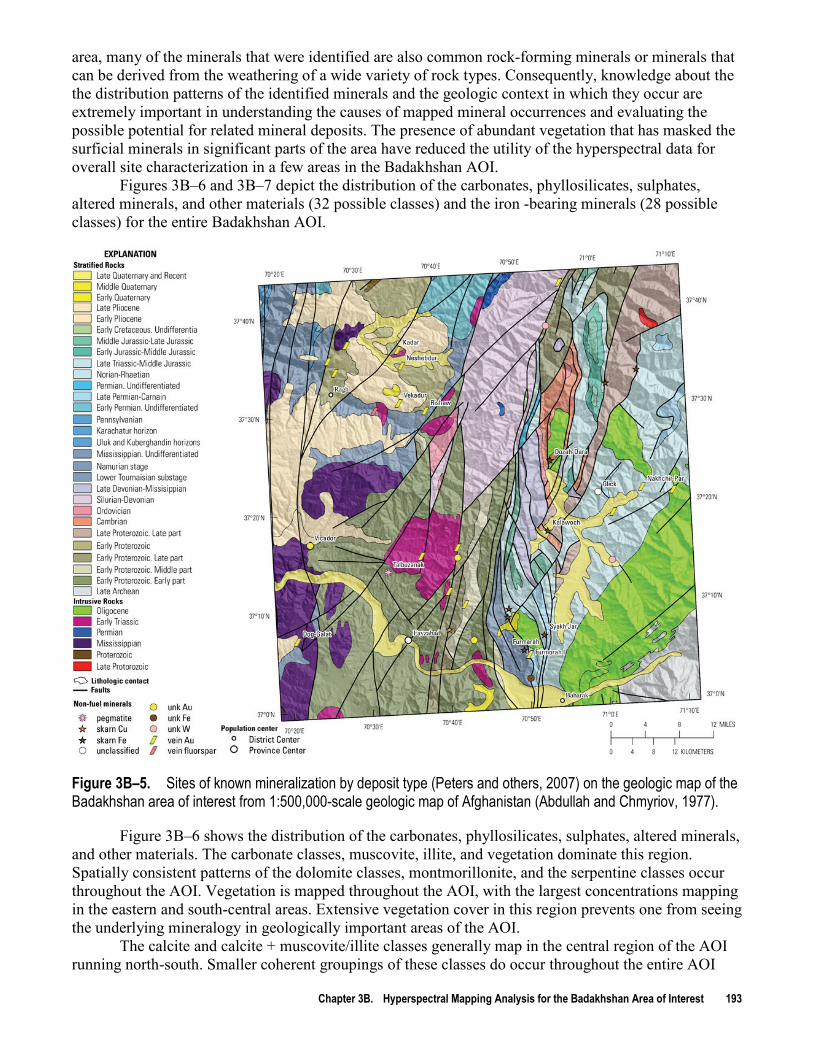
3B.3.3 Known Mineralization Figure 3B–5 shows the locations where mineralization with a potential for mineral resource
development may exist (Peters and others, 2007). A number of different types of mineral deposits, particularly metamorphic gold vein, gold-copper skarn, iron skarn, and polymetallic vein deposits are present within the Badakhshan AOI. Of these known mineral deposits, only 18 occur within the boundaries of the HyMap data. The mineralogical characteristics of the mineralized locations are summarized in table 3B–1.
Ragh and Baharak subareas in the Badakhshan AOI are beyond the coverage of the HyMap data. These areas are thought to have significant potential for gold. Future remote sensing and geochemical and geophysical studies of these remote areas are expected to improve understanding of these areas and their economic potential.
Gold occurrences in the Fayz Abad District subarea have characteristics similar to pluton-related gold deposits rather than to regional metamorphic deposits. The Furmorah gold occurrence lies proximal

Chapter 3B. Hyperspectral Mapping Analysis for the Badakhshan Area of Interest 191
to a number of iron skarn occurrences, such as the Syakh Jar, Kalawock, and Dozah-Dara iron skarns, and consists of an 80-km2-size mineralized area along the outer contact between Oligocene granite that intrudes Upper Permian to Upper Triassic sandstone and limestone. Mineralized zones consist of garnetiferous and garnet-magnetite skarn. Away from the skarn areas, mineralization consists of quartz-sulfide.
Figure 3B–3. Elevations and topography of the Badakhshan area of interest.

192 Summaries of Important Areas for Mineral Investment and Production Opportunities of Nonfuel Minerals in Afghanistan
Table 3B–1. Sites of known sites of mineralization in the Badakhshan area of interest (Peters and others, 2007).
Name Deposit type Alteration Mineralogy Gangue Talbuzanak pegmatite _ Spodumene; cleavelandite; Biotite; microcline; quartz
beryl; columbite; tantalite; pollucite
Unnamed skarn Cu Skarn alteration of tremolite- No data Tremolite actinolite facies
Furmarah skarn Fe Hornfels Magnetite No data Syakh Jar skarn Fe Hornfels Magnetite; hematite No data Unnamed skarn Fe Skarn alteration of magnetite Magnetite No data
facies Unnamed skarn Fe Skarn alteration of magnetite Magnetite Garnet
facies; Skarn alteration of garnet-magnetite facies
Figure 3B–4. Geologic map of the Badakhshan area of interest from 1:500,000-scale geologic map of Afghanistan (Abdullah and Chmyriov, 1977).
3B.4 Mineral Maps of the Badakhshan Area of Interest Analysis of the HyMap imaging spectrometer data of the Badakhshan AOI using spectroscopic
methods resulted in the identification of a wide variety of minerals exposed at the surface. Although the occurrence of certain minerals may suggest that mineralization processes may have once operated in the
Chapter 3B. Hyperspectral Mapping Analysis for the Badakhshan Area of Interest 193
area, many of the minerals that were identified are also common rock-forming minerals or minerals that can be derived from the weathering of a wide variety of rock types. Consequently, knowledge about the the distribution patterns of the identified minerals and the geologic context in which they occur are extremely important in understanding the causes of mapped mineral occurrences and evaluating the possible potential for related mineral deposits. The presence of abundant vegetation that has masked the surficial minerals in significant parts of the area have reduced the utility of the hyperspectral data for overall site characterization in a few areas in the Badakhshan AOI.
Figures 3B–6 and 3B–7 depict the distribution of the carbonates, phyllosilicates, sulphates, altered minerals, and other materials (32 possible classes) and the iron -bearing minerals (28 possible classes) for the entire Badakhshan AOI.
Figure 3B–5. Sites of known mineralization by deposit type (Peters and others, 2007) on the geologic map of the Badakhshan area of interest from 1:500,000-scale geologic map of Afghanistan (Abdullah and Chmyriov, 1977).
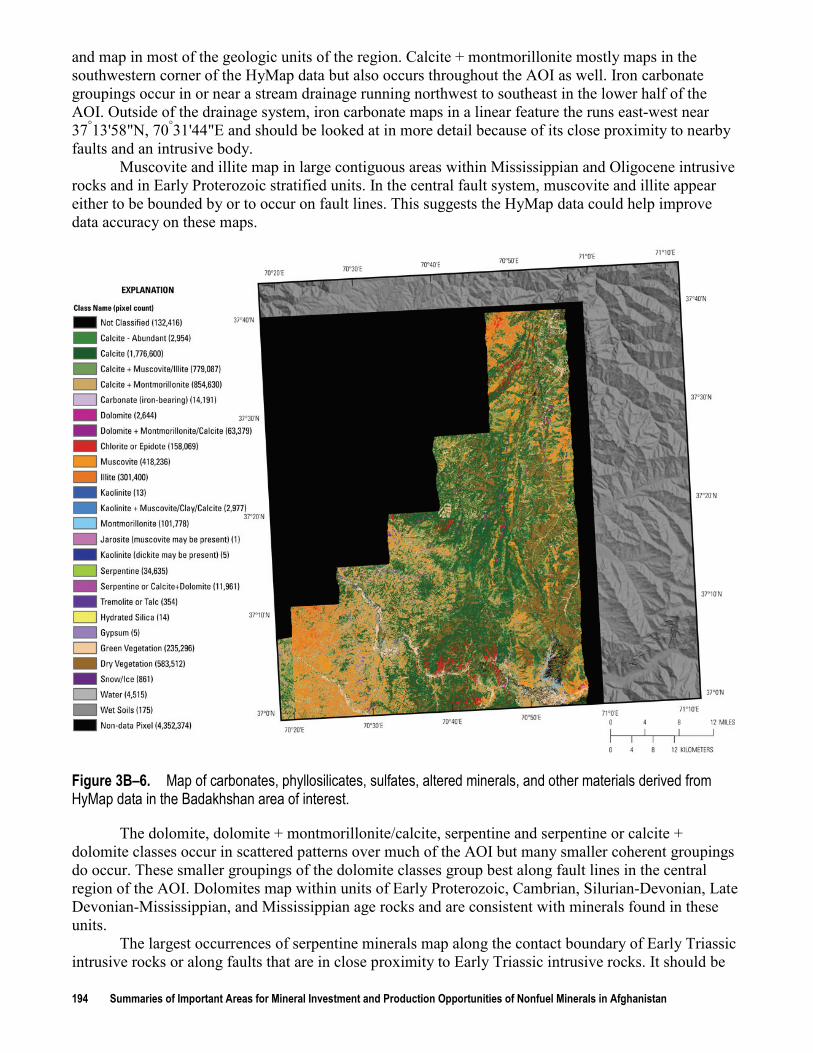
Figure 3B–6 shows the distribution of the carbonates, phyllosilicates, sulphates, altered minerals, and other materials. The carbonate classes, muscovite, illite, and vegetation dominate this region. Spatially consistent patterns of the dolomite classes, montmorillonite, and the serpentine classes occur throughout the AOI. Vegetation is mapped throughout the AOI, with the largest concentrations mapping in the eastern and south-central areas. Extensive vegetation cover in this region prevents one from seeing the underlying mineralogy in geologically important areas of the AOI.
The calcite and calcite + muscovite/illite classes generally map in the central region of the AOI running north-south. Smaller coherent groupings of these classes do occur throughout the entire AOI
194 Summaries of Important Areas for Mineral Investment and Production Opportunities of Nonfuel Minerals in Afghanistan
and map in most of the geologic units of the region. Calcite + montmorillonite mostly maps in the southwestern corner of the HyMap data but also occurs throughout the AOI as well. Iron carbonate groupings occur in or near a stream drainage running northwest to southeast in the lower half of the AOI. Outside of the drainage system, iron carbonate maps in a linear feature the runs east-west near 37°13'58"N, 70°31'44"E and should be looked at in more detail because of its close proximity to nearby faults and an intrusive body.
Muscovite and illite map in large contiguous areas within Mississippian and Oligocene intrusive rocks and in Early Proterozoic stratified units. In the central fault system, muscovite and illite appear either to be bounded by or to occur on fault lines. This suggests the HyMap data could help improve data accuracy on these maps.
Figure 3B–6. Map of carbonates, phyllosilicates, sulfates, altered minerals, and other materials derived from HyMap data in the Badakhshan area of interest.
The dolomite, dolomite + montmorillonite/calcite, serpentine and serpentine or calcite + dolomite classes occur in scattered patterns over much of the AOI but many smaller coherent groupings do occur. These smaller groupings of the dolomite classes group best along fault lines in the central region of the AOI. Dolomites map within units of Early Proterozoic, Cambrian, Silurian-Devonian, Late Devonian-Mississippian, and Mississippian age rocks and are consistent with minerals found in these units.
The largest occurrences of serpentine minerals map along the contact boundary of Early Triassic intrusive rocks or along faults that are in close proximity to Early Triassic intrusive rocks. It should be

Chapter 3B. Hyperspectral Mapping Analysis for the Badakhshan Area of Interest 195
noted that upon further analysis of the spectral data that mapped as serpentines, a 2.38-µm feature is usually found to be present in HyMap spectra. This 2.38-µm band is usually very weak in hyperspectral data of most serpentines but is much stronger in amphibole minerals. The 2.32-µm feature of serpentine in this region also exhibits a slight shoulderness around 2.30 µm, which would also be consistent with amphiboles. Additional work to define the composition of rocks in these areas is warranted in conjunction with further analysis of the imaging spectrometer data.
Chlorite or epidote occur in spatially consistent patterns in large areas in the south-central regions and smaller areas in the central and north-central regions. The southern occurrence of chlorite or epidote maps across different age geologic units. The central detection of chlorite or epidote mainly occurs within Early Triassic intrusive rocks. Other epidote or chlorite detections in this area may suggest that this intrusive body is larger than on the current Russian map. Chlorite or epidote in the north-central region map within Silurian-Devonian age rocks but tend to occur along fault lines. In several places the chlorite or epidote map as a series of offset blocks. This suggests that the fault lines need to be extended in many areas.
Figure 3B–7. Map of iron-bearing minerals and other materials derived from HyMap data in the Badakhshan area of interest.
Montmorillonite occurs as individual pixels or small clusters throughout the AOI with the largest coherent grouping mapping near the southern border in the south-central region of the AOI. This area is clearly visible with the blue-grey colors in the TM image (see fig. 3B–2).
196 Summaries of Important Areas for Mineral Investment and Production Opportunities of Nonfuel Minerals in Afghanistan
Tremolite or talc did map in small groupings in several areas, which is consistent with the mineralogy of the area. The addition of a more diverse range of amphibole entries into the spectral library and ground sampling could improve mapping within this classification.
The iron-bearing materials map is shown in figure 3B–6. A large portion of the data mapped into the Not Classified classification. This shows that the rocks in this AOI lack minerals that contain significant absorption features in the 1 µm region of the electromagnetic spectrum. The image clearly demonstrates the extensive vegetation coverage in the Badakhshan AOI. The vegetation covers surface exposures and can limit the usefulness of the HyMap data and analysis in this region. Of the classified pixels in this region (other than the Not Classified or Non-data Pixel classifications), vegetation accounts for 60 percent of the identifications.
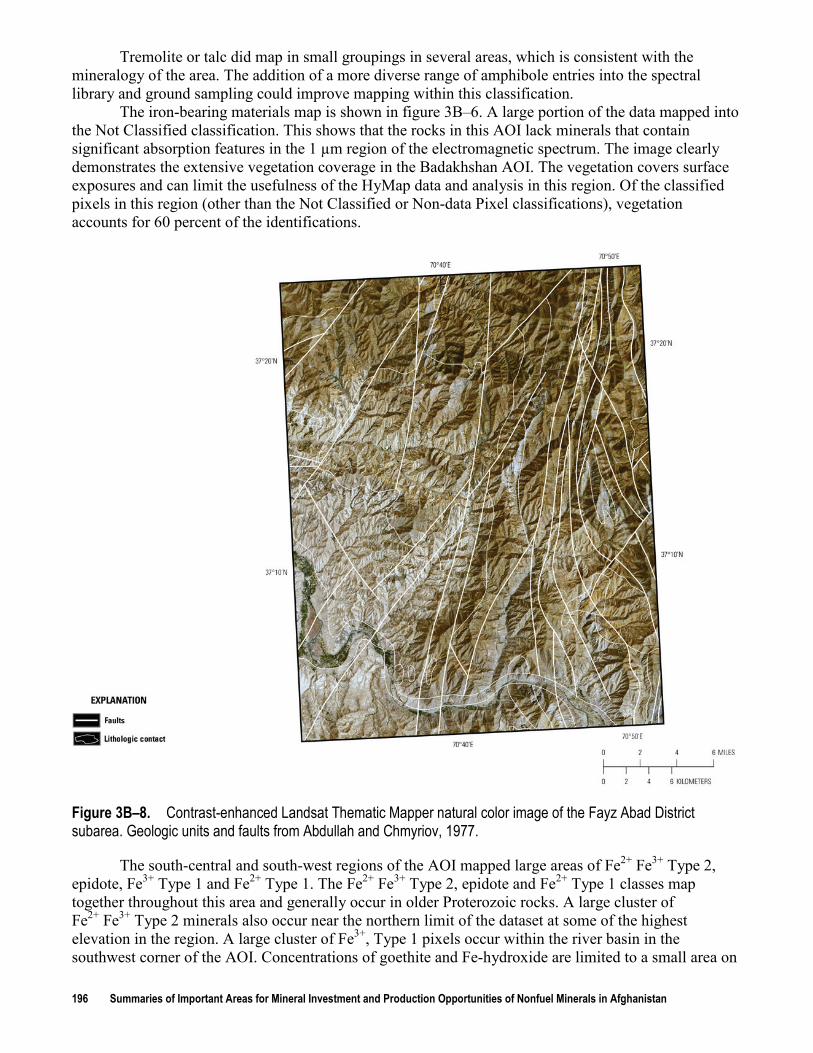
Figure 3B–8. Contrast-enhanced Landsat Thematic Mapper natural color image of the Fayz Abad District subarea. Geologic units and faults from Abdullah and Chmyriov, 1977.
The south-central and south-west regions of the AOI mapped large areas of Fe2+ Fe3+ Type 2, epidote, Fe3+ Type 1 and Fe2+ Type 1. The Fe2+ Fe3+ Type 2, epidote and Fe2+ Type 1 classes map together throughout this area and generally occur in older Proterozoic rocks. A large cluster of Fe2+ Fe3+ Type 2 minerals also occur near the northern limit of the dataset at some of the highest elevation in the region. A large cluster of Fe3+, Type 1 pixels occur within the river basin in the southwest corner of the AOI. Concentrations of goethite and Fe-hydroxide are limited to a small area on

Chapter 3B. Hyperspectral Mapping Analysis for the Badakhshan Area of Interest 197
the border of the AOI in the southwest corner and small occurrences along fault lines in the northern region of the HyMap data. Early Triassic and Oligocene intrusive rocks are noted as lacking any significant detections of minerals that are found in the iron-bearing classifications.
It is possible that the spectral library does not have a representative entry for the mineral or mineral mixture of rocks in these areas. There are several areas where reflectance levels in the longer wavelengths (2 to 2.5 µm region) of rocks are low (10 percent to 20 percent at 2.272 µm) compared to surrounding areas (20 percent to 45 percent at 2.272 µm). The addition of a 2.38 µm band in certain spectra is also intriguing. Understanding of the rocks in these areas would benefit from additional field work.
Figure 3B–9. Elevations and topography of the Fayz Abad District subarea.
3B.4.1 Fayz Abad District Subarea Detailed maps of the Fayz Abad District subarea are presented in figures 3B–8 through 3B–13.
The Fayz Abad District subarea covers almost 50 percent of the total HyMap coverage for the area and most of the significant details of this area have already been discussed above. Figures 3B–8 through 3B–11 show the contrast-enhanced natural color Landsat TM image, elevation data for this region, geologic map and the geologic map with known mineral occurrences. The elevation in the Fayz Abad District subarea ranges from 1,112 to 3,696 m. Stratified rocks in the Fayz Abad District subarea range in age from Early Proterozoic to Middle Quaternary. Intrusive rocks of Mississippi, Early Triassic and Oligocene age occur within the subarea (Abdullah and Chmyriov, 1977). The Proterozoic intrusive

198 Summaries of Important Areas for Mineral Investment and Production Opportunities of Nonfuel Minerals in Afghanistan
rocks occur extensively in the central and western region of the subarea. Paleozoic, Mesozoic and Cenozoic rocks occur along the eastern border of the subarea with small sections along the northern border. A large Early Triassic intrusive body occurs in the northwestern region with smaller intrusions to the south. Smaller intrusions of Mississippian and Oligocene rocks occur in the northwest and southeast corner of the subarea. The subarea is heavily faulted with north-south trending faults.
Figure 3B–10. Geologic map of the Fayz Abad District subarea from 1:500,000-scale geologic map of Afghanistan (Abdullah and Chmyriov, 1977).
Figure 3B–12 shows the distribution of carbonates, phyllosilicates, sulphates, altered minerals, and other materials within the Fayz Abad District subarea. Vegetation and calcite class minerals dominate most of the region and can be found in most rock units. Calcite and calcite + muscovite/illite predominantly map in the central and western region of the subarea. The calcite + montmorillonite class maps in spatially consistent patterns in the western third of the subarea with calcite, calcite + muscovite/illite, muscovite and illite dispersed throughout. Chlorite and epidote concentrations occur along the river basin in the south-central region, within Early Triassic intrusive rocks in the northwest region, and along fault lines in the northeast region of the subarea. Muscovite with smaller amounts of illite map throughout the subarea. In the northern regions they appear to map in bedded formations running mostly north-south. Muscovite, illite, and the main detections of kaolinite + muscovite/clay/calcite are associated with Oligocene intrusive rocks in the southeast region. The dolomite, dolomite + montmorillonite/calcite, serpentine, and serpentine or calcite + dolomite classes

Chapter 3B. Hyperspectral Mapping Analysis for the Badakhshan Area of Interest 199
seem to map along intrusive body contacts or on fault lines near intrusive rocks. Iron carbonate maps along the river basin to the south and in the west-central region.
Figure 3B–11. Sites of known mineralization by deposit type (Peters and others, 2007) on the geologic map of the Fayz Abad District subarea from 1:500,000-scale geologic map of Afghanistan (Abdullah and Chmyriov, 1977).
Figure 3B–13 shows the mineral distribution of iron-bearing minerals for the Fayz Abad District subarea. Vegetation covers most of the central and eastern regions of the subarea. Fe2+ Fe3+ Type 2, epidote, Fe3+ Type 1, and Fe2+ Type 1 concentrations occur throughout the central and western region in Early Proterozoic (Early Part) stratified formations. The intrusive rock units do not map significant amounts of iron-bearing minerals. Small linear groupings of the goethite class minerals occur in the northeastern region of the subarea and may be related to fault lines.

200 Summaries of Important Areas for Mineral Investment and Production Opportunities of Nonfuel Minerals in Afghanistan
Figure 3B–12. Map of carbonates, phyllosilicates, sulfates, altered minerals, and other materials derived from HyMap data in the Fayz Abad District subarea.
3B.5 Summary The HyMap data for the Badakhshan AOI shows several locations based on the presence of
specific minerals or groups of minerals that suggest the need for additional field sampling and geochemical characterization. The northern and eastern limits of the HyMap dataset result in only partial coverage within the Badakhshan AOI. Only the Fayz Abad District subarea was covered with HyMap data in this region.
While vegetation, calcite class minerals, muscovite, and illite map extensively throughout the AOI, the proximity of the dolomite class minerals, serpentine class minerals, and iron carbonates to intrusive contacts or fault lines warrants further investigation. These detections would also benefit from additional field sampling, as weaker features in the spectra indicate that other minerals are present within these rock units. The addition of spectra of rock types of this area that aren’t part of our current spectral library and the acquisition of data from a local ground calibration site could improve the accuracy of the maps within this region.

Chapter 3B. Hyperspectral Mapping Analysis for the Badakhshan Area of Interest 201
Figure 3B–13. Map of iron-bearing minerals and other materials derived from HyMap data in the Fayz Abad District subarea.
3B.6 References Cited Abdullah, Sh., and Chmyriov, V.M., 1977, Geological map of Afghanistan: Kabul, Afghanistan,
Ministry of Mining and Industry of Democratic Republic of Afghanistan, scale 1:500,000. Abdullah, Sh., Chmyriov, V.M., Stazhilo-Alekseev, K.F., Dronov, V.I., Gannan, P.J., Rossovskiy, L.N.,
Kafarskiy, A.Kh., and Malyarov, E.P., 1977, Mineral resources of Afghanistan (2d ed.): Kabul, Afghanistan, Republic of Afghanistan Geological and Mineral Survey, 419 p.
Cocks, T., Jenssen, R., Stewart, A., Wilson, I., and Shields, T., 1998, The HyMap airborne hyperspectral sensor—The system, calibration and performance, in Schaepman, M., Schlapfer, D., and Itten, K.I., eds., Proceedings of the 1st EARSeL Workshop on Imaging Spectroscopy, 6–8 October 1998, Zurich: Paris, European Association of Remote Sensing Laboratories, p. 37–43.
Davis, P.A., 2007, Landsat ETM+ false-color image mosaics of Afghanistan: U.S. Geological Survey Open-File Report 2007–1029, 22 p. (Also available at http://pubs.usgs.gov/of/2007/1029/
Hoefen, T.M., Kokaly, R.F., and King, T.V.V., 2010, Calibration of HyMap data covering the country of Afghanistan, in Proceedings of the 15th Australasian Remote Sensing and Photogrammetry Conference, Alice Springs, Australia, September 12–17, 2010, p. 409, available at
.)
http://dl.dropbox.com/u/81114/15ARSPC-Proceedings.zip/ .
202 Summaries of Important Areas for Mineral Investment and Production Opportunities of Nonfuel Minerals in Afghanistan
King, T.V.V., Kokaly, R.F., Hoefen, T.M., and Knepper, D.H., 2010, Resource mapping in Afghanistan using HyMap data, in Proceedings of the 15th Australasian Remote Sensing and Photogrammetry Conference, Alice Springs, Australia, September 12–17, 2010, p. 500, available at http://dl.dropbox.com/u/81114/15ARSPC-Proceedings.zip/
King, T.V.V., Kokaly, R.F., Hoefen, T.M., Dudek, K. and Livo, K.E., 2011, Surface materials map of Afghanistan—Iron-bearing minerals and other materials: U.S. Geological Survey Scientific Investigations Map 3152–B.
.
Kokaly, Ray, 2011, PRISM—Processing routines in IDL for spectroscopic measurements: U.S. Geological Survey Open-File Report 2011–1155, available at http://pubs.usgs.gov/of/2011/1155/
Kokaly, R.F., King, T.V.V., and Livo, K.E., 2008, Airborne hyperspectral survey of Afghanistan 2007—Flight line planning and HyMap data collection: U.S. Geological Survey Open-File Report 2008–1235, 14 p.
.
Kokaly, R.F., King, T.V.V., Hoefen, T.M., Dudek, K. and Livo, K.E., 2011, Surface materials map of Afghanistan—Carbonates, phyllosilicates, sulfates, altered minerals, and other materials: U.S. Geological Survey Scientific Investigations Map 3152–A.
Peters, S.G., Ludington, S.D., Orris, G.J., Sutphin, D.M., Bliss, J.D., and Rytuba, J.J., eds., and the U.S. Geological Survey-Afghanistan Ministry of Mines Joint Mineral Resource Assessment Team, 2007, Preliminary non-fuel mineral resource assessment of Afghanistan: U.S. Geological Survey Open-File Report 2007–1214, 810 p., 1 CD–ROM. (Also available at http://pubs.usgs.gov/of/2007/1214/.)