Imagine the result - EPA Archives · 6.2 Reporting Requirements 54 ... 7.5.2 Delayed Coker 61 ......
166
Transcript of Imagine the result - EPA Archives · 6.2 Reporting Requirements 54 ... 7.5.2 Delayed Coker 61 ......

Imagine the result
Measurement & Analysis of Benzene & VOC Emissions in the Houston Ship Channel Area
Quality Assurance Project Plan
Support for Development of Environmental Regulations and Standards
Revision 1.0
September 2009


Project No.: RN009285.0001
Element No.: A2
Revision No.: 1.0
Date: September 2009
Page: i
Table of Contents
Measurement & Analyses of Benzene & VOC Emissions in Houston Ship Channel Area, Quality Assurance Project Plan
List of Tables vi
List of Figures vii
List of Appendices viii
Distribution List ix
A: Project Management 1
1. Project/Task Organization 1
2. Problem Definition/Background 8
2.1 Background 8
2.2 Problem Definition 9
2.3 Known Information 12
2.4 Recipients of the Open-Path VOC Data 14
2.5 Intended Use of the Data 14
3. Project/Task Description and Schedule 16
3.1 Project/Task Description 16
3.1.1 DIAL Methodology 28
3.1.2 OP-FTIR Technology 30
3.1.2.1 Procedure for Calculation of Alkane Mixture Concentrations and Equivalent Molecular Mass 30
3.1.2.2 Further Speciation of Gaseous Air Pollutants 31
3.1.3 Benzene Concentrations from the UV-DOAS 31
3.2 Project Schedule 31
3.3 Shell Escort Planning 34

Project No.: RN009285.0001
Element No.: A2
Revision No.: 1.0
Date: September 2009
Page: ii
4. Quality Objectives and Criteria for Measurement Data 36
4.1 Data Quality Objectives (DQOs) 36
4.2 Critical Measurement List 37
4.3 Data Quality Indicator (DQI) Goals 38
4.3.1 Accuracy 42
4.3.2 Precision 42
4.3.3 Detection Limits 42
4.3.4 Completeness 43
4.4 Procedures to Assess QA Objectives 44
4.4.1 NPL DIAL Flux DQI Assessment 44
4.4.2 OP-FTIR PIC DQI Assessment 47
4.4.3 UV-DOAS PAC DQI Assessment 47
4.4.4 Intercomparison and Spectral Confirmation 48
4.4.5 Meteorological Head DQI Assessment 48
4.4.6 Method for Assessing the DQI for the Laser Rangefinder 49
4.5 MAAML 49
5. Special Training/Certification 50
6. Documents and Records 52
6.1 Data Handling and Storage 52
6.2 Reporting Requirements 54
B: Data Generation and Acquisition 56
7. Experimental Design 56
7.1 NPL DIAL 56
7.1.1 Pre-Campaign 56
7.1.2 Main Measurement Period 56
7.1.3 Typical Daily Program 57
Project No.: RN009285.0001
Element No.: A2
Revision No.: 1.0
Date: September 2009
Page: iii
7.2 OP-FTIR 59
7.3 UV-DOAS 59
7.4 MAAML 60
7.5 Process Data 60
7.5.1 Flares 60
7.5.2 Delayed Coker 61
7.5.3 Tanks 61
7.5.4 Wastewater 61
7.5.5 Generic Process Leaks 62
7.5.6 Cooling Towers 62
7.6 Instrument Deployment 63
7.6.1 Meteorological Data 63
7.6.2 OP-FTIR and UV-DOAS Instrument-Source Distances 63
7.6.3 Monitoring Procedures 63
7.7 Flux Calculations using DIAL 64
8. Sampling Methods 67
8.1 DIAL Sampling Methods 67
8.2 MAAML 68
8.3 Description of Measurement Methods 69
8.3.1 Data Generation 70
8.3.2 Meteorological Data Collection for the NPL Fixed Mast 70
8.3.3 Optical Path Length Determination with the Bushnell Rangefinder 71
9. Sample Handling and Custody 72
10. Analytical Methods 73
10.1 DIAL 73
10.2 MAAML 77

Project No.: RN009285.0001
Element No.: A2
Revision No.: 1.0
Date: September 2009
Page: iv
10.3 Analytical Methods 78
11. Quality Control 79
11.1 NPL DIAL 79
11.2 MAAML 82
11.3 Pre-Deployment QC Checks 83
11.3.1 DIAL 83
11.3.2 OP-FTIR 83
11.3.3 UV-DOAS 84
11.3.4 Meteorological Head 84
11.4 Pre-Operation QC Checks 84
11.4.1 DIAL 84
11.4.2 OP-FTIR Instruments 85
11.4.3 UV-DOAS Instruments 85
11.4.4 Meteorology Head 85
11.5 QC Checks during Operation 85
12. Instrument/Equipment Testing, Inspection, and Maintenance 87
13. Instrument/Equipment Calibration and Frequency 89
14. Inspection/Acceptance of Supplies and Consumables 92
15. Non-Direct Measurements 93
16. Data Management 94
16.1 Data Reduction/Organizational Deliverables 95
C: Assessment and Oversight 96
17. Assessments and Response Actions 96
17.1 Readiness Review 97
17.2 Audits 97

Project No.: RN009285.0001
Element No.: A2
Revision No.: 1.0
Date: September 2009
Page: v
18. Reports to Management 99
18.1 Weekly Progress Reports 99
18.2 Final Project Report 99
D: Data Validation and Usability 101
19. Data Review, Verification, and Validation 101
19.1 Validation of Site Information Data 101
19.2 Validation of Data 101
19.3 Validation of Wind Data 102
19.4 Validation of DIAL Flux Measurements 102
20. Verification and Validation Methods 105
20.1 Sampling Design 105
20.2 Sample Collection Procedures 105
20.3 Analytical Methods 105
20.4 Quality Control 106
20.5 Calibration 106
20.6 Data Reduction and Processing 106
21. Reconciliation with User Requirements 107
References 108

Project No.: RN009285.0001
Element No.: A2
Revision No.: 1.0
Date: September 2009
Page: vi
List of Tables
Table 1-1. Personnel Responsibilities and Contact Information 3
Table 2-1. Project Elements and Responsible Parties 9
Table 3-1. Project Elements and Responsible Parties 16
Table 4-1. Implementation of the DQO Process 36
Table 4-2. List of Critical Measurements 38
Table 4-3. Data Quality Indicator Goals for the Project 39
Table 4-4a. Ultraviolet (UV) Capability of NPL DIAL 39
Table 4-4b. Infrared (IR) Capability of NPL DIAL 40
Table 4-6. Minimum Detection Limits for the OP-FTIR Measurements 41
Table 4-7. Procedures Used to Assess QA Objectives 45
Table 5-1. Technical Personnel 50
Table 13-1. Instrumentation Calibration Frequency and Description 89
Table 16-1. Data-related Deliverables 95
Table 16-2. Data-reduced Deliverables 96
Table 16-3. Data Reduction Procedures and Associated MOPs and QA/QC Manuals 96

Project No.: RN009285.0001
Element No.: A2
Revision No.: 1.0
Date: September 2009
Page: vii
List of Figures
Figure 1-1. Project organizational chart. 5
Figure 3-1. Shell Deer Park Proposed Dial Locations. 17
Figure 3-2. Proposed Dial Location 1: Tanks south of olefins units, including pyrolysis gasoline tanks 18
Figure 3-3. Proposed Dial Location 2: Tanks south of olefins units, including pyrolysis gasoline tanks 18
Figure 3-4. Proposed Dial Location 3: OP2 and OP3 elevated flares (OP2ELFLA & OP3ELFLA), olefins units cooling tower and process unit fugitives, and certain tanks north of the olefins units 19
Figure 3-5. Proposed Dial Location 4: Shell Deer Park: OP2 and OP3 elevated flares (OP2ELFLA & OP3ELFLA), OP3 ground flare (OP3GRFLA) and certain tanks north of the olefins units. This location may also be good for olefins units cooling towers and process unit fugitives 19
Figure 3-6. Proposed Dial Location 5: Tanks generally south of the coker units (West Operations Tank Farm) 20
Figure 3-7. Proposed Dial Location 6: Coker units and tanks generally east of coker units 20
Figure 3-8. Proposed Dial Location 7: West property flare (WP FLARE), tanks east of coker units and possibly the coker flare 21
Figure 3-9. Proposed Dial Location 8: North property wastewater sources (primarily refinery wastewater) and possibly some north property tanks 21
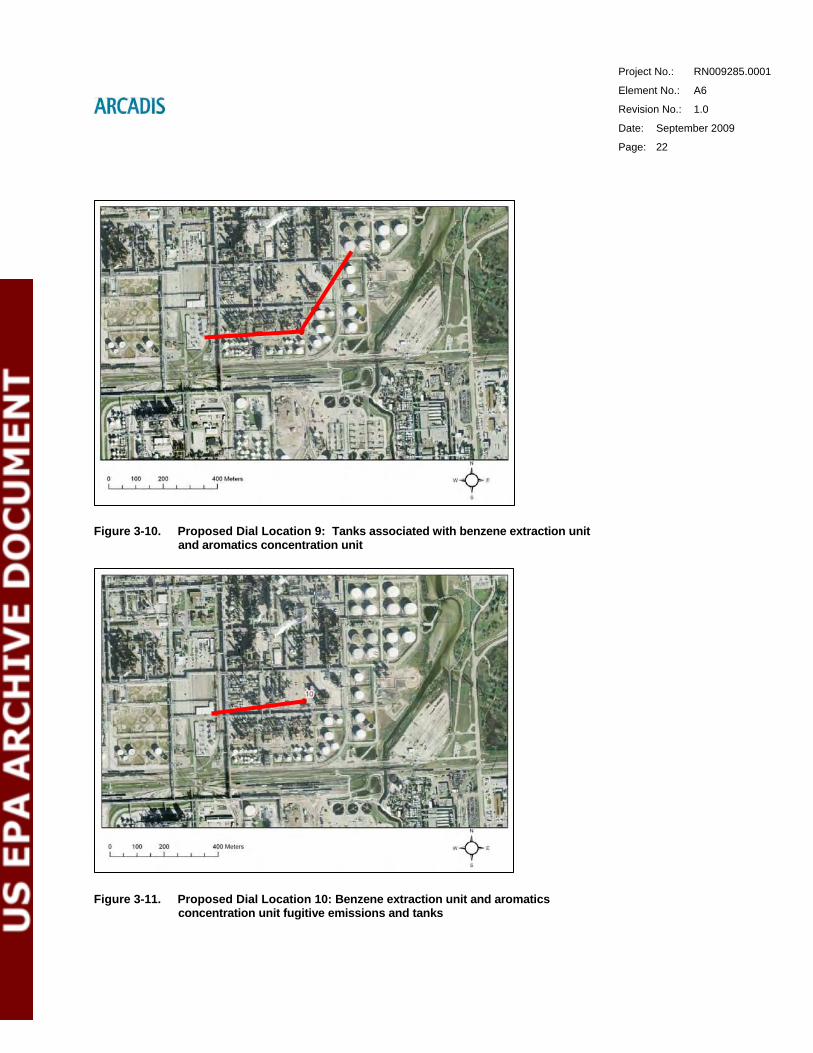
Figure 3-10. Proposed Dial Location 9: Tanks associated with benzene extraction unit and aromatics concentration unit 22
Figure 3-11. Proposed Dial Location 10: Benzene extraction unit and aromatics concentration unit fugitive emissions and tanks 22
Figure 3-12. Proposed Dial Location 11: East property flare and possibly some east property tanks 23
Figure 3-13. Proposed Dial Location 12: East property flare and possibly some east property tanks 23
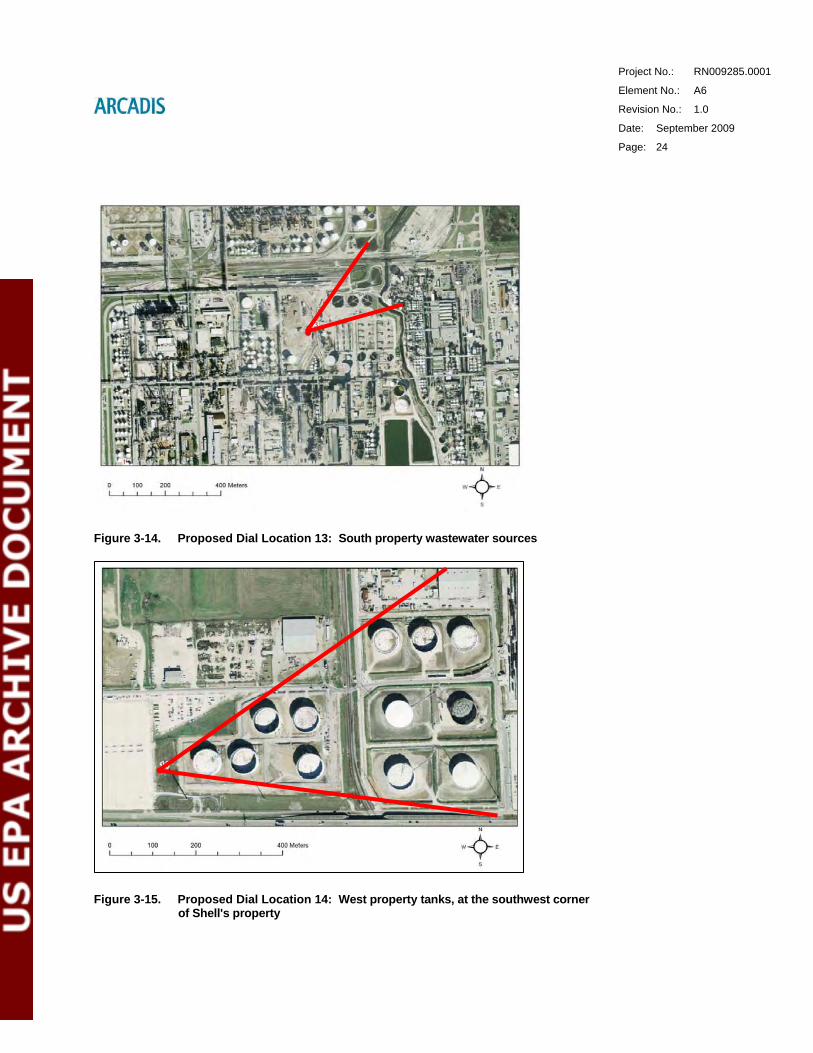
Figure 3-14. Proposed Dial Location 13: South property wastewater sources 24
Figure 3-15. Proposed Dial Location 14: West property tanks, at the southwest corner of Shell's property 24
Figure 3-16. Example of the NPL DIAL configuration setup. 29
Project No.: RN009285.0001
Element No.: A2
Revision No.: 1.0
Date: September 2009
Page: viii
List of Appendices
Appendix A Procedure to Convert OP-FTIR Volume Concentration Determinations of Alkane Mixture that Originate from Petroleum-Based Fuels to Mass Concentrations.
Appendix B Facility-Specific Process Data Forms
Appendix C Project Specific Operating Procedure for OPSIS UV-DOAS Calibration and QC Checks for Benzene
Appendix D DIAL Measurement Record Sheets and Wind Sensors Calibration Procedure
Appendix E MOP 6812: Single-Path Data Collection Using the RAM2000 Monostatic OP-FTIR
Appendix F MOP-6803 (Guidance for Deploying and Using ORS Supplemental Equipment) and MOP-6822 (Determining the Geographical Locations of the ORS Measurement Locations)
Appendix G MOP 6827: Procedures for OP-FTIR Concentration Data Analysis Using IMACC FTIR SOFTWARE SUITE
Appendix H OPSIS Emitter / Receiver ER 150 User’s Manual
Appendix I OPSIS Opto-Analyser AR 500 for Air Quality Monitoring Hardware Operating Manual
Appendix J OPSIS Quality Assurance and Quality Control using Opsis Analysers for Air Quality Monitoring, Version 1.4
Appendix K MOP-6802: Pre-Deployment and QC Checks for ORS Facility Instrumentation
Appendix L MOP-6823: QC Checks of ORS Instrument Performance during Data Collection
Project No.: RN009285.0001
Element No.: A3
Revision No.: 1.0
Date: September 2009
Page: ix
Distribution List
Copies of this plan and all revisions will be initially sent to the following individuals. It is the responsibility of the Houston Department of Health and Human Services (HDHHS), Bureau of Air Quality Control (BAQC) Supervising Engineer, the National Physical Laboratory (DIAL) Project Manager, and the ARCADIS U.S., Inc. (ARCADIS) On-Site Project Manager to make copies of the plan available to all field personnel.
Daniel Hoyt, P.E., HDHHS, BAQC Supervising Engineer. Houston, TX.
Phone: (713) 640-4365
Aunjanee' E. Gautreaux, EPA Regional Grant Project Officer. Region 6, Dallas, TX.
Phone: (214) 665-7127
Melanie Williams, DIAL Project Manager. National Physical Laboratory, Middlesex, United Kingdom.
Phone: (0) 208-943-6121
Rod Robinson, DIAL Team Leader. National Physical Laboratory, Middlesex, United Kingdom.
Phone: (0) 208-943-6121
Tom Gardiner, Reserve DIAL Team Leader. National Physical Laboratory, Middlesex, United Kingdom.
Phone: (0) 208-943-6121
Mark Modrak, ARCADIS Project Manager. Research Triangle Park, NC.
Phone: (919) 328-5613
Dr. Ram Hashmonay, Environ On-site Technical Consultant. Research Triangle Park, NC.
Project No.: RN009285.0001
Element No.: A3
Revision No.: 1.0
Date: September 2009
Page: x
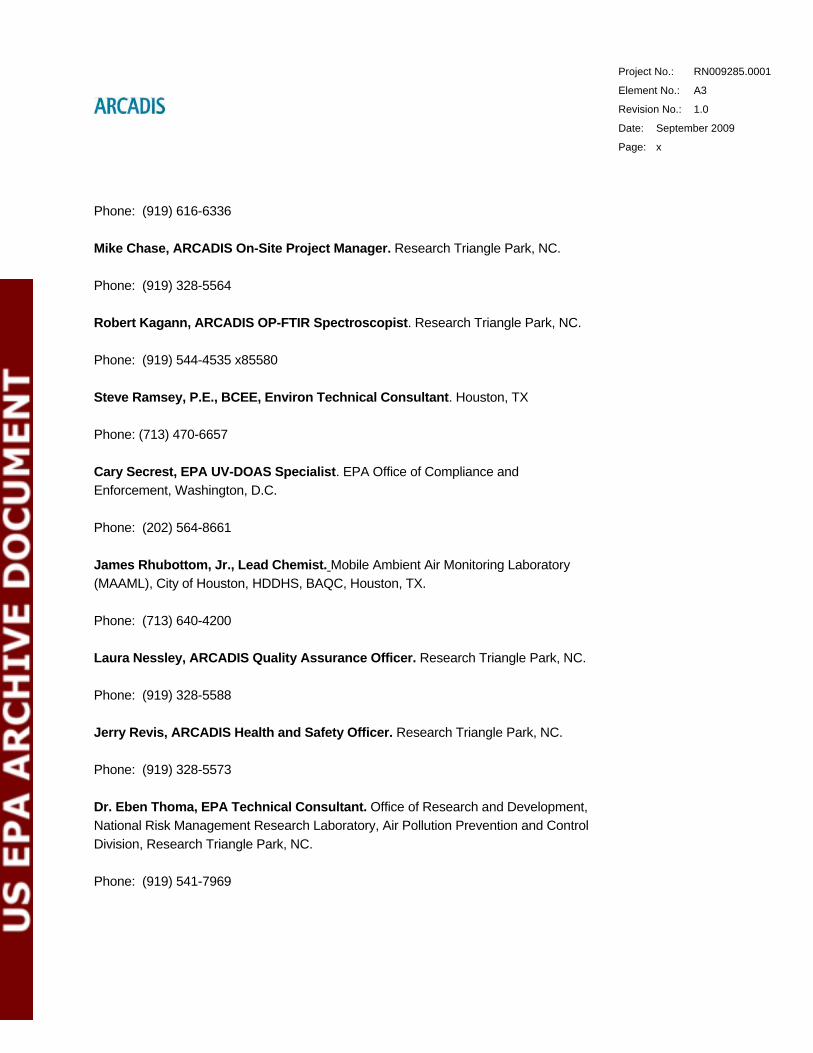
Phone: (919) 616-6336
Mike Chase, ARCADIS On-Site Project Manager. Research Triangle Park, NC.
Phone: (919) 328-5564
Robert Kagann, ARCADIS OP-FTIR Spectroscopist. Research Triangle Park, NC.
Phone: (919) 544-4535 x85580
Steve Ramsey, P.E., BCEE, Environ Technical Consultant. Houston, TX
Phone: (713) 470-6657
Cary Secrest, EPA UV-DOAS Specialist. EPA Office of Compliance and Enforcement, Washington, D.C.
Phone: (202) 564-8661
James Rhubottom, Jr., Lead Chemist. Mobile Ambient Air Monitoring Laboratory (MAAML), City of Houston, HDDHS, BAQC, Houston, TX.
Phone: (713) 640-4200
Laura Nessley, ARCADIS Quality Assurance Officer. Research Triangle Park, NC.
Phone: (919) 328-5588
Jerry Revis, ARCADIS Health and Safety Officer. Research Triangle Park, NC.
Phone: (919) 328-5573
Dr. Eben Thoma, EPA Technical Consultant. Office of Research and Development, National Risk Management Research Laboratory, Air Pollution Prevention and Control Division, Research Triangle Park, NC.
Phone: (919) 541-7969
Project No.: RN009285.0001
Element No.: A3
Revision No.: 1.0
Date: September 2009
Page: xi
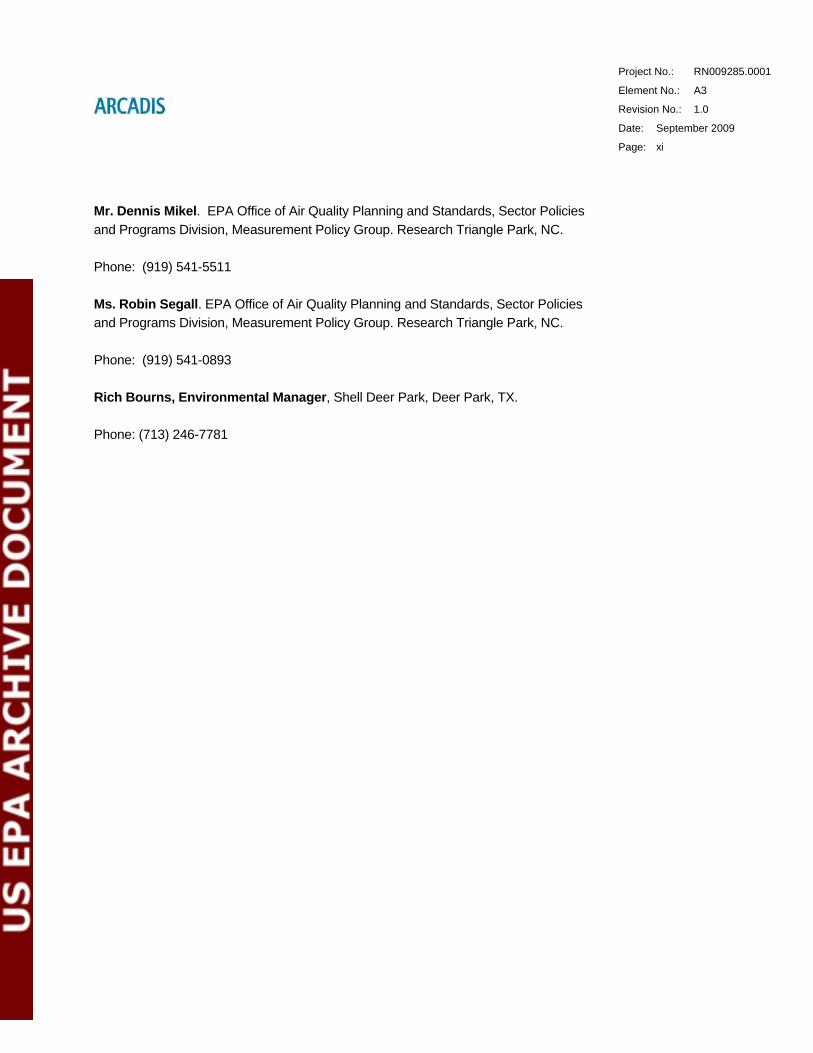
Mr. Dennis Mikel. EPA Office of Air Quality Planning and Standards, Sector Policies and Programs Division, Measurement Policy Group. Research Triangle Park, NC.
Phone: (919) 541-5511
Ms. Robin Segall. EPA Office of Air Quality Planning and Standards, Sector Policies and Programs Division, Measurement Policy Group. Research Triangle Park, NC.
Phone: (919) 541-0893
Rich Bourns, Environmental Manager, Shell Deer Park, Deer Park, TX.
Phone: (713) 246-7781

Project No.: RN009285.0001
Element No.: A4
Revision No.: 1.0
Date: September 2009
Page: 1
A: Project Management
1. Project/Task Organization
This Quality Assurance Project Plan (QAPP) addresses the project entitled, Measurement and Analysis of Benzene and VOC Emissions in the Houston Ship Channel Area and Selected Surrounding Major Stationary Sources Using DIAL (Differential Absorption Light Detection and Ranging) Technology to Support Ambient HAP Concentration Reductions in the Community. This project is to be conducted by the Houston Department of Health and Human Services (HDHHS) through the Bureau of Air Quality Control (BAQC), through a Cooperative Agreement with the U.S. Environmental Protection Agency (EPA), Region 6. This work is being performed in collaboration with Shell Oil Company, on behalf of Deer Park Refining Limited Partnership, and Shell Chemical LP (collectively “Shell Deer Park” or “Shell”), which is allowing access to their Shell Deer Park complex. This project has the potential for Shell and the City of Houston to agree to more detailed studies of certain specific emissions sources.
BAQC will provide a Supervising Engineer and an Engineer for overall project coordination and oversight. One of the engineers will be on site at all times, and will be responsible for overall project health and safety. They will have a GasFindIR camera, ppbRae PID, and a GIS instrument for the purpose of identifying the specific location where emissions detected with DIAL are coming from.
ARCADIS U.S., Inc. (ARCADIS) will provide project management for coordination of the joint DIAL, OP-FTIR, and UV-DOAS sampling and will provide guidance on the execution of the quality assurance/quality control (QA/QC) procedures detailed in this QAPP. As part of their project management responsibilities, they will collect process data from sources of significant detected emissions at each of the monitored sites.
The National Physical Laboratory from the United Kingdom will conduct all DIAL measurements and be responsible for data evaluation and reporting of benzene and total hydrocarbon fluxes to the City of Houston. NPL will also measure the speciation of the VOCs in the measurement path using pumped sorbent tubes and GC analyses. These are used to modify the absorption cross section to relate to the molecular weight of the VOC mixture. Concurrent with the DIAL measurements, ARCADIS will use an open-path Optical-Fourier Transform Infrared (OP-FTIR) instrument to provide a path-averaged calculation of the alkane mixture concentrations and equivalent mass (molecular weight). EPA will use an open-path Ultra-Violet Differential Optical

Project No.: RN009285.0001
Element No.: A4
Revision No.: 1.0
Date: September 2009
Page: 2
Absorption Spectroscopy (UV-DOAS) instrument to provide this same information for benzene.
HDHHS will also provide funding for three Chemists to operate the City of Houston’s Mobile Ambient Air Monitoring Laboratory (MAAML). The MAAML will be placed near the midpoint of the DIAL path to collect monitoring data using near real-time continuous sampling procedures that can be used to characterize a range of emissions that will help to “fingerprint” or identify the emission patterns of specific facilities. HDHHS will also contribute to the project through covering operating costs incurred related to MAAML supplies, such as fuel, tubing and calibration gases.
Technical consultation will be provided by EPA Region 6 in Dallas, TX, and EPA’s Office of Research and Development, National Risk Management Research Laboratory, Air Pollution Prevention and Control Division in Research Triangle Park, NC. ARCADIS and its subcontractor Environ, will also provide technical consulting services. Both companies have extensive experience in optical remote sensing studies involving fugitive emissions from industrial sites.
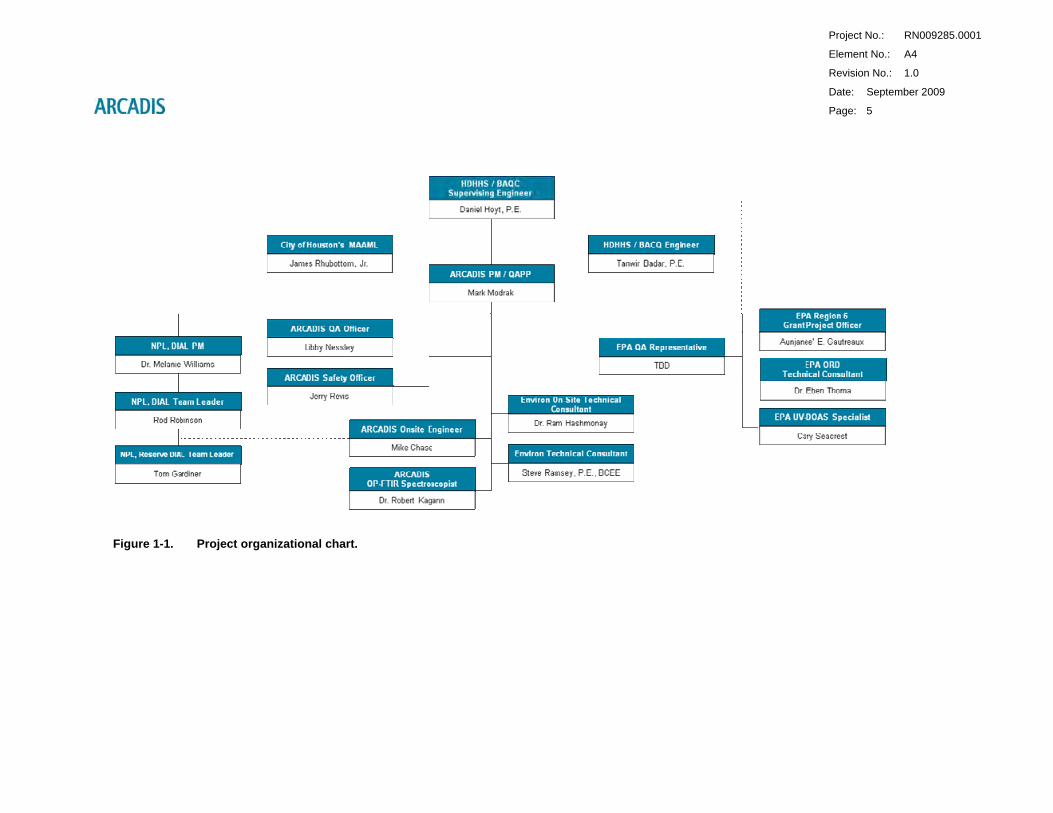
Table 1-1 lists the HDHHS/BAQC, City of Houston, National Physical Laboratory, EPA and ARCADIS personnel responsible for the oversight and completion of this task, as well as their project titles and contact information (telephone and e-mail). Contact information is also listed for the EPA and Environ technical consultants. Figure 1-1 is the project organizational chart which illustrates each group’s hierarchy and the lines of communication between groups.
Mr. Daniel Hoyt, P.E., will serve as the Supervising Engineer for HDHHS/BAQC. He is responsible for communicating the scope of work and deliverables required for this project to NPL, ARCADIS, EPA and the MAAML. He will perform the final data evaluation and project report to be submitted to EPA Region 6 incorporating the NPL DIAL, ARCADIS OP-FTIR, EPA UV-DOAS, MAAML near real-time continuous sampler, and process data. He will be assisted by Mr. Tanwir Badar, P.E., and they will be responsible for overall site Health and Safety. They will help identify the sources of emissions detected by the DIAL, keep track of the status of process and emissions inventory data requests, and provide assistance to the ARCADIS Technical Director and NPL DIAL Team Leader, as needed.
Mr. Mark Modrak will serve as the ARCADIS Project Manager, and has the overall responsibility for the OP-FTIR technical planning, execution, data reduction, and reporting related to this portion of the project. In addition to being responsible for the
Project No.: RN009285.0001
Element No.: A4
Revision No.: 1.0
Date: September 2009
Page: 3
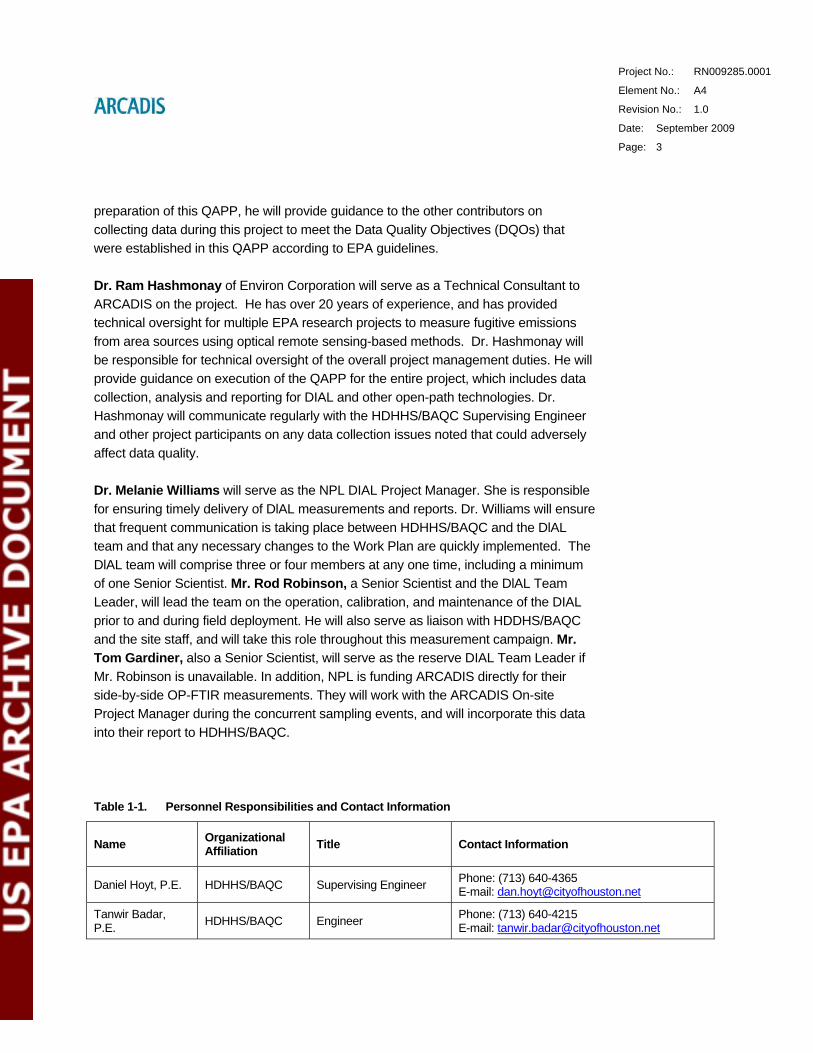
preparation of this QAPP, he will provide guidance to the other contributors on collecting data during this project to meet the Data Quality Objectives (DQOs) that were established in this QAPP according to EPA guidelines.
Dr. Ram Hashmonay of Environ Corporation will serve as a Technical Consultant to ARCADIS on the project. He has over 20 years of experience, and has provided technical oversight for multiple EPA research projects to measure fugitive emissions from area sources using optical remote sensing-based methods. Dr. Hashmonay will be responsible for technical oversight of the overall project management duties. He will provide guidance on execution of the QAPP for the entire project, which includes data collection, analysis and reporting for DIAL and other open-path technologies. Dr. Hashmonay will communicate regularly with the HDHHS/BAQC Supervising Engineer and other project participants on any data collection issues noted that could adversely affect data quality.
Dr. Melanie Williams will serve as the NPL DIAL Project Manager. She is responsible for ensuring timely delivery of DlAL measurements and reports. Dr. Williams will ensure that frequent communication is taking place between HDHHS/BAQC and the DlAL team and that any necessary changes to the Work Plan are quickly implemented. The DlAL team will comprise three or four members at any one time, including a minimum of one Senior Scientist. Mr. Rod Robinson, a Senior Scientist and the DlAL Team Leader, will lead the team on the operation, calibration, and maintenance of the DIAL prior to and during field deployment. He will also serve as liaison with HDDHS/BAQC and the site staff, and will take this role throughout this measurement campaign. Mr. Tom Gardiner, also a Senior Scientist, will serve as the reserve DIAL Team Leader if Mr. Robinson is unavailable. In addition, NPL is funding ARCADIS directly for their side-by-side OP-FTIR measurements. They will work with the ARCADIS On-site Project Manager during the concurrent sampling events, and will incorporate this data into their report to HDHHS/BAQC.
Table 1-1. Personnel Responsibilities and Contact Information
Name Organizational Affiliation Title Contact Information
Daniel Hoyt, P.E. HDHHS/BAQC Supervising Engineer Phone: (713) 640-4365 E-mail: [email protected]
Tanwir Badar, P.E. HDHHS/BAQC Engineer Phone: (713) 640-4215
E-mail: [email protected]

Name
Project No.: RN009285.0001
Element No.: A4
Revision No.: 1.0
Date: September 2009
Page: 4
Organizational Affiliation Title Contact Information
Mark Modrak ARCADIS ARCADIS Project Manager
Phone: (919) 328-5613 E-mail: [email protected]
Dr. Ram Hashmonay Environ Environ On-site
Technical Consultant Phone: (919) 616-6336 E-mail: [email protected]
Dr. Melanie Williams
National Physical Laboratory DIAL Project Manager Phone: +44 208-943-6121
E-mail: [email protected]
Rod Robinson National Physical Laboratory DIAL Team Leader Phone: +44 208-943-7146
E-mail: [email protected]
Tom Gardiner National Physical Laboratory
Reserve DIAL Team Leader
Phone: +44 208-943-7143 E-mail: [email protected]
Mike Chase ARCADIS ARCADIS On-Site Manager
Phone: (919) 328-5564 E-mail: [email protected]
Tomasz Balicki ARCADIS Reserve ARCADIS On-Site Manager
Phone: (919) 328-5575 E-mail: [email protected]
Robert Kagann ARCADIS OP-FTIR Spectroscopist Phone: (919) 544-4535 x85580 E-mail: [email protected]
Steve Ramsey, P.E., BCEE Environ DIAL Technical
Consultant Phone: (713) 470-6657 E-mail: [email protected]
Cary Secrest EPA UV-DOAS Specialist Phone: (202) 564-8661 E-mail: [email protected]
James Rhubottom, Jr. City of Houston MAAML Lead Chemist Phone: (713) 640-4318
E-mail: [email protected]
Aunjanee’ E. Gautreaux EPA Region 6 Grant Project
Officer Phone: (214) 665-7127 E-mail: [email protected]
Dr. Eben Thoma EPA ORD Technical Consultant
Phone: (919) 541-7969 E-mail: [email protected]
Laura Nessley ARCADIS QA Officer Phone: (919) 328-5588 E-mail: [email protected]
Jerry Revis ARCADIS Health and Safety Officer
Phone: (919) 328-5588 E-mail: [email protected]
Project No.: RN009285.0001
Element No.: A4
Revision No.: 1.0
Date: September 2009
Page: 5
Figure 1-1. Project organizational chart.

Project No.: RN009285.0001
Element No.: A4
Revision No.: 1.0
Date: September 2009
Page: 6
Mr. Mike Chase, as the ARCADIS On-site Project Manager, will carry out the OP-FTIR data collection activities described in this QAPP. Mr. Chase will also be responsible for the collection of relevant process data from site hosts upon detection of significant emissions and during each flare and delayed coker measurement. As part of Decision Making Team, Mr. Chase will maintain open communications with and seek advice from the ARCADIS Project Manager (Mr. Mark Modrak) and the ARCADIS Technical Director (Dr. Ram Hashmonay). Mr. Tomasz Balicki is an experienced field engineer in open-path measurements, and will serve as the Reserve On-Site Project Manager, if needed. Dr. Robert Kagann is an OP-FTIR spectroscopist and will consult on technical issues such as instrumentation QC, instrument operation/troubleshooting, and concentration analysis, including verification and calculation of the average alkane mixture. Steve Ramsey, P.E., BCEE, of Environ Corporation will serve as a Technical Consultant to ARCADIS on the project. Mr. Ramsey has experience in performing an environmental audit at a petroleum refinery using DIAL-based methods, and his expertise will be used to provide insight on operational issues with the DIAL system.
Mr. Cary Secrest, from EPA’s Headquarters, is a specialist on UV-DOAS who will be responsible for the operation, calibration, and maintenance of this instrument prior to and during field deployment, including verification and calculation of the average benzene concentration.
James Rhubottom, Jr., will serve as the MAAML Lead Chemist and supervise the other two chemists that comprise the MAAML staff. He will be responsible for the collection of the near real-time continuous sampling in concert with the DIAL, OP-FTIR and UV-DOAS measurements. This data will be provided directly to HDHHS/BAQC.
Ms. Laura Nessley is the Quality Assurance Manager of the ARCADIS Durham, NC Office. Ms. Nessley has extensive knowledge of EPA QA requirements, and has been involved in multiple EPA research projects. She reviewed this QAAP for adherence to EPA quality guidelines. A Region 6 EPA QA Representative will review this QAPP to ensure that the plan has the appropriate content and level of detail. Mr. Jerry Revis, the ARCADIS Health and Safety Officer, will review the Health and Safety Plan for the ARCADIS portion of this project prior to submission to the City of Houston.
Ms. Aunjanee’ E. Gautreaux will serve as an EPA Region 6 Grant Project Officer, and will be responsible for oversight of the cooperative agreement awarded to the City of Houston for this project. Dr. Eben Thoma, from the EPA Office of Research and Development, National Risk Management Research Laboratory, Air Pollution Prevention and Control Division will also serve as a Technical Consultant. HDHHS is

Project No.: RN009285.0001
Element No.: A4
Revision No.: 1.0
Date: September 2009
Page: 7
working with Dr. Thoma on ways to identify how HDHHS can implement EPA programs, standards, and other technologies to measure air toxics at the ppbv level and below, in the context of verifying DIAL results with the MAAML.
The EPA Office of Air Quality Planning and Standards, Sector Policies and Programs Division, Measurement Policy Group will also become an important partner. Ms. Robin Segall and Mr. Dennis Mikel of the EPA’s Measurement Policy Group has expressed interest in facilitating the demonstration of effective use of the DIAL technology at sites in the US.
In addition, experts from two Houston academic institutions, The University of Houston and Rice University, are key partners in advising and providing technical support to the City of Houston during data collection and interpretation. The University of Houston provides specialized expertise in chemical and meteorological measurements as well as air quality modeling. Rice University provides specialized expertise in air pollution analytical measurement and statistical interpretation of the empirical data.
The Houston Advanced Research Center (HARC) can provide HDHHS with technical direction, contacts, and coordinate research studies with a variety of partners with interest in performing related studies. HARC manages $10-12 million each year in air quality related research projects funded by the State of Texas. HARC has numerous contacts with regulatory agencies for counties, the State of Texas, EPA, university researchers, non-governmental organizations (NGO’s), and industry. HARC will provide consulting assistance to HDHHS for help in the planning, sample gathering, and execution of this project.
Environment Canada (EC) was a primary funding agency for DIAL projects in Alberta, Canada that were successfully executed in 2003 and 2004 involving five gas plants and in 2005 involving a refinery. EC has indicated significant interest in this proposed project and has offered to provide support. EC’s experience related to selecting project sites, developing site plans, implementing procedures and protocols and interpreting results will allow for EC to provide crucial input for the successful implementation of this project.
Project No.: RN009285.0001
Element No.: A5
Revision No.: 1.0
Date: September 2009
Page: 8
2. Problem Definition/Background
2.1 Background
Section 112 of the Clean Air Act (CAA), as amended in 1990, lists 188 hazardous air pollutants (HAPs) that are regulated by EPA. HAPs (also known as “air toxics”) are substances that can cause acute and/or chronic health effects such as short-term nausea, difficulty in breathing, and cancer; along with immunological, neurological, reproductive, developmental, and respiratory effects upon exposure to excessive concentrations.
Recently, toxicology reports from the Texas Commission on Environmental Quality (TCEQ) (Kadlubar, 2006), the U.S. EPA’s 1999 National-Scale Air Toxics Assessment (NATA) (EPA, 2006a), the Mayor’s Health Effects of Air Pollution Task Force (City of Houston, 2006), as well as studies conducted by Rice University (Forswall and Higgins, 2005) and the Houston Endowment, Inc. (Clements, et. al, undated) indicate that ambient air concentrations of the carcinogenic hazardous air pollutant benzene, exceed acceptable health levels in the Houston area. The Houston area faces particularly difficult air toxic challenges due to the significant air emissions from one of the largest petrochemical complexes in the world. Industrial sources in Harris County, home to Houston, reported the release of over 19 million pounds of hazardous air pollutants in 2003, including 750,325 pounds of benzene according to EPA’s 2003 Toxic Release Inventory (TRI) report. As such, ambient benzene concentrations pose serious health risks to Houston and Harris county residents. The City of Houston and Mayor Bill White have set forth an initiative in response to this documented problem to reduce ambient benzene concentrations through benzene and other VOC emissions reductions from the largest known stationary sources (City of Houston, 2007) which pose the greatest health risk to the community according to both measured and modeled data.
Shell Deer Park offered to voluntarily participate in this Study and make its refinery and chemical plant available for testing to obtain more information regarding the accuracy of emission factors and emission estimating methods widely used in industry. The intent of this project is not to single out a facility but to study conditions believed to be representative of industry more broadly.

Project No.: RN009285.0001
Element No.: A5
Revision No.: 1.0
Date: September 2009
Page: 9
2.2 Problem Definition
To compare the magnitude and sources of actual benzene and volatile organic compound (VOC) emissions to estimated emissions in the Houston Ship Channel area, The City of Houston, HDHHS/BAQC, their contractors NPL and ARCADIS, and EPA, will be receiving the following pieces of information from a number of locations suspected to be the main emission sources within the Shell Deer Park complex for the period covered by the 4-5 week (30 day) measurement campaign addressed by this QAPP. Table 2-1 summarizes these information components and the parties responsible for each element.
Table 2-1. Project Elements and Responsible Parties
Project Element Data/Information to Be Received Organization Responsible for Collection of the Data
Project Management QAPP execution. Liaison between HDHHS/BAQC, Shell representatives and other project participants. Technical oversight of all project elements
ARCADIS
Benzene and VOC Emission Fluxes
Measurements of total VOCs (benzene in the UV and alkane mixture in the IR), using DIAL, at suspected main emission source locations within Shell Deer Park and calculation of emission fluxes
NPL
Alkane Mixture Concentrations and Mass
Independent verification and calculation of average alkane mixture concentrations (ppm) and equivalent molecular weight, using OP-FTIR side-by-side with DIAL at each of the Shell Deer Park locations
NPL through subcontract with ARCADIS
Benzene Concentrations and Mass
Independent verification and calculation of average benzene concentrations (ppm), using UV-DOAS side-by-side with DIAL at selected Shell Deer Park locations
EPA
Characterization of VOC Emissions
Near real-time continuous sampling of VOCs, using MAAML the center of the DIAL measurement path, to help identify the sources of detected emissions and to provide additional speciation data
HDHHS/BAQC
Site Process Data Process data from suspected sources, in the vicinity of the DIAL measurements, to reconstruct emission rates
HDHHS/BAQC and ARCADIS
Speciation of Additional Compounds
Post data analysis of OP-FTIR spectra. Speciation of additional VOCs and other gaseous pollutants, upon request of HDHHS/BAQC.
ARCADIS

Project No.: RN009285.0001
Element No.: A5
Revision No.: 1.0
Date: September 2009
Page: 10
1. ARCADIS is responsible for the overall Project Management. As such, they will provide guidance on execution of the QAPP to meet the stated project goals; will serve as liaison between all of the project participants and the Shell site hosts; and will provide technical oversight to the DIAL and the other open-path technologies being employed during this field campaign.
2. NPL will apply DIAL, a proven remote sensing methodology, to measure the mass flux of benzene and VOC emissions from individual sources of benzene and VOC emissions at the host site in the Houston Ship Channel area. DIAL measurements will be made at a number of locations suspected to be the main emission sources within the Shell Deer Park complex.
3. ARCADIS (through a subcontract to NPL) will be responsible for side-by-side OP-FTIR measurements to serve as independent verification of the total hydrocarbon DIAL detections, and to allow for calculation of alkane mixture concentrations (in ppm) and equivalent mass.
4. EPA will be responsible for side-by-side UV-DOAS measurements to serve as independent verification of the benzene DIAL detections, and to allow for calculation of benzene concentrations (in ppm) at anticipated benzene sources and other benzene sources identified by OP-FTIR.
5. The City of Houston’s MAAML will collect near real-time continuous sampling near the center of the DIAL measurement path to characterize a range of emissions that will help to “fingerprint” or identify the emission patterns of specific facilities and to provide additional speciation data.
6. Upon detection of significant emissions with the DIAL, HDHHS/BAQC, in coordination with the host site, will employ a GasFindIR camera, ppbRae PID and a GIS instrument to identify the specific location where emissions are coming from. Additional follow-up by HDHHS/BAQC, in coordination with the host site, as described in Section 7.5, may also be requested. BAQC/HDHHS will initiate host site coordination as soon as practicable upon detection of significant emissions and before the commencement of the next day’s field measurement activities. ARCADIS will then collect relevant process data from the host site for use by HDHHS/BAQC in reconstructing emissions rates during the time periods when DIAL measurements occurred. Relevant process data will be collected from each flare and delayed Coker, monitored with DIAL, regardless of whether or not significant emissions are measured.

Project No.: RN009285.0001
Element No.: A5
Revision No.: 1.0
Date: September 2009
Page: 11
7. HDHHS/BAQC may request additional post-analysis of the OP-FTIR spectral data for speciation of additional VOCs (e.g., formaldehyde, 1,3-butadiene, methane, BTEX and highly reactive VOCs) and non-organic gaseous compounds (e.g., ammonia, SO2).
NPL, ARCADIS and HDHHS/BAQC will place their respective instruments (DIAL, OP-FTIR and MAAML) at each site after consultation between HDHHS/BAQC, Shell, the NPL Dial Team Leader and the ARCADIS On-site Manager (the Decision Team). Additionally, during the last week of the measurement campaign, EPA will place the UV-DOAS at each site in consultation with the Decision Team. The approximate first week of the campaign is expected to be carried out as a series of screening measurements at most, if not all areas of the refinery, to identify key emission source areas. This will allow for a more focused approach to measuring the most significant emission sources.
It should be noted that the DIAL can only be run in one configuration at a time; the IR configuration will provide total hydrocarbon profiles, and the UV configuration will provide benzene concentration profiles. As there is an additional cost associated with switching the DIAL between the IR and UV modes, it is anticipated that the IR mode will be used initially. The use of the UV mode for benzene will most likely occur toward the end of the project (focusing on anticipated benzene sources and benzene sources identified by the OP-FTIR), to coincide with the seven days that EPA will be available to operate the UV-DOAS.
Equipment location decisions will be made based on the results from the previous sampling, priority of emission sources and meteorological forecast (e.g. wind direction and daily conditions). One of the main advantages of the DIAL is its flexibility and responsiveness, particularly in its ability to react to changing wind conditions. Therefore, the DIAL may be moved to a new location during any particular sampling day if the wind changes direction or should other conditions dictate. Potential sources of emissions include a variety of individual sources such as flares, storage tanks, wastewater systems, cooling water systems, and miscellaneous processes.
ARCADIS will analyze the OP-FTIR data collected and provide a time series of alkane mixtures for each run to NPL upon completion of the monitoring and sampling phase. EPA will provide similar information pertaining to benzene utilizing the UV-DOAS, for time periods when EPA is on site. NPL will provide an initial qualitative assessment of the DIAL emission fluxes within one day of the measurements. This will be sufficient to identify significant sources. The production of full flux data for each site will be

Project No.: RN009285.0001
Element No.: A5
Revision No.: 1.0
Date: September 2009
Page: 12
performed by NPL post-campaign and provided to HDHHS/BAQC. HDHHS/BAQC will take the NPL report and incorporate the MAAML VOC characterization results, along with the process data collected, and create the final report for EPA Region 6.
The long-term anticipated outcome of this project, in addition to improving emissions estimates, will be to identify and encourage reasonable benzene and VOC emissions reductions from major stationary sources. Reductions in benzene and VOC emissions typically lead to corollary reductions in emissions of other HAPs emitted by the same processes. Effective emissions reductions will result in reduced ambient benzene and other HAPs concentrations, reducing human exposure and the risk of adverse health effects from atmospheric exposure.
2.3 Known Information
The largest major stationary sources of benzene, as well as the greatest density of ambient benzene monitors in the country are located in the east Houston/east Harris County/Houston Ship Channel area. According to the Texas Emissions Inventory, emissions of benzene from these industrial sources are comprised as follows: wastewater (10%), cooling towers (6.5%), flares (13.3 %), fugitive − not including cooling towers, wastewater or tanks (34%) and miscellaneous loading, unloading, vents (36.1 %) (City of Houston, 2007). Much of the data reported on the Texas Emissions Inventory is based on engineering calculations rather than direct measurement of emissions and this study will evaluate the accuracy of those emissions estimating techniques. Further quantification of emissions, beyond the self-reported emission inventory, is necessary to potentially identify additional emission release locations as well as underreported sources, so that effective emission reduction strategies can be identified, evaluated, prioritized and implemented.
The detailed identification and quantification of actual emissions from individual stationary sources is especially salient in light of the results of the Texas Air Quality Study (University of Texas, 2009) which noted measurements of ambient concentrations of certain VOC species in the Houston Ship Channel area at levels six-times greater than predicted from modeling of emissions estimates reported to the TCEQ's emissions inventory. Quantitative measurements would therefore not only form the basis of a successful community-scale air pollution reduction effort, but would provide empirical ground-truthing of emissions inventory estimates. The accuracy of the emissions inventory directly impacts the quality of many environmental initiatives such as air modeling, human health risk assessments, and evaluation of ozone attainment emissions control strategies.

Project No.: RN009285.0001
Element No.: A5
Revision No.: 1.0
Date: September 2009
Page: 13
The DIAL method has been used extensively to perform emissions studies at industrial settings. The Texas Air Quality Study used DIAL to measure ozone mass flux from the Houston Ship Channel area. DIAL has also been used to measure mass flux of benzene and VOC from refineries and other benzene sources in Canada and Europe. The results from the use of DIAL in Canada and Europe indicated VOC mass fluxes 5 to 20 times higher than reported by the same refineries using standard emission factors and estimating techniques (EPA, 2006b). The use of DIAL in other places has led to the identification of unknown/underestimated emission sources (e.g., coker operations) and the prioritization of emission reduction measures within a facility based on emission magnitude and downwind ambient concentration impact. This project will attempt to determine how adequate currently utilized emissions estimation techniques are in predicting emissions. This project will also evaluate emission control strategies and pollution reduction opportunities, if any unknown/underestimated emissions sources are identified.
BAQC will use DIAL to assess mass emission rates of benzene and VOC, in and around the major emission sources in the Houston Ship Channel area (specifically, in the Shell Deer Park complex). DIAL is a powerful instrument used to measure quantities of specific VOC species across a wide physical area, without the limitations of non-mobile stationary sensors. The results of the DIAL measurements will be used to evaluate emissions estimates and identify unknown/underestimated emission sources so that emission reduction measures can be assessed and prioritized. If significant (unanticipated or under-reported) sources of benzene or VOC are discovered, the owner/operator of the site will be timely notified and encouraged to take appropriate action to address the circumstance (including implementing effective emissions reductions options), and re-measure using DIAL if emissions reductions strategies have been implemented. The data would also be used as an input to adjust industry wide emission estimating factors. The objective of this study is not a Shell Deer Park specific result. Rather the objective is to develop information relating to emission estimating on a broader scale to improve existing knowledge of emissions sources and the quantification of related emissions.
In contrast to DIAL, traditional single point sensors can only measure analytes of interest at the precise time and location at which the sample is taken. Due to the constantly changing nature of meteorological conditions, the traditional point sensor method of sample collection limits the sensor's field-of-vision. DIAL uses laser light in conjunction with the unique chemical properties of ambient air pollutants to identify and quantify VOC concentrations through large air masses with a working range of over 500 m.
Project No.: RN009285.0001
Element No.: A5
Revision No.: 1.0
Date: September 2009
Page: 14
The density of refineries and petrochemical complexes within the Houston Ship Channel area makes source emission identification very difficult. Many of these sites share common fence lines, and fixed site monitors cannot adequately collect enough information to propose back-trajectory modeling to discover exact point sources. DIAL's range and scope can identify and quantify the emissions in air masses traveling between fence lines to determine individual pollution contributions of specific chemical complexes.
2.4 Recipients of the Open-Path VOC Data
Upon completion of the monitoring and sampling phase, OP-FTIR data collected by ARCADIS, and UV-DOAS data collected by EPA, will be analyzed and sent to NPL. NPL will incorporate this data with their DIAL data, and prepare a report for HDHHS/BAQC. HDHHS/BAQC will incorporate the data collected by the MAAML along with the process data collected, and will prepare the final report of all results for EPA Region 6. The final report to EPA will document methodology, field monitoring, data analyses, measurement accuracy, comparison of measured benzene and VOC emission rates to reported emission rates, the feasibility of identified emissions reduction opportunities and cost effectiveness of DIAL System measurements.
Presentation of project results from VOC and benzene monitoring activities is anticipated at a national EPA monitoring conference or workshop. In addition, this data is expected to be used to prepare manuscripts for publication in journals.
2.5 Intended Use of the Data
Data collected from this project will be used by HDHHS/BAQC to meet the following objectives. They will be collected in conformance with the quality requirements of this EPA QAPP.
1. Develop, improve and demonstrate DIAL system emissions measurement methods for estimating the mass flux of benzene and VOC from individual emissions sources within the Shell Deer Park complex.
2. Evaluate and verify the DIAL system benzene and VOC measurements using the City of Houston’s Mobile Ambient Air Monitoring Laboratory (MAAML), grab samples or pumped sorbent tube measurements (collected by NPL as part of the DIAL methodology), and other monitoring/open path measurement techniques (OP-FTIR and UV-DOAS).

Project No.: RN009285.0001
Element No.: A5
Revision No.: 1.0
Date: September 2009
Page: 15
3. Identify unanticipated/underestimated sources of benzene and VOC.
4. Evaluate emission estimation techniques currently utilized to determine VOC and benzene emission rates by comparing DIAL measurements with estimated emissions.
5. Evaluate reasonable emissions reduction strategies for the most significant emissions sources measured.
6. Assess the cost effectiveness of the DIAL system based on project costs, estimated potential emissions reduction strategies costs and the estimated cost savings anticipated by preventing the loss of valuable products, intermediates and/or raw materials via the preliminary assessment of potential emissions reduction strategies.
Air pollution control authorities from two counties, Harris County and Galveston County, are key partners interested in understanding and potentially applying the project results. Harris County represents an important partner because many petrochemical plants are located outside Houston's city limits, within Harris County, yet significantly affecting Houston's air quality. Galveston County is another important partner to HDHHS because they also have a large-scale concentrated petrochemical complex, and face similar problems with elevated HAPs in the ambient air. Galveston County anticipates utilizing the data collected in this project to identify analogous emission reduction opportunities from sources within their jurisdiction.
Project No.: RN009285.0001
Element No.: A6
Revision No.: 1.0
Date: September 2009
Page: 16
3. Project/Task Description and Schedule
3.1 Project/Task Description
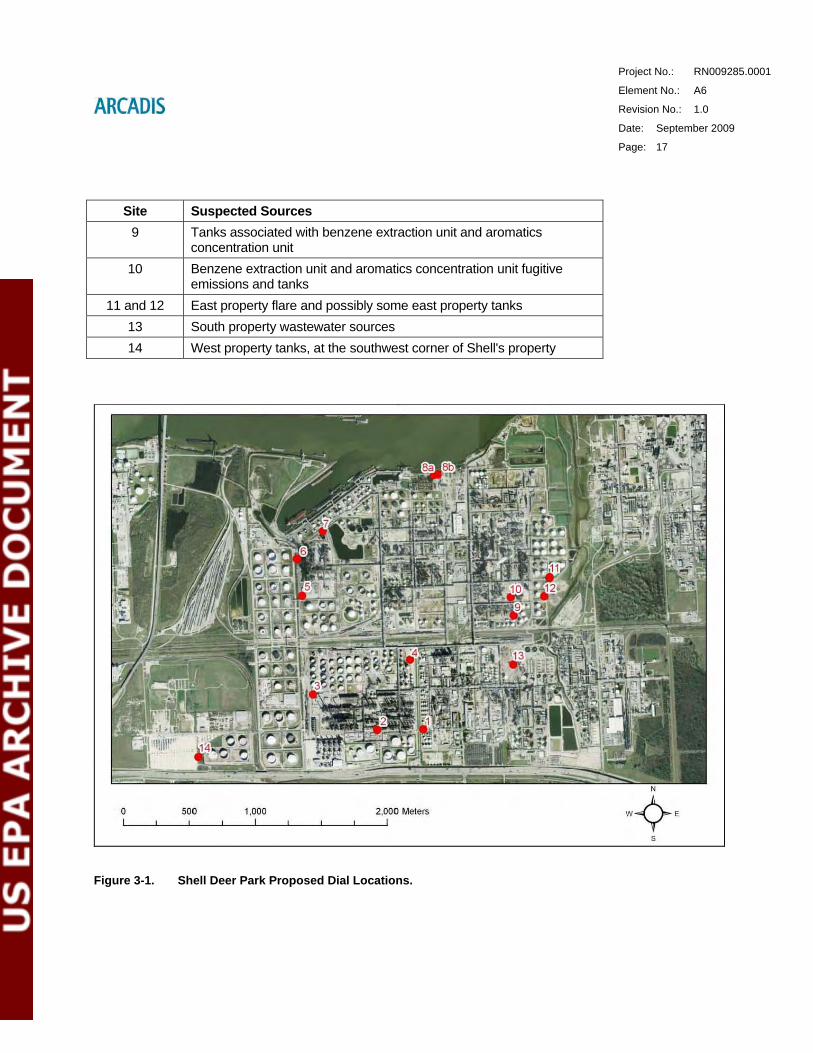
Benzene and VOC emissions data will be collected by NPL using DIAL, by ARCADIS using OP-FTIR (alkane mixture only), and by EPA using UV-DOAS (benzene only for seven days) at a number of locations suspected to be the main emission sources within the Shell Deer Park complex. Potential sources of these total emissions could include a variety of individual sources at the Shell Deer Park complex, including flares, storage tanks, wastewater systems, cooling water systems, and miscellaneous processes. Figure 3-1 shows some of the most likely significant source locations within Shell Deer Park, with Figures 3-2 through 3-15 showing aerial close-ups of these sites. Additional sites may be included in the screening measurements to be made during the first week of the sampling campaign. All of the targeted sources and proposed configurations (shown as red lines, and for illustrative purposes only) were chosen based on prevailing south/southeast winds, which are expected during the field deployment in November. As stated earlier, should winds change during any particular sampling day, or should any other conditions dictate, the DIAL (and OP-FTIR and UV-DOAS) can be moved to an alternate location In addition, the DIAL does not provide data in the first 50 m (50 m ‘stand off’), which will be taken into account when actual configurations are being determined. Table 3-1 lists the suspected sources at each of the initially proposed locations.
Table 3-1. Project Elements and Responsible Parties Site Suspected Sources
1 and 2 Tanks south of olefins units, including pyrolysis gasoline tanks 3 OP2 and OP3 elevated flares (OP2ELFLA & OP3ELFLA), olefins
units cooling tower and process unit fugitives, and certain tanks north of the olefins units
4 OP2 and OP3 elevated flares (OP2ELFLA & OP3ELFLA), OP3 ground flare (OP3GRFLA) and certain tanks north of the olefins units. This location may also be good for olefins units cooling towers and process unit fugitives
5 Tanks generally south of the coker units (West Operations Tank Farm)
6 Coker units and tanks generally west of coker units 7 West property flare (WP FLARE), tanks east of coker units and
possibly the coker flare 8 North property wastewater sources (primarily refinery wastewater) and
possibly some north property tanks
Project No.: RN009285.0001
Element No.: A6
Revision No.: 1.0
Date: September 2009
Page: 17
Site Suspected Sources 9 Tanks associated with benzene extraction unit and aromatics
concentration unit 10 Benzene extraction unit and aromatics concentration unit fugitive
emissions and tanks 11 and 12 East property flare and possibly some east property tanks
13 South property wastewater sources 14 West property tanks, at the southwest corner of Shell's property
Figure 3-1. Shell Deer Park Proposed Dial Locations.

Project No.: RN009285.0001
Element No.: A6
Revision No.: 1.0
Date: September 2009
Page: 18
Figure 3-2. Proposed Dial Location 1: Tanks south of olefins units, including pyrolysis gasoline tanks
Figure 3-3. Proposed Dial Location 2: Tanks south of olefins units, including pyrolysis gasoline tanks

Project No.: RN009285.0001
Element No.: A6
Revision No.: 1.0
Date: September 2009
Page: 19
Figure 3-4. Proposed Dial Location 3: OP2 and OP3 elevated flares (OP2ELFLA & OP3ELFLA), olefins units cooling tower and process unit fugitives, and certain tanks north of the olefins units
Figure 3-5. Proposed Dial Location 4: Shell Deer Park: OP2 and OP3 elevated flares (OP2ELFLA & OP3ELFLA), OP3 ground flare (OP3GRFLA) and certain tanks north of the olefins units. This location may also be good for olefins units cooling towers and process unit fugitives

Project No.: RN009285.0001
Element No.: A6
Revision No.: 1.0
Date: September 2009
Page: 20
Figure 3-6. Proposed Dial Location 5: Tanks generally south of the coker units (West Operations Tank Farm)
Figure 3-7. Proposed Dial Location 6: Coker units and tanks generally east of coker units

Project No.: RN009285.0001
Element No.: A6
Revision No.: 1.0
Date: September 2009
Page: 21
Figure 3-8. Proposed Dial Location 7: West property flare (WP FLARE), tanks east of coker units and possibly the coker flare
Figure 3-9. Proposed Dial Location 8: North property wastewater sources (primarily refinery wastewater) and possibly some north property tanks
Project No.: RN009285.0001
Element No.: A6
Revision No.: 1.0
Date: September 2009
Page: 22
Figure 3-10. Proposed Dial Location 9: Tanks associated with benzene extraction unit and aromatics concentration unit
Figure 3-11. Proposed Dial Location 10: Benzene extraction unit and aromatics concentration unit fugitive emissions and tanks

Project No.: RN009285.0001
Element No.: A6
Revision No.: 1.0
Date: September 2009
Page: 23
Figure 3-12. Proposed Dial Location 11: East property flare and possibly some east property tanks
Figure 3-13. Proposed Dial Location 12: East property flare and possibly some east property tanks
Project No.: RN009285.0001
Element No.: A6
Revision No.: 1.0
Date: September 2009
Page: 24
Figure 3-14. Proposed Dial Location 13: South property wastewater sources
Figure 3-15. Proposed Dial Location 14: West property tanks, at the southwest corner of Shell's property

Project No.: RN009285.0001
Element No.: A6
Revision No.: 1.0
Date: September 2009
Page: 25
Measurements for VOC emissions will begin with the approximate one-week long screening study of as many suspected source locations as possible. More in-depth sampling will then proceed at the locations identified as the most significant sources, and is expected to continue until the last week of the campaign, Ideally, and if possible within the time and budget constraints, three days of sampling will be conducted at each site of identified significant sources. One day will then be required to change the DIAL from the IR (total hydrocarbon) to UV (benzene) mode, at which time EPA will join the sampling team for the final seven days of the campaign.
The Decision Team (HDHHS Supervising Engineer, Shell, NPL DIAL Team Leader, and ARCADIS On-Site Project Manager) will meet each day to discuss the previous day’s results, review weather forecasts, and plan operations for the next day. The location chosen for the next day’s sampling will be based on the results already obtained, expected prevailing wind direction, site operations (e.g., tank movement schedules) and monitoring location priorities. If the previous results indicate that the monitored location is not a source of significant emissions, no additional measurements will be made at that location.
Normally, when the DIAL is measuring in the IR configuration for total hydrocarbons, the OP-FTIR will provide independent verification of the total alkanes and the equivalent molecular mass. If available, the UV-DOAS will provide independent verification of the proportion of benzene to the total VOC plume. When DIAL is measuring in the UV configuration for benzene, OP-FTIR will provide the proportion of the alkane mixture in the same plume, and the UV-DOAS (when available) will provide confirmation of the benzene values being measured in as side-by-side comparison. NPL also collects air sample data (using pumped sorbent tubes) that are subsequently analyzed to provide speciation and concentration data on a wider range of specific VOCs than can be achieved with OP-FTIR or UV-DOAS. NPL will use the air data to correct the DIAL, and to serve as a comparison with the OP-FTIR and UV-DOAS results.
However, when elevated sources such as flares and delayed cokers are being measured by the DIAL, the OP-FTIR (and UV-DOAS data when collected) will serve as a reference measurements since the OP-FTIR and UV-DOAS will not be expected to measure the emissions plume from the elevated source unless mounting a retroreflector or IR/UV source at an elevated height is approved by and coordinated with the host site. When these elevated sources are being monitored with the DIAL, and provided they are significant sources of both benzene and VOCs, three days in the IR configuration, and three days in the UV configuration (at the end of the campaign

Project No.: RN009285.0001
Element No.: A6
Revision No.: 1.0
Date: September 2009
Page: 26
when the DIAL is changed to the UV mode) would be desired. It is often the case that air samples (NPL and MAAML) can be made downwind in the plume of elevated sources and these will provide an indication of the VOC/benzene split. This is certainly the case for cokers, but less so for elevated flares, although benzene emissions from those plumes are likely to be low.
The field campaign is expected to last 4-5 weeks (30 days). The measurement campaign will be conducted using DIAL, OP-FTIR and UV-DOAS (when available – most likely during the final seven days of the campaign) for seven hours per day, six days a week, for the duration of the project. Moving the DIAL and calibration time is included in the seven hours a day. A detailed description of the Experimental Design is included in Section 7.
ARCADIS will provide Project Management support during the field campaign, and will provide oversight to all parties in the collection of the data according to the data qualify goals established in this QAPP. ARCADIS will be represented daily by the On-site Project Manager, who will stay in frequent communication with the ARCADIS Project Manager and Technical Director. One of the latter will visit the site again during the field campaign to verify data quality and that data collection is proceeding appropriately to meet the stated project goals, and both will be available by telephone to provide management and overall technical oversight to the project, as needed.
As part of these responsibilities, ARCADIS will collect the relevant plant process information upon detection of significant emissions from a specific source and from each flare and delayed coker during flare and coker DIAL measurements. HDHHS/BAQC will use a GasFindIR camera, ppbRae PID and a GIS instrument for the purpose of identifying the specific location where emissions detected with DIAL are coming from. Details of the process information to be collected are included in Section 7.
The DlAL team will comprise three or four members at any one time, including a minimum of one Senior Scientist. The DlAL Team Leader will be responsible for the operation, calibration, and maintenance of the DIAL prior to and during field deployment. He will also serve as liaison with HDDHS/BAQC and will work with them in determining the exact location for the DIAL setup at each location.
ARCADIS will also conduct side-by-side measurements with the DIAL for independent verification and determination of alkane mixture concentrations and equivalent molecular mass. Their portion of the measurement campaign will be conducted using a

Project No.: RN009285.0001
Element No.: A6
Revision No.: 1.0
Date: September 2009
Page: 27
single beam configuration using an OP-FTIR instrument. The ARCADIS Project Manager and/or Technical Director will be on-site for the initial deployment and first several days of sample collection to verify that the instrument is being deployed and is running properly. The ARCADIS On-Site Project Manager will remain throughout the campaign, and will be responsible for the instrument’s calibration, QC checks, and any required maintenance.
EPA will conduct side-by-side measurements with the DIAL for independent verification and determination of benzene concentrations for seven days, most likely toward the end of the sampling campaign. Their portion of the measurement campaign will be conducted using a bistatic UV-DOAS instrument. The EPA UV-DOAS Specialist will be on-site during this time, and will be responsible for the instrument’s calibration, QC checks, and any required maintenance.
The City of Houston’s MAAML will be collecting ambient VOC data in the vicinity of the DIAL measurements. Their Lead Chemist will supervise the other two chemists that comprise the MAAML staff. He will be responsible for the collection of the near real-time continuous sampling in concert with the DIAL, OP-FTIR and UV-DOAS measurements.
The objectives for this project are all based on collecting as much information as possible on benzene and other VOCs in the Houston Ship Channel area (i.e., in the Shell Deer Park complex). These objectives will be met by collecting the following data at the site:
• Benzene and VOC emission flux measurements using DIAL technology; independent verification of these detections and calculation of alkane mixture and benzene concentrations and equivalent molecular mass using a single-beam OP-FTIR and a bistatic UV-DOAS instrument, respectively; and ambient VOC data using the MAAML. The open path and MAAML data may also provide time-series information which may also aid in interpretation of the DIAL campaign results.
• Process data from sources of significant detections at each location.
• Quality control (QC) check results
• Meteorological data collected during the field campaign.

Project No.: RN009285.0001
Element No.: A6
Revision No.: 1.0
Date: September 2009
Page: 28
3.1.1 DIAL Methodology
DIAL technology uses multiple lasers and meteorological data to measure and map both concentrations and mass emissions of various chemical species in the lower atmosphere. DIAL is a measurement technique that can directly obtain mass emissions fluxes of various chemical species from a large area, such as an industrial complex.
The DlAL system in this project will be responsible for taking measurements of benzene when operating under the ultraviolet (UV) configuration, and total hydrocarbons when operating under the infrared (IR) configuration. The DIAL is able to make measurements of a wide range of compounds (one at a time), including benzene and other aromatics, individual VOCs and total VOCs (described in detail in Section 7, Experimental Design). A scanner system directs the output beam and detection optics, giving almost full coverage in both the horizontal and vertical planes. From this data, concentration profiles and mass emission fluxes along defined vertical cross section can be produced.
The NPL DlAL has a maximum working range of between 500 m to 2 km depending on atmospheric conditions, the pollutant being monitoring and its concentration. The usual configuration to monitor an emissions flux is to measure in a scan which is close to normal to the pollutant plume. However, it should be noted that the DIAL does not provide data in the first 50 m (50 m “stand off’), which will be taken into account when determining the actual path configurations. Figure 3-16 illustrates an example of the NPL DIAL configuration setup.

Project No.: RN009285.0001
Element No.: A6
Revision No.: 1.0
Date: September 2009
Page: 29
Figure 3-16. Example of the NPL DIAL configuration setup.
The distance that the DlAL can be away from the source is primarily driven by how dispersed the plume is at the range at which the DlAL can measure. In many cases it is possible to scan the DIAL beam closer to the source in order to improve the detection sensitivity.
Hot and humid conditions could be an issue for the DIAL, since there are components that must be kept cool and free of moisture to operate properly. NPL has successfully carried out DlAL measurements in hot and humid conditions, including the 2007 survey of a refinery and tank farm in the Texas City area for TCEQ (2007) and a summer measurement campaign in Athens, (Gardiner, et al., 1996). The system is fitted with three air conditioning systems, and can be fitted with additional cooling, if required, to cope with any temperatures that may be encountered during the sampling campaign.

Project No.: RN009285.0001
Element No.: A6
Revision No.: 1.0
Date: September 2009
Page: 30
3.1.2 OP-FTIR Technology
OP-FTIR is an accepted quantitative technique to measure gaseous air toxics and VOCs. It is an EPA and ASTM approved testing method: TO-16 (EPA, 1999; ASTM, 1997; ASTM, 1998).
The OP-FTIR instrument passes IR light along an open beam path to identify and measure any absorbing chemical in the beam path. The OP-FTIR to be used in this project is a monostatic in which the receiver and transmitter are in a single instrument. The single transmitter/receiver telescope transmits the IR beam to a corner-cube retroreflector array (mirror) that returns the respective beam back to the transmitter/receiver for detection and processing. Since most molecular vapors and gases are IR active, the OP-FTIR sensors are capable of detecting and measuring a large number of atmospheric species and contaminants simultaneously (e.g., Total Hydrocarbon (THC); benzene, toluene, ethylbenzene, xylenes (BTEX); Highly Reactive Volatile Organic Compounds (HRVOC); 1,3-butadiene; formaldehyde; styrene).
The OP-FTIR spectra are analyzed using a multi-variant regression fit (Haaland and Easterling, 1982) to quantitatively calibrated reference spectra to determine the path-integrated concentrations of any absorbing gas. Most of the IR spectral references were created by Pacific Northwest National Laboratory (PNNL) in collaboration with the National Institute of Standards and Technology (NIST).
The OP-FTIR data will be used in this study to confirm the total hydrocarbon (alkane mixture) concentration measurements from the DIAL instrument collected along the same measurement path. Data from the instruments will be used to analyze the same absorption feature in the C-H stretch region of the spectrum. However, the OP-FTIR data will be used to determine the mean carbon number of the alkane mixture, which is necessary to calculate the mass emission flux. More information on the technique used for this determination can be found in the next section.
3.1.2.1 Procedure for Calculation of Alkane Mixture Concentrations and Equivalent Molecular Mass
ARCADIS has developed a method for spectral analysis of the alkane mixture. The method uses two alkanes to perform spectral analysis of the alkane mixture. The method provides a direct measurement-based determination of the mean carbon number of the mixture, and provides this determination for every data point collected. This results in a more accurate determination of the mass emission flux of the mixture,

Project No.: RN009285.0001
Element No.: A6
Revision No.: 1.0
Date: September 2009
Page: 31
as any changes in composition of the mixture (and mean carbon number) are accounted for in the mass flux calculation. More information on this analysis procedure can be found in Appendix A, Procedure to Convert OP-FTIR Volume Concentration Determinations of Alkane Mixture that Originate from Petroleum-Based Fuels to Mass Concentrations. VOC data will be collected by the NPL DIAL team and are the primary data used to determine flux measurements. The methodology for obtaining measurements of the total VOC content from C3 to C15 consists of the combination of DlAL measurements with air sampling and GC analysis.
3.1.2.2 Further Speciation of Gaseous Air Pollutants
HDHHS/BAQC may request additional post-analysis of the OP-FTIR spectral data for speciation of additional VOCs (e.g., formaldehyde, 1,3-butadiene, methane, BTEX and highly reactive VOCs) and non-organic gaseous compounds (e.g., ammonia, SO2). These analyses would be conducted to provide additional ratios of emissions for other compounds, if funding allows.
3.1.3 Benzene Concentrations from the UV-DOAS
The UV-DOAS is used to determine the presence of various gases along a measured path length (volume) of the atmosphere and operates on the principle that each type of gas molecule has its own unique absorption behavior at various wavelengths in the electromagnetic spectrum. Since each type of gas molecule is distinct from one another, it is possible to identify different individual gases based upon their uniquely individual spectral ‘fingerprints’.
EPA will use a single-beam, bistatic (with both a transmitter and a receiver) UV-DOAS instrument. Continuous path-integrated benzene concentration data will be collected along the UV-DOAS beam path. No additional calculations will be required.
3.2 Project Schedule
Table 3-1 details the project schedule for the measurement campaign. The measurement portion of this project is tentatively scheduled to occur between November 13, 2009 and December 23, 2009. DIAL, OP-FTIR and UV-DOAS (when on site) measurements are expected to be conducted six days a week for the duration of the project, except during the weeks of Thanksgiving and Christmas, which will be three-day weeks. The HDHHS/BAQC Supervising Engineer will decide which locations are to be monitored and their order on the schedule in consultation with the rest of the Decision Team.

Project No.: RN009285.0001
Element No.: A6
Revision No.: 1.0
Date: September 2009
Page: 32
The NPL DIAL Team Leader (or alternate) and ARCADIS On-site Project Manager will be on-site throughout the sampling campaign. The EPA UV-DOAS Specialist will be on-site for seven days. Each will be responsible for all required calibration and maintenance activities on their respective instruments. Daily, and often more frequent communication will occur between the on-site teams and between the HDHHS/BAQC Supervising Engineer. The HDHHS/BAQC Supervising Engineer will be responsible for communication with the MAAML Lead Chemist. The sampling campaign is tentatively scheduled to conclude on December 23, 2009.
There are potential circumstances which could interrupt, and extend, the sampling period. Equipment malfunction, severe weather, or unacceptable quality of data according to DIAL, OP-FTIR or UV-DOAS criteria, could result in sample interruption. Any period of lost data collection may be added to the end of the sampling campaign for up to an additional two-week period, with approval from the host site and budget permitting. Any delays encountered during this study, as well as any unanticipated issues (and resulting corrective actions) that arise, will be communicated to the HDHHS/BAQC Supervising Engineer listed in Table 1-1 and documented in the project records and in the Weekly Progress Report (discussed in Section 18.1) .

Project No.: RN009285.0001
Element No.: A6
Revision No.: 1.0
Date: September 2009
Page: 33
Table 3-1. Project Schedule
Activity Tentative Date1 Deliverable Deliverable Due Date1
Initial Site Safety Training November 13, 2009 NA NA Project Kickoff Meeting November 13, 2009 NA NA Initial Deployment of Instruments November 14-16, 2009 NA NA Project Measurements Begin November 14-16, 2009 NA NA
Benzene and VOC Flux Measurements
~One week screening for VOCs to identify sources, then up to three days at each location One day changeover, with last seven days of campaign for benzene
Data downloaded/backed up by NPL, ARCADIS, and EPA Missing/unacceptable data periods determined after review and corrective action
HDHHS/BAQC Supervision Engineer will be kept up-to-date on sampling issues. Details will be included in the Weekly Progress Report.
Ambient VOC Data Concurrent with benzene and VOC measurements
Data downloaded/backed up by MAAML Same as above
Process Data
As directed by the HDHHS/BAQC Supervising Engineer upon detection of significant emissions, and at the flare and delayed coked locations
Facility-specific process data, as detailed in Section 7 and included in Appendix B
Will be requested immediately from and reasonably provided by Shell site host. Details will be included in the Weekly Progress Report.
Daily Coordination Meeting Daily NA NA
Calibration and Maintenance As required Any required actions or schedule impacts
To be included in the Weekly Progress Report.
Last Day of Scheduled Measurements December 23, 20091 NA NA Site Breakdown December 23-24, 2009 NA NA
Weekly Progress Report Wednesday following the end of the sampling week
HDHHS/BAQC Supervising Engineer detailing any major issues encountered, actions taken, and impact to project schedule. Shell, NPL, ARCADIS and EPA will have daily meetings to discuss project progress
November 18, 2009 November 25, 2009 December 2, 2009 December 11, 2009 December 16, 2009
Draft Final Project Report NA
Draft Final Project Report with benzene and VOC flux calculations for the four-week measurement period
February 26, 2010
Final Project Report NA Final Project Report incorporating HDHHS/BAQC comments
March 30, 2010 (assuming 4-week review by HDHHS/BAQC)

Project No.: RN009285.0001
Element No.: A6
Revision No.: 1.0
Date: September 2009
Page: 34
1 This assumes a start date of November 13, 2009 and sampling six days a week. Should sampling be interrupted due to circumstances such as equipment malfunction, severe weather, missing wind data, or unacceptable quality of data according to DIAL, OP-FTIR or UV-DOAS criteria, the length of the sample interruption may be added to the end of the sampling campaign for up to a two-week contingency with approval from Shell and if budget permits.
3.3 Shell Escort Planning
Shell Deer Park is a controlled industrial complex, and per limitations and requirements and U.S. Department of Homeland Security regulations, through an agreement with the Port Authority, can allow only five project personnel to be on-site at any one time for each Shell escort. All project personnel must be in the line of sight of the Shell escort. All project personnel must be met by the escort at Gate 34 or at the Shell Deer Park Center before entry to the site will be allowed. The following plan has been drafted to allow for effective deployment of the various project staff required to complete the project objectives.
DIAL Project Personnel for Normal DIAL Project Operations:
NPL: Three individuals to operate the DIAL system and ancillary DIAL equipment.
ARCADIS: One individual to serve as Project Manager and operate OP-FTIR
equipment. City of Houston: One individual to support NPL and ARCADIS and for general project
oversight/coordination.
Situations where additional staff will be involved, without the need for additional Shell staff resources:
EPA: When Cary Secrest is on-site to operate the UV-DOAS, he will take the place of the City of Houston’s normal project operations staff. At least one City of Houston project member will be stationed at the Shell Conference Center each day that Cary Secrest is on-site, for general project oversight/coordination.
MAAML: The MAAML will be deployed and operated within Shell's fence line
and without continual staffing. MAAML staff will coordinate directly with Shell regarding safety and logistical considerations, and will enter the Shell site as needed, and at least one to two times each day the MAAML is deployed inside Shell's fence line. These visits will be used to ensure that the MAAML is operating correctly and is
Project No.: RN009285.0001
Element No.: A6
Revision No.: 1.0
Date: September 2009
Page: 35
adequately fueled, and for conducting daily calibrations and related maintenance. MAAML staff will coordinate and rotate with Cary Secrest (EPA), NPL staff or the on-site City of Houston normal project operations staff, as appropriate, such that only five project personnel will be inside Shell's site fence line at any given time during normal project operations.
Situations where additional staff will be involved, with the need for additional Shell staff resources:
If sampling, monitoring or GasFindIR camera follow-up is determined to be warranted, the HDHHS/BAQC Supervising Engineer and City of Houston will provide reasonable advance notice and coordinate with Shell to seek one additional employee from Shell's staff to accommodate the necessary additional City of Houston or EPA staff involvement (up to five additional City of Houston project staff will be available). As an example, DIAL results at a particular location may indicate the need for UV-DOAS monitoring during overnight or early morning hours. Coordination with Shell regarding needs for additional Shell staff resources will begin as soon as the need for sampling, monitoring or GasFindIR camera follow-up is identified.
Project No.: RN009285.0001
Element No.: A7
Revision No.: 1.0
Date: September 2009
Page: 36
4. Quality Objectives and Criteria for Measurement Data
4.1 Data Quality Objectives (DQOs)
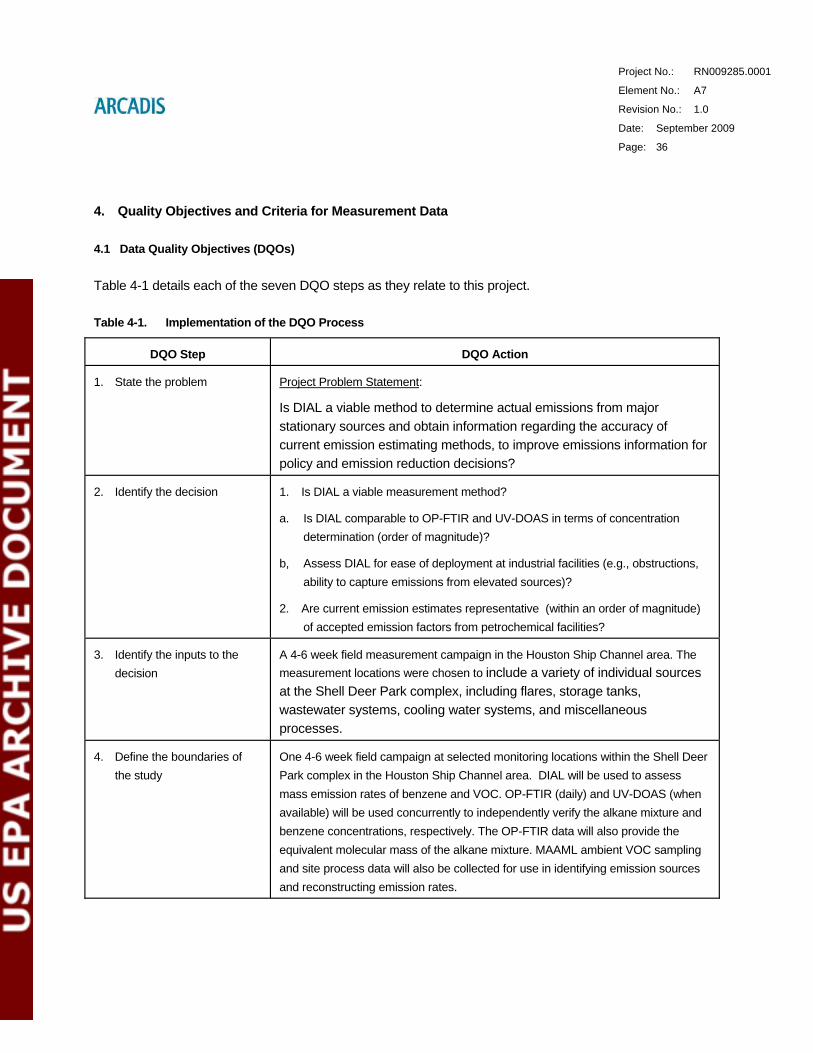
Table 4-1 details each of the seven DQO steps as they relate to this project.
Table 4-1. Implementation of the DQO Process
DQO Step DQO Action
1. State the problem Project Problem Statement:
Is DIAL a viable method to determine actual emissions from major stationary sources and obtain information regarding the accuracy of current emission estimating methods, to improve emissions information for policy and emission reduction decisions?
2. Identify the decision 1. Is DIAL a viable measurement method?
a. Is DIAL comparable to OP-FTIR and UV-DOAS in terms of concentration determination (order of magnitude)?
b, Assess DIAL for ease of deployment at industrial facilities (e.g., obstructions, ability to capture emissions from elevated sources)?
2. Are current emission estimates representative (within an order of magnitude) of accepted emission factors from petrochemical facilities?
3. Identify the inputs to the decision
A 4-6 week field measurement campaign in the Houston Ship Channel area. The measurement locations were chosen to include a variety of individual sources at the Shell Deer Park complex, including flares, storage tanks, wastewater systems, cooling water systems, and miscellaneous processes.
4. Define the boundaries of the study
One 4-6 week field campaign at selected monitoring locations within the Shell Deer Park complex in the Houston Ship Channel area. DIAL will be used to assess mass emission rates of benzene and VOC. OP-FTIR (daily) and UV-DOAS (when available) will be used concurrently to independently verify the alkane mixture and benzene concentrations, respectively. The OP-FTIR data will also provide the equivalent molecular mass of the alkane mixture. MAAML ambient VOC sampling and site process data will also be collected for use in identifying emission sources and reconstructing emission rates.
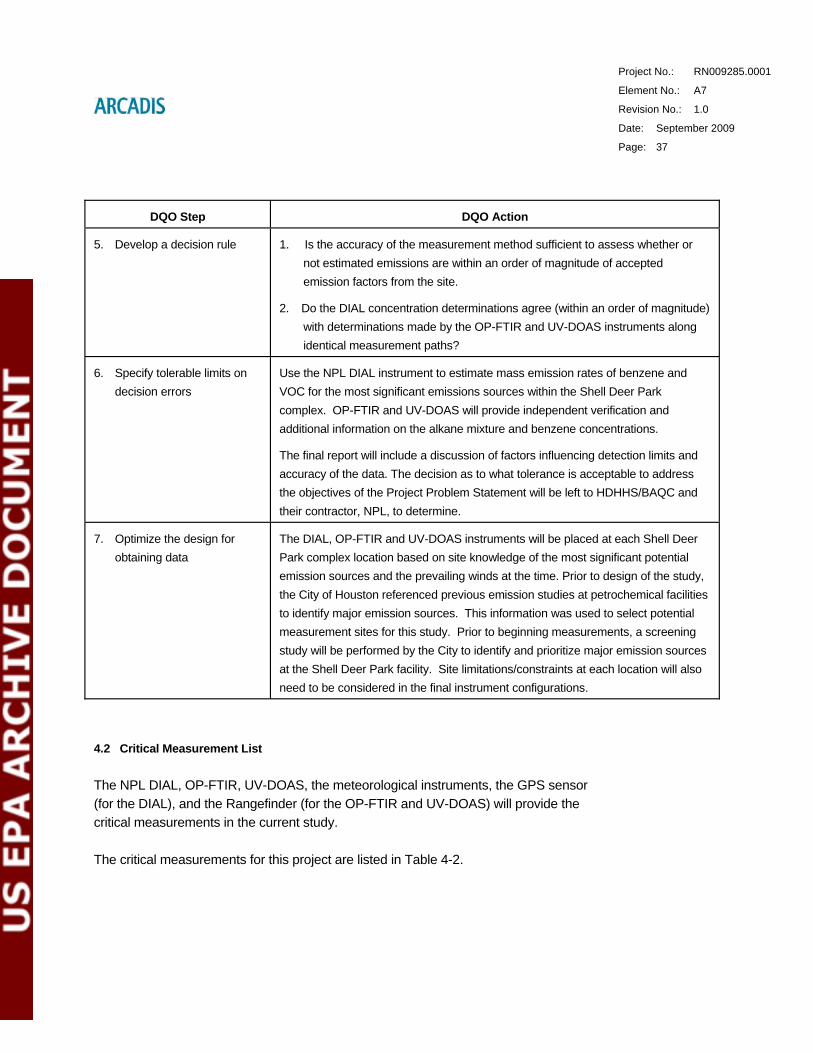
Project No.: RN009285.0001
Element No.: A7
Revision No.: 1.0
Date: September 2009
Page: 37
DQO Step DQO Action
5. Develop a decision rule 1. Is the accuracy of the measurement method sufficient to assess whether or not estimated emissions are within an order of magnitude of accepted emission factors from the site.
2. Do the DIAL concentration determinations agree (within an order of magnitude) with determinations made by the OP-FTIR and UV-DOAS instruments along identical measurement paths?
6. Specify tolerable limits on decision errors
Use the NPL DIAL instrument to estimate mass emission rates of benzene and VOC for the most significant emissions sources within the Shell Deer Park complex. OP-FTIR and UV-DOAS will provide independent verification and additional information on the alkane mixture and benzene concentrations.
The final report will include a discussion of factors influencing detection limits and accuracy of the data. The decision as to what tolerance is acceptable to address the objectives of the Project Problem Statement will be left to HDHHS/BAQC and their contractor, NPL, to determine.
7. Optimize the design for obtaining data
The DIAL, OP-FTIR and UV-DOAS instruments will be placed at each Shell Deer Park complex location based on site knowledge of the most significant potential emission sources and the prevailing winds at the time. Prior to design of the study, the City of Houston referenced previous emission studies at petrochemical facilities to identify major emission sources. This information was used to select potential measurement sites for this study. Prior to beginning measurements, a screening study will be performed by the City to identify and prioritize major emission sources at the Shell Deer Park facility. Site limitations/constraints at each location will also need to be considered in the final instrument configurations.
4.2 Critical Measurement List
The NPL DIAL, OP-FTIR, UV-DOAS, the meteorological instruments, the GPS sensor (for the DIAL), and the Rangefinder (for the OP-FTIR and UV-DOAS) will provide the critical measurements in the current study.
The critical measurements for this project are listed in Table 4-2.
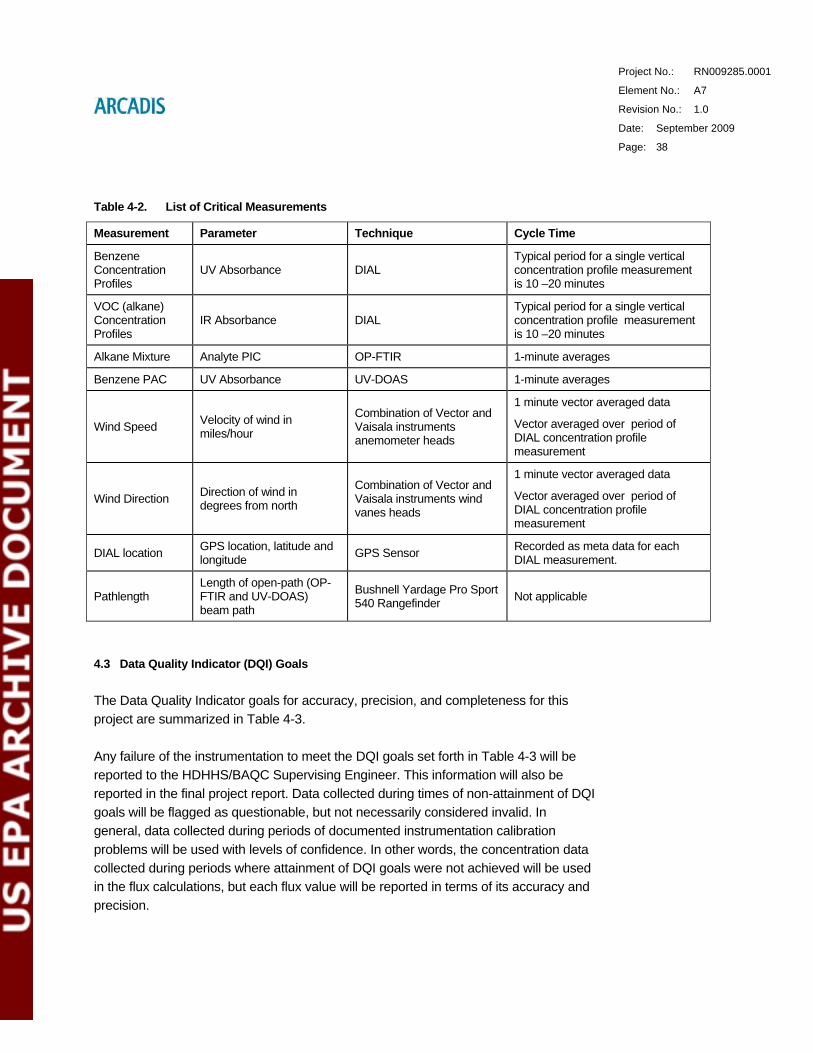
Project No.: RN009285.0001
Element No.: A7
Revision No.: 1.0
Date: September 2009
Page: 38
Table 4-2. List of Critical Measurements
Measurement Parameter Technique Cycle Time
Benzene Concentration Profiles
UV Absorbance DIAL Typical period for a single vertical concentration profile measurement is 10 –20 minutes
VOC (alkane) Concentration Profiles
IR Absorbance DIAL Typical period for a single vertical concentration profile measurement is 10 –20 minutes
Alkane Mixture Analyte PIC OP-FTIR 1-minute averages
Benzene PAC UV Absorbance UV-DOAS 1-minute averages
Wind Speed Velocity of wind in miles/hour
Combination of Vector and Vaisala instruments anemometer heads
1 minute vector averaged data
Vector averaged over period of DIAL concentration profile measurement
Wind Direction Direction of wind in degrees from north
Combination of Vector and Vaisala instruments wind vanes heads
1 minute vector averaged data
Vector averaged over period of DIAL concentration profile measurement
DIAL location GPS location, latitude and longitude GPS Sensor Recorded as meta data for each
DIAL measurement.
Pathlength Length of open-path (OP-FTIR and UV-DOAS) beam path
Bushnell Yardage Pro Sport 540 Rangefinder Not applicable
4.3 Data Quality Indicator (DQI) Goals
The Data Quality Indicator goals for accuracy, precision, and completeness for this project are summarized in Table 4-3.
Any failure of the instrumentation to meet the DQI goals set forth in Table 4-3 will be reported to the HDHHS/BAQC Supervising Engineer. This information will also be reported in the final project report. Data collected during times of non-attainment of DQI goals will be flagged as questionable, but not necessarily considered invalid. In general, data collected during periods of documented instrumentation calibration problems will be used with levels of confidence. In other words, the concentration data collected during periods where attainment of DQI goals were not achieved will be used in the flux calculations, but each flux value will be reported in terms of its accuracy and precision.

Project No.: RN009285.0001
Element No.: A7
Revision No.: 1.0
Date: September 2009
Page: 39
Table 4-3. Data Quality Indicator Goals for the Project
Measurement Parameter Analysis Method Accuracy Precision Detection Limit Completeness
Benzene Concentration Profile
DIAL - UV ±20% ±20% 10 ppba (see Table 4-4a) 90%
VOC Concentration Profile
DIAL - IR ±20% ±20% 40 ppba
(see Table 4-4b) 90%
Analyte PIC OP-FTIR: Nitrous Oxide Concentrations ±10% ±10% See Table 4-5 90%
Benzene PAC UV-DOAS ±15% ±15% ~1.0 ppbv to ~1.5 ppbvb 75%
Ambient Wind Speed
Vector Instruments Anemometer
±1% of reading (10 to 55 m/s)
or 0.1 m/s (0.1 to 10 m/s)
±1% reading (10 to 55 m/s)
or 0.1 m/s (0.1 to 10
m/s)
Not applicable
Lowest wind speed 0.1 m/s
90%
Ambient Wind Direction
Vector instruments wind vane ±5º ±5º Not applicable 90%
Distance Measurement Rangefinder - Bushnell ±1m ±1m Not applicable 100%
(a) The concentration sensitivities apply for measurements of a 50-meter wide plume at a range of 200 meters, under typical meteorological conditions.
(b) The concentration sensitivity of ~1.0 ppbv applies for measurements at 300 m, whereas ~1.5 ppbv applies for measurements at 200 m.
The DlAL is able to make measurements of several other compounds in addition to benzene and total VOCs. Tables 4-4a and 4-4b show the species, sensitivity in ppb, and maximum range for the UV and IR components of the DIAL, respectively. If budget and schedule allow, NPL could set up the DIAL to measure other compounds as listed under the IR and UV capabilities. This would only be done at the direction of the HDDHS/BAQC Supervising Engineer and as required to meet project goals.
Table 4-4a. Ultraviolet (UV) Capability of NPL DIAL
Species Sensitivitya Maximum Rangeb
Benzene 10 ppb 800 mNitric oxide 5 ppb 500 m
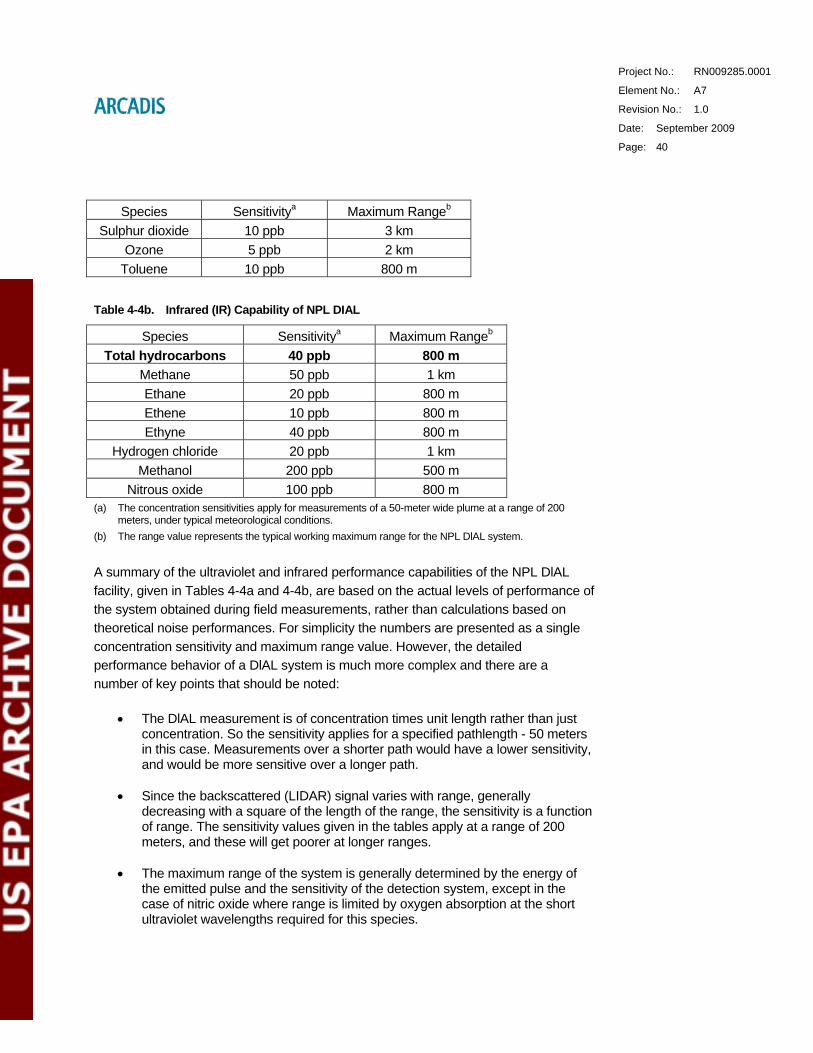
Project No.: RN009285.0001
Element No.: A7
Revision No.: 1.0
Date: September 2009
Page: 40
Species Sensitivitya Maximum Rangeb
Sulphur dioxide 10 ppb 3 kmOzone 5 ppb 2 km
Toluene 10 ppb 800 m
Table 4-4b. Infrared (IR) Capability of NPL DIAL
Species Sensitivitya Maximum Rangeb
Total hydrocarbons 40 ppb 800 mMethane 50 ppb 1 kmEthane 20 ppb 800 mEthene 10 ppb 800 mEthyne 40 ppb 800 m
Hydrogen chloride 20 ppb 1 kmMethanol 200 ppb 500 m
Nitrous oxide 100 ppb 800 m(a) The concentration sensitivities apply for measurements of a 50-meter wide plume at a range of 200
meters, under typical meteorological conditions. (b) The range value represents the typical working maximum range for the NPL DlAL system.
A summary of the ultraviolet and infrared performance capabilities of the NPL DlAL facility, given in Tables 4-4a and 4-4b, are based on the actual levels of performance of the system obtained during field measurements, rather than calculations based on theoretical noise performances. For simplicity the numbers are presented as a single concentration sensitivity and maximum range value. However, the detailed performance behavior of a DlAL system is much more complex and there are a number of key points that should be noted:
• The DlAL measurement is of concentration times unit length rather than just concentration. So the sensitivity applies for a specified pathlength - 50 meters in this case. Measurements over a shorter path would have a lower sensitivity, and would be more sensitive over a longer path.
• Since the backscattered (LIDAR) signal varies with range, generally decreasing with a square of the length of the range, the sensitivity is a function of range. The sensitivity values given in the tables apply at a range of 200 meters, and these will get poorer at longer ranges.
• The maximum range of the system is generally determined by the energy of
the emitted pulse and the sensitivity of the detection system, except in the case of nitric oxide where range is limited by oxygen absorption at the short ultraviolet wavelengths required for this species.

Project No.: RN009285.0001
Element No.: A7
Revision No.: 1.0
Date: September 2009
Page: 41
In all cases, the performance parameters are based on those obtained under typical meteorological conditions. For the UV measurements, the meteorological conditions do not have as great an effect on the measurements as the backscattered signal level is predominantly determined by molecular (Rayleigh) scattering, and this does not vary greatly. However, in the IR, the dominant scattering mechanism is from particulates (Mie scattering). So the signal level, and therefore the sensitivity, is dependent on the particular loading of the atmosphere, and this can vary dramatically over relatively short timescales.
NPL has already demonstrated their ability to undertake DlAL measurements under hot and humid conditions, an example being a successful summer measurement campaign studying hydrocarbon emissions from an oil refinery on the outskirts of Athens, Greece. This includes the practical issue of operating the equipment in these conditions, as well as the change to the spectroscopy of the measurements, and in particular the interference from water vapor in the infrared measurements.
The minimum detection limits (MDL) for the OP-FTIR for selected compounds can be found in Table 4-6. The alkane mixture sensitivity (derived from butane and octane) will be 10 ppbv. Upon funding availability, ARCADIS could be asked to post-analyze the archived OP-FTIR spectra data for more compounds to provide additional ratios of emissions for other compounds. This analysis would follow the same protocol for PIC determination as described for the total alkane mixture. It should be noted that these are estimated detection limits for a 300 m path length. However, the OP-FTIR path lengths that will be used in this study will likely be less than 300 m, resulting in higher minimum detection limits.
Table 4-6. Minimum Detection Limits for the OP-FTIR Measurements
Compound OP-FTIR for a path length = 300m (ppbv), 1 min avg.
Butane 5 Octane 5 Methane 10 Methanol 5 Benzene 50 Ethylene 3 Acetylene 4 Propylene 10
Propane 10
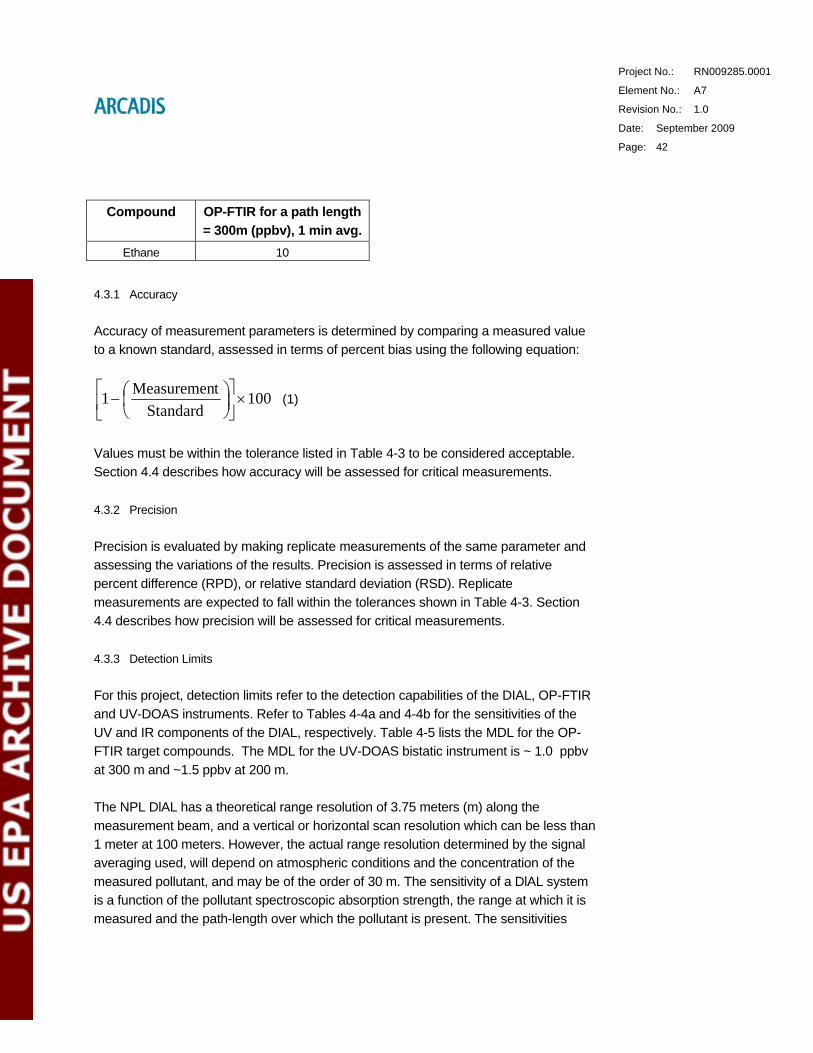
Project No.: RN009285.0001
Element No.: A7
Revision No.: 1.0
Date: September 2009
Page: 42
Compound OP-FTIR for a path length = 300m (ppbv), 1 min avg.
Ethane 10
4.3.1 Accuracy
Accuracy of measurement parameters is determined by comparing a measured value to a known standard, assessed in terms of percent bias using the following equation:
100Standard
tMeasuremen1 ×⎥⎦
⎤⎢⎣
⎡⎟⎠⎞
⎜⎝⎛− (1)
Values must be within the tolerance listed in Table 4-3 to be considered acceptable. Section 4.4 describes how accuracy will be assessed for critical measurements.
4.3.2 Precision
Precision is evaluated by making replicate measurements of the same parameter and assessing the variations of the results. Precision is assessed in terms of relative percent difference (RPD), or relative standard deviation (RSD). Replicate measurements are expected to fall within the tolerances shown in Table 4-3. Section 4.4 describes how precision will be assessed for critical measurements.
4.3.3 Detection Limits
For this project, detection limits refer to the detection capabilities of the DIAL, OP-FTIR and UV-DOAS instruments. Refer to Tables 4-4a and 4-4b for the sensitivities of the UV and IR components of the DIAL, respectively. Table 4-5 lists the MDL for the OP-FTIR target compounds. The MDL for the UV-DOAS bistatic instrument is ~ 1.0 ppbv at 300 m and ~1.5 ppbv at 200 m.
The NPL DlAL has a theoretical range resolution of 3.75 meters (m) along the measurement beam, and a vertical or horizontal scan resolution which can be less than 1 meter at 100 meters. However, the actual range resolution determined by the signal averaging used, will depend on atmospheric conditions and the concentration of the measured pollutant, and may be of the order of 30 m. The sensitivity of a DlAL system is a function of the pollutant spectroscopic absorption strength, the range at which it is measured and the path-length over which the pollutant is present. The sensitivities
Project No.: RN009285.0001
Element No.: A7
Revision No.: 1.0
Date: September 2009
Page: 43
listed in Tables 4-4a and 4-4b were achieved under field conditions, and range from 5 to 50 parts per billion (ppb).
The DIAL total hydrocarbon (total VOC) measurement listed in Table 4-4b uses an IR absorption that is common to all hydrocarbons with three or more carbon atoms, linked to the stretch frequency of the carbon-hydrogen bond. As such, it provides a measure of the mixture of VOCs that are present at a petroleum refinery or petrochemical site. The pair of IR wavelengths used for this DlAL measurement are selected so that the absorption per unit mass is relatively invariant with respect to the mix of different hydrocarbons that are present. However, the sensitivity of this measurement in terms of ppb of hydrocarbon depends on the mixture of species present, and the value given in the table reflects the typical mix of hydrocarbons found at oil refineries.
Although the total hydrocarbon measurement provides a reasonable estimate of the overall amount of hydrocarbons present, the accuracy of this measurement can be improved, and the total VOC concentration calculated, by combining the DlAL measurements with the results of gas chromatography (GC) analysis of the emitted gases. The standard procedure for this involves taking whole air samples around the site in locations where the DlAL measurements show the emitted plumes are present. The VOCs present in these samples are identified and quantified by GC analysis. The results provide the relative levels of all the VOCs present with a concentration of 0.1 ppb or higher. The results of this analysis are combined with NPL's unique spectral library of quantified infrared absorptions of an extensive set of VOCs to calculate the combined absorption coefficient for the actual VOC mixture present at the site. Applying this absorption coefficient to the DlAL results enables the total VOC emission rates to be calculated.
4.3.4 Completeness
Completeness is expressed as a percentage of the number of valid measurements compared to the total number of measurements taken. See Table 4-3 for the completeness goals for each measurement parameter. The completeness goal for the DIAL is to acquire 90 percent completeness for the DIAL benzene and total hydrocarbon concentration profile data. The completeness goal for the OP-FTIR analyte PIC data and for the UV-DOAS benzene PAC data is 90 percent and 75 percent, respectively.
Project No.: RN009285.0001
Element No.: A7
Revision No.: 1.0
Date: September 2009
Page: 44
4.4 Procedures to Assess QA Objectives
The procedures used to assess all QA objectives are described in Table 4-7, and the following text.
4.4.1 NPL DIAL Flux DQI Assessment
A number of QA checks are carried out during a measurement day, to assess the DIAL measurements. These will assess conformance with the DQIs (Table 4.3) for benzene or VOCs depending on which measurement is being carried out. These tests are recorded on the DIAL record sheets for the measurement period.
Spectroscopic Calibration Procedures: A crucial requirement for high quality DIAL measurements is accurate knowledge of the actual differential absorption coefficients that are appropriate for a particular measurement. The following calibration procedures are employed by the NPL DIAL team to ensure the spectroscopic quality, and therefore the accuracy of the differential absorption measurement. The three key elements that need to be verified through these checks are that:
• A suitable calibration reference cell is prepared with a known (concentration. Pathlength) parameter.
• The source is operating with a suitably narrow linewidth to properly resolve the spectral feature of interest.
• The wavelength of the source is fixed and stable on the appropriate on and off resonant wavelengths.
Project No.: RN009285.0001
Element No.: A7
Revision No.: 1.0
Date: September 2009
Page: 45
Table 4-7. Procedures Used to Assess QA Objectives
Measurement Parameter Analysis Method Assessment Method
Precision Assessment Method
Accuracy
Benzene Flux DIAL - UV Calibration Reference Cell Check; daily scan of relevant absorption feature
Calibration Reference Cell Check; daily scan of relevant absorption feature
Total Hydrocarbon Flux DIAL - IR
Calibration Reference Cell Check; daily scan of relevant absorption feature
Calibration Reference Cell Check; daily scan of relevant absorption feature
VOC Concentration DIAL - IR City of Houston injection of known VOC gas into DIAL calibration cell
City of Houston injection of known VOC gas into DIAL calibration cell
Analyte PIC OP-FTIR Comparison of consecutive nitrous oxide concentration measurements
Absolute nitrous oxide concentration measurement
Benzene PAC UV-DOAS Four-Point Calibration QC Check Four-Point Calibration QC Check
Ambient Wind Speed and Wind Direction
Vector and Vaisala Anemometer and wind Vane
Pre deployment calibration checks. Pre deployment calibration checks
Distance Measurement Rangefinder Periodic Field Check/EPA Metrology
Lab Periodic Field Check/ EPA Metrology Lab
Calibration Gases: A standard gas mixture of the target gas (or an appropriate proxy – e.g., propane or pentane for the total hydrocarbon measurements) is used to provide the reference for the spectroscopic measurements. These standards are, where possible, gravimetrically prepared, internationally-traceable NPL reference gas mixtures with absolute volume mixing ratio (VMR) accuracies of 0.5 percent or better. The VMR levels for the standards are selected to give appropriate optical absorptions (typically optical depths between 1 and 2) over pathlengths of a few centimeters.
A calibration cell (with either 10 cm or 20 cm pathlength) is filled to atmospheric pressure with the reference gas. This ensures that the pressure broadening, and therefore the linewidth, is the same for the calibration gas as in the ambient environment. These cells are usually placed in front of one of a pair of pyroelectric detectors (PEDs) which monitor the energy of a small portion of the transmitted beam. The ratio of the PED readings with and without the cell in front provides a direct measure of the transmission through the calibration cell.

Project No.: RN009285.0001
Element No.: A7
Revision No.: 1.0
Date: September 2009
Page: 46
An independent QA check will be performed by the City of Houston on the DIAL. They will inject a known quantity of VOC gas into the calibration cell of the DIAL instrument to test the precision and accuracy of the DIAL for concentration measurements.
Spectral Scans: A spectral scan of the relevant absorption feature is carried out on a daily basis (typically at the beginning of the day) and after any refilling of the calibration gas cell. The PED signals are logged as the wavelength of the source is slow tuned across the region. These data are saved from the DIAL acquisition program, the filename is automatically assigned based on the data and time. The recorded data are loaded into excel and graphed to allow the measured absorption feature to be compared to the expected one. This provides confirmation that the cell has been filled correctly and that the DIAL laser source line width is correct. If the measured width of the absorption features differs significantly (typically by more than 0.2 cm-1) from the expected widths then this indicates an issue with the source bandwidth and a number of laser checks are carried out. These checks are carried out by the trained laser operator and any corrective actions recorded in the laser operators’ lab note book. If the measured absorption differs by more than 10 percent from the expected absorption then this indicates a fault in the filling of the cell and it should be refilled and the measurement repeated.
The expected PED ratio is calculated based on the results of the cell scan, together with the acceptable limits for the PED ratio to be used as the quality check for the continuous spectral monitoring – see below. A record that the spectral scan has been carried out is recorded on the relevant DIAL record sheet.
Continuous Spectral Monitoring: Having established that a suitable reference cell is available and the source linewidth is correct, the on- and off-resonant wavelengths are set to their chosen values for the DIAL measurements. The expected value for the PED ratio for these wavelengths can then be predicted from the results of the cell scan. The actual PED ratios are logged continuously by the DIAL acquisition software and stored as part of the DIAL data. The PED ratios are also recorded for each measurement scan on the DIAL record sheets, and checked on a scan-by-scan basis to confirm that the ratio remains stable, and therefore that the wavelengths have not drifted significantly from the desired values. If the PED ratio changes by more than the level corresponding to a 20% change in the reference cell absorption then this indicates significant wavelength drift and the wavelengths are retuned. The wavelength retuning is carried out by the trained DIAL laser operator. Any changes to the laser settings are recorded in the DIAL laser operators’ lab note book. The spectral monitoring check is carried out for every DIAL measurement scan.

Project No.: RN009285.0001
Element No.: A7
Revision No.: 1.0
Date: September 2009
Page: 47
In-line Cell Checks: In addition to verifying the spectroscopic performance of the source, the calibration cell is also used to check that the full detection and acquisition system is measuring correctly. At least once a day (and normally 3 times a day) the calibration cell is placed directly in the output beam path. The effect of this is to offset the measured DIAL integrated concentration column by an amount that is directly related to the concentration pathlength in the cell. The system is deemed to be operating correctly as long as this offset remains within 20 percent of the expected value. If this criterion is not met, then a spectral scan, as indicated above, is carried out to check the gas cell and DIAL wavelength. If necessary the cell may be refilled or DIAL laser may then be adjusted to correct any drift. If the cell is refilled then the spectral scan is repeated, before repeating the in-line cell checks. The results of the cell measurements are recorded on the DIAL record sheets for the measurement period.
Any corrective actions beyond routine procedures outlined above will be conducted by the DIAL Team Leader and reported to the HDHHS/BAQC Supervising Engineer.
4.4.2 OP-FTIR PIC DQI Assessment
The precision and accuracy of the concentration data may be checked by looking at the analyzed nitrous oxide concentrations. The known atmospheric background nitrous oxide concentration is around 315 ppbv (this is an average value, as the value exhibits a slight seasonal variation). The acceptable range of nitrous oxide concentrations will be 315 ppb ±10% (for pathlengths greater than 100m, which are expected at these locations). Verifying this background concentration provides a good QC check of the data collected. Obviously, this method is not valid for data collected at a site that is a source of nitrous oxide. This data check will be performed by ARCADIS on analyzed concentration data collected.
Any corrective actions will be conducted by the ARCADIS On-site Project Manager and reported to the DIAL Team Leader and the HDHHS/BAQC Supervising Engineer.
4.4.3 UV-DOAS PAC DQI Assessment
The precision and accuracy of the UV-DOAS instruments will be assessed by performing the Four-Point Calibration QC Check at the time of initial deployment and prior to starting measurements at each of the Shell Deer Park locations. Other QC checks will be performed on the instrument, including a Wavelength Precision Check, System Check, and Reference Check. These checks will be performed at various
Project No.: RN009285.0001
Element No.: A7
Revision No.: 1.0
Date: September 2009
Page: 48
times throughout the duration of the project. More information on the procedures these checks, as well as the schedule of each procedure can be found in Appendix C: Project Specific Operating Procedure for OPSIS UV-DOAS Calibration and QC Checks for Benzene.
Any corrective actions will be conducted by the EPA UV-DOAS specialist and reported to the DIAL Team Leader and the HDHHS/BAQC Supervising Engineer.
4.4.4 Intercomparison and Spectral Confirmation
The OP-FTIR and UV-DOAS will be collecting data concurrently with the DIAL along the ground level in the same direction of the DIAL measurements. These inter-comparison data will independently verify the DIAL data.
For OP-FTIR, we will provide a spectral confirmation for the DIAL detection and correction for the volume concentration correction factor for the DIAL measurement. Further, equivalent molecular mass for the conversion of volumetric concentration to mass concentration for the DIAL data will be provided.
For the UV-DOAS, a concentration correction factor for the DIAL flux calculation will be provided.
4.4.5 Meteorological Head DQI Assessment
The NPL meteorological heads are calibrated by the manufacturer. The calibration certificates provide a calibration factor in mV/meter per second (voltage output from the anemometer) for the wind speed and correction factors for nonlinear response. The sensors, cabling and data loggers are checked annually at NPL using a reference voltage generator. Known voltages are applied directly to the output terminal of the anemometer and voltage readings are taken at the data logger. A final calibration factor is then obtained in mV/meter per second (voltage input in the data logger). The windvane incorporates a precision wire-wound potentiometer as shaft angle transducer, enabling wind direction to be accurately determined. The minimum voltage output at 0° and the maximum voltage output at 360° are read from a high precision multimeter providing a wind direction calibration. In addition, the different sensors are compared side-by-side in the field to provide a further check on their correct function. Procedures for doing the above described calibration for the wind speed and direction sensors are included in Appendix D.

Project No.: RN009285.0001
Element No.: A7
Revision No.: 1.0
Date: September 2009
Page: 49
4.4.6 Method for Assessing the DQI for the Laser Rangefinder
The DIAL provides concentration measurements with a spatial component, based on the speed of light, and does not require an actual measure of pathlength distance. The distance is related to the recorded signal in the DIAL data acquisition system, and the clock on this is checked periodically using test pulses. The accuracy of this timing is better than one range bin (3.75 m) in 4 km.
The precision and accuracy of the laser rangefinder is assessed by deploying one retroreflecting mirror and standing at a distance of between 50 and 100 meters from the retroreflector. The actual distance between the person taking the measurement and the position of the retroreflector is found by using a tape measure. After the actual distance has been established, two distance measurements are taken using the laser rangefinder. The distance measured with the laser rangefinder should be within ± 1 m of the distance measured with the tape measure to satisfy the DQI for accuracy. The two measurements taken with the laser rangefinder should agree within ± 1 m to satisfy the DQI for precision.
4.5 MAAML
The MAAML was designed to monitor ambient air toxics in situ with species concentrations of VOCs determined immediately after collection. The MAAML includes equipment to document geographic location along with measurement of meteorological parameters such as wind speed, wind direction, ambient temperature, humidity, and atmospheric pressure. Their detailed procedures can be found in their Quality Assurance Project Plan, Mobile Laboratory Project (City of Houston, 2008).

Project No.: RN009285.0001
Element No.: A9
Revision No.: 1.0
Date: September 2009
Page: 50
5. Special Training/Certification
Table 5-1 lists the technical staff selected for this project, and their areas of respective expertise. Mr. Daniel Hoyt, as the Supervising Engineer for HDHHS/BAQC, will have overall responsibility for the daily monitoring and review of this sampling campaign. He will be assisted by another engineer from HDHHS/BAQC trained in conducting air quality studies. NPL’s Dr. Melanie Williams, Mr. Rod Robinson and Mr. Tom Gardiner are field-trained in deploying the DIAL system, and will work closely with the HDHHS/BAQC staff. ARCADIS’ Mr. Mark Modrak will provide Project Management services and oversee Mr. Mike Chase, who is field-trained in deploying the OP-FTIR. EPA’s Mr. Cary Secrest possesses similar field experience with the UV-DOAS. Technical assistance will provided by Dr. Ram Hashmonay (OP-FTIR and Optical Remote Sensing), Dr. Robert Kagann (OP-FTIR spectroscopy), and Mr. Steve Ramsey (DIAL at petrochemical facilities). Mr. James Rhubottom, Jr. is a Lead Chemist for the City of Houston experienced in the MAAML.
Official audits may be performed by an EPA Region 6 QA Representative. Training records are maintained by HDHHS/BAQC, NPL, and ARCADIS Human Resources in personnel files.
Table 5-1. Technical Personnel
Name Organization Expertise
Daniel Hoyt, P.E. HDHHS/BAQC Supervising Engineer for Air Quality Studies
Tanwir Badar, P.E. HDHHS/BAQC Engineering support for Air Quality Studies
Dr. Melanie Williams NPL Project Manager for DIAL Studies
Rod Robinson NPL Team Leader for DIAL Studies
Tom Gardiner NPL Reserve Team Leader for DIAL Studies
Mark Modrak ARCADIS Project Manager for OP-FTIR Studies
Dr. Ram Hashmonay Environ OP-FTIR and Optical Remote Sensing Specialist
Mike Chase ARCADIS Field Manager for OP-FTIR Studies
Robert Kagann ARCADIS OP-FTIR Spectroscopy
Cary Secrest EPA UV-DOAS Specialist
Steve Ramsey, P.E., BCEE
Environ DIAL at petrochemical facilities

Project No.: RN009285.0001
Element No.: A9
Revision No.: 1.0
Date: September 2009
Page: 51
Name Organization Expertise
James Rhubottom, Jr. MAAML Senior Chemist in mobile laboratory
Laura Nessley ARCADIS QA of Environmental Measurement Programs
Jerry Revis ARCADIS Health and Safety of Environmental Measurement Programs
All personnel working on-site at the Shell Deer Park locations will be required to attend the Shell Site Safety Training program upon arrival and prior to any site deployment, unless they already possess a card indicating they have taken the training within the past year. HDHHS/BAQC, NPL, ARCADIS, EPA and MAAML stall will adhere to all site safety requirements, including obtaining hot work permits for the DIAL system and related equipment. All equipment must be Nationally Recognized Testing Laboratories (NRTL) certified to be allowed onto the Shell Deer Park complex. While on site, staff will wear site-required personal protective equipment at all times.
All relevant statutory requirements will be complied with, at all times. These will be considered as a minimum standard and where reasonably practicable will be exceeded where it is necessary to meet the spirit of this policy.
The safety procedures which apply to DlAL measurements are principally concerned with safe operation of the lasers used to provide the UV and IR radiation sources. A rigorous assessment has shown these lasers to be completely eye-safe outside of the DlAL container itself and access to the optical room, during operation, is strictly limited to members of the DlAL team. All NPL staff and subcontractors will also complete any site specific safety training. NPL staff have considerable experience of taking measurements at refineries.
MAAML employees must perform all work in accordance with the appropriate health and safety procedures specified in the Houston Department of Health and Human Services Safety and Health Manual (May 2003).
Mr. Jerry Revis will oversee the preparation and approval of the ARCADIS site-specific Health and Safety Plan (HASP). To provide a safe work environment, all personnel are required to sign and comply with the HASP. The ARCADIS On-Site Project Manager will verify that the HASP requirements are being following during the initial instrument deployment and throughout the field campaign. A copy of the HASP will be kept in the field trailer.

Project No.: RN009285.0001
Element No.: A9
Revision No.: 1.0
Date: September 2009
Page: 52
6. Documents and Records
The pertinent documents and records for this project are the project QAPP, Health and Safety Plan (HASP), field notebooks, logbooks for each instrument, and actual data files. Once the QAPP for this project has been approved, the HDDHS/BAQC Supervising Engineer will distribute an electronic copy of the document, via email, to the individuals listed in the distribution list, presented at the beginning of this document. A hardcopy of the HASP will distributed at the site by the HDDHS/BAQC Supervising Engineer, NPL DIAL Team Leader, and the ARCADIS On-Site Project Manager to each member of the field crew (NPL, ARCADIS and EPA), as well as any other consultant or host site personnel who may come into the area of active sampling. For this project, one field notebook will be maintained at all times by the HDHHS/BAQC Supervising Engineer. Additionally, each instrument used in the field campaign will have its own log book (may also include field notes and electronic documents) to record analyzer specific operational information such as calibration information and any necessary maintenance performed on the instrument.
The MAAML team must document and maintain accurate records for all mobile laboratory activities. These records include site information, instrument operation, maintenance, calibrations, sample collection, analysis, data review, and data reporting. This allows the opportunity for historical reconstruction of all activities contributing to the creation of the final report. Their detailed procedures can be found in their Quality Assurance Project Plan, Mobile Laboratory Project (City of Houston, 2008).
6.1 Data Handling and Storage
The NPL Dial Team Leader, ARCADIS On-Site Project Manager, EPA UV-DOAS Specialist, and MAAML Lead Chemist will be responsible for daily data check/download, and for maintaining and archiving all project documents and field data. The field data will directly produce computer-stored data files. These files will include DIAL VOC/benzene scan data, OP-FTIR PIC data, UV-DOAS PAC data, MAAML VOC concentrations, and meteorological data. During each day of the project, the individual team leaders will be responsible for the downloading and back-up of their collected data.
For the NPL DIAL, meta-data are recorded with the data files, and all records relating to the same data (individual DIAL measurement) have the same base file name – derived from the system time and date. Scans (consisting of a sequence of measurements usually over a vertical plane) are uniquely identified with a scan id.

Project No.: RN009285.0001
Element No.: A9
Revision No.: 1.0
Date: September 2009
Page: 53
Records relating to a scan are also automatically recorded. Meta data include date, time, site name, DIAL measurement location name, GPS readings, DIAL scanner angle. Data stored for each measurement include DIAL return signals, power readings and gas cell readings. Meteorological data are stored separately. The time periods for each DIAL scan are automatically written to a file which is used to process the meteorological data. All data are recorded and stored on back-up external hard drives, and written to network storage drives at NPL as soon as is possible (usually over secure internet connection while still in the field). Hardcopy data records are kept of key system parameters during the measurements. Example record sheets are included in Appendix D.
The following file naming scheme will be used for the archived data. Any deviations from this format will be fully documented:
• DIAL UV/IR Absorbance Data for Benzene/VOC Profiles:
o “SHELL_DDMMYYYY_DIAL”
• OP-FTIR Concentration Data for the Alkane Mixture:
o “SHELL_DDMMYYYY_OP-FTIR”
• UV-DOAS Concentration Data for Benzene:
o “SHELL_DDMMYYYY_UV-DOAS”
• MAAML Concentration Data for VOCs:
o “SHELL_DDMMYYYY_MAAML”
• Meteorological Data:
o “SHELL_DDMMYYYY_MetData”
The files will maintain this naming scheme until data analysis has been completed.
Optical path length measurements and open-path telescope coordinates are determined with the laser rangefinder. This information will be shared with the individual team leaders who will enter the path lengths and coordinates into their

Project No.: RN009285.0001
Element No.: A9
Revision No.: 1.0
Date: September 2009
Page: 54
respective notebooks during the time of deployment. Each individual team leader will also draw a diagram of the setup, detailing the location of the instrumentation and other structures at the site. More information on the chain-of-custody of the data files can be found in Table 16-2 of this document.
Any periods of missing data (due to circumstances such as study equipment malfunction, severe weather, missing wind data, or unacceptable quality of data according to DIAL, OP-FTIR or UV-DOAS criteria) will be forwarded to the HDHHS/BAQC Supervising Engineer as soon as possible by the identifying team leader. Details of the problems and corrective actions associated with the study equipment will be included in the Weekly Progress Report. If approved by the HDHHS/BAQC Supervising Engineer and Shell, the length of the identified period of missing data may be added to the end of the sampling campaign (for up to a two-week contingency), budget permitting, ensuring that a full three days of acceptable data at each location of significant emissions (according to DIAL, OP-FTIR or UV-DOAS criteria) are collected.
6.2 Reporting Requirements
The Project Schedule was detailed in Table 3-1. The Weekly Progress Reports will be e-mailed by each team leader to the HDHHS/BAQC Supervising Engineer and will detail any major issues encountered during the previous week, corrective actions taken in relation to the study equipment, and any impacts to the project schedule.
The Final Project Report to be prepared by NPL for HDDHS/BAQC will contain the following information for each of the Shell Deer Park complex locations monitored:
• The calculated benzene and total hydrocarbon flux for every ~10-20 minute averaging interval, as measured by the DIAL-UV and DIAL-IR configurations, respectively.
• The calculated alkane mixture path-averaged concentrations (time-series of each run) and equivalent molecular mass, as measured by the single beam OP-FTIR.
• The calculated benzene path-averaged concentrations, as measured by the single beam UV-DOAS.

Project No.: RN009285.0001
Element No.: A9
Revision No.: 1.0
Date: September 2009
Page: 55
• Relevant process data collected from each suspected source of significant emissions, and from each flare and delayed coker during flare and coker DIAL measurements.
Data Management procedures are detailed in Section 16.
The Final Project Report will include any corrective actions taken related to study equipment during the field campaign, and the impacts (if any) to project data will be discussed. MAAML will provide their ambient VOC data directly to HDHHS/BAQC for incorporation into the final report to EPA Region 6.
Project No.: RN009285.0001
Element No.: B1
Revision No.: 1.0
Date: September 2009
Page: 56
B: Data Generation and Acquisition
7. Experimental Design
7.1 NPL DIAL
7.1.1 Pre-Campaign
The NPL DIAL operates within a Quality Management system that is ISO 9001 accredited. DIAL work is performed following two local procedures, and the field campaign will be conducted according to QPDQM.B.512 - Planning and Implementing a Field Measurement Campaign.
The DIAL instrument will be shipped to Houston, Texas and stored at the local transport company as soon as it has cleared customs. Three NPL staff will arrive to set up the DIAL instrument once it has been delivered. The system is fully self contained, with power provided by an on board generator, and has full air conditioning to allow operation in a range of ambient conditions.
Three days may be required to re-commission the DIAL instrument following shipping, barring any significant damage occurring as a result of rough sea conditions.
During this period, the DIAL instrument will be operated within the Shell Deer Park complex. Also, consumables and items which cannot be transported by the vehicle ferry will be delivered directly to the transport company. If possible, NPL staff will accompany HDHHS/BAQC and ARCADIS staff on pre-site visits to the measurement sites at this time.
7.1.2 Main Measurement Period
NPL proposes to conduct measurements six days a week for 4-6 weeks from November 13, 2009 to December 23, 2009. Measurements will be made during the day, with a nominal working period of 08:30 to 17:30. The period will commence with site inductions on November 13, 2009, immediately following the Shell Site Safety Training.
A secure parking location will be obtained from Shell for this period, with 24-hour access available for NPL staff to work on the system.
Project No.: RN009285.0001
Element No.: B1
Revision No.: 1.0
Date: September 2009
Page: 57
NPL will deploy a meteorological mast at a fixed location within the Shell Deer Park complex to provide a long term consistent set of data. To have the flexibility to gather on-site data as meteorological conditions change, HDHHS/BAQC will deploy one portable meteorological mast, which is integrated into the MAAML. Additionally, HDHHS/BAQC has access to monitoring data from Texas Commission on Environmental Quality’s (TCEQ) intranet, including five-minute and hourly resultant wind speed and direction data. There are three ambient air monitors that collect metrological data located in proximity to the Shell Deer Park complex. In addition to metrological data, those three TCEQ locations monitor for approximately 48 VOC compounds, including benzene, using automated gas chromatography (AutoGC). NPL can also deploy a local wind sensor head mounted on a tripod, usually is typically used near the measurement path to determine local conditions.
The scheduling of the different measurement goals will involve detailed discussions with both HDHHS/BAQC and the participating site and will evolve as those discussions progress. HDHHS/BAQC staff will provide participating site maps to NPL, with priority locations identified. NPL will then identify potential measurement locations, and possible measurement lines-of-sight. These can then be discussed with the site, HDHHS/BAQC, ARCADIS and EPA to identify a set of pre-agreed DIAL, OP-FTIR and UV-DOAS measurement locations. It is anticipated that the MAAML will collect their ambient sample at the approximate mid-point of the chosen measurement paths. This process will simplify operation, since NPL will have a set of pre-defined locations agreed with the facility that the DIAL instrument can monitor. NPL, HDHHS/BAQC, and the participating site may identify and agree upon other locations during the measurements on a case-by-case basis.
The DIAL system can operate in either IR or UV modes, depending on the target species for a particular measurement. The IR mode will be used for the majority of the campaign, starting with an approximate one-week screening of as many potential sources as possible. More focused IR measurements will then be made, prior to switching the DIAL to the UV (benzene) mode for the final seven days of the campaign. One day will be needed to swap the optical configuration and recalibrate the system.
7.1.3 Typical Daily Program
Initial system daily start-up will take approximately two hours. During this period the measurement objective and location(s) for the day will be decided. This will be driven by measurement priorities (i.e., whether all primary objectives have been met), meteorological conditions, and any site conditions (i.e., plant shutdown).

Project No.: RN009285.0001
Element No.: B1
Revision No.: 1.0
Date: September 2009
Page: 58
The system will be moved to the agreed measurement location, taking approximately 30 minutes for the move. Measurements will then be taken, with nominally 10 to 20 minutes per scan. It is anticipated that three consecutive days of sampling will occur at each location.
The system will be moved to measure up- and down-wind scans of the source(s). NPL will collect grab samples, or pumped sorbent tube measurements, downwind of sources to assist with total VOC measurements.
At the end of the measurement period, the system will be moved to the night parking location, and post-measurement housekeeping carried out, including downloading meteorological data and data backup.
Although not practical on a daily basis (most of these stages are usually carried out post campaign), analysis of the previous day's data is possible, if needed, and would involve:
• selecting and combining meteorological data from the various met instruments to provide the most representative wind data for the DIAL scans,
• assessing the DIAL returns and checking for potential issues ,
• reviewing the relevant system diagnostics for the scans,
• re-calculating the concentration maps and emissions fluxes,
• taking into account upwind measurements to assess emission flux balance from target sources,
• production of graphical displays of data,
• combining multiple flux measurements from the DIAL concentration data with meteorological data,
• using speciation data, when available, to improve the VOC mass flux, and
• using site-provided process data to conduct preliminary data analysis and to modify the following day’s measurement plans, if necessary.

Project No.: RN009285.0001
Element No.: B1
Revision No.: 1.0
Date: September 2009
Page: 59
If the previous day’s raw data from emissions sources is generated as described above, it will be provided to the participating site.
7.2 OP-FTIR
The OP-FTIR instrument will be deployed downwind of the suspected sources, along a single optical path at a height of approximately two meters above the surface, to collect path-integrated alkane mixture concentration data. The instrument consists of an infrared light beam, modulated by a Michelson interferometer. The infrared beam is transmitted from a single telescope to a retroreflecting mirror target, which is usually set up at a range of 100 to 500 m. The returned light signal is received by the single telescope and directed to a detector. The light is absorbed by the molecules in the beam path as the light propagates to the retroreflecting mirror and again as the light is reflected back to the analyzer. The advantage of OP-FTIR monitoring is that the concentrations of a multitude of infrared absorbing gaseous chemicals can be detected and measured simultaneously, with high temporal resolution. More information on the OP-FTIR instrument can be found in MOP 6812 (Single-Path Data Collection Using the RAM2000 Monostatic OP-FTIR) of EPA’s National Risk Management Research Laboratory, Air Pollution Prevention and Control Division, Emissions Characterization and Prevention Branch (ECPB) Optical Remote Sensing Facility Manual, presented in Appendix E of this document.
7.3 UV-DOAS
The UV-DOAS instrument will be deployed downwind of the suspected sources, along a single optical path at a height of approximately two meters above the surface, to collect path-integrated benzene concentration data. The UV-DOAS beam path will be co-located as close as possible to the OP-FTIR beam path. More information on the UV-DOAS instrument can be found in Appendix C: Project Specific Operating Procedure for OPSIS UV-DOAS Calibration and QC Checks for Benzene.
The UV-DOAS instrument must be kept free of moisture so that the internal optics are not damaged. The instrument will be covered to protect it from the elements. In addition, a dry air circulator will be assembled for the UV-DOAS, consisting of a pump and a large air drying cartridge. Drierite will be placed into a cartridge and hooked up to an air pump which will pull a set air flow through the cartridge. Tubing will run from the cartridge into the UV-DOAS analyzers to provide a dry air source. This system will be maintained by the EPA UV-DOAS Specialist and a log will be kept of the date and time that each cartridge is refreshed.

Project No.: RN009285.0001
Element No.: B1
Revision No.: 1.0
Date: September 2009
Page: 60
7.4 MAAML
Point source characterization comprises a critical element of the MAAML in order to identify specific point source emissions. Each facility uses different production processes; thus, the "fingerprint" or emissions pattern of chemicals that released into the air by any single facility will differ from the other nearby facilities. Data obtained from the MAAML combined with speciated VOC concentrations measured by all relevant auto-GCs will create the “fingerprints” for Shell to identify the sources and relative emissions speciation from each process area. The data will be used to determine which units within each facility generate the highest emissions.
HDHHS has applied the same technology and approach, with modifications, at other facilities in Houston showing elevated levels of air toxics. HDHHS intends to collaborate with the EPA to identify the best means for sharing the experience with other local, state, and national government agencies for continuous improvement of their own techniques as well as providing guidance to help others resolve their issues with source identification.
7.5 Process Data
Upon commencement of DIAL monitoring involving a Flare or Delayed Coker unit, the data detailed in Sections 7.5.1 and 7.5.2 will be collected from the host site. Upon detection of significant emissions from a tank, wastewater, cooling tower or generic process leak source, the data detailed in Sections 7.5.3, 7.5.4, 7.5.5, and 7.5.6, respectively, will be requested from the host sit. The forms to be used to collect this data are included in Appendix B.
7.5.1 Flares
Contemporaneous data during the DIAL monitoring including continuous monitoring data for composition, heat content, purge gas flow rates, waste gas flow rates and steam or air assist flow rates will be provided by the host site. The host site may be requested to collect flare header samples for compositional analyses (TO-15 Analyses by Chemtex Lab). Data from any related and relevant flare emissions studies and the most recent flare emissions inventory estimates will be made available by the host site throughout the DIAL Project field campaign, including all relevant efficiency and compositional assumptions.
Project No.: RN009285.0001
Element No.: B1
Revision No.: 1.0
Date: September 2009
Page: 61
7.5.2 Delayed Coker
Contemporaneous data during the DIAL monitoring including identification of the active portion of the Delayed Coker cycle (de-heading, coke cutting, steam venting, etc.), flow rates, temperatures and pressures, as well as feedstock origin and composition will be reasonably provided by the host site. Process data including but not limited to data from any relevant Delayed Coker emissions studies and the most recent Delayed Coker emissions inventory estimates will be made available by the host site throughout the DIAL project field campaign, including all relevant compositional and flow rate assumptions.
7.5.3 Tanks
Contemporaneous data during the DIAL monitoring including the composition, vapor pressure and temperature of the stored material and filling or emptying rates will be provided by the host site. If necessary, the host site may be requested to collect samples for compositional analyses and to have the samples analyzed in accordance with their standard practices. Analyses that the host site may be requested to conduct ASTM method D2879-83,96 for vapor pressure analyses, "PIANO" analyses (including paraffins, isoparaffins, aromatics, naphthenes and olefins) for compositional analyses of crude oils or petroleum fractions like gasoline, naphthas or similar products, ASTM D3606-99 for benzene content and EPA Method 8260B for oxygenate content. Data from the most recent tanks emissions inventory estimates and tank seal inspections will be made available by the host site, as appropriate, throughout the duration of the DIAL field campaign, including all relevant inputs for EPA's Tanks 4.0 program (or equivalent) such as tank information, fittings information for floating roof tanks and characteristics of the stored material. Inspection and recording of emissions images with IR cameras will be used to identify and document the specific locations where emissions may be coming from.
7.5.4 Wastewater
Contemporaneous data during the DIAL monitoring including the flow rates, compositions and temperatures of the wastewater at the inlet and outlet of the wastewater emissions source will be provided by the host site. The host site may be requested to collect samples for compositional analyses (EPA Methods 8260 and 8270 by the City of Houston, Health and Human Services Department Lab or EPA's Houston Lab depending on availability), mixed liquor volatile suspended solids analyses (EPA Method 1684 or Standard Method 2540 B & E by City of Houston, Health and Human

Project No.: RN009285.0001
Element No.: B1
Revision No.: 1.0
Date: September 2009
Page: 62
Services Department Lab or EPA's Houston Lab depending on availability) and biological analyses (EPA Method 304a by EPA's Houston Lab). Data from related and relevant wastewater emissions studies, the most recent wastewater emissions inventory estimates and required seal inspections will be made available, as appropriate, by the host site throughout the duration of the DIAL Project field campaign, including all relevant inputs for EPA's Water9 program (or equivalent) such as wastewater unit information and characteristics of the wastewater. Inspection and recording of images with IR cameras will be used to identify and document the specific location where emissions may be coming from.
7.5.5 Generic Process Leaks
Contemporaneous data during the DIAL monitoring including the name of the unit where the leak occurred, composition of the leaking material, temperatures, pressures and physical characteristics of the leak opening will be provided (as available) by the host site. The host site may be requested to collect samples and conduct appropriate analyses of the process fluid. For example, ASTM method D2879-83,96 may be requested for vapor pressure analyses, "PIANO" analyses (including paraffins, isoparaffins, aromatics, naphthenes and olefins) may be requested for compositional analyses of crude oils or petroleum fractions like gasoline, naphthas or similar products, ASTM D3606-99 may be requested for benzene content and EPA Method 8260B may be requested for oxygenate content. Additionally air canister samples from leak emissions may be collected for compositional analyses (TO-15 Analyses by Chemtex Lab). Inspection and recording of images with IR cameras will be used to identify and document the specific location where emissions may be coming from. Data from the most recent fugitive emissions inventory estimates will be made available by the host site, as appropriate, including all relevant compositional and leak rate assumptions.
7.5.6 Cooling Towers
Contemporaneous data during the DIAL monitoring including cooling water flow rates and continuous monitoring data will be provided (as available) by the host site. The host site, the City of Houston or EPA staff may follow-up by conducting El Paso Method monitoring (reference El Paso Method and TCEQ Appendix P procedures). Analyses of El Paso Method 1-hour integrated stripped air canister samples may be collected for compositional analyses (TO-15 Analyses by Chemtex Lab) during the follow-up El Paso Method monitoring. Data from the most recent El Paso Method
Project No.: RN009285.0001
Element No.: B1
Revision No.: 1.0
Date: September 2009
Page: 63
monitoring and emissions inventory estimates will be made available by the host site, including all relevant compositional and cooling water flow rate assumptions.
7.6 Instrument Deployment
The project is tentatively scheduled to begin during the week of July 27, 2009. The first two or three days will be used for Health and Safety training of all involved parties and for initial site deployment and shake-down of the DIAL at the first location. Three consecutive days of sampling at each site would logistically be best, but may not be possible due to prevailing wind conditions and monitoring location priorities.
Predeployment (preliminary) QC checks will be performed on each instrument (see Section 11, Quality Control). The first full day of data collection is tentatively scheduled for July 24, 2009.
7.6.1 Meteorological Data
Meteorological data including wind direction, and wind speed, will be collected during the entire sampling/measurement campaign. Wind speed and direction data will be logged from a fixed 11m meteorological mast mounting wind sensors at two elevations. The data is logged and collected each day. The sensors consist of wind vanes and cup anemometers.
7.6.2 OP-FTIR and UV-DOAS Instrument-Source Distances
The optical path (one-way distance between the OP-FTIR and the retroreflector and the bistatic UV-DOAS receiver and source) for each configuration will be measured using a Bushnell Yardage Pro Sport 540 laser rangefinder operated by ARCADIS. Information on the procedures used for setting up and using the rangefinder can be found in MOP-6803 (Guidance for Deploying and Using ORS Supplemental Equipment) and MOP-6822 (Determining the Geographical Locations of the ORS Measurement Locations) of the ECPB Optical Remote Sensing Facility Manual, which are included in Appendix F.
7.6.3 Monitoring Procedures
Following equipment turn-on, adjustment, and pre-operation QC checks (as detailed in Section 11), the monitoring process is started. During each day of monitoring, the time and date of data acquisition are recorded in each individual teams the field notebook. If

Project No.: RN009285.0001
Element No.: B1
Revision No.: 1.0
Date: September 2009
Page: 64
for any reason data acquisition is discontinued, the events are described and times are recorded in the field notebook. The internal clocks of all instruments are synchronized at the beginning of the field campaign to allow later analysis of temporally related events.
7.7 Flux Calculations using DIAL
The DIAL technique uses pulsed tunable laser radiation which is launched into the atmosphere over the paths to be monitored. A small fraction of this energy is scattered from the atmosphere itself and from any aerosols and particulates that may also be present, back towards the laser source. It is collected by a telescope close to the source, and measured on a detection system. Since the atmospheric scattering medium acts as an extended reflector and produces backscattered radiation at all distances from the source, the time of arrival of the returning signal is range dependent. If a short duration pulse of laser radiation is transmitted into the atmosphere and the amount of backscattered radiation is measured as a function of time from the launch of the pulse, the recorded signal at a particular time relates to radiation scattered at a calculable distance from the source. Then, the gas concentration can be measured as a function of range from the source by tuning the laser wavelength on and off the spectral absorption feature of the target gas. The NPL DIAL technique operates using these principles in the infrared and ultraviolet spectral regions. This enables a wide range of gases including HCl, CH4, C2H4, C2H6, higher molecular weight alkanes and alkenes, and aromatics such as toluene and benzene, to be monitored specifically and sensitively.
The atmospheric return signal measured by a DIAL system is given by the Lidar equation, a simplified form of which is given in Equation 1.
r}d)]r(+)r(A[exp{-2(r)BrDE=(r)P C
r
02
′′′∫ α λλλλ
λλ (1)
Where Dλ is a range independent constant, C(r) is the concentration of an absorber with absorption coefficient αλ and Aλ (r) is the absorption coefficient due to all other atmospheric absorption, Eλ is the transmitted energy and Bλ is the backscatter coefficient for the atmosphere at wavelength λ.
The DIAL equation has three basic components, a backscatter term based on the strength of the signal scattering medium, parameters associated with the DIAL system

Project No.: RN009285.0001
Element No.: B1
Revision No.: 1.0
Date: September 2009
Page: 65
and a term which is a measure of the amount of absorption of the signal which has occurred due to the presence of the target species.
The laser is operated alternately at two adjacent wavelengths. One of these, the "on-resonant wavelength" is chosen to be at a wavelength which is absorbed by the target species, the other, the "off-resonant wavelength" is chosen to be at a wavelength which is not sensitive to the target species concentration. Pairs of on and off wavelength signals are acquired and averaged separately until the required signal to noise is achieved.
Because the two wavelengths used are closely separated the atmospheric terms Aλ (r) and Bλ (r) in the lidar equation can be assumed to be the same for both wavelengths. These terms are then removed by taking the ratio of the two returned signals. Multiplying the log of the ratio of the signals by the ratio of the absorption of the two wavelengths by the target species, the path integrated concentration (CL) may be derived (Equation 2).
CL(r)=1
21N
S (r)S (r)i=1
NON,i
OFF,i∆α ∑ log (2)
Where N is the number of pulse pairs averaged, ∆α = αOFF-αON is the differential absorption coefficient and S represents the received power after normalization and background subtraction for the on and off resonant signals respectively.
This path integrated concentration represents the total concentration of the target species in the atmosphere along the measured line of sight out to each range r. The DIAL measurement may be thought of as being comparable to a series of open-path measurements made with virtual retro reflectors at range, r, the spacing of which is defined by the range resolution of the DIAL system.
The range-resolved concentration (c) of the target species can be derived by calculating the derivative of CL as a function of range (Eq. 3)
dr
dCL(r)=c(r) (3)
Multiple range-resolved concentration measurements can be made along different lines-of-sight and combined to produce 2-D concentration distributions. These are typically made by scanning the line-of-sight in either azimuth or elevation, to produce

Project No.: RN009285.0001
Element No.: B1
Revision No.: 1.0
Date: September 2009
Page: 66
horizontal or vertical scans. Horizontal scans are generally used to identify different sources across a site.
Vertical scans are combined with wind information to derive the emission flux from the sources. This is done by determining a wind field, as a matrix of wind vectors, in the same plane as the vertical concentration data, and with the same spatial resolution (3.75 m x 3.75 m cells). The flux in each cell is then determined by multiplying the wind vector for each cell with the average concentration in that cell. The plane of concentration fluxes is then integrated to determine the total flux for that measurement.

Project No.: RN009285.0001
Element No.: B2
Revision No.: 1.0
Date: September 2009
Page: 67
8. Sampling Methods
There are no actual samples collected by the DIAL, OP-FTIR or UV-DOAS instruments, therefore, a discussion of sample collection, preservation, and storage procedures is not necessary. However, any additional speciation measurements made in conjunction with the DIAL will be carried out by means of grab samples, or pumped sorbent tube measurements, and are discussed below. This section details the measurement collection methods to be used. Sampling methods for the MAAML are detailed in their QAPP (City of Houston, 2008).
8.1 DIAL Sampling Methods
DIAL technology uses multiple lasers and meteorological data to measure and map both concentrations and mass emissions of various chemical species in the lower atmosphere. DIAL is a measurement technique that can directly obtain mass emissions fluxes of various chemical species from a large area, such as an industrial site.
The DIAL instrument required for this project will be able to measure a wide range of VOCs, including aromatic hydrocarbons such as benzene, which is an ozone precursor. This narrow-band operation also allows the DIAL system to target hydrocarbon mixtures and many other compounds of interest to the HDHHS/BAQC without interference from water vapor, which is ubiquitous in the Houston Ship Channel area and can interfere with other instruments’ emissions measurements.
NPL operates within an ISO 9001 compliant quality system, the scope of which covers field measurement services. NPL's procedures for operating the DIAL facility are compliant with the German VDI DIN standard VDI 4210 Part 1 - Remote Sensing of atmospheric measurements with LIDAR, which is the only (currently) published European standard for DlAL measurements.
Any additional speciation measurements will be carried out by means of grab samples, or pumped sorbent tube measurements, with subsequent analysis by NPL or a HDHHS/BAQC approved subcontractor. Analyses at NPL will be carried out according to accredited procedures.
Regarding sample collection, Method IP-1A or the equivalent will be used for Summa® evacuated canisters; the IP-1B method or its equivalent will be used for adsorbent
Project No.: RN009285.0001
Element No.: B2
Revision No.: 1.0
Date: September 2009
Page: 68
tubes. Methods 18, 25, or 25A, or suitable equivalents, will be used to analyze VOC content of samples.
8.2 MAAML
The instruments in the mobile laboratory have the capability to measure many different compounds in addition to air toxics of interest such as 1,3-butadiene and benzene. By placing the mobile laboratory at several surrounding locations and measuring wind direction and speed, the monitoring data can characterize a range of emissions that will help to "fingerprint" or identify the emission patterns of specific facilities.
The MAAML analytical platform starts with a pre-concentrator/Thermal Desorber (TD) combined with an air server composed of a mass flow controller (MFC) and a pump to draw ambient air samples at a specified rate into the instrumentation. A Nafion dryer removes excess moisture in the ambient sample. A multitrap cryogenic concentrator concentrates the sample to achieve high analytical sensitivity for very low concentrations of air toxics. After collection of a desired amount of sample, the TD rapidly heats the trap to desorb the sample and inject it into the GC. The following summarizes the sampling procedures:
Sampling method: Near real-time continuous GC/FID/MS sampling
Collection media: Multitrap cryogenic concentrator, Markes Air Server and UNITYe TD, or equivalents
Instrumentation: Agilent 6890N GC w/dual columns, heated Deans switch, and FID; Agilent 5975 Inert Turbo MSD, or equivalents
Sample flow rate: 15 mL min-1
Sample collection period: 40 min
Sample volume: 600 mL
GPS: GPS16-HVS or equivalent
Meteorological: MetOne 50.5 Sonic Wind Sensor, Met One 060A Temperature Sensor, Met One 083D Relative Humidity Sensor, Met One 092 Barometric Sensor; or equivalents
Project No.: RN009285.0001
Element No.: B2
Revision No.: 1.0
Date: September 2009
Page: 69
Appendix C of the Mobile Laboratory Project QAPP (City of Houston, 2008) contains the BAQC Standard Operating Procedure for the TD-GC/FID/MS for Air Toxics Analysis in the Mobile Ambient Air Monitoring Laboratory (MAAML). This document addresses issues such as safety, calibrations and QC analyses, corrective actions, and sample analysis.
8.3 Description of Measurement Methods
The project is tentatively scheduled to begin during the week of July 24, 2009. The first two or three days will be used for Shell Site Health and Safety training of all involved parties and for initial site deployment and shake-down of the DIAL at the first location. The following tasks will be completed as part of the instrument deployment process:
1. Deploying the DIAL at the first site in the optimum location based on the suspected sources and prevailing wind. The priority of the sites and the configuration of the instrument (UV or IR) will be determined by the HDHHS/BAQC Supervising Engineer.
2. Deploying the OP-FTIR and the UV-DOAS as near to the DIAL as possible, given site and safety constraints.
3. Deploying the MAAML at the approximate mid-point of the OP-FTIR and UV-DOAS pathlengths.
4. One fixed meteorological mast will be deployed by NPL. A portable meteorological mast may also be deployed.
5. The internal clocks of all instruments are synchronized to allow for later analysis of temporally related events.
Testing and measurement protocols include:
• Benzene and total hydrocarbon profile measurements with the DIAL – UV and DIAL – IR configurations, respectively.
• PIC total alkane emission measurements with the OP-FTIR instrument
• Benzene emission measurements with the UV-DOAS instrument

Project No.: RN009285.0001
Element No.: B2
Revision No.: 1.0
Date: September 2009
Page: 70
• Meteorological data collection with the DIAL meteorological head
• Optical path length determination with Bushnell rangefinder
8.3.1 Data Generation
The NPL Dial operates within a Quality Management system that is ISO 9001 accredited. DIAL work is performed following two local procedures, and analytical data for the DIAL will be generated according to QPDQM.B.513 - Analysis and Presentation of Field Measurement Data. Operation of the DIAL is in accordance with desk instructions and local operating procedures. Only trained and experienced staff are authorized to operate the DIAL system.
Analytical data for the OP-FTIR will be generated in accordance with MOP 6827 (Procedures for OP-FTIR Concentration Data Analysis Using IMACC FTIR SOFTWARE SUITE) of the ECPB Optical Remote Sensing Facility Manual, which is presented in Appendix G of this document. The average four-minute, path-integrated benzene concentrations will be determined from the OP-FTIR beam path.
Analytical data for the UV-DOAS will be generated in accordance with the OPSIS ER-150 (bistatic) UV-DOAS instrument User Manual, the Opto-Analyser AR-500 Hardware Operating Manual, and the OPSIS QA/QC manual entitled, Quality Assurance and Quality Control using OPSIS Analyzers for Air Quality Monitoring. These manuals are included as Appendices H, I, and J, respectively. The average four-minute, path-integrated benzene concentrations will be determined from the UV-DOAS beam path.
8.3.2 Meteorological Data Collection for the NPL Fixed Mast
The fixed mast will be deployed in a single location for the duration of the measurement campaign. The location will be chosen to be as representative of the overall wind conditions at the Shell Deer Park Facility as possible. The location will be in an open area, without, as far as practically possible, local obstructions to the wind flow or other local effects.
Meteorological data including wind direction and wind speed will be logged each day using a 'data taker' logger housed in a weather proof enclosure. The data are vector averaged within the logger to produce a continuous time series of one minute averages. These data are downloaded each day.

Project No.: RN009285.0001
Element No.: B2
Revision No.: 1.0
Date: September 2009
Page: 71
8.3.3 Optical Path Length Determination with the Bushnell Rangefinder
The physical distance between the OP-FTIR and the retroreflector (or the bistatic UV-DOAS receiver and source) is determined by measurement with a Bushnell Yardage Pro Sport 450 Laser Rangefinder. The measurement is a manual operation, with the results recorded by hand in the project notebook. After the project has been completed, the results will be transferred to a Microsoft Excel spreadsheet for data archiving and calculations.

Project No.: RN009285.0001
Element No.: B3
Revision No.: 1.0
Date: September 2009
Page: 72
9. Sample Handling and Custody
For this project, the samples that are being handled include the benzene and total hydrocarbon profile data collected with the DIAL – UV and DIAL – IR, respectively; path-integrated total alkane data collected with the OP-FTIR; path-integrated benzene concentration data collected with the UV-DOAS; and wind speed and wind direction data collected with the meteorological instrument. The data are downloaded each weekday by the respective team leaders, or his designee, as described in Section 6, Documentation and Records. The data are then named and stored according to the procedures outlined in Section 6.1 of this document. The data are downloaded and accessed using password-protected computers that are only accessible by members of the project team. The electronic chain-of-custody for the data is detailed in Section 16, Data Management, of this document.
Any grab or canister samples collected will be analyzed by EPA-accredited laboratories to ensure proper sample handling and custody procedures.
MAAML Chemists will not directly handle discrete samples. The identity and disposition of samples are documented electronically by the run log associated with the GC/FID/MS support computer and processing software. Meteorological signals are recorded in analog by a data logger, then converted to digital and processed by the support computers and software. An audit trail of all data transfers and processing activities associated with electronic data files is maintained by the processing software, and hardcopies are kept in site specific binders. All electronic data files and data measured by meteorological instruments are transferred to the Active and Intelligent Monitoring (AIM) server via wireless modem for secure storage. The AIM server provides real-time web-based access for analyzing results.
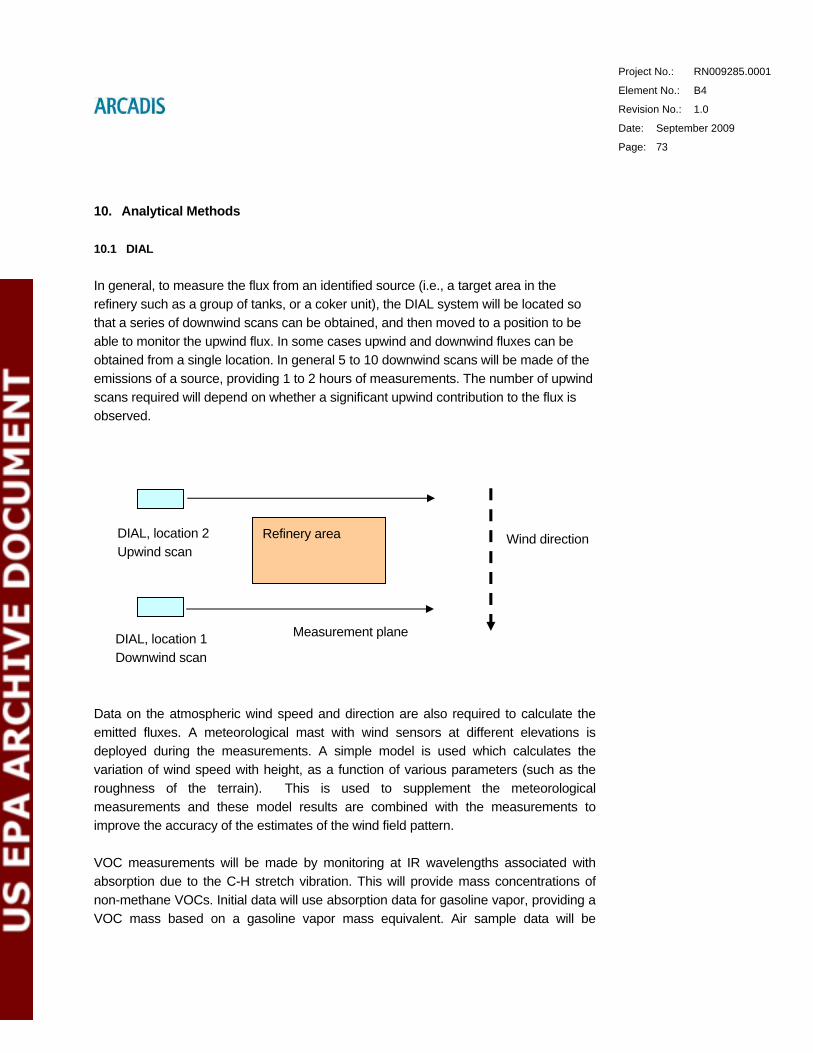
Project No.: RN009285.0001
Element No.: B4
Revision No.: 1.0
Date: September 2009
Page: 73
10. Analytical Methods
10.1 DIAL
In general, to measure the flux from an identified source (i.e., a target area in the refinery such as a group of tanks, or a coker unit), the DIAL system will be located so that a series of downwind scans can be obtained, and then moved to a position to be able to monitor the upwind flux. In some cases upwind and downwind fluxes can be obtained from a single location. In general 5 to 10 downwind scans will be made of the emissions of a source, providing 1 to 2 hours of measurements. The number of upwind scans required will depend on whether a significant upwind contribution to the flux is observed.
Refinery area
DIAL, location 1 Downwind scan
DIAL, location 2 Upwind scan
Measurement plane
Wind direction
Data on the atmospheric wind speed and direction are also required to calculate the emitted fluxes. A meteorological mast with wind sensors at different elevations is deployed during the measurements. A simple model is used which calculates the variation of wind speed with height, as a function of various parameters (such as the roughness of the terrain). This is used to supplement the meteorological measurements and these model results are combined with the measurements to improve the accuracy of the estimates of the wind field pattern.
VOC measurements will be made by monitoring at IR wavelengths associated with absorption due to the C-H stretch vibration. This will provide mass concentrations of non-methane VOCs. Initial data will use absorption data for gasoline vapor, providing a VOC mass based on a gasoline vapor mass equivalent. Air sample data will be

Project No.: RN009285.0001
Element No.: B4
Revision No.: 1.0
Date: September 2009
Page: 74
subsequently used to provide information on the VOC compounds present, and this will be used to determine the mass based absorption factor, which will be used to provide a VOC mass flux based on the observed mixture of species. This will make use of the NPL spectroscopic database which provides traceable spectra of a number of hydrocarbons.
Benzene will be measured in the UV providing a parts per million concentration map and mass flux. Flux data will be presented in units required by the HDHHS/BAQC, proposed to be pounds per hour.
A DIAL flux measurement of a location will consist of the following:
• Vertical scans downwind and upwind to map concentration distributions
• Measurement of wind conditions at the time of the DIAL measurements
• Identification of suitable location to take air samples for speciation analysis
• Recorded information on the source location, plant activities, temperature and ambient pressure
• Recorded information on DIAL location, using site maps and DIAL GPS (Hemisphere GPS A100).
The data acquired are analyzed, using the DlAL techniques described below, to give the range-resolved concentration along each line-of-sight.
The DIAL measurement scan configuration – the number of measurement lines in a vertical scan, the angle range scanned over, and the number of DIAL shots acquired at each scan line are determined based on the expert judgment of the DIAL operators. The main factors affecting the signal averaging time are the signal strength due to the atmospheric backscatter and the measurement configuration (i.e. location and size of the source). The scan configuration is therefore defined for each flux measurement based on conditions. In general scans will take between 10 to 20 minutes. The spatial resolution achieved in a scan will be the product of post processing, however this will have a negligible affect on the flux data.
In general the measurement configuration is chosen such that the DIAL measurement plane is as perpendicular to the horizontal wind vector as possible. However, this is not

Project No.: RN009285.0001
Element No.: B4
Revision No.: 1.0
Date: September 2009
Page: 75
always possible in practice, due to constraints on the location of the DIAL and achievable measurement lines of sight. The data processing steps take account of the wind direction, so it is not a critical requirement.
The data analysis process consists of the following steps:
1. Normalization for variation in transmitted energy
The two signal returns are normalized using the monitored values of the transmitted energy. The mean transmitted energy is used to normalize the averaged return signal. For this application, this has been shown to be equivalent to normalizing individual shots against transmitted energy and then averaging the normalized values.
2. Background subtraction
Following normalization for transmitted energy any DC background value is subtracted from the signals. This measured background takes account of any DC signal offset which may be present due to electronic offsets and from incident background radiation. The background level is derived from the average value of the far field of the returned lidar signal where no backscattered light is present.
3. Calculation of path-integrated concentration
The path-integrated concentration of the target species, out to the range r, is calculated by multiplying the log of the ratio of the returned normalized signals by the differential absorption.
The absorption coefficients used in this calculation are derived from high-resolution spectroscopy carried out using reference gas mixtures at NPL.
4. Derivation of range-resolved concentrations
In order to better visualize the data the integrated concentration profiles are piecewise differentiated to give the range-resolved concentration along the line-of-sight.
5. Calculation of emission fluxes
Range-resolved concentration measurements along different lines-of-sight are combined to generate a concentration profile. This is carried out using algorithms
Project No.: RN009285.0001
Element No.: B4
Revision No.: 1.0
Date: September 2009
Page: 76
developed at NPL which reduce artifacts due to the difference in data density at different ranges, due to the polar scanning format of the data. The emission flux is then determined using the concentration profile together with meteorological data.
The emitted flux is calculated using the following mathematical steps:
a) The product is formed of the gas concentration measured with the DlAL technique at a given point in space (3.75 x 3.75 pixel), and the component of the wind velocity perpendicular to the DlAL measurement plane at the same location.
b) This product is computed at all points within the measured concentration profile, to form a two-dimensional array of data, with a spatial 'pixel' size of 3.75 m x 3.75m.
c) This array of flux results is then integrated over the complete concentration profile to produce a value for the total emitted flux.
Considerable care is needed in applying the meteorological data, particularly when the concentration profile measured by the DlAL technique has large and complex spatial variations since, for example, errors in the wind speed in regions where large concentrations are present will significantly affect the accuracy of the results. In such cases, a more complex procedure is used which employs a further software package to combine the data from the anemometers with that of an additional meteorological model, to generate the complete wind field over the concentration profile. This model calculates the variation of wind speed with height, as a function of various parameters (such as the roughness of the terrain). The calculated wind field is then combined with the measured gas concentration profile using the procedure described above.
The spatial averaging applied to the DIAL data can be adjusted in post processing, to take account of low signals due to atmospheric backscatter. This primarily affects the production of concentration plots. These are a secondary data product used to provide visual indications of plume location and as an aid to source identification. The averaging used has minimal affect on calculation of the emission fluxes, which are the main data product.

Project No.: RN009285.0001
Element No.: B4
Revision No.: 1.0
Date: September 2009
Page: 77
The DIAL measures (aliphatic) hydrocarbons by measuring the differential absorption of two wavelengths of light. The wavelengths used, at around 3 µm, are chosen to measure, in effect, the C-H stretch in the hydrocarbons for C3 and above. The sensitivity of the DIAL is slightly different to different hydrocarbons and, for example, an oxygenated hydrocarbon will give a different absorption per mass than a straight chain alkane. The differential absorption strength used is (usually) calibrated to give a mass emission rate for a gasoline vapor. A different ‘cocktail’ of hydrocarbons would give a slightly different response per unit mass. Air samples will be taken at locations which will provide an indication of the actual speciation of the emission fluxes sampled by the DIAL. If the actual (relative) composition is known, from the air sample analyses, then by determining the absorption of each constituent it is possible to determine a correction factor which will provide the true ‘mass value’ assuming the emissions measured have a similar relative composition to the sampled air.
The results of the GC analyses of the NPL air samples are combined with NPL's spectral library to quantify the impact of such interferences on the measurements.
Applying this absorption coefficient to the DIAL results enables a correction to be applied to the total VOC emission rates to account for the hydrocarbon mix observed at the measurement location.
10.2 MAAML
The MLP team will perform the primary sample analyses based upon EPA Compendium Method TO-14A, "Determination of Volatile Organic Compounds (VOCs) in Ambient Air Using Specially Prepared Canisters with Subsequent Analysis by Gas Chromatography” and EPA Technical Assistance Document for Sampling and Analysis of Ozone Precursors. Procedural modifications will include the incorporation of MS instrumentation and use of near real-time continuous sampling procedures rather than the lack of MS instrumentation and use of canister sampling methods described in EPA Method TO-14A.
The GC has dual capillary columns that coupled with an FID and an MSD. MLP Chemists use the MSD to examine mass spectra for individual peaks in the total ion chromatogram with respect to the fragmentation pattern of ions corresponding to various VOCs, including the intensity of primary and secondary ions. Comparing the fragmentation pattern with the National Institute of Standards and Technology (NIST) traceable reference spectra allows the MLP Chemists to identify the compound. For any given compound, the MSD compares the intensity of the quantitation ion with the

Project No.: RN009285.0001
Element No.: B4
Revision No.: 1.0
Date: September 2009
Page: 78
system response to the fragment for known amounts of the compound. This establishes the compound concentration in the sample.
MLP Chemists will use the FID for the quantitation of light species such as ethane, ethylene, and acetylene with the identification of these compounds based on matching retention times and peak patterns of standards containing known analytes.
10.3 Analytical Methods
After the data for the project has been collected and archived (See Section 9), the data will be averaged into 20-minute intervals, according to the procedures described in Section 8.3.1, Data Generation.
After the data has been averaged, it will be validated to assess whether it can be used for the benzene and total hydrocarbon flux determinations. Validation will be performed on data collected with the DIAL, OP-FTIR, and UV-DOAS instruments, and meteorological equipment.
More information on the data validation procedures can be found in Section 19 of this document. Once the data validations have been completed, the data will be used to calculate the benzene and total hydrocarbon flux for each of the selected Shell Deer Park complex locations.

Project No.: RN009285.0001
Element No.: B5
Revision No.: 1.0
Date: September 2009
Page: 79
11. Quality Control
11.1 NPL DIAL
Project management at NPL is governed by a number of internal procedures and processes that have been independently certified as part of NPL's quality system accreditation under IS0 9001. These procedures require detailed project planning and progress monitoring with projects subject to regular internal reviews and quality audits. In addition, Lloyds Register Quality Assurance (LRQA) performs external audits on projects and the quality system at NPL.
The following gives a summary of the QA/QC procedures that will be followed during the project:
Measurement Planning
• Campaign logistics: This includes pre-site visits (if required) and checklists for ensuring the site are aware of the logistics of a DIAL measurement. A method statement covering the DIAL may be provided if required.
• Health and Safety: This covers requirements for site specific health and safety, for example safety inductions or hot work permit systems. It also requires a risk assessment for site specific hazards, and for example the provision of suitable PPE. Risks associated with the operation of the DIAL system are covered within an NPL internal risk-assessment. The NPL DIAL system has a fire prevention system, which is maintained and tested under a service contract, and all electrical equipment is routinely tested in accordance with UK regulations for In-service Inspection & Testing of Electrical Equipment.
• Selection of measuring locations: Identification of suitable measurement locations from a technical viewpoint and also from a site logistics (parking and potential obstructions etc).
• Identification of likely emissions sources contributing to the measurement scan: This requires information from the site, usually including site plans and existing emissions information. Potential sources off-site should also be considered.

Project No.: RN009285.0001
Element No.: B5
Revision No.: 1.0
Date: September 2009
Page: 80
• Identification of potential interfering species: For complex sites this may require process information or preliminary air-sample analysis taken as part of the pre-site visit. The NPL database of spectra can be searched to identify species with potentially interfering absorption features.
• Assessment of wind field and availability of suitable met measurements: Pre site planning includes an assessment of the likely wind, and what existing meteorological data are available.
Traceability and Calibration
• Calibration of meteorological equipment: Wind direction and wind speed sensors are checked against a traceable calibrated system at NPL.
• Calibration of DIAL concentration measurement using built in gas cells and internationally traceable gas standards: As described in the technical overview, the DIAL concentration measurement calibration is checked using gas cells within the DIAL system.
• Use of traceable spectral information: NPL use spectral data from an internal quantified spectral database with spectra taken using a high resolution lab-based Bomem DA8 FTIR spectrometer.
• Accredited laboratory for speciation measurements: NPL use our own internal accredited laboratory for air sample analyses to provide speciation data for VOC measurements. Where necessary (due to logistics or requirements for local methods) we use local suppliers who can meet NPL’s quality requirements.
The NPL DIAL system has several in-built calibration techniques and procedures. The most important are the in-line gas calibration cells. Part of the transmitted beam is split off in the same way as the beam for the transmitted energy monitors. This beam passes through a gas cell containing a known concentration of the target species. These cells are prepared using NPL standard gas mixtures which are traceable to national standards. This gives a direct measurement of the differential absorption of the DIAL wavelengths by the target gas. It is continuously monitored during the operation of the system to detect any possible drift in the laser wavelengths or bandwidths.
Project No.: RN009285.0001
Element No.: B5
Revision No.: 1.0
Date: September 2009
Page: 81
Calibration cells are also placed intermittently in the output beam to validate the response of the whole system.
NPL have also developed and operate a facility for the calibration of long path monitors including DIAL. This consists of a 10m long window-less cell able to maintain a uniform independently monitored concentration of a gaseous species along its length. The range-resolved concentration measurement capability of NPL’s DIAL system was validated using this facility.
Validation of DIAL Flux Measurements
There have been a number of field comparisons undertaken to validate flux measurements undertaken with the DIAL system. These have included
• Repeated DIAL measurements downwind of a source of a known flux of methane agreed to within +/- 10 percent of emitted value (10 kg/hour)
• Comparison with a line of pumped absorption tube samplers inside chemical plant agreed with DIAL measurements of aliphatic hydrocarbons to within +/- 12 percent and toluene to within +/- 15 percent.
• VOC emission measurements from a petro-chemical storage facility made by DIAL and standard point sampling methods agreed to within +/- 8 percent.
These tests mainly highlight uncertainties in the technique used to calculate flux rates which relies on accurate wind profiling.
• Comparison measurements of a known SO2 source monitored using an independent measurement technique.
• Comparison of VOC measurements along a near ground level line of sight against a series of six pumped samplers, and one or two canister samplers.
Data Ratification
• The final data set will be assessed in a 'quality circle' before issuing the final report. This involves an independent assessment of the data analysis by a

Project No.: RN009285.0001
Element No.: B5
Revision No.: 1.0
Date: September 2009
Page: 82
panel review, chaired by an NPL scientist who will not have been involved in the measurements but is familiar with DIAL measurements.
• The repeatability of results of the emissions from the same sources will be assessed, to determine if the variability is due to the DIAL technique or variations in the emissions.
Quality Assurance
NPL's quality management system has been registered for scientific R&D and the provision of internal services by LRQA to IS0 9001:2000 and where appropriate in accordance to TicklT. Many of the services offered by NPL are accredited by the United Kingdom Accreditation Service (UKAS). Copies of the certificates are available on our website www.npl.co.uk.
The NPL Quality Manual covers work carried out at NPL's permanent site, at sites away from our permanent facilities, or in associated temporary or mobile facilities. These policies are amplified where necessary in procedures. The quality system set out in the manual is supported by corporate and local procedures and desk instructions. Controlled copies of corporate procedures are distributed via NPL's Intranet. Internal quality audits are carried out on a regular basis to monitor the implementation of the NPL Quality Management System to determine it conforms to planned arrangements and the requirements of IS0 17025 and IS0 9001; also, to identify where business
11.2 MAAML
The Mobile Laboratory Project team is responsible for maintaining and operating the Mobile Ambient Air Monitoring Laboratory (MAAML) including all required calibration and quality assurance/quality control (QA/QC) protocols. MLP management assures that the instruments, personnel, methods, QC procedures, and records conform to the MLP Quality Management Plan, MLP Quality Assurance Project Plan, MLP Standard Operating Procedures (SOPs) as well as all applicable city, state, and federal guidelines. Each team member has certain responsibilities to fulfill for the QA/QC program to be successful.
The Quality Control (QC) protocol for the MLP includes the following:
Project No.: RN009285.0001
Element No.: B5
Revision No.: 1.0
Date: September 2009
Page: 83
• Sampling system contributions to the final measurements
• Analytical system contributions to the final measurements
• Qualitative performance of the method
• Quantitative performance of the method
• Precision of the measurements
• Accuracy (bias) of the measurements
QC activities for meteorological equipment include visual inspection of instrumentation integrity, measurement consistency with current conditions, and corrective actions while QC activities for GPS equipment will reflect manufacturer’s guidelines. Details on all QC activities can be found in their QAPP (City of Houston, 2008).
11.3 Pre-Deployment QC Checks
11.3.1 DIAL
The NPL DIAL system has several in-built calibration techniques and procedures. The most important are the in-line gas calibration cells. The gas cells are filled with known concentrations of the target species, from NPL standard gas mixtures, which are directly traceable to national standards. A fraction of the transmitted beam is split off and directed through a gas cell to a PED, in the same way as the beam for the transmitted energy monitors. This provides a direct measurement of the differential absorption at the operating wavelengths by the target gas. The transmission through the gas cells is continuously monitored during the operation of the system to detect any possible drift in the laser wavelengths. The calibration cells are also periodically placed in the output beam to show the concentration response of the whole system is as expected.
11.3.2 OP-FTIR
Before deployment to the field, a series of QC checks are performed on the OP-FTIR instrument. These checks will take place at the EPA. More information on these QC checks can be found in MOP 6802 Pre-Deployment and QC Checks for ORS Facility
Project No.: RN009285.0001
Element No.: B5
Revision No.: 1.0
Date: September 2009
Page: 84
Instrumentation) of the ECPB Optical Remote Sensing Facility Manual, which is presented in Appendix K of this document.
11.3.3 UV-DOAS
Before deployment to the field, an Eight-Point Span/Offset Calibration is performed on the UV-DOAS instrument. Additionally, a series of QC checks are performed. The calibration and QC checks will take place at the EPA facility, and are detailed in Appendix C: Project Specific Operating Procedure for OPSIS UV-DOAS Calibration and QC Checks for Benzene, of this document.
11.3.4 Meteorological Head
Before deployment to the field, a series of QC checks are performed on the meteorological head. These include checking the signal collection chain from the cup anemometer to the data logger, as described in Section 4.4.5. Intercomparisons between the different wind sensors are also carried out to check their performance.
11.4 Pre-Operation QC Checks
Following equipment set up, a series of pre-operation QC checks are conducted to ensure that the equipment is functioning properly. These QC checks are described in the following subsections. If any of the instrumentation fails to pass the QC checks, data collection will cease until the problem can be assessed and corrected.
11.4.1 DIAL
The NPL DIAL system has several in-built calibration techniques and procedures. The most important are the in-line gas calibration cells. The gas cells are filled with known concentrations of the target species, from NPL standard gas mixtures, which are directly traceable to national standards. A fraction of the transmitted beam is split off and directed through a gas cell to a PED, in the same way as the beam for the transmitted energy monitors. This provides a direct measurement of the differential absorption at the operating wavelengths by the target gas. The transmission through the gas cells is continuously monitored during the operation of the system to detect any possible drift in the laser wavelengths. The calibration cells are also periodically placed in the output beam to show the concentration response of the whole system is as expected.

Project No.: RN009285.0001
Element No.: B5
Revision No.: 1.0
Date: September 2009
Page: 85
11.4.2 OP-FTIR Instruments
Several QC checks are performed on the OP-FTIR before actual data collection begins. A complete description of each QC check performed on the OP-FTIR can be found in MOP 6823 (QC Checks of ORS Instrument Performance during Data Collection) of the ECPB Optical Remote Sensing Facility Manual, which is presented in Appendix J.
11.4.3 UV-DOAS Instruments
Several QC checks are performed on the UV-DOAS instruments before actual data collection begins. A complete description of each QC check performed on each UV-DOAS can be found in Appendix C: Project Specific Operating Procedure for OPSIS UV-DOAS Calibration and QC Checks for Benzene.
11.4.4 Meteorology Head
As described in Section 4.4.5. Intercomparisons between the different wind sensors are also carried out to check their performance.
11.5 QC Checks during Operation
In-operation QC checks for the instruments used in the project are discussed below.
During each day of sampling and instrument operation, QC checks on the reasonableness of measured data are frequently made. These checks verify the operational status of the instruments. Additionally, the values of several operational parameters are quantitatively evaluated. In-operation QC checks for the instruments used in the project are discussed below:
DIAL
Internal QA checks on the DIAL concentration data are carried out as follows:
• A calibration gas cell is placed in the output beam of the DIAL to check the concentration measurement (accuracy check). This is carried out at least once a day.
• A wavelength scan through this cell is also carried out to check absorption cross section, at least once a week
Project No.: RN009285.0001
Element No.: B5
Revision No.: 1.0
Date: September 2009
Page: 86
• The diagnostic gas cell power readings are checked on every measurement scan for drift (online precision check)
• Laser power of output DIAL beam is monitored on every scan
• Wind data are collected and downloaded to computer every day and checked for reasonableness against observed meteorological conditions. Consistency between different sensors is also checked.
• DIAL location is checked and recorded on map and GPS location is checked for reasonableness against observed location
OP-FTIR
• Continuously monitor the strength of the signal on the retroreflector. The strength of the signal should be at least five times the intensity of the stray light signal collected at the beginning of the field campaign.
• Continuously check the data collection computer to ensure that data is being recorded.

Project No.: RN009285.0001
Element No.: B7
Revision No.: 1.0
Date: September 2009
Page: 87
12. Instrument/Equipment Testing, Inspection, and Maintenance
NPL, ARCADIS and EPA staff will be on-site each day of testing. Section 11 details the QC checks to be made during predeployment, per-operation, and during operation for the DIAL, OP-FTIR and UV-DOAS. Any required corrective actions will be documented in the field notes as well as in the Weekly Progress Report to the HDHHS/BAQC Supervising Engineer.
Equipment testing, inspection, and maintenance will be performed during the field campaign as needed or as specified by the established QA procedures. Critical spare parts/supplies will be stocked by each participant for their respective instruments.
Section 11 details the QC checks to be made during predeployment, per-operation, and during operation for the DIAL, OP-FTIR and UV-DOAS instruments, as well as the meteorological head. The NPL DlAL system which will be deployed has been tested in a number of ways. Specifically it is validated using the NPL Open Path Calibration Facility, and inspection and maintenance are performed as required by NPL procedures. The NPL Dial operates within a Quality Management system that is ISO 9001 accredited. DIAL work is performed following two local procedures:
QPDQM.B.512 - Planning and Implementing a Field Measurement Campaign
QPDQM.B.513- Analysis and Presentation of Field Measurement Data
To assess the performance of the NPL DIAL, Spectroscopic Calibration Procedures, Calibration Gases, Spectral Scans, Continuous Spectral Monitoring, and In-line Cell Checks are used (see Section 4.4.1). Operation of the DIAL is in accordance with desk instructions and local operating procedures. Only trained and experienced staff are authorized to operate the DIAL system (see Section 8.3.1). Additional details on Measurement Planning, Traceability and Calibration, Validation of DIAL Flux Measurements, Data Ratification and QC Checks are described in Section 11. Section 4.4.5 describes the calibration of the NPL meteorological heads. In addition, the different sensors are compared side-by-side in the field to provide a further check on their correct function. Data Collection procedures for the NPL fixed mast are described in Section 8.3.2
For information on calibration and operation of the OP-FTIR instrument, refer to Appendix F (MOP-6803: Guidance for Deploying and Using ORS Supplemental Equipment), Appendix H (MOP 6802: Pre-Deployment and QC Checks for ORS

Project No.: RN009285.0001
Element No.: B7
Revision No.: 1.0
Date: September 2009
Page: 88
Facility Instrumentation) and Appendix L (MOP-6823: QC Checks of ORS Instrument Performance during Data Collection). For information on calibration and operation of the UV-DOAS instrument, refer to Appendix C (Project Specific Operating Procedure for OPSIS UV-DOAS Calibration and QC Checks for Benzene).
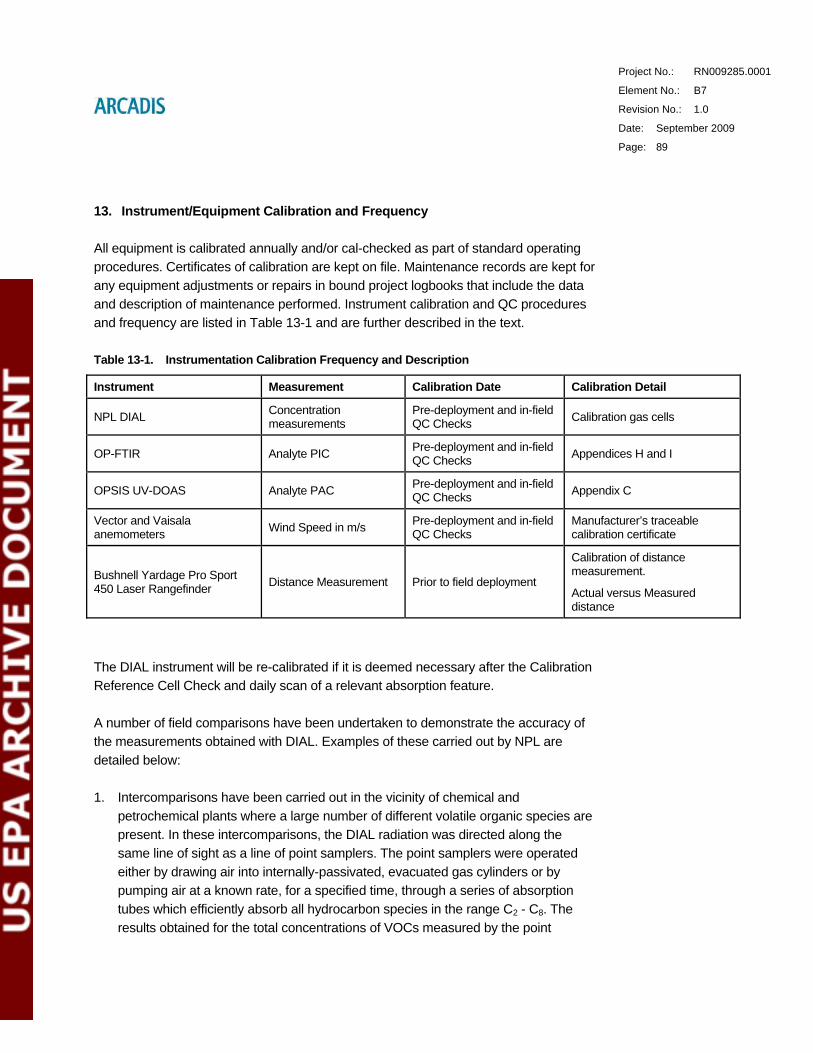
Project No.: RN009285.0001
Element No.: B7
Revision No.: 1.0
Date: September 2009
Page: 89
13. Instrument/Equipment Calibration and Frequency
All equipment is calibrated annually and/or cal-checked as part of standard operating procedures. Certificates of calibration are kept on file. Maintenance records are kept for any equipment adjustments or repairs in bound project logbooks that include the data and description of maintenance performed. Instrument calibration and QC procedures and frequency are listed in Table 13-1 and are further described in the text.
Table 13-1. Instrumentation Calibration Frequency and Description
Instrument Measurement Calibration Date Calibration Detail
NPL DIAL Concentration measurements
Pre-deployment and in-field QC Checks Calibration gas cells
OP-FTIR Analyte PIC Pre-deployment and in-field QC Checks Appendices H and I
OPSIS UV-DOAS Analyte PAC Pre-deployment and in-field QC Checks Appendix C
Vector and Vaisala anemometers Wind Speed in m/s Pre-deployment and in-field
QC Checks Manufacturer’s traceable calibration certificate
Bushnell Yardage Pro Sport 450 Laser Rangefinder Distance Measurement Prior to field deployment
Calibration of distance measurement.
Actual versus Measured distance
The DIAL instrument will be re-calibrated if it is deemed necessary after the Calibration Reference Cell Check and daily scan of a relevant absorption feature.
A number of field comparisons have been undertaken to demonstrate the accuracy of the measurements obtained with DIAL. Examples of these carried out by NPL are detailed below:
1. Intercomparisons have been carried out in the vicinity of chemical and petrochemical plants where a large number of different volatile organic species are present. In these intercomparisons, the DIAL radiation was directed along the same line of sight as a line of point samplers. The point samplers were operated either by drawing air into internally-passivated, evacuated gas cylinders or by pumping air at a known rate, for a specified time, through a series of absorption tubes which efficiently absorb all hydrocarbon species in the range C2 - C8. The results obtained for the total concentrations of VOCs measured by the point
Project No.: RN009285.0001
Element No.: B7
Revision No.: 1.0
Date: September 2009
Page: 90
samplers and those measured by the infrared DIAL technique agreed within ± 15 percent. The concentrations of atmospheric toluene measured by the ultraviolet DIAL system agreed with those obtained by the point samplers to within ± 20 percent.
2. The ultraviolet DIAL system was used to monitor the fluxes and concentrations of sulfur dioxide produced from combustion and emitted by industrial stacks. These stacks were instrumented with calibrated in-stack sampling instruments. The results of the two sets of measurements agreed to within ± 12 percent.
3. DIAL Measurements of controlled releases of methane from a stack agreed with the known emission fluxes to within ± 15 percent.
The NPL Open-Path Calibration Facility is a full-scale facility developed and operated by NPL for the calibration of open path monitors, including DIAL. This consists of a 10 m long windowless cell able to maintain a uniform, independently-monitored concentration of a gaseous species along its length. This provides a known controlled section of the atmosphere with traceable concentration over a defined range (10 m). The absence of windows removes reflections and other artifacts from measurements made using optical techniques, providing a direct way to validate and assess the calibration of DIAL instruments.
The calibration facility is windowless with a 1 m diameter, to minimize any beam reflections from the cell walls and ends. At each end of the cell is an annular calibration-gas feed ring with multiple outlets injecting the calibration gas mixture into the cell. A ring of tangential fans around the centre of the cell extract gas and entrained air pulled in through the open ends of the cell. This ensures the backscatter in the cell approximates to the ambient air conditions. Each fan has a long exhaust tube to avoid recirculation of the gas into the cell.
This facility has been employed to directly validate VOC measurements by the NPL DlAL facility (Milton, et al., 1995).

Project No.: RN009285.0001
Element No.: B7
Revision No.: 1.0
Date: September 2009
Page: 91
The facility provides the ability to generate a defined concentration path and so it also provides range-resolution validation for DlAL and lidar instruments. The system was used to validate the DlAL with a number of measurements of propane and methane, as a part of its acceptance tests for Siemens, Shell and British Gas.
The IMACC OP-FTIR will be calibrated at EPA prior to field deployment to ensure that the instrument is operating properly. The OP-FTIR will be re-calibrated if it is deemed necessary after the comparison of consecutive nitrous oxide concentration measurements.
The OPSIS UV-DOAS instrument will be calibrated prior to field deployment to ensure that the instrument is operating properly. The UV-DOAS instrument will be re-calibrated if it is deemed necessary after the Four-Point Calibration QC check.
The Bushnell rangefinder (which provides the distance measurements) will be calibrated by ARCADIS prior to field deployment. The calibration procedures used by the MAAML are detailed in their QAPP (City of Houston, 2008).

Project No.: RN009285.0001
Element No.: B8
Revision No.: 1.0
Date: September 2009
Page: 92
14. Inspection/Acceptance of Supplies and Consumables
Supplies and consumables for the DIAL include methanol (dye laser consumable) and calibration gases, including propane and nitrogen. Liquid nitrogen is required to cool the IR detector.
Drierite (for the dry air supply for the UV-DOAS instrument) is the only other critical supply/consumable for this project. New Drierite will be used for the dry air supply and visual inspections will be performed at least daily to ensure the material is not spent. Spent material will be replaced. The EPA UV-DOAS Specialist will be responsible for ensuring that ample supplies are on-hand.

Project No.: RN009285.0001
Element No.: B9
Revision No.: 1.0
Date: September 2009
Page: 93
15. Non-Direct Measurements
Process data, as detailed in Section 7.5, will be collected from each suspected source of significant emissions at each of Shell Deer Park locations monitored, and from each flare and delayed coker monitored with DIAL, during DIAL measurements. In addition, the data collected by the MAAML will be used by HDHHS/BAQC in atmospheric dispersion models to assess the impact of source emissions on ambient air quality. Their methodology is detailed in their QAPP (City of Houston, 2008). These data will be provided to HDHHS/BAQC for use in answering the project objectives.
Project No.: RN009285.0001
Element No.: C1
Revision No.: 1.0
Date: September 2009
Page: 94
16. Data Management
Data for this project includes a field notebook, which will document project activities, a logbook for each analyzer used during the project, and the data files from the DIAL, OP-FTIR, and UV-DOAS instruments, and the meteorological head.
The Final Project Report from NPL to HDHHS/BAQC will contain the calculated flux of benzene and total hydrocarbon emissions for every ~10-20 minute scanning period as measured by the DIAL UV and IR configurations, respectively. The total alkane concentration and equivalent molecular mass data from the OP-FTIR and the benzene concentration data from the UV-DOAS will be used to confirm the DIAL detections and to calculate the flux values.
Additional deliverables in the Final Project Report will include:
• DIAL, OP-FTIR and UV-DOAS data from each day of the measurement campaign
• Optical path length measurements for the single-path OP-FTIR and bistatic UV-DOAS instruments
• Meteorological data:
a. Wind speed
b. Wind direction
Table 16-1 lists the data-related deliverables which include any results of QC checks for the respective instruments, format of each deliverable, and personnel responsible. MAAML will provide their data directly to HDHHS/BAQC.

Project No.: RN009285.0001
Element No.: C1
Revision No.: 1.0
Date: September 2009
Page: 95
Table 16-1. Data-related Deliverables
Deliverable Custodian Person Delivered to Format
UV-DIAL Benzene Profiles Rod Robinson, NPL Daniel Hoyt, HDHHS/BAQC .xls files
UV-DIAL Total Hydrocarbon Profiles Rod Robinson, NPL Daniel Hoyt, HDHHS/BAQC .xls files
OP-FTIR PIC Data Mike Chase, ARCADIS Robert Kagann, ARCADIS .txt files
UV-DOAS PAC Data Cary Secrest, EPA Daniel Hoyt, HDHHS/BAQC .txt files
Optical Path Length Measurements Mike Chase, ARCADIS Robert Kagann, ARCADIS Field Notebook
Meteorological Data (Summary) Rod Robinson, NPL Daniel Hoyt, HDHHS/BAQC .xls files
QC Check Results
Mike Chase, ARCADIS
Cary Secrest, EPA
Rod Robinson, NPL
Melanie Williams, NPL
Melanie Williams, NPL
Melanie Williams, NPL
.doc/.xls files
After NPL has received the ARCADIS and EPA data for the OP-FTIR and UV-DOAS measurements, respectively, they will incorporate this data with the processed and analyzed NPL data. NPL will submit a Draft Final Project Report of the findings to HDHHS/BAQC. This report will include the results of the study, conclusions, and an assessment of whether or not the DQI goals of the project were attained.
16.1 Data Reduction/Organizational Deliverables
NPL, ARCADIS, and EPA personnel are responsible for all data reduction activities for the DIAL, OP-FTIR and UV-DOAS instruments involved in this project. Data reduction deliverables include:
• Reduction of UV-DIAL and IR-DIAL profile data collected by NPL
• Reduction of OP-FTIR PIC data collected by ARCADIS
• Reduction of UV-DOAS PAC data collected by EPA
• Reduction of meteorological data, including sorting of data, by NPL
• Total site benzene and total hydrocarbon emission fluxes
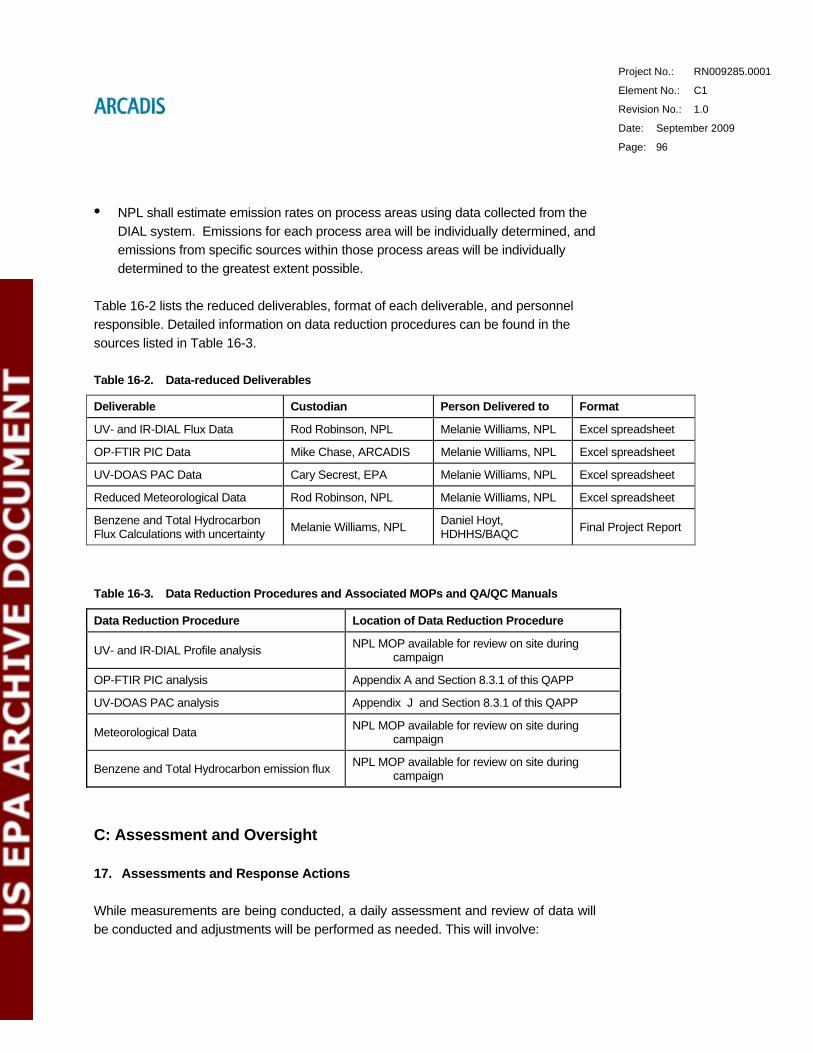
Project No.: RN009285.0001
Element No.: C1
Revision No.: 1.0
Date: September 2009
Page: 96
• NPL shall estimate emission rates on process areas using data collected from the DIAL system. Emissions for each process area will be individually determined, and emissions from specific sources within those process areas will be individually determined to the greatest extent possible.
Table 16-2 lists the reduced deliverables, format of each deliverable, and personnel responsible. Detailed information on data reduction procedures can be found in the sources listed in Table 16-3.
Table 16-2. Data-reduced Deliverables
Deliverable Custodian Person Delivered to Format
UV- and IR-DIAL Flux Data Rod Robinson, NPL Melanie Williams, NPL Excel spreadsheet
OP-FTIR PIC Data Mike Chase, ARCADIS Melanie Williams, NPL Excel spreadsheet
UV-DOAS PAC Data Cary Secrest, EPA Melanie Williams, NPL Excel spreadsheet
Reduced Meteorological Data Rod Robinson, NPL Melanie Williams, NPL Excel spreadsheet
Benzene and Total Hydrocarbon Flux Calculations with uncertainty Melanie Williams, NPL Daniel Hoyt,
HDHHS/BAQC Final Project Report
Table 16-3. Data Reduction Procedures and Associated MOPs and QA/QC Manuals
Data Reduction Procedure Location of Data Reduction Procedure
UV- and IR-DIAL Profile analysis NPL MOP available for review on site during campaign
OP-FTIR PIC analysis Appendix A and Section 8.3.1 of this QAPP
UV-DOAS PAC analysis Appendix J and Section 8.3.1 of this QAPP
Meteorological Data NPL MOP available for review on site during campaign
Benzene and Total Hydrocarbon emission flux NPL MOP available for review on site during campaign
C: Assessment and Oversight
17. Assessments and Response Actions
While measurements are being conducted, a daily assessment and review of data will be conducted and adjustments will be performed as needed. This will involve:

Project No.: RN009285.0001
Element No.: C1
Revision No.: 1.0
Date: September 2009
Page: 97
• selecting and combining meteorological data from the various met instruments to provide the most representative wind data for the DIAL scans
• assessing the DIAL returns and checking for potential issues
• reviewing the relevant system diagnostics for the scans
• re-calculating the concentration maps and emissions fluxes
• taking into account upwind measurements to assess emission flux balance from target sources
• production of graphical displays of data
• combining multiple flux measurements from the DIAL concentration data with meteorological data
• using speciation data when available to improve the VOC mass flux
• using site-provided process data to conduct preliminary data analysis and to modify the following day’s measurement plans, if necessary
• reviewing the OP-FTIR and UV-DOAS real-time concentration data as a general reasonability verification of detections made by DIAL
17.1 Readiness Review
Prior to field deployment, a readiness review will be performed by the NPL DIAL Team Leader, the ARCADIS On-Site Supervisor, and the EPA UV-DOAS Specialist, and will be responsible for any corrective actions. The equipment will be visually inspected, and the sample design will be reviewed to ensure the proper equipment has been gathered. The HDDHS/BAQC Supervising Engineer of NPL Dial PM will contact the host facility (Shell Deer Park) to ensure that the plant is prepared for the test program.
17.2 Audits
An EPA Technical Systems Audit may be conducted and would add value to the project. This audit would be conducted by an EPA Region 6 QA Representative, who would coordinate any audits with the HDHHS/BAQC Supervising Engineer, DIAL Team

Project No.: RN009285.0001
Element No.: C1
Revision No.: 1.0
Date: September 2009
Page: 98
Leader, ARCADIS On-site Project Manager and the EPA UV-DOAS Specialist. This audit has not yet been confirmed by EPA, but should they perform such an audit, EPA will develop an audit plan and checklist. All assessments performed by the EPA QA Representative will be formally reported to the HDHHS/BAQC Supervising Engineer within 30 days of completion of the audit. Findings from the audits will be reported immediately in order for necessary corrective actions to be implemented. In the event of major findings, the EPA QA Representative has the authority to stop work until corrective actions resolve any issues negatively affecting data quality or the ability to achieve data quality objectives. The HDHHS/BAQC Supervising Engineer and the NPL PM and DIAL Team Leader also have the authority to stop work in the event of poor data quality.
In addition to any EPA audits, the final data set will be assessed at NPL by a 'quality circle' before issuing the final report. This involves an independent assessment of the data analysis by a panel review, chaired by an NPL scientist who will not have been involved in the measurements but is familiar with DIAL measurements. During this process, the repeatability of results of the emissions from the same sources will be assessed to determine if the variability is due to the DIAL technique or variations in the emissions.
The ARCADIS QA Officer will perform an internal audit of data quality (ADQ) on the OP-FTIR data delivered to NPL. In the ADQ, at least 10% of all the reported data will be validated by reviewing the project notebook and data files to verify that raw data corresponds with the information delineated in the report to NPL. Results of this ADQ will be documented by the ARCADIS QA Officer in a report to the ARCADIS Project Manager. For the UV -DOAS data, the EPA UV-DOAS Specialist will follow all QA/QC procedures detailed in the project-specific operating procedure (Appendix C) and in the OPSIS QA/QC Manual (Appendix J).
As detailed in Section 11, QC checks are performed on each instrument in the field prior to data collection. Many problems detected during these checks can be corrected in the field. However, the results of some of these QC checks are not known until the results are analyzed after the data collection has occurred. Although most instrumentation QC issue problems encountered can be corrected prior to data collection occurring, any limitations on the quality of collected data will be reported in the Final Project Report submitted to HDHHS/BAQC.
Project No.: RN009285.0001
Element No.: C2
Revision No.: 1.0
Date: September 2009
Page: 99
18. Reports to Management
Effective communication is an integral part of a quality system. Planned publications provide a structure for apprising management of the study’s schedule, the deviations from the approved QAPP, the impact of the deviations, and the potential uncertainties in decisions based on the data.
18.1 Weekly Progress Reports
As this is a long-term project, Weekly Progress Reports will be sent to the HDDHS/BAQC Supervising Engineer and Shell by the NPL DIAL PM, ARCADIS On-site Project Manager, and the EPA UV-DOAS Specialist. The HDDHS/BAQC Supervising Engineer will be informed as soon as possible concerning any issues that could affect data quality and the achievement of project objectives. However, the Weekly Progress Reports will detail these findings and, if required, will be used as the official means of requesting an extension to the sampling campaign to replace identified periods of missing/unacceptable data. Each weekly report will be completed and e-mailed three days following the close of the prior week’s sampling.
18.2 Final Project Report
The Final Project Report will be prepared by NPL in consultation with ARCADIS, the EPA UV-DOAS Specialist, and the EPA and Environ Technical Consultants. Data deliverables for this project are detailed in Section 16. In addition, the comprehensive Draft Final Project Report will be provided within 60 days of completion of the field campaign. Upon receipt of comments from HDHHS/BAQC, the Final Project Report will be provided with two weeks. The Draft Final and Final Project Reports will include the following:
• Overview and description of measurement method
• Description of emission quantification procedures
• Factors influencing detection limits and accuracy
• Emissions estimates for each unit measured
• Meteorological and other data collected pertaining to the DIAL measurement, including, but not limited to:

Project No.: RN009285.0001
Element No.: C2
Revision No.: 1.0
Date: September 2009
Page: 100
• date, time, and duration of measurement
• temperature
• wind velocity and direction
• geographic location (GPS coordinates)
• mapped location of plumes
• other data deemed necessary for estimating emissions
• Descriptions of areas observed
• Areas with high concentration of VOC plumes will be specially noted
• Evaluation of DQI goals
The NPL DlAL is able to provide concentration profiles and mass emission fluxes along defined cross sections (either vertical, horizontal, or at an arbitrary angle). NPL has developed enhanced processing algorithms for determining emission rates from DlAL measurements. These are used in the conversion of the individual DIAL measurements which make up the scan into two-dimensional concentration maps. These take account of the differences in the density of the data along the DlAL line-of-site and in the plane of the scan. In addition, the DlAL software suite includes visualization software to enable the display of the data overlaid on a site plan.

Project No.: RN009285.0001
Element No.: D1
Revision No.: 1.0
Date: September 2009
Page: 101
D: Data Validation and Usability
19. Data Review, Verification, and Validation
The HDHHS/BAQC Supervising Engineer and NPL DIAL PM will be responsible for the data review, verification, and validation activities for this project. An assessment of whether or not DQI goals were met will be performed, and reported in the Final Project Report. Additionally, the EPA QA Representative may perform one or more audits of this project. The results of the audits, as well as any corrective actions taken, will be detailed in the Final Project Report.
Data from this project that are subject to review, verification, and validation include:
• Path length for the OP-FTIR and UV-DOAS.
• Profile data collected with the DIAL, PIC data collected with the OP-FTIR and PAC data collected with the UV-DOAS instruments.
• Wind data collected with NPL meteorological mast.
• Inputs to the benzene and total hydrocarbon flux calculations.
19.1 Validation of Site Information Data
Site configuration data will be generated in the field by taking measurements with the Bushnell rangefinder. These data will be recorded in ink in a bound field notebook, maintained by the ARCADIS On-Site Project Manager (for the OP-FTIR) and by the EPA UV-DOAS Specialist (for the UV-DOAS). The notebooks will include a detailed map of the site which includes landmarks, the location and orientation of the instrumentation, the distance between the instrument and retroreflector or receiver. Extreme care will be exercised to ensure that hand-recorded data is written accurately and legibly. Errors will be corrected by striking through with a single line using black ink then dated and signed by the author.
19.2 Validation of Data
Validation of the profile data collected with the DIAL, PIC data collected with the OP-FTIR and PAC data collected with the UV-DOAS instruments will be based on the results of the pre-deployment and instrument calibrations described in Sections 11 and
Project No.: RN009285.0001
Element No.: D1
Revision No.: 1.0
Date: September 2009
Page: 102
13, respectively. Any issues with the performance of these instruments will be documented in the Weekly Progress Report sent to the HDHHS/BAQC Supervising Engineer, and included in the Final Project Report.
19.3 Validation of Wind Data
A post- field deployment calibration will be conducted to assess the accuracy and precision of the NPL DIAL meteorological heads. This calibration will be performed by the NPL Open Path Calibration Facility. Validation of wind data collected with the NPL DIAL meteorological head will be performed initially at the time of deployment. Upon deployment, the DIAL Team Leader will perform a visual inspection of the wind vanes, and compare the compass heading of the vanes to the data displayed from the instrumentation.
19.4 Validation of DIAL Flux Measurements
Validation of the DIAL Flux Measurements may include:
• Procedures for assessing potential influences on the DIAL concentration measurement such as spectral interference and differential backscatter.
• Validation of the software used to calculate the flux from the DIAL concentration measurements and the wind field.
• Side-by-side comparison measurements of the DIAL with the OP-FTIR and the UV-DOAS instruments.
• Comparison of VOC measurements along a near ground level line of sight against a series of six pumped samplers, and one or two canister samplers. These measurements would be made in a location where DIAL has identified a suitable plume, and would be taken over an approximately 20-minute period.
There have been a number of field comparisons undertaken to validate flux measurements undertaken with the DIAL system. These have included
• Repeated DIAL measurements downwind of a source of a known flux of methane agreed to within +/- 10% of emitted value (10 kg/hour)

Project No.: RN009285.0001
Element No.: D1
Revision No.: 1.0
Date: September 2009
Page: 103
• Comparison with a line of pumped absorption tube samplers inside chemical plant agreed with DIAL measurements of aliphatic hydrocarbons to within +/- 12 percent and toluene to within +/- 15 percent.
• VOC emission measurements from a petro-chemical storage facility made by DIAL and standard point sampling methods agreed to within +/- 8 percent.
These tests mainly highlight uncertainties in the technique used to calculate flux rates which relies on accurate wind profiling.
Data ratification
• The final data set will be assessed in a 'quality circle' before issuing the final report. This involves an independent assessment of the data analysis by a panel review, chaired by an NPL scientist who will not have been involved in the measurements but is familiar with DIAL measurements.
• The repeatability of results of the emissions from the same sources will be assessed, to determine if the variability is due to the DIAL technique or variations in the emissions.
Data Audit Trail
• A data audit trail will be provided to give traceability for all phases of the measurement and analysis process.
• Meta-data are recorded with the data files, and all records relating to the same data (individual DIAL measurement) have the same base file name – derived from the system time and date. Scans (consisting of a sequence of measurements usually over a vertical plane) are uniquely identified with a scan id. Records relating to a scan are also automatically recorded. Meta data include date, time, site name, DIAL measurement location name, GPS readings, DIAL scanner angle. Data stored for each measurement include DIAL return signals, power readings and gas cell readings. Meteorological data are stored separately. The time periods for each DIAL scan are automatically written to a file which is used to process the meteorological data. All data are recorded and stored on back-up external hard drives, and written to network storage drives at NPL as soon as is possible (usually

Project No.: RN009285.0001
Element No.: D1
Revision No.: 1.0
Date: September 2009
Page: 104
over secure internet connection while still in the field). Hardcopy data records are kept of key system parameters during the measurements. An example record sheet is attached.
• Data archiving. Field data are stored for 6 years in accordance with NPL’s data retention procedures.
Project No.: RN009285.0001
Element No.: D2
Revision No.: 1.0
Date: September 2009
Page: 105
20. Verification and Validation Methods
Verification and validation of the procedures used to collect and analyze data are critical to the goals of this project and will be performed after data collection, but prior to performing the flux calculations and uncertainty determinations. Study personnel will be responsible for ensuring that the sampling methods, quality control protocols, and validation methods described in earlier sections of this document are followed and completed. Additionally, an evaluation will be conducted by an independent reviewer by comparing the original study objectives and operation guidance with the actual circumstances encountered in the field. The following subsections provide further detail on these points.
20.1 Sampling Design
The first step in validating the data collected during the project is for the NPL DIAL PM to assess if the project, as executed, meets the sampling design described in Section 7. This validation will be done by referencing data recorded in the field notebooks. Test dates and times will be reviewed to ensure that testing was performed as scheduled with test methods performed sequentially or simultaneously as designed. Test locations, and the methods used for data collection are checked against the project design. The results of this procedure will be documented in the QA section of the Final Project Report.
20.2 Sample Collection Procedures
The NPL DIAL PM will check the actual procedures documented in the project notebooks against the procedures described in Section 8 of this document. Deviations from the QAPP will be communicated to the HDHHS/BAQC Supervising Engineer and classified as acceptable or unacceptable, and critical or non-critical. Any deviations from the QAPP will be documented in the Final Project Report.
20.3 Analytical Methods
The NPL DIAL PM will check that the analytical procedures performed during the test program agree with those referenced in Section 10 of this document. Deviations from the QAPP will be communicated to the HDHHS/BAQC Supervising Engineer and classified as acceptable or unacceptable, and critical and non-critical. Any deviations from the QAPP will be documented in the Final Project Report.

Project No.: RN009285.0001
Element No.: D2
Revision No.: 1.0
Date: September 2009
Page: 106
20.4 Quality Control
The NPL DIAL PM will check the QC procedures performed during the test program against those previously described in Section 11. Omissions will be discussed with the HDHHS/BAQC Supervising Engineer and included in the Final Project Report. All results outside specified parameters will be discussed with HDHHS/BAQC Supervising Engineer for corrective action. In some cases, reference methods have guidance on corrective action.
20.5 Calibration
The NPL DIAL PM will check the documentation of equipment calibration against the values used in data collection. Errors and omissions will be discussed in the Final Project Report. The documentation will be checked to ensure that the calibrations: (1) were performed within an acceptable time prior to, and during the duration of the project; (2) include the proper number of calibration points; (3) were performed using appropriate standards for the reported measurements; and (4) had acceptable checks to ensure that the measurement system was stable when the calibration was performed. Information on instrument calibration can be found in Section 13 of this document.
20.6 Data Reduction and Processing
The post-test data processing will be checked by validating the input files, as discussed in Section 19 of this document. This will be performed by the NPL DIAL PM and will be document in the Final Project Report.

Project No.: RN009285.0001
Element No.: D3
Revision No.: 1.0
Date: September 2009
Page: 107
21. Reconciliation with User Requirements
Upon receipt of emissions data, staff or contractors will perform data review/validation procedures. Staff that conducted the verification of emissions data prepares a written report informing the data users of the failure to meet laboratory QA/QC procedures, the effect on data usability, and whether validated data can support their intended use.
Section 19 describes data validation procedures that will be used to ensure that the data collected meets DQI objectives in order to ensure that the data meets the project goals. The analytical data will be checked for accuracy, precision, detection limit, and completeness. Statistical analyses may also be performed to determine these parameters, as appropriate.
Project No.: RN009285.0001
Element No.: References
Revision No.: 1.0
Date: September 2009
Page: 108
References
Alberta Research Council, Inc. Optical Measurement Technology for Fugitive Emissions from Upstream Oil and Gas Facilities. Carbon and Energy Management, ARC Project No. CEM-P004.03. December 15, 2004. http://www.ptac.org/env/dl/ envp0403.pdf. ASTM Standard Guide for Open-Path Fourier Transform Infrared Monitoring of Gases and Vapors in Air, ASTM E 1865 – 97, 1997. ASTM Standard Practice for Open-Path Fourier Transform Infrared Monitoring of Gases and Vapors in Air, ASTM E 1982 – 98, 1998. City of Houston. A Closer Look at Air Pollution in Houston: Identifying Priority Health Risks. Mayor's Task Force on the Health Effects of Air Pollution, 2006. http://www.greenhoustontx.gov/reports/UTreport.pdf. City of Houston. Houston Regional Benzene Air Pollution Reduction: A Voluntary Plan for Major Sources. Report prepared by the City of Houston, Mayor's Office of Environmental Programming, Department of Health and Human Services, and Bureau of Air Quality Control, February 2007. http://www.greenhoustontx.gov/reports/ benzenereductionplan.pdf. City of Houston. Quality Assurance Project Plan for the Mobile Laboratory Project. City of Houston, Department of Health and Human Services, Bureau of Air Quality Control, Technical Services Section, Houston, Texas. Revision 2. October 2008. Clements, Andrea L., et al. The Control of Air Toxics: Toxicology Motivation and Houston Implications. Funded by The Houston Endowment. Undated. http://www. houstontx.gov/environment/reports/controlofairtoxics.pdf. Forswall, Clayton D., Kathryn E. Higgins. Clean Air Act Implementation in Houston: A Historical Perspective 1970-2005. Report prepared by Rice University, February 2005. http://www.ruf.rice.edu/%7Eeesi/scs/SIP.pdf. Gardiner, T. D.; M. J. T. Milton; R. A. Robinson; P. T. Woods; A. S. Andrews; H. D'Souza; D. Alfonso; N. R. Swann. Measurements of the Emissions to Atmosphere of Volatile Organic Compounds from the Hellenic Aspropyrgos Oil Refinery. NPL Report QM S99, September 1996. Gardiner, T., R. Robinson. NPL DIAL Measurement and QA/QC Overview. National Physical Laboratory, Middlesex, United Kingdom, Version 3, Match 2009. Haaland, D.M., and Easterling, R.G., “Application of New Least-squares Methods for the Quantitative Infrared Analysis of Multicomponent Samples, Applied Spectroscopy 36, 665 – 673, 1982.

Project No.: RN009285.0001
Element No.: References
Revision No.: 1.0
Date: September 2009
Page: 109
Kadlubar, Bernard, M.S. Health Effects Review of Ambient Air Monitoring Data Collected in TCEQ Region 12 during 2005. Texas Commission on Environmental Quality (TCEQ), Toxicology Section, Chief Engineer's Office, December 18, 2006. http://www.tceq.state.tx.us/files/2005Reg12.pdf_4425030.pdf Milton, M. J. T.; P. T. Woods; R. H. Partridge; B. A. Goody. Calibration of DlAL and Open Path Systems Using External Gas Cells. Proc. Europto. Munich 1995.
University of Texas. The Texas Air Quality Study 2000. University of Texas, Center for Energy and Environmental Resources. http://www.utexas.edu/research/ ceer/texaqs/visitors/about.html. Accessed March 18, 2009. U.S. EPA, Compendium Method TO-16: Long-Path Open-Path Fourier Transform Infrared Monitoring of Atmospheric Gases, Center for Environmental Research Information-Office of Research and Development, US EPA, Cincinnati, Ohio, Jan. 1999, EPA/625/R-96/010b. U.S. Environmental Protection Agency. 1999 National-scale Air Toxics Assessment: 1999 Data Tables, Texas State Summary Database. US EPA, 2006a. U.S. Environmental Protection Agency . VOC Fugitive Losses: New Monitors, Emission Losses, and Potential Policy Gaps; 2006 International Workshop. US EPA, October 25-27, 2006b. http://www.epa.gov/ttn/chief/efpac/projects.html. U.S. Environmental Protection Agency . Optical Remote Sensing for Emission Characterization from Non-point Sources. USEPA Other Test Method Protocol, OTM-10, 2006c (see http://www.epa.gov/ttn/emc/prelim.html).
U.S. Environmental Protection Agency. lntegrated Risk Information System, Benzene (CASRN 71-43-2). http://www.epa.gov/NCEA/iris/subst/0276.htm. Accessed March 18, 2009.
Project No.: RN009285.0001
Element No.: Appendix A
Revision No.: 1.0
Date: September 2009
Appendix A
Procedure to Convert OP-FTIR Volume Concentration Determinations of Alkane Mixture that Originate from Petroleum-Based Fuels
to Mass Concentrations

Project No.: RN009285.0001
Element No.: Appendix B
Revision No.: 1.0
Date: September 2009
Appendix B
Facility-Specific Process Data Forms
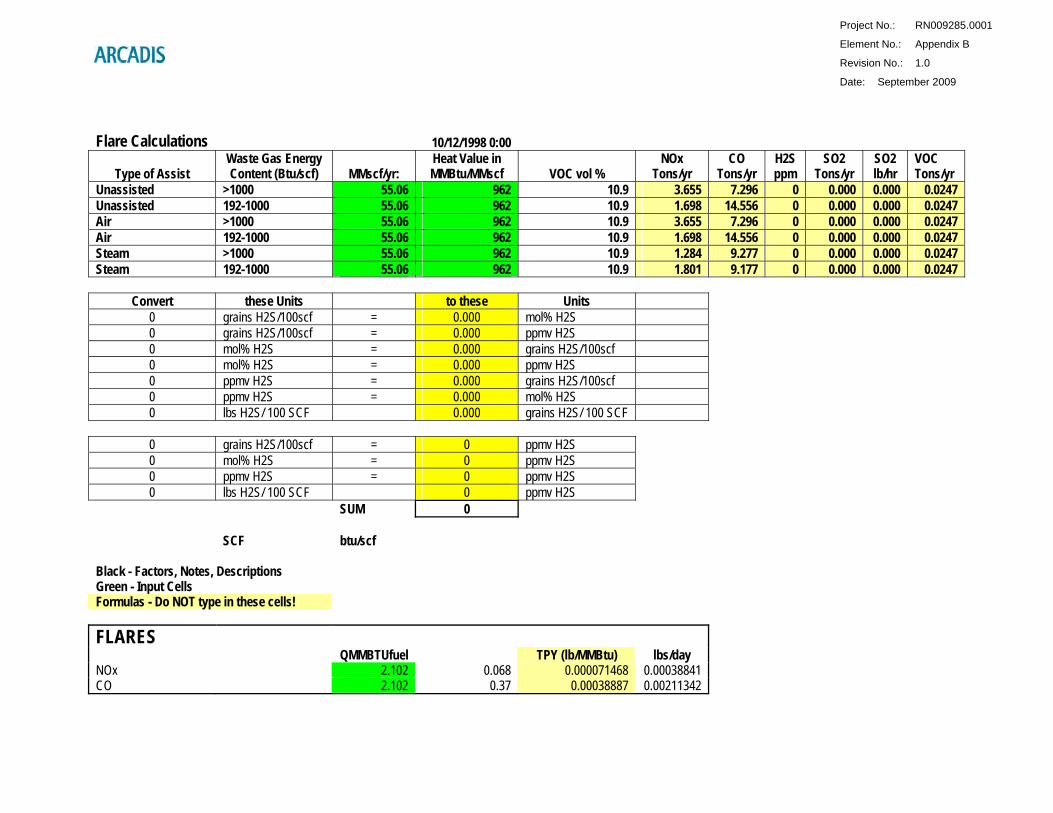
Project No.: RN009285.0001
Element No.: Appendix B
Revision No.: 1.0
Date: September 2009
Flare Calculations 10/12/1998 0:00
Type of Assist Waste Gas Energy Content (Btu/scf) MMscf/yr:
Heat Value in MMBtu/MMscf VOC vol %
NOx Tons/yr
CO Tons/yr
H2S ppm
SO2 Tons/yr
SO2 lb/hr
VOC Tons/yr
Unassisted >1000 55.06 962 10.9 3.655 7.296 0 0.000 0.000 0.0247 Unassisted 192-1000 55.06 962 10.9 1.698 14.556 0 0.000 0.000 0.0247 Air >1000 55.06 962 10.9 3.655 7.296 0 0.000 0.000 0.0247 Air 192-1000 55.06 962 10.9 1.698 14.556 0 0.000 0.000 0.0247 Steam >1000 55.06 962 10.9 1.284 9.277 0 0.000 0.000 0.0247 Steam 192-1000 55.06 962 10.9 1.801 9.177 0 0.000 0.000 0.0247
Convert these Units to these Units 0 grains H2S/100scf = 0.000 mol% H2S 0 grains H2S/100scf = 0.000 ppmv H2S 0 mol% H2S = 0.000 grains H2S/100scf 0 mol% H2S = 0.000 ppmv H2S 0 ppmv H2S = 0.000 grains H2S/100scf 0 ppmv H2S = 0.000 mol% H2S 0 lbs H2S/ 100 SCF 0.000 grains H2S/ 100 SCF 0 grains H2S/100scf = 0 ppmv H2S 0 mol% H2S = 0 ppmv H2S 0 ppmv H2S = 0 ppmv H2S 0 lbs H2S/ 100 SCF 0 ppmv H2S
SUM 0 SCF btu/scf Black - Factors, Notes, Descriptions Green - Input Cells Formulas - Do NOT type in these cells! FLARES QMMBTUfuel TPY (lb/MMBtu) lbs/day NOx 2.102 0.068 0.000071468 0.00038841 CO 2.102 0.37 0.00038887 0.00211342
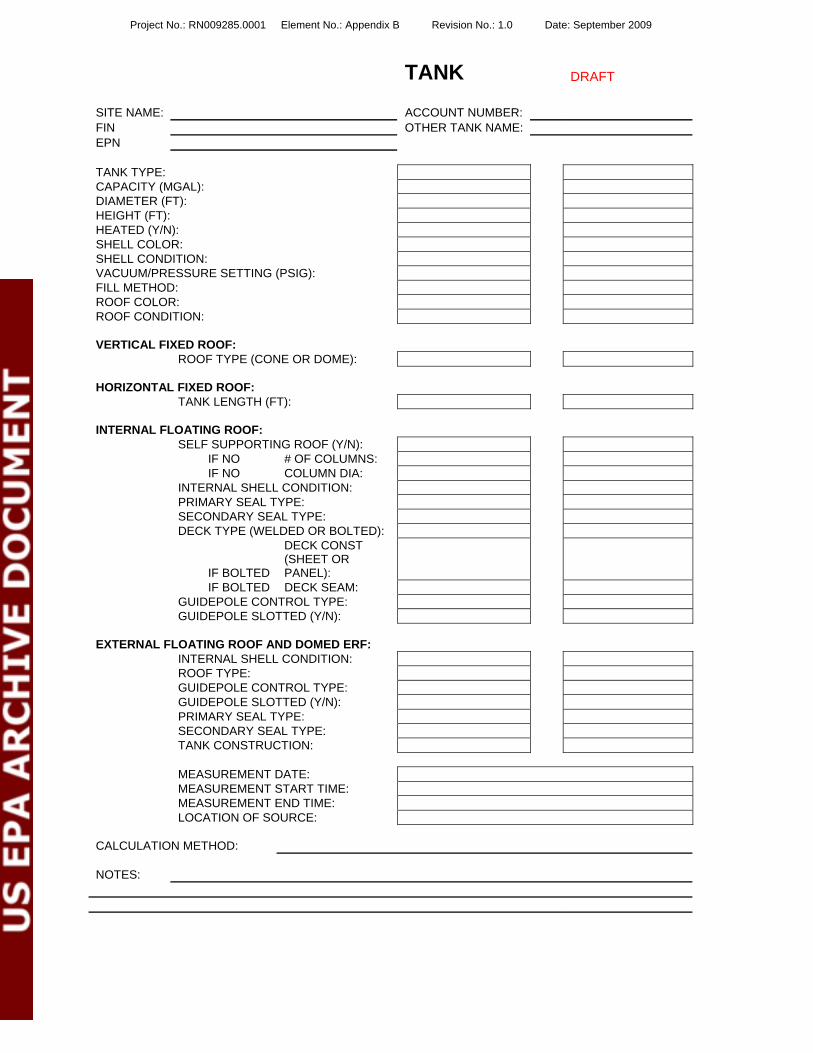
Project No.: RN009285.0001 Element No.: Appendix B Revision No.: 1.0 Date: September 2009
TANK DRAFT
SITE NAME: ACCOUNT NUMBER: FIN OTHER TANK NAME: EPN TANK TYPE: CAPACITY (MGAL): DIAMETER (FT): HEIGHT (FT): HEATED (Y/N): SHELL COLOR: SHELL CONDITION: VACUUM/PRESSURE SETTING (PSIG): FILL METHOD: ROOF COLOR: ROOF CONDITION: VERTICAL FIXED ROOF: ROOF TYPE (CONE OR DOME): HORIZONTAL FIXED ROOF: TANK LENGTH (FT): INTERNAL FLOATING ROOF: SELF SUPPORTING ROOF (Y/N): IF NO # OF COLUMNS: IF NO COLUMN DIA: INTERNAL SHELL CONDITION: PRIMARY SEAL TYPE: SECONDARY SEAL TYPE: DECK TYPE (WELDED OR BOLTED):
DECK CONST (SHEET OR PANEL): IF BOLTED
IF BOLTED DECK SEAM: GUIDEPOLE CONTROL TYPE: GUIDEPOLE SLOTTED (Y/N): EXTERNAL FLOATING ROOF AND DOMED ERF: INTERNAL SHELL CONDITION: ROOF TYPE: GUIDEPOLE CONTROL TYPE: GUIDEPOLE SLOTTED (Y/N): PRIMARY SEAL TYPE: SECONDARY SEAL TYPE: TANK CONSTRUCTION: MEASUREMENT DATE: MEASUREMENT START TIME: MEASUREMENT END TIME: LOCATION OF SOURCE: CALCULATION METHOD: NOTES:

Project No.: RN009285.0001 Element No.: Appendix B Revision No.: 1.0 Date: September 2009
TANK OPERATIONS AT TIME OF DIAL MEASUREMENTS DRAFT
PAGE ____ OF ____
SITE NAME: ______________________________ DATE: ____________________ FIN: _____________________________________ EPN: _____________________ ****Please note units if not consistent with ones listed
MILITARY TIME: CONTENT CHEMICAL: CAS NUMBER: VAPOR PRESSURE (PSIA): INLET LIQUID TEMP: IN TANK LIQUID TEMP: TANK SHELL TEMP: TANK OPERATION: LANDED (Y/N): # OF TURNOVERS TANK LEVEL (BARRELS): TANK LEVEL DELTA (BARRELS): LOADING RATE (BARREL/HR): UNLOADING RATE (BARREL/HR): WEATHER: VOC EST EMISSIONS HAWK OBSERVATIONS:
NOTES:
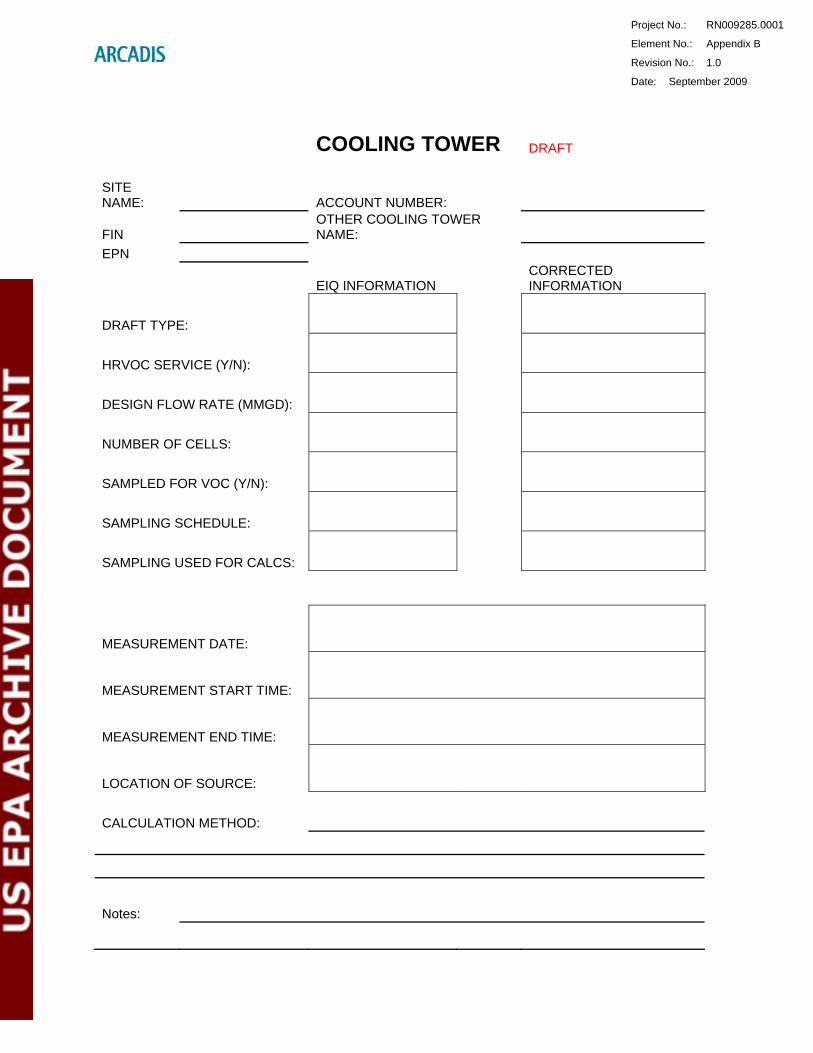
Project No.: RN009285.0001
Element No.: Appendix B
Revision No.: 1.0
Date: September 2009
COOLING TOWER DRAFT
SITE NAME: ACCOUNT NUMBER:
FIN OTHER COOLING TOWER NAME:
EPN
EIQ INFORMATION CORRECTED INFORMATION
DRAFT TYPE:
HRVOC SERVICE (Y/N):
DESIGN FLOW RATE (MMGD):
NUMBER OF CELLS:
SAMPLED FOR VOC (Y/N):
SAMPLING SCHEDULE:
SAMPLING USED FOR CALCS:
MEASUREMENT DATE:
MEASUREMENT START TIME:
MEASUREMENT END TIME:
LOCATION OF SOURCE: CALCULATION METHOD:
Notes:
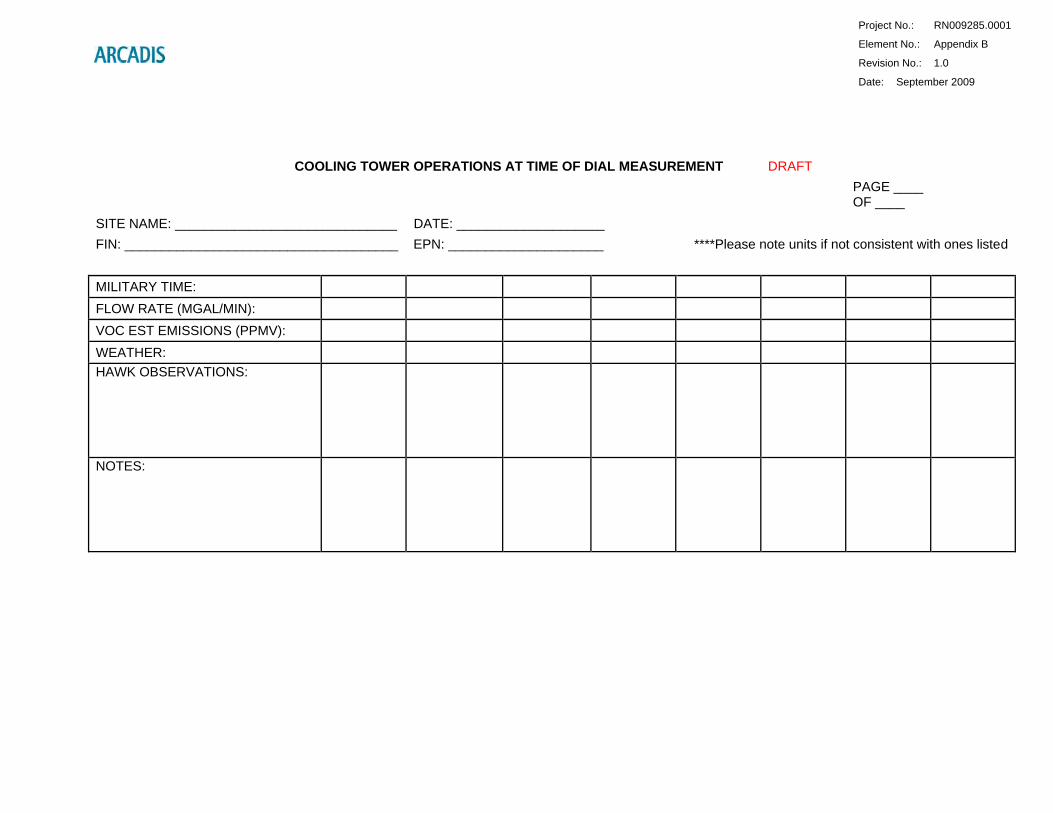
Project No.: RN009285.0001
Element No.: Appendix B
Revision No.: 1.0
Date: September 2009
COOLING TOWER OPERATIONS AT TIME OF DIAL MEASUREMENT DRAFT
PAGE ____ OF ____
SITE NAME: ______________________________ DATE: ____________________ FIN: _____________________________________ EPN: _____________________ ****Please note units if not consistent with ones listed
MILITARY TIME: FLOW RATE (MGAL/MIN): VOC EST EMISSIONS (PPMV): WEATHER: HAWK OBSERVATIONS:
NOTES:

Project No.: RN009285
Element No.: Appendix B
Revision No.: 1.0
Date: September 2009
.0001
El Paso Method Calculation
CT flow MW P b,
stripping air c, conc in R, gas law constant
T, stripping chamber
a, sample water
CONC, air strippable
E, lb VOC/MMgal
E, lb/hr
GPM g/mol atm ml/min stripping air, ppmv ml-atm/mol-K Kelvin, 0C+274 ml/min compounds in
water, ppmw HOUR 1 0 16.042 1 2500 0 82.054 312 125 0.00 0.00 0.00 HOUR 2 0 16.042 1 2500 0 82.054 312 125 0.00 0.00 0.00 HOUR 3 0 16.042 1 2500 0 82.054 312 125 0.00 0.00 0.00 HOUR 4 0 16.042 1 2500 0 82.054 312 125 0.00 0.00 0.00 HOUR 5 0 16.042 1 2500 0 82.054 312 125 0.00 0.00 0.00 HOUR 6 0 16.042 1 2500 0 82.054 312 125 0.00 0.00 0.00 HOUR 7 0 16.042 1 2500 0 82.054 312 125 0.00 0.00 0.00 HOUR 8 0 16.042 1 2500 0 82.054 312 125 0.00 0.00 0.00
AVG 0 16.042 1 2500 0.00 82.054 312 125 0.00 0.00 0.00
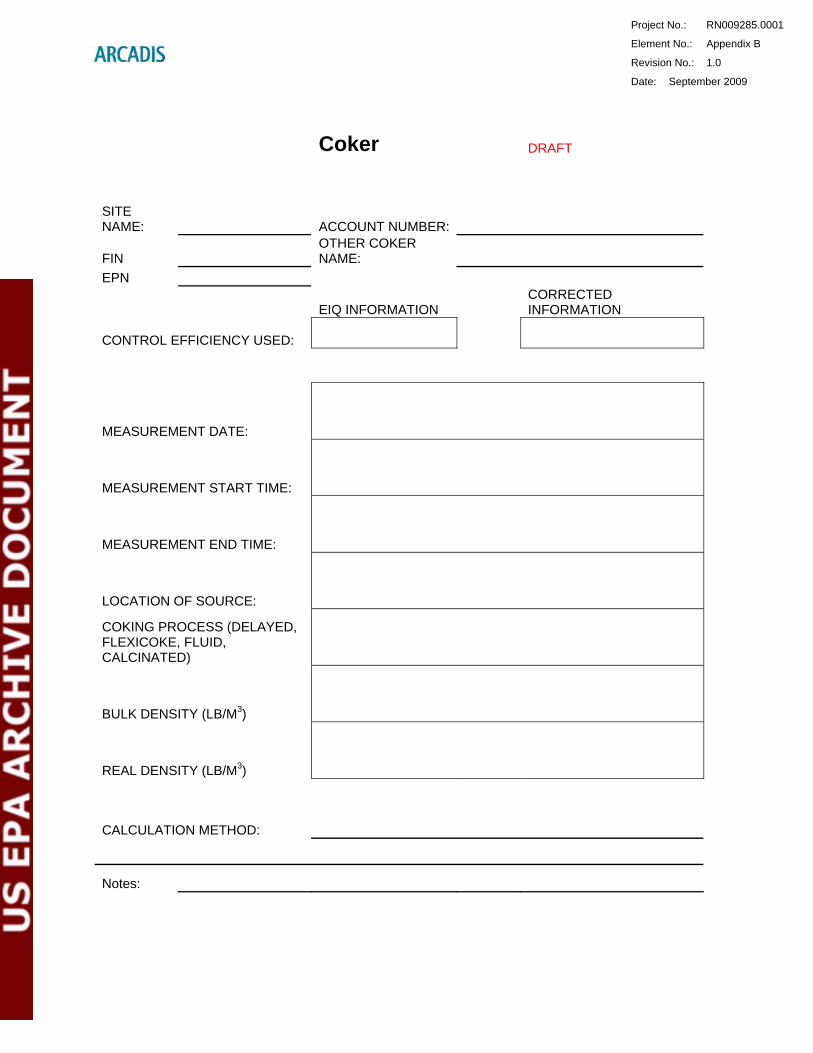
Project No.: RN009285
Element No.: Appendix B
Revision No.: 1.0
Date: September
Coker DRAFT
SITE NAME: ACCOUNT NUMBER:
FIN OTHER COKER NAME:
EPN
EIQ INFORMATION CORRECTED INFORMATION
CONTROL EFFICIENCY USED:
MEASUREMENT DATE:
MEASUREMENT START TIME:
MEASUREMENT END TIME:
LOCATION OF SOURCE:
COKING PROCESS (DELAYED, FLEXICOKE, FLUID, CALCINATED)
BULK DENSITY (LB/M3)
REAL DENSITY (LB/M3)
CALCULATION METHOD:
Notes:
.0001
2009
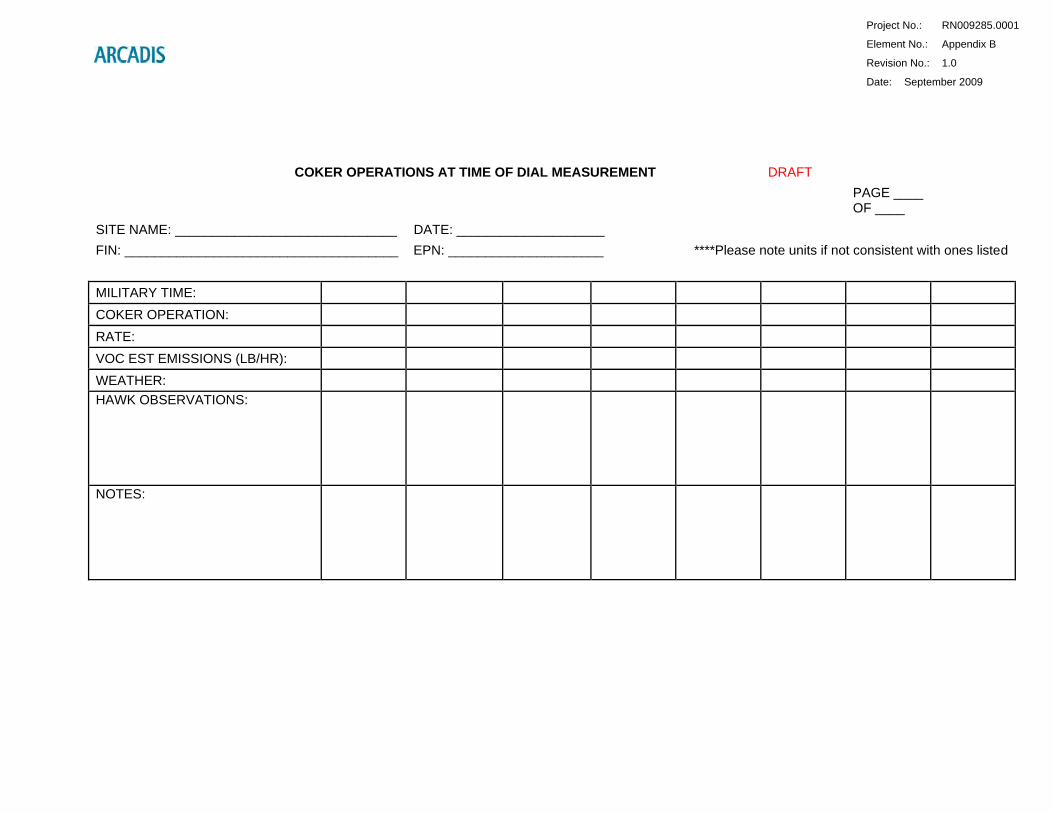
Project No.: RN009285.0001
Element No.: Appendix B
Revision No.: 1.0
Date: September 2009
COKER OPERATIONS AT TIME OF DIAL MEASUREMENT DRAFT
PAGE ____ OF ____
SITE NAME: ______________________________ DATE: ____________________ FIN: _____________________________________ EPN: _____________________ ****Please note units if not consistent with ones listed
MILITARY TIME: COKER OPERATION: RATE: VOC EST EMISSIONS (LB/HR): WEATHER: HAWK OBSERVATIONS:
NOTES:

Project No.: RN009285
Element No.: Appendix B
Revision No.: 1.0
Date: September
Wastewater DRAFT
SITE NAME:
ACCOUNT NUMBER:
FIN OTHER WASTEWATER NAME: EPN CIN
EIQ INFORMATION CORRECTED INFORMATION
CONTROL EFFICIENCY USED:
MEASUREMENT DATE:
MEASUREMENT START TIME:
MEASUREMENT END TIME:
LOCATION OF SOURCE:
TYPE OF UNIT:
VOLUME (FT3):
DIMENSIONS (FT):
AERATED (Y/N):
BIOLOGICAL PROCESS (Y/N):
CALCULATION METHOD:
.0001
2009
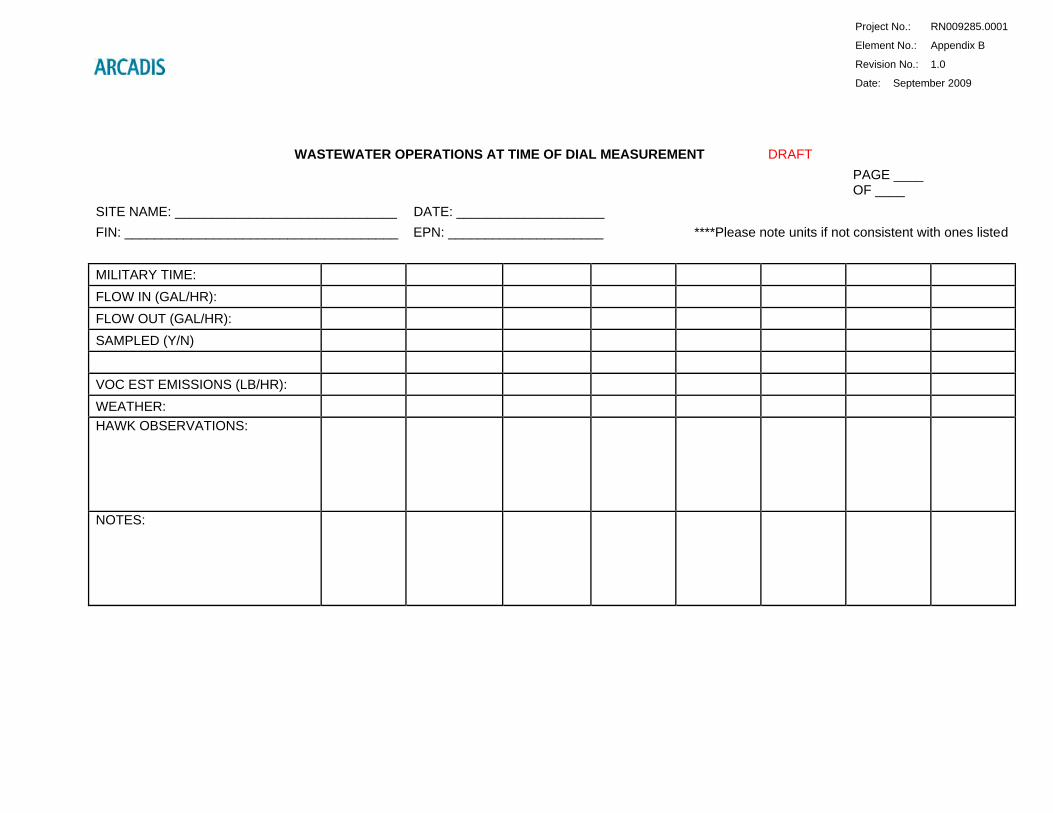
Project No.: RN009285.0001
Element No.: Appendix B
Revision No.: 1.0
Date: September 2009
WASTEWATER OPERATIONS AT TIME OF DIAL MEASUREMENT DRAFT
PAGE ____ OF ____
SITE NAME: ______________________________ DATE: ____________________ FIN: _____________________________________ EPN: _____________________ ****Please note units if not consistent with ones listed
MILITARY TIME: FLOW IN (GAL/HR): FLOW OUT (GAL/HR): SAMPLED (Y/N) VOC EST EMISSIONS (LB/HR): WEATHER: HAWK OBSERVATIONS:
NOTES:

Project No.: RN009285.0001
Element No.: Appendix C
Revision No.: 1.0
Date: September 2009
Appendix C
Project Specific Operating Procedure for OPSIS UV-DOAS Calibration
and QC Checks for Benzene

Project No.: RN009285
Element No.: Appendix D
Revision No.: 1.0
Date: September 2009
DIAL Measurement Record Sheets and Wind Sensors Calibration Procedures
Appendix D
.0001

Project No.: RN009285.0001
Element No.: Appendix D
Revision No.: 1.0
Date: September 2009
DIAL Measurement Record Sheet Species
Date User Sheet of Heading-
Location GPS Coordinates
Scan ID Azimuth Elevation Steps Shots Wind Speed
Recorded wind
direction Actual wind
direction Abs
On/OffStartEnd Time
Atten Details
Start End Start End ( m/s ) ( degrees) (degrees) dB

DIAL CHECKLISTS
01 Checklist for equipment stored in DIAL van
02 Consumables for Measurement Campaign
03 Packing/Installation of Equipment Not Stored in DIAL Van
04 Preliminary Site Visit
05 Preparation for Travelling
06 Initial Tasks during Measurement Campaign
07A Tasks at Start of Day during Measurement Campaign
07B Tasks during Day on Measurement Campaign
07C Tasks at End of Day during Measurement Campaign
08 Tasks upon Return from Measurement Campaign
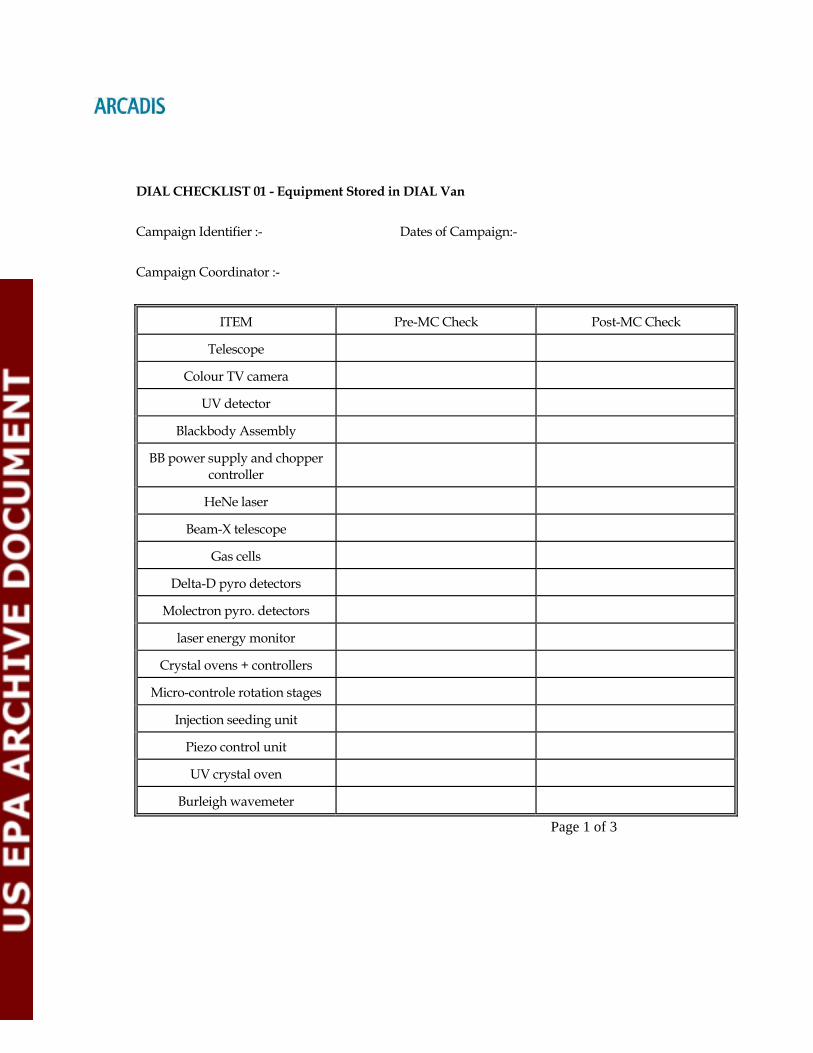
DIAL CHECKLIST 01 - Equipment Stored in DIAL Van
Campaign Identifier :- Dates of Campaign:-
Campaign Coordinator :-
ITEM Pre-MC Check Post-MC Check
Telescope
Colour TV camera
UV detector
Blackbody Assembly
BB power supply and chopper controller
HeNe laser
Beam-X telescope
Gas cells
Delta-D pyro detectors
Molectron pyro. detectors
laser energy monitor
Crystal ovens + controllers
Micro-controle rotation stages
Injection seeding unit
Piezo control unit
UV crystal oven
Burleigh wavemeter
Page 1 of 3

DIAL CHECKLIST 01 - Equipment Stored in DIAL Van (cont.)
Campaign Identifier :- Dates of Campaign:-
Campaign Coordinator :-
ITEM Pre-MC Check Post-MC Check
Dye laser control computer
Trigger generator
Trigger distribution unit
Beam Profile Monitor
Crystal Tracker Units
Spare optics
Optical Filters (IR and UV)
Nd-YAG lasers
Dye laser
Dye pump
Gas regulators
IR cards
Spanner set
Allen key sets
(Metric + Imperial)
Laser safety goggles
Multimeter(s)
Function generator
Dataloggers
Spare flashlamps
Page 2 of 3

DIAL CHECKLIST 01 - Equipment Stored in DIAL Van (cont.)
Campaign Identifier :- Dates of Campaign:-
Campaign Coordinator :-
ITEM Pre-MC Check Post-MC Check
Acquisition PC
Analysis PC
Met Data PC
Main air con system
Secondary air con units
Diesel generator
Fire alarm system
DIAL met. equipment
Trigger conditioning unit
Licel acquisition unit
orig acquisition system
GPS
5L dewar
Time-lapse video
Fuse kit
Adhesive kit
Ladders / steps
Safety kit / PPE
Spreader plates
Exhaust extension
External power cables
Accepted by Campaign Coordinator - Signature :-
Date :- Page 3 of 3

DIAL CHECKLIST 02 - Consumables for Measurement Campaign
Campaign Identifier :- Dates of Campaign:-
Campaign Coordinator :-
ITEM Pre-MC Check Post-MC Check
batteries
laser dyes
paper
pens
burn paper
tissue paper
kitchen roll
methanol
de-mineralised water
disposable gloves
site/area maps
scan summary sheets
Accepted by Campaign Coordinator - Signature :
Date :-

DIAL CHECKLIST 03 - Packing/Installation of Equipment Not Stored in DIAL Van
Campaign Identifier :- Dates of Campaign:-
Campaign Coordinator :-
Additional Item Requirement Pre-MC Check End of MC Check
Oscilloscopes
Point Monitors
Detectors
Amplifiers
Reference Gases
Ambient Air Sample Cylinders
Meteorological sensors Met. loggers
Met mast
Dewar +
lq. nitrogen
External hard-drive
Accepted by Campaign Coordinator - Signature :-
Date :-

DIAL CHECKLIST 04 - Preliminary Site Visit
Campaign Identifier :- Visit Conducted by :-
Campaign Coordinator :- Date of Visit :-
Check access to site for DIAL vehicle
Ensure site operators and safety personnel are aware of :-
- the size of the vehicle [4.25 m high, 12m long + cab, 4m wide]
- the number of NPL staff involved
- a general overview of the measurement techniques
- the use of the diesel generator (running continuously)
- " battery operated met. equipment
- " support vehicle
- " met. mast(s)
- " eye-safe laser radiation
Check availability of :-
- lockable dry storage space
- secure overnight parking
- backup mains supply (One 60 amp 3 phase supply required)
- diesel supply
- liquid nitrogen
- local process information
- local meteorological information
- liason staff
Page 1 of 2

DIAL CHECKLIST 04 - Preliminary Site Visit (continued)
Check requirements for :-
- local safety regulations (inc. training/induction courses)
- local security arrangements
Identify suitable measurement locations
Identify suitable/unsuitable dates for campaign to take place
Accepted by Campaign Coordinator - Signature :
Date :-
Page 2 of 2

DIAL CHECKLIST 05 - Preparation for Travelling
Campaign Identifier :- Dates of Campaign :-
Campaign Coordinator :- Date of Travel :-
Consumables list complete
Packing list complete
Shipping documentation checked
Infrared detector, pre-amp and matching amp removed from telescope
All items on optical table secured and covered
Internal cupboards and drawers locked
External lockers and doors locked
Cover placed over telescope exit
Delicate equipment taken off shelves
All electrical equipment turned off (except air conditioning and crystal ovens) BEFORE switching to generator power
Fuel level in generator checked and battery charged
Mains supply switched off (in stack sim) and generator running
Tractor unit connected up, (4 x) support legs raised
DIAL van lights checked
Number plate securely fixed on DIAL van
Tractor unit's high pressure air supply connected
Staff at destination aware of DIAL van's ETA
Accepted by Campaign Coordinator - Signature :
Date :-
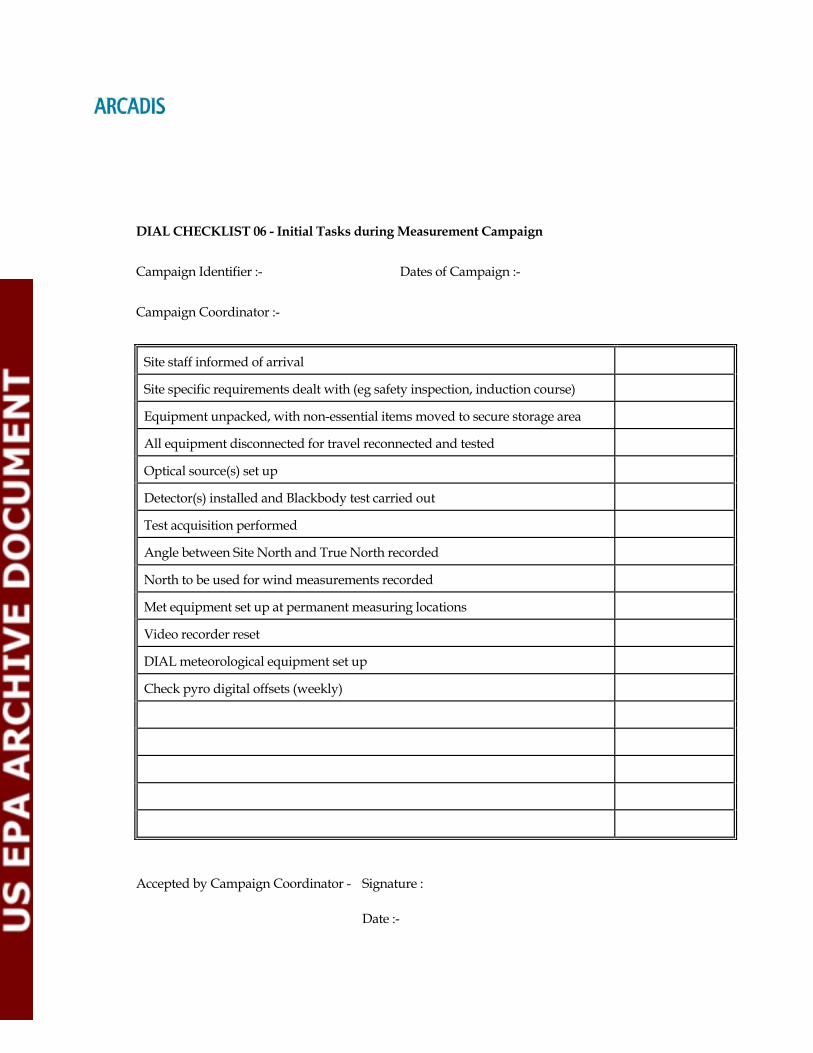
DIAL CHECKLIST 06 - Initial Tasks during Measurement Campaign
Campaign Identifier :- Dates of Campaign :-
Campaign Coordinator :-
Site staff informed of arrival
Site specific requirements dealt with (eg safety inspection, induction course)
Equipment unpacked, with non-essential items moved to secure storage area
All equipment disconnected for travel reconnected and tested
Optical source(s) set up
Detector(s) installed and Blackbody test carried out
Test acquisition performed
Angle between Site North and True North recorded
North to be used for wind measurements recorded
Met equipment set up at permanent measuring locations
Video recorder reset
DIAL meteorological equipment set up
Check pyro digital offsets (weekly)
Accepted by Campaign Coordinator - Signature :
Date :-

DIAL CHECKLIST 07A - Tasks at Start of Day during Measurement Campaign
Campaign Identifier: - Date:-
Campaign Coordinator:-
Infrared detector filled with lq. nitrogen and switched on
Generator fuel level checked
Optical source set up
Acquisition system set up (SW Version - )
Starting Scan ID
Time-lapse video recorder started
Logging of DIAL met. data started
Logging of external met. data started
Accepted by Campaign Coordinator - Signature :
Date :-

DIAL CHECKLIST 07B - Tasks during Day on Measurement Campaign
Campaign Identifier: - Date:-
Campaign Coordinator:-
Calibration cell check (1), time :
Calibration cell check (2), time :
Calibration cell check (3), time :
Infrared detector refilled with lq. nitrogen
Measurement locations and lines-of-sight recorded on site map
Met. locations recorded on site map
Ambient air sample times and locations recorded
Accepted by Campaign Coordinator - Signature :
Date :-
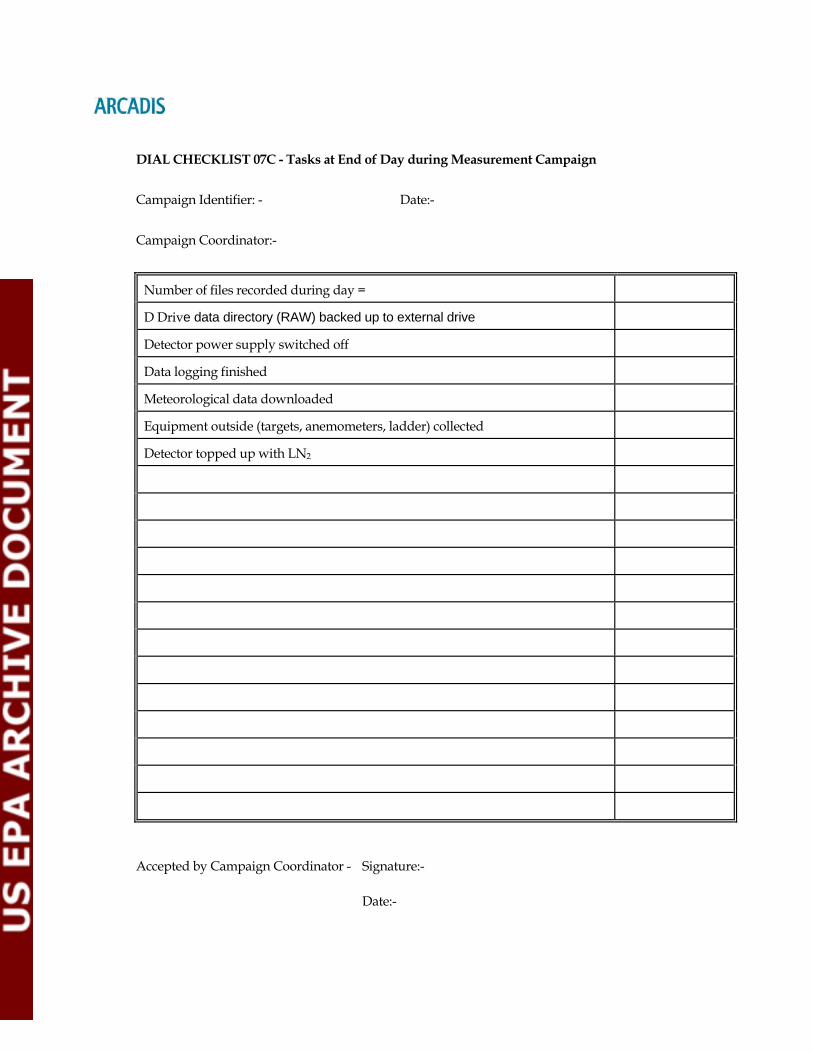
DIAL CHECKLIST 07C - Tasks at End of Day during Measurement Campaign
Campaign Identifier: - Date:-
Campaign Coordinator:-
Number of files recorded during day =
D Drive data directory (RAW) backed up to external drive
Detector power supply switched off
Data logging finished
Meteorological data downloaded
Equipment outside (targets, anemometers, ladder) collected
Detector topped up with LN2
Accepted by Campaign Coordinator - Signature:-
Date:-

DIAL CHECKLIST 08 - Tasks Upon Return from Measurement Campaign
Campaign Identifier: - Dates of Campaign:-
Campaign Coordinator:-
All equipment returned to its normal location
Consumables list checked - used items replaced
Back-up copies of data stored in separate locations
Optics checked - and re-coated if necessary
Equipment (particularly met.) checked for damage
Accepted by Campaign Coordinator - Signature:
Date:-
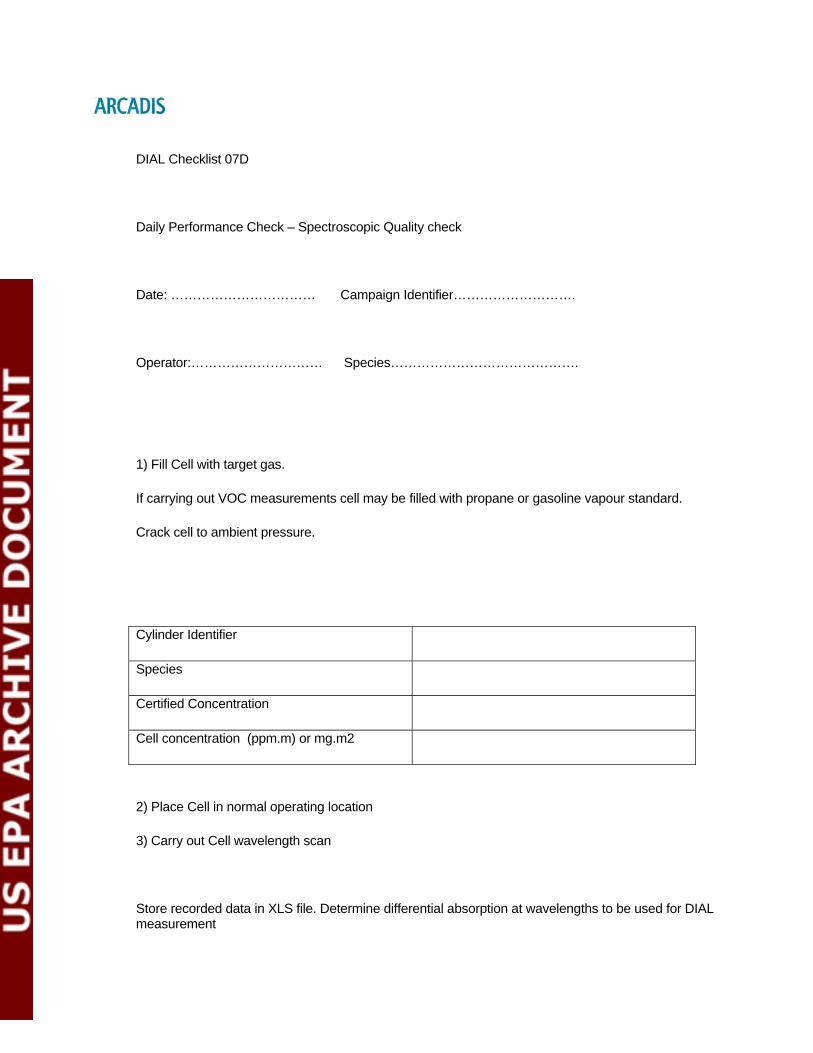
DIAL Checklist 07D
Daily Performance Check – Spectroscopic Quality check
Date: …………………………… Campaign Identifier……………………….
Operator:………………………… Species…………………………………….
1) Fill Cell with target gas.
If carrying out VOC measurements cell may be filled with propane or gasoline vapour standard.
Crack cell to ambient pressure.
Cylinder Identifier
Species
Certified Concentration
Cell concentration (ppm.m) or mg.m2
2) Place Cell in normal operating location
3) Carry out Cell wavelength scan
Store recorded data in XLS file. Determine differential absorption at wavelengths to be used for DIAL measurement

Cell wavelength Scan filenename
Time
Lambda On
Lambda Off
Cell Value
Cell Value
Recorded Differential absorption
4) Carry out test DIAL measurement
Pyro Ratio
Expected pyro ratio
Difference (%)
If difference is < 10%
Calculate allowable pyro ration drift (corresponding to a 20% change in cell absorption) and enter in daily record sheets.

The following procedure is to be carried out 3 times during the day (under normal operating conditions.)
1st CELL check
Place Cell in output beam
Carry out DIAL measurement – at least 3 scans
Determine offset in column as displayed in acquisition software for last scan
Measured offset (ppm.m)
Expected offset from cell measurements
Difference (%)
If difference is < 20% then DQI is met. Check…………….
2nd CELL check
Carry out DIAL measurement – at least 3 scans
Determine offset in column as displayed in acquisition software for last scan
Measured offset (ppm.m)
Expected offset from cell measurements
Difference (%)
If difference is < 20% then DQI is met. Check…………….

3rd CELL check
Carry out DIAL measurement – at least 3 scans
Determine offset in column as displayed in acquisition software for last scan
Measured offset (ppm.m)
Expected offset from cell measurements
Difference (%)
If difference is < 20% then DQI is met. Check………………
Signed ……………………………….
Date………………………………….
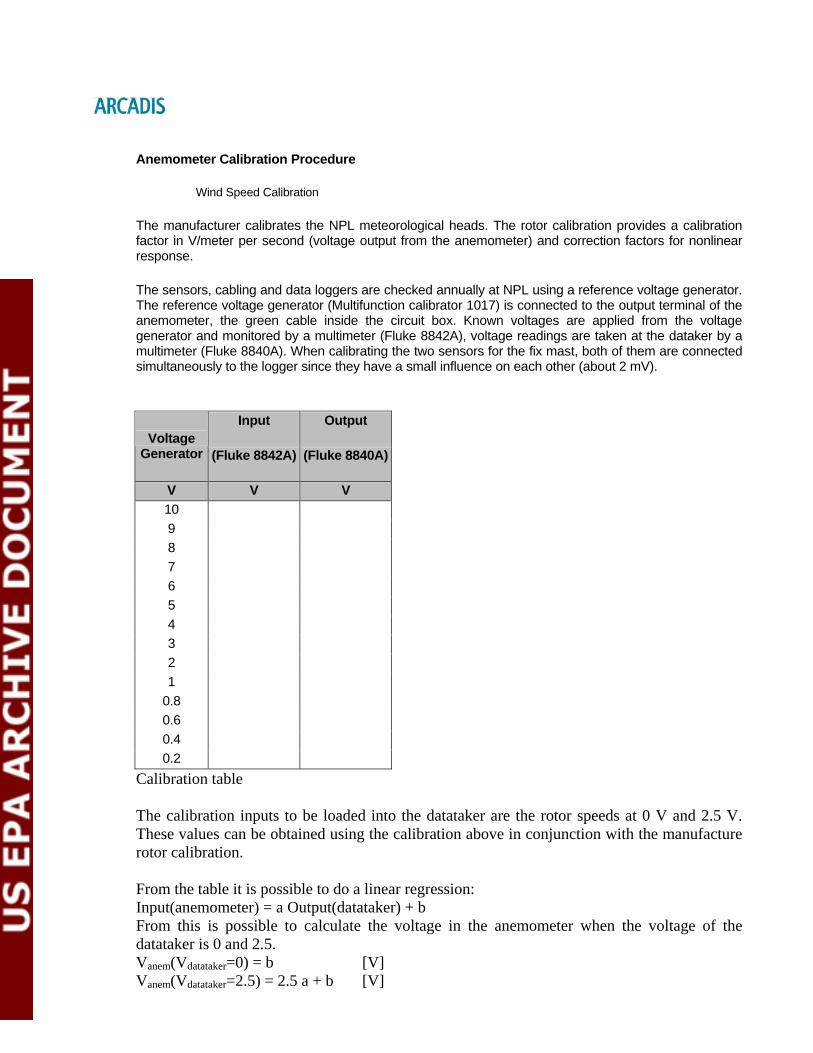
Anemometer Calibration Procedure
Wind Speed Calibration
The manufacturer calibrates the NPL meteorological heads. The rotor calibration provides a calibration factor in V/meter per second (voltage output from the anemometer) and correction factors for nonlinear response.
The sensors, cabling and data loggers are checked annually at NPL using a reference voltage generator. The reference voltage generator (Multifunction calibrator 1017) is connected to the output terminal of the anemometer, the green cable inside the circuit box. Known voltages are applied from the voltage generator and monitored by a multimeter (Fluke 8842A), voltage readings are taken at the dataker by a multimeter (Fluke 8840A). When calibrating the two sensors for the fix mast, both of them are connected simultaneously to the logger since they have a small influence on each other (about 2 mV).
Input Output
Voltage Generator (Fluke 8842A) (Fluke 8840A)
V V V 10 9 8 7 6 5 4 3 2 1
0.8 0.6 0.4 0.2
Calibration table The calibration inputs to be loaded into the datataker are the rotor speeds at 0 V and 2.5 V. These values can be obtained using the calibration above in conjunction with the manufacture rotor calibration. From the table it is possible to do a linear regression: Input(anemometer) = a Output(datataker) + b From this is possible to calculate the voltage in the anemometer when the voltage of the datataker is 0 and 2.5. Vanem(Vdatataker=0) = b [V] Vanem(Vdatataker=2.5) = 2.5 a + b [V]

These voltages can be divided by the rotor calibration factor cf [V/meter second] to obtain the speed when the datataker voltages are 0 and 2.5. Speed(Vdatataker=0) = b/cf [m/s] Speed (Vdatataker=2.5) = (2.5 a + b)/cf [m/s]
Wind Direction Calibration
The windvane incorporates a precision wire-wound potentiometer as shaft angle transducer, enabling wind direction to be accurately determined. The minimum voltage output at 2.5° and the maximum voltage output at 357.5° are read from a high precision multimeter (Fluke 8842A). From these two values is possible to calculate the parameters “a” and “b” of the equation Angle= a Vdatataker + b.
The calibration input to be loaded into the datataker are the rotor angles in radians at 0 V and 2.5 V.
Angle(Vdatataker=0) = b*π/180
Angle(Vdatataker=2.5) = (2.5 a + b)*π/180
In addition, the different sensors are compared side-by-side in the field to provide a further check on their correct function upon arrival at a measurement site.

Project No.: RN009285.0001
Element No.: Appendix E
Revision No.: 1.0
Date: September 2009
Appendix E
MOP 6812: Single-Path Data Collection Using the RAM2000 Monostatic OP-FTIR

Project No.: RN009285.0001
Element No.: Appendix F
Revision No.: 1.0
Date: September 2009
Appendix F
MOP-6803 (Guidance for Deploying and Using ORS Supplemental Equipment) and
MOP-6822 (Determining the Geographical Locations of the ORS Measurement Locations)

Project No.: RN009285.0001
Element No.: Appendix G
Revision No.: 1.0
Date: September 2009
Appendix G
MOP 6827: Procedures for OP-FTIR Concentration Data Analysis Using IMACC FTIR
SOFTWARE SUITE
Project No.: RN009285.0001
Element No.: Appendix H
Revision No.: 1.0
Date: September 2009
Appendix H
OPSIS Emitter / Receiver ER 150 User’s Manual

Project No.: RN009285.0001
Element No.: Appendix I
Revision No.: 1.0
Date: September 2009
Appendix I
OPSIS Opto-Analyser AR 500 for Air Quality Monitoring Hardware Operating Manual
Project No.: RN009285.0001
Element No.: Appendix J
Revision No.: 1.0
Date: September 2009
Appendix J
OPSIS Quality Assurance and Quality Control using Opsis Analysers for Air Quality Monitoring, Version 1.4

Project No.: RN009285.0001
Element No.: Appendix K
Revision No.: 1.0
Date: September 2009
Appendix K
MOP-6802: Pre-Deployment and QC Checks for ORS Facility Instrumentation

Project No.: RN009285.0001
Element No.: Appendix L
Revision No.: 1.0
Date: September 2009
Appendix L
MOP-6823: QC Checks of ORS Instrument Performance during Data Collection