Images Similarity by Relative Dynamic Programming
37
Images Similarity by Relative Dynamic Programming M. Sc. thesis by Ady Ecker Supervisor: prof. Shimon Ullman
-
Upload
caldwell-flores -
Category
Documents
-
view
31 -
download
0
description
Images Similarity by Relative Dynamic Programming. M. Sc. thesis by Ady Ecker Supervisor: prof. Shimon Ullman. Overview. The similarity problem The Method: Overlapping patches Combining evidences Relative dynamic programming Analysis. Part 1: The Problem. Old problem. Important. - PowerPoint PPT Presentation
Transcript of Images Similarity by Relative Dynamic Programming

Images Similarity by Relative Dynamic
Programming
M. Sc. thesis by Ady Ecker
Supervisor: prof. Shimon Ullman

Overview
The similarity problem
The Method:Overlapping patchesCombining evidencesRelative dynamic programming
Analysis


The similarity problem
Old problem.
Important.
Difficult.
Natural to humans.

What is similarity?Similarity has many aspects, e.g. shape, color, size, outline, texture.
Relative and context dependent.
Depends on experience with classes in the real world.
Similarity is not a metric
Triangle inequality
Symmetry
Minimality

Previous approaches to similarity computation
Distance functions (L2, correlation).
Features detection, image signatures.
Minimal energy aligning transformation.
Dynamic programming measures.
Overlapping fragments (Ullman and Sali).

Motivation
Point-wise methods fail on very simple examples.

Motivation
We propose: common substructures of multiple sizes at multiple scales.
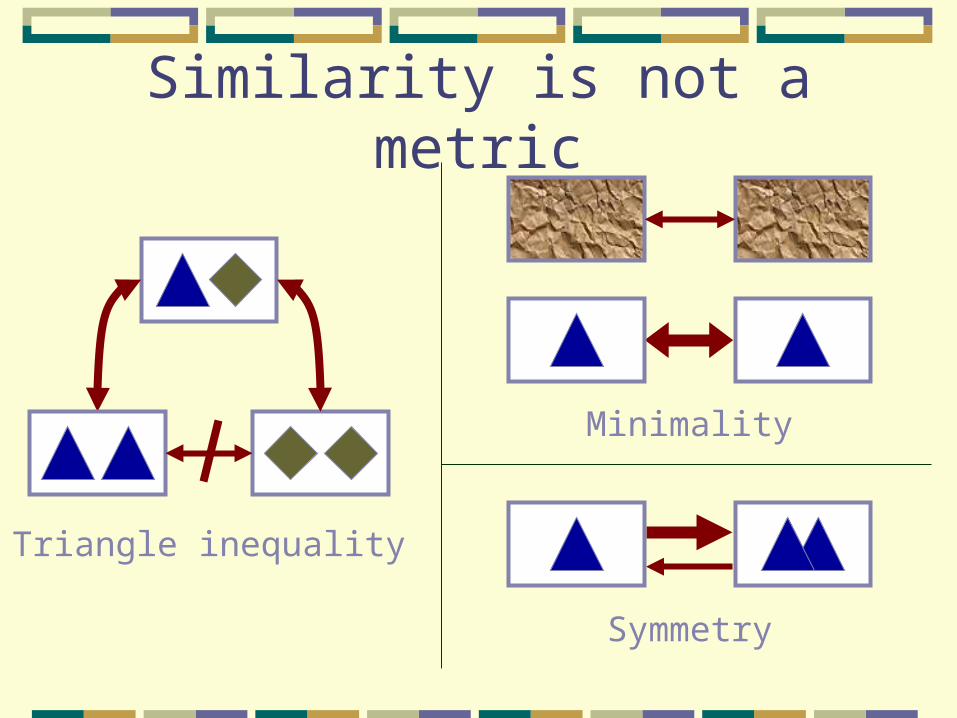
Similarity of sub-patchesat the local level
A1
B1
C1
A2
C2
B2
A1 A2 B1 B2 C1 C2


Overlapping sub-patchesoverlapping fragments impose similar structure.
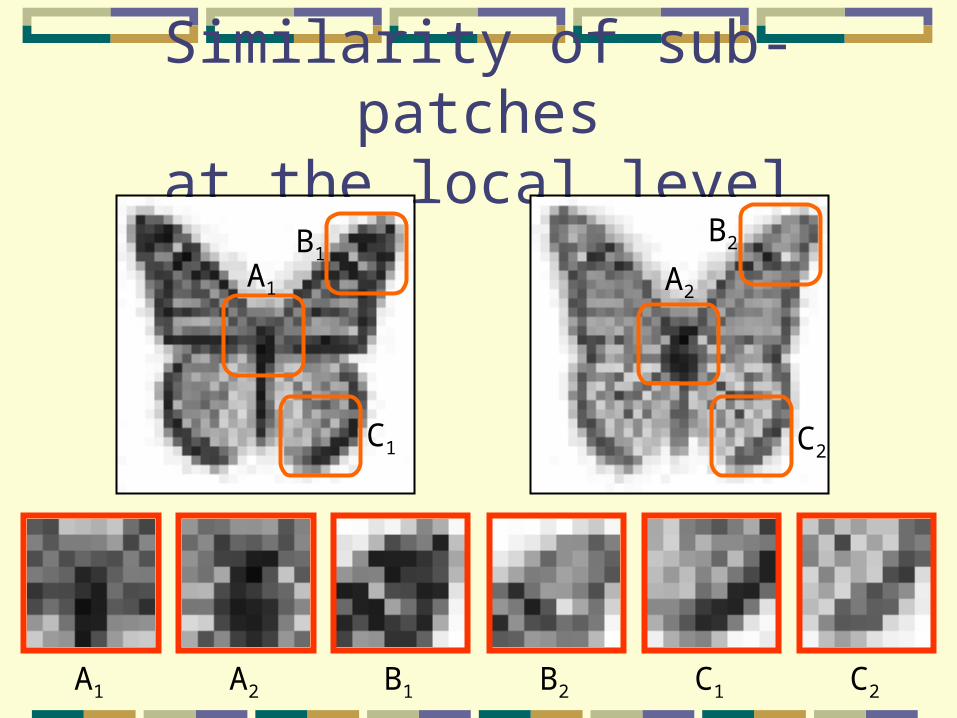
Hierarchical decomposition Allows the sub-patches to move a little.

Hierarchical alignment

Similarity indicators
Each indicator has its marginal distribution, but the joint distribution is too complex.
The indicators are dependent.
FX
Xnormalization by 1-D distribution

Generalization groups example
The similarity is related to the intersection of the groups:Pr( (A,B) length ratio ratio(A,B) )
45º length ratio 2

Graphical illustration of the similarity score
independent case general case estimation error
zF
0 10
1z
(x,y)area zprob. F
F
z
0 1
z
(x0,y0)
(x1,y1)
zz
1
0
(x3,y3)
F
0 10
1
(x0,y0)
(x1,y1)
FF
F
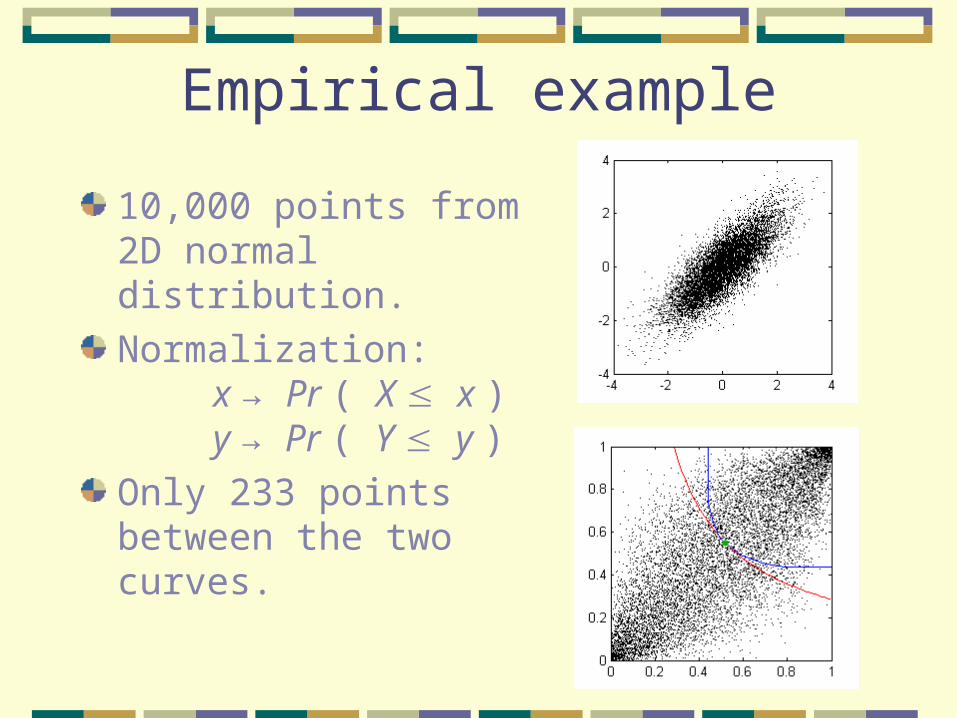
Empirical example
10,000 points from 2D normal distribution.
Normalization:x → Pr ( X x )y → Pr ( Y y )
Only 233 points between the two curves.
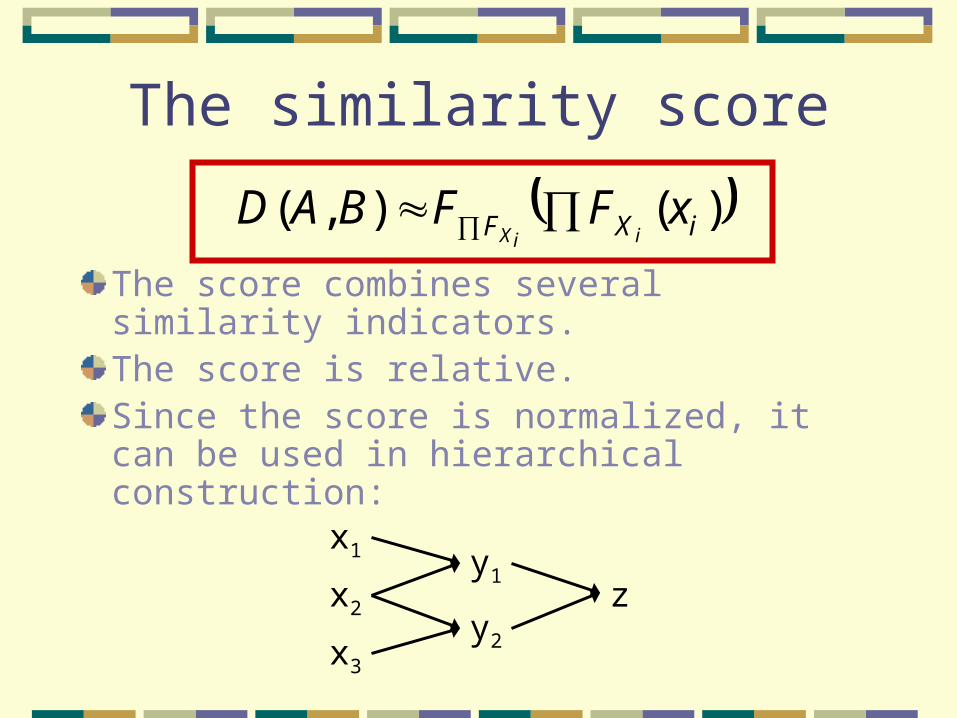
The similarity score
The score combines several similarity indicators.The score is relative.Since the score is normalized, it can be used in hierarchical construction:
)(),( iXF xFFBADiiX
x1
x2
x3
y1
y2
z

Dynamic programming in 2D?
Vertical movement
Horizontal and vertical movements

Relative Dynamic Programming (RDP)
Works in 2D like dynamic programming algorithms, but:Scores are relative.No explicit objective function.Start from many points simultaneously.

I1 I2
D(x,x2)
D(x,x3)
D(x,x2)D(x,x1)
D(x,x3)
D(x,x)
D(x,x1)
T(i,)
3
2
1
0
123
x x
The similarity table

The minima tableAllow flexible movements.
Costs keep movement coherence.
Used for efficiency.
Bi-directional (two tables).
projected index
delta

Combining evidences
18
118
1
tableminimum thefrom score
i
i
i
vP
v

Flowchart
Patch size = N?
Input images Set patch size = 2 Basic similarity measure
Store scores in similarity table
Yes
Output the similarity score
Build minima tables
Normalization
Double the patch size
Geometric mean of sub-patches' scores
No

Weighting patches
ii
w
i
wi
patchi j
vP
iIjiIpatchw
118
1
)2,2(
)2,2(
2)()(

Multi-scaleTwo dimensions, cross-resolution:
T(r,z,i1,i2,1,2)=min(P, Vhigh-low, Vlow-low)
P
Vlow-low
Vhigh-low
low resolution:
high resolution:
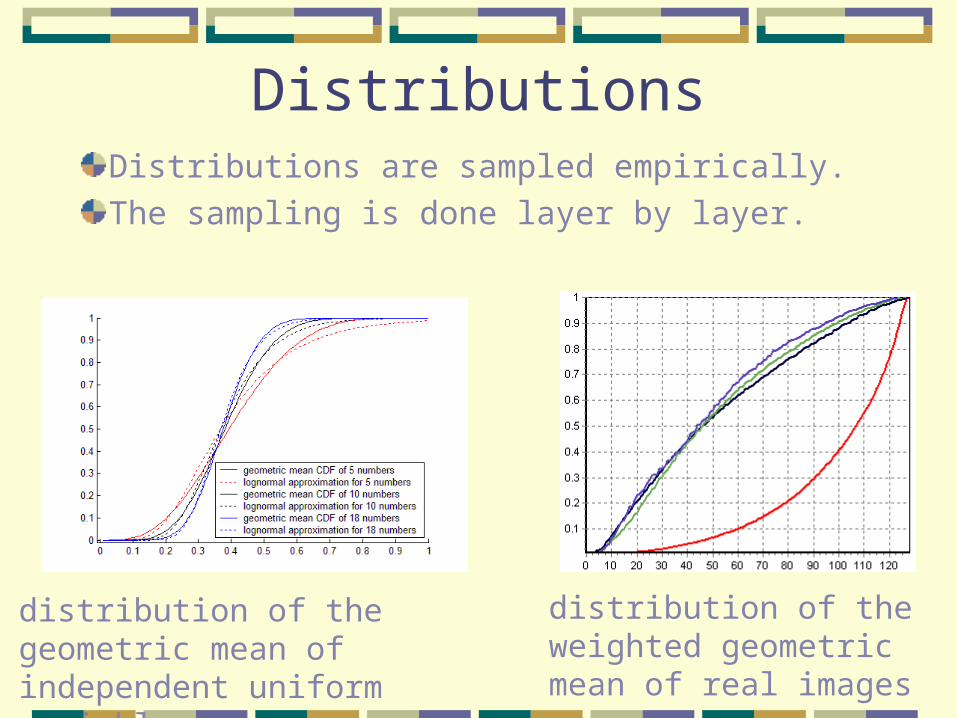
DistributionsDistributions are sampled empirically.
The sampling is done layer by layer.
distribution of the geometric mean of independent uniform variables
distribution of the weighted geometric mean of real images


Performance
The complexity is O(N22).The number of operations is governed by the operations on the original resolution.Basic-similarity operations:
3232171716 4,735,000.Minima operations:
3232171792 5,327,000.Total 10,000,000.Takes a second on 1.5GH p.c.
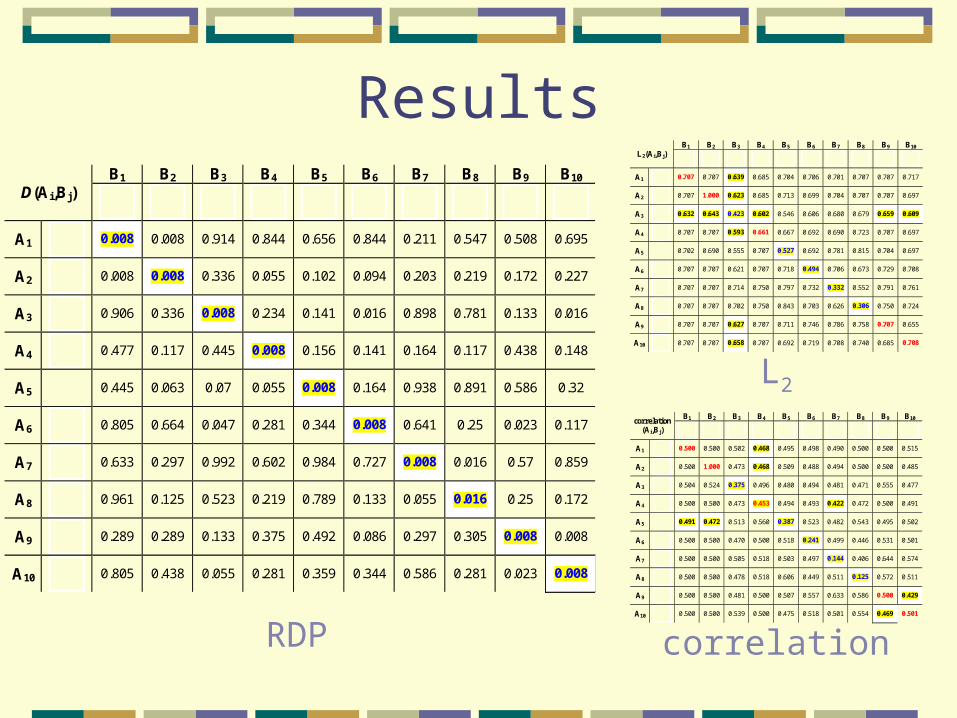
ResultsB1 B2 B3 B4 B5 B6 B7 B8 B9 B10
D(Ai,Bj)
A1
0.008 0.008 0.914 0.844 0.656 0.844 0.211 0.547 0.508 0.695
A2
0.008 0.008 0.336 0.055 0.102 0.094 0.203 0.219 0.172 0.227
A3
0.906 0.336 0.008 0.234 0.141 0.016 0.898 0.781 0.133 0.016
A4
0.477 0.117 0.445 0.008 0.156 0.141 0.164 0.117 0.438 0.148
A5 0.445 0.063 0.07 0.055 0.008 0.164 0.938 0.891 0.586 0.32
A6
0.805 0.664 0.047 0.281 0.344 0.008 0.641 0.25 0.023 0.117
A7
0.633 0.297 0.992 0.602 0.984 0.727 0.008 0.016 0.57 0.859
A8
0.961 0.125 0.523 0.219 0.789 0.133 0.055 0.016 0.25 0.172
A9
0.289 0.289 0.133 0.375 0.492 0.086 0.297 0.305 0.008 0.008
A10
0.805 0.438 0.055 0.281 0.359 0.344 0.586 0.281 0.023 0.008
B1 B2 B3 B4 B5 B6 B7 B8 B9 B10 L2(Ai,Bj)
A1
0.707 0.707 0.639 0.685 0.704 0.706 0.701 0.707 0.707 0.717
A2
0.707 1.000 0.623 0.685 0.713 0.699 0.704 0.707 0.707 0.697
A3
0.632 0.643 0.423 0.602 0.546 0.606 0.680 0.679 0.659 0.609
A4
0.707 0.707 0.593 0.661 0.667 0.692 0.690 0.723 0.707 0.697
A5 0.702 0.690 0.555 0.707 0.527 0.692 0.781 0.815 0.704 0.697
A6
0.707 0.707 0.621 0.707 0.718 0.494 0.706 0.673 0.729 0.708
A7
0.707 0.707 0.714 0.750 0.797 0.732 0.332 0.552 0.791 0.761
A8
0.707 0.707 0.702 0.750 0.843 0.703 0.626 0.306 0.750 0.724
A9
0.707 0.707 0.627 0.707 0.711 0.746 0.786 0.758 0.707 0.655
A10
0.707 0.707 0.658 0.707 0.692 0.719 0.708 0.740 0.685 0.708
B1 B2 B3 B4 B5 B6 B7 B8 B9 B10 correlation (Ai,Bj)
A1
0.500 0.500 0.502 0.468 0.495 0.498 0.490 0.500 0.500 0.515
A2
0.500 1.000 0.473 0.468 0.509 0.488 0.494 0.500 0.500 0.485
A3
0.504 0.524 0.375 0.496 0.480 0.494 0.481 0.471 0.555 0.477
A4
0.500 0.500 0.473 0.453 0.494 0.493 0.422 0.472 0.500 0.491
A5 0.491 0.472 0.513 0.560 0.387 0.523 0.482 0.543 0.495 0.502
A6
0.500 0.500 0.470 0.500 0.518 0.241 0.499 0.446 0.531 0.501
A7
0.500 0.500 0.505 0.518 0.503 0.497 0.144 0.406 0.644 0.574
A8
0.500 0.500 0.478 0.518 0.606 0.449 0.511 0.125 0.572 0.511
A9
0.500 0.500 0.481 0.500 0.507 0.557 0.633 0.586 0.500 0.429
A10
0.500 0.500 0.539 0.500 0.475 0.518 0.501 0.554 0.469 0.501
RDP
L2
correlation
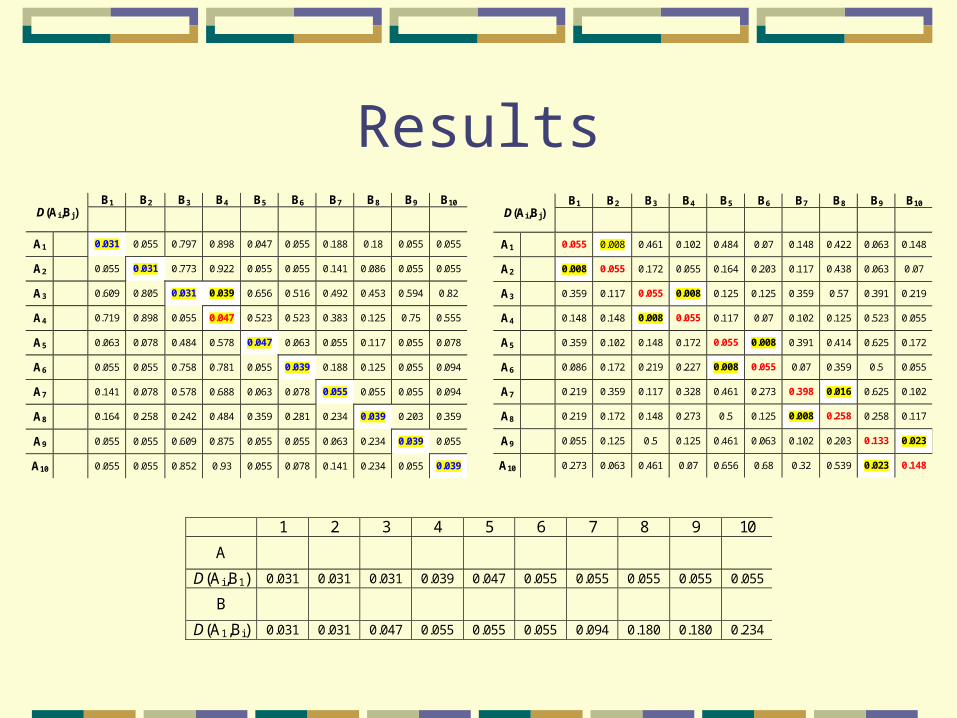
ResultsB1 B2 B3 B4 B5 B6 B7 B8 B9 B10
D(Ai,Bj)
A1 0.055 0.008 0.461 0.102 0.484 0.07 0.148 0.422 0.063 0.148
A2 0.008 0.055 0.172 0.055 0.164 0.203 0.117 0.438 0.063 0.07
A3 0.359 0.117 0.055 0.008 0.125 0.125 0.359 0.57 0.391 0.219
A4 0.148 0.148 0.008 0.055 0.117 0.07 0.102 0.125 0.523 0.055
A5 0.359 0.102 0.148 0.172 0.055 0.008 0.391 0.414 0.625 0.172
A6 0.086 0.172 0.219 0.227 0.008 0.055 0.07 0.359 0.5 0.055
A7 0.219 0.359 0.117 0.328 0.461 0.273 0.398 0.016 0.625 0.102
A8 0.219 0.172 0.148 0.273 0.5 0.125 0.008 0.258 0.258 0.117
A9 0.055 0.125 0.5 0.125 0.461 0.063 0.102 0.203 0.133 0.023
A10 0.273 0.063 0.461 0.07 0.656 0.68 0.32 0.539 0.023 0.148
B1 B2 B3 B4 B5 B6 B7 B8 B9 B10 D(Ai,Bj)
A1 0.031 0.055 0.797 0.898 0.047 0.055 0.188 0.18 0.055 0.055
A2 0.055 0.031 0.773 0.922 0.055 0.055 0.141 0.086 0.055 0.055
A3 0.609 0.805 0.031 0.039 0.656 0.516 0.492 0.453 0.594 0.82
A4 0.719 0.898 0.055 0.047 0.523 0.523 0.383 0.125 0.75 0.555
A5 0.063 0.078 0.484 0.578 0.047 0.063 0.055 0.117 0.055 0.078
A6 0.055 0.055 0.758 0.781 0.055 0.039 0.188 0.125 0.055 0.094
A7 0.141 0.078 0.578 0.688 0.063 0.078 0.055 0.055 0.055 0.094
A8 0.164 0.258 0.242 0.484 0.359 0.281 0.234 0.039 0.203 0.359
A9 0.055 0.055 0.609 0.875 0.055 0.055 0.063 0.234 0.039 0.055
A10 0.055 0.055 0.852 0.93 0.055 0.078 0.141 0.234 0.055 0.039
1 2 3 4 5 6 7 8 9 10
A
D(Ai,B1) 0.031 0.031 0.031 0.039 0.047 0.055 0.055 0.055 0.055 0.055
B
D(A1,Bi) 0.031 0.031 0.047 0.055 0.055 0.055 0.094 0.180 0.180 0.234

Experimental conclusions
The algorithm is superior to point-wise distance functions (L2, correlation), even when the images are aligned by a global transformation.
The current implementation neglects important parts such as outlines and topology.

Qualitative properties
Similarity by parts.
Captures variety of transformations.
Weights the salient parts.
Adaptive to distributions in the domain.

Properties of the design
Robust.
Simple operations.
Can be implemented in parallel and neural-networks.
Intuitive.
Extendible to deal with many aspects of similarity.

SummaryWe presented a new scheme to the similarity problem in general.The scheme is based on the systematic evaluation of similarity on overlapping sub-patches. Scores are relative. Scores are combined hierarchically using empiric normalizations.The implementation captures aspects of perceptual similarity, but is still inferior to human’s judgment.