Images in Mathematics - homepages.math.uic.edu
22
Images in Mathematics John T. Baldwin December 11, 2019 Abstract Mathematical images occur in lectures, books, notes, posters, and on the inter- net. We extend Kennedy’s [Ken17] proposal for classifying these images. In doing so we distinguish three uses of images in mathematics. 1. iconic images 2. incidental images 3. integral images An iconic image is one that so captures the essence of a concept or proof that it serves for a community of mathematicians as a motto or a meme for an area or a result. A system such as Euclid’s can combine such apprehensions with other forms of logical inference and an image that is built into a system of exposition is called an integral image. An incidental image is an image used by a mathematician to reason with a particular concept. In addition to this thematic characterization, we also explore one concept, infin- ity, in some depth by comparing representations of the infinite by mathematicians and artists. In this paper we will investigate various uses of images by mathematicians and contrast the artistic and mathematical representation of the infinite. A quick glance through my library supports an intriguing observation about mathematics. The serious works of history contain at most few pages of photographs; the philosophy books are all text 1 ; the mathematics book often contain images of various sorts. In high school and beginning college texts, the images largely serve to illustrate and thereby inculcate concepts. But others play different roles which we will try to explicate here. We follow Kennedy [Ken17] in beginning a partial classification of images in math- ematics by their use. Our categories are not intended as a rigid taxonomy, but rather as beginning a list of types of use. These categories may overlap. Alternatively, one might classify images by their subject; while we don’t address this topic systematically, in Section 4, we contrast representations of infinity by artists and mathematicians. This discussion builds on images related to perspective considered in earlier sections We extend Kennedy’s distinction [Ken17] among Euclidean diagrams, (using her terms), incidental diagrams and architectural drawing by adding the notion of an iconic dia- gram. We place the Euclidean diagram as a subcategory of our integral images, while 1 The few exceptions are scattered illustrations in some books on the Philosophy of Mathematics. 1
Transcript of Images in Mathematics - homepages.math.uic.edu

Images in Mathematics
John T. Baldwin
December 11, 2019
Abstract
Mathematical images occur in lectures, books, notes, posters, and on the inter-net. We extend Kennedy’s [Ken17] proposal for classifying these images. In doingso we distinguish three uses of images in mathematics.
1. iconic images
2. incidental images
3. integral images
An iconic image is one that so captures the essence of a concept or proof thatit serves for a community of mathematicians as a motto or a meme for an area ora result. A system such as Euclid’s can combine such apprehensions with otherforms of logical inference and an image that is built into a system of exposition iscalled an integral image. An incidental image is an image used by a mathematicianto reason with a particular concept.
In addition to this thematic characterization, we also explore one concept, infin-ity, in some depth by comparing representations of the infinite by mathematiciansand artists.
In this paper we will investigate various uses of images by mathematicians andcontrast the artistic and mathematical representation of the infinite. A quick glancethrough my library supports an intriguing observation about mathematics. The seriousworks of history contain at most few pages of photographs; the philosophy books areall text1; the mathematics book often contain images of various sorts. In high schooland beginning college texts, the images largely serve to illustrate and thereby inculcateconcepts. But others play different roles which we will try to explicate here.
We follow Kennedy [Ken17] in beginning a partial classification of images in math-ematics by their use. Our categories are not intended as a rigid taxonomy, but ratheras beginning a list of types of use. These categories may overlap. Alternatively, onemight classify images by their subject; while we don’t address this topic systematically,in Section 4, we contrast representations of infinity by artists and mathematicians. Thisdiscussion builds on images related to perspective considered in earlier sections Weextend Kennedy’s distinction [Ken17] among Euclidean diagrams, (using her terms),incidental diagrams and architectural drawing by adding the notion of an iconic dia-gram. We place the Euclidean diagram as a subcategory of our integral images, while
1The few exceptions are scattered illustrations in some books on the Philosophy of Mathematics.
1

we adopt her usage of ‘incidental’; we do not address her notion of architectural draw-ing which explores the relationship between ‘visual’ and ‘manual’ understanding. InSection 1 we explore by example, the notion of iconic image; in Section 2 we clarifythe relationship incidental images with other categories. In Section 3 we elaborate onthe integral nature of image in Euclidean geometry and in contemporary mathematics.
1 Iconic imagesAn iconic image so well represents an idea that little context is necessary. It contrastswith the integral images presented in Section 3, precisely because it brings out the ideawithout supporting context. In this section we display a number of iconic images fromvarious fields of mathematics. Our last example illustrates that the notion of iconic isfield-dependent.
The next set of pictures were contributed by the mathematician John Boller. Eachof the sketches represents an iconic result from centuries ago. These images have be-come iconic as they distill the essence of certain ideas for many people. For example,the upper left hand picture explains why the sum of the angles of a triangle is 180◦ (pro-viding the parallel postulate holds). Similarly, the one labeled ‘Eureka’ encapsulatesthe Pythagorean theorem. The three at the bottom summarize Archimedes approach tothe calculation of volumes. These diagrams have been emblematic for mathematiciansfor two millennia.
Iconic traces: John Boller-classical
2

In contrast, here are some sketches by the same author of some modern icons. Theupper left represents the notion of a quotient group. This is a nineteeth century concept.This picture often appears in modern texts in abstract algebra along with the equation(G/H)(H/K) = G/K. This equation exploits the notation for a ‘quotient of twostructures’ by using it in analogy to the the quotient of two numbers. The diagramson the right represent ideas that became central in topology during the early twentiethcentury.
Iconic traces: John Boller–modern
The lower left diagram is an example of the kind of category-theoretic diagram wediscuss in the next section, the definition of a tensor product.
3

Iconic traces: Post-Modern
The upper picture is the iconic picture of 20th century statistics, a normal distri-bution for independently distributed events. The lower one represents the result whenthere are correlations among the variables. They were published in Quanta magazine10/15/2014.
One type of iconic image is the so-called ‘proof by picture’, an image so clear that it‘immediately’ convinces the reader of the proof of the proposition. Many useful exam-ples occur in [Nel93]. But some care is needed; compare the following two diagramsthat purport to demonstrate that Σ1≤n<∞
12n = 1.
4

The three dots near the upper right hand corner of the second diagram are essentialto indicate that this procedure does not stop. And in fact, after Bolzano (see below),we may think more care is needed to make this proof complete.
The next anecdote illustrates that ‘iconic’ should really be ‘iconic’ for a specifiedgroup of (perhaps all) mathematicians.
Iconic traces: The universe of sets: V
The modern conception of the cumulative hierarchy envisions all sets being gener-ated by a sequence Vα where V0 is the empty set and Vα+1 is the power set of Vα. Theiconic picture is vee-shaped.
5

A standard way to show that a proposition φ (e.g. the continuum hypothesis) is con-sistent with ZFC is to construct a substructure of V which satisfies φ, an inner model.For example, the following picture, where L denotes the class of ‘constructible sets’which satisfies the continuum hypothesis, illustrates the consistency of the continuumhypothesis.
Iconic traces: Inner Models
Iconic traces: Elementary extensions
Model theorists have a different picture for a similar notion. The diagram aboverepresents that M is an elementary submodel of N — they satisfy the same sentences.As a model theorist, I drew it on the blackboard for a group of set theorists. M0 andM1
were supposed to be models of set theory; the room exploded in laughter. As the refereepointed out, the set theoretic picture has a more refined meaning; it emphasizes that V iswider than L while they have the same height. But this was not an important feature ofthe model extension I was drawing. The fields have established certain cultural norms,dare I say meme, for representing the concept of model extension; these images reflectmore specific aspects. But the particular image is expected even when that aspect isnot salient. Even a single model of set theory is drawn (by set theorists) as a V.
6

Sasha Borovik reports a complementary example; the ability of the same diagramto illustrate different ideas. He wrote,
Once upon a time, three of my postgraduate students worked on threecompletely different problems:
1. groups of finite Morley rank,
2. symplectic matroids and
3. probabilistic recognition of finite simple groups.
I used to talk to each of them referring to the same picture that was sittingfor a month or two on the blackboard in my office. It represented the rootsystem of type B3 – an eternal object. Could the same be done without ablackboard (or at least a whiteboard)? I doubt it.
Here is the diagram.The root system B3
7

Our last example has a more social aspect. Pictured below is the T-shirt of the‘Forking Festival’ held in Chicago for three years in the early 80’s when I was writingthe first full textbook in stability theory. This was deliberate attempt to both educate agroup of young logician in a new technology and an attempt to popularize the subject.Thus, various images which had largely been incidental in the previous decade (andunknown before), are displayed to show the world the new field. While the individualimages have iconic significance for the participant, the entire shirt proclaims a motto.The word ‘forking’ names in stability theory (an area of model theory, which itself isa branch of mathematical logic) an important generalization of the notion of algebraicindependence which is a bulwark of modern algebra. In reaching the final formulationof this notion, Shelah successively defined: splitting, strong splitting, dividing. All ofthese words describe a ‘bad behavior’ of an extension of a type: more information hasbeen introduced. That is, it is ‘good’ when the type p is a non-splitting extension of thetype q. When he finally came on the right notion he asked Chang for another English2
word in this family. Chang suggested forking and that stuck. However, when Lascarand Poizat approached the concepts, they looked first at the positive side and thinkingof an extension as a ‘fils’ (son), the non-forking extension became the ‘fils aınee’. AndHarnik translated ‘fils aınee’ as heir. I mention this string of names to emphasize thatfinding a name for a concept is a crucial part of making the definition.
The T shirt (designed by Gisela Ahlbrandt who was a graduate student at the time)contains a number of themes. The top line is read, ‘Forking dominates Chicago’ as pBqrepresents the technical relation of p dominates q. The tree of forking extensions playsa central role in the theory; here, the various leaves are names of important concepts.The crossed forks represent the visits each evening to one of the ethnic restaurants ofChicago. Here, the icons are being created for propaganda purposes; in advertising thefield the workers in the (then very small) field of stability theory are telling the math-ematical world some of the key ideas by diagrams which are incidental (as describedbelow) to the workers but might become iconic (and some have).
Forking Dominates Chicago
2He had one in Hebrew.
8
2 Incidental imagesIn this section we show some images that may stay on the mathematicians blackboardfor months (perhaps altered slightly from day to day) and yet may or may not appearin the published paper. Crucially, even if published, the image is illustrative but notintegrated. It is an aid to understanding rather than a step in the proof.
Kennedy wrote in two separated comments in her paper
And there are the informal, illustrative drawings, as one might call them,the incidental drawings mathematicians create while working alone or inconversation with other mathematicians, or while giving lectures.
These drawings are not proofs, though that claim has been made for themon occasion; and they are almost always discarded—in fact it seems wrongto preserve them, as if to circumscribe an epiphany, an intimate, rationalmoment, with a souvenir. [Ken17]
Our notion follows the first paragraph above, but not the second. Especially as itbecomes easier to publish illustrations, incidental diagrams may appear in print. Theymay double as iconic images for a particular concept. But perhaps this hits on thecrucial distinction. A particularly apt incidental diagram can be become an icon for aconcept. But the proof (modulo the Manders-style revision discussed in Section 3) isa sequence of assertions. It is the ability to tinker with the diagram that allows one toreach this precision.
The amalgamation property, illustrated above, is a fundamental notion in modeltheory. A class of models K has the amalgamation property if for each embedding
9

f1, f2 of a model M0 ∈K into models M1,M2 ∈K there are a model M3 and mapsf ′1, f
′2 of M1,M2 into M3 such that f ′1 ◦ f1 and f ′2 ◦ f2 agree on M0. This property is
true for first order theories but is an important contingent property in infinitary logic.These two representations are iconic; but the second will be embelished on the boardwith indications of obstructions to amalgamations that don’t show up in the paper buthelp the author to find the proof.
I was trying to explain by email the example below to a colleague and could notmake myself understood. Since this conference, where I intended to speak on the roleof images, was approaching, I carefully drew and emailed the diagram below as I wouldhave drawn them on the blackboard if he were present.
A mathematical conversation I
The diagram above shows the basic structure: an equivalence relation E with twoclasses (the two columns) and a descending chain of unary predicates Pn such thateach annulus Pn − Pn+1 is finite and each equivalence class intersects the annulus inthe same number of points. The ‘type’ p∞ is satisfied by an element that is in all of theUn. An infinitary axiom asserts that all realizations are E-equivalent. This picture wasnot convincing.
10
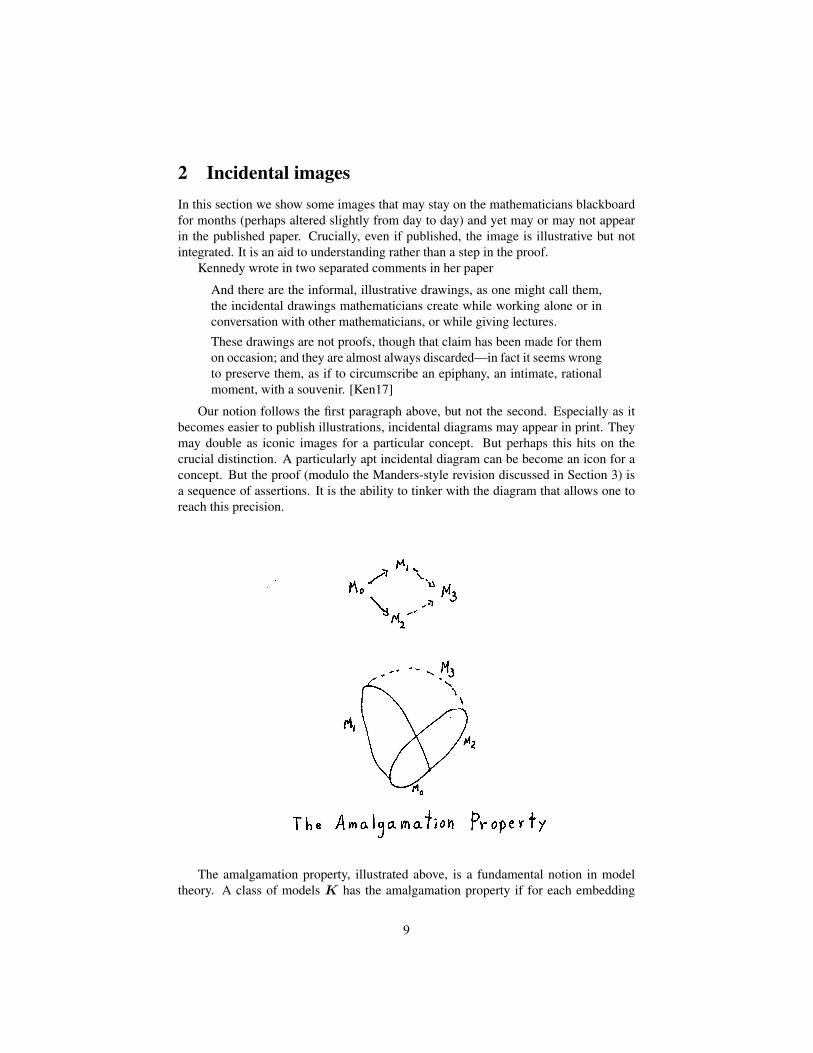
A mathematical conversation II
The second diagram shows that for an element a in the ground model M0 whereno element satisfies p∞, there are two extensions, one with a b such that p∞(b) andE(a, b) and another where ¬E(a, b) holds. These two models cannot be amalgamated.This picture satisfied my colleague. Note this diagram is a variation on the iconicamalgamation diagram. I continued the straight lines of Conversation I, but by splittingthe two possible extensions I have turned over the amalgamation diagram. The ‘Y’ isupside-down.
One of the prime interactions between mathematics and art is the notion of per-spective. The use of axial perspective dates back to Etruscan times. A pair of linesthat are intended to appear parallel are drawn to intersect and all such pairs intersecton the same line. A painting found at Pompeii3 (below) illustrates this idea. Anotherclear example is Giotto’s marriage at Cana which is easily available on-line. Comparevarious ‘horizontal lines’ on the two walls coming towards you and the grill work atthe top.
3Image taken from a photo by Esther M. Zimmer Lederberg which is on her memorial web site with theillustrative yellow lines: http://www.estherlederberg.com/EImages/Extracurricular/Renaissance+Baroque/Perspective+Art/Axial\%20Perspective.html.
11

In the renaissance Axial perspective was replaced by ‘linear perspectivity’ and theuse of a vanishing point. The remarkable theorem of Desargues asserts that these arethe same idea.
The ‘vanishing point’ of the artist becomes a ‘center of a central perspectivity’ inprojective geometry. In the diagram4 above, viewed as lying in the plane of the page,the triangles 〈M1,M2,M3〉 and 〈a1, a2, a3〉 are centrally perspective by point P andaxially perspective by line ω.
The 16th century Desargues theorem asserts that either perspectivity condition im-plies the other. Our diagram exhibits this theorem if we change our focus; focusingfirst on P , we see that central perspectivity; switching our attention to ω we see anaxial perspectivity. This diagram illustrating the theorem is certainly iconic. But itand many variants served as incidental diagrams in developing a geometric proof of aninterpretation of three-space into a Desarguesian plane Π. (Baldwin-Howard appendixto [Bal13]).
4We thank Andreas Mueller for this diagram.
12

3 Integral ImagesUnder various interpretations a diagram is taken as a heuristic or as integral part of themathematical discourse. As Ken Manders [Man08] points out, from the time of Eucliduntil the mid-nineteeth century, diagram was taken as an essential component of theproof. The very first proposition in Euclid illustrates the issue.
Euclid I.1: Construct an equilateral triangle5
Euclid does not have an axiom asserting that two overlapping circles must intersect.Manders (page 66 of [Man08]) asserts: ‘Already the simplest observation on whatthe texts do infer from diagrams and do not suffices to show the intersection of twocircles is completely safe.’ Manders distinguishes ‘exact’ and ‘inexact’ or topologicalproperties. An exact property is one that requires measurement - an assertion that twoline segments are congruent. Such statement are always in the text in 2000 years ofmathematicians following Euclid’s precepts. On the other hand when two lines cross inthe diagram (or circles cross) then there is a point of intersection. This convention wasdiscarded by (in particular Pasch and Hilbert) for what seemed to be a good reason. Theanalysis of the 19th century had discovered ‘analytic constructions’ that would build
5This diagram is taken from the site http://aleph0.clarku.edu/˜DJoyce/java/elements/bookI/propI1.html.
13

from rational numbers transcendental numbers that were not on the rational line. Eveneasier, the construction of
√2, leaves the rational numbers. In particular, in marked
contrast to the view down to Descartes, the 19th century and later view is that there isa straight line segment of length π. But the collection of numbers constructed with aruler and compass does not contain such a segment. The line of Euclid is found in theplane over the smallest field F such that if a ∈ F and a > 0 then
√a ∈ F . So as
Manders said, Euclid was perfectly safe.Thus, the diagrams of Euclid implicitly contain the information that they were con-
structed by carefully prescribed rules. These rules have been formally reconstructed by[ADM09, Mil07]. See the discussion in [Ken17]. The nineteenth century uncertaintystemmed not from a flaw in Euclid but from a not fully conscious extension of themeans of construction.
Several of the examples of iconic images were of ‘picture proofs’; a propositionthat is immediately clear from a picture. Kennedy [Ken17] describes this as ‘single textview’ and gives an example concerning the transitivity of betweenness from [ADM09].Under the ‘single-text’ view, the particular image is immediately perceived to verifya conclusion. Following Manders, we argue here that Euclid integrates the text anddiagram to form a coherent proof system; we call the diagrams which appear in such aproof integral images. We discuss category theory as another example below.
Kennedy gives a more detailed analysis of the 19th century rejection of the inte-gral diagram emphasizing the important role of Bolzano in stimulating this shift. Theintermediate value theorem (IVP) asserts that a continuous function on a closed inter-val must take on each value in the closed interval [f(a), f(b)]. Kennedy summarizesBolzano’s view and its reception.
To summarize Bolzano’s view—one that is now entrenched in the math-ematical community: construed as a geometrical truth, the IVP followsimmediately from the relevant diagram. Construed as a general mathe-matical truth, the IVP requires proof.
This assertion of course depends on the meaning of ‘geometrical’ and ‘mathemat-ical’. The revolution in the nineteenth century greatly expanded the notion of a math-ematical curve. Perhaps there was a time when mathematical curve and geometricalcurve could be considered synonomous6. But if Euclidean geometry is to be regardedon its own terms, these two notions of curve must be distinguished. The curves dis-cussed in The Elements were (at least, primarily) straight lines or conics. For all ofthese, the intersection axiom is indeed clear and the picture does not lie. It seems thatBolzano is adopting that meaning of ‘geometry’. But if the theorem construed for ar-bitrary continuous functions a careful proof must be given and at least some modernmathematicians would consider such curves ‘geometric’.
This distinction (what does ‘geometric’ mean?) remains rough in contemporarymathematics. Precise definitions exist but they vary by field. For an algebraic geometer,a curve (more generally, a higher dimensional surface or algebraic variety), is definedby a finite conjunction of polynomial equations. For a student of complex manifoldsthe natural object, an analytic variety, is defined by a finite conjunction of zero-sets
6This is somewhat dubious; the distinction between geometrical and mechanical arises even in antiquity.
14

of analytic function. Astonishingly, Chow’s theorem asserts that an analytic subspaceof complex projective space that is closed (in the ordinary topological sense) is analgebraic subvariety. Which is geometric?
Modern algebraic topology and category theory rely heavily on the use of diagrams.A short exact sequence is written:
0→ A→ C → B → 0;
It expresses that B is the quotient of C by A. In practice these diagrams becomeincredibly complicated. For an ‘artistic’ example see the movie7 It’s my turn.
The following diagram is taken from [Voe14].
In this paper, Fields medalist Voevodsky explains his mission to establish a firmerbasis for mathematics because of errors (listed in the paper) in major articles by seniormathematicians involved in describing calculations involving such diagrams.
7Jill Clayburgh proves the Snake Lemma at \{https://www.youtube.com/watch?v=etbcKWEKnvg.
15

The fundamental appeal of integral images is that the diagram is surveyable andgives direct evidence of truth. Even though it is possible to draw, at least with a com-puter, the diagrams described in [Voe14]; they are no longer surveyable. Thus Voevod-sky has turned to computer proof.
We pass from the philosophical discussion of the role of images in proof to a ques-tion. Raphael paid tribute to the Greeks in his School of Athens including a diagrambeing drawn by Euclid. What theorem is that diagram meant to support?
What is Euclid doing in the lower right-hand corner8? Fichtner [Haa12] suggeststhat he was demonstrating properties of a Star of David:
8Photo by Donald Wink
16

More precisely, Hass proposes (next diagram) that the problem is to prove Ficht-ner’s theorem: in a Star of David, the diagonal D1 has equal length to the chord L2(which is not drawn on Euclids slate).
In a workshop for high school teachers, I, Andreas Mueller, and Donald Wink de-veloped from Fichtner’s paper an activity to bring to life the construction in Raphael’spainting. Following, Hass [Haa12] we asked the teachers to prove the following theo-rem
Fichtner’s theorem: In the above diagram suppose BD and QP are perpendicularto AC and that the length of AB is twice that of BD and the length of AC is fourtimes that of BD. Show that the length of QC is twice the length of PB.
Hass raised more intriguing questions. He explores how Raphael’s knowledge ofperspective allows the inference that the diagrams of our discussion of Fichtner’s prob-lems are plausible, although the diagrams in the picture are only similar. He also dis-cusses alternative mathematical explanations of the painting.
17

4 Images of InfinityIn this section we compare some artistic images of infinity with incidental/iconic im-ages of particular infinite sets drawn by mathematicians. The most obvious distinctionis that the mathematicians are expressing a notion that was accepted9 only in the lastone hundred and fifty years: there are different sizes of infinity. But, even withoutdistinguishing sizes of infinity, the mathematical motifs underlying different artisticpresentations may differ.
Although Andrew Wyeth apparently painted this picture in New England, it evokedKansas for me and Dorothy staring off after the storm. Rather than the traditionaltending to vanishing point to represent immense distance, the big houses are set againstthe horizon; there is no fading away, just the virtually featureless sky.
https://www.moma.org/collection/works/78455
Infinity is empty.
This mirrored room produced by Kusama10 applies both the perspective effect ofsuggesting parallelism by lines meeting in the distance and contrasting the symmetryof these lines with the more random placement of the stars.
http://www.mirrorhistory.com/picture/infinity-mirrored-rooms/
Infinity is not so empty after all.In Citizen Kane, Welles gave us an infinite sequences of images of Kane — Hearst?
But in this still the repetition is precise; there is none of the randomness in Kusama’simage. There is perfect symmetry as Kane persists forever.
9The scholastic Grossteste had long ago envisioned the concept of orders of infinity [Fre54].10Infinity Mirrored Room The Souls of Millions of Light Years Away by Yayoi Kusama — Photo courtesy
of Kusama.Yayoi.
18

Mathematicians have much more detailed and diverse pictures of infinity. Since,Cantor there are ways to recognize many levels of infinite. In text it is easy to describethis in terms of two operations: taking unions and ‘there is always one more’. But for-ever is hard to visualize so diagrams can only represent the beginning of the sequence.ω is the first infinite ordinal: 1, 2, 3, . . . But it is possible to add infinities. Here aresome visualizations I drew.
ω
ω
ω + ω
ω + ω + ω
Marynthe Malliaris envisions a relationship. Why is ω + ω + ω = ω × 3? Andexplains it on a napkin.
ω × 3
19

Those were intuitive representations of small infinite ordinal numbers. More for-mally, an ordinal number is a linear order such that every decreasing sequence is finite.ω is The first infinite ordinal is denoted ω. Bill Howard phrases the problem of showinga linear order as an ordinal graphicall: Envision descending sequences.
He describes this as Godel’s Game. In order that the descending chain principle forthe set of ordinals ≤ α be intuitively understandable, we must be able to
‘Survey the various structural possibilities that obtain for [the] descendingsequences.’
Displaying descending sequences
We thank Bill Howard for telling us of Paul Cohen’s intelligence test: for whatordinals can you visualize the termination of descending chains witnessing well-foundedness of the ordinal? Cohen claimed ε0, the least ordinal such that ε = ωε.Try it, I don’t get nearly that far.
20
Giaquinto [Gia08] explores this ‘cognition of structures’ in more detail with astricter view of what people can grasp. He carefully examines, beginning with fi-nite structures, the process of abstracting from a single diagram to equivalence classescalled ‘visual images’ and then at the next level ‘visual categorical specification’(where for example our normal picture of a binary tree of height 2 is equivalent todividing a line segment in half and repeating on each subsegment). Then he arguesthat an infinite structure such as (ω,<) can be visualized by inductively repeating thepicture. And he explains the strategy of the ‘Cohen game’ described above. In contrastto finite and ‘short’ infinite well-orders, in his view a dense linear order does not admitsuch a ‘visual grasp’. Our notion is more general; we assert that understanding howto repeat a construction can lead to a ‘grasp’ of an infinite object and in this sense wehave similar grasps of (ω,<) and (Q,<). That is, there is no distinction between astep adding points at the end to form (ω,<) and a step adding a point between eachpair of consecutive elements to form (Q,<). Our grasp of the reals is somewhat moretenuous since it assumes the filling of continuum many cuts, but most mathematiciansdon’t agonize over their grasp of the linear ordering of the reals.
However, all these structures have cardinality at most the continuum. There are fewstrong intuitions of structures with cardinality greater than the continuum. However,there is a crucial exception to this remark. It is rather easy to visualize a model thatconsist of copies of single countable or finite object. Consider a vocabulary with aunary function f . Assert that f(x) never equals x but f2(x) = x. Then any model isa collection of 2-cycles. On the one hand we have the notion that there are models ofarbitrarily large cardinality but we have no really different image distinguishing amongthe models of different large cardinalities. This situation generalizes when the numberof disjoint copies of the same structure is replaced by the dimension of a vector spaceor field. Thus we might consider the class of structures Aκ, a direct sum of κ copies ofZ2. The isomorphism type of the model depends solely on the number κ of copies (andnot at all on the internal structure of the cardinal κ). That is, the class is κ-categorical.
In this last section we have shown how mathematicians devise specific images tosharpen their grasp of the many facets of infinity.
References[ADM09] J. Avigad, Edward Dean, and John Mumma. A formal system for Euclid’s
elements. Review of Symbolic Logic, 2:700–768, 2009.
[Bal13] John T. Baldwin. Formalization, primitive concepts, and purity. Review ofSymbolic Logic, 6:87–128, 2013.
[Fre54] Anne Freemantle. The Age of Belief. The Mentor Philosophers. New Amer-ican Library of World Literature, 1954. Grosseteste quoted page 134.
[Gia08] M. Giaquinto. Cognition of structures. In P. Mancosu, editor, The Philos-ophy of Mathematical Practice, pages 198–256. Oxford University Press,2008.
21

[Haa12] Robert Haas. Raphael’s school of athens: A theorem in a paint-ing? Journal of Humanistic Mathematics, pages 2–26, 2012. DOI:10.5642/jhummath.201202.03 http://scholarship.claremont.edu/jhm/vol2/iss2/3.
[Ken17] Juliette Kennedy. Three moments in the life of the mathematical diagram:Notes on the syntax/semantics distinction. In L. L. de Freitas, N. Sinclair,and A. Coles, editors, Mathematical Concepts. Cambridge University Press,2017.
[Man08] K. Manders. Diagram-based geometric practice. In P. Mancosu, editor,The Philosophy of Mathematical Practice, pages 65–79. Oxford UniversityPress, 2008.
[Mil07] N. Miller. Euclid and his Twentieth Century Rivals: Diagrams in the Logicof Euclidean Geometry. CSLI Publications, 2007.
[Nel93] Roger Nelson. Proofs without Words: Exercises in Visual Thinking. Math-ematical Association of America, Providence, 1993. Classroom ResourceMaterials.
[Voe14] V. Voevodski. The origins and motivations of univalent foundations; a per-sonal mission to develop computer proof verification to avoid mathematicalmistakes. 2014. Website: https://www.ias.edu/ideas/2014/voevodsky-origins.
22