IMAGE PROCESSING OF AERODYNAMIC DATA - NASA · 2013-08-30 · IMAGE PROCESSING OF AERODYNAMIC DATA...
18
NASA Technical Memorandum 87629 IMAGE PROCESSING OF AERODYNAMIC DATA NETTIE D. FAULCON DECEMBER 1985 NI\S/\ National Aeronautics and Space Administration Langley Research Center Hampton, Virginia 23665 NASA-TM-8762919860007083 ,i II N 'j '1'1 it) . '.' \ . .' '-' . ! ,'I',!'Jir:rON, VIRGINIA https://ntrs.nasa.gov/search.jsp?R=19860007083 2018-07-12T05:17:01+00:00Z
Transcript of IMAGE PROCESSING OF AERODYNAMIC DATA - NASA · 2013-08-30 · IMAGE PROCESSING OF AERODYNAMIC DATA...
NASA Technical Memorandum 87629
IMAGE PROCESSING OF AERODYNAMIC DATA
NETTIE D. FAULCON
DECEMBER 1985
NI\S/\National Aeronautics andSpace Administration
Langley Research CenterHampton, Virginia 23665
NASA-TM-8762919860007083
,i II N 'j f~< '1'1it). '.' .~. \ ..' '-' ~- .
! ,'I',!'Jir:rON, VIRGINIA
https://ntrs.nasa.gov/search.jsp?R=19860007083 2018-07-12T05:17:01+00:00Z

3 1176 00187 7399
SUMMARY
The use of digital image processing techniques in analyzing and evaluatingaerodynamic data is discussed. An image processing system that convertsimages derived from digital data or from transparent film into black andwhite, full color, or false color pictures is described. Applications toblack and white images of a model wing with a NACA 64-210 section insimulated rain and to computed flow properties for transonic flow past aNACA 0012 airfoil are presented. Image processing techniques are used tovisualize the variations of water film thicknesses on the wing model and toillustrate the contours of computed Mach numbers for the flow past the NACA0012 airfoil. Since the computed data for the NACA 0012 airfoil are availableonly at discrete spatial locations, an interpolation method is used to providevalues of the Mach number over the entire field.
INTROOUCTION
Digital image processing, originally established to analyze and improve lunarimages, is rapidly finding a wealth of new applications in many areas. Suchapplications include those in the field of medicine (e.g., tomography andthermography), in earth resource analysis and planning (e.g., land usage andminerals), in geophysical and seismic research, in nondestructive testing andevaluation, as well as in industrial process control.
Recently, there has been interest in using image processing techniques toanalyze and evaluate aerodynamic data. Usually the analysis and evaluation ofaerodynamic data involves examining and summarizing physical measurementsand/or numeric data. In many cases, this is not the most efficient way ofobtaining the desired aerodynamic information.
Using digital image processing techniques, an easily-interpretable, opticalpresentation of the data can be obtained. This is accomplished bytransforming aerodynamic data, derived from calculations or from print orfilm, into a matrix of pixels (picture elements) with each pixel capable of256 gray levels, thus requiring eight bits. When color is used as an outputmedium for this monochrome imagery, certain features of the data arehighlighted and thus are identified easily. This technique, referred to aspseudoco1or, maps each of the gray levels of a monochrome image into anassigned color and is done with the belief that the eye more usefully discernsshades of color than shades of gray. With this technique, the mappings of thecolors are computationally simple and fast. This makes pseudoco10r anattractive technique for use on digital image processing systems that aredesigned to be used interactively. It should be noted, however, that the
success or failure of a particular pseudocolor technique in analyzing imagesdepends upon the nature of the image. One property that has a noticeableeffect is the noise in images digitized from film or print. The human visualsystem can filter out the high spatial frequency noise fairly well when theintensity is affected. However, when the noise is converted to colors bypseudocoloring operations that change colors at high rates (such as randomassignment) the image can be difficult, if not impossible to see. It becomesvery difficult to preceive features of interest unless the colors are assignedsystematically. On the other hand, random assignment of colors is anattractive technique to present image data which are derived from calculations, since noise is not present in the image.
In this study, image processing has been used to study the effects of waterfilms on the aerodynamic properties of wing surfaces, and to provide a fastand efficient method for presenting flow field properties such as Mach numberdistributions obtained from numerical solutions of flow equations.
SYSTEM DESCRIPTION
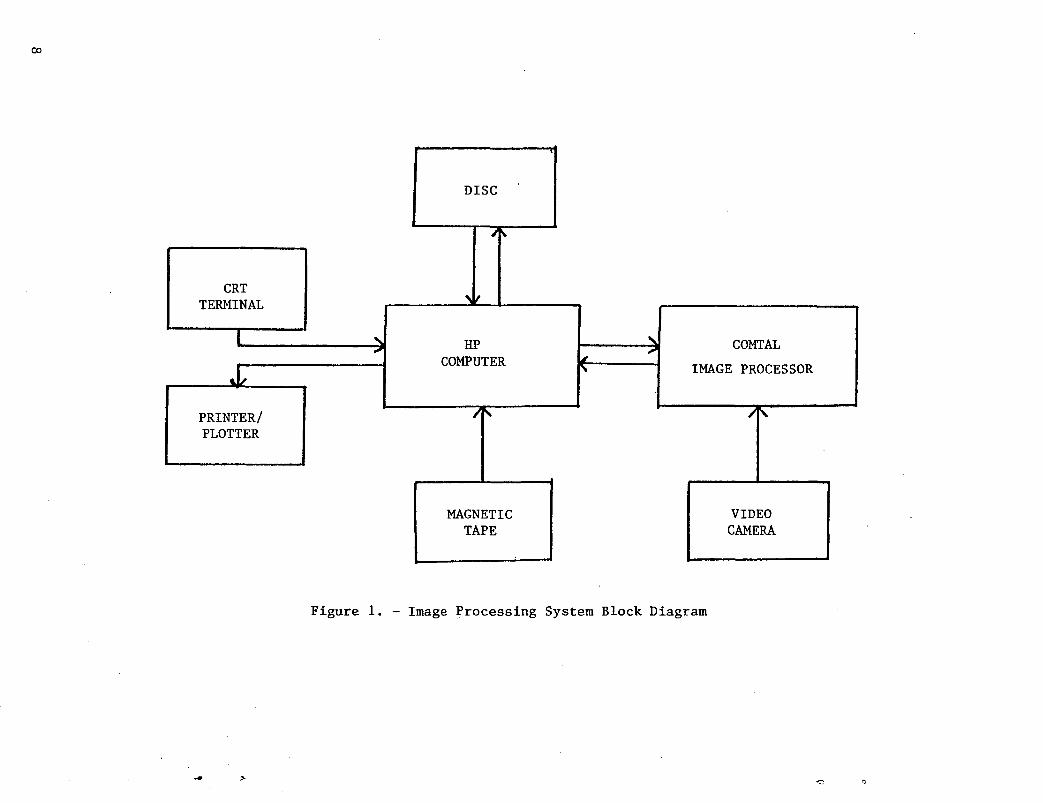
An image processing system is the combination of an image processor, controland display devices, and the software necessary to provide the capability toanalyze and enhance image data interactively. The system used in this studyconsisted of a COMTAL Vision One/20 image processor with a monochrome videocamera, and a Hewlett Packard (HP 1000) minicomputer with disc and otherperipheral equipment. Figure I shows a block diagram of the system.
COMTAL Vision One/20
The COMTAL Vision One/20 is a real-time interactive image processor that maybe operated as a stand-alone system or as a peripheral unit of a hostcomputer. The processor produces high spatial resolution video images in fullcolor, in pseudocolor, or in shades of gray over a full range of brightnessfrom 0 (black) to 255 (white). It acquires these images from built-in imagegenerating functions, from the video camera or from the system interface,which is the link between the host computer and the COMTAL system. The hostcomputer is used to enter digital image data (monochrome or color) into theCOMTAL Vision One/20 via the system interface, while images from film or printare entered through the video camera as monochrome analog values and thenconverted to digital data.
•
2
The COMTAL Vision One/20 consists of a fully integrated LSI-II systemcontroller, image processing electronics, refresh memory using 16K RAM, andapplication firmware. The LSI-II system controller handles the switching andthe control of the images, manages the memory, and controls the overall COMTALsystem in response to operator commands locally via the keyboard control unit,or remotely through the system interface. The LSI-II utilizes a combination ~
of ROM and RAM to provide interactive control and processing. Additional RAMis available for user-generated software. The operating system, furnished infirmware (ROM), allows the user to interact with the system through a set ofhigh level commands that require only initial letters from the keyboard tocomplete instruction definition (ref. 1).
•
•
All image data and graphic overlay data are stored in RAM refresh memories.The system has four 512 x 512 x 8 bit image memories with four512 x 512 x 1 bit graphic memories which can be dynamically reconfigured toone 1024 x 1024 x 8 bit image with a single graphic plane. Image dataretrieved from storage are processed by two independent, sequentialprocessors, a function processor, and a pseudocolor processor. With the useof fast look-up tables, these processors perform analysis and enhancementalgorithms on the data after it is retrieved from storage. Graphic overlaydata can be retrieved from the refresh memory and presented to the displaysimultaneously with the retrieval and display of the image data. The graphicoverlays, which are independent of each other and of the images as well, canbe placed nondestructively over the image being displayed. Images and graphicoverlays, as well as charaster input commands and output data, are displayedon a very high spatial resolution (512 x 512) color monitor.
For interactive modification of displayed process parameters, a manuallyoperated trackball and a data tablet are available. These devices can also beused to position a target (another feature of the COMTAL system) to any pixellocation on the display. This target which is programmable (shape and color)can also be controlled by software or firmware. The X and Y coordinates ofthe target are available through the standard system interface.
HP 1000 Computer
With the HP 1000 computer, disc and other peripherals, an orderly sequence ofevents for the entire processing system can be organized and contcolled. Ashost to the COMTAL Vision One/20, the Hewlett Packard minicomputer is used toenter command data to the system, for image/graphic data transfers between thesystem and the original data source, for control of processing functions, andfor implementing other application programs.
The operator communicates with the computer and its peripherals (disc,magnetic tapes, and printer/plotter) as well as with the COMTAL via a CRTterminal. Data files and application programs are stored on the disc whi.lemagnetic tape is used to store digital data. An electrostatic printer/plotteris used to obtain image data as well as intensity profiles (graphs) ofimages. Quick hard copies of displayed images and graphic overlays areobtainable with a hooded Polaroid camera. For better copies, Langleyphotographic services are used.
IMAGE PROCESSING OF WATER FILMS ON A WING SURFACE
In support of an intense nation-wide investigation into the effects of weatheron aircraft performance, wind tunnel tests with simulated heavy rain wereconducted by researchers from the Subsonic Aerodynamics Branch of the LowSpeed Aerodynamics Division of the NASA Langley Research Center. The effectof water collected on the wing surface is important because, in addition toadding weight, the water acts as a surface contaminant that may influencepressure gradients, skin friction drag, and boundary-layer characteristics andtransition. All of these factors can influence lift and/or drag (ref. 2).
3
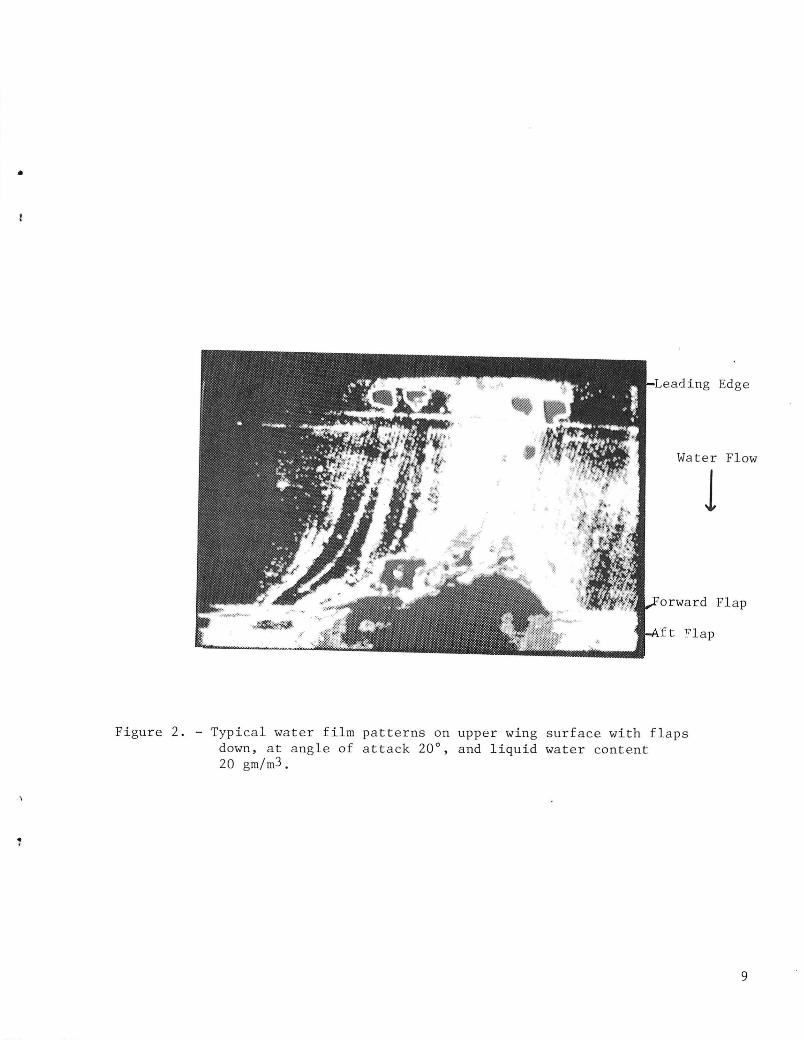
Tests were conducted in the 4-by-7 meter wind tunnel where water, containing adye, was sprayed into the tunnel stream ahead of a model wing with aNACA 64-210 section (ref. 3). At various times. an ultraviolet strobe lightwas used to cause the dye to fluoresce. For changes. of the wingconfiguration. angle of attack. or liquid water content, flow patterns on themodel surface were recorded with overhead cameras using photographictransparent film. Images of these flow patterns were analyzed using the •COMTAL image processing system. As analog input to the video camera, flowpatterns recorded on the transparent film were converted to monochrome imagesin the COMTAL system. After being preprocessed to minimize noise transmission ,from the camera. each image was stored on the disc for subsequent analysis.After studying the intensity distribution of the images, the researcherselected. for each image, four pixel intensity ranges to represent variationsof the water film thicknesses. With the hardware capabilities of the imageprocessing system. each selected intensity range was classified in real timeinto a particular color. The resultant classified areas were instantlydisplayed on the monitor using pseudocolor presentation, with user selectedcolors assigned via the keyboard or through the system interface. In thisvivid optical presentation of the flow pattern, each pseudocolor wasassociated with water film thicknesses as indicated on the transparencies.Actual discrete water film thickness measurements could not be determined forthese images because of inadequate resolution in the photographs.
Figure 2 shows a flow pattern analyzed on the COMTAL system. In this pattern,the angle of attack of the wing with flaps down was 200 and the liquid watercontent was 20 gm/m3 • The darker regions represented the heavy water filmthicknesses while the brighter areas represented the lighter thicknesses.
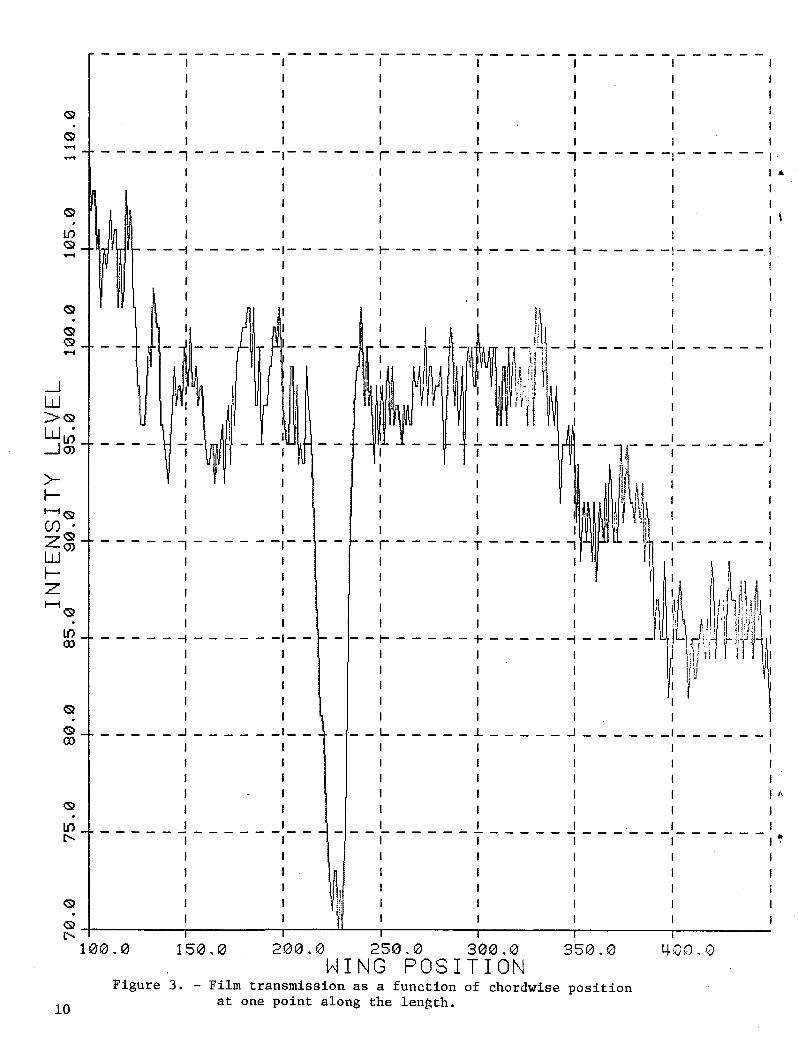
Also, intensity profiles of an X (horizontal) or Y (vertical) plane throughany location on the image could be obtained. Figure 3 shows a typical Xintensity profile of a flow pattern. The intensity profiles are displayed onthe system's color monitor as graphic overlays or passed to the computer foroutput on the printer/plotter.
VISUALIZATION OF FLOW PAST A NACA 0012 AIRFOIL
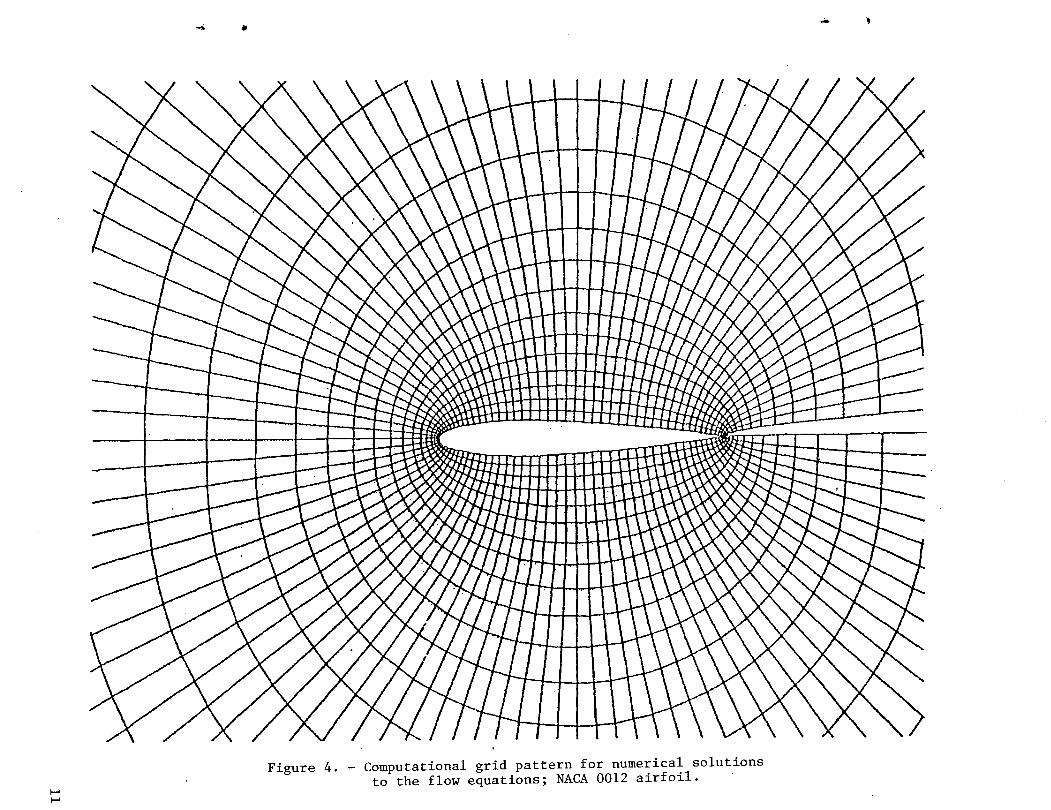
Image processing techniques were used to help analyze and evaluate dataobtained from numerical solutions of flow equations. In an aerodynamic study.inviscid flow past a NACA 0012 airfoil was computed. Researchers from theLoads and Aeroelasticity and the Transonic Aerodynamics Divisions at Langleyand from the University of California. Los Angeles. used a modified version ofthe TAIR computer program (ref. 4) to generate numerical solutions of theconservative potential equation
4
t~x) x+ 0~y)y = 0
where the density. p is1
p = [1Y - 1 (~ 2 ~ Y2) ]
Y - 1
Y 1 ++ x (2)
•
x and yare streamwise and lateral coordinate directions, ~ is a velocitypotential, and Y is the ratio of specific heats. Finite difference methodswere used to solve equations (1) and (2) in a body-fitted coordinate systemlike that shown in figure 4. The system has 149 grid lines intersecting theairfoil and 30 grid lines around the airfoil. The innermost line around theairfoil defines the airfoil boundary. Mach number data obtained from thisstudy were used to demonstrate the capability of using image processingtechniques to analyze and evaluate such data.
For this application, an image file was created from the aerodynamic data byimplementing a computer program that does the following:
1. Converts the streamwise and lateral coordinate directions topixel locations in a 512 x 512 array;
2. Converts the values of the flow properties (Mach number ordensity) to gray scale values between 0 and 255; and
3. Implements a linear interpolation method to provide values ofthe flow properties over the entire field (since the computed data wereavailable only at discrete spatial locations).
Inputs to the program allow the operator to:
1. Select the Mach number or density fields for evaluation; and
2. Select the size of the flow field to view and the flow fieldfor magnitude scaling.
For example, to zoom in on the field ~round the airfoil's leading edge and toprovide good magnitude resolution, the operator could select the data fieldfrom the 10 innermost grid lines around the airfoil and from grid lines thatintersect the airfoil within 10 percent of the chord of the leading edge.
The image file created from the program can be presented on the COMTAL displayeither as a monochrome image, with the various shades of gray representingdifferent values of the flow field variables, or as a pseudocolor image, withthe different colors forming contours of the computed flow quantities. Eachpresentation of the data can quickly be accomplished in 1/30 of a second bydepressing one key on the COMTAL keyboard. In addition, the r.esearcher canuse the trackball to easily obtain, in real time, the most desirable colorcontrast for the presentation of the contours on the display monitor.
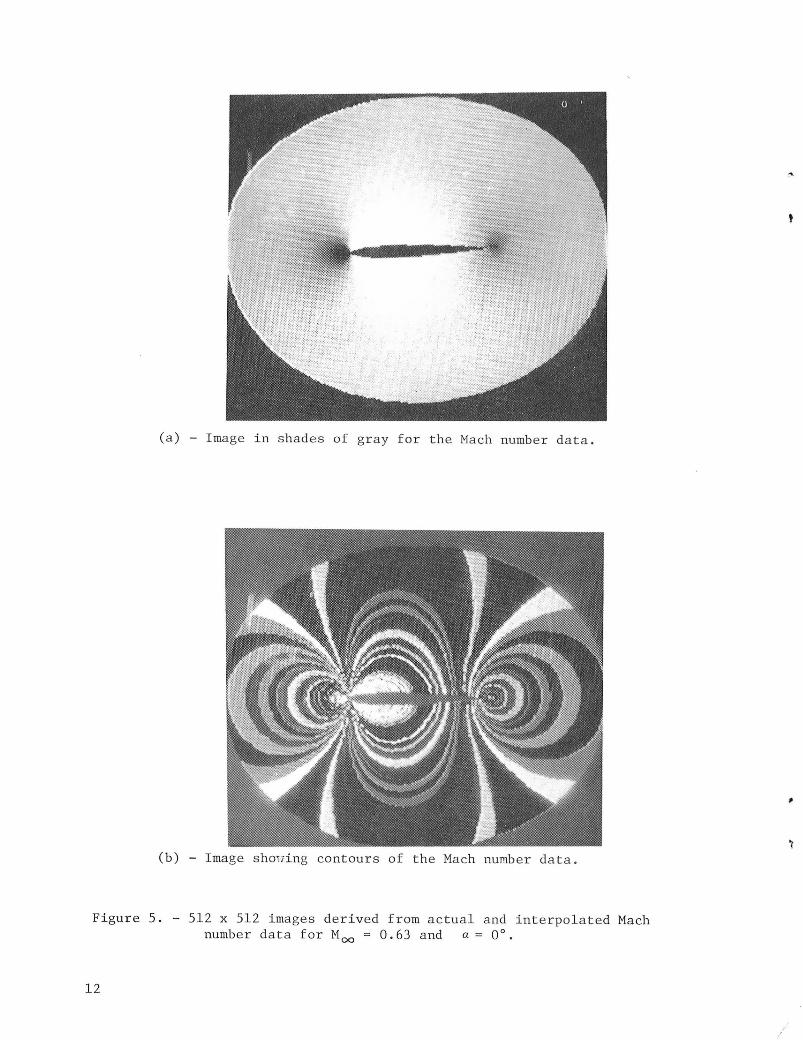
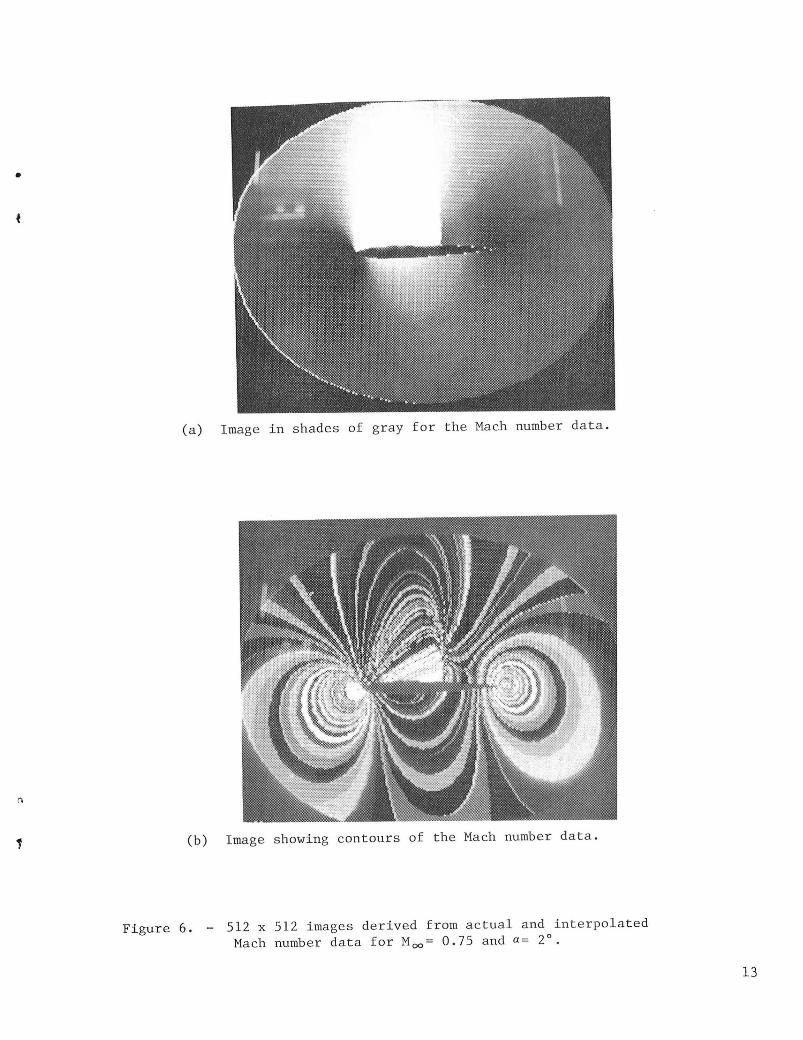
Figures 5 and 6 show images displayed on the COMTAL system using the Machnumber values (derived from given and linearly interpolated data) underdifferent conditions. Figure 5 shows images of the Mach numbers throughoutthe flow field for a fr.ee-stream Mach number (Moo) of 0.63 and angle of attack(a) of 0°. Figure Sa shows the Mach number values in shades of gray. Thedark regions near the airfoil's leading and trailing edges indic~te regionswhere the Mach numbers are low. The relatively bright areas around theforward half of the airfoil indicate expansion oE the flow (increase in localMach number). Recompression (decrease in Mach number) occurs over the aft
5
6
portion (where the gray shades are not as bright). Figure 5b shows thecontours of the Mach number levels. The gradual spacing of the contoursindicates that there are no discontinuities, such as shock waves, in the flowfield. Figure 6a shows the gray image for Mm of 0.75 and a of 20 • Thebright area in the upper portion of the flow field indicates a large region ofsupersonic flow that is terminated by a shock wave on the upper surface of theairfoil. In figure 6b the shock is evident from the clustering of contourlines near midchord. This corresponds to the termination of the bright areain figure 6a.
CONCLUDING REMARKS
An image processing system has been described and the use of digital imageprocessing techniques to enhance the display of aerodynamic data has beendiscussed. Monochrome imagery and pseudoco10r techniques were used tovisualize and indicate the water film thicknesses on a wing model with aNACA 64-210 section and to present the computed flow properties for transonicflow past a NACA 0012 airfoil. In evaluating the water films on the wingmodel, monochrome images derived from transparent film were examined and userselected colors were assigned to represent different intensity ranges. Thecolors in this pseudocolor image represented different water film thicknesseson the wing surface.
In presenting the computed flow properties of transonic flow past aNACA 0012 airfoil, a monochrome image was derived from the computed flowvalues. The gray shades of this monochrome image represented values of theflow field variables while the colors (randomly assigned within the system) ofthe corresponding pseudoco10r image represented the contours of the flowvariables. Even though other methods (e.g., computer graphics) exist fordisplaying results such as the computed properties for flow past an airfoil,image processing techniques offer an alternative method that is both fast andefficient. This is due to the image processing system's software, built-inhardware, and interactive capability.
f
REFERENCES
1. Faulcon, Nettie D.: Handbook on COMTAL's Image Processing System, NASATM 85671, July 1983.
2. Hastings, E. C., Jr.; and Manuel, G. S.: Measurements of Water FilmCharacteristics on Airfoil Surfaces from Wind Tunnel Tests withSimulated Heavy Rain, AIAA Paper 85-0259, 1985.
3. Dunham, R. E., Jr.; Bezos, G. M.; Gentry, G. L.; and Melson, E., Jr.: TwoDimensional Wind Tunnel Tests of a Transport-Type Airfoil in a WaterSpray, AIAA Paper 85-0258, 1985.
4. Dougherty, F. Carroll; Holst, Terry L.; and Gundy, Karen L: TAIR - ATransonic Airfoil Analysis Computer Code, NASA TM 81296, May 1981.
7
DISC
,~
CRT ,IITERMINAL
I " HP " COMTAL,. ,COMPUTER ~
ll~, IMAGE PROCESSOR
PRINTER/ I ~ / "PLOTTER
MAGNETIC VIDEOTAPE CAMERA
Figure 1. - Image ~rocessing System Block Diagram
..
•
•,
Edge
Water Flow
1
orward Flap
ft Flap
Figure 2. - Typical water film patterns on upper wing surface with flapsdown, at angle of attack 20°, and liquid water content20 gm/m3 .
9
400.03513.01513.13 21313.13 2513.13 31313.13WING POSITION
Figure 3. - Film transmission as a function of chordwise positionat one point along the length.
-------------------------------------------1111I
I I I I I I I- - - - - ., - - - - - -1- - - - - - r - - - - - T - - - - - ., - - - - - -,- - - - - - I
I I I I I I I •I I I I I I I
l I I I I I I I
~~ --J-----_:------~ -----L----J-----_:------:I
! J, I I I I I !I I I I II I I , I I
I I I. I !'\ I I
, I /dIP ) I Ii I I
I I' I I ij~ I I III I II I I Ir I 1 I I
I I I ,I
I I I I 'II I
-----1------:- --- -~-----L ~ ~ ,~1 !\\I\ -!- -----iI I I I ,1m I \ I I
I I I I I I lit II 'I ,'I ~ II I f If'I r J.I~ ~,;l I
I I I I I ~1,;I.1 . .1.'. ii'l [,.1':.1,1\",1 I1 1 I I I li,I'!! ~. ~J,!I'I IWfil i !-----~-----T----~-----r-----~ -----r~~\il nn~11:
I I I I I II I I I I I
_____ ...J 1_ _ _ '__ L .1. ...J 1 I
I I I I I I II I I I I II I I I I II I I I I ! n
I I I I II I I , I I, I I-------------- ----------------------------.I I I I I I I I
I I I I I I I
I I ~ I I I I 1I I I I I I II ,d I I I I II I~' I I , I ,
<Sl 4------r-------r--.....!I..l---r-----.,.-----.,.-------r------['-.
11313.13
10
>It-i<Sl(I).z<SlwO)IZt-i(Sl
If)OJ
•
Figure 4. - Computational grid pattern for numerical solutionsto the flow equations; NACA 0012 airfoil.
(a) - Image in shades of gray for the Mach number data.
(b) - Image shouing contours of the Mach number data.
Figure 5. - 512 x 512 images derived from actual and interpolated Machnumber data for Moo = 0.63 and a = 0°.
12
t
•
(a) Image in shades of gray for the Mach number data.
(b) Image showing contours of the Mach number data.
Figure 6. - 512 x 512 images derived from actual and interpolatedMach number data for Moo = 0.75 and a= 2°.
13
1. Report No.
NASA TM-87629
Standard Bibliographic Page
12. Government Accession No. 3. Recipient's Catalog No.
4. Title and Subtitle
Image Processing of Aerodynamic Data
7. Author(s)
Nettie D. Faulcon
9. Performing Organization Name and Address
Langley Research CenterHampton, VA 23665
12. Sponsoring Agency Name and Address
National Aeronautics and Space AdministrationWashington, DC 20545
15. Supplementary Notes
. 5. Report Date
December 19R56. Performing Organization Code
505 61-01 058. Performing Organization Report No.
10. Work Unit No.
11. Contract or Grant No.
13. Type of Report and Period Covered
~ .,. .... ." .14. Sponsoring Agency Code
16. AbstnlC~
The use of digital image processing techniques in analyzing and evaluatingaerodynamic data is discussed. An image processing system that convertsimages derived from digital data or from transparent film into black andwhite, full color, or false color pictures is described. Applications toblack and white images of a model wing with a NACA 64-210 section insimulated rain and to computed flow properties for transonic flow past aNACA 0012 airfoil are presented. Image processing techniques are used tovisualize the variations of water film thicknesses on the wing model and toillustrate the contours of computed Mach numbers for the flow past the NACA0012 airfoil. Since the computed data for the NACA 0012 airfoil are availableonly at discrete spatial locations, an interpolation method is used to providevalues of the Mach number over the entire field.
17. Key Words (Suggested by Authors(s))
Pseudocoloring TechniquesWater FilmsMach Number Data
19. Security Classif.(of this report)n ., ol Col_..:I
18. Distribution Statement
Unclassified - Unlimited
Subject Category 35
120. Security Classif.(ofthispage) 121. No. of Pages I22. Price
. TT,..,..1 ..,coco-l H ,,-'I 14 I A02
For sale by the National 'Thchnical Information Service, Springfield, Virginia 22161NASA Langley Form 63 (June 1985)
...,...,..


• f ,~ , >
.., I
1\11\ 11111\~~I\\~~\rn~t\~~~\ ~~~\\\~\ \\\1 11\\1\3 1176 00187 7399
e
,
j
-.\