Image files of the World Map of Organic Agriculture may be ...
11
Image files of the World Map of Organic Agriculture may be downloaded from the Oxford University Research Archive (http://ora.ox.ac.uk) at: http://ora.ox.ac.uk/objects/uuid%3Aab89bad3-13cf-40b7-8c58-396d7e36e3ee
Transcript of Image files of the World Map of Organic Agriculture may be ...

Image files of the World Map of Organic Agriculture may be downloaded from the Oxford University Research Archive (http://ora.ox.ac.uk) at:
http://ora.ox.ac.uk/objects/uuid%3Aab89bad3-13cf-40b7-8c58-396d7e36e3ee
European Journal of Social Sciences – Volume 24, Number 3 (2011)
360
A World Map of Organic Agriculture
John Paull
Institute of Social and Cultural Anthropology, University of Oxford
Email: [email protected] Tel: +44 (0)1865-589-113
Benjamin Hennig
Department of Geography, University of Sheffield
Email: [email protected]
Abstract
This paper presents a world map of organic agriculture. A Gall-Peters projection map of the world is taken as the reference map (where map areas are proportional to territorial areas). Applying the area of organic agriculture to countries, the World Map of Organic Agriculture presents countries as proportional in size to their share of the total of world organic hectares (such a map can be referred to as an equal-area cartogram or a density-equalising map). The World Map of Organic Agriculture accounts for 37.2 million hectares of organically managed agricultural land (certified organic and in-conversion organic) from 160 countries, and here distributed across the 200 territories of the reference map. The World Map of Organic Agriculture visually reveals global contiguity and regional relationships among and between the territories of the world, and highlights the regional strengths and weaknesses of the global diffusion of organic agriculture. The World Map of Organic Agriculture is generated by the Worldmapper GIS algorithm developed at the University of Sheffield as a cartographic visualisation tool. It is the first Worldmapper cartogram to proportionately represent Falkland Islands (Malvinas). Keywords: Global organic farming, certified organic agriculture, equal-area cartogram,
density-equalizing map, Worldmapper, Geographic Information Systems (GIS).
1. Introduction 1.1. Maps
The assertion that “A picture is worth ten thousand words” was presented by Fred Barnard in 1927 as a Chinese proverb, and it has by now become a maxim of modern advertising and communications. ‘Visual’ is the dominant learning modality for many, and presenting information visually enhances recall even where the visual modality is not an individual’s dominant learning modality (e.g. Constantinidou & Baker, 2002).
Visual images can carry a potency that words can struggle to match. The picture of a terrified young Vietnamese girl running from a US napalm drop during the Vietnam War summed up, in a single image, the case against the war and the misery and injustice that words and statistics could barely, and perhaps never, match (Chong, 2001).
Alfred Korzbyski (1933) made two observations about maps. Firstly, that the map is not the territory, and secondly, that it is the similarity of the structure of the map to the territory that accounts
jp
Stamp

European Journal of Social Sciences – Volume 24, Number 3 (2011)
361
for its usefulness. The process of producing a map reduces the complexity of the territory to the simplicity of the map, and this is, by definition, a lossy process. A map conceals more than it reveals, and yet it is just what it reveals that makes it interesting and perhaps, as Korzbyski suggests, useful.
Maps possess an immediacy that is lacking in tables and narrative accounts. With his epic voyage of Antipodean discovery, Matthew Flinders (1774-1814) was the first to circumnavigate and chart the coast of Australia. His narrative account runs to 613 pages, whereas, in contrast, one map, his ‘General Chart of Terra Australis or Australia’, bears tangible and immediate witness to his great achievement (Flinders, 1814).
Maps most typically reduce a three dimensional territory to a two dimensional plane. This process introduces a controlled form of distortion since the surface of a ball, for example, cannot be represented on a sheet of paper without some degree of compromise and cartographic license. All maps have implicit biases, for example, positioning Australia somewhat arbitrarily in the lower half and Europe in the upper half. US maps of the world generally have the USA placed centrally, European maps typically place Europe along the central meridian, while Australian maps typically have Australia placed centrally. And consider, if Antarctica was a republic of a hundred million citizens they would surely be demanding some better projection than the typical ones that reduce Antarctica to a squiggle scratched along the bottom of world maps.
James Gall (1885) and Arno Peters (1983), among others, have argued for a world map that represents equal areas equally. This process is achieved effectively by sliding an imaginary cylinder over the world globe, migrating the counties to the surface of the cylinder (while conserving shape and size), then cutting open the cylinder vertically, and flattening it out (and choose a scale for reproduction). This process conserves territorial area in that equal map areas represent equal territorial areas. This process does not conserve inter-regional distances, so that distances between land masses are progressively exaggerated as the poles are approached; this is an artifact of transforming the surface of a sphere to a plane. Following previously entrenched conventions, Europe may still occupy a central meridian, north is up, and the equator cuts the map horizontally (Fig.1).
A cartographic challenge of long standing has been to create equal-area cartograms (Tobler, 2004) so that map areas are proportional to some territorial parameter. The Worldmapper project (worldmapper.org) of the University of Sheffield adopts a Gall-Peters world map as its reference map - with its equal map areas representing equal territorial areas, but otherwise adopting typical Euro-centric cartographic conventions of north as up, and with Europe centrally placed (Fig.1). The Worldmapper projections replace the Gall-Peters prescription of ‘equal map areas represent equal territory areas’ with ‘equal map areas represent equal parameter densities’ where the nominated parameter is any variable that has a measurable distribution across the domain of the map (e.g. the world or a particular country) and whose presence can be measured locally, for example, population, road deaths, or military spending. An algorithm developed by Gastner & Newman (2004) achieves the appropriate resizing, and, as they assert, “produces useful, elegant, and easily readable maps” (p.7499). Colours differentiate twelve regions consistently through Worldmapper maps, and different countries within regions are distinguished by different shades of the regional colour, while regional colours follow the rainbow from red through to violet, poorest to richest, with that ordering derived from the Human Development Report (UNDP, 2004) (Fig.1). 1.2. Organic Agriculture
Organic agriculture is a set of food production protocols that have developed in parallel with chemical agriculture, and as a response to it. Rudolf Steiner presented what is arguably the first organic agriculture course to an audience of 111 farmers and others, from six continental European countries, in 1924 in what is now the Polish village of Kobierzyce (then Koberwitz) (Paull, 2011a). The course was partly a response to the growing chemicalisation of agriculture, epitomised particularly by the Haber-Bosch process which was first demonstrated by Fritz Haber and Carl Bosch in 1909. This process was rapidly industrialised and commercialised for producing nitrogenous fertilisers, as well as
European Journal of Social Sciences – Volume 24, Number 3 (2011)
362
explosives, with a vast industrial complex to convert nitrogen and hydrogen to ammonia opening in 1913 at Oppau, Germany (Charles, 2005; Nobel Foundation, 1966; Paull, 2009; Smil, 2001). The Haber-Bosch process was a great commercial success, it continues to be so, and it offered farmers cheap synthetic nitrogenous fertiliser.
Farmers at Steiner’s course formed the Agricultural Experimental Circle of the General Anthroposophical Society, to test and develop the ideas that Steiner had presented. Informed by the research of the Agricultural Experimental Circle, Ehrenfried Pfeiffer published Bio-Dynamic Farming
and Gardening in 1938 in at least five language editions: Dutch, English, French, German and Italian (Paull, 2011b; Pfeiffer, 1938). Pfeiffer’s book described to an international audience the practices of an agriculture differentiated from the prevailing paradigm of chemical agriculture.
Shortly after Pfeiffer’s book appeared, Lord Northbourne (1940) published Look to the Land in England. The book is a manifesto of organic agriculture, it introduced the term ‘organic farming’, it endorsed the results of biodynamic farming without excluding other modes of practising organic agriculture, it defined a contest of “organic versus chemical farming” (p.81), and it laid the broad philosophical underpinnings for an agriculture differentiated from chemical agriculture (Paull, 2006).
The terminology and concepts of organic farming, and of eschewing synthetic fertilisers and pesticides for the production of food, rapidly proliferated internationally. Jerome Rodale founded the first ‘organic’ periodical Organic Farming and Gardening in USA in 1942. In Sydney, Australia, the first ‘organic’ society, the Australian Organic Farming and Gardening Society was founded in 1944 and others followed (Paull, 2008). Roland Chevriot, President of the French national farmer organisation, Nature et Progrès, called a meeting in Versailles in 1972 which led to the founding of the global organics advocacy group, the International Federation of Organic Agriculture Movements (IFOAM) (Paull, 2010a). The organics sector is reportedly now valued at US$60 billion per annum (Biofach, 2011) and organic agriculture statistics are reported from 160 countries (Willer & Kilcher, 2011).
2. Methods The Worldmapper algorithm (§2.1) was applied to the data set of world organic agriculture hectares (§2.2) to produce the World Map of Organic Agriculture. To marry the 160 territories reported by Willer & Kilcher (2001) with the 200 territories of the Worldmapper cartogram algorithm, the organic hectares of six islands (accounting for 3505 hectares in total) were transferred to their governing or administering states (refer Appendix 1 for the data set mapped). The World Map of Organic Agriculture accounts for 37,235,195 organic agriculture hectares which is the aggregate of all the territorially-attributed organic agriculture hectares of Willer & Kilcher (but is slightly different from their stated total of 37,232,127 organic agriculture hectares where 3068 hectares appear to be territorily-unattributed). 2.1. World Map
A method for producing a density-equalizing map was described by Gastner & Newman (2004) and this is the method used. The Worldmapper project (worldmapper.org) relies on a world map comprising 200 territories and an algorithm to apply the variable values (in this case organic agriculture hectares) to the corresponding territories so that the territories expand or contract to achieve an equal density of the variable across the territories within the domain of the map (in this case the world map). The reference map, with equal territorial areas represented by equal map areas, appears as Figure 1.

European Journal of Social Sciences – Volume 24, Number 3 (2011)
363
Figure 1: Reference Map of the World - Gall-Peters projection
Source: www.worldmapper.org
2.2. Data Set of Organic Agriculture
Data sets of worldwide organic agriculture hectares have been published annually, as tables, since 2000 (viz. Willer & Yussefi, 2000). The present paper uses the data set published in 2011 by Willer & Kilcher (2011) which reported data from 160 territories. Data sources for that 2011 data set are various, and include government departments and certifying agencies (pp.268-286). The data are stated to be variously from: 2004; 2005; 2006; 2007; 2008; 2008/2009; Oct 2008-Sept 2009; 2009 [most commonly]; 2009/2010; and June 2010 (pp.234-237). The data set is of “organic agricultural land (including in-conversion areas)” (p.29), however Willer & Kilcher state that “some countries provided only data on the fully converted area, others only on the total organically managed agricultural land” (p.29).
The data set of organic agriculture hectares relies on the reportage of third parties who are not necessarily ‘at arms length’ since, for example, they may be local organic certifiers. Survey respondents may under-report for reasons of, for example, ignorance or confidentiality; they may over-report, for example, to intentionally inflate figures, or because an enterprise that is certified organic may be certified by several certifiers to gain access to different markets and may thereby be counted several times in aggregated data.
3. Results The density-equalising map for worldwide organic agriculture hectares is presented in Figure 2. Equal map areas (land masses) represent equal areas of organic agriculture; i.e. the density of organic hectares is constant across territories.
Figure 2: World Map of Organic Agriculture
4. Discussion and Conclusion Equal-density cartograms are a tool for presenting a fresh view of tabulated geographic data sets. Tobler (2004, p.58) makes the point that “The most common use of cartograms is solely for the display and emphasis of a geographic distribution, as a contrast to the usual geographic map”.
European Journal of Social Sciences – Volume 24, Number 3 (2011)
364
The World Map of Organic Agriculture illustrates the great unevenness of the global uptake of organic agriculture. The map is dominated by the presence of Australia which appears especially bloated, and this reflects its world leadership position in terms of its number of organic agriculture hectares. South America has a strong presence accounted for in large measure by three countries, Argentina, Brazil and Uruguay. Europe collectively has a strong presence with substantial contributions from many states, and led by Spain, Italy, Germany, UK, France, and Austria. China and India dominate the Asian representation. Africa has an eviscerated presence, Russia appears anorexic, and the Middle East is emaciated, in each case reflecting the poor diffusion of organic agriculture into these regions - and perhaps the great opportunities for future organic penetration into these territories. The map presence of the Falkland Islands (Malvinas) reflects their recent commitment to the adoption of organics (BFA, 2009) and the newfound status of the Falkland Islands as a current world leader with 36% of its agricultural land classified as organic (Paull, 2011c).
The mechanics of the equal-density cartogram mean that, for future-year maps, a country's increment in organic hectares will appear as an increment in size in a future map, provided its percentage increase in organic hectares is greater that the global percentage increase. For the past decade Australia has increased its organic hectares at a slower rate than the global rate of organic hectares increase - if that trend were to persist then Australia would appear smaller in future maps. In contrast, China and India, for example, have an rate of increase much higher than the global average over the past decade, and if this trend were to persist then a future map of organic agriculture would reflect this with larger map-presences for these countries (decadal rates of increase derivable from data: Willer & Kilcher, 2011; & Willer & Yussefi, 2001).
Oscar Wilde (1891, p.13) observed that: "A map of the world that does not include Utopia is not worth even glancing at, for it leaves out the one country at which Humanity is always landing. And when Humanity lands there, it looks out, and, seeing a better country, sets sail. Progress is the realisation of Utopias". A world conversion to organic agriculture is an aspiration of the umbrella organisation representing the organics sector (IFOAM, 2006). So, in some senses, the World Map of Organic Agriculture honours Wilde’s injunction by presenting progress towards an organics utopia, an Otopia (Paull, 2010b), while also highlighting the abundance of opportunities for the uptake and further growth of organic agriculture.
Acknowledgements The World Map of Organic Agriculture relies on data reported by a wide variety of organic certifiers and others and collected and published by FiBL (Willer & Kilcher, 2011), and on the method for producing density-equalising maps proposed by Gastner & Newman (2004) and implemented by the Worldmapper project and the SASI (Social and Spatial Inequalities) Group of the University of Sheffield. Open source high resolution image files of Figure 2 are available for download at http://ora.ox.ac.uk/objects/uuid%3Aab89bad3-13cf-40b7-8c58-396d7e36e3ee
References [1] Barnard, F. R. (1927). Chinese proverb: One picture is worth ten thousand words - Make a cake
for Bobby. Printers' Ink, 10 May, 114-115. [2] BFA. (2009). Organic farming in the Falkland Islands. Organic-Market.Info, Lauterbach,
Germany, 3 July. [3] Biofach. (2011). Global Organic Sales Approaching 60 Billion US Dollars. Biofach Newsletter,
239(7 January). [4] Charles, D. (2005). Master Mind: The rise and fall of Fritz Haber, the Nobel laureate who
launched the age of chemical warfare. New York: Ecco, HarperCollins Publishers. [5] Chong, D. (2001). The Girl in the Picture: The Story of Kim Phuc, the Photograph, and the
Vietnam War. London: Penguin.

European Journal of Social Sciences – Volume 24, Number 3 (2011)
365
[6] Constantinidou, F., & Baker, S. (2002). Stimulus modality and verbal learning in normal aging. Brain and Language, 82(3), 296-311.
[7] Flinders, M. (1814). A Voyage to Terra Australis: Undertaken for the purpose of completing
the discovery of that vast country, and prosecuted in the years 1801, 1802, and 1803, Vols I &
II (2004 edition ed.): Project Gutenberg eBook. [8] Gall, J. (1885). Use of cylindrical projections for geographical, astronomical, and scientific
purposes. Scottish Geographical Magazine, 1(4), 119–123. [9] Gastner, M. T., & Newman, M. E. J. (2004). Diffusion-based method for producing density
equalizing maps. Proceedings of the National Academy of Sciences (PNAS), 101(20), 7499-7504.
[10] IFOAM. (2006). Principles of Organic Agriculture. Bonn: International Federation of Organic Agriculture Movements (IFOAM).
[11] Korzybski, A. (1933). Science and Sanity: An Introduction to Non-Aristotelian Systems and
General Semantics. Lancaster, PA: International Non-Aristotelian Library Publishing Company.
[12] Nobel Foundation. (1966). Nobel Lectures, Chemistry 1922-1941. Amsterdam, Netherlands: Elsevier Publishing.
[13] Northbourne, Lord. (1940). Look to the Land. London: Dent. [14] Paull, J. (2006). The farm as organism: the foundational idea of organic agriculture. Journal of
Bio-Dynamics Tasmania, (80), 14-18. [15] Paull, J. (2008). The lost history of organic farming in Australia. Journal of Organic Systems,
3(2), 2-17. [16] Paull, J. (2009). A Century of Synthetic Fertilizer: 1909-2009. Journal of Bio-Dynamics
Tasmania(94), 16-21. [17] Paull, J. (2010a). From France to the World: The International Federation of Organic
Agriculture Movements (IFOAM). Journal of Social Research & Policy, 1(2), 93-102. [18] Paull, J. (2010b). The Future of Organic Agriculture: Otopia or Oblivion? Innovative Science
Editions, 1, 11-14. [19] Paull, J. (2011a). Attending the First Organic Agriculture Course: Rudolf Steiner’s Agriculture
Course at Koberwitz, 1924. European Journal of Social Sciences, 21(1), 64-70. [20] Paull, J. (2011b). Biodynamic Agriculture: The journey from Koberwitz to the World, 1924-
1938. Journal of Organic Systems, 6(1), 27-41. [21] Paull, J. (2011c). Organics Olympiad 2011: Global Indices of Leadership in Organic
Agriculture. Journal of Social and Development Sciences, 1(4), 144-150. [22] Peters, A. (1983). Die Neue Kartographie/The New Cartography. (dual text: in German and
English); Klagenfurt, Austria: Carinthia University; New York Friendship Press: Friendship Press.
[23] Pfeiffer, E. (1938). Bio-Dynamic Farming and Gardening: Soil Fertility Renewal and
Preservation (F. Heckel, Trans.). New York: Anthroposophic Press. [24] Rodale, J. I. (Ed.). (1942). Organic Farming and Gardening. Emmaus, Pennsylvania: Rodale
Press, 1(1):1-16. [25] Smil, V. (2001). Enriching the Earth: Fritz Haber, Carl Bosch, and the Transformation of
World Food Production. Cambridge, USA: The MIT Press. [26] Tobler, W. (2004). Thirty Five Years of Computer Cartograms. Annals of the Association of
American Geographers, 94, 58-73. [27] UNDP. (2004). Human Development Report 2004: Cultural liberty in today’s diverse world.
New York, NY: United Nations Development Programme (UNDP). [28] Wilde, O. (1891). The Soul of Man Under Socialism (2008 edition ed.). Whitefish, MT:
Kessinger Publishing.

European Journal of Social Sciences – Volume 24, Number 3 (2011)
366
[29] Willer, H., & Kilcher, L. (Eds.). (2011). The World of Organic Agriculture: Statistics and
Emerging Trends 2011: Bonn: International Federation of Organic Agriculture Movements (IFOAM); Frick, Switzerland: Research Institute of Organic Agriculture (FiBL).
[30] Willer, H., & Yussefi, M. (Eds.). (2000). Organic Agriculture World-Wide: Statistics and
Perspectives. Bad Durkheim, Germany: Stiftung Ökologie & Landbau (SÖL). [31] Willer, H., & Yussefi, M. (Eds.). (2001). Organic Agriculture Worldwide 2001: Statistics and
Future Prospects. Bad Durkheim, Germany: Stiftung Ökologie & Landbau (SÖL).
Appendix Table 1: The data set on which the World Map of Organic Agriculture is based (*includes Faroe Islands (12
ha); ** inc. French Guinea (2651 ha); Guadeloupe (83 ha); Martinique (141 ha); Reunion (188 ha); *** inc. Channel Islands (430 ha)). Sources: country listing from worldmapper.org with Falkland Islands added; organic agriculture hectares data from Willer & Kilcher (2011).
Country Organic Hectares
Afghanistan 63 Albania 500 Algeria 622 Andorra 2 Angola 2486 Antigua & Barbuda 0 Argentina 4397851 Armenia 600 Australia 12001724 Austria 518757 Azerbaijan 20339 Bahamas 0 Bahrain 0 Bangladesh 1162 Barbados 0 Belarus 0 Belgium 41459 Belize 1177 Benin 872 Bhutan 0 Bolivia 41004 Bosnia Herzegovina 580 Botswana 0 Brazil 1765793 Brunei Darussalam 0 Bulgaria 12320 Burkina Faso 14693 Burundi 350 Cambodia 10725 Cameroon 292 Canada 703678 Cape Verde 0 Central African Republic 0 Chad 0 Chile 82327 China 1853000 Colombia 42235 Comoros 1330 Congo 0 Cook Islands 4 Costa Rica 8058
European Journal of Social Sciences – Volume 24, Number 3 (2011)
367
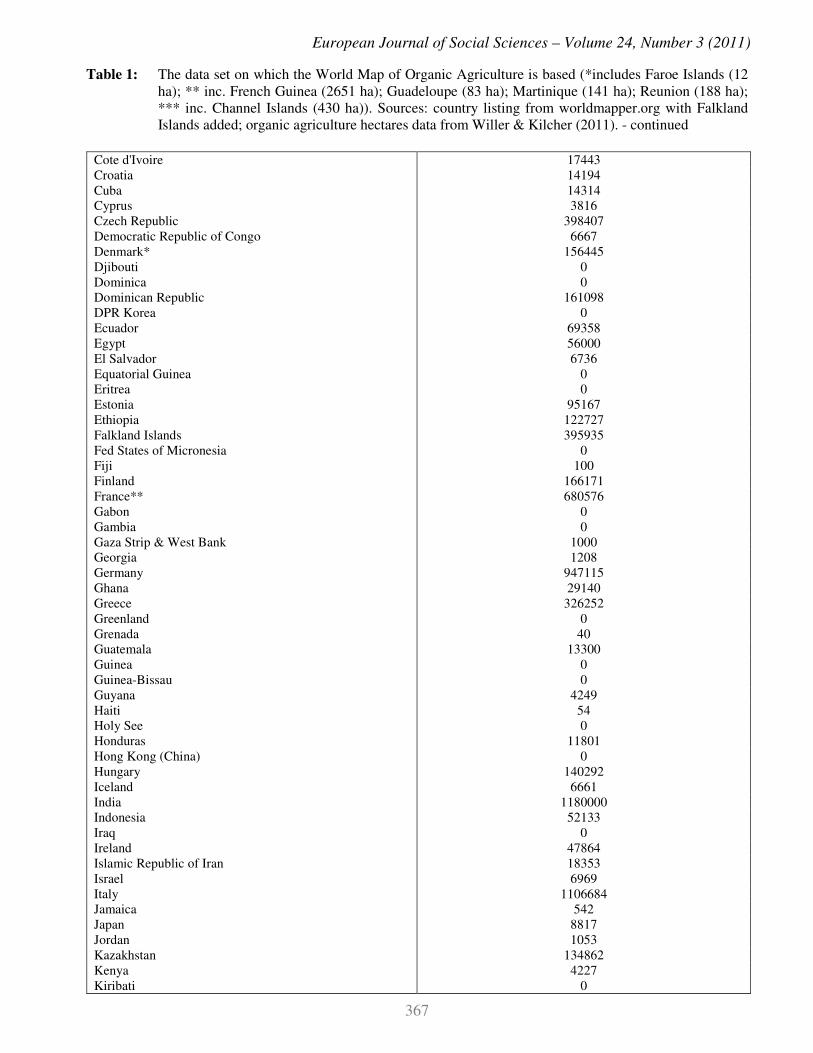
Table 1: The data set on which the World Map of Organic Agriculture is based (*includes Faroe Islands (12 ha); ** inc. French Guinea (2651 ha); Guadeloupe (83 ha); Martinique (141 ha); Reunion (188 ha); *** inc. Channel Islands (430 ha)). Sources: country listing from worldmapper.org with Falkland Islands added; organic agriculture hectares data from Willer & Kilcher (2011). - continued
Cote d'Ivoire 17443 Croatia 14194 Cuba 14314 Cyprus 3816 Czech Republic 398407 Democratic Republic of Congo 6667 Denmark* 156445 Djibouti 0 Dominica 0 Dominican Republic 161098 DPR Korea 0 Ecuador 69358 Egypt 56000 El Salvador 6736 Equatorial Guinea 0 Eritrea 0 Estonia 95167 Ethiopia 122727 Falkland Islands 395935 Fed States of Micronesia 0 Fiji 100 Finland 166171 France** 680576 Gabon 0 Gambia 0 Gaza Strip & West Bank 1000 Georgia 1208 Germany 947115 Ghana 29140 Greece 326252 Greenland 0 Grenada 40 Guatemala 13300 Guinea 0 Guinea-Bissau 0 Guyana 4249 Haiti 54 Holy See 0 Honduras 11801 Hong Kong (China) 0 Hungary 140292 Iceland 6661 India 1180000 Indonesia 52133 Iraq 0 Ireland 47864 Islamic Republic of Iran 18353 Israel 6969 Italy 1106684 Jamaica 542 Japan 8817 Jordan 1053 Kazakhstan 134862 Kenya 4227 Kiribati 0
European Journal of Social Sciences – Volume 24, Number 3 (2011)
368
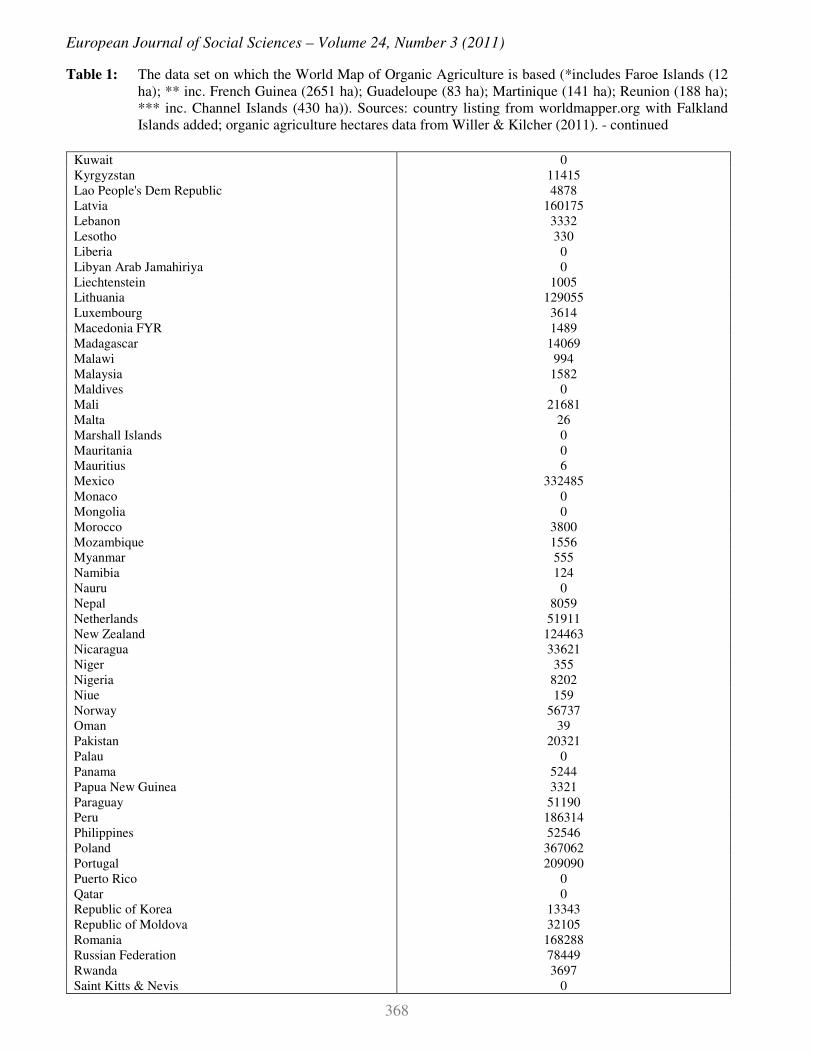
Table 1: The data set on which the World Map of Organic Agriculture is based (*includes Faroe Islands (12 ha); ** inc. French Guinea (2651 ha); Guadeloupe (83 ha); Martinique (141 ha); Reunion (188 ha); *** inc. Channel Islands (430 ha)). Sources: country listing from worldmapper.org with Falkland Islands added; organic agriculture hectares data from Willer & Kilcher (2011). - continued
Kuwait 0 Kyrgyzstan 11415 Lao People's Dem Republic 4878 Latvia 160175 Lebanon 3332 Lesotho 330 Liberia 0 Libyan Arab Jamahiriya 0 Liechtenstein 1005 Lithuania 129055 Luxembourg 3614 Macedonia FYR 1489 Madagascar 14069 Malawi 994 Malaysia 1582 Maldives 0 Mali 21681 Malta 26 Marshall Islands 0 Mauritania 0 Mauritius 6 Mexico 332485 Monaco 0 Mongolia 0 Morocco 3800 Mozambique 1556 Myanmar 555 Namibia 124 Nauru 0 Nepal 8059 Netherlands 51911 New Zealand 124463 Nicaragua 33621 Niger 355 Nigeria 8202 Niue 159 Norway 56737 Oman 39 Pakistan 20321 Palau 0 Panama 5244 Papua New Guinea 3321 Paraguay 51190 Peru 186314 Philippines 52546 Poland 367062 Portugal 209090 Puerto Rico 0 Qatar 0 Republic of Korea 13343 Republic of Moldova 32105 Romania 168288 Russian Federation 78449 Rwanda 3697 Saint Kitts & Nevis 0

European Journal of Social Sciences – Volume 24, Number 3 (2011)
369
Table 1: The data set on which the World Map of Organic Agriculture is based (*includes Faroe Islands (12 ha); ** inc. French Guinea (2651 ha); Guadeloupe (83 ha); Martinique (141 ha); Reunion (188 ha); *** inc. Channel Islands (430 ha)). Sources: country listing from worldmapper.org with Falkland Islands added; organic agriculture hectares data from Willer & Kilcher (2011). - continued
Saint Lucia 0 Samoa 9714 San Marino 0 Sao Tome & Principe 3591 Saudi Arabia 46635 Senegal 25351 Serbia & Montenegro 13264 Seychelles 0 Sierra Leone 72472 Singapore 0 Slovakia 145490 Slovenia 29388 Solomon Islands 3628 Somalia 0 South Africa 59562 Spain 1330774 Sri Lanka 21156 St Vincent & The Grenadines 0 Sudan 77798 Suriname 8 Swaziland 46 Sweden 391524 Switzerland 114050 Syrian Arab Republic 35439 Taiwan 2962 Tajikistan 70 Thailand 29597 Timor-Leste 24997 Togo 1789 Tonga 0 Trinidad & Tobago 0 Tunisia 167302 Turkey 325831 Turkmenistan 0 Tuvalu 0 Uganda 226954 Ukraine 271315 United Arab Emirates 373 United Kingdom*** 722156 United Republic of Tanzania 72188 United States 1948946 Uruguay 930965 Uzbekistan 324 Vanuatu 8996 Venezuela 337 Viet Nam 14012 Western Sahara 0 Yemen 0 Zambia 7310 Zimbabwe 421