Image enhancement for pattern recognition
9
Image enhancement for pattern recognition Quyen Huynh, Nicola Nerettia, Nathan Intratora, and Gerry Dobeckb ajustitute for Brain and Neural System, Brown University, Providence, RI 02912 bCoastal Systems Station, Naval Surface Warfare Center, Panama City, FL 32407-7001 ABSTRACT We investigate various image enhancement techniques geared towards a specific detector. Our database consists of side-scan sonar images collected at the Naval Surface Warfare Center (NSWC) , and the detector we use has proven to have excellent results on these data. We start by investigating various wavelet and wavelet packet denoising methods. Other methods we consider are based on more common filters (gaussian and DOG filters). In wavelet based denoising we try different approaches, combining techniques that have been succesfully used in signal and image denoising. We notice that the performance is mostly affected by the choice of the scale levels to which shrinkage is applied. We demonstrate that wavelet denoising can significantly improve detection performance while keeping low false alarm rates. Keywords: Image processing, Wavelets, Pattern recognition 1. METHODOLOGY Discrimination problems differ in nature from reconstruction tasks. While in reconstruction, it is the mean squared error that is often used to measure the quality of the scheme, classification requires a different measure which often is not related to the former. The discrimination power of a certain basis or a set of basis function is not necessarily connected to the quality of reconstruction associated with this set. As part of our effort to construct an integrated system for mine detection, we started investigating various image enhancement techniques which are geared towards a specific detector* that has proven to have excellent results on this data. We started by investigating various wavelet and wavelet packet denoising methods. Other methods that we have considered are based on more common filters. In particular we used a Gaussian filter with o- = 2, and a DOG filter (Difference Of Gaussians) with ui = 1 and a2 = 3. Their parameters have been chosen so as not to smear the difference between the highlight of the mine and its shadow. In the wavelet based denoising we used two different approaches. The first one is the direct application of Donoho's shrinkage1 . It consists of choosing a certain level in the wavelet representation, which we suspect, contains noise that could affect the detection, and then shrinking its coefficients. We considered two types of mother wavelets: Coifiet-5 and Symmlet-8. It is also possible to shrink at different levels and even shrink with different mother wavelets based on a careful examination of the signal. Following Coifman and Majid2, we first shrinked the coefficients at a certain level and then shrinked again at a different level the denoised (reconstructed) image from the first level. Again, we used Coifiet-5 and Symmlet-8 mother wavelets. The scales for shrinkage were chooses so as to fit approximately the mine-like targets dimension. It turned out that a good choice would include levels between the first and the third, the first level corresponding to the finest scale. 2. DESCRIPTION OF DATA The data base we used consists of a 60-image set from a side-scan sonar (SSSO) collected at the Naval Surface Warfare Center (NSWC). They are encoded as 8-bit gray scale images, 1024 range cells by 511 cross-range cells. The 60 images contain 33 targets; some contain more than one target while others contain no targets. Non-target objects which look as targets appear throughout the images. A typical mine-like target consists * Constructed by Dr. John Hyland and Dr. Gerry Dobeck from NSWC. Part of the SPIE Conference on Detection and Remediation Technologies for Mines and Minelike Targets Ill 306 Orlando, Florida • April 1998 SPIE Vol. 3392 • 0277-786X198/$10.0O
Transcript of Image enhancement for pattern recognition

Image enhancement for pattern recognition
Quyen Huynh, Nicola Nerettia, Nathan Intratora, and Gerry Dobeckbajustitute for Brain and Neural System, Brown University, Providence, RI 02912
bCoastal Systems Station, Naval Surface Warfare Center, Panama City, FL 32407-7001
ABSTRACTWe investigate various image enhancement techniques geared towards a specific detector. Our databaseconsists of side-scan sonar images collected at the Naval Surface Warfare Center (NSWC) , and the detectorwe use has proven to have excellent results on these data. We start by investigating various wavelet andwavelet packet denoising methods. Other methods we consider are based on more common filters (gaussianand DOG filters). In wavelet based denoising we try different approaches, combining techniques that havebeen succesfully used in signal and image denoising. We notice that the performance is mostly affected bythe choice of the scale levels to which shrinkage is applied. We demonstrate that wavelet denoising cansignificantly improve detection performance while keeping low false alarm rates.
Keywords: Image processing, Wavelets, Pattern recognition
1. METHODOLOGYDiscrimination problems differ in nature from reconstruction tasks. While in reconstruction, it is the meansquared error that is often used to measure the quality of the scheme, classification requires a differentmeasure which often is not related to the former. The discrimination power of a certain basis or a set ofbasis function is not necessarily connected to the quality of reconstruction associated with this set.
As part of our effort to construct an integrated system for mine detection, we started investigatingvarious image enhancement techniques which are geared towards a specific detector* that has proven to haveexcellent results on this data. We started by investigating various wavelet and wavelet packet denoisingmethods.
Other methods that we have considered are based on more common filters. In particular we used aGaussian filter with o- = 2, and a DOG filter (Difference Of Gaussians) with ui = 1 and a2 = 3. Theirparameters have been chosen so as not to smear the difference between the highlight of the mine and itsshadow.
In the wavelet based denoising we used two different approaches. The first one is the direct application ofDonoho's shrinkage1 . It consists of choosing a certain level in the wavelet representation, which we suspect,contains noise that could affect the detection, and then shrinking its coefficients. We considered two typesof mother wavelets: Coifiet-5 and Symmlet-8. It is also possible to shrink at different levels and even shrinkwith different mother wavelets based on a careful examination of the signal. Following Coifman and Majid2,we first shrinked the coefficients at a certain level and then shrinked again at a different level the denoised(reconstructed) image from the first level. Again, we used Coifiet-5 and Symmlet-8 mother wavelets. Thescales for shrinkage were chooses so as to fit approximately the mine-like targets dimension. It turned outthat a good choice would include levels between the first and the third, the first level corresponding to thefinest scale.
2. DESCRIPTION OF DATAThe data base we used consists of a 60-image set from a side-scan sonar (SSSO) collected at the Naval SurfaceWarfare Center (NSWC). They are encoded as 8-bit gray scale images, 1024 range cells by 511 cross-rangecells. The 60 images contain 33 targets; some contain more than one target while others contain no targets.Non-target objects which look as targets appear throughout the images. A typical mine-like target consists
* Constructed by Dr. John Hyland and Dr. Gerry Dobeck from NSWC.
Part of the SPIE Conference on Detection and Remediation Technologies for Mines and Minelike Targets Ill
306 Orlando, Florida • April 1998SPIE Vol. 3392 • 0277-786X198/$10.0O

Performance summary
Type of image preprocessing Pd (%) FA/ImageOriginal 91 1.17
Original 97 3.8
Gaussian 91 1.57
Coiflet-5 (1st level) 97 1.38
Symmlet-8 (1st level) 97 1.37
Coiflet-5 (2nd level) 91 0.9
Coiflet-5 (2nd level) 97 1.20
Symmlet-8 (2nd level) 97 1.22
Coiflet-5 (1st level), Symmlet-8 (2nd level) 97 1.37
Coifiet-5 (1st level), Symmlet-8 (2nd level), Coiflet-5 (3rd level) 97 1.28
Table 1: Performance of the detection stage of the AMDAC algorithm for different denoising techniques.Percent correct classification is followed by the average number of false alarms per image.
of a strong highlight on its left side and a long shadow down range on its right side. Unfortunately thepresence of clutter can mask this structure. This is clearly seen in Figure 1 which contains one of the filesused in this study.
Real sonar image data is preferred over simulated sonar data because sonar simulations are expensiveand do not capture all the critical dynamics associated with actual sonar images.
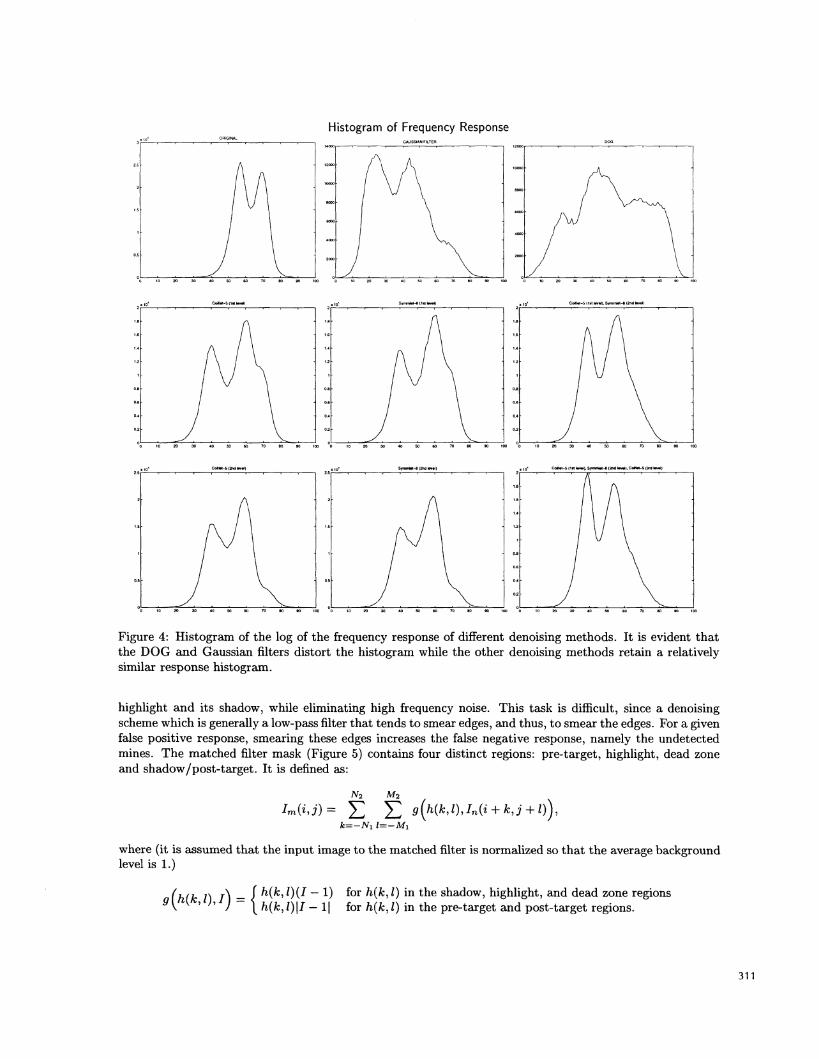
3. FREQUENCY RESPONSETo get some intuition about the effect of the denoising methods, we analyzed their frequency response beforeand after denoising. Figures 2 and 3 depict the Fourier transform of an original image (top), and of thesame image denoised with different denoising techniques (center and bottom). We note the presence of veryhigh values in the low frequency domain in the original images. A possible interpretation is the presenceof regular periodic structures (sand waves on the sea bottom, trails created by fish nets) and a correlationbetween pixels due to the slow movement of the sonar detector. The wavelet denoising had little effect onthese low frequencies. The DOG filter has a stronger effect as it behaves more like a bandpass and thus,decreases both the high and low frequency response. This behavior is better seen in the histogram of thefrequency response (Figure 4) where one can see the distortion to the histogram caused by the DOG andGaussian filters vs. the distortion caused by the wavelet denoising methods.
4. HYBRID CLASSIFICATION SCHEMETo test the effectiveness of the denoising method, we employed it in a full detection and classificationscheme. We used the detection stage of the current best scheme — the Advanced Mine Detection andClassification (AMDAC) algorithm developed at the Naval Surface Warfare Center (NSWC)3 . This schemeis a combination of a detection density algorithm applied to a non-linear matched filter response and followedby a classification feature extractor and a k-nearest neighbor (KNN) classifier.
We chose to concentrate on the detection stage since it is considered to be the most critical; Its purposeis to scan the entire image and identify candidate mine-like regions that will be more thoroughly analyzed bythe subsequent classification stages. If a mine-like region is not detected at this stage it will not be possibleto recover it afterwards.
5. MATCHED FILTER
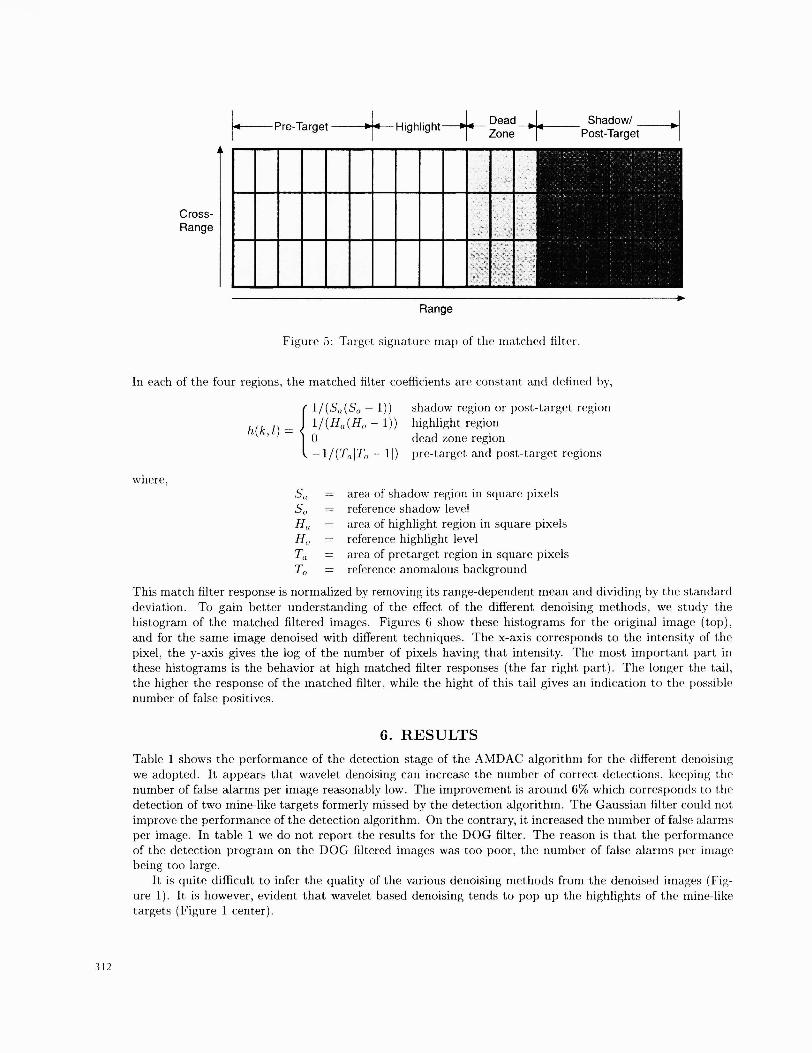
The matched filter is designed to detect a mine-like structure, a highlight with the shadow behind it( Figure 5) . Relying on the existence of a shadow can dramatically reduce the false positive response of thedetector. The challenge to a successful denoising method is to preserve this sharp distinction between mine
307

308
Sonar image si000206
Figure 1: Original image (top), wavelet denoised image (center), and Gaussian filtered image (bottom).Mine-like objects in the original image have been enclosed in white squares.

Frequency response
Figure 2: Fourier transform of the original image (top), and of the same image denoised with differentdertoising techniques (center and bottom).
3O)

310
Irequency Kesponse
Figure 3: Fourier transform of the original image (top), and of the same image denoised with differentdenoising techniques (center and bottom).
Histogram of Frequency Response
Figure 4: Histogram of the log of the frequency response of different denoisingmethods. It is evident thatthe DOG and Gaussian filters distort the histogram while the other denoising methods retain a relativelysimilar response histogram.
highlight and its shadow, while eliminating high frequency noise. This task is difficult, since a denoisingscheme which is generally a low-pass filter that tends to smear edges, and thus, to smear the edges. For a givenfalse positive response, smearing these edges increases the false negative response, namely the undetectedmines. The matched filter mask (Figure 5) contains four distinct regions: pre-target, highlight, dead zoneand shadow/post-target. It is defined as:
N2 M2
Im(,j) : g(h(k,l),In(i+k,j+l)),k=—Ni l=—M1
where (it is assumed that the input image to the matched filter is normalized so that the average backgroundlevel is 1.)
(wk l' I'\ — I h(k,l)(I — 1) for h(k,l) in the shadow, highlight, and dead zone regions, , — h(k,l)II — ii for h(k,l) in the pre-target and post-target regions.
311
f\
1 2
Cross-Range
_______ __________ _______ Dead ________ Shadow! _______4 Pre-Target + Highlight Zone Post-Target
In each of the four regions, the matched filter coefficients are constant and defined by,
where,
( 1/(S,,(So — 1)) shadow region or post-target region
h1k i J 1/(H,,(Ho — 1)) highlight region— 0 dead zone regionI 1/(TaT,, 1) pre-target and post-target regions
S,, = area of shadow region in square pixelsS0 = reference shadow levelH,, = area of highlight region in square pixelsH,, = reference highlight levelT,, = area of pretarget region in square pixelsT,, = reference anomalous background
This match filter response is normalized by removing its range-dependent mean and dividing by the standarddeviation. To gain better understanding of the effect of the different denoising methods, we study thehistogram of the matched filtered images. Figures 6 show these histograms for time original image (top),and for the same image denoised with different techniques. The x-axis corresponds to the intensity of thepixel, the y-axis gives the log of the number of pixels having that intensity. The most important part inthese histograms is the behavior at high matched filter responses (time far right part). The longer time tail,the higher the response of the matched filter, while the hight of this tail gives an indication to time possiblenumber of false positives.
6. RESULTSTable 1 shows the performance of the detection stage of the AMDAC algorithm for time different denoisingwe adopted. It appears that wavelet denoising can increase the number of correct detections, keeping timenumber of false alarms per image reasonably low. The improvement is around 6% which corresponds to thedetection of two mine-like targets forrmierly missed by the detection algorithm. The Gaussian filter could notimprove the performance of the detection algorithm. On the contrary, it increased the number of false alarmsper image. In table 1 we do not, report the results for the DOG filter. The reason is that time performanceof the detection program on the DOG filtered images was too poor, the number of false alarms per imagebeing too large.
It is quite difficult to infer the quality of time various denoising methods from the denoised images (Fig-ure 1). It is however, evident that wavelet based denoising tends to pop up the highlights of time mine-liketargets (Figure 1 center).
a
Range
Figure 5: Target signature nmap of time irmatchmed filter.

Figure 6: Histogram of the matched filtered image for the original image (top left), and for the same imagedenoised with different techniques. All graphics are in semilogarithmic scale.
The frequency response of all the denoising methods we tested, apart from the DOG filter, is qualitativelythe same. All of them act on the image reducing the values of high frequency coefficients. Thus, the differencein their performance is not directly linked to their frequency response but to their ability to retain higherorder structure.
The matched filtered histograms show that there is indeed a difference in the way denoising is performed.As can be seen in Figures 6, images denoised using a wavelet based technique present a shorter tail. Thismeans that the number of high value pixels in the matched filtered image is lower. Since detections areconcentrated in this region, this results in a lower number of false alarms per image. On the other hand,both the Gaussian filtered and the DOG filtered images present a tail comparable to that of the original one.
A further interpretation of the different performance is that, using a convolution filter to denoise theimage, we modify the shape of the mine-like targets as well. Thus, the matched filter in the detectionprogram is no longer optimal. On the contrary, wavelet denoising projects the image over an orthonormalbasis and shrinks only the coefficients corresponding to wavelets whose support is of the same order of themine-like targets. This does not affect the shape of the targets.
In our analysis we noticed that the performance does not depend on the type of mother wavelet used.Coiflet-5 and Symmlet-8 gave comparable results when the shrinking was applied to the same level. Theperformance is mostly affected by the choice of the level. That makes sense, since it is equivalent to choosing
313

314
the scale at which the noise is present. The best results were obtained when the second level was shrinked.So far, we have not seen an effect to the use of different wavelets at different levels.
7. ACKNOWLEDGEMENTS
This work is supported by the Office of Naval Research (code 31 1).
8. REFERENCES
1. D. L. Donoho, "De-noising by Soft-Thresholding" ,IEEE Transactions on Information Theory, 41(3),pp. 613—627, 1995.
2. R. R. Coifman and F. Majid, "Adapted waveform analysis" , Progress in Wavelet Analysis and Appli-cations (Proceedings of the International Conference "Wavelets and Applications ", Toulouse, France, June,1992), Y. Meyer and S. Roques, pp. 63—76. Editions Frontieres, B.P. 33, 91192 Gif-sur-Yvette, Cedex,France, 1993.
3. G. J. Dobeck and J.C. Hyland, "Sea Mine Detection and Classification Using Side-Looking Sonars",Proceedings of the SPIE Annual International Symposium on Aerospace/Defense Sensing, Simulation andControl, 2496, pp. 442—453, 1995.