Image analysis basics and principles
61
APPLICATION OF REMOTE SENSING AND GEOGRAPHICAL INFORMATION SYSTEM IN CIVIL ENGINEERING Date: INSTRUCTOR DR. MOHSIN SIDDIQUE ASSIST. PROFESSOR DEPARTMENT OF CIVIL ENGINEERING
-
Upload
mohsin-siddique -
Category
Engineering
-
view
277 -
download
1
Transcript of Image analysis basics and principles

APPLICATION OF REMOTE SENSING AND
GEOGRAPHICAL INFORMATION SYSTEM IN
CIVIL ENGINEERING
Date:
INSTRUCTOR
DR. MOHSIN SIDDIQUE
ASSIST. PROFESSOR
DEPARTMENT OF CIVIL ENGINEERING

� Image: A reproduction or imitation of the form of a person or thing.
Principles of image interpretation2
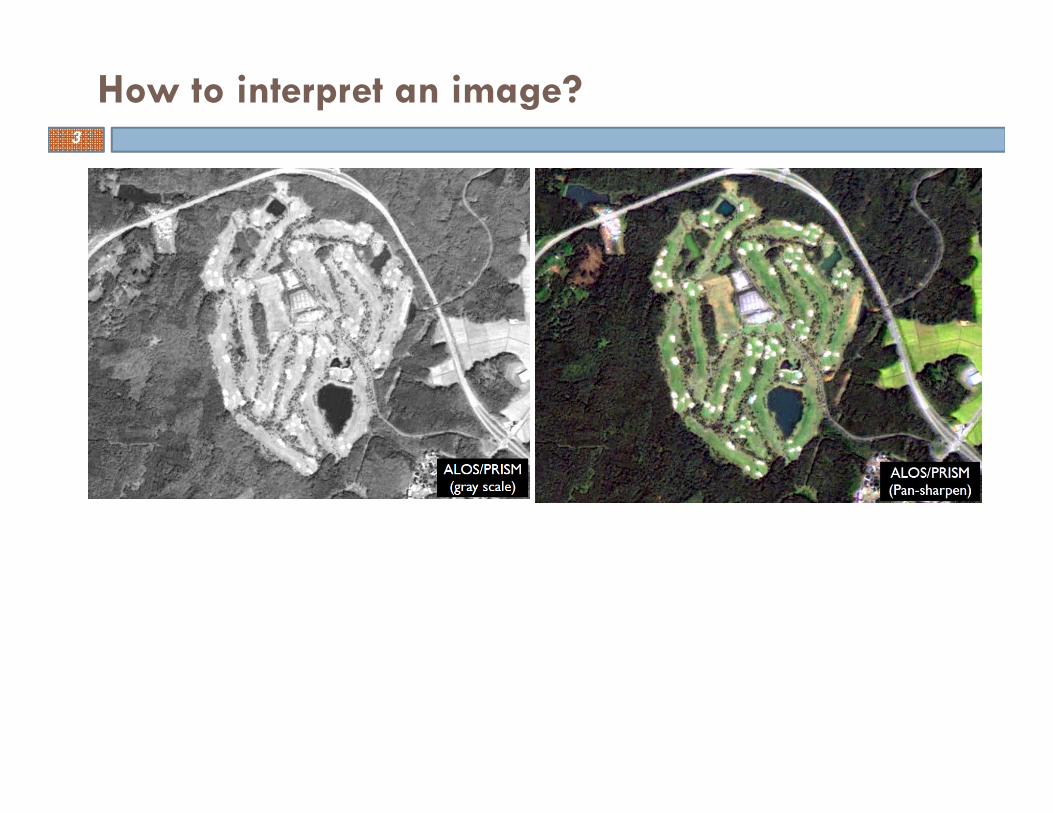
How to interpret an image?3

� Interpretation and analysis of remote sensing imagery involves theidentification and/or measurement of various targets in an image in order toextract useful information about them
Elements of image interpretation4

� This is primarily a stimulus and response activity. The stimuli arethe elements of image interpretation.
� The interpreter conveys his or her response to these stimuli withdescriptions and labels that are expressed in qualitative termse.g. likely, possible, or probable.
� Very rarely do interpreter use definite statements with regard todescribing features identified on aerial photography.
Detection and identification5
� As opposed to detection and identification, the making ofmeasurements is primarily quantitative.
� Measurements made by photo interpreters will get you close;given high quality, high resolution, large-scale aerialphotographs and appropriate interpretation tools andequipment, you can expect to be within meters.
� whereas with photogrammetry if you employ the same type ofphotography and the appropriate equipment you could expectto be within centimeters.
Measurement6

� Interpreters are often required to identify objects from a studyof associated objects that they can identify; or to identify objectcomplexes from an analysis of their component objects.
� Analysts may also be asked to examine an image, which depictsthe effects of some process, and suggest a possible or probablecause.
� A solution may not always consist of a positive identification. Theanswer may be expressed as a number of likely scenarios withstatements of probability of correctness attached by theinterpreter.
Solving a problem7

Primary ordering of image elements8

� Tone can be defined as each distinguishable variation from white toblack.
� Color may be defined as each distinguishable variation on an imageproduced by a multitude of combinations of hue, value and chroma.
� If there is not sufficient contrast between an object and it'sbackground to permit, at least, detection there can be noidentification.
� While a human interpreter may only be able to distinguish betweenten and twenty shades of gray; interpreters can distinguish at least100 times more variations of color on color photography than shadesof gray on black and white photography.
Tone/Color9

Tone/Color10

� Resolution can be defined as the ability of the entire photographicsystem, including lens, exposure, processing, and other factors, torender a sharply defined image.
� An object or feature must be resolved in order to be detected and/oridentified. Resolution is one of the most difficult concepts to address inimage analysis because it can be discussed for camera lenses in termsof so many line pairs per millimeter.
� There are resolution targets that help to determine this when testingcamera lenses for metric quality.
� Photo interpreters often talk about resolution in terms of groundresolved distance which is the smallest normal contrast object that canbe identified and measured.
Resolution11

Resolution12

� Size of objects in an image is a function of scale.
� Size can be important in discriminating objects and features (cars vs.trucks or buses, single family vs. multifamily residences, brush vs. trees,etc. ).
� In the use of size as a diagnostic characteristic both the relative andabsolute sizes of objects can be important.
Geometrical - size13

Geometrical - size14
The size of runways gives an indication of the types of aircraft thatcan be accommodated.

� Shape refers to the general form, structure, or outline of individual objects
� The shape of objects/features can provide diagnostic clues that aid identification.
� Man-made features have straight edges, natural features tend not to. Roads can have right angle (90°) turns, railroads can't.
Geometrical - shape15
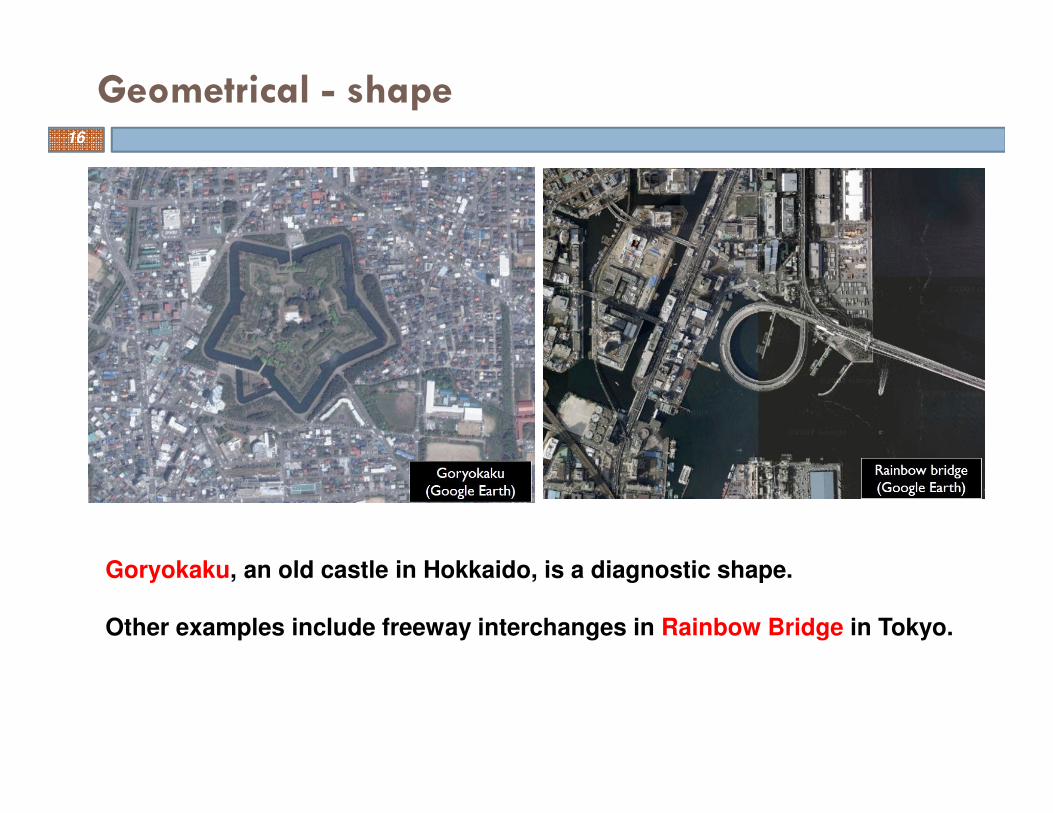
Geometrical - shape16
Goryokaku, an old castle in Hokkaido, is a diagnostic shape.
Other examples include freeway interchanges in Rainbow Bridge in Tokyo.

� Texture is the frequency of change and arrangement of tones and is amicro image characteristic.
� The visual impression of smoothness or roughness of an area can oftenbe a valuable clue in image interpretation.
� Pattern is the spatial arrangement of objects. Patterns can be eitherman-made or natural and is a macro image characteristic.
� Typically an orderly repetition of similar tones and textures willproduce a distinctive and ultimately recognizable pattern.
� Still water bodies are typically fine textured, grass medium, brushrough.
Spatial - texture and pattern17

Spatial - texture and pattern18

� Height can add significant information in many types of interpretationtasks, particularly those that deal with the analysis of man-madefeatures and vegetation.
� How deep an excavation is can tell something about the amount ofmaterial that was removed used in mining operations excavators.
� Geologists like low sun angle photography because of the featuresthat shadow patterns can help identify (e.g. fault lines and fracturepatterns).
� Infrared aerial photography shadows are typically very black andcan render targets in shadows uninterpretable.
height and shadow19

height and shadow20

height and shadow21

� Association takes into account the relationship between otherrecognizable objects or features in proximity to the target of interest
� The identification of features that one would expect to associate withother features may provide information to facilitate identification.
Association22
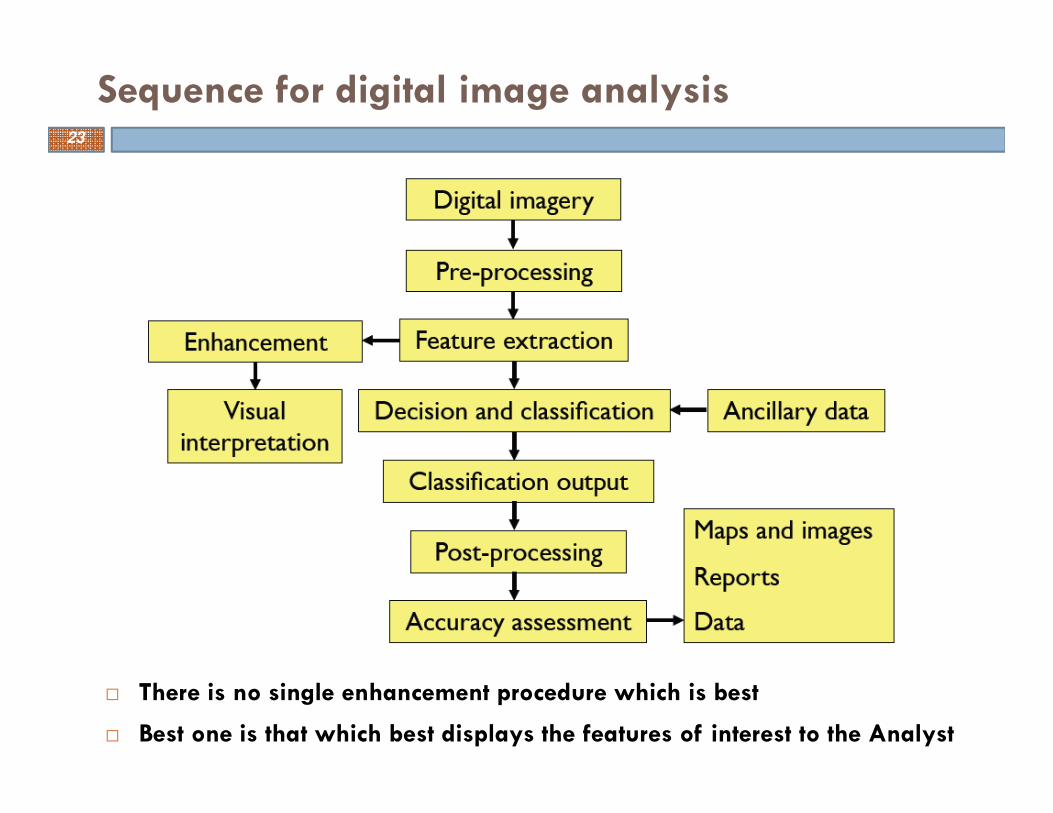
� There is no single enhancement procedure which is best
� Best one is that which best displays the features of interest to the Analyst
Sequence for digital image analysis23

� Digital image analysis is usually conducted using raster data rather than vector data which is popular in GIS.
Data format - raster and vector24

� Preprocessing functions involve those operations that are normally requiredprior to the main data analysis and extraction of information. These arereferred to as image restoration and rectification, and are intended to correctfor sensor and platform-specific radiometric and geometric distortions ofdata.
� Radiometric correction:
� to adjust digital values for physical units.
� These include correcting the data for sensor irregularities and unwantedsensor or atmospheric noise, and converting the data so they accuratelyrepresent the reflected or emitted radiation measured by the sensor
� Geometric correction:
� to bring an image into registration with a map.
� These include correcting for geometric distortions due to sensor-Earthgeometry variations, and conversion of the data to real world coordinates(e.g. latitude and longitude) on the Earth's surface.
Pre-processing25

� The first term in the below equation contains valid information about ground reflectance.
� The atmosphere interacts by adding a scattered component as path radiance.
Theoretical radiometric correction
whereLTOA = total spectral radiance measured at the top of atmosphereρ = reflectance of objectE = irradiance on object (W/m2)T = transmission of atmosphereLp = path radiance
26

� Detectors and data systems are designed to produce a linearresponse to incident spectral radiance.
� A linear fit to the calibration data results in the following relationshipbetween radiance and digital number (DN) values for any givenchannel.
Conventional radiometric correction
where DN = digital number value recordedA = slope of response function (gain)L = spectral radiance measuredB = intercept of response function (offset)
27
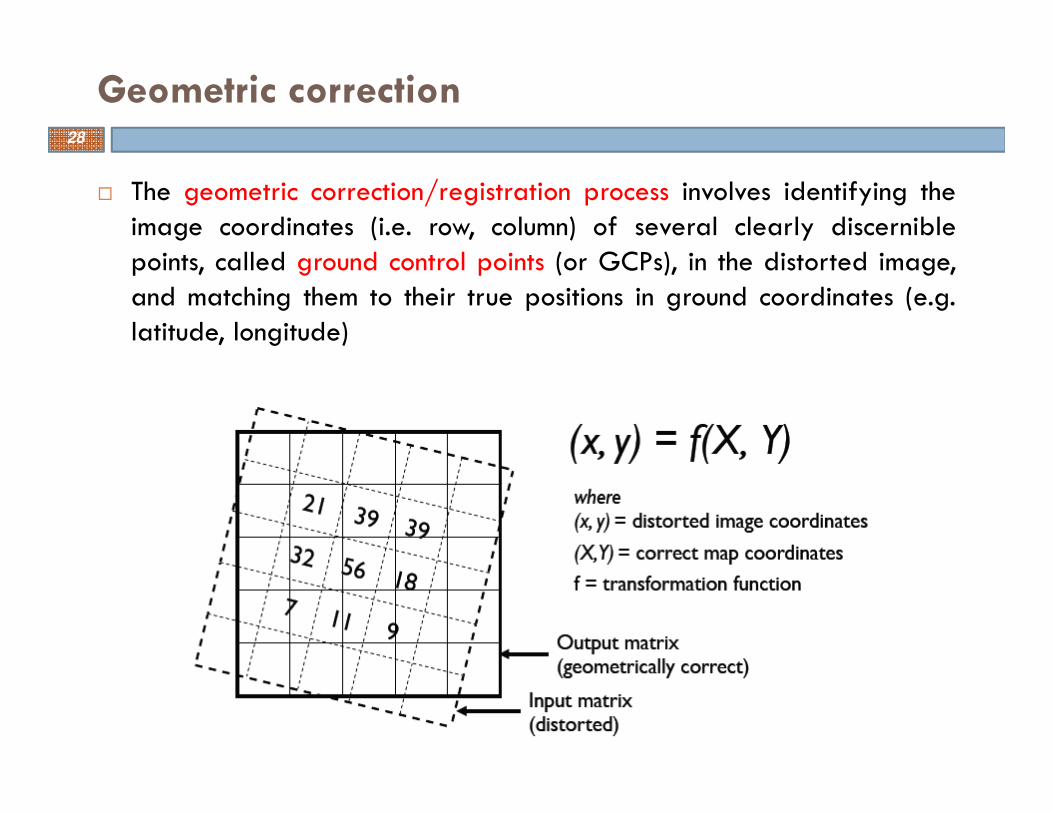
� The geometric correction/registration process involves identifying theimage coordinates (i.e. row, column) of several clearly discerniblepoints, called ground control points (or GCPs), in the distorted image,and matching them to their true positions in ground coordinates (e.g.latitude, longitude)
Geometric correction28

Geometric correction29

� In order to geometrically correct the original distorted image, aprocedure called resampling is used to determine the digital values toplace in the new pixel locations of the corrected output image.
� The resampling process calculates the new pixel values from theoriginal digital pixel values in the uncorrected image
Geometric correction30

� There are three common methods for resampling
� Nearest neighbor (NN): simply chooses the actual pixel nearest to thepoint located in the image.
� Bilinear (BL): uses three linear interpolations over the four surroundingpixels.
� Cubic convolution (CC): uses cubic polynomials fitting with thesurrounding sixteen pixels.
Interpolation methods31

Comparison of interpolation methods32

� In the context of digital image analysis, feature extraction is not
geographical features but is rather statistical characteristics of animage.
� Feature extraction is to isolate the components within multi-spectralbands that are most useful in portraying the essential elements of animage.
� It reduces the number of bands to be analyzed, thereby reducingcomputational demands and time.
Feature extraction33

� Principal component analysis (PCA) is a technique used to reducemultispectral image data sets lower dimensions for analysis.
� PCA identifies the optimum linear combination of the original channelsthat can account for variation of pixel values in an image.
Principal component analysis (PCA)
RGB false colour composit
34

Principal component analysis35
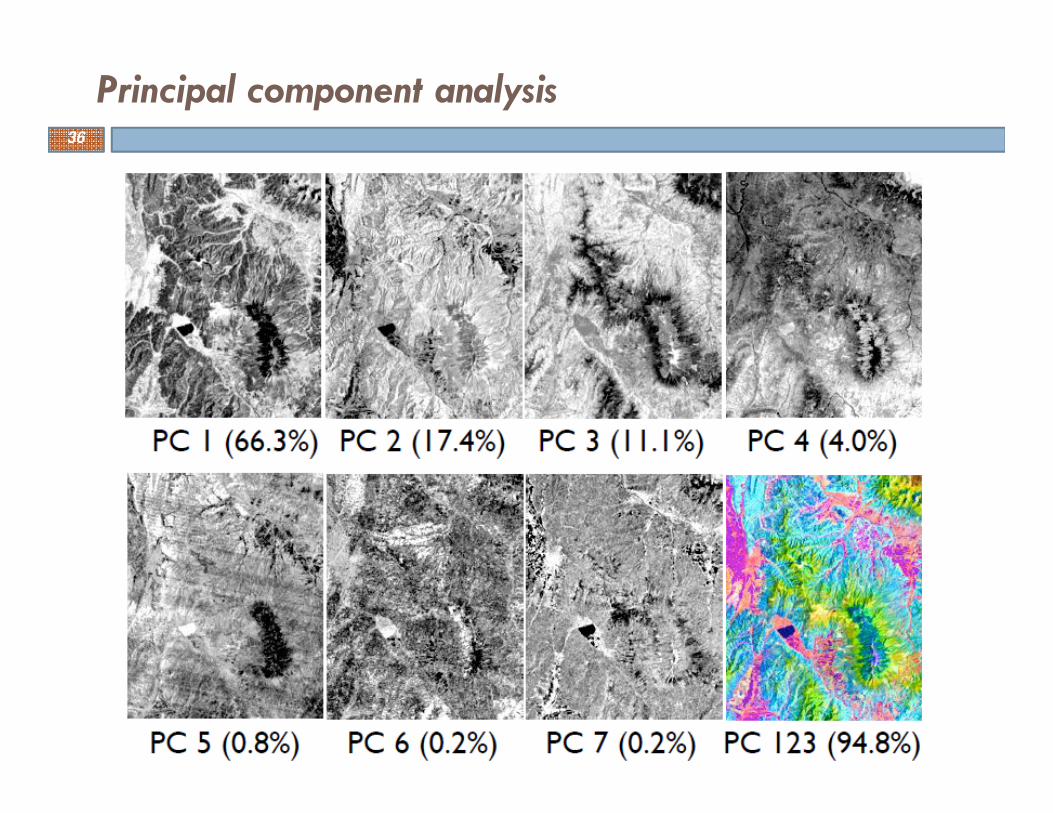
Principal component analysis36

Burnt scar mapping by PCA37

38

� Image enhancement is the process of improving
the visual appearance of digital images.
� It is usually done by contrast enhancement orhistogram manipulation
� Concept of an image histogram.
� A histogram is a graphical representation ofthe brightness values that comprise an image.
� The brightness values (i.e. 0-255) are displayedalong the x-axis of the graph.
� The frequency of occurrence of each of thesevalues in the image is shown on the y-axis
Image enhancement
There is no single enhancement procedure which is bestBest one is that which best displays the features of interest to the Analyst
39

� Linear stretch: stretch using minimum
and maximum values.
� Histogram equalization: stretch using a
nonlinear function derived fromdistribution of intensities.
� Density slicing (pseud coloring):
(Introducing color to a single-band Image)
� divide the range of values in a single band by assigning each interval into a color.
Image enhancement
Density slicing (pseud coloring):
Linear stretch:
Histogram equalization:
40

Image enhancement41

� Threshold can be applied to an image to isolate a feature represented by specific range of DNs.
Thresholding
� To calculate the area of lakes, DNs not representing water are a distraction
� Highest DN for water is 35 and is used as the threshold
� All DNs > 35 are assigned 255 (saturated to white);
� DNs<=35 are assigned zero (black)
� The lakes are much more prominent in the image after
42

� Filtering is a process that selectively enhances or suppresses particular
� wavelengths within an image
� Two approaches to digitally filtering data
� Convolution filtering in the spatial domain
� Fourier analysis in the frequency domain
Filtering Techniques43
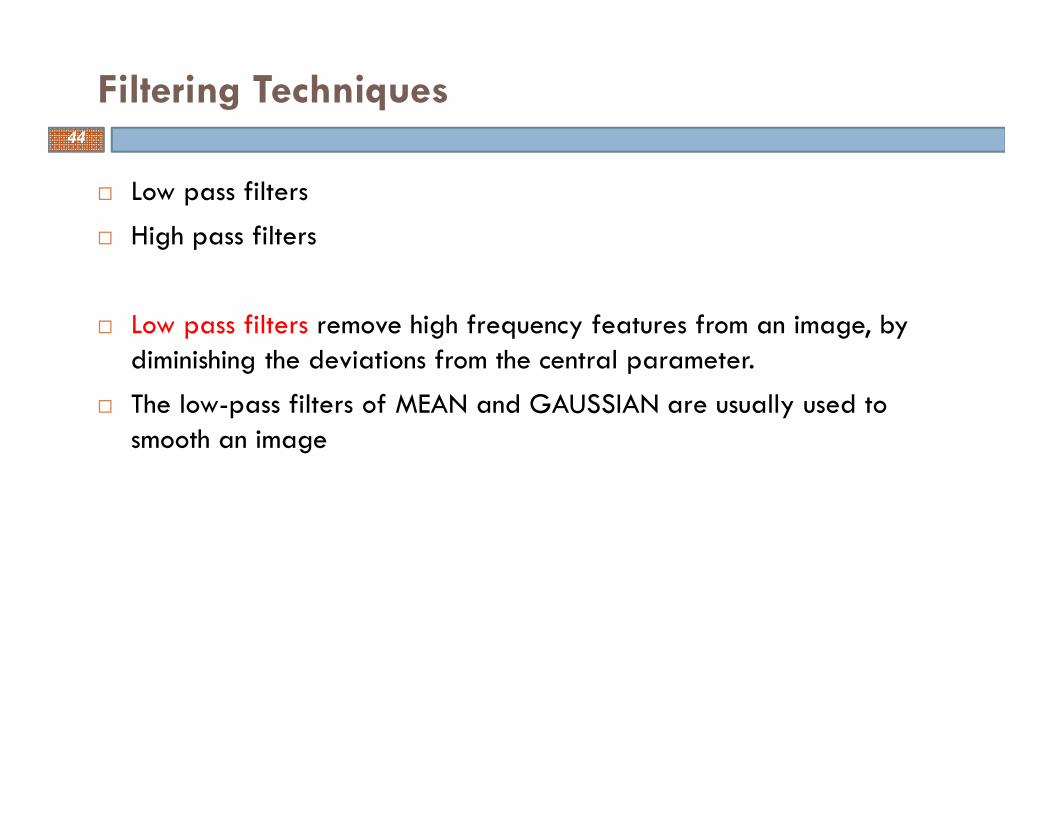
� Low pass filters
� High pass filters
� Low pass filters remove high frequency features from an image, by diminishing the deviations from the central parameter.
� The low-pass filters of MEAN and GAUSSIAN are usually used to smooth an image
Filtering Techniques44

Filtering Techniques45

� Digital image classification is the process of assigning pixels to classes.
� Since, measured reflection values in an image depend on the localcharacteristics of the earth surface; in other words there is a relationshipbetween land cover and measured reflection values
� Therefore, by comparing pixels each other, it is possible to assemble groupsof similar pixels into classes and pixels within the same class are spectrallysimilar each other, however, in practice, they have some variability withinclasses.
Digital image classification46

� Classification can be done using a single band, (single spectral classification), or using many bands (multi-spectral classification).
� Single-spectral classification
� Thresholding and level slicing
� Multi-spectral classification
� Minimum distance classifiers
� Parallelepiped classifiers
� Maximum likelihood classifiers
� Supervised Classification
� Un-Supervised Classification
Image classification approaches47

� Training fields are areas of known identify delineated on the digital image, usually by specifying a rectangular area within the digital image.
Training data48
49

Thresholding and level slicing50

Thresholding and level slicing51

Pixel observation from selected training sites52
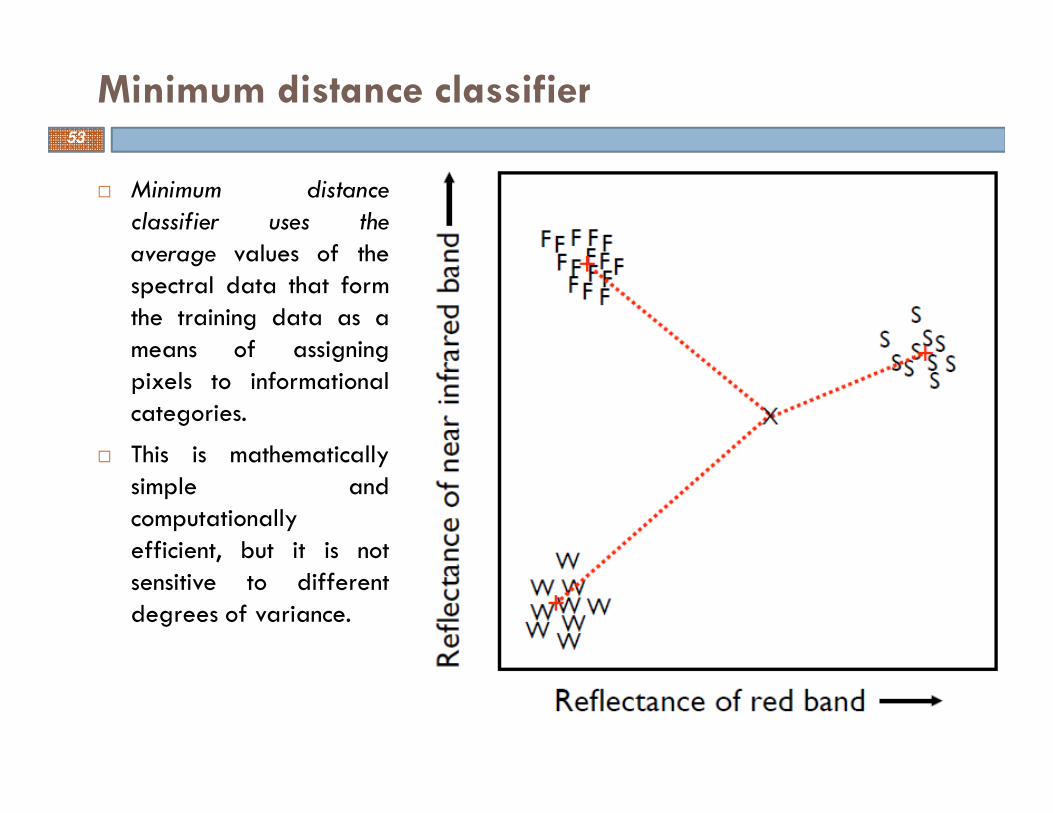
Minimum distance classifier
� Minimum distance
classifier uses the
average values of thespectral data that formthe training data as ameans of assigningpixels to informationalcategories.
� This is mathematicallysimple andcomputationallyefficient, but it is notsensitive to differentdegrees of variance.
53
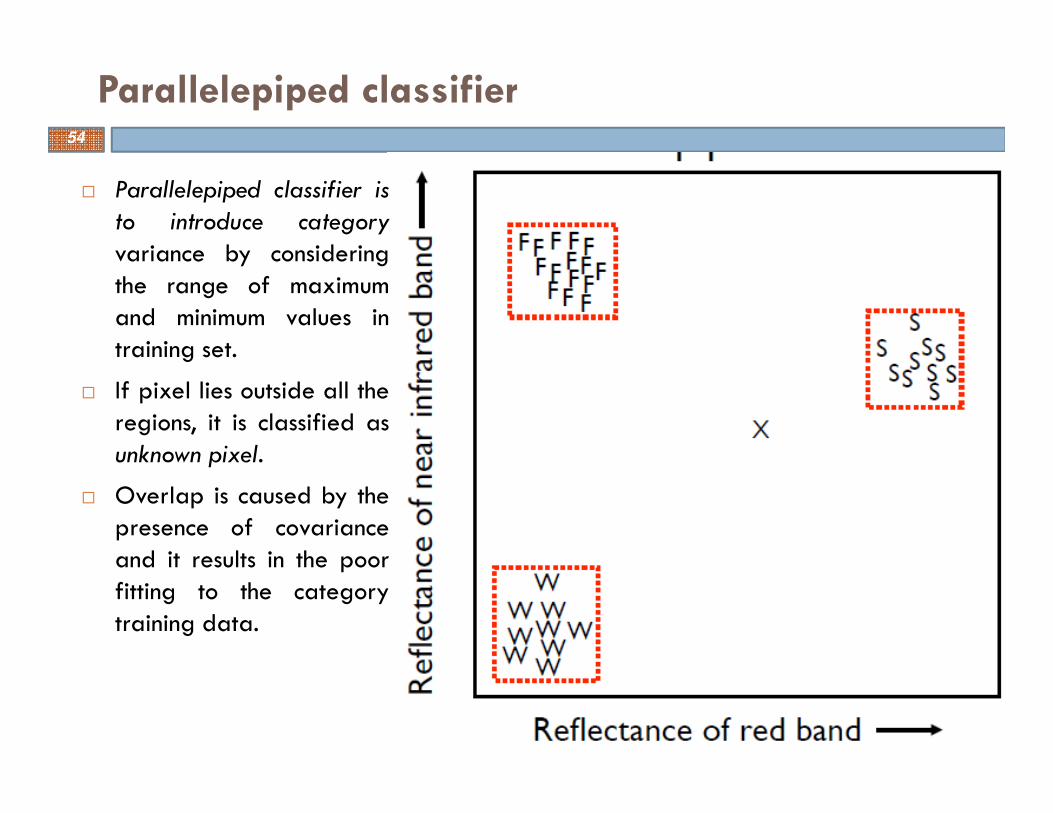
Parallelepiped classifier
� Parallelepiped classifier is
to introduce category
variance by consideringthe range of maximumand minimum values intraining set.
� If pixel lies outside all theregions, it is classified asunknown pixel.
� Overlap is caused by thepresence of covarianceand it results in the poorfitting to the categorytraining data.
54

� Maximum likelihood
classifier is to evaluate
both the categoryvariance and covariancewhen classifying anunknown pixel.
� It is based on theassumption that trainingdata is Gaussian (normaldistribution function).
� The probability densityfunctions are used toclassify an unidentifiedpixel.
Maximum likelihood classifier55

� Classified data often manifest a salt-and-pepper appearance due to the spectral variability.
� Spatial filtering is a local operation in that pixel values in an original image are modified on the basis of the gray levels of neighboring pixels.
� A moving window image processing operation is generally called convolution.
� A moving majority filter is effective for post classification smoothing to determine the majority class within the searching window.
Post classification56

Moving window concept57

Post classification smoothing58

Accuracy assessment of classification59

Geographic products60

Comments….
Questions….
Suggestions….
61
I am greatly thankful to all the information sources(regarding remote sensing and GIS) on internet that Iaccessed and utilized for the preparation of presentlecture.
Thank you !
Feel free contact