
Illustrative IFRS consolidated financial statements 2009 · Illustrative IFRS consolidated...
166
Illustrative IFRS consolidated financial statements 2009 Insurance
Transcript of Illustrative IFRS consolidated financial statements 2009 · Illustrative IFRS consolidated...

Illustrative IFRS consolidated financial statements 2009Insurance
PricewaterhouseCoopers’ IFRS and corporate governance publications and tools 2009
IFRS technical publications
IFRS pocket guide 2009Provides a summary of the IFRS recognition and measurement requirements. Including currencies, assets, liabilities, equity, income, expenses, business combinations and interim financial statements.
IFRS newsMonthly newsletter focusing on the business implications of the IASB’s proposals and new standards. Subscribe by emailing [email protected].
Illustrative interim financial information for existing preparers Illustrative information, prepared in accordance with IAS 34, for a fictional existing IFRS preparer. Includes a disclosure checklist and IAS 34 application guidance. Reflects standards issued up to 31 March 2009.
Illustrative IFRS corporate consolidated financial statements for 2009 year endsIllustrative set of consolidated financial statements for an existing preparer of IFRS. Includes an appendix showing example disclosures under IFRS 3 (revised). Included with Manual of accounting – IFRS 2010; also available separately.
Illustrative consolidated financial statements• Investment property, 2009• Private equity, 2009
• Banking, 2009• Insurance, 2009• Investment funds, 2009Realistic sets of financial statements – for existing IFRS preparers in the above sectors – illustrating the required disclosure and presentation.
Making sense of a complex world: IFRIC 13 – Customer loyalty programmesConsiders the accounting and practical implications for telecom operators that arise from the guidance in IFRIC 13, ‘Customer loyalty programmes’. Contact [email protected] for hard copies.
Questions and answers on impairment of non-financial assets in the current crisisProvides practical guidance on impairment indicators to look out for, timing of impairment tests, suggestions on how to do an impairment test in volatile markets and what disclosures are critical to the market and regulators in the current environment.
Segment reporting – an opportunity to explain the businessSix-page flyer explaining high-level issues for management to consider when applying IFRS 8, including how the standard will change reporting and what investors want to see.
Top 10 tips for impairment testingThe current economic slowdown will increase the likelihood that impairment charges will need to be taken and appropriate disclosures made. Each tip is accompanied by an explanation or illustrative example.
Manual of accounting – Financial instruments 2010Comprehensive guidance on all aspects of the requirements for financial instruments accounting. Detailed explanations illustrated through worked examples and extracts from company reports.Included with Manual of accounting – IFRS 2010; also available separately.
Manual of accounting – IFRS 2010 Global guide to IFRS providing comprehensive practical guidance on how to prepare financial statements in accordance with IFRS. Includes hundreds of worked examples and extracts from company reports. The Manual is a three-volume set comprising:• Manual of accounting – IFRS 2010• Manual of accounting – Financial instruments 2010• Illustrative IFRS corporate consolidated financial statements for 2009 year ends
A practical guide to capitalisation of borrowing costsGuidance in question and answer format addressing the challenges of applying IAS 23R, including how to treat specific versus general borrowings, when to start capitalisation and whether the scope exemptions are mandatory or optional.
A practical guide to new IFRSs for 200940-page guide providing high-level outline of the key requirements of new IFRSs effective in 2009, in question and answer format.
A practical guide to segment reporting Provides an overview of the key requirements of IFRS 8, ‘Operating segments’ and some points to consider as entities prepare for the application of this standard for the first time. See also ‘Segment reporting – an opportunity to explain the business’ below.
A practical guide to share-based paymentsAnswers the questions we have been asked by entities and includes practical examples to help management draw similarities between the requirements in the standard and their own share-based payment arrangements. November 2008.
Preparing your first IFRS financial statements: Adopting IFRSOutlines how companies should address the process of selecting their new IFRS accounting policies and applying the guidance in IFRS 1. Provides specific considerations for US market.
Financial instruments under IFRS – A guide through the maze High-level summary of IAS 32, IAS 39 and IFRS 7, updated in June 2009. For existing IFRS preparers and first-time adopters.
IAS 39 – Achieving hedge accounting in practiceCovers in detail the practical issues in achieving hedge accounting under IAS 39. It provides answers to frequently asked questions and step-by-step illustrations of how to apply common hedging strategies.
IAS 39 – Derecognition of financial assets in practiceExplains the requirements of IAS 39, providing answers to frequently asked questions and detailed illustrations of how to apply the requirements to traditional and innovative structures.
IFRS 3R: Impact on earnings – the crucial Q&A for decision-makersGuide aimed at finance directors, financial controllers and deal-makers, providing background to the standard, impact on the financial statements and controls, and summary differences with US GAAP.
IFRS disclosure checklist 2009Outlines the disclosures required by all IFRSs published up to October 2009.
Only available in electronic format. To download visit www.pwc.com/ifrs

1PricewaterhouseCoopers
Illustrative IFRS consolidated financial statements 2009 − Insurance
This publication provides an illustrative set of consolidated financial statements, prepared in accordance with International Financial Reporting Standards (IFRS), for Asfalia Insurance Group, a fictional multinational insurance group that conducts business in Euravia, the US and the UK.
The Group operates via four segments in Euravia: property, casualty, savings (comprising contracts with discretionary and non-discretionary participation) and life risk (comprising personal accident and death protection insurance). The Group operates in the property and casualty segments in the UK. In the US, it operates within the property, casualty, life risk and savings segments, excluding discretionary participation savings products. However, the US casualty policies are no longer actively underwritten and are now in run-off. The Group does not issue any contracts that would meet the definition of separate accounts as defined in US accounting literature. The Group has acquired an insurance business in the period, which was accounted for under IFRS 3 (see Note 44). The business acquired is an entity that issues investment contracts in the Euravian market and has helped the Group to increase its market share in that geographical segment.
Asfalia Insurance Group is an existing preparer of IFRS consolidated financial statements; IFRS 1, ‘First-time adoption of International Financial Reporting Standards’, is not applicable. For an illustrative set of financial statements for first-time adopters of IFRS, refer to the PricewaterhouseCoopers’ publication ‘Adopting IFRS: IFRS 1 – First time adoption of International Financial Reporting Standards’.
This publication is based on the requirements of IFRS standards and interpretations applicable to financial years beginning on or after 1 January 2009. No interpretations, standards and amendments were early adopted. The significant new requirements included in this set of financial statements is the improvement of disclosures around financial instruments (IFRS 7), detailed in Note 4.3, and the application of the IAS 39 (amendment) in regards to reclassification of financial assets, detailed in Note 11.
We have attempted to create a realistic set of financial statements for an insurance Group. This set of financial statements does however not necessarily reflect the current economical environment. Certain types of transaction have not been included, as they are not relevant to the Group’s operations. The example disclosures for some of these additional items have been included in Appendix II. Other disclosure items and transactions have been included in other publications in the ‘Illustrative’ series. See inside front cover for details.
The example disclosures should not be considered the only acceptable form of presentation. The form and content of each reporting entity’s financial statements are the responsibility of the entity’s directors and/or management. Forms of presentation alternative to those proposed in this publication and that are equally acceptable may be preferred and adopted, if they comply with the specific disclosure requirements prescribed in IFRS.
These illustrative financial statements are not a substitute for reading the standards and interpretations themselves or for professional judgement as to fairness of presentation. They do not cover all possible disclosures that IFRS requires, nor
2 PricewaterhouseCoopers
do they take account of any specific legal framework. Further information may be required in order to ensure fair presentation under IFRS. We recommend that readers refer to our publication ‘IFRS disclosure checklist 2009’. Additional accounting disclosures may be required in order to comply with local laws, national financial reporting standards and/or stock exchange regulations.
For additional guidance on presentation in the primary financial statements, see pages 1 to 22 of the ‘Illustrative IFRS consolidated corporate financial statements for 2009 year-ends’.
Structure
Asfalia Insurance Group – Illustrative IFRS consolidated insurance financial
statements 3
Independent auditors’ report 157
Appendices
Appendix I Accounting policies and disclosures not relevant to Asfalia
Insurance Group:
– Consolidated statement of cash flows – indirect method 158
– Cash generated from operations 159
– Fee income 160
Appendix II Other critical accounting estimates and judgements in applying
accounting policies 161
Format
The references in the left-hand margin of the financial statements represent the paragraph of the standards in which the disclosure requirement appears – for example, ‘8p40’ indicates IAS 8 paragraph 40. References to IFRS appear in full – for example ‘IFRS2p6’ indicates IFRS 2 paragraph 6 or ‘1Rp55’ indicates IAS 1 (revised) paragraph 55. The designation ‘DV’ (disclosure voluntary) indicates that the relevant IAS or IFRS encourages, but does not require, the disclosure. ‘IG’ refers to ‘Implementation Guidance’ attached to the relevant IFRS.
Additional notes and explanations are shown in footnotes.
All amounts that are shown in brackets are negative amounts. Due to roundings, variations/differences can occur.
3PricewaterhouseCoopers
Asfalia Insurance Group consolidated financial statements
31 December 2009
4 PricewaterhouseCoopers
Contents
Consolidated income statement 6
Consolidated statement of comprehensive income 7
Consolidated balance sheet 8
Consolidated statement of changes in equity 10
Consolidated statement of cash flows 12
Notes to the consolidated financial statements 13
1 General information 13
2 Summary of significant accounting policies 13
2.1 Basis of preparation 13
2.2 Consolidation 18
2.3 Segment reporting 19
2.4 Foreign currency translation 20
2.5 Property, plant and equipment 21
2.6 Investment properties 21
2.7 Intangible assets 22
2.8 Financial assets 24
2.9 Reclassification of financial assets 28
2.10 Impairment of assets 28
2.11 Derivative financial instruments 30
2.12 Offsetting financial instruments 32
2.13 Cash and cash equivalents 32
2.14 Share capital 32
2.15 Insurance and investment contracts – classification 32
2.16 Insurance contracts and investment contracts with DPF 33
2.17 Investment contracts without DPF 38
2.18 Borrowings 39
2.19 Current and deferred income tax 39
2.20 Employee benefits 40
2.21 Provisions 42
2.22 Revenue recognition 43
2.23 Leases 44
2.24 Dividend distribution 44
3 Critical accounting estimates and judgements 44
4 Management of insurance and financial risk 46
4.1 Insurance risk 46
4.2 Financial risk 64
4.3 Fair value estimation 93
5 Segment information 96
6 Property, plant and equipment 101
7 Investment properties 102
8 Intangible assets 103
5PricewaterhouseCoopers
9 Investments in associates 106
10 Reinsurance assets 107
11 Financial assets 108
12 Loans and receivables 112
13 Derivative financial instruments 113
14 Cash and cash equivalents 115
15 Share capital 116
16 Other reserves and equity component of discretionary participation features 118
17 Insurance liabilities and reinsurance assets 121
17.1 Development claims tables 122
17.2 Movements in insurance liabilities and reinsurance assets 126
18 Investment contract liabilities 129
19 Trade and other payables and deferred income 131
20 Borrowings 131
21 Deferred income tax 132
22 Retirement benefit obligations 135
23 Provisions for other liabilities and charges 140
24 Net insurance premium revenue 141
25 Fee income 141
26 Investment income 142
27 Net realised gains on financial assets 142
28 Net fair value gains on assets at fair value through income 142
29 Insurance benefits and claims 143
30 Investment contract benefits 143
31 Other expenses by destination 144
32 Expenses by nature 144
33 Employee benefit expense 144
34 Finance costs 145
35 Income tax expense 145
36 Net foreign exchange gains 147
37 Earnings per share 147
38 Dividends per share 148
39 Cash generated from operations 149
40 Convertible bonds 149
41 Redeemable preference shares 150
42 Contingencies 150
43 Commitments 151
44 Business combinations 151
45 Related-party transactions 153
46 Events occurring after the reporting period 155
47 Principal subsidiaries and associates 156
6 PricewaterhouseCoopers
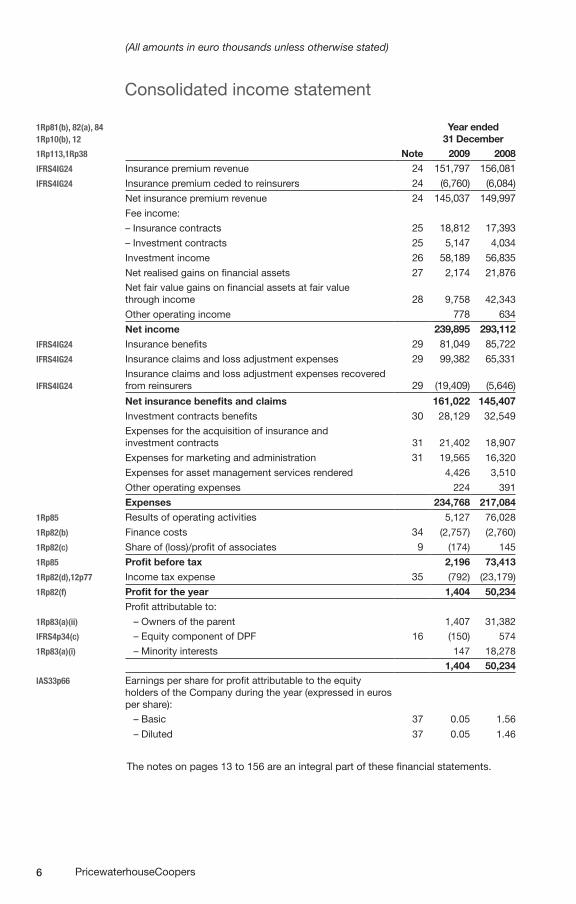
(All amounts in euro thousands unless otherwise stated)
Consolidated income statement
1Rp81(b), 82(a), 84 1Rp10(b), 12
Year ended 31 December
1Rp113,1Rp38 Note 2009 2008
IFRS4IG24 Insurance premium revenue 24 151,797 156,081IFRS4IG24 Insurance premium ceded to reinsurers 24 (6,760) (6,084)
Net insurance premium revenue 24 145,037 149,997Fee income:
– Insurance contracts 25 18,812 17,393– Investment contracts 25 5,147 4,034Investment income 26 58,189 56,835Net realised gains on financial assets 27 2,174 21,876Net fair value gains on financial assets at fair value through income 28 9,758 42,343
Other operating income 778 634Net income 239,895 293,112
IFRS4IG24 Insurance benefits 29 81,049 85,722IFRS4IG24 Insurance claims and loss adjustment expenses 29 99,382 65,331
IFRS4IG24Insurance claims and loss adjustment expenses recovered from reinsurers 29 (19,409) (5,646)
Net insurance benefits and claims 161,022 145,407Investment contracts benefits 30 28,129 32,549Expenses for the acquisition of insurance and investment contracts 31 21,402 18,907
Expenses for marketing and administration 31 19,565 16,320
Expenses for asset management services rendered 4,426 3,510
Other operating expenses 224 391
Expenses 234,768 217,084
1Rp85 Results of operating activities 5,127 76,028
1Rp82(b) Finance costs 34 (2,757) (2,760)
1Rp82(c) Share of (loss)/profit of associates 9 (174) 145
1Rp85 Profit before tax 2,196 73,413
1Rp82(d),12p77 Income tax expense 35 (792) (23,179)
1Rp82(f) Profit for the year 1,404 50,234
Profit attributable to:
1Rp83(a)(ii) – Owners of the parent 1,407 31,382
IFRS4p34(c) – Equity component of DPF 16 (150) 574
1Rp83(a)(i) – Minority interests 147 18,278
1,404 50,234IAS33p66
Earnings per share for profit attributable to the equity holders of the Company during the year (expressed in euros per share):
– Basic 37 0.05 1.56
– Diluted 37 0.05 1.46
The notes on pages 13 to 156 are an integral part of these financial statements.
7PricewaterhouseCoopers
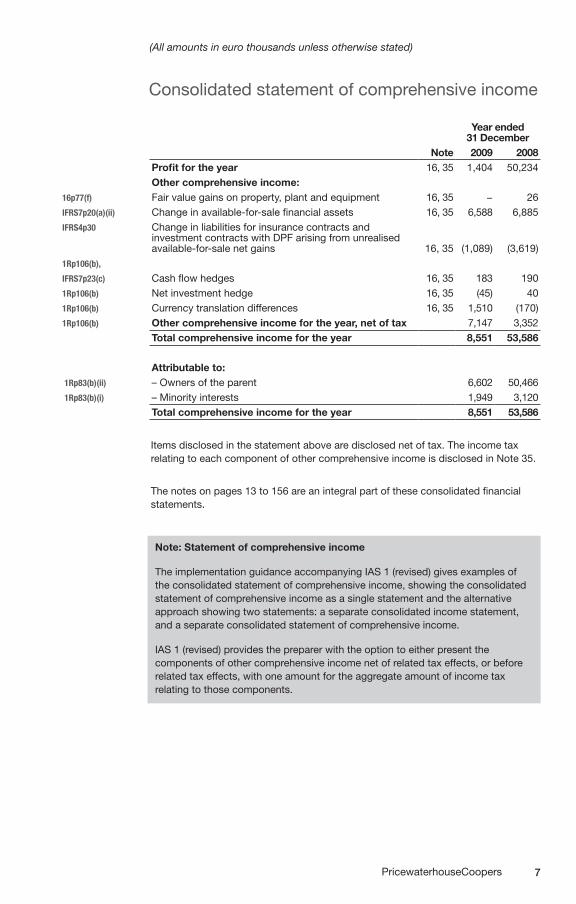
(All amounts in euro thousands unless otherwise stated)
Consolidated statement of comprehensive income
Year ended 31 December
Note 2009 2008Profit for the year 16, 35 1,404 50,234Other comprehensive income:
16p77(f) Fair value gains on property, plant and equipment 16, 35 − 26IFRS7p20(a)(ii) Change in available-for-sale financial assets 16, 35 6,588 6,885IFRS4p30
Change in liabilities for insurance contracts and investment contracts with DPF arising from unrealised available-for-sale net gains 16, 35 (1,089) (3,619)
1Rp106(b),
IFRS7p23(c) Cash flow hedges 16, 35 183 1901Rp106(b) Net investment hedge 16, 35 (45) 401Rp106(b) Currency translation differences 16, 35 1,510 (170)1Rp106(b) Other comprehensive income for the year, net of tax 7,147 3,352
Total comprehensive income for the year 8,551 53,586
Attributable to: 1Rp83(b)(ii) – Owners of the parent 6,602 50,466 1Rp83(b)(i) – Minority interests 1,949 3,120
Total comprehensive income for the year 8,551 53,586
Items disclosed in the statement above are disclosed net of tax. The income tax relating to each component of other comprehensive income is disclosed in Note 35.
The notes on pages 13 to 156 are an integral part of these consolidated financial statements.
Note: Statement of comprehensive income
The implementation guidance accompanying IAS 1 (revised) gives examples of the consolidated statement of comprehensive income, showing the consolidated statement of comprehensive income as a single statement and the alternative approach showing two statements: a separate consolidated income statement, and a separate consolidated statement of comprehensive income.
IAS 1 (revised) provides the preparer with the option to either present the components of other comprehensive income net of related tax effects, or before related tax effects, with one amount for the aggregate amount of income tax relating to those components.
8 PricewaterhouseCoopers
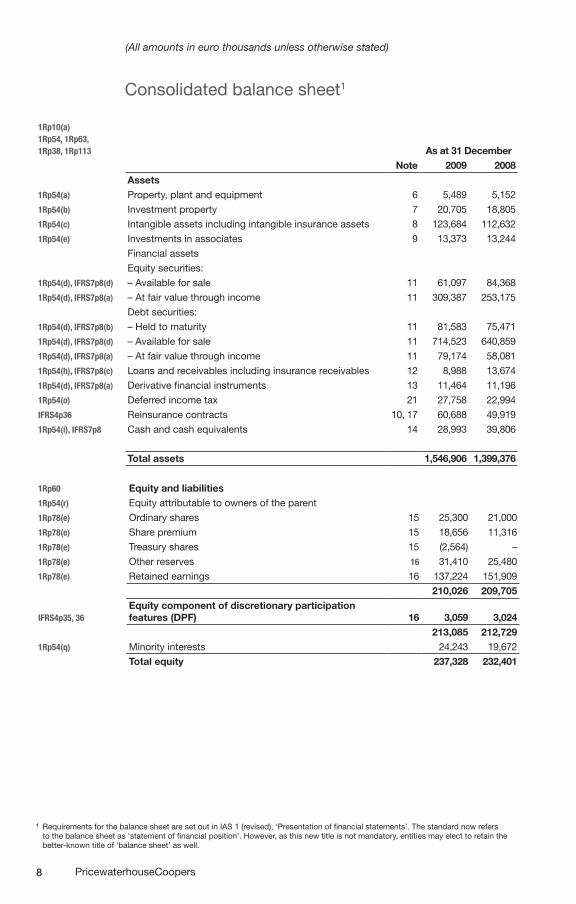
(All amounts in euro thousands unless otherwise stated)
Consolidated balance sheet1
1Rp10(a) 1Rp54, 1Rp63, 1Rp38, 1Rp113 As at 31 December
Note 2009 2008Assets
1Rp54(a) Property, plant and equipment 6 5,489 5,152
1Rp54(b) Investment property 7 20,705 18,805
1Rp54(c) Intangible assets including intangible insurance assets 8 123,684 112,632
1Rp54(e) Investments in associates 9 13,373 13,244
Financial assets
Equity securities:
1Rp54(d), IFRS7p8(d) – Available for sale 11 61,097 84,368
1Rp54(d), IFRS7p8(a) – At fair value through income 11 309,387 253,175
Debt securities:
1Rp54(d), IFRS7p8(b) – Held to maturity 11 81,583 75,471
1Rp54(d), IFRS7p8(d) – Available for sale 11 714,523 640,859
1Rp54(d), IFRS7p8(a) – At fair value through income 11 79,174 58,081
1Rp54(h), IFRS7p8(c) Loans and receivables including insurance receivables 12 8,988 13,674
1Rp54(d), IFRS7p8(a) Derivative financial instruments 13 11,464 11,196
1Rp54(o) Deferred income tax 21 27,758 22,994
IFRS4p36 Reinsurance contracts 10, 17 60,688 49,919
1Rp54(i), IFRS7p8 Cash and cash equivalents 14 28,993 39,806
Total assets 1,546,906 1,399,376
1Rp60 Equity and liabilities1Rp54(r) Equity attributable to owners of the parent
1Rp78(e) Ordinary shares 15 25,300 21,000
1Rp78(e) Share premium 15 18,656 11,316
1Rp78(e) Treasury shares 15 (2,564) –
1Rp78(e) Other reserves 16 31,410 25,480
1Rp78(e) Retained earnings 16 137,224 151,909
210,026 209,705
IFRS4p35, 36Equity component of discretionary participation features (DPF) 16 3,059 3,024
213,085 212,7291Rp54(q) Minority interests 24,243 19,672
Total equity 237,328 232,401
1 Requirements for the balance sheet are set out in IAS 1 (revised), ‘Presentation of financial statements’. The standard now refers to the balance sheet as ‘statement of financial position’. However, as this new title is not mandatory, entities may elect to retain the better-known title of ‘balance sheet’ as well.
9PricewaterhouseCoopers
(All amounts in euro thousands unless otherwise stated)
As at 31 DecemberNote 2009 2008
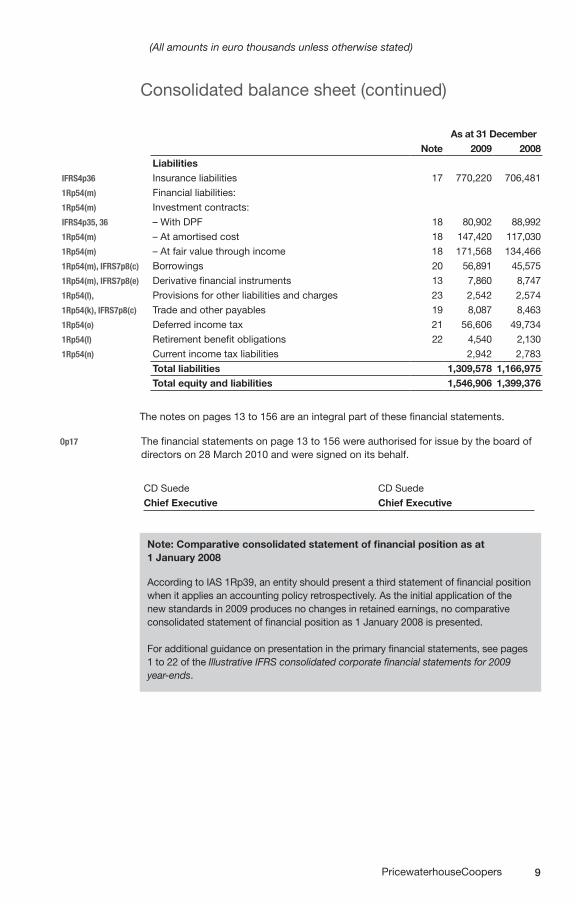
LiabilitiesIFRS4p36 Insurance liabilities 17 770,220 706,481
1Rp54(m) Financial liabilities:
1Rp54(m) Investment contracts:
IFRS4p35, 36 – With DPF 18 80,902 88,992
1Rp54(m) – At amortised cost 18 147,420 117,030
1Rp54(m) – At fair value through income 18 171,568 134,466
1Rp54(m), IFRS7p8(c) Borrowings 20 56,891 45,575
1Rp54(m), IFRS7p8(e) Derivative financial instruments 13 7,860 8,747
1Rp54(l), Provisions for other liabilities and charges 23 2,542 2,574
1Rp54(k), IFRS7p8(c) Trade and other payables 19 8,087 8,463
1Rp54(o) Deferred income tax 21 56,606 49,734
1Rp54(l) Retirement benefit obligations 22 4,540 2,130
1Rp54(n) Current income tax liabilities 2,942 2,783
Total liabilities 1,309,578 1,166,975Total equity and liabilities 1,546,906 1,399,376
The notes on pages 13 to 156 are an integral part of these financial statements.
Op17 The financial statements on page 13 to 156 were authorised for issue by the board of directors on 28 March 2010 and were signed on its behalf.
CD Suede CD Suede
Chief Executive Chief Executive
Note: Comparative consolidated statement of financial position as at 1 January 2008
According to IAS 1Rp39, an entity should present a third statement of financial position when it applies an accounting policy retrospectively. As the initial application of the new standards in 2009 produces no changes in retained earnings, no comparative consolidated statement of financial position as 1 January 2008 is presented.
For additional guidance on presentation in the primary financial statements, see pages 1 to 22 of the Illustrative IFRS consolidated corporate financial statements for 2009 year-ends.
Consolidated balance sheet (continued)
10 PricewaterhouseCoopers
(All amounts in euro thousands unless otherwise stated)
Consolidated statement of change in equity
Attributable to owners of the parent
NoteShare
capitalOther
reservesRetained earnings
Equity compo-
nent of DPF Total
Minority interests Total
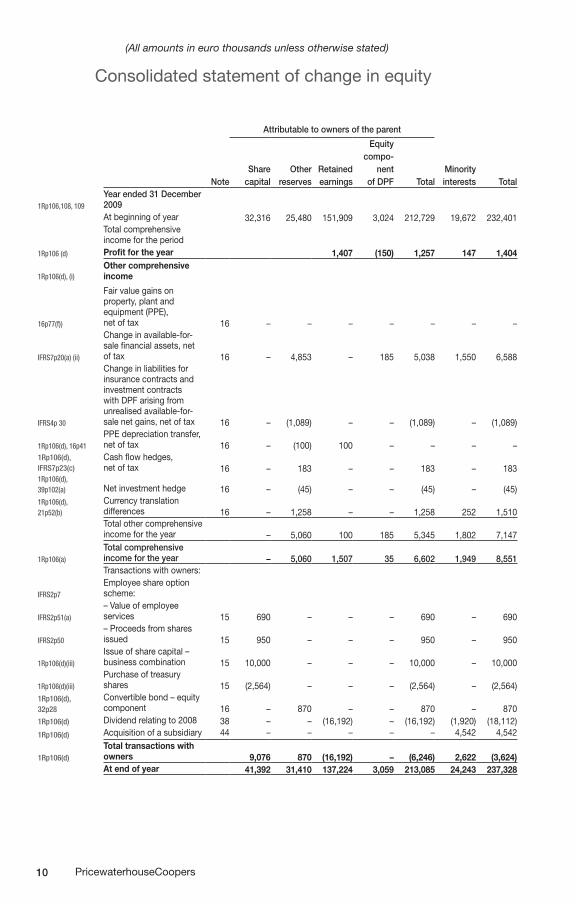
1Rp106,108, 109Year ended 31 December 2009At beginning of year 32,316 25,480 151,909 3,024 212,729 19,672 232,401Total comprehensive income for the period
1Rp106 (d) Profit for the year 1,407 (150) 1,257 147 1,404
1Rp106(d), (i)Other comprehensive income
16p77(f))
Fair value gains on property, plant and equipment (PPE), net of tax 16 – – – – – – –
IFRS7p20(a) (ii)
Change in available-for-sale financial assets, net of tax 16 – 4,853 – 185 5,038 1,550 6,588
IFRS4p 30
Change in liabilities for insurance contracts and investment contracts with DPF arising from unrealised available-for-sale net gains, net of tax 16 – (1,089) – – (1,089) – (1,089)
1Rp106(d), 16p41PPE depreciation transfer, net of tax 16 – (100) 100 – – – –
1Rp106(d), IFRS7p23(c)
Cash flow hedges, net of tax 16 – 183 – – 183 – 183
1Rp106(d), 39p102(a) Net investment hedge 16 – (45) – – (45) – (45)1Rp106(d), 21p52(b)
Currency translation differences 16 – 1,258 – – 1,258 252 1,510Total other comprehensive income for the year – 5,060 100 185 5,345 1,802 7,147
1Rp106(a)Total comprehensive income for the year – 5,060 1,507 35 6,602 1,949 8,551Transactions with owners:
IFRS2p7Employee share option scheme:
IFRS2p51(a)– Value of employee services 15 690 – – – 690 – 690
IFRS2p50– Proceeds from shares issued 15 950 – – – 950 – 950
1Rp106(d)(iii)Issue of share capital – business combination 15 10,000 – – – 10,000 – 10,000
1Rp106(d)(iii)Purchase of treasury shares 15 (2,564) – – – (2,564) – (2,564)
1Rp106(d), 32p28
Convertible bond – equity component 16 – 870 – – 870 – 870
1Rp106(d) Dividend relating to 2008 38 – – (16,192) – (16,192) (1,920) (18,112)1Rp106(d) Acquisition of a subsidiary 44 – – – – – 4,542 4,542
1Rp106(d)Total transactions with owners 9,076 870 (16,192) – (6,246) 2,622 (3,624)At end of year 41,392 31,410 137,224 3,059 213,085 24,243 237,328
11PricewaterhouseCoopers
(All amounts in euro thousands unless otherwise stated)
Consolidated statement of change in equity (continued)
Attributable to owners of the parent
1Rp10(c)
NoteShare
capitalOther
reservesRetained earnings
Equity compo-
nent of DPF Total
Minority interests
Total equity
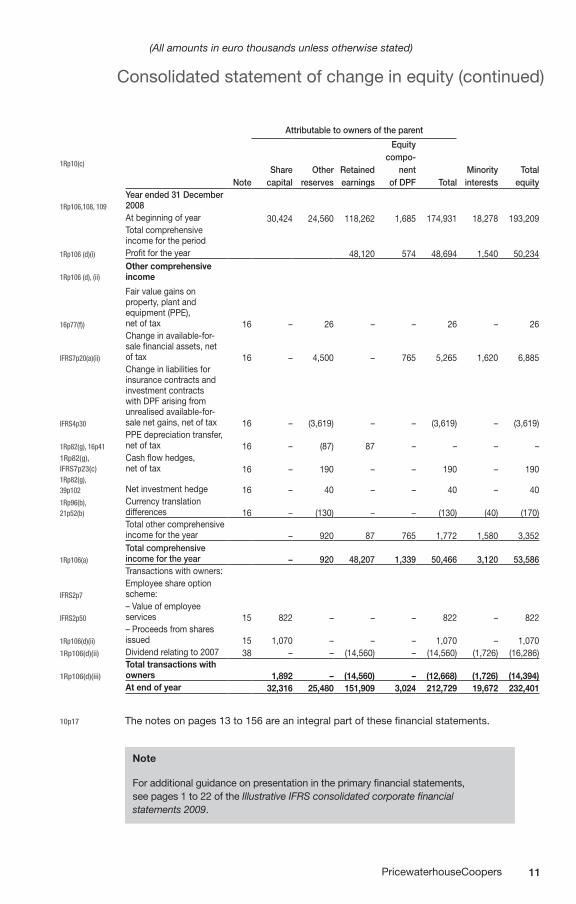
1Rp106,108, 109Year ended 31 December 2008At beginning of year 30,424 24,560 118,262 1,685 174,931 18,278 193,209Total comprehensive income for the period
1Rp106 (d)(i) Profit for the year 48,120 574 48,694 1,540 50,234
1Rp106 (d), (ii)Other comprehensive income
16p77(f))
Fair value gains on property, plant and equipment (PPE), net of tax 16 – 26 – – 26 – 26
IFRS7p20(a)(ii)
Change in available-for-sale financial assets, net of tax 16 – 4,500 – 765 5,265 1,620 6,885
IFRS4p30
Change in liabilities for insurance contracts and investment contracts with DPF arising from unrealised available-for-sale net gains, net of tax 16 – (3,619) – – (3,619) – (3,619)
1Rp82(g), 16p41PPE depreciation transfer, net of tax 16 – (87) 87 – – – –
1Rp82(g), IFRS7p23(c)
Cash flow hedges, net of tax 16 – 190 – – 190 – 190
1Rp82(g), 39p102 Net investment hedge 16 – 40 – – 40 – 401Rp96(b), 21p52(b)
Currency translation differences 16 – (130) – – (130) (40) (170)Total other comprehensive income for the year – 920 87 765 1,772 1,580 3,352
1Rp106(a)Total comprehensive income for the year – 920 48,207 1,339 50,466 3,120 53,586Transactions with owners:
IFRS2p7Employee share option scheme:
IFRS2p50– Value of employee services 15 822 – – – 822 – 822
1Rp106(d)(ii)– Proceeds from shares issued 15 1,070 – – – 1,070 – 1,070
1Rp106(d)(ii) Dividend relating to 2007 38 – – (14,560) – (14,560) (1,726) (16,286)
1Rp106(d)(iii)Total transactions with owners 1,892 – (14,560) – (12,668) (1,726) (14,394)At end of year 32,316 25,480 151,909 3,024 212,729 19,672 232,401
10p17 The notes on pages 13 to 156 are an integral part of these financial statements.
Note
For additional guidance on presentation in the primary financial statements, see pages 1 to 22 of the Illustrative IFRS consolidated corporate financial statements 2009.
12 PricewaterhouseCoopers
(All amounts in euro thousands unless otherwise stated)
Consolidated statement of cash flows
7p10, 18(b), 1Rp38 Note Year ended 31 December1Rp113 2009 2008
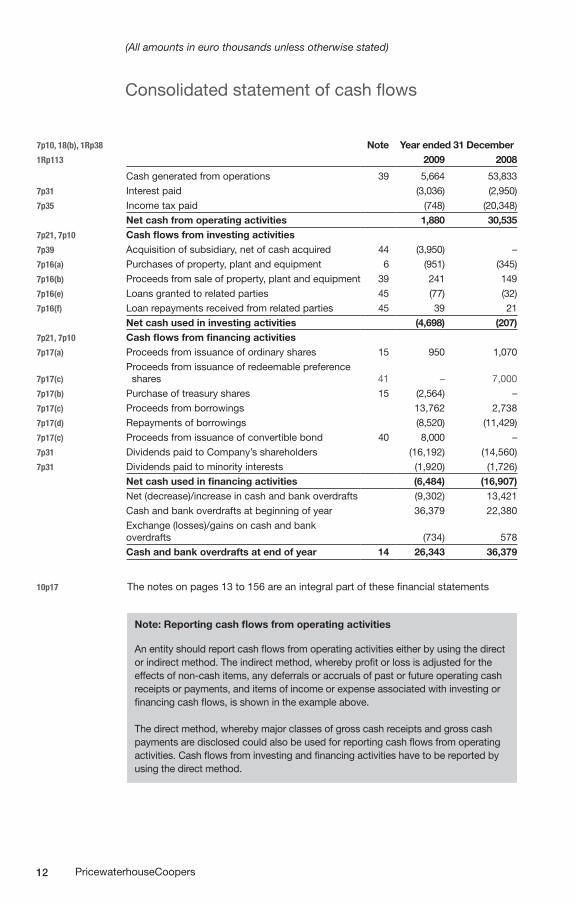
Cash generated from operations 39 5,664 53,833
7p31 Interest paid (3,036) (2,950)
7p35 Income tax paid (748) (20,348)
Net cash from operating activities 1,880 30,5357p21, 7p10 Cash flows from investing activities7p39 Acquisition of subsidiary, net of cash acquired 44 (3,950) –
7p16(a) Purchases of property, plant and equipment 6 (951) (345)
7p16(b) Proceeds from sale of property, plant and equipment 39 241 149
7p16(e) Loans granted to related parties 45 (77) (32)
7p16(f) Loan repayments received from related parties 45 39 21
Net cash used in investing activities (4,698) (207)7p21, 7p10 Cash flows from financing activities7p17(a) Proceeds from issuance of ordinary shares 15 950 1,070
7p17(c)Proceeds from issuance of redeemable preference
shares 41 – 7,000
7p17(b) Purchase of treasury shares 15 (2,564) –
7p17(c) Proceeds from borrowings 13,762 2,738
7p17(d) Repayments of borrowings (8,520) (11,429)
7p17(c) Proceeds from issuance of convertible bond 40 8,000 –
7p31 Dividends paid to Company’s shareholders (16,192) (14,560)
7p31 Dividends paid to minority interests (1,920) (1,726)
Net cash used in financing activities (6,484) (16,907)Net (decrease)/increase in cash and bank overdrafts (9,302) 13,421
Cash and bank overdrafts at beginning of year 36,379 22,380
Exchange (losses)/gains on cash and bank overdrafts (734) 578
Cash and bank overdrafts at end of year 14 26,343 36,379
10p17 The notes on pages 13 to 156 are an integral part of these financial statements
Note: Reporting cash flows from operating activities
An entity should report cash flows from operating activities either by using the direct or indirect method. The indirect method, whereby profit or loss is adjusted for the effects of non-cash items, any deferrals or accruals of past or future operating cash receipts or payments, and items of income or expense associated with investing or financing cash flows, is shown in the example above.
The direct method, whereby major classes of gross cash receipts and gross cash payments are disclosed could also be used for reporting cash flows from operating activities. Cash flows from investing and financing activities have to be reported by using the direct method.
13PricewaterhouseCoopers
(All amounts in euro thousands unless otherwise stated)Notes to the consolidated financial statements(All amounts in euro thousands unless otherwise stated)
Notes to the consolidated financial statements
1Rp138(b), (c) 1 General information
1Rp51(a), (b) Asfalia Insurance Group (‘the Company’) and its subsidiaries (together forming ‘the Group’) underwrite life and non-life insurance risks, such as those associated with death, disability, health, property and liability. The Group also issues a diversified portfolio of investment contracts to provide its customers with asset management solutions for their savings and retirement needs. All these products are offered to both domestic and foreign markets. The Group does business in Europe and the US. It has operations in Euravia, the US and the UK and employs over 1,340 people.
1Rp138(a) The Company is a limited liability company incorporated and domiciled in Euravia. The address of its registered office is: 34 Isipingo Street, Lanckdanck, Euravia.
The Company has a primary listing on the EuroMoney Stock Exchange.
10p17 These Group consolidated financial statements have been authorised for issue by the Board of Directors on 28 March 2010.
2 Summary of significant accounting policies
1Rp112(a) The principal accounting policies applied in the preparation of these consolidated1Rp117(b) financial statements are set out below. These policies have been consistently 1Rp119 applied to all the years presented, unless otherwise stated.
2.1 Basis of presentation
1Rp116 These consolidated financial statements are prepared in accordance with1Rp117(a) International Financial Reporting Standards (IFRS) as defined by IAS 1. They have
been prepared under the historical cost convention, as modified by the revaluation of land and buildings, investment property, available-for-sale financial assets, and financial assets and financial liabilities (including derivative instruments) at fair value through income.
Note: Endorsement by EU regulation
EU incorporated entities within the scope of Regulation (EC) No 1606/2002 of the European Parliament and of the Council have to prepare their financial statements in accordance with the IFRS adopted by EU Regulation. Other entities prepare their financial statements in accordance with the IFRS as issued by the IASB.
The preparation of financial statements in conformity with IFRS requires the use of certain critical accounting estimates. It also requires management to exercise its judgement in the process of applying the Company’s accounting policies. The areas involving a higher degree of judgement or complexity, or areas where assumptions and estimates are significant to the consolidated financial statements, are disclosed in Note 3.
1Rp51(d)(e) All amounts in the notes are shown in thousands of euros, rounded to the nearest thousand, unless otherwise stated.
14 PricewaterhouseCoopers
(All amounts in euro thousands unless otherwise stated)Notes to the consolidated financial statements (continued)(All amounts in euro thousands unless otherwise stated)
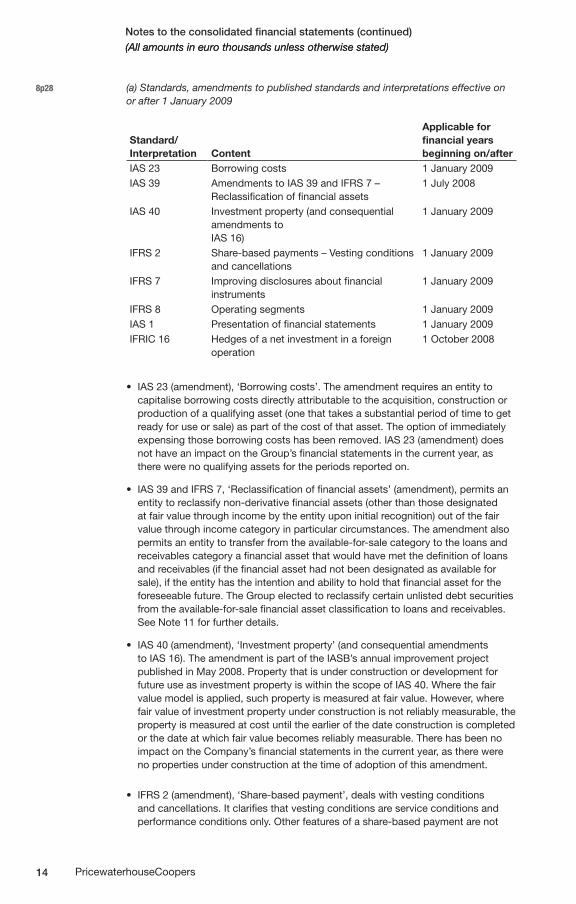
8p28 (a) Standards, amendments to published standards and interpretations effective on or after 1 January 2009
Standard/ Interpretation Content
Applicable for financial years beginning on/after
IAS 23 Borrowing costs 1 January 2009IAS 39 Amendments to IAS 39 and IFRS 7 –
Reclassification of financial assets1 July 2008
IAS 40 Investment property (and consequential amendments to IAS 16)
1 January 2009
IFRS 2 Share-based payments – Vesting conditions and cancellations
1 January 2009
IFRS 7 Improving disclosures about financial instruments
1 January 2009
IFRS 8 Operating segments 1 January 2009IAS 1 Presentation of financial statements 1 January 2009IFRIC 16 Hedges of a net investment in a foreign
operation1 October 2008
IAS 23 (amendment), ‘Borrowing costs’. The amendment requires an entity to •capitalise borrowing costs directly attributable to the acquisition, construction or production of a qualifying asset (one that takes a substantial period of time to get ready for use or sale) as part of the cost of that asset. The option of immediately expensing those borrowing costs has been removed. IAS 23 (amendment) does not have an impact on the Group’s financial statements in the current year, as there were no qualifying assets for the periods reported on.
IAS 39 and IFRS 7, ‘Reclassification of financial assets’ (amendment), permits an •entity to reclassify non-derivative financial assets (other than those designated at fair value through income by the entity upon initial recognition) out of the fair value through income category in particular circumstances. The amendment also permits an entity to transfer from the available-for-sale category to the loans and receivables category a financial asset that would have met the definition of loans and receivables (if the financial asset had not been designated as available for sale), if the entity has the intention and ability to hold that financial asset for the foreseeable future. The Group elected to reclassify certain unlisted debt securities from the available-for-sale financial asset classification to loans and receivables. See Note 11 for further details.
IAS 40 (amendment), ‘Investment property’ (and consequential amendments •to IAS 16). The amendment is part of the IASB’s annual improvement project published in May 2008. Property that is under construction or development for future use as investment property is within the scope of IAS 40. Where the fair value model is applied, such property is measured at fair value. However, where fair value of investment property under construction is not reliably measurable, the property is measured at cost until the earlier of the date construction is completed or the date at which fair value becomes reliably measurable. There has been no impact on the Company’s financial statements in the current year, as there were no properties under construction at the time of adoption of this amendment.
IFRS 2 (amendment), ‘Share-based payment’, deals with vesting conditions •and cancellations. It clarifies that vesting conditions are service conditions and performance conditions only. Other features of a share-based payment are not
15PricewaterhouseCoopers
(All amounts in euro thousands unless otherwise stated)Notes to the consolidated financial statements (continued)(All amounts in euro thousands unless otherwise stated)
vesting conditions. These features would need to be included in the grant date fair value for transactions with employees and others providing similar services; they would not impact the number of awards expected to vest or valuation thereof subsequent to grant date. All cancellations, whether by the entity or by other parties, should receive the same accounting treatment. The Group and Company has adopted IFRS 2 (amendment) from 1 January 2009. The amendment does not have a material impact on the Group or Company’s financial statements.
IFRS 7, ‘Financial instruments – Disclosures’ (amendment), requires enhanced •disclosures about fair value measurement and liquidity risk. The Group adopted the amendment to IFRS 7 with effect from 1 January 2009. This requires disclosure of fair value measurements by level of the following fair value measurement hierarchy:
Quoted prices (unadjusted) in active markets for identical assets or liabilities •(Level 1).Inputs other than quoted prices included within Level 1 that are observable •for the asset or liability, either directly (that is, as prices) or indirectly (that is, derived from prices) (Level 2). Inputs for the asset or liability that are not based on observable market data •(that is, unobservable inputs) (Level 3).
The adoption of the amendment results in additional disclosures, there is no impact on earnings per share
IFRS 8, ‘Operating segments’. IFRS 8 replaces IAS 14, ‘Segment reporting’, with •its requirement to determine primary and secondary reporting segments. Under the requirements of the new standard, the Group’s external segment reporting will be based on the internal reporting to the Group Executive Board (in its function as the chief operating decision-maker), which makes decisions on the allocation of resources and assess the performance of the reportable segments. The application of IFRS 8 does not have any material effects for the Group but has an impact on segment disclosure (for example, goodwill allocation) and on the measurement bases within segments. The segment results have been changed accordingly.
IAS 1 (revised), ‘Presentation of financial statements’, effective 1 January 2009. •The revised standard prohibits the presentation of items of income and expenses (that is, ‘non-owner changes in equity’) in the statement of changes in equity, requiring ‘non-owner changes in equity’ to be presented separately from owner changes in equity in a statement of comprehensive income. As a result, the Group presents in the consolidated statement of changes in equity all owner changes in equity, whereas all non-owner changes in equity are presented in the consolidated statement of comprehensive income. Comparative information has been re-presented so that it also conforms with the revised standard. As the change in accounting policy only impacts presentation aspects, there is no impact on earnings per share.
IFRIC 16, ‘Hedges of a net Investment in a foreign operation’, clarifies the •accounting treatment in respect of net investment hedging. This includes the fact that net investment hedging relates to differences in functional currency not presentation currency, and hedging instruments may be held anywhere in the Group. The requirements of IAS 21, ‘The effects of changes in foreign exchange rates’, do apply to the hedged item. This interpretation does not have a material impact on the Group’s financial statements.
16 PricewaterhouseCoopers
(All amounts in euro thousands unless otherwise stated)Notes to the consolidated financial statements (continued)(All amounts in euro thousands unless otherwise stated)
DV (b) Standards, amendments to published standards and interpretations early adopted by the Group
In 2009, the Group did not early adopt any new, revised or amended standards.
Note: Early adoption of standards
Where a change in accounting policy is made on the adoption of an IFRS, an entity should provide the disclosures in accordance with the specific transitional provisions of that standard and 1p39.
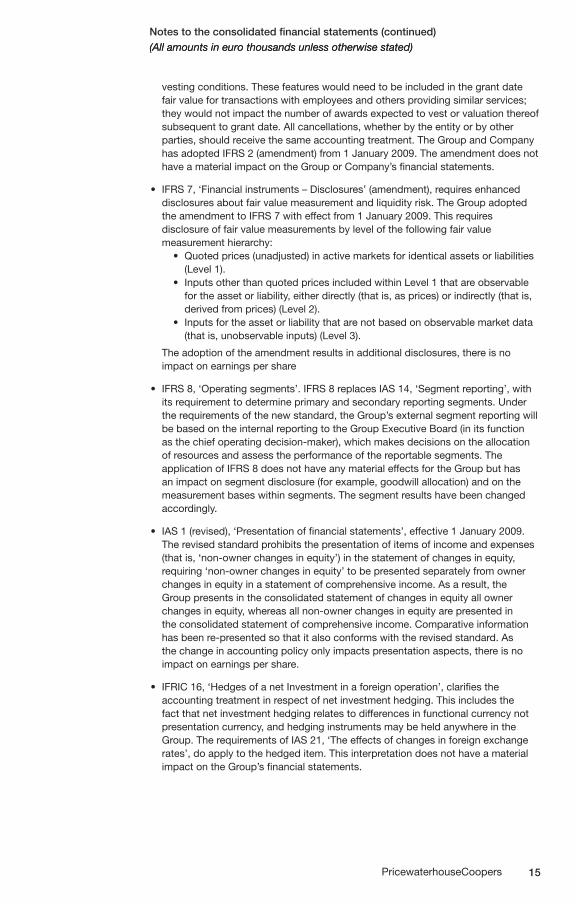
8p28 (c) Standards and interpretations effective in 2009 but not relevant to the Group’s operations
Standard/ Interpretation Content
Applicable for financial years beginning on/after
IAS 16 Property, plant and equipment (and consequential amendment to IAS 7)
1 January 2009
IAS 20
Accounting for government grants and disclosure of government assistance (amendment)
1 January 2009
IAS 29 Financial reporting in hyperinflationary economies
1 January 2009
IAS 31 Interests in joint ventures (and consequential amendments to IAS 32 and IFRS 7)
1 January 2009
IAS 32 and IAS 1
Puttable financial instruments and obligations arising on liquidation
1 January 2009
IAS 38 Intangible assets 1 January 2009IAS 41 Agriculture 1 January 2009IFRIC 13 Customer loyalty programmes 1 July 2008IFRIC 15 Agreements for the construction of real estate 1 January 2009
8p30 (d) Standards, amendments and interpretations to existing standards that are not yet effective and have not been early adopted by the Group
The following standards and amendments to existing standards have been published and are mandatory for the Group’s accounting periods beginning on or after 1 January 2010 or later periods, but the Group has not early adopted them:
Standard/ Interpretation Content
Applicable for financial years beginning on/after
IAS 1 Presentation of financial statements (amendment)
1 July 2009
IAS 24 Related party disclosures (amendment) 1 January 2011IAS 27 Consolidated and separate financial
statements (revised)1 July 2009
IAS 38 Intangible assets (amendment) 1 July 2009IAS 32 Classification of rights issues (amendment) 1 February 2010
IAS 39Financial instruments: Recognition and measurement – Eligible hedged items 1 July 2009
IFRS 3 Business combinations (revised) 1 July 2009IFRS 5
Measurement of non-current assets (or disposal groups) classified as held for sale (amendment)
1 July 2009
IFRS 9 Financial instruments 1 January 2013IFRIC 17 Distribution of non-cash assets to owners 1 July 2009IFRIC 18 Transfers of assets from customers 1 July 2009
17PricewaterhouseCoopers
(All amounts in euro thousands unless otherwise stated)Notes to the consolidated financial statements (continued)(All amounts in euro thousands unless otherwise stated)
IAS 1 (amendment), ‘Presentation of financial statements’. The amendment is •part of the IASB’s annual improvements project published in April 2009. The amendment provides clarification that the potential settlement of a liability by the issue of equity is not relevant to its classification as current or non current. By amending the definition of current liability, the amendment permits a liability to be classified as non-current (provided that the entity has an unconditional right to defer settlement by transfer of cash or other assets for at least 12 months after the accounting period) notwithstanding the fact that the entity could be required by the counterparty to settle in shares at any time. The Group and Company will apply IAS 1 (amendment) from 1 January 2010. It is not expected to have a material impact on the Group or Company’s financial statements.
IAS 24 (amendment), ‘Related party disclosures’. The amendment relaxes the •disclosures of transactions between government- related entities and clarifies related-party definition. The amendment is not expected to have an impact on the Group or Company’s financial statements.
IAS 27 (revised), ‘Consolidated and separate financial statements’. The revised •standard requires the effects of all transactions with minority interests to be recorded in equity if there is no change in control and these transactions will no longer result in goodwill or gains and losses. The standard also specifies the accounting when control is lost. Any remaining interest in the entity is re-measured to fair value, and a gain or loss is recognised in profit or loss. The group will apply IAS 27 (revised) prospectively to transactions with minority interests from 1 January 2010.
IAS 32 (amendment), ‘Classification of rights issues’. The amended standard •allows rights issues to be classified as equity when the price is denominated in a currency other than the entity’s functional currency. The amendment is effective for annual periods beginning on or after 1 February 2010 and should be applied retrospectively. The amendment is not expected to have an impact on the Group or Company’s financial statements.
IAS 38 (amendment), ‘Intangible assets’. The amendment is part of the IASB’s •annual improvements project published in April 2009. The Group and Company will apply IAS 38 (amendment) from the date IFRS 3 (revised) is adopted. The amendment clarifies guidance in measuring the fair value of an intangible asset acquired in a business combination and it permits the grouping of intangible assets as a single asset if each asset has similar useful economic lives. The amendment will not result in a material impact on the Group or Company’s financial statements.
IAS 39 (amendment), ‘Financial instruments: Recognition and measurement – •Eligible hedged items’. The amendment was issued in July 2008. It provides guidance in two situations: on the designation of a one-sided risk in a hedged item, IAS 39 concludes that a purchased option designated in its entirety as the hedging instrument of a one-sided risk will not be perfectly effective. The designation of inflation as a hedged risk or portion is not permitted unless in particular situations. It is not expected to have a material impact on the Group or Company’s financial statements.
IFRS 3 (revised), ‘Business combinations’. The revised standard continues to apply •the acquisition method to business combinations, with some significant changes. For example, all payments to purchase a business are to be recorded at fair value at the acquisition date, with contingent payments classified as debt subsequently re-measured through the income statement. There is a choice on an acquisition-by-acquisition basis to measure the minority interest in the acquiree either at fair vale or at the minority interest’s proportionate share of the acquiree’s net assets. All acquisition-related costs should be expensed. The group will apply IFRS 3 (revised) prospectively to all business combinations from 1 January 2010.
18 PricewaterhouseCoopers
(All amounts in euro thousands unless otherwise stated)Notes to the consolidated financial statements (continued)(All amounts in euro thousands unless otherwise stated)
IFRS 5 (amendment), ‘Measurement of non-current assets (or disposal groups) •classified as held for sale’. The amendment is part of the IASB’s annual improvements project published in April 2009. The amendment provides clarification that IFRS 5, ‘Non-current assets held for sale and discontinued operations’, specifies the disclosures required in respect of non-current assets (or disposal groups) classified as held for sale or discontinued operations. It also clarifies that the general requirement of IAS 1 still apply, particularly IAS 1 paragraph 15 (to achieve a fair presentation) and paragraph 125 (sources of estimation uncertainty). The Group and Company will apply IFRS 5 (amendment) from 1 January 2010. It is not expected to have a material impact on the Group or Company’s financial statements.
IFRS 9, ‘Financial instruments’. IFRS 9 addresses classification and measurement •of financial assets and is available for early adoption immediately. IFRS 9 replaces the multiple classification and measurement models in IAS 39 with a single model that has only two classification categories: amortised cost and fair value.
IFRS 9 represents the first milestone in the IASB’s planned replacement of IAS 39. IFRS 9 is expected to have a significant impact on the Group’s financial statements.
IFRIC 17, ‘Distribution of non-cash assets to owners‘. The interpretation is part •of the IASB’s annual improvements project published in April 2009. It provides guidance on accounting for arrangements whereby an entity distributes non-cash assets to shareholders either as a distribution of reserves or as dividends. IFRS 5 has also been amended to require that assets are classified as held for distribution only when they are available for distribution in their present condition and the distribution is highly probable. The Group and Company will apply IFRIC 17 from 1 January 2010. It is not expected to have a material impact on the Group or Company’s financial statements.
IFRIC 18, ‘Transfers of assets from customers‘, was issued in January 2009. It •clarifies how to account for transfers of items of property, plant and equipment by entities that receive such transfers from their customers. The interpretation also applies to agreements in which an entity receives cash from a customer when that amount of cash must be used only to construct or acquire an item of property, plant and equipment and the entity must then use that item to provide the customer with ongoing access to supply of goods and/or services. The Group is not impacted by applying IFRIC 18.
2.2 Consolidation
(a) Subsidiaries
1Rp119, Subsidiaries are all entities (including special purpose entities) over which the27p12, 14 Group has the power to govern the financial and operating policies generally27p30 accompanying a shareholding of more than one half of the voting rights. The
existence and effect of potential voting rights that are currently exercisable or convertible are considered when assessing whether the Group controls another entity. Subsidiaries are fully consolidated from the date on which control is transferred to the Group. They are de-consolidated from the date on which control ceases.
IFRS3p14, 24, 28, The Group uses the purchase method of accounting to account for the acquisition IFRS3p36, 37, of subsidiaries. The cost of an acquisition is measured as the fair value of the assetsIFRS3p51, 56 given, equity instruments issued and liabilities incurred or assumed at the date of exchange, plus costs directly attributable to the acquisition. Identifiable assets acquired and liabilities and contingent liabilities assumed in a business combination are measured initially at their fair values at the acquisition date, irrespective of the
19PricewaterhouseCoopers
(All amounts in euro thousands unless otherwise stated)Notes to the consolidated financial statements (continued)(All amounts in euro thousands unless otherwise stated)
extent of any minority interest. The excess of the cost of acquisition over the fair value of the Group’s share of the identifiable net assets acquired is recorded as goodwill (Note 2.7). If the cost of acquisition is less than the fair value of the net assets of the subsidiary acquired, the difference is recognised directly in the income statement.
27p24, 25 Intragroup transactions, balances and gains and losses on intra-group transactions27p28 are eliminated. Subsidiaries’ accounting policies have been changed where
necessary to ensure consistency with the policies adopted by the Group.
(b) Transactions and minority interest The Group applies a policy of treating transactions with minority interests as
transactions with parties external to the Group. Disposals to minority interests result in gains and losses for the Group that are recorded in the income statement. Purchases from minority interests result in goodwill, being the difference between any consideration paid and the relevant share acquired of the carrying value of net assets of the subsidiary.
(c) Associates
1Rp119 Associates are all entities over which the Group has significant influence but not28p11, 13 control, generally accompanying a shareholding of between 20% and 50% of the voting rights. Investments in associates are accounted for by the equity method
of accounting and are initially recognised at cost. The Group’s investment in associates includes goodwill (net of any accumulated impairment loss) identified on acquisition (Note 2.10(c)). None of the Group’s investments in funds that are not fully consolidated subsidiaries meets the definition of an associate. They are classified as unlisted equity securities available for sale when they are not designated to be measured at fair value through income.
28p29, 30 The Group’s share of its associates’ post-acquisition profits or losses is recognised in the income statement; its share of post-acquisition movements in reserves is
recognised in reserves. The cumulative post-acquisition movements are adjusted against the carrying amount of the investment. When the Group’s share of losses in an associate equals or exceeds its interest in the associate, including any other unsecured receivables, the Group does not recognise further losses unless it has
28p22, 26 incurred obligations or made payments on behalf of the associate. Intragroup gains on transactions between the Group and its associates are eliminated to the extent
of the Group’s interest in the associates. Intragroup losses are also eliminated unless the transaction provides evidence of an impairment of the asset transferred. Associates’ accounting policies have been changed where necessary to ensure consistency with the policies adopted by the Group.
Dilution gains and losses arising in investments in associates are recognised in the income statement.
1Rp119 2.3 Segment reporting
IFRS8p5(b) Operating segments are reported in a manner consistent with the internal reporting provided to the chief operating decision-maker. The chief operating decision-maker, which is responsible for allocating resources and assessing performance of the operating segments, has been identified as the steering committee that makes strategic decisions.
20 PricewaterhouseCoopers
Notes to the consolidated financial statements (continued)(All amounts in euro thousands unless otherwise stated)
2.4 Foreign currency translation
1Rp119 (a) Functional and presentation currency
21p17, 9, 18 Items included in the financial statements of each of the Group’s entities are1Rp51(d) measured using the currency of the primary economic environment in which the
entity operates (the ‘functional currency’). The consolidated financial statements are presented in thousands of euros (€), which is the Group’s presentation currency.
1Rp119 (b) Transactions and balances 21p21, 28 Foreign currency transactions are translated into the functional currency using21p32 the exchange rates prevailing at the dates of the transactions. Foreign exchange39p95(a), 102(a) gains and losses resulting from the settlement of such transactions and from the translation at year-end exchange rates of monetary assets and liabilities
denominated in foreign currencies are recognised in the income statement, except when deferred in equity as qualifying cash flow hedges and qualifying net investment hedges. Foreign exchange gains and losses that relate to borrowings and cash and cash equivalents are presented in the income statement within ‘finance income or cost’. All other foreign exchange gains and losses are presented in the income statement within ‘Other operating income’ or ‘Other operating expenses’.
39AG83 Changes in the fair value of monetary securities denominated in foreign currency classified as available for sale are analysed between translation differences resulting from changes in the amortised cost of the security, and other changes in the carrying amount of the security. Translation differences related to changes in amortised cost are recognised in profit or loss; other changes in carrying amount are recognised in equity.
21p30 Translation differences on financial assets and liabilities held at fair value through income are reported as part of the fair value gain or loss. Translation differences on non-monetary financial assets such as equities classified as available-for-sale financial assets are included in the fair value reserve in equity.
1Rp119 (c) Group companies
21p39 The results and financial position of all the group entities (none of which has the currency of a hyperinflationary economy) that have a functional currency different from the presentation currency are translated into the presentation currency as follows:
21p39(a) • Assetsandliabilitiesforeachbalancesheetpresentedaretranslatedatthe closing rate at the date of that balance sheet;
21p39(b) • Incomeandexpensesforeachincomestatementaretranslatedataverage exchange rates (unless this average is not a reasonable approximation of the cumulative effect of the rates prevailing on the transaction dates, in which case, income and expenses are translated at the dates of the transactions); and
1Rp79(b) • Allresultingexchangedifferencesarerecognisedasaseparatecomponentof equity.
21p39(c) On consolidation, exchange differences arising from the translation of the net1Rp79(b) investment in foreign entities, and of borrowings and other currency instruments39p102 designated as hedges of such investments, are taken to shareholders’ equity. When
a foreign operation is partially disposed of or sold, such exchange differences are recognised in the income statement as part of the gain or loss on sale.
21p47 Goodwill and fair value adjustments arising on the acquisition of a foreign entity are treated as the foreign entity’s assets and liabilities and are translated at the closing rate.
21PricewaterhouseCoopers
Notes to the consolidated financial statements (continued)(All amounts in euro thousands unless otherwise stated)
2.5 Property, plant and equipment
1Rp119 Land and buildings comprise mainly outlets and offices occupied by the Group.
16p73(a) Land and buildings are shown at fair value, based on periodic, but at least triennial,16p15, 17, 35(b) valuations by external independent appraisers, less subsequent depreciation for buildings. Any accumulated depreciation at the date of revaluation is eliminated
against the gross carrying amount of the asset, and the net amount is restated to the revalued amount of the asset. All other property, plant and equipment are stated
at historical cost less depreciation. Historical cost includes expenditure that is directly attributable to the acquisition of the items. Cost may also include transfers from equity of any gains/losses on qualifying cash flow hedges of foreign currency purchases of property, plant and equipment.
Subsequent costs are included in the asset’s carrying amount or recognised as16p12 a separate asset, as appropriate, only when it is probable that future economic39p98(b) benefits associated with the item will flow to the Group and the cost of the item can
be measured reliably. All other repairs and maintenance are charged to the income statement during the financial period in which they are incurred.
16p39 Increases in the carrying amount arising on revaluation of land and buildings are1Rp79(b) credited to the revaluation surplus in shareholders’ equity. Decreases that offset16p40, 41 previous increases of the same asset are charged against fair value reserves directly
in equity; all other decreases are charged to the income statement. Each year, the difference between depreciation based on the revalued carrying amount of the asset charged to the income statement and depreciation based on the asset’s original cost, net of any related deferred income tax, is transferred from the revaluation surplus to retained earnings.
16p73(b), (c), 50 Land is not depreciated. Depreciation on other assets is calculated using the straight-line method to allocate their cost or revalued amounts to their residual values over their estimated useful lives, as follows:
Buildings 25-40 years•Vehicles 3-5 years•Furniture, fittings and equipment 3-8 years•
16p51, 36p59 The assets’ residual values and useful lives are reviewed at the end of each reporting period and adjusted if appropriate.
An asset’s carrying amount is written down immediately to its recoverable amount
if the asset’s carrying amount is greater than its estimated recoverable amount (Note 2.10).
16p68, 71, 41 Gains and losses on disposals are determined by comparing the proceeds with the carrying amount. These are included in the income statement in operating income1Rp96 When revalued assets are sold, the amounts included in the revaluation surplus are
transferred to retained earnings.
2.6 Investment properties
1Rp54(b), 114 Property held for long-term rental yields that is not occupied by the companies in40p5, 75(b) the Group is classified as investment property. 40p75(a), (d) Investment property comprises freehold land and buildings. It is carried at fair
value. Fair value is based on active market prices, adjusted, if necessary, for any difference in the nature, location or condition of the specific asset. If this information is not available, the Group uses alternative valuation methods such as discounted
22 PricewaterhouseCoopers
(All amounts in euro thousands unless otherwise stated)Notes to the consolidated financial statements (continued)(All amounts in euro thousands unless otherwise stated)
cash flow projections or recent prices in less active markets. These valuations are reviewed annually by an independent valuation expert. Investment property that is being redeveloped for continuing use as investment property, or for which the market has become less active, continues to be measured at fair value.
40p70(f) Changes in fair values are recorded in the income statement. 40p6,25, 34 Property located on land that is held under an operating lease is classified as
investment property as long as it is held for long-term rental yields and is not occupied by the companies in the consolidated Group. The initial cost of the property is the lower of the fair value of the property and the present value of the minimum lease payments. The property is carried at fair value after initial recognition.
40p10, If an investment property becomes owner-occupied, it is reclassified as property,40p75(c) plant and equipment, and its fair value at the date of reclassification becomes its
cost for subsequent accounting purposes. 40p61 If an item of property, plant and equipment becomes an investment property
because its use has changed, any difference arising between the carrying amount and the fair value of this item at the date of transfer is recognised in equity as a
40p62(b) revaluation of property, plant and equipment. However, if a fair value gain reverses a previous impairment loss, the gain is recognised in the income statement. Upon the disposal of such investment property, any surplus previously recorded in equity is transferred to retained earnings; the transfer is not made through the income statement.
Note: Choice between fair value model and cost model
IAS 40 permits entities to choose either a fair value model, under which an investment property is measured, after initial measurement, at fair value with changes in fair value recognised in profit or loss, or a cost model. The cost model is specified in IAS 16 and requires an investment property to be measured after initial measurement at depreciated cost. An entity that chooses the cost model discloses the fair value of its investment property.
2.7 Intangible assets
1Rp119 (a) Goodwill
IFRS3p51 Goodwill represents the excess of the cost of an acquisition over the fair value38p118(a) of the Group’s share of the net identifiable assets of the acquired subsidiaryIFRS3p54 associate at the acquisition date. Goodwill on acquisition of subsidiaries is included36p124 in intangible assets. Goodwill is tested annually for impairment and carried at cost
less accumulated impairment losses. Gains and losses on the disposal of an entity include the carrying amount of goodwill relating to the entity sold.
36p80 Goodwill is allocated to cash-generating units for the purpose of impairment testing. Each of those cash-generating units represents the Group’s investment in each country of operation by each operating segment.
23PricewaterhouseCoopers
Notes to the consolidated financial statements (continued)(All amounts in euro thousands unless otherwise stated)
1Rp119 (b) Contractual customer relationships – rights to receive investment management fees
38p12(b) Incremental costs directly attributable to securing rights to receive fees for asset38p24, management services sold with investment contracts are recognised as an18Appx14B(ii) intangible asset where they can be identified separately and measured reliably and it is probable that they will be recovered.
The asset represents the Group’s contractual right to benefit from providing asset management services and is amortised on a straight-line basis over the period in which the Group expects to recognise the related revenue. The costs of securing the right to provide asset management services do not include transaction costs relating to the origination of the investment contract.
IFRS4p37(a) The accounting policy in respect of deferred acquisition costs relating to insurance contracts and investment contracts with discretionary participation features (DPF) is described in Note 2.16.
1Rp119 (c) Contractual customer relationships acquired as part of a business combination
38p12(b) As a result of certain acquisitions of investment contracts and the application38p33-34 of purchase accounting, the Group carries a customer contract intangible asset
representing the value of future profits from the acquired contracts. This asset is initially measured at fair value by estimating the net present value of future cash flows from the contracts in force at the date of acquisition. The Group subsequently amortises this asset on a straight-line basis over the estimated life of the acquired contracts. The estimated life is re-evaluated regularly.
IFRS4p37(a) The accounting policy in respect of intangible assets arising from insurance contracts
acquired in a business combination is described in Note 2.16. It also applies to the intangible assets arising from investment contracts with DPF acquired in a business combination.
1Rp119 (d) Trademarks and licences
38p74 Separately acquired trademarks and licences are shown at historical cost. 38p9 Trademarks and licences acquired in a business combination are recognised at fair38p118(a)(b) value at the acquisition date. They have a definite useful life and are carried at cost
less accumulated amortisation and impairment. Amortisation is calculated using the straight-line method to allocate the cost of trademarks and licences over.
1Rp119 (e) Computer software
38p57 Costs associated with maintaining computer software programmes are recognised as an expense as incurred. Development costs that are directly attributable to the design and testing of identifiable and unique software products controlled by the Group are recognised as intangible assets when the following criteria are met:
• Itistechnicallyfeasibletocompletethesoftwareproductsothatitwillbe available for use;
• Managementintendstocompletethesoftwareproductanduseorsellit; • Thereisanabilitytouseorsellthesoftwareproducts; • Itcanbedemonstratedhowthesoftwareproductwillgenerateprobablefuture
economic benefits; • Adequatetechnical,financialandotherresourcestocompletethedevelopment
and to use or sell the software product are available; and • Theexpenditureattributabletothesoftwareproductduringitsdevelopmentcan
be reliably measured.
24 PricewaterhouseCoopers
Notes to the consolidated financial statements (continued)(All amounts in euro thousands unless otherwise stated)
38p66 Directly attributable costs that are capitalised as part of the software product include the software development employee costs and an appropriate portion of directly attributable overheads.
38p68, 71 Other development expenditures that do not meet these criteria are recognised as an expense as incurred. Development costs previously recognised as an expense are not recognised as an asset in a subsequent period.
38p97 Computer software development costs recognised as assets are amortised over118(a)-(b) their useful lives, which does not exceed three years.
1Rp119 2.8 Financial assets
IFRS7p21 The Group classifies its financial assets into the following categories: at fair value39p9 through income, loans and receivables, held to maturity and available for sale. The
classification is determined by management at initial recognition and depends on the purpose for which the investments were acquired. See Note 2.9 for financial assets reclassified during the current year.
2.8.1 Classification 1Rp119 (a) Financial assets at fair value through income
39p9, 45 This category has two sub-categories: financial assets held for trading and those designated at fair value through income at inception.
IFRS7Appx A financial asset is classified into the ‘financial assets at fair value through income’Bp5(a), (e) category at inception if acquired principally for the purpose of selling in the short
term, if it forms part of a portfolio of financial assets in which there is evidence of short-term profit-taking, or if so designated by management. Derivatives are also classified as held for trading unless they are designated as hedges.
Financial assets designated as at fair value through income at inception are those
that are:Held in internal funds to match insurance and investment contracts liabilities •that are linked to the changes in fair value of these assets. The designation of these assets to be at fair value through income eliminates or significantly reduces a measurement or recognition inconsistency (sometimes referred to as ‘an accounting mismatch’) that would otherwise arise from measuring assets or liabilities or recognising the gains and losses on them on different bases; andManaged and whose performance is evaluated on a fair value basis. Information •about these financial assets is provided internally on a fair value basis to the Group’s key management personnel. The Group’s investment strategy is to invest in equity and debt securities and to evaluate them with reference to their fair values. Assets that are part of these portfolios are designated upon initial recognition at fair value through income (see Note 4.2 for additional details on the Group’s portfolio structure.
1Rp119 (b) Loans and receivables
39p9, 1Rp 66, 68 Loans and receivables are non-derivative financial assets with fixed or determinable payments that are not quoted in an active market other than those that the Group intends to sell in the short term or that it has designated as at fair value through income or available for sale. Receivables arising from insurance contracts are also classified in this category and are reviewed for impairment as part of the impairment review of loans and receivables.
25PricewaterhouseCoopers
Notes to the consolidated financial statements (continued)(All amounts in euro thousands unless otherwise stated)
1Rp119 (c) Held-to-maturity financial assets 39p9 Held-to-maturity investments are non-derivative financial assets with fixed or
determinable payments and fixed maturities that the Group’s management has the positive intention and ability to hold to maturity, other than:
Those that the Group upon initial recognition designates as at fair value through •profit or loss; Those that the Group designates as available for sale; and•Those that meet the definition of loans and receivables.•
Interest on held-to-maturity investments are included in the consolidated income statement and are reported as ‘Interest and similar income’. In the case of an impairment, it is been reported as a deduction from the carrying value of the investment and recognised in the consolidated income statement as ‘Net gains/(losses) on investment securities’. Held-to-maturity investments are corporate bonds.
1Rp119 (d) Available-for-sale financial assets 39p9 Available-for-sale investments are financial assets that are intended to be held forIFRS7AppxBp5(b) an indefinite period of time, which may be sold in response to needs for liquidity or1Rp 66, 68 changes in interest rates, exchange rates or equity prices or that are not classified
as loans and receivables, held-to-maturity investments or financial assets at fair value through income.
2.8.2 Recognition and measurement
39p38 Regular-way purchases and sales of financial assets are recognised on trade-date –IFRS7p21(c) the date on which the Group commits to purchase or sell the asset.
IFRS7AppxBp5(e) Financial assets are initially recognised at fair value plus, in the case of all financial39p43, 46, 55(a), 55(b) assets not carried at fair value through income, transaction costs that are directly attributable to their acquisition. Financial assets carried at fair value through income
are initially recognised at fair value, and transaction costs are expensed in the income statement.
Financial assets are derecognised when the rights to receive cash flows from them have expired or where they have been transferred and the Group has also transferred substantially all risks and rewards of ownership.
Available-for-sale financial assets and financial assets at fair value through income are subsequently carried at fair value. Loans and receivables and held-to-maturity financial assets are carried at amortised cost using the effective interest method.
39p55(a) Gains and losses arising from changes in the fair value of the ‘financial assets at fairIFRS7 AppxBp5(e) value through income’ category are included in the income statement in the period in
which they arise. Dividend income from financial assets at fair value through income is recognised in the income statement as part of other income when the group’s right to receive payments is established.
39p55(b) Changes in the fair value of monetary and non-monetary securities classified asIFRS7 AppxBp5(e) available for sale are recognised in other comprehensive income.
39p67 When securities classified as available for sale are sold or impaired, the accumulated fair value adjustments recognised in equity are included in the income statement as net realised gains on financial assets.
26 PricewaterhouseCoopers
Notes to the consolidated financial statements (continued)(All amounts in euro thousands unless otherwise stated)
Interest on available-for-sale securities calculated using the effective interest method is recognised in the income statement. Dividends on available-for-sale equity instruments are recognised in the income statement when the Group’s right to receive payments is established. Both are included in the investment income line.
See Note 2.10 for the Group’s accounting policies relating to the impairment of financial assets.
2.8.3 Determination of fair value
For financial instruments traded in active markets, the determination of fair values of financial assets and financial liabilities is based on quoted market prices or dealer price quotations. This includes listed equity securities and quoted debt instruments
39pAG71-73 on major exchanges (for example, FTSE, NYSE) and broker quotes from Bloomberg and Reuters. The quoted market price used for financial assets held by the group is the current bid price.
39pAG74-79 A financial instrument is regarded as quoted in an active market if quoted prices are readily and regularly available from an exchange, dealer, broker, industry group, pricing service or regulatory agency, and those prices represent actual and regularly occurring market transactions on an arm’s length basis. If the above criteria are not met, the market is regarded as being inactive.
For example a market is inactive when there is a wide bid-offer spread or significant increase in the bid-offer spread or there are few recent transactions.
For all other financial instruments, fair value is determined using valuation techniques. In these techniques, fair values are estimated from observable data in respect of similar financial instruments, using models to estimate the present value of expected future cash flows or other valuation techniques, using inputs (for example, LIBOR yield curve, FX rates, volatilities and counterparty spreads) existing at the dates of the consolidated statement of financial position.
The Group uses widely recognised valuation models for determining fair values of
non-standardised financial instruments of lower complexity like options or interest rate and currency swaps. For these financial instruments, inputs into models are generally market observable.
For more complex instruments, the Group uses internally developed models, which
are usually based on valuation methods and techniques generally recognised as standard within the industry. Valuation models are used primarily to value derivatives transacted in the over-the-counter market, including unlisted equity and debt securities (including those with embedded derivatives), and other debt instruments for which markets were or have become illiquid in 2008. Some of the inputs to these models may not be market observable and are therefore estimated based on assumptions. The impact on net profit of financial instrument valuations reflecting non-market observable inputs (level 3) is disclosed in Note 4.3.
The Group uses its own credit risk spreads in determining the current value for
its derivative liabilities and all other liabilities for which it has elected the fair value option. When the Group’s credit spreads widen, the Group recognises a gain on theses liabilities because the value of the liabilities has decreased. When the Group’s credit spreads narrow, the Group recognises a loss on these liabilities because the value of the liabilities has increased.
27PricewaterhouseCoopers
Notes to the consolidated financial statements (continued)(All amounts in euro thousands unless otherwise stated)
The output of a model is always an estimate or approximation of a value that cannot be determined with certainty, and valuation techniques employed may not fully reflect all factors relevant to the positions the Group holds. Valuations are therefore adjusted, where appropriate, to allow for additional factors including model risks, liquidity risk and counterparty credit risk. Based on the established fair value and model governance policies and related controls and procedures applied, management believes that these valuation adjustments are necessary and appropriate to fairly state the values of financial instruments carried at fair value in the consolidated statement of financial position. Price data and parameters used in the measurement procedures applied are generally reviewed carefully and adjusted, if necessary – particularly in view of the current market developments.
The measurement of asset-backed securities (predominantly CMBS (commercial mortgage-backed securities) and RMBS (residential mortgage-backed securities)) held for trading is partly based on generally accepted valuation models and partly based on indicative price given the absence of such models. Such indicative prices are first validated against other sources of price data. In addition, the Group’s analysis takes into account factors such as tranche-specific collateralisation status and collateral structures; analyses of underlying receivables (‘look-through’ analysis of ABS (asset-backed securities)), primarily regarding redemption schedules and (payment) defaults of securitised receivables; as well as trigger events and rating changes.
Asset-backed securities in the Group’s Unites States portfolio are measured based
on indicative prices. For the Group’s European portfolio of asset-backed securities, the Group uses generally accepted valuation models.
The fair value of over-the-counter (OTC) derivatives is determined using valuation
methods that are commonly accepted in the financial markets, such as the present value technique and option pricing models. The fair value of foreign exchange forwards is generally based on current forward exchange rates. Structured interest rate derivatives are measured using appropriate option pricing models (for example, the Black-Scholes model) or numerical procedures (for example, Monte Carlo Simulation). Numerical procedures are used when an exact mathematical formula is not available.
In cases where the fair value of unlisted equity instruments cannot be determined reliably, the instruments are carried at cost less any impairments. The fair value for loans and advances as well as liabilities to banks and customers are determined using a present value model on the basis of contractually agreed cash flows, taking into account credit quality, liquidity and costs.
The fair values of contingent liabilities and irrevocable loan commitments correspond to their carrying amounts.
The carrying value less impairment provision of trade receivables and payables are
assumed to approximate their fair values. The fair value of financial liabilities for disclosure purposes is estimated by discounting the future contractual cash flows at the current market interest rate that is available to the group for similar financial instruments.
39AG72 The fair values of quoted investments are based on current bid prices. If the market73, 74 for a financial asset is not active, the Group establishes fair value by using valuation
techniques. These include the use of recent arm’s length transactions, reference toIFRS7p27(b) other instruments that are substantially the same, discounted cash flow analysis and
option pricing models making maximum use of market inputs and relying as little as possible on entity-specific inputs.
28 PricewaterhouseCoopers
Notes to the consolidated financial statements (continued)(All amounts in euro thousands unless otherwise stated)
1Rp119 2.9 Reclassification of financial assets
39p50(c) Financial assets other than loans and receivables are permitted to be reclassified39p50B out of the held-for-trading category only in rare circumstances arising from a single
event that is unusual and highly unlikely to recur in the near-term. In addition, the Group may choose to reclassify financial assets that would meet the definition of loans and receivables out of the held-for-trading or available-for-sale categories if the Group has the intention and ability to hold these financial assets for the foreseeable future or until maturity at the date of reclassification.
39p50F Reclassifications are made at fair value as of the reclassification date. Fair value becomes the new cost or amortised cost as applicable, and no reversals of fair value gains or losses recorded before reclassification date are subsequently made. Effective interest rates for financial assets reclassified to loans and receivables and held-to-maturity categories are determined at the reclassification date. Further increases in estimates of cash flows adjust effective interest rates prospectively.
During the first quarter of 2009, the Group has reclassified several illiquid financial assets out of the available-for-sale category into the loans and receivables category. Those financial assets are no longer fair valued through the revaluation reserve in equity but measured at amortised cost less impairment. See Note 11 for more information regarding the financial assets reclassified.
2.10 Impairment of assets
(a) Financial assets carried at amortised cost
The Group assesses at each end of the reporting period whether there is objective39p58 evidence that a financial asset or group of financial assets is impaired. A financial39p59 asset or group of financial assets is impaired and impairment losses are incurred
only if there is objective evidence of impairment as a result of one or more events that have occurred after the initial recognition of the asset (a ‘loss event’) and that loss event (or events) has an impact on the estimated future cash flows of the financial asset or group of financial assets that can be reliably estimated. Objective evidence that a financial asset or group of assets is impaired includes observable data that comes to the attention of the Group about the following events:
IFRS7 Appx B5(f) • Significantfinancialdifficultyoftheissuerordebtor;
A breach of contract, such as a default or delinquency in payments;•It becoming probable that the issuer or debtor will enter bankruptcy or other •financial reorganisation;The disappearance of an active market for that financial asset because of financial •difficulties; orObservable data indicating that there is a measurable decrease in the estimated •future cash flow from a group of financial assets since the initial recognition of those assets, although the decrease cannot yet be identified with the individual financial assets in the Group, including:
– adverse changes in the payment status of issuers or debtors in the Group; or – national or local economic conditions that correlate with defaults on the assets in the Group.
Note
The disclosures shown have been prepared based on general guidance provided in the relevant standard. It is also necessary to disclose more specific entity-related information.
29PricewaterhouseCoopers
Notes to the consolidated financial statements (continued)(All amounts in euro thousands unless otherwise stated)
39AG87 The Group first assesses whether objective evidence of impairment exists individually for financial assets that are individually significant. If the Group determines that no objective evidence of impairment exists for an individually assessed financial asset, whether significant or not, it includes the asset in a group of financial assets with similar credit risk characteristics and collectively assesses them for impairment. Assets that are individually assessed for impairment and for which an impairment loss is or continues to be recognised are not included in a collective assessment of impairment.
39p64 If there is objective evidence that an impairment loss has been incurred on loans andIFRS7p21 receivables or held-to-maturity investments carried at amortised cost, the amount39p63 of the loss is measured as the difference between the asset’s carrying amount and39AG84 the present value of estimated future cash flows (excluding future credit losses that
have been incurred) discounted at the financial asset’s original effective interest rate. The carrying amount of the asset is reduced through the use of an allowance account, and the amount of the loss is recognised in the income statement. If a held-to-maturity investment or a loan has a variable interest rate, the discount rate for measuring any impairment loss is the current effective interest rate determined under contract. As a practical expedient, the Group may measure impairment on the basis of an instrument’s fair value using an observable market price.
For the purpose of a collective evaluation of impairment, financial assets are grouped on the basis of similar credit risk characteristics (that is, on the basis of the Group’s grading process that considers asset type, industry, geographical location, past-due status and other relevant factors). Those characteristics are relevant to the estimation of future cash flows for groups of such assets by being indicative of the issuer’s ability to pay all amounts due under the contractual terms of the debt instrument being evaluated.
39p65 If in a subsequent period, the amount of the impairment loss decreases and the decrease can be related objectively to an event occurring after the impairment was recognised (such as improved credit rating), the previously recognised impairment loss is reversed by adjusting the allowance account. The amount of the reversal is recognised in the income statement.
(b) Assets classified as available for sale
39p67, 68, 69 The Group assesses at each date of the consolidated statement of financial position39p70 whether there is objective evidence that a financial asset or a group of financialIFRS7AppxB5(f) assets is impaired. In the case of equity investments classified as available for sale, a significant or prolonged decline in the fair value of the security below its cost is an objective evidence of impairment resulting in the recognition of an impairment loss.
In this respect, a decline of 20% or more is regarded as significant, and a period of 12 months or longer is considered to be prolonged1. If any such quantitative evidence exists for available-for-sale financial assets, the asset is considered for impairment, taking qualitative evidence into account. The cumulative loss – measured as the difference between the acquisition cost and the current fair value, less any impairment loss on that financial asset previously recognised in profit or loss – is removed from equity and recognised in the consolidated income statement. Impairment losses recognised in the consolidated income statement on equity instruments are not reversed through the consolidated income statement. If in a subsequent period the fair value of a debt instrument classified as available for sale increases and the increase can be objectively related to an event occurring after the impairment loss was recognised in profit or loss, the impairment loss is reversed through the consolidated income statement.
1 IAS 39 does not provide a quantitative definition of the terms ‘significant’ and ‘prolonged’. Management should make a policy choice of what is considered ‘significant’ and ‘prolonged’ and apply it consistently.
30 PricewaterhouseCoopers
Notes to the consolidated financial statements (continued)(All amounts in euro thousands unless otherwise stated)
Note
Regarding the meaning of ‘significant or prolonged’, the IFRIC clarified the following in May 2009:
The standard cannot be read to require the decline in value to be both significant and prolonged. Thus, either a significant or a prolonged decline is sufficient to require the recognition of an impairment loss.
A significant or prolonged decline cannot be considered only an indicator of possible impairment in determining whether there is objective evidence. When such a decline exists, recognition of an impairment loss is required.
The fact that the decline in the value of an investment is in line with the overall level of decline in the relevant market does not mean that an entity can conclude the investment is not impaired.
The existence of a significant or prolonged decline cannot be overcome by forecasts of an expected recovery of market values, regardless of their expected timing.
1Rp119 (c) Impairment of other non-financial assets
36p9, 10 Assets that have an indefinite useful life – for example, land – are not subject to amortisation and are tested annually for impairment. Assets that are subject
to amortisation are reviewed for impairment whenever events or changes in circumstances indicate that the carrying amount may not be recoverable. An impairment loss is recognised for the amount by which the asset’s carrying amount exceeds its recoverable amount. The recoverable amount is the higher of an asset’s fair value less costs to sell and value in use. For the purposes of assessing impairment, assets are grouped at the lowest levels for which there are separately identifiable cash flows (cash-generating units).
2.11 Derivative financial instruments
IFRS7p21 Derivatives are initially recognised at fair value on the date on which a derivative39p88 contract is entered into and are subsequently re-measured at their fair value. The
method of recognising the resulting fair value gain or loss depends on whether the derivative is designated as a hedging instrument, and if so, the nature of the item being hedged. Fair values are obtained from quoted market prices in active markets, including recent market transactions, and valuation techniques, including discounted cash flow models and options pricing models, as appropriate. All derivatives are carried as assets when fair value is positive and as liabilities when fair value is negative.
39AG76 The best evidence of the fair value of a derivative at initial recognition is theIFRS7p27 transaction price (that is, the fair value of the consideration given or received) unless
the fair value of that instrument is evidenced by comparison with other observable current market transactions in the same instrument (that is, without modification or repackaging) or based on a valuation technique whose variables include only data from observable markets.
31PricewaterhouseCoopers
Notes to the consolidated financial statements (continued)(All amounts in euro thousands unless otherwise stated)
Note
The disclosures shown have been prepared based on general guidance provided in the relevant standard. Entities would need to tailor these disclosures taking into consideration the specific facts and circumstances. Companies may disclose more specific entity-related information.
IFRS7p28(a) When unobservable market data has an impact on the valuation of derivatives, the entire initial change in fair value indicated by the valuation model is not recognised immediately in the income statement but over the life of the transaction on an appropriate basis or when the inputs become observable, or when the derivative matures or is closed out.
39p11 Embedded derivatives that are not closely related to their host contracts and meet the definition of a derivative are separated and fair valued through profit or loss. The accounting policy in respect of derivatives embedded in host insurance contracts is described in Note 2.16(b).
39p88 The Group designates certain derivatives as either: (i) hedges of the fair value ofIFRS7p33(b) recognised assets or liabilities or of a firm commitment (fair value hedge); (ii) hedges
of highly probable forecast transactions (cash flow hedges); or (iii) hedges of net investments in foreign operations (net investment hedge).
IFRS7p23, 24 The Group documents at the inception of the transaction the relationship between hedging instruments and hedged items, as well as its risk management objective and strategy for undertaking various hedging transactions. The Group also documents its assessment, both at hedge inception and on an ongoing basis, of whether the derivatives that are used in hedging transactions are expected to be and have been highly effective in offsetting changes in fair values or cash flows of hedged items. The fair values of various derivative instruments used for hedging purposes are disclosed in Note 13. Movements on the hedging reserve in shareholders’ equity are shown in Note 16.
39p89 (a) Fair value hedge
39p92 Changes in the fair value of derivatives that are designated and qualify as fair value hedges are recorded in the income statement, together with any changes in the fair value of the hedged asset or liability that are attributable to the hedged risk.
If the hedge no longer meets the criteria for hedge accounting, the adjustment to the carrying amount of a hedge item for which the effective interest method is used is amortised to profit or loss over the period to maturity.
39p95 (b) Cash flow hedges
39p97, 98 The effective portion of changes in the fair value of derivatives that are designated and qualify as cash flow hedges is recognised in other comprehensive income. The gain or loss relating to any ineffective portion is recognised immediately in the income statement within ‘net fair value gains on financial assets at fair value through income’.
39p99, 100 Amounts accumulated in equity are recycled to income in the periods in which the hedged item affects profit or loss (for example, when the hedged forecast transaction takes place). However, when the hedged forecast transaction results in the recognition of a non-financial asset or a liability, the gains and losses previously deferred in equity are transferred from equity and included in the initial measurement of the cost of the asset or liability.
32 PricewaterhouseCoopers
Notes to the consolidated financial statements (continued)(All amounts in euro thousands unless otherwise stated)
39p101 When a hedging instrument expires or is sold, or when a hedge no longer meets the criteria for hedge accounting, any cumulative gain or loss existing in equity at that time remains in equity and is recognised when the forecast transaction is ultimately recognised in the income statement. However, when a forecast transaction is no longer expected to occur, the cumulative gain or loss that was reported in equity is immediately transferred to the income statement.
39p102(a), (b) (c) Net investment hedge
Hedges of net investments in foreign operations are accounted for similarly to cash flow hedges. Any gain or loss on the hedging instrument relating to the effective portion of the hedge is recognised in equity; the gain or loss relating to the ineffective portion is recognised immediately in the income statement within ‘net fair value gains on financial assets at fair value through income’.
Gains and losses accumulated in equity are included in the income statement on disposal of the foreign operation.
39p46 (d) Derivatives that do not qualify for hedge accounting
Certain derivative instruments do not qualify for hedge accounting. Changes in the fair value of all such derivative instruments are recognised immediately in the income statement.
1Rp119 2.12 Offsetting financial instruments
32p42 Financial assets and liabilities are offset and the net amount reported in the consolidated balance sheet only when there is a legally enforceable right to offset the recognised amounts and there is an intention to settle on a net basis, or to realise the asset and settle the liability simultaneously.
1Rp119
IFRSp21 2.13 Cash and cash equivalents
7p45 Cash and cash equivalents includes cash in hand, deposits held at call with banks, other short-term highly liquid investments with original maturities of three months or less, and bank overdrafts.
1Rp119 2.14 Share capital
IFRS7p21, Shares are classified as equity when there is no obligation to transfer cash or other32p35, 37 assets. Incremental costs directly attributable to the issue of equity instruments are
shown in equity as a deduction from the proceeds, net of tax.
32p33 Where any Group company purchases the Company’s equity share capital (treasury shares), the consideration paid, including any directly attributable incremental costs (net of income taxes), is deducted from equity attributable to the Company’s equity holders. Where such shares are subsequently sold, reissued or otherwise disposed of, any consideration received is included in equity attributable to the Company’s equity holders, net of any directly attributable incremental transaction costs and the related income tax effects.
1Rp119 2.15 Insurance and investment contracts – classification
IFRS4p37(a) The Group issues contracts that transfer insurance risk or financial risk or both. Insurance contracts are those contracts that transfer significant insurance risk. Such contracts may also transfer financial risk. As a general guideline, the Group defines as significant insurance risk the possibility of having to pay benefits on the occurrence of an insured event that are at least 10% more than the benefits payable if the insured event did not occur.
33PricewaterhouseCoopers
Notes to the consolidated financial statements (continued)(All amounts in euro thousands unless otherwise stated)
Investment contracts are those contracts that transfer financial risk with no significant insurance risk.
A number of insurance and investment contracts contain a discretionary participation feature (DPF). This feature entitles the holder to receive, as a supplement to guaranteed benefits, additional benefits or bonuses:
That are likely to be a significant portion of the total contractual benefits;•Whose amount or timing is contractually at the discretion of the Group; and•That are contractually based on:•
− the performance of a specified pool of contracts or a specified type of contract; − realised and/or unrealised investment returns on a specified pool of assets held by the Group; or − the profit or loss of the Group, fund or other entity that issues the contract.
Local statutory regulations and the terms and conditions of these contracts set out the bases for the determination of the amounts on which the additional discretionary benefits are based (the DPF eligible surplus) and within which the Group may exercise its discretion as to the quantum and timing of their payment to contract holders. At least 90% of the eligible surplus must be attributed to contract holders as a group (which can include future contract holders); the amount and timing of the distribution to individual contract holders is at the discretion of the Group, subject to the advice of the relevant local appointed actuary.
2.16 Insurance contracts and investment contracts with DPF
1Rp119 (a) Recognition and measurement
IFRS4p37(a) Insurance contracts and investment contracts with DPF are classified into four main categories, depending on the duration of risk and whether or not the terms and conditions are fixed.
(i) Short-term insurance contracts
These contracts are casualty, property and short-duration life insurance contracts.
Casualty insurance contracts protect the Group’s customers against the risk of causing harm to third parties as a result of their legitimate activities. Damages covered include both contractual and non-contractual events. The typical protection offered is designed for employers who become legally liable to pay compensation to injured employees (employers’ liability) and for individual and business customers who become liable to pay compensation to a third party for bodily harm or property damage (public liability).
Property insurance contracts mainly compensate the Group’s customers for damage suffered to their properties or for the value of property lost. Customers who undertake commercial activities on their premises could also receive compensation for the loss of earnings caused by the inability to use the insured properties in their business activities (business interruption cover).
Short-duration life insurance contracts protect the Group’s customers from the consequences of events (such as death or disability) that would affect the ability of the customer or his/her dependants to maintain their current level of income. Guaranteed benefits paid on occurrence of the specified insurance event are either fixed or linked to the extent of the economic loss suffered by the policyholder. There are no maturity or surrender benefits.
34 PricewaterhouseCoopers
Notes to the consolidated financial statements (continued)(All amounts in euro thousands unless otherwise stated)
For all these contracts, premiums are recognised as revenue (earned premiums) proportionally over the period of coverage. The portion of premium received on in-force contracts that relates to unexpired risks at the balance sheet date is reported as the unearned premium liability. Premiums are shown before deduction of commission and are gross of any taxes or duties levied on premiums.
Claims and loss adjustment expenses are charged to income as incurred based on the estimated liability for compensation owed to contract holders or third parties damaged by the contract holders. They include direct and indirect claims settlement costs and arise from events that have occurred up to the end of the reporting period even if they have not yet been reported to the Group. The Group does not discount its liabilities for unpaid claims other than for disability claims. Liabilities for unpaid claims are estimated using the input of assessments for individual cases reported to the Group and statistical analyses for the claims incurred but not reported, and to estimate the expected ultimate cost of more complex claims that may be affected by external factors (such as court decisions).
(ii) Long-term insurance contracts with fixed and guaranteed terms
IFRS4p37(a) These contracts insure events associated with human life (for example, death or survival) over a long duration. Premiums are recognised as revenue when they become payable by the contract holder. Premiums are shown before deduction of commission.
Benefits are recorded as an expense when they are incurred.
A liability for contractual benefits that are expected to be incurred in the future is recorded when the premiums are recognised. The liability is determined as the sum of the expected discounted value of the benefit payments and the future administration expenses that are directly related to the contract, less the expected discounted value of the theoretical premiums that would be required to meet the benefits and administration expenses based on the valuation assumptions used (the valuation premiums). The liability is based on assumptions as to mortality, persistency, maintenance expenses and investment income that are established at the time the contract is issued. A margin for adverse deviations is included in the assumptions.
Where insurance contracts have a single premium or a limited number of premium payments due over a significantly shorter period than the period during which benefits are provided, the excess of the premiums payable over the valuation premiums is deferred and recognised as income in line with the decrease of unexpired insurance risk of the contracts in force or, for annuities in force, in line with the decrease of the amount of future benefits expected to be paid.
The liabilities are recalculated at each end of the reporting period using the assumptions established at inception of the contracts.
IFRS4p37(a) (iii) Long-term insurance contracts without fixed terms and with DPF – unit-linked and universal life
These contracts insure human life events (for example, death or survival) over a long duration. However, insurance premiums are recognised directly as liabilities. These liabilities are increased by credited interest (in the case of universal life contracts) or change in the unit prices (in the case of unit-linked contracts) and are decreased by policy administration fees, mortality and surrender charges and any withdrawals.
35PricewaterhouseCoopers
Notes to the consolidated financial statements (continued)(All amounts in euro thousands unless otherwise stated)
The liability for these contracts includes any amounts necessary to compensate the Group for services to be performed over future periods. This is the case for contracts where the policy administration charges are higher in the initial years than in subsequent years. The mortality charges deducted in each period from the contract holders as a group are considered adequate to cover the expected total death benefit claims in excess of the contract account balances in each period; no additional liability is therefore established for these claims.
A unit-linked insurance contract is an insurance contract with an embedded derivative linking payments on the contract to units of an internal investment fund set up by the Group with the consideration received from the contract holders. This embedded derivative meets the definition of an insurance contract and is not therefore accounted for separately from the host insurance contract. The liability for such contracts is adjusted for all changes in the fair value of the underlying assets.
Universal life contracts contain a DPF that entitles the holders to a minimum guaranteed crediting rate per annum (3% or 4%, depending on the contract commencement date) or, when higher, a bonus rate declared by the Group from the DPF eligible surplus available to date. The Group has an obligation to eventually pay to contract holders at least 90% of the DPF eligible surplus (that is, all interest and realised gains and losses arising from the assets backing these contracts). Any portion of the DPF eligible surplus that is not declared as a bonus rate and credited to individual contract holders is retained in a liability for the benefit of all contract holders until declared and credited to them individually in future periods. In relation to the unrealised gains and losses arising from the assets backing these contracts (the DPF latent surplus), the Group establishes a liability equal to 90% of these net gains as if they were realised at year-end. Shareholders’ interest in the DPF latent surplus (equal to 10%) is recognised in the equity component of DPF.
Revenue consists of fees deducted for mortality, policy administration and surrender charges. Interest or changes in the unit prices credited to the account balances and excess benefit claims incurred in the period are charged as expenses in the income statement.
(iv) Investment contracts with DPF
The liability for these contracts is established in the same way as for the universal life insurance contracts with DPF (see the above). Revenue is also recognised in the same way.
Where the resulting liability is lower than the sum of the amortised cost of the guaranteed element of the contract and the intrinsic value of the surrender option embedded in the contract, it is adjusted and any shortfall is recognised immediately in the income statement.
Note
In certain jurisdictions, depending on local statutory requirements regarding minimum distribution requirements, it may be possible that no part of the discretionary participation feature will be recorded in equity.
36 PricewaterhouseCoopers
Notes to the consolidated financial statements (continued)(All amounts in euro thousands unless otherwise stated)
(b) Embedded derivatives
39p11 Certain derivatives embedded in insurance contracts are treated as separate derivatives when their economic characteristics and risks are not closely related to those of the host contract and the host contract is not carried at fair value through income. These embedded derivatives are measured at fair value with changes in fair value recognised in the income statements.
IFRS4p8 The Group does not separately measure embedded derivatives that meet the definition of an insurance contract or embedded options to surrender insurance contracts for a fixed amount (or an amount based on a fixed amount and an interest rate). All other embedded derivatives are separated and carried at fair value if they are not closely related to the host insurance contract and meet the definition of a derivative.
IFRS4p31-33 (c) Deferred policy acquisition costs (DAC)
Commissions and other acquisition costs that vary with and are related to securing new contracts and renewing existing contracts are capitalised as an intangible asset (DAC). All other costs are recognised as expenses when incurred. The DAC is subsequently amortised over the life of the contracts as follows:
For property, casualty and short-duration life insurance contracts, DAC is •amortised over the terms of the policies as premium is earnedFor long-term insurance contracts with fixed and guaranteed terms, DAC is •amortised in line with premium revenue using assumptions consistent with those used in calculating future policy benefit liabilities; andFor long-term insurance contracts without fixed terms and investment contracts •with DPF, DAC is amortised over the expected total life of the contract group as a constant percentage of estimated gross profit margins (including investment income) arising from these contracts. The pattern of expected profit margins is based on historical and anticipated future experience and is updated at the end of each accounting period. The resulting change to the carrying value of the DAC is charged to revenue.
(d) Value of business acquired
On acquisition of a portfolio of contracts, either directly from another insurer or through the acquisition of a subsidiary undertaking, the Group recognises an intangible asset representing the value of business acquired (VOBA). VOBA represents the present value of future profits embedded in acquired insurance contracts and investment contracts with DPF. The Group amortises VOBA over the effective life of the acquired contracts on the same basis as DAC (see (c) above).
IFRS4p30 (e) Impact of unrealised gains and losses on available-for-sale assets on liabilities from insurance contracts and investment contracts with DPF and related intangible assets
Where unrealised gains or losses arise on available-for-sale assets, the adjustment to the liabilities arising from insurance contracts and investment contracts with DPF (and related assets – DAC and VOBA) equal to the effect that the realisation of those gains or losses at the end of the reporting period would have had on those liabilities (and related assets) is recognised directly in other comprehensive income.
37PricewaterhouseCoopers
Notes to the consolidated financial statements (continued)(All amounts in euro thousands unless otherwise stated)
IFRS4p15 (f) Liability adequacy test
At each end of the reporting period, liability adequacy tests are performed to ensure the adequacy of the contract liabilities net of related DAC and VOBA assets. In performing these tests, current best estimates of future contractual cash flows and claims handling and administration expenses, as well as investment income from the assets backing such liabilities, are used. Any deficiency is immediately charged to profit or loss initially by writing off DAC or VOBA and by subsequently establishing a provision for losses arising from liability adequacy tests (the unexpired risk provision).
As set out in (a) above, long-term insurance contracts with fixed terms are measured based on assumptions set out at the inception of the contract. When the liability adequacy test requires the adoption of new best estimate assumptions, such assumptions (without margins for adverse deviation) are used for the subsequent measurement of these liabilities.
Any DAC or VOBA written off as a result of this test cannot subsequently be reinstated.
IFRS4p37(a) (g) Reinsurance contracts held
Contracts entered into by the Group with reinsurers under which the Group is compensated for losses on one or more contracts issued by the Group and that meet the classification requirements for insurance contracts in Note 2.15 are classified as reinsurance contracts held. Contracts that do not meet these classification requirements are classified as financial assets. Insurance contracts entered into by the Group under which the contract holder is another insurer (inwards reinsurance) are included with insurance contracts.
IFRS4p14 The benefits to which the Group is entitled under its reinsurance contracts held are recognised as reinsurance assets. These assets consist of short-term balances due from reinsurers, as well as longer term receivables that are dependent on the expected claims and benefits arising under the related reinsured insurance contracts. Amounts recoverable from or due to reinsurers are measured consistently with the amounts associated with the reinsured insurance contracts and in accordance with the terms of each reinsurance contract. Reinsurance liabilities are primarily premiums payable for reinsurance contracts and are recognised as an expense when due.
IFRS4p37(b) In certain cases, a reinsurance contract is entered into retrospectively to reinsure a notified claim under the Group’s property or casualty insurance contracts. Where the premium due to the reinsurer differs from the liability established by the Group for the related claim, the difference is amortised over the estimated remaining settlement period.
IFRS4p20 The Group assesses its reinsurance assets for impairment on a quarterly basis. If there is objective evidence that the reinsurance asset is impaired, the Group reduces the carrying amount of the reinsurance asset to its recoverable amount and recognises that impairment loss in the income statement. The Group gathers the objective evidence that a reinsurance asset is impaired using the same process adopted for financial assets held at amortised cost. The impairment loss is calculated following the same method used for these financial assets. These processes are described in Note 2.10.
IFRS4p37(a) (h) Receivables and payables related to insurance contracts and investment contracts
Receivables and payables are recognised when due. These include amounts due to and from agents, brokers and insurance contract holders.
38 PricewaterhouseCoopers
Notes to the consolidated financial statements (continued)(All amounts in euro thousands unless otherwise stated)
If there is objective evidence that the insurance receivable is impaired, the Group reduces the carrying amount of the insurance receivable accordingly and recognises that impairment loss in the income statement. The Group gathers the objective evidence that an insurance receivable is impaired using the same process adopted for loans and receivables. The impairment loss is calculated under the same method used for these financial assets. These processes are described in Note 2.10.
IFRS4p37(a) (i) Salvage and subrogation reimbursements
Some insurance contracts permit the Group to sell (usually damaged) property acquired in settling a claim (for example, salvage). The Group may also have the right to pursue third parties for payment of some or all costs (for example, subrogation).
Estimates of salvage recoveries are included as an allowance in the measurement of the insurance liability for claims, and salvage property is recognised in other assets when the liability is settled. The allowance is the amount that can reasonably be recovered from the disposal of the property.
Subrogation reimbursements are also considered as an allowance in the measurement of the insurance liability for claims and are recognised in other assets when the liability is settled. The allowance is the assessment of the amount that can be recovered from the action against the liable third party.
1Rp119 2.17 Investment contracts without DPF
IFRS7p21 The Group issues investment contracts without fixed terms (unit-linked) and investment contracts with fixed and guaranteed terms (fixed interest rate).
39p9, 43 Investment contracts without fixed terms are financial liabilities whose fair value is dependent on the fair value of underlying financial assets, derivatives and/orIFRS7AppxBp5(a) investment property (these contracts are also known as unit-linked investment
contracts) and are designated at inception as at fair value through income. The Group designates these investment contracts to be measured at fair value through income because it eliminates or significantly reduces a measurement or recognition inconsistency (sometimes referred to as ‘an accounting mismatch’) that would otherwise arise from measuring assets or liabilities or recognising the gains and losses on them on different bases. See Note 2.8 for the financial assets backing these liabilities.
IFRS7p27(d) The best evidence of the fair value of these financial liabilities at initial recognition is the transaction price (that is, the fair value received) unless the fair value of that instrument is evidenced by comparison with other observable current market transactions in the same instrument or based on a valuation technique whose variables include only data from observable markets. When such evidence exists, the Group recognises profit on day 1. The Group has not recognised any profit on initial measurement of these investment contracts because the difference is attributed to the pre-payment liability recognised for the future investment management services that the Group will render to each contract holder.
39AG74-79 The Group’s main valuation techniques incorporate all factors that market39AG82 participants would consider and make maximum use of observable market data.
The fair value of financial liabilities for investment contracts without fixed terms is determined using the current unit values in which the contractual benefits are denominated. These unit values reflect the fair values of the financial assets contained within the Group’s unitised investment funds linked to the financial liability. The fair value of the financial liabilities is obtained by multiplying the number of units attributed to each contract holder at the end of the reporting period by the unit value for the same date.
39PricewaterhouseCoopers
Notes to the consolidated financial statements (continued)(All amounts in euro thousands unless otherwise stated)
39p49 When the investment contract has an embedded put or surrender option, the fair value of the financial liability is never less than the amount payable on surrender, discounted for the required notice period where applicable.
IFRS7p21 For investment contracts with fixed and guaranteed terms, the amortised cost basis39p43 is used. In this case, the liability is initially measured at its fair value less transaction
costs that are incremental and directly attributable to the acquisition or issue of the contract.
39p47 Subsequent measurement of investment contracts at amortised cost uses the39AG8 effective interest method. This method requires the determination of an interest
rate (the effective interest rate) that exactly discounts to the net carrying amount of the financial liability, the estimated future cash payments or receipts through the expected life of the financial instrument or, when appropriate, a shorter period if the holder has the option to redeem the instrument earlier than maturity.
The Group re-estimates at each reporting date the expected future cash flows and recalculates the carrying amount of the financial liability by calculating the present value of estimated future cash flows using the financial liability’s original effective interest rate. Any adjustment is immediately recognised as income or expense in the income statement.
1Rp119 2.18 Borrowings
IFRS7p21 Borrowings are recognised initially at fair value, net of transaction costs incurred.39p47, 43 Borrowings are subsequently stated at amortised cost; any difference between the proceeds (net of transaction costs) and the redemption value is recognised in the
income statement over the period of the borrowings using the effective interest method.
Fees paid on the establishment of loan facilities are recognised as transaction cost of the loan to the extent that it is probable that some or all of the facility will be drawn down. In this case, the fee is deferred until the draw-down occurs. To the extent there is no evidence that it is probable that some or all of the facility will be drawn down, the fee is capitalised as a pre-payment for liquidity services and amortised over the period of the facility to which it relates.
IFRS7p21, Preference shares, which are mandatorily redeemable on a specific date, are32p18(a), 33 classified as liabilities. The dividends on these preference shares are recognised in
the income statement as interest expense.
IFRS7p27(a) The fair value of the liability portion of a convertible bond is determined using a32p18, 28, 32AG31 market interest rate for an equivalent non-convertible bond. This amount is recorded1Rp60, 61 as a liability on an amortised cost basis until extinguished on conversion or maturity
of the bonds. The remainder of the proceeds is allocated to the conversion option. This is recognised and included in shareholders’ equity, net of income tax effects.
1Rp119 2.19 Current and deferred income tax
12p58, 61A The tax expense for the period comprises current and deferred tax. Tax is recognised in the income statement, except to the extent that it relates to items recognised in other comprehensive income or directly in equity. In this case, the tax is also recognised in other comprehensive income or directly in equity, respectively.
12p12, 46 The current income tax charge is calculated on the basis of the tax laws enacted or substantively enacted at the end of the reporting period in the countries where the company’s subsidiaries and associates operate and generate taxable income. Management periodically evaluates positions taken in tax returns with respect to situations in which applicable tax regulation is subject to interpretation and establishes provisions where appropriate.
40 PricewaterhouseCoopers
Notes to the consolidated financial statements (continued)(All amounts in euro thousands unless otherwise stated)
12p24, 15, 47 Deferred income tax is recognised, using the liability method, on temporary differences arising between the tax bases of assets and liabilities and their carrying amounts in the consolidated financial statements. However, if the deferred income tax arises from initial recognition of an asset or liability in a transaction other than a business combination that at the time of the transaction affects neither accounting nor taxable profit or loss, it is not accounted for. Deferred income tax is determined using tax rates (and laws) that have been enacted or substantively enacted by the end of the reporting period and are expected to apply when the related deferred income tax asset is realised or the deferred income tax liability is settled.
12p24, 34 Deferred income tax assets are recognised to the extent that it is probable that future taxable profit will be available against which the temporary differences can be utilised.
12p39, 44 Deferred income tax is provided on temporary differences arising on investments in subsidiaries and associates, except where the Group controls the timing of the reversal of the temporary difference and it is probable that the temporary difference will not reverse in the foreseeable future.
12p74 Deferred income tax assets and liabilities are offset when there is a legally enforceable right to offset current tax assets against current tax liabilities and when the deferred income taxes assets and liabilities relate to income taxes levied by the same taxation authority on either the taxable entity or different taxable entities where there is an intention to settle the balances on a net basis.
12p34 The tax effects of carry-forwards of unused losses or unused tax credits are recognised as an asset when it is probable that future taxable profits will be available against which these losses can be utilised.
12p61A Deferred tax related to fair value re-measurement of available-for-sale investments and cash flow hedges, which are charged or credited directly in other comprehensive income or to equity, is also credited or charged directly to equity and subsequently recognised in the consolidated income statement together with the deferred gain or loss.
1Rp119 2.20 Employee benefits
(a) Pension obligations
19p27, 25, 7, 120A(b) Group companies operate various pension schemes. The schemes are generally funded through payments to insurance companies or trustee-administered funds, determined by periodic actuarial calculations. The Group has both defined benefit and defined contribution plans. A defined benefit plan is a pension plan that defines
an amount of pension benefit that an employee will receive on retirement, usually dependent on one or more factors such as age, years of service and compensation. A defined contribution plan is a pension plan under which the Group pays fixed contributions into a separate entity. The Group has no legal or constructive obligations to pay further contributions if the fund does not hold sufficient assets to pay all employees the benefits relating to employee service in the current and prior periods.
19p79, 80, 64 The liability recognised in the consolidated balance sheet in respect of defined benefit pension plans is the present value of the defined benefit obligation at the end of the financial reporting period less the fair value of plan assets, together with adjustments for unrecognised actuarial gains or losses and past service costs. Plan assets exclude any insurance contracts issued by the Group. The defined benefit obligation is calculated annually by independent actuaries using the projected unit credit method. The present value of the defined benefit obligation is determined by discounting the estimated future cash outflows using interest rates of high-quality corporate bonds that are denominated in the currency in which the benefits will be paid and that have terms to maturity that approximate the terms of the related pension liability.
41PricewaterhouseCoopers
Notes to the consolidated financial statements (continued)(All amounts in euro thousands unless otherwise stated)
19p93-93D Actuarial gains and losses arising from experience adjustments and changes in19p120A(a) actuarial assumptions are charged or credited to income over the employees’
expected average remaining working lives.
19p96 Past-service costs are recognised immediately in income, unless the changes to the pension plan are conditional on the employees remaining in service for a specified period of time (the vesting period). In this case, the past-service costs are amortised on a straight-line basis over the vesting period.
Note: Actuarial gains and losses
If the reporting entity applies IAS 19p93A and recognises actuarial gains and losses in other comprehensive income (other reserves), the disclosure requirements differ slightly compared to those presented in Note 22.
The total amount recognised in other comprehensive income (actuarial gains/losses and the effect of the limit in IAS 19p58(b)) for the current period as well as the cumulative amount recognised in other comprehensive income have to be disclosed.
19p44 For defined contribution plans, the Group pays contributions to publicly or privately administered pension insurance plans on a mandatory, contractual or voluntary basis. The Group has no further payment obligations once the contributions have been paid. The contributions are recognised as employee benefit expenses when they are due. Pre-paid contributions are recognised as an asset to the extent that a cash refund or a reduction in the future payments is available.
1Rp119 (b) Other post-employment obligations
19p120A(a), (b) Some group companies provide post-retirement healthcare benefits to their retirees. The entitlement to these benefits is usually conditional on the employee remaining in service up to retirement age and the completion of a minimum service period. The expected costs of these benefits are accrued over the period of employment using an accounting methodology similar to that for defined benefit pension plans. Actuarial gains and losses arising from experience adjustments and changes in actuarial assumptions are charged or credited to income over the expected average remaining working lives of the related employees. Independent qualified actuaries value these obligations annually.
1Rp119 (c) Share-based compensation
IFRS2p15(b), 19 The Group operates a number of equity-settled, share-based compensation plans,under which the entity receives services from employees as consideration for equity instruments (options) of the Group. The fair value of the employee services received in exchange for the grant of the options is recognised as an expense. The total amount to be expensed is determined by reference to the fair value of the options granted:
Including any market performance conditions;•Excluding the impact of any service and non-market performance vesting •conditions (for example, profitability, sales growth targets and remaining an employee of the entity over a specified time period); andIncluding the impact of any non-vesting conditions (for example, the requirement •for employees to save).
Non-market vesting conditions are included in assumptions about the number of options that are expected to vest. The total expense is recognised over the vesting period, which is the period over which all of the specified vesting conditions are to
42 PricewaterhouseCoopers
Notes to the consolidated financial statements (continued)(All amounts in euro thousands unless otherwise stated)
be satisfied. At the end of each reporting period, the entity revises its estimates of the number of options that are expected to vest based on the non-marketing vesting conditions. It recognises the impact of the revision to original estimates, if any, in the income statement, with a corresponding adjustment to equity.
When the options are exercised, the company issues new shares. The proceeds received net of any directly attributable transaction costs are credited to share capital (nominal value) and share premium when the options are exercised.
The grant by the Company of options over its equity instruments to the employees of subsidiary undertakings in the Group is treated as a capital contribution. The fair value of employee services received, measured by reference to the grant date fair value, is recognised over the vesting period as an increase to investment in subsidiary undertakings, with a corresponding credit to equity.
1Rp119 (d) Termination benefits
19p133, 134, 139 Termination benefits are payable when employment is terminated before the normal retirement date, or whenever an employee accepts voluntary redundancy in exchange for these benefits. The Group recognises termination benefits when it is demonstrably committed to either: terminating the employment of current employees according to a detailed formal plan without possibility of withdrawal; or providing termination benefits as a result of an offer made to encourage voluntary redundancy. Benefits falling due more than 12 months after the end of the reporting period are discounted to present value.
(e) Profit-sharing and bonus plans
19p17 The Group recognises a liability and an expense for bonuses and profit-sharing, based on a formula that takes into consideration the profit attributable to the Company’s shareholders after certain adjustments. The Group recognises a provision where contractually obliged or where there is a past practice that has created a constructive obligation.
1Rp119 2.21 Provisions
37p14 (a) Restructuring costs and legal claims
37p72, 63 Provisions for restructuring costs and legal claims are recognised when: the Grouphas a present legal or constructive obligation as a result of past events; it is more likely than not that an outflow of resources will be required to settle the obligation; and the amount has been reliably estimated. Restructuring provisions comprise lease termination penalties and employee termination payments. Provisions are not recognised for future operating losses.
37p24 Where there are a number of similar obligations, the likelihood that an outflow will be required in settlement is determined by considering the class of obligations as a whole. A provision is recognised even if the likelihood of an outflow with respect to any one item included in the same class of obligations may be small.
37p45 Provisions are measured at the present value of the expenditures expected to be required to settle the obligation using a pre-tax rate that reflects current market assessments of the time value of money and the risks specific to the obligation. The increase in the provision due to passage of time is recognised as interest expense.
(b) Levies
IFRS4pIG17(j) The Group is subject to various insurance-related assessments or guarantee-fund levies. Related provisions are provided for where there is a present obligation (legal or constructive) as a result of a past event.
43PricewaterhouseCoopers
Notes to the consolidated financial statements (continued)(All amounts in euro thousands unless otherwise stated)
1Rp119 2.22 Revenue recognition
18p35(a) Revenue comprises the fair value for services, net of value-added tax, after eliminating revenue within the Group. Revenue is recognised as follows:
18p20 (a) Rendering of services
Revenue arising from asset management and other related services offered by the Group is recognised in the accounting period in which the services are rendered.
Fees consist primarily of investment management fees arising from services rendered in conjunction with the issue and management of investment contracts where the Group actively manages the consideration received from its customers to fund a return that is based on the investment profile that the customer selected on origination of the instrument. These services comprise the activity of trading financial assets and derivatives in order to reproduce the contractual returns that the Group’s customers expect to receive from their investments. Such activities generate revenue that is recognised by reference to the stage of completion of the contractual services. In all cases, these services comprise an indeterminate number of acts over the life of the individual contracts. For practical purposes, the Group recognises these fees on a straight-line basis over the estimated life of the contract.
Certain upfront payments received for asset management services (‘front-end fees’) are deferred and amortised in proportion to the stage of completion of the service for which they were paid.
The Group charges its customers for asset management and other related services using the following different approaches:
Front-end fees are charged to the client on inception. This approach is used •particularly for single premium contracts. The consideration received is deferred as a liability and recognised over the life of the contract on a straight-line basis; andRegular fees are charged to the customer periodically (monthly, quarterly or •annually) either directly or by making a deduction from invested funds. Regular charges billed in advance are recognised on a straight-line basis over the billing period; fees charged at the end of the period are accrued as a receivable that is offset against the financial liability when charged to the customer.
18p30(a) (b) Interest income and expenses
IFRS7AppxB5(e) Interest income and expenses for all interest-bearing financial instruments, including financial instruments measured at fair value through income, are recognised within ‘investment income’ (Note 26) and ‘finance costs’ (Note 34) in the income statement using the effective interest rate method. When a receivable is impaired, the Group reduces the carrying amount to its recoverable amount, being the estimated future cash flow discounted at the original effective interest rate of the instrument, and continues unwinding the discount as interest income.
Note: Disclosure of interest income and expense
Interest income, interest expense and dividend income on financial instruments at fair value through income (either designated at fair value through income or non-derivatives held for trading) can be disclosed as part of ‘Net gains/(losses) on financial instruments classified as held for trading’ or separated as part of ‘Interest and similar income’, ‘Interest and similar expenses’ or ‘Dividend income’. Both treatments are acceptable provided they are consistently applied and properly disclosed (IFRS 7 Appx B5). It is possible to adopt one treatment for interest income and interest expenses and a different treatment for dividend income provided that the method is applied consistently.
44 PricewaterhouseCoopers
Notes to the consolidated financial statements (continued)(All amounts in euro thousands unless otherwise stated)
18p30(c) (c) Dividend income
Dividend income for available-for-sale equities is recognised when the right to receive payment is established – this is the ex-dividend date for equity securities.
1Rp119 2.23 Leases
17p33 Leases in which a significant portion of the risks and rewards of ownership areSIC-15p5 retained by the lessor are classified as operating leases. Payments made under
operating leases (net of any incentives received from the lessor) are charged to the income statement on a straight-line basis over the period of the lease.
1Rp119 The Group leases certain property, plant and equipment. The Group does not have substantially all the risks and rewards of ownership and these leases are therefore classified as operating leases.
1Rp119 2.24 Dividend distribution
10p12 Dividend distribution to the Company’s shareholders is recognised as a liability in the Group’s financial statements in the period in which the dividends are approved by the Company’s shareholders.
1Rp125 3 Critical accounting estimates and judgements
IFRS4p38 The Group makes estimates and assumptions that affect the reported amounts1Rp112, 1Rp125 of assets and liabilities within the next financial year. Estimates and judgements1Rp129 are continually evaluated and based on historical experience and other factors,
including expectations of future events that are believed to be reasonable under the circumstances.
IFRS4p38 (a) The ultimate liability arising from claims made under insurance contracts
The estimation of the ultimate liability arising from claims made under insurance contracts is the Group’s most critical accounting estimate. There are several sources of uncertainty that need to be considered in the estimate of the liability that the Group will ultimately pay for such claims. In particular, the claims arising from the employers’ liability policies written in the casualty segment are exposed to claims for industrial diseases caused by exposure to asbestos. The majority of these asbestos claims arises from insurance contracts issued in 1986 and prior years.
Estimation of the ultimate cost of asbestos claims is a complex process and cannot be done using conventional actuarial techniques. Significant factors that affect the trends that influence the asbestos estimation process are the inconsistent court resolutions and jurisprudence that has broadened the intent and scope coverage of the protections offered in the insurance contracts issued by the Group. This factor is exacerbated by the geographical diversification of the Group asbestos claims. The current case law in all the territories in which the Group is exposed to these claims can be characterised as still evolving; it is unlikely that any firm direction will emerge in the courts’ compensation methods in the near future. Due to this uncertainty, it is not possible to determine the future development of asbestos claims with the same degree of reliability as with other types of claim.
IFRS4p39(c)(i) The Group believes that the liability for asbestos claims carried at year-end is adequate. However, an increase of 10% in the cost of the most severe cases (those where the disease degenerates into a form of cancer known as mesothelioma) would require the recognition of an additional loss of €10,284 (€2,545 net of reinsurance). Similarly, an increase of 10% in the ultimate number of such claims would cost an additional loss of €4,988 (€1,273 net of reinsurance).
45PricewaterhouseCoopers
Notes to the consolidated financial statements (continued)(All amounts in euro thousands unless otherwise stated)
IFRS4p38 (b) Estimate of future benefit payments and premiums arising from long-term insurance contracts, and related deferred acquisition costs and other intangible assets
The determination of the liabilities under long-term insurance contracts is dependent on estimates made by the Group. Estimates are made as to the expected number of deaths for each of the years in which the Group is exposed to risk. The Group bases these estimates on standard industry and national mortality tables that reflect recent historical mortality experience, adjusted where appropriate to reflect the Group’s own experience. For contracts that insure the risk of longevity, appropriate but not excessively prudent allowance is made for expected mortality improvements. The estimated number of deaths determines the value of the benefit payments and the value of the valuation premiums. The main source of uncertainty is that epidemics such as AIDS, SARS and wide-ranging lifestyle changes, such as in eating, smoking and exercise habits, could result in future mortality being significantly worse than in the past for the age groups in which the Group has significant exposure to mortality risk. However, continuing improvements in medical care and social conditions could result in improvements in longevity in excess of those allowed for in the estimates used to determine the liability for contracts where the Group is exposed to longevity risk. Were the numbers of deaths in future years to differ by 10% from management’s estimate, the liability would increase by €1,243 or decrease by €552. In this case, there is no relief arising from reinsurance contracts held.
For contracts without fixed terms, it is assumed that the Group will be able to increase mortality risk charges in future years in line with emerging mortality experience.
Under certain contracts, the Group has offered guaranteed annuity options. In determining the value of these options, estimates have been made as to the percentage of contract holders that will exercise them. There is not enough historical information available on which to base these estimates. Changes in investment conditions could result in significantly more contract holders exercising their options than has been assumed. Were the numbers of contract holders that exercise their options to differ by 10% from the number estimated by management, the insurance liability would alter by €1,190. In this case, there is no relief arising from reinsurance contracts held.
IFRS4p39(c)(i) Estimates are also made as to future investment income arising from the assets backing long-term insurance contracts. These estimates are based on current market returns, as well as expectations about future economic and financial developments. The average estimated rate of investment return is 4.2%. Were the average future investment returns to differ by 1% from management’s estimates, the insurance liability would increase by €1,782 or decrease by €711. In this case, there is no relief arising from reinsurance contracts held.
For long-term insurance contracts with fixed and guaranteed terms and with DPF, estimates are made in two stages. Estimates of future deaths, voluntary terminations, investment returns and administration expenses are made at the inception of the contract and form the assumptions used for calculating the liabilities during the life of the contract. A margin for risk and uncertainty is added to these assumptions. These assumptions are ‘locked in’ for the duration of the contract. New estimates are made each subsequent year in order to determine whether the previous liabilities are adequate in the light of these latest estimates. If the liabilities are considered adequate, the assumptions are not altered. If they are not adequate, the assumptions are altered (‘unlocked’) to reflect the best estimate assumptions.
A key feature of the adequacy testing for these contracts is that the effects of changes in the assumptions on the measurement of the liabilities and related assets are not symmetrical. Any improvements in estimates have no impact on the value of the liabilities and related assets until the liabilities are derecognised, while significant enough deterioration in estimates is immediately recognised to make the liabilities adequate.
46 PricewaterhouseCoopers
Notes to the consolidated financial statements (continued)(All amounts in euro thousands unless otherwise stated)
(c) Fair value of investment contracts
The Group issues a significant number of investment contracts that are designated at fair value through income. These financial instruments are not quoted in active markets, and their fair values are determined by using valuation techniques. Such techniques (for example, valuation models) are validated and periodically reviewed by qualified personnel independent of the area that created them. All models are validated before they are used and calibrated to ensure that outputs reflect actual experience and comparable market prices. A variety of factors is considered in the Group’s valuation techniques, including time value, credit risk (both own and counterparty), embedded derivatives (such as unit-linking features), volatility factors (including contract holder behaviour), servicing costs and activity in similar instruments.
Changes in assumptions about these factors could affect the reported fair value of financial instruments. The extent that actual surrenders are different from the Group’s estimates is the most critical factor in the fair valuation process, as additional fair value gains or losses would have been recognised in the fair value of liabilities associated with investment contracts. The change in fair value arising from the expected surrender patterns does not operate symmetrically. Increased surrender volumes may not be fully recognised in the valuation of investment contract liabilities owing to the requirement to maintain the fair value of financial liabilities above the amount payable on demand. Were the actual expected surrender experience to differ by 10% from management’s estimates, the consolidated net income would be an estimated €690 higher or €350 lower.
(d) Impairment of available-for-sale equity financial assets
The Group determines that available-for-sale equity financial assets are impaired when there has been a significant or prolonged decline in the fair value below its cost. This determination of what is significant or prolonged requires judgement. In making this judgement, the Group evaluates among other factors, the normal volatility in share price, the financial health of the investee, industry and sector performance, changes in technology, and operational and financing cash flow. Impairment may be appropriate when there is evidence of deterioration in the financial health of the investee, industry and sector performance, changes in technology, and financing and operational cash flows.
Had all the declines in fair values below cost been considered significant or prolonged, the Group would suffer an additional €550 loss in its 2009 financial statements, being the transfer of the total equity reserve for unrealised losses to the income statement.
(e) Fair value of financial instruments
The fair value of financial instruments where no active market exists or where quoted prices are not otherwise available are determined by using valuation techniques. In these cases the fair values are estimated from observable data in respect of similar financial instruments or using models. Where market observable inputs are not available, they are estimated based on appropriate assumptions. Where valuation techniques (for example, models) are used to determine fair values, they are validated and periodically reviewed by qualified personnel independent of those that sourced them. All models are certified before they are used, and models are calibrated to ensure that outputs reflect actual data and comparative market prices. To the extent practical, models use only observable data; however, areas such as credit risk (both own credit risk and counterparty risk), volatilities and correlations require management to make estimates.
47PricewaterhouseCoopers
Notes to the consolidated financial statements (continued)(All amounts in euro thousands unless otherwise stated)
Changes in assumptions about these factors could affect the reported fair value of financial instruments. For example, to the extent that management used a tightening of 20 basis points in the credit spread, the fair values of debt securities (carried at fair value through income and available for sale) would be estimated at €652,000 as compared to their reported fair value of €653,000 at 31 December 2009.
See Note 4.3 for additional sensitivity information for financial instruments.
4 Management of insurance and financial risk
The Group issues contracts that transfer insurance risk or financial risk or both. This section summarises these risks and the way the Group manages them.
Note: Nature and extent of risks arising from financial instruments
The disclosures required by IFRS7p31-42 (‘Nature and extent of risks arising from financial instruments’) should either be given in the financial statements or incorporated by cross-reference from the financial statements to some other statement, such as a management commentary or risk report, that is available to users of the financial statements on the same terms as the financial statements and at the same time (IFRS 7 Appx B6). It will generally be easier for a user to identify the audited information if it is all presented in the notes to the financial statements.
4.1 Insurance risk
IFRS4p39(a) The risk under any one insurance contract is the possibility that the insured event occurs and the uncertainty of the amount of the resulting claim. By the very nature of an insurance contract, this risk is random and therefore unpredictable.
For a portfolio of insurance contracts where the theory of probability is applied to pricing and provisioning, the principal risk that the Group faces under its insurance contracts is that the actual claims and benefit payments exceed the carrying amount of the insurance liabilities. This could occur because the frequency or severity of claims and benefits are greater than estimated. Insurance events are random, and the actual number and amount of claims and benefits will vary from year to year from the level established using statistical techniques.
Experience shows that the larger the portfolio of similar insurance contracts, the smaller the relative variability about the expected outcome will be. In addition, a more diversified portfolio is less likely to be affected by a change in any subset of the portfolio. The Group has developed its insurance underwriting strategy to diversify the type of insurance risks accepted and within each of these categories to achieve a sufficiently large population of risks to reduce the variability of the expected outcome.
Factors that aggravate insurance risk include lack of risk diversification in terms of type and amount of risk, geographical location and type of industry covered.
4.1.1 Casualty insurance risks
IFRS4p38 (a) Frequency and severity of claims
IFRS4p39(a), (c) The frequency and severity of claims can be affected by several factors. The most significant are the increasing level of awards for the damage suffered as a result of exposure to asbestos, and the increase in the number of cases coming to court that
48 PricewaterhouseCoopers
Notes to the consolidated financial statements (continued)(All amounts in euro thousands unless otherwise stated)
have been inactive or latent for a long period of time. Estimated inflation is also a significant factor due to the long period typically required to settle these cases.
The Group manages these risks through its underwriting strategy, adequate reinsurance arrangements and proactive claims handling.
The underwriting strategy attempts to ensure that the underwritten risks are well diversified in terms of type and amount of risk, industry and geography.
Underwriting limits are in place to enforce appropriate risk selection criteria. For example, the Group has the right not to renew individual policies, it can impose deductibles and it has the right to reject the payment of a fraudulent claim. Insurance contracts also entitle the Group to pursue third parties for payment of some or all costs (for example, subrogation). Furthermore, the Group’s strategy limits the total exposure to any one territory to 40% of the total Group exposure, and the exposure to any one industry to 25% of the total Group exposure. In certain territories, legislation requires the maximum loss under each employers’ liability contracts never to be lower than a prescribed amount. All the Group employers’ liability contracts offer maximum cover in compliance with such minimums (£10 million in the UK and €15 million in Euravia). Any contract in which the Group is committed to cover risks in excess of €25 million requires head office approval.
The reinsurance arrangements include excess, stop-loss and catastrophe coverage. The effect of such reinsurance arrangements is that the Group should not suffer total net insurance losses of more than €40 million in any one year. In addition to the overall Group reinsurance programme, individual business units are permitted to purchase additional reinsurance protection.
The Group has specialised claims units dealing with the mitigation of risks surrounding known asbestos claims. This unit investigates and adjusts all asbestos claims. The asbestos claims are reviewed individually at least semi-annually and adjusted to reflect the latest information on the underlying facts, current law, jurisdiction, contractual terms and conditions, and other factors. The Group actively manages and pursues early settlements of asbestos claims to reduce its exposure to unpredictable developments.
IFRS4p39(c)(ii) The concentration of insurance risk before and after reinsurance by territory in relation to the type of casualty insurance risk accepted is summarised below, with reference to the carrying amount of the insurance liabilities (gross and net of reinsurance) arising from casualty insurance contracts:
Year ended 31 December 2009
Type of risk
TerritoryEmployers’
liabilityPublic
liability
Other types of
casualty risk Total
Euravia Gross 22,741 3,173 513 26,427Net 21,015 2,910 388 24,313
US Gross 51,951 7,618 519 60,088Net 12,546 2,344 382 15,272
UK Gross 37,826 11,614 1,855 51,295Net 37,110 6,586 1,569 45,266
Total Gross 112,518 22,405 2,887 137,810Net 70,671 11,840 2,339 84,850
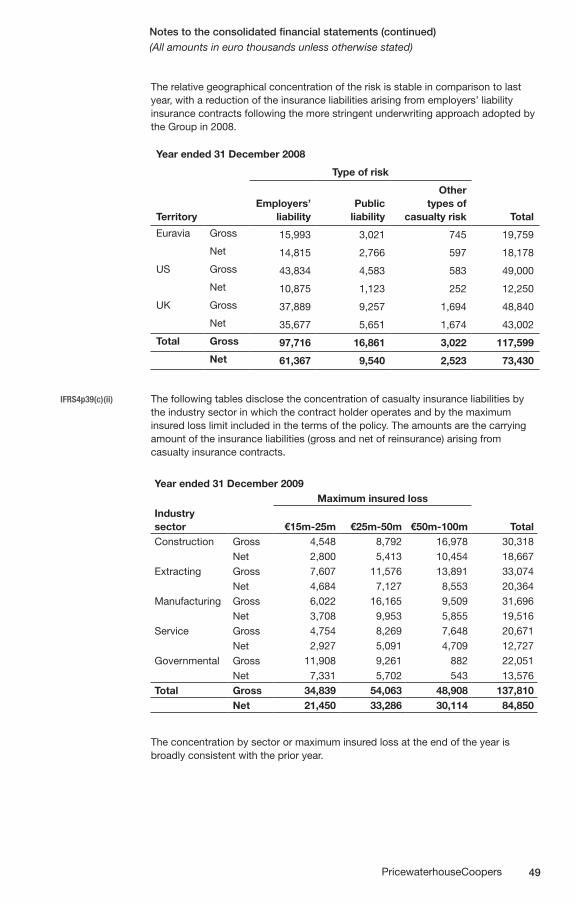
49PricewaterhouseCoopers
Notes to the consolidated financial statements (continued)(All amounts in euro thousands unless otherwise stated)
The relative geographical concentration of the risk is stable in comparison to last year, with a reduction of the insurance liabilities arising from employers’ liability insurance contracts following the more stringent underwriting approach adopted by the Group in 2008.
Year ended 31 December 2008
Type of risk
TerritoryEmployers’
liabilityPublic
liability
Other types of
casualty risk Total
Euravia Gross 15,993 3,021 745 19,759
Net 14,815 2,766 597 18,178
US Gross 43,834 4,583 583 49,000
Net 10,875 1,123 252 12,250
UK Gross 37,889 9,257 1,694 48,840
Net 35,677 5,651 1,674 43,002
Total Gross 97,716 16,861 3,022 117,599
Net 61,367 9,540 2,523 73,430
IFRS4p39(c)(ii) The following tables disclose the concentration of casualty insurance liabilities by the industry sector in which the contract holder operates and by the maximum insured loss limit included in the terms of the policy. The amounts are the carrying amount of the insurance liabilities (gross and net of reinsurance) arising from casualty insurance contracts.
Year ended 31 December 2009Maximum insured loss
Industry sector €15m-25m €25m-50m €50m-100m TotalConstruction Gross 4,548 8,792 16,978 30,318
Net 2,800 5,413 10,454 18,667Extracting Gross 7,607 11,576 13,891 33,074
Net 4,684 7,127 8,553 20,364Manufacturing Gross 6,022 16,165 9,509 31,696
Net 3,708 9,953 5,855 19,516Service Gross 4,754 8,269 7,648 20,671
Net 2,927 5,091 4,709 12,727Governmental Gross 11,908 9,261 882 22,051
Net 7,331 5,702 543 13,576Total Gross 34,839 54,063 48,908 137,810
Net 21,450 33,286 30,114 84,850
The concentration by sector or maximum insured loss at the end of the year is broadly consistent with the prior year.
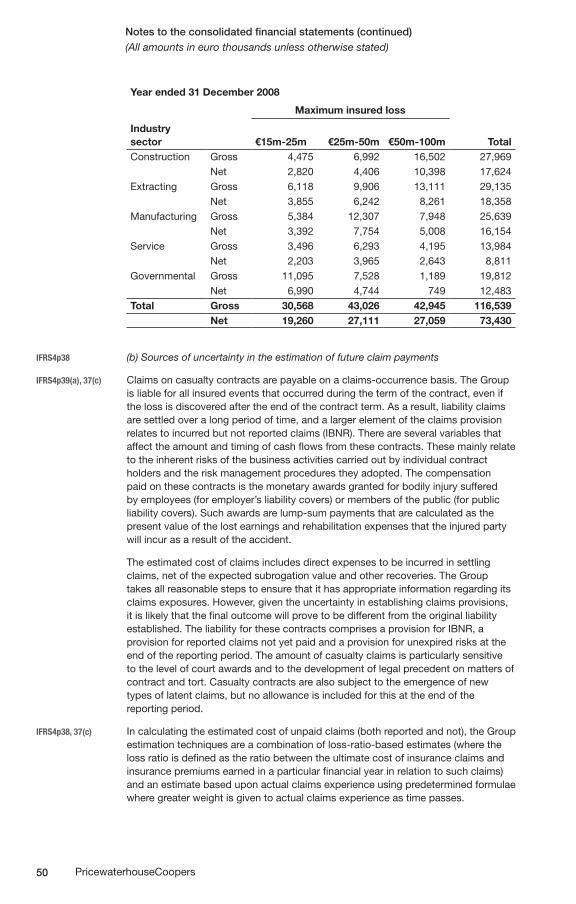
50 PricewaterhouseCoopers
Notes to the consolidated financial statements (continued)(All amounts in euro thousands unless otherwise stated)
Year ended 31 December 2008
Maximum insured loss
Industry sector €15m-25m €25m-50m €50m-100m TotalConstruction Gross 4,475 6,992 16,502 27,969
Net 2,820 4,406 10,398 17,624Extracting Gross 6,118 9,906 13,111 29,135
Net 3,855 6,242 8,261 18,358Manufacturing Gross 5,384 12,307 7,948 25,639
Net 3,392 7,754 5,008 16,154Service Gross 3,496 6,293 4,195 13,984
Net 2,203 3,965 2,643 8,811Governmental Gross 11,095 7,528 1,189 19,812
Net 6,990 4,744 749 12,483Total Gross 30,568 43,026 42,945 116,539
Net 19,260 27,111 27,059 73,430
IFRS4p38 (b) Sources of uncertainty in the estimation of future claim payments
IFRS4p39(a), 37(c) Claims on casualty contracts are payable on a claims-occurrence basis. The Group is liable for all insured events that occurred during the term of the contract, even if the loss is discovered after the end of the contract term. As a result, liability claims are settled over a long period of time, and a larger element of the claims provision relates to incurred but not reported claims (IBNR). There are several variables that affect the amount and timing of cash flows from these contracts. These mainly relate to the inherent risks of the business activities carried out by individual contract holders and the risk management procedures they adopted. The compensation paid on these contracts is the monetary awards granted for bodily injury suffered by employees (for employer’s liability covers) or members of the public (for public liability covers). Such awards are lump-sum payments that are calculated as the present value of the lost earnings and rehabilitation expenses that the injured party will incur as a result of the accident.
The estimated cost of claims includes direct expenses to be incurred in settling claims, net of the expected subrogation value and other recoveries. The Group takes all reasonable steps to ensure that it has appropriate information regarding its claims exposures. However, given the uncertainty in establishing claims provisions, it is likely that the final outcome will prove to be different from the original liability established. The liability for these contracts comprises a provision for IBNR, a provision for reported claims not yet paid and a provision for unexpired risks at the end of the reporting period. The amount of casualty claims is particularly sensitive to the level of court awards and to the development of legal precedent on matters of contract and tort. Casualty contracts are also subject to the emergence of new types of latent claims, but no allowance is included for this at the end of the reporting period.
IFRS4p38, 37(c) In calculating the estimated cost of unpaid claims (both reported and not), the Group estimation techniques are a combination of loss-ratio-based estimates (where the loss ratio is defined as the ratio between the ultimate cost of insurance claims and insurance premiums earned in a particular financial year in relation to such claims) and an estimate based upon actual claims experience using predetermined formulae where greater weight is given to actual claims experience as time passes.
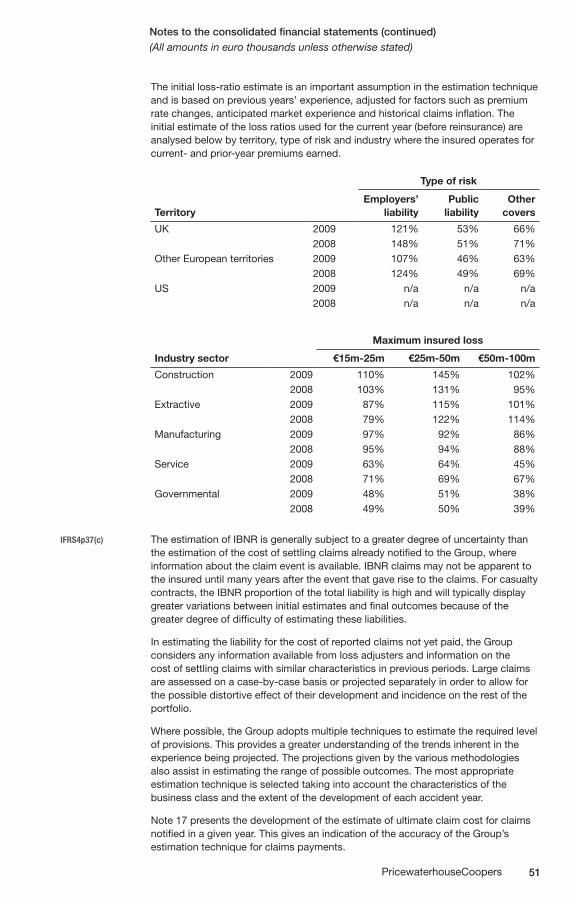
51PricewaterhouseCoopers
Notes to the consolidated financial statements (continued)(All amounts in euro thousands unless otherwise stated)
The initial loss-ratio estimate is an important assumption in the estimation technique and is based on previous years’ experience, adjusted for factors such as premium rate changes, anticipated market experience and historical claims inflation. The initial estimate of the loss ratios used for the current year (before reinsurance) are analysed below by territory, type of risk and industry where the insured operates for current- and prior-year premiums earned.
Type of risk
TerritoryEmployers’
liabilityPublic
liabilityOther
covers
UK 2009 121% 53% 66%2008 148% 51% 71%
Other European territories 2009 107% 46% 63%2008 124% 49% 69%
US 2009 n/a n/a n/a2008 n/a n/a n/a
Maximum insured loss
Industry sector €15m-25m €25m-50m €50m-100m
Construction 2009 110% 145% 102%2008 103% 131% 95%
Extractive 2009 87% 115% 101%2008 79% 122% 114%
Manufacturing 2009 97% 92% 86%2008 95% 94% 88%
Service 2009 63% 64% 45%2008 71% 69% 67%
Governmental 2009 48% 51% 38%2008 49% 50% 39%
IFRS4p37(c) The estimation of IBNR is generally subject to a greater degree of uncertainty than the estimation of the cost of settling claims already notified to the Group, where information about the claim event is available. IBNR claims may not be apparent to the insured until many years after the event that gave rise to the claims. For casualty contracts, the IBNR proportion of the total liability is high and will typically display greater variations between initial estimates and final outcomes because of the greater degree of difficulty of estimating these liabilities.
In estimating the liability for the cost of reported claims not yet paid, the Group considers any information available from loss adjusters and information on the cost of settling claims with similar characteristics in previous periods. Large claims are assessed on a case-by-case basis or projected separately in order to allow for the possible distortive effect of their development and incidence on the rest of the portfolio.
Where possible, the Group adopts multiple techniques to estimate the required level of provisions. This provides a greater understanding of the trends inherent in the experience being projected. The projections given by the various methodologies also assist in estimating the range of possible outcomes. The most appropriate estimation technique is selected taking into account the characteristics of the business class and the extent of the development of each accident year.
Note 17 presents the development of the estimate of ultimate claim cost for claims notified in a given year. This gives an indication of the accuracy of the Group’s estimation technique for claims payments.
52 PricewaterhouseCoopers
Notes to the consolidated financial statements (continued)(All amounts in euro thousands unless otherwise stated)
IFRS4p37(c) (c) Process used to decide on assumptions
The risks associated with these insurance contracts are complex and subject to a number of variables that complicate quantitative sensitivity analysis. However, the exposure of the Group to claims associated with asbestos-related diseases is material and is described in detail in this section. This exposure is geographically concentrated in the US and UK.
The Group uses assumptions based on a mixture of internal and market data to measure its asbestos-related claims liabilities. Internal data is derived mostly from the Group’s quarterly claims reports and screening of the actual insurance contracts carried out at year-end 2009 to derive data for the contracts held. The Group has reviewed the individual contracts and in particular the industries in which the insured companies operate and the actual exposure years of claims. This information is used to develop scenarios related to the latency of claims that are used for the projections of the ultimate number of claims.
These projections are carried out separately for two classes in which asbestos claims have been classified. The aim in this classification is to group claims based on their severity. The categories used in the analysis are non-malignant diseases (mainly pleural plaques), and mesothelioma and asbestosis.
The modelling of claims arising from mesothelioma, the most severe disease associated with asbestos, is based on studies published in the US and the UK and attempts to extrapolate historical asbestos-related mortality rates. Individuals with asbestosis and non-malignant types of disease are entitled to lower compensation due to the fact that the disease arises from a relatively limited exposure to asbestos and is less severe than mesothelioma.
For each disease category, the cost of the future claims includes estimates of the cost for the pure indemnity and the associated handling costs (including defence and legal costs). Market data is used to assess the indemnity inflation rates for each type of disease and its estimated future evolution. An inflation factor is therefore calculated for each year/disease. Different rates are used for UK claims and US claims.
The estimated cost of claims for each year and each disease is the product of the projections of claims number, the average claims sizes and the inflation factor. These figures are then summed up over years and types of disease. For each contract, estimated losses are compared to the maximum loss payable under the terms of the policy and reduced to such amount if lower than the estimated loss.
For all other casualty risks, the Group uses several statistical methods to incorporate the various assumptions made in order to estimate the ultimate cost of claims. The two methods more commonly used are the chain-ladder and the Bornhuetter-Ferguson methods.
Chain-ladder methods may be applied to premiums, paid claims or incurred claims (for example, paid claims plus case estimates). The basic technique involves the analysis of historical claims development factors and the selection of estimated development factors based on this historical pattern. The selected development factors are then applied to cumulative claims data for each accident year that is not yet fully developed to produce an estimated ultimate claims cost for each accident year.
Chain-ladder techniques are most appropriate for those accident years and classes of business that have reached a relatively stable development pattern. Chain-ladder techniques are less suitable in cases in which the insurer does not have a developed claims history for a particular class of business.
53PricewaterhouseCoopers
Notes to the consolidated financial statements (continued)(All amounts in euro thousands unless otherwise stated)
The Bornhuetter-Ferguson method uses a combination of a benchmark or market- based estimate and an estimate based on claims experience. The former is based on a measure of exposure such as premiums; the latter is based on the paid or incurred claims to date. The two estimates are combined using a formula that gives more weight to the experience-based estimate as time passes. This technique has been used in situations in which developed claims experience was not available for the projection (recent accident years or new classes of business).
The choice of selected results for each accident year of each class of business depends on an assessment of the technique that has been most appropriate to observed historical developments. In certain instances, this has meant that different techniques or combinations of techniques have been selected for individual accident years or groups of accident years within the same class of business.
IFRS4p37(d) (d) Change in assumptions and sensitivity analysis
The additional net insurance reserves arising in respect of prior years of €9,320 (2008: €2,228) includes a movement of €5,618 (2008: €912) that has arisen due to changes in the assumptions used to estimate the ultimate cost of asbestos-related claims payment (for €4,417).
As explained in Note 3, the assumptions used to estimate these liabilities require judgement and are subject to great uncertainty.
The change in the assumptions for asbestos amounts to a net increase of €4,417 and relates to the frequency of mesothelioma and asbestosis and non-malignant diseases claims. These projections have been updated to take account of claims experience during the year. During 2009, the Group estimation model for asbestos- related claims has been updated to reflect the following changes in assumptions:
The increasingly heavy punitive elements included in litigation awards in the US •and in the other territories where the Group has incurred this type of claim.The increase in the tendency for non-US claimants to seek a resolution through a •court decision (more expensive on average than out-of-court settlements).Changes to the actual legal costs incurred driven by the method of paying these •costs (for example, fixed cost or share of court award).
The revised assumptions resulted in an increased charge to the income statement reflecting an increased liability.
IFRS4p39(c)(i)(iii) (e) Sensitivity analysis – sensitivity of asbestos-related liabilities and claims development tables
The reasonableness of the estimation process is tested by an analysis of sensitivity around several different scenarios. The change in average indemnity awards allowing for alternative inflation rates and different proportions of mesothelioma and non-malignant claims is the scenario that is the most critical to the assumptions used to estimate the liabilities for these insurance contracts.
The impact on profit or loss before tax described above does not take account of changes in other variables, as they are considered to be less material. Such an assessment and the relative materiality of individual variables may change in the future.
4.1.2 Long-term insurance contracts
IFRS4p38 (a) Frequency and severity of claims
IFRS4p39(a)(c) For contracts where death is the insured risk, the most significant factors that could increase the overall frequency of claims are epidemics (such as AIDS, SARS and a human form of avian flu) or widespread changes in lifestyle, such as eating,
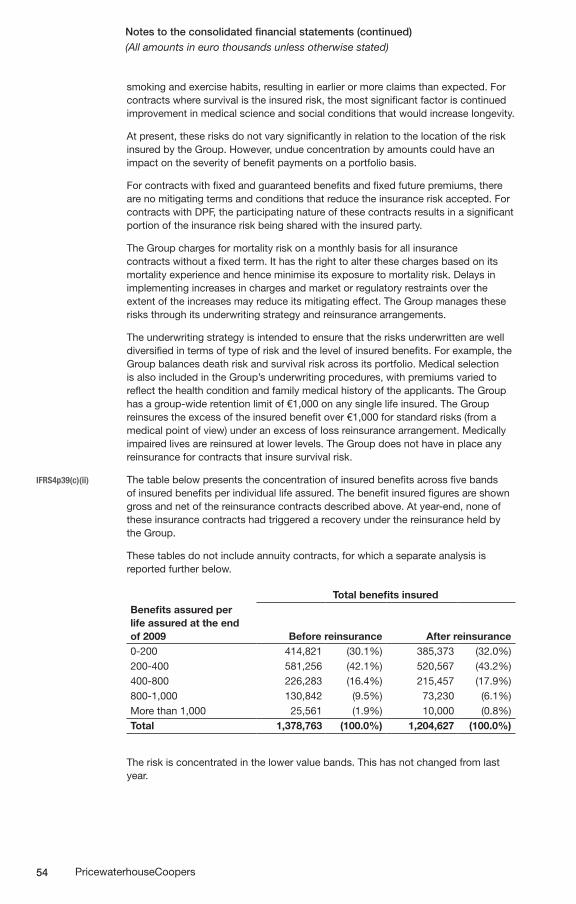
54 PricewaterhouseCoopers
Notes to the consolidated financial statements (continued)(All amounts in euro thousands unless otherwise stated)
smoking and exercise habits, resulting in earlier or more claims than expected. For contracts where survival is the insured risk, the most significant factor is continued improvement in medical science and social conditions that would increase longevity.
At present, these risks do not vary significantly in relation to the location of the risk insured by the Group. However, undue concentration by amounts could have an impact on the severity of benefit payments on a portfolio basis.
For contracts with fixed and guaranteed benefits and fixed future premiums, there are no mitigating terms and conditions that reduce the insurance risk accepted. For contracts with DPF, the participating nature of these contracts results in a significant portion of the insurance risk being shared with the insured party.
The Group charges for mortality risk on a monthly basis for all insurance contracts without a fixed term. It has the right to alter these charges based on its mortality experience and hence minimise its exposure to mortality risk. Delays in implementing increases in charges and market or regulatory restraints over the extent of the increases may reduce its mitigating effect. The Group manages these risks through its underwriting strategy and reinsurance arrangements.
The underwriting strategy is intended to ensure that the risks underwritten are well diversified in terms of type of risk and the level of insured benefits. For example, the Group balances death risk and survival risk across its portfolio. Medical selection is also included in the Group’s underwriting procedures, with premiums varied to reflect the health condition and family medical history of the applicants. The Group has a group-wide retention limit of €1,000 on any single life insured. The Group reinsures the excess of the insured benefit over €1,000 for standard risks (from a medical point of view) under an excess of loss reinsurance arrangement. Medically impaired lives are reinsured at lower levels. The Group does not have in place any reinsurance for contracts that insure survival risk.
IFRS4p39(c)(ii) The table below presents the concentration of insured benefits across five bands of insured benefits per individual life assured. The benefit insured figures are shown gross and net of the reinsurance contracts described above. At year-end, none of these insurance contracts had triggered a recovery under the reinsurance held by the Group.
These tables do not include annuity contracts, for which a separate analysis is reported further below.
Total benefits insuredBenefits assured per life assured at the end of 2009 Before reinsurance After reinsurance0-200 414,821 (30.1%) 385,373 (32.0%)200-400 581,256 (42.1%) 520,567 (43.2%)400-800 226,283 (16.4%) 215,457 (17.9%)800-1,000 130,842 (9.5%) 73,230 (6.1%)More than 1,000 25,561 (1.9%) 10,000 (0.8%)Total 1,378,763 (100.0%) 1,204,627 (100.0%)
The risk is concentrated in the lower value bands. This has not changed from last year.
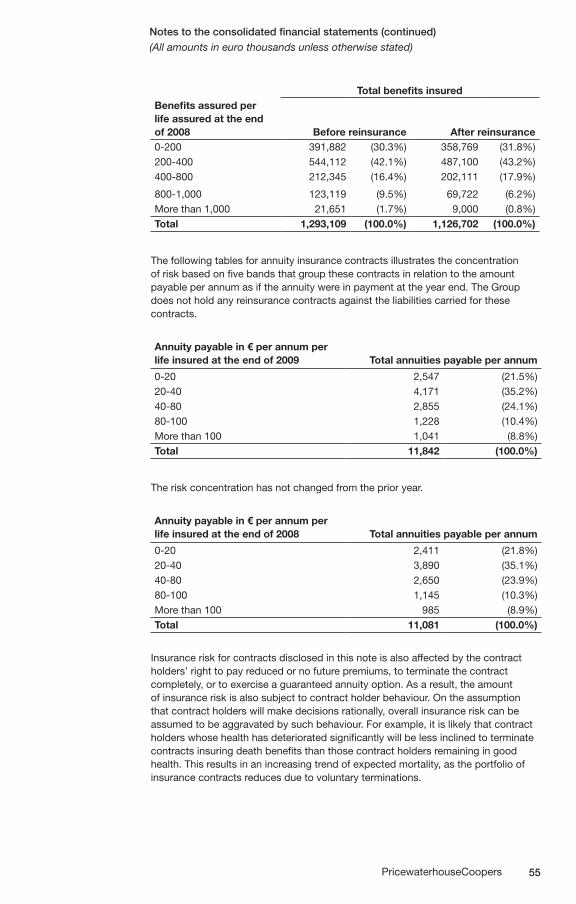
55PricewaterhouseCoopers
Notes to the consolidated financial statements (continued)(All amounts in euro thousands unless otherwise stated)
Total benefits insuredBenefits assured per life assured at the end of 2008 Before reinsurance After reinsurance0-200 391,882 (30.3%) 358,769 (31.8%)200-400 544,112 (42.1%) 487,100 (43.2%)400-800 212,345 (16.4%) 202,111 (17.9%)
800-1,000 123,119 (9.5%) 69,722 (6.2%)More than 1,000 21,651 (1.7%) 9,000 (0.8%)Total 1,293,109 (100.0%) 1,126,702 (100.0%)
The following tables for annuity insurance contracts illustrates the concentration of risk based on five bands that group these contracts in relation to the amount payable per annum as if the annuity were in payment at the year end. The Group does not hold any reinsurance contracts against the liabilities carried for these contracts.
Annuity payable in € per annum per life insured at the end of 2009 Total annuities payable per annum
0-20 2,547 (21.5%)20-40 4,171 (35.2%)40-80 2,855 (24.1%)80-100 1,228 (10.4%)More than 100 1,041 (8.8%)Total 11,842 (100.0%)
The risk concentration has not changed from the prior year.
Annuity payable in € per annum per life insured at the end of 2008 Total annuities payable per annum
0-20 2,411 (21.8%)20-40 3,890 (35.1%)40-80 2,650 (23.9%)80-100 1,145 (10.3%)More than 100 985 (8.9%)Total 11,081 (100.0%)
Insurance risk for contracts disclosed in this note is also affected by the contract holders’ right to pay reduced or no future premiums, to terminate the contract completely, or to exercise a guaranteed annuity option. As a result, the amount of insurance risk is also subject to contract holder behaviour. On the assumption that contract holders will make decisions rationally, overall insurance risk can be assumed to be aggravated by such behaviour. For example, it is likely that contract holders whose health has deteriorated significantly will be less inclined to terminate contracts insuring death benefits than those contract holders remaining in good health. This results in an increasing trend of expected mortality, as the portfolio of insurance contracts reduces due to voluntary terminations.
56 PricewaterhouseCoopers
Notes to the consolidated financial statements (continued)(All amounts in euro thousands unless otherwise stated)
The Group has factored the impact of contract holders’ behaviour into the assumptions used to measure these liabilities (see Note 17).
IFRS4p37(c) (b) Sources of uncertainty in the estimation of future benefit payments and premium receipts
IFRS4p38, Uncertainty in the estimation of future benefit payments and premium receipts for39(a) long-term insurance contracts arises from the unpredictability of long-term changes
in overall levels of mortality and the variability in contract holder behaviour.
The Group uses appropriate base tables of standard mortality according to the type of contract being written and the territory in which the insured person resides. An investigation into the actual experience of the Group over the last three years is carried out, and statistical methods are used to adjust the crude mortality rates to produce a best estimate of expected mortality for the future. Where data is sufficient to be statistically credible, the statistics generated by the data are used without reference to an industry table. Where this is not the case, the best estimate of future mortality is based on standard industry tables adjusted for the Group’s overall experience. For contracts that insure survival, an adjustment is made for future mortality improvements based on trends identified in the data and in the continuous mortality investigations performed by independent actuarial bodies. The impact of any historical evidence of selective termination behaviour will be reflected in this experience. The Group maintains voluntary termination statistics to investigate the deviation of actual termination experience against assumptions. Statistical methods are used to determine appropriate termination rates. An allowance is then made for any trends in the data to arrive at a best estimate of future termination rates.
(c) Process used to decide on assumptions
IFRS4p37(c) For long-term insurance contracts with fixed and guaranteed terms and with DPF, estimates are made in two stages. At inception of the contract, the Group determines assumptions in relation to future deaths, voluntary terminations, investment returns and administration expenses. These assumptions are used for calculating the liabilities during the life of the contract. A margin for risk and uncertainty is added to these assumptions. These assumptions are ‘locked in’ for the duration of the contract.
Subsequently, new estimates are developed at each reporting date to determine whether liabilities are adequate in the light of the latest current estimates. The initial assumptions are not altered if the liabilities are considered adequate. If the liabilities are not adequate, the assumptions are altered (‘unlocked’) to reflect the latest current estimates; no margin is added to the assumptions in this event. As a result, the effect of changes in the underlying variables on insurance liabilities and related assets shown in paragraph (d) below is not symmetrical. Improvements in estimates have no impact on the value of the liabilities and related assets, while significant enough deteriorations in estimates have an impact.
For long-term insurance contracts without fixed terms and for investment contracts with DPF, the assumptions used to determine the liabilities do not contain margins and are not locked in but are updated at each reporting date to reflect the latest estimates. Assumptions are considered to be ‘best estimate’ if, on average, the results are expected to be worse than the assumptions in 50% of possible scenarios and better in the other 50%.
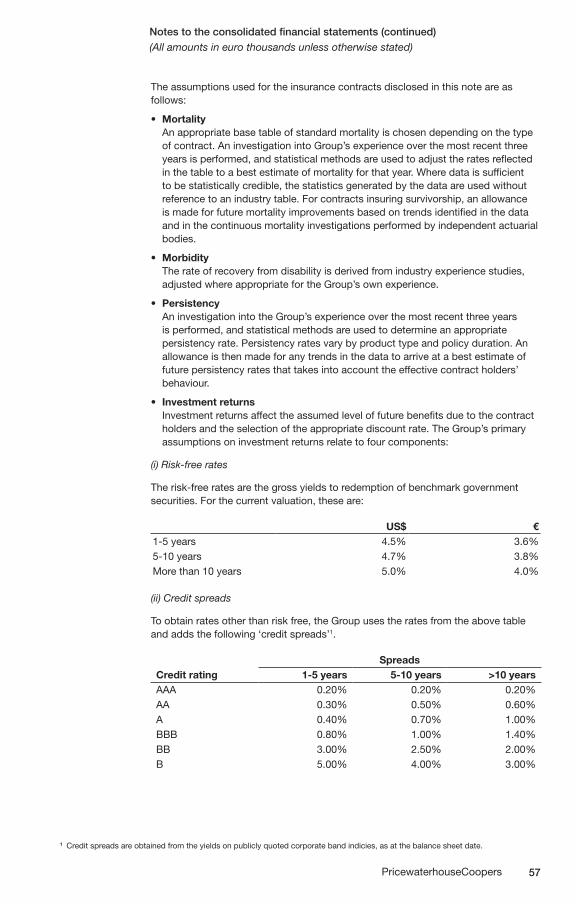
57PricewaterhouseCoopers
Notes to the consolidated financial statements (continued)(All amounts in euro thousands unless otherwise stated)
The assumptions used for the insurance contracts disclosed in this note are as follows:
Mortality• An appropriate base table of standard mortality is chosen depending on the type of contract. An investigation into Group’s experience over the most recent three years is performed, and statistical methods are used to adjust the rates reflected in the table to a best estimate of mortality for that year. Where data is sufficient to be statistically credible, the statistics generated by the data are used without reference to an industry table. For contracts insuring survivorship, an allowance is made for future mortality improvements based on trends identified in the data and in the continuous mortality investigations performed by independent actuarial bodies.
Morbidity• The rate of recovery from disability is derived from industry experience studies, adjusted where appropriate for the Group’s own experience.
Persistency• An investigation into the Group’s experience over the most recent three years is performed, and statistical methods are used to determine an appropriate persistency rate. Persistency rates vary by product type and policy duration. An allowance is then made for any trends in the data to arrive at a best estimate of future persistency rates that takes into account the effective contract holders’ behaviour.
Investment returns •Investment returns affect the assumed level of future benefits due to the contract holders and the selection of the appropriate discount rate. The Group’s primary assumptions on investment returns relate to four components:
(i) Risk-free rates
The risk-free rates are the gross yields to redemption of benchmark government securities. For the current valuation, these are:
US$ €1-5 years 4.5% 3.6%5-10 years 4.7% 3.8%More than 10 years 5.0% 4.0%
(ii) Credit spreads
To obtain rates other than risk free, the Group uses the rates from the above table and adds the following ‘credit spreads’1.
SpreadsCredit rating 1-5 years 5-10 years >10 yearsAAA 0.20% 0.20% 0.20%AA 0.30% 0.50% 0.60%A 0.40% 0.70% 1.00%BBB 0.80% 1.00% 1.40%BB 3.00% 2.50% 2.00%B 5.00% 4.00% 3.00%
1 Credit spreads are obtained from the yields on publicly quoted corporate band indicies, as at the balance sheet date.
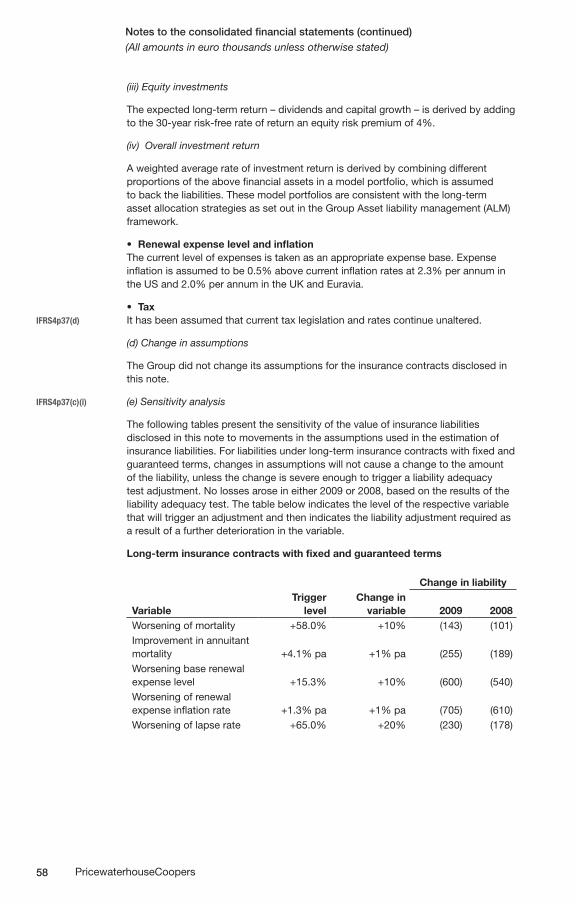
58 PricewaterhouseCoopers
Notes to the consolidated financial statements (continued)(All amounts in euro thousands unless otherwise stated)
(iii) Equity investments
The expected long-term return – dividends and capital growth – is derived by adding to the 30-year risk-free rate of return an equity risk premium of 4%.
(iv) Overall investment return
A weighted average rate of investment return is derived by combining different proportions of the above financial assets in a model portfolio, which is assumed to back the liabilities. These model portfolios are consistent with the long-term asset allocation strategies as set out in the Group Asset liability management (ALM) framework.
• Renewal expense level and inflation The current level of expenses is taken as an appropriate expense base. Expense
inflation is assumed to be 0.5% above current inflation rates at 2.3% per annum in the US and 2.0% per annum in the UK and Euravia.
• TaxIFRS4p37(d) It has been assumed that current tax legislation and rates continue unaltered.
(d) Change in assumptions
The Group did not change its assumptions for the insurance contracts disclosed in this note.
IFRS4p37(c)(i) (e) Sensitivity analysis
The following tables present the sensitivity of the value of insurance liabilities disclosed in this note to movements in the assumptions used in the estimation of insurance liabilities. For liabilities under long-term insurance contracts with fixed and guaranteed terms, changes in assumptions will not cause a change to the amount of the liability, unless the change is severe enough to trigger a liability adequacy test adjustment. No losses arose in either 2009 or 2008, based on the results of the liability adequacy test. The table below indicates the level of the respective variable that will trigger an adjustment and then indicates the liability adjustment required as a result of a further deterioration in the variable.
Long-term insurance contracts with fixed and guaranteed terms
Change in liability
VariableTrigger
levelChange in
variable 2009 2008Worsening of mortality +58.0% +10% (143) (101)Improvement in annuitant mortality +4.1% pa +1% pa (255) (189)Worsening base renewal expense level +15.3% +10% (600) (540)Worsening of renewal expense inflation rate +1.3% pa +1% pa (705) (610)Worsening of lapse rate +65.0% +20% (230) (178)
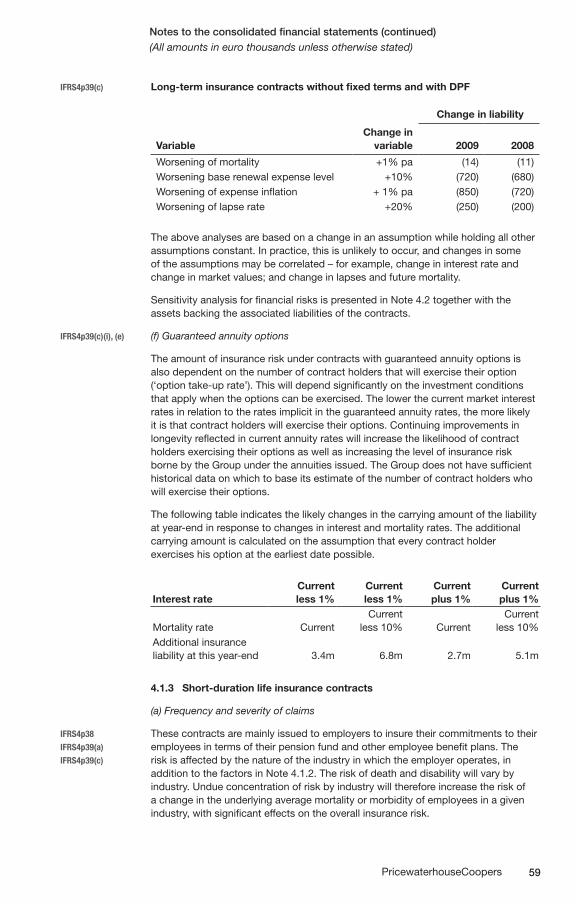
59PricewaterhouseCoopers
Notes to the consolidated financial statements (continued)(All amounts in euro thousands unless otherwise stated)
IFRS4p39(c) Long-term insurance contracts without fixed terms and with DPF
Change in liability
VariableChange in
variable 2009 2008
Worsening of mortality +1% pa (14) (11)Worsening base renewal expense level +10% (720) (680)Worsening of expense inflation + 1% pa (850) (720)Worsening of lapse rate +20% (250) (200)
The above analyses are based on a change in an assumption while holding all other assumptions constant. In practice, this is unlikely to occur, and changes in some of the assumptions may be correlated – for example, change in interest rate and change in market values; and change in lapses and future mortality.
Sensitivity analysis for financial risks is presented in Note 4.2 together with the assets backing the associated liabilities of the contracts.
IFRS4p39(c)(i), (e) (f) Guaranteed annuity options
The amount of insurance risk under contracts with guaranteed annuity options is also dependent on the number of contract holders that will exercise their option (‘option take-up rate’). This will depend significantly on the investment conditions that apply when the options can be exercised. The lower the current market interest rates in relation to the rates implicit in the guaranteed annuity rates, the more likely it is that contract holders will exercise their options. Continuing improvements in longevity reflected in current annuity rates will increase the likelihood of contract holders exercising their options as well as increasing the level of insurance risk borne by the Group under the annuities issued. The Group does not have sufficient historical data on which to base its estimate of the number of contract holders who will exercise their options.
The following table indicates the likely changes in the carrying amount of the liability at year-end in response to changes in interest and mortality rates. The additional carrying amount is calculated on the assumption that every contract holder exercises his option at the earliest date possible.
Interest rateCurrent less 1%
Current less 1%
Current plus 1%
Current plus 1%
Mortality rate CurrentCurrent
less 10% CurrentCurrent
less 10%Additional insurance liability at this year-end 3.4m 6.8m 2.7m 5.1m
4.1.3 Short-duration life insurance contracts
(a) Frequency and severity of claims
IFRS4p38 These contracts are mainly issued to employers to insure their commitments to theirIFRS4p39(a) employees in terms of their pension fund and other employee benefit plans. TheIFRS4p39(c) risk is affected by the nature of the industry in which the employer operates, in addition to the factors in Note 4.1.2. The risk of death and disability will vary by
industry. Undue concentration of risk by industry will therefore increase the risk of a change in the underlying average mortality or morbidity of employees in a given industry, with significant effects on the overall insurance risk.
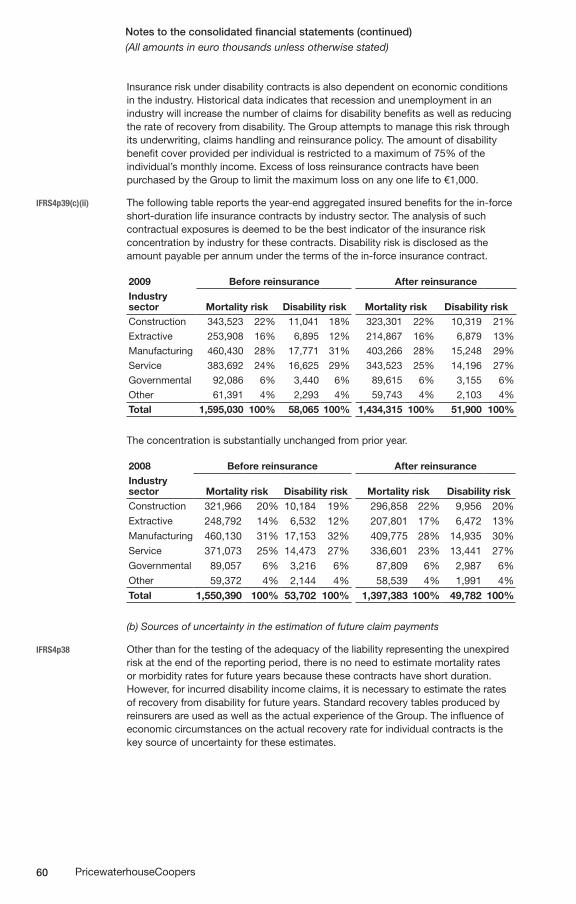
60 PricewaterhouseCoopers
Notes to the consolidated financial statements (continued)(All amounts in euro thousands unless otherwise stated)
Insurance risk under disability contracts is also dependent on economic conditions in the industry. Historical data indicates that recession and unemployment in an industry will increase the number of claims for disability benefits as well as reducing the rate of recovery from disability. The Group attempts to manage this risk through its underwriting, claims handling and reinsurance policy. The amount of disability benefit cover provided per individual is restricted to a maximum of 75% of the individual’s monthly income. Excess of loss reinsurance contracts have been purchased by the Group to limit the maximum loss on any one life to €1,000.
IFRS4p39(c)(ii) The following table reports the year-end aggregated insured benefits for the in-force short-duration life insurance contracts by industry sector. The analysis of such contractual exposures is deemed to be the best indicator of the insurance risk concentration by industry for these contracts. Disability risk is disclosed as the amount payable per annum under the terms of the in-force insurance contract.
2009 Before reinsurance After reinsuranceIndustry sector Mortality risk Disability risk Mortality risk Disability riskConstruction 343,523 22% 11,041 18% 323,301 22% 10,319 21%
Extractive 253,908 16% 6,895 12% 214,867 16% 6,879 13%
Manufacturing 460,430 28% 17,771 31% 403,266 28% 15,248 29%
Service 383,692 24% 16,625 29% 343,523 25% 14,196 27%
Governmental 92,086 6% 3,440 6% 89,615 6% 3,155 6%
Other 61,391 4% 2,293 4% 59,743 4% 2,103 4%
Total 1,595,030 100% 58,065 100% 1,434,315 100% 51,900 100%
The concentration is substantially unchanged from prior year.
2008 Before reinsurance After reinsuranceIndustry sector Mortality risk Disability risk Mortality risk Disability riskConstruction 321,966 20% 10,184 19% 296,858 22% 9,956 20%Extractive 248,792 14% 6,532 12% 207,801 17% 6,472 13%Manufacturing 460,130 31% 17,153 32% 409,775 28% 14,935 30%Service 371,073 25% 14,473 27% 336,601 23% 13,441 27%Governmental 89,057 6% 3,216 6% 87,809 6% 2,987 6%Other 59,372 4% 2,144 4% 58,539 4% 1,991 4%Total 1,550,390 100% 53,702 100% 1,397,383 100% 49,782 100%
(b) Sources of uncertainty in the estimation of future claim payments
IFRS4p38 Other than for the testing of the adequacy of the liability representing the unexpired risk at the end of the reporting period, there is no need to estimate mortality rates or morbidity rates for future years because these contracts have short duration. However, for incurred disability income claims, it is necessary to estimate the rates of recovery from disability for future years. Standard recovery tables produced by reinsurers are used as well as the actual experience of the Group. The influence of economic circumstances on the actual recovery rate for individual contracts is the key source of uncertainty for these estimates.
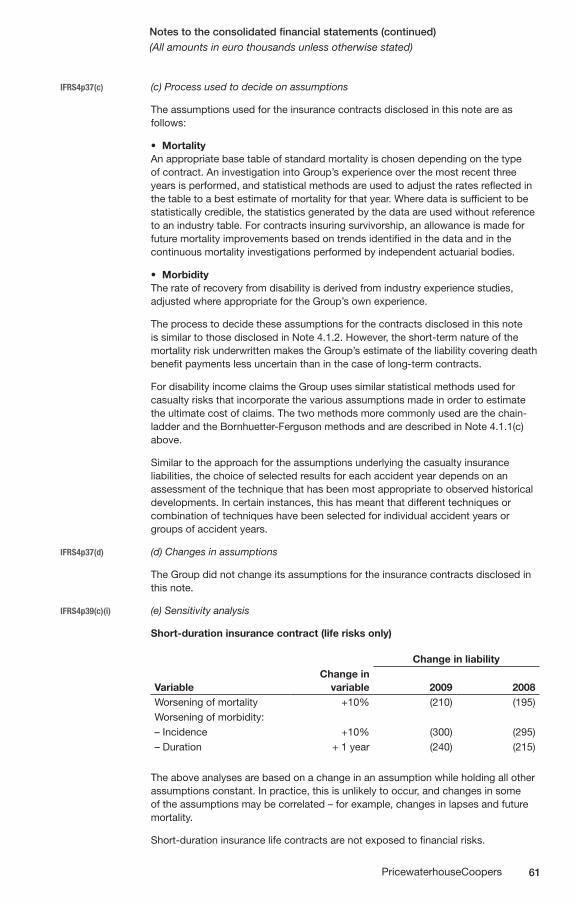
61PricewaterhouseCoopers
Notes to the consolidated financial statements (continued)(All amounts in euro thousands unless otherwise stated)
IFRS4p37(c) (c) Process used to decide on assumptions
The assumptions used for the insurance contracts disclosed in this note are as follows:
• Mortality An appropriate base table of standard mortality is chosen depending on the type
of contract. An investigation into Group’s experience over the most recent three years is performed, and statistical methods are used to adjust the rates reflected in the table to a best estimate of mortality for that year. Where data is sufficient to be statistically credible, the statistics generated by the data are used without reference to an industry table. For contracts insuring survivorship, an allowance is made for future mortality improvements based on trends identified in the data and in the continuous mortality investigations performed by independent actuarial bodies.
Morbidity• The rate of recovery from disability is derived from industry experience studies,
adjusted where appropriate for the Group’s own experience.
The process to decide these assumptions for the contracts disclosed in this note is similar to those disclosed in Note 4.1.2. However, the short-term nature of the mortality risk underwritten makes the Group’s estimate of the liability covering death benefit payments less uncertain than in the case of long-term contracts.
For disability income claims the Group uses similar statistical methods used for casualty risks that incorporate the various assumptions made in order to estimate the ultimate cost of claims. The two methods more commonly used are the chain- ladder and the Bornhuetter-Ferguson methods and are described in Note 4.1.1(c) above.
Similar to the approach for the assumptions underlying the casualty insurance liabilities, the choice of selected results for each accident year depends on an assessment of the technique that has been most appropriate to observed historical developments. In certain instances, this has meant that different techniques or combination of techniques have been selected for individual accident years or groups of accident years.
IFRS4p37(d) (d) Changes in assumptions
The Group did not change its assumptions for the insurance contracts disclosed in this note.
IFRS4p39(c)(i) (e) Sensitivity analysis
Short-duration insurance contract (life risks only)
Change in liability
VariableChange in
variable 2009 2008Worsening of mortality +10% (210) (195)Worsening of morbidity:– Incidence +10% (300) (295)– Duration + 1 year (240) (215)
The above analyses are based on a change in an assumption while holding all other assumptions constant. In practice, this is unlikely to occur, and changes in some of the assumptions may be correlated – for example, changes in lapses and future mortality.
Short-duration insurance life contracts are not exposed to financial risks.
62 PricewaterhouseCoopers
Notes to the consolidated financial statements (continued)(All amounts in euro thousands unless otherwise stated)
4.1.4 Property insurance contracts
IFRS4p38 (a) Frequency and severity of claims
IFRS4p39(a), 37(c) For property insurance contracts, climatic changes give rise to more frequent and severe extreme weather events (for example, river flooding, hurricanes and typhoons) and their consequences (for example, subsidence claims). For certain contracts, the Group has also limited the number of claims that can be paid in any policy year or introduced a maximum amount payable for claims in any policy year.
The Group has the right to re-price the risk on renewal. It also has the ability to impose deductibles and reject fraudulent claims. These contracts are underwritten by reference to the commercial replacement value of the properties and contents insured, and claims payment limits are always included to cap the amount payable on occurrence of the insured event. Cost of rebuilding properties, of replacement or indemnity for contents and time taken to restart operations for business interruption are the key factors that influence the level of claims under these policies. The greatest likelihood of significant losses on these contracts arises from storm or flood damage. The Group has reinsurance cover for such damage to limit losses to €3,000 in any one year.
Property insurance contracts are subdivided into four risk groups: fire, business interruption, weather damage and theft. The insurance risk arising from these contracts is not concentrated in any of the territories in which the Group operates, and there is a balance between commercial and personal properties in the overall portfolio of insured buildings. The Group does not underwrite property insurance contracts outside Europe.
IFRS4p38 (b) Sources of uncertainty in the estimation of future claim payments
IFRS4p39(a), 37(c) Property claims are analysed separately for subsidence and non-subsidence claims. The development of large losses/catastrophes is analysed separately.Non-subsidence claims can be estimated with greater reliability, and the Group estimation processes reflect all the factors that influence the amount and timing of cash flows from these contracts. The shorter settlement period for these claims allows the Group to achieve a higher degree of certainty about the estimated cost of claims, and relatively little IBNR is held at year-end. However, the longer time needed to assess the emergence of a subsidence claim makes the estimation process more uncertain for these claims. Virtually all the IBNR liability for property insurance contracts relates to subsidence claims.
In particular, the claims experience in 2009 has deteriorated, and both the frequency and severity of subsidence claims have increased significantly. The weather in summer 2009 in Europe has generated a significantly higher number of subsidence claims than usual. The uncertain nature of the costs of this type of claim causes greater uncertainty in the estimates than in previous years. The Group has been monitoring numbers of reported claims on a weekly basis and reflected such information in its assessment of the adequacy of the unearned premium provision held at year end (Note 17). The effect of this unexpected weather may affect prior year claims, due to the re-opening of old claims and higher settlement costs for subsidence claims in the current market. At year-end 2009, the Group believes that its liabilities for subsidence claims are adequate. However, more permanent changes in the European climate may produce a higher frequency and severity of claims than currently expected.
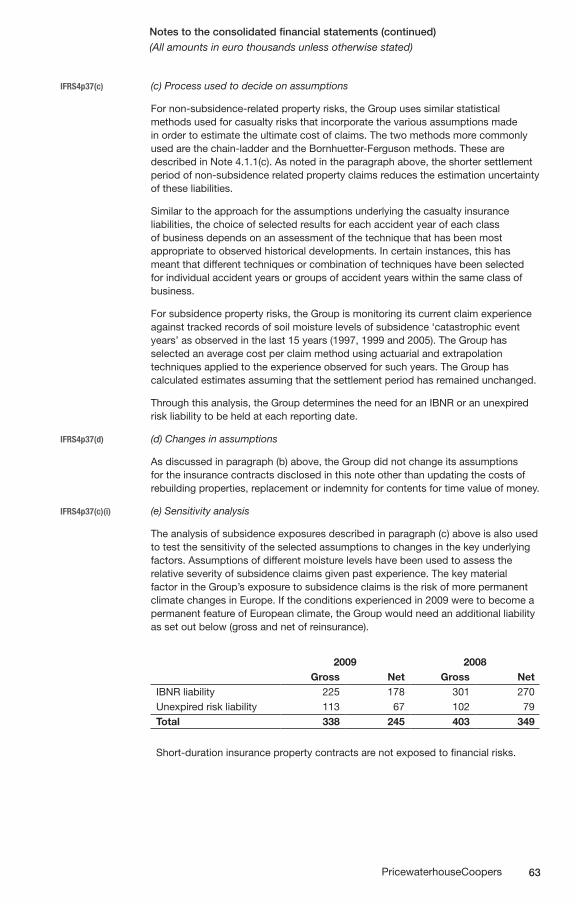
63PricewaterhouseCoopers
Notes to the consolidated financial statements (continued)(All amounts in euro thousands unless otherwise stated)
IFRS4p37(c) (c) Process used to decide on assumptions
For non-subsidence-related property risks, the Group uses similar statistical methods used for casualty risks that incorporate the various assumptions made in order to estimate the ultimate cost of claims. The two methods more commonly used are the chain-ladder and the Bornhuetter-Ferguson methods. These are described in Note 4.1.1(c). As noted in the paragraph above, the shorter settlement period of non-subsidence related property claims reduces the estimation uncertainty of these liabilities.
Similar to the approach for the assumptions underlying the casualty insurance liabilities, the choice of selected results for each accident year of each class of business depends on an assessment of the technique that has been most appropriate to observed historical developments. In certain instances, this has meant that different techniques or combination of techniques have been selected for individual accident years or groups of accident years within the same class of business.
For subsidence property risks, the Group is monitoring its current claim experience against tracked records of soil moisture levels of subsidence ‘catastrophic event years’ as observed in the last 15 years (1997, 1999 and 2005). The Group has selected an average cost per claim method using actuarial and extrapolation techniques applied to the experience observed for such years. The Group has calculated estimates assuming that the settlement period has remained unchanged.
Through this analysis, the Group determines the need for an IBNR or an unexpired risk liability to be held at each reporting date.
IFRS4p37(d) (d) Changes in assumptions
As discussed in paragraph (b) above, the Group did not change its assumptions for the insurance contracts disclosed in this note other than updating the costs of rebuilding properties, replacement or indemnity for contents for time value of money.
IFRS4p37(c)(i) (e) Sensitivity analysis
The analysis of subsidence exposures described in paragraph (c) above is also used to test the sensitivity of the selected assumptions to changes in the key underlying factors. Assumptions of different moisture levels have been used to assess the relative severity of subsidence claims given past experience. The key material factor in the Group’s exposure to subsidence claims is the risk of more permanent climate changes in Europe. If the conditions experienced in 2009 were to become a permanent feature of European climate, the Group would need an additional liability as set out below (gross and net of reinsurance).
2009 2008Gross Net Gross Net
IBNR liability 225 178 301 270Unexpired risk liability 113 67 102 79Total 338 245 403 349
Short-duration insurance property contracts are not exposed to financial risks.
64 PricewaterhouseCoopers
Notes to the consolidated financial statements (continued)(All amounts in euro thousands unless otherwise stated)
4.2 Financial risk
Note
The IFRS 7 and IFRS 4 disclosures illustrated below are an example of how an insurance company may choose to align its financial and insurance risk disclosures with its internal asset liability framework.
The disclosures below are not necessarily indicative of the disclosures that may be required under IFRS 7 and IFRS 4, and companies may approach these disclosures differently in any given circumstance.
The Group is exposed to a range of financial risks through its financial assets, financial liabilities (investment contracts and borrowings), reinsurance assets and insurance liabilities. In particular, the key financial risk is that the in the long-term its investment proceeds are not sufficient to fund the obligations arising from its insurance and investment contracts. The most important components of this financial risk are interest rate risk, equity price risk, foreign currency risk and credit risk.
These risks arise from open positions in interest rate, currency and equity products, all of which are exposed to general and specific market movements. The risks that the Group primarily faces due to the nature of its investments and liabilities are interest rate risk and equity price risk.
IFRS7p33(b) The Group manages these positions within an ALM framework that has beenIFRS4p39(a) developed to achieve long-term investment returns in excess of its obligations
under insurance and investment contracts. Within the ALM framework, the Group periodically produces reports at portfolio, legal entity and asset and liability class level that are circulated to the Group’s key management personnel. The principal technique of the Group’s ALM is to match assets to the liabilities arising from insurance and investment contracts by reference to the type of benefits payable to contract holders. For each distinct class of liabilities, a separate portfolio of assets is maintained. The Group has not changed the processes used to manage its risks from previous periods.
The Group’s ALM is integrated with the management of the financial risks associated with the Group’s other classes of financial assets and liabilities not directly associated with insurance and investment liabilities (in particular, borrowings and investments in foreign operations). The notes below explain how financial risks are managed using the categories utilised in the Group’s ALM framework. In particular, the ALM Framework requires the management of interest rate risk, equity price risk and liquidity risk at the portfolio level. Foreign currency and credit risk are managed on a group-wide basis. To reflect the Group risk management approach, the required disclosures for interest rate, equity price and liquidity risks are given separately for each portfolio of the ALM framework (see Notes 4.2.1 to 4.2.7). Credit risk disclosures are provided for the whole Group in Note 4.2.6.

65PricewaterhouseCoopers
The tables on the following pages reconcile the consolidated balance sheet to the classes and portfolios used in the Group’s ALM framework.
Notes to the consolidated financial statements (continued)(All amounts in euro thousands unless otherwise stated)
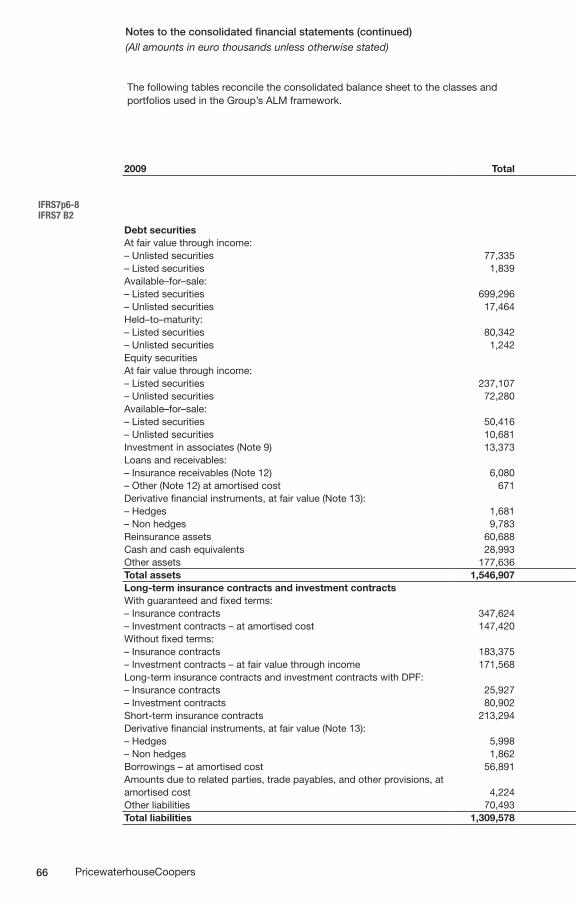
66 PricewaterhouseCoopers
Notes to the consolidated financial statements (continued)(All amounts in euro thousands unless otherwise stated)
The following tables reconcile the consolidated balance sheet to the classes and portfolios used in the Group’s ALM framework.
2009 Total
Fixed andguaranteed
Insurance and
investmentcontracts Contracts with DPF Unit–linked contracts Corporate
IFRS7p6-8 IFRS7 B2
Insurance contracts
Investment contracts
Insurance contracts
Investment contracts
Short–term insurance contracts
Other financial
assets andliabilities
Other assets
and liabilities
Debt securitiesAt fair value through income:– Unlisted securities 77,335 – – – 6,521 21,321 23,993 25,500 –– Listed securities 1,839 – – – – – 1,839 – –Available–for–sale:– Listed securities 699,296 491,437 25,471 82,724 – – 64,164 35,500 –– Unlisted securities 17,464 17,464 – – – – – – –Held–to–maturity:– Listed securities 80,342 80,342 – – – – – – –– Unlisted securities 1,242 1,242 – – – – – – –Equity securitiesAt fair value through income:– Listed securities 237,107 – – – 123,323 113,784 – – –– Unlisted securities 72,280 – – – 47,176 25,104 – – –Available–for–sale:– Listed securities 50,416 – – – – – 50,416 – –– Unlisted securities 10,681 – – – – – 10,681 – –Investment in associates (Note 9) 13,373 – – – – – – 13,373 –Loans and receivables:– Insurance receivables (Note 12) 6,080 – – – – – 6,080 – –– Other (Note 12) at amortised cost 671 – – – – – – 671 –Derivative financial instruments, at fair value (Note 13):– Hedges 1,681 875 – – – – 514 292 –– Non hedges 9,783 7,526 – – – 2,257 – – –Reinsurance assets 60,688 – – – – – 60,688 – –Cash and cash equivalents 28,993 6,142 1,177 1,139 355 10,214 9,966 – –Other assets 177,636 46,400 1,692 5,326 26,659 36,221 6,512 – 54,825Total assets 1,546,907 651,428 28,340 89,189 204,034 208,901 234,853 75,336 54,825Long-term insurance contracts and investment contractsWith guaranteed and fixed terms:– Insurance contracts 347,624 347,624 – – – – – – –– Investment contracts – at amortised cost 147,420 147,420 – – – – – – –Without fixed terms:– Insurance contracts 183,375 – – – 183,375 – – – –– Investment contracts – at fair value through income 171,568 – – – – 171,568 – – –Long-term insurance contracts and investment contracts with DPF:– Insurance contracts 25,927 – 25,927 – – – – – –– Investment contracts 80,902 – – 80,902 – – – – –Short-term insurance contracts 213,294 – – – – – 213,294 – –Derivative financial instruments, at fair value (Note 13):– Hedges 5,998 2,390 – – – – 2,567 1,041 –– Non hedges 1,862 127 79 544 – 1,112 – – –Borrowings – at amortised cost 56,891 – – – – – – 56,891 –Amounts due to related parties, trade payables, and other provisions, atamortised cost 4,224 – – – – – – 4,224 –Other liabilities 70,493 – – – – – – – 70,493Total liabilities 1,309,578 497,561 26,006 81,446 183,375 172,680 215,861 62,156 70,493
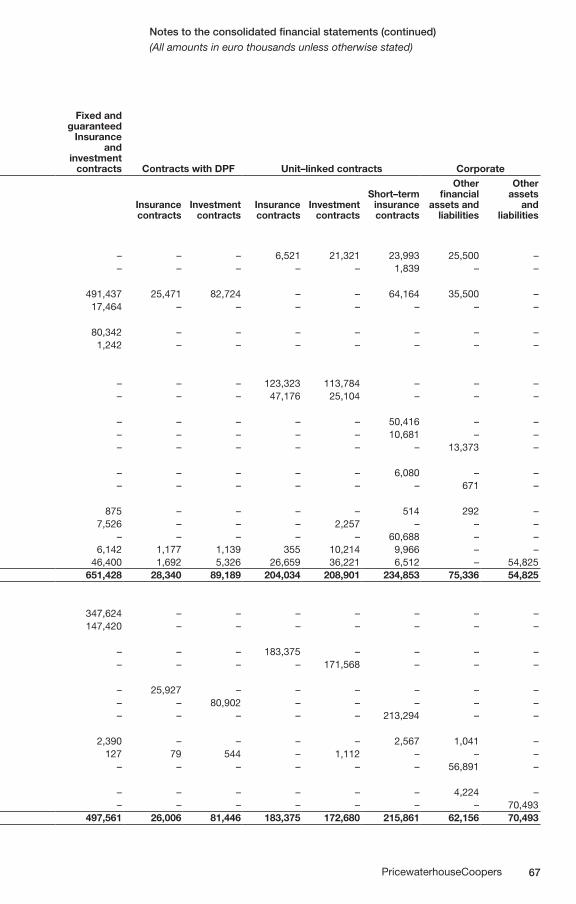
67PricewaterhouseCoopers
Notes to the consolidated financial statements (continued)(All amounts in euro thousands unless otherwise stated)
The following tables reconcile the consolidated balance sheet to the classes and portfolios used in the Group’s ALM framework.
2009 Total
Fixed andguaranteed
Insurance and
investmentcontracts Contracts with DPF Unit–linked contracts Corporate
IFRS7p6-8 IFRS7 B2
Insurance contracts
Investment contracts
Insurance contracts
Investment contracts
Short–term insurance contracts
Other financial
assets andliabilities
Other assets
and liabilities
Debt securitiesAt fair value through income:– Unlisted securities 77,335 – – – 6,521 21,321 23,993 25,500 –– Listed securities 1,839 – – – – – 1,839 – –Available–for–sale:– Listed securities 699,296 491,437 25,471 82,724 – – 64,164 35,500 –– Unlisted securities 17,464 17,464 – – – – – – –Held–to–maturity:– Listed securities 80,342 80,342 – – – – – – –– Unlisted securities 1,242 1,242 – – – – – – –Equity securitiesAt fair value through income:– Listed securities 237,107 – – – 123,323 113,784 – – –– Unlisted securities 72,280 – – – 47,176 25,104 – – –Available–for–sale:– Listed securities 50,416 – – – – – 50,416 – –– Unlisted securities 10,681 – – – – – 10,681 – –Investment in associates (Note 9) 13,373 – – – – – – 13,373 –Loans and receivables:– Insurance receivables (Note 12) 6,080 – – – – – 6,080 – –– Other (Note 12) at amortised cost 671 – – – – – – 671 –Derivative financial instruments, at fair value (Note 13):– Hedges 1,681 875 – – – – 514 292 –– Non hedges 9,783 7,526 – – – 2,257 – – –Reinsurance assets 60,688 – – – – – 60,688 – –Cash and cash equivalents 28,993 6,142 1,177 1,139 355 10,214 9,966 – –Other assets 177,636 46,400 1,692 5,326 26,659 36,221 6,512 – 54,825Total assets 1,546,907 651,428 28,340 89,189 204,034 208,901 234,853 75,336 54,825Long-term insurance contracts and investment contractsWith guaranteed and fixed terms:– Insurance contracts 347,624 347,624 – – – – – – –– Investment contracts – at amortised cost 147,420 147,420 – – – – – – –Without fixed terms:– Insurance contracts 183,375 – – – 183,375 – – – –– Investment contracts – at fair value through income 171,568 – – – – 171,568 – – –Long-term insurance contracts and investment contracts with DPF:– Insurance contracts 25,927 – 25,927 – – – – – –– Investment contracts 80,902 – – 80,902 – – – – –Short-term insurance contracts 213,294 – – – – – 213,294 – –Derivative financial instruments, at fair value (Note 13):– Hedges 5,998 2,390 – – – – 2,567 1,041 –– Non hedges 1,862 127 79 544 – 1,112 – – –Borrowings – at amortised cost 56,891 – – – – – – 56,891 –Amounts due to related parties, trade payables, and other provisions, atamortised cost 4,224 – – – – – – 4,224 –Other liabilities 70,493 – – – – – – – 70,493Total liabilities 1,309,578 497,561 26,006 81,446 183,375 172,680 215,861 62,156 70,493
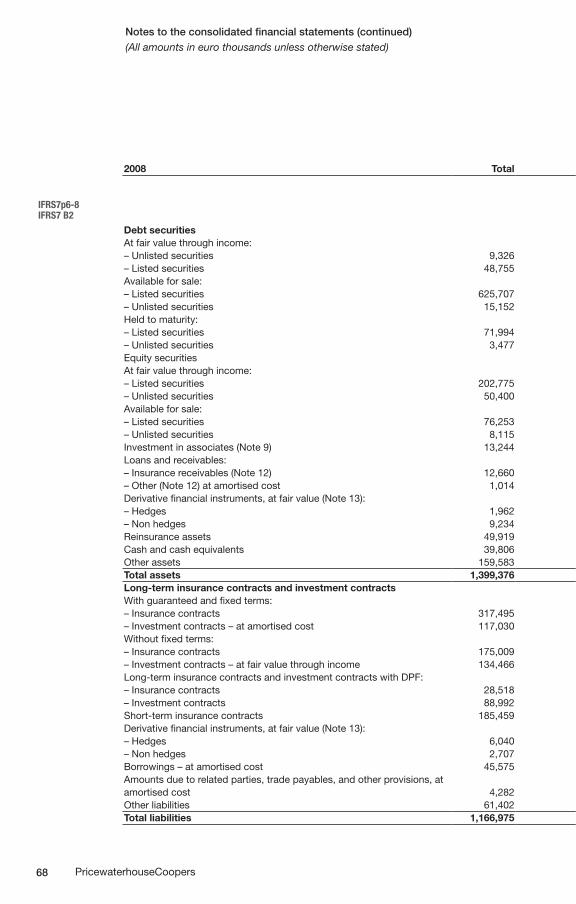
68 PricewaterhouseCoopers
Notes to the consolidated financial statements (continued)(All amounts in euro thousands unless otherwise stated)
2008 Total
Fixed andguaranteed
Insurance and
investmentcontracts Contracts with DPF Unit–linked contracts Corporate
IFRS7p6-8 IFRS7 B2
Insurance contracts
Investment contracts
Insurance contracts
Investment contracts
Short–term insurance contracts
Other financial
assets andliabilities
Other assets
and liabilities
Debt securitiesAt fair value through income:– Unlisted securities 9,326 – – – – – 4,766 4,560 –– Listed securities 48,755 – – – 23,115 19,297 6,343 – –Available for sale:– Listed securities 625,707 426,326 27,668 88,543 – – 47,730 35,440 –– Unlisted securities 15,152 15,152 – – – – – – –Held to maturity:– Listed securities 71,994 71,994 – – – – – – –– Unlisted securities 3,477 3,477 – – – – – – –Equity securitiesAt fair value through income:– Listed securities 202,775 – – – 115,748 87,027 – – –– Unlisted securities 50,400 – – – 29,407 20,993 – – –Available for sale:– Listed securities 76,253 – – – – – 56,253 20,000 –– Unlisted securities 8,115 – – – – – 8,115 – –Investment in associates (Note 9) 13,244 – – – – – – 13,244 –Loans and receivables:– Insurance receivables (Note 12) 12,660 – – – – – 12,660 – –– Other (Note 12) at amortised cost 1,014 – – – – – – 1,014 –Derivative financial instruments, at fair value (Note 13):– Hedges 1,962 1,040 – – – – 610 446 –– Non hedges 9,234 7,325 159 1,140 – 476 – – –Reinsurance assets 49,919 – – – – – 49,919 – –Cash and cash equivalents 39,806 5,985 1,326 1,698 236 8,149 22,412 – –Other assets 159,583 49,718 1,998 6,264 24,027 23,756 6,257 – 47,563Total assets 1,399,376 581,017 31,151 97,645 192,533 159,698 215,065 74,704 47,563Long-term insurance contracts and investment contractsWith guaranteed and fixed terms:– Insurance contracts 317,495 317,495 – – – – – – –– Investment contracts – at amortised cost 117,030 117,030 – – – – – – –Without fixed terms:– Insurance contracts 175,009 – – – 175,009 – – – –– Investment contracts – at fair value through income 134,466 – – – – 134,466 – – –Long-term insurance contracts and investment contracts with DPF:– Insurance contracts 28,518 – 28,518 – – – – –– Investment contracts 88,992 – – 88,992 – – – – –Short-term insurance contracts 185,459 – – – – – 185,459 – –Derivative financial instruments, at fair value (Note 13):– Hedges 6,040 2,791 – – – – 2,642 1,141 –– Non hedges 2,707 697 – – – 1,476 – – –Borrowings – at amortised cost 45,575 – – – – – – 45,575 –Amounts due to related parties, trade payables, and other provisions, atamortised cost 4,282 – – – – – – 4,282 –Other liabilities 61,402 – – – – – – – 61,402Total liabilities 1,166,975 438,013 28,518 88,992 175,009 135,942 188,101 50,998 61,402
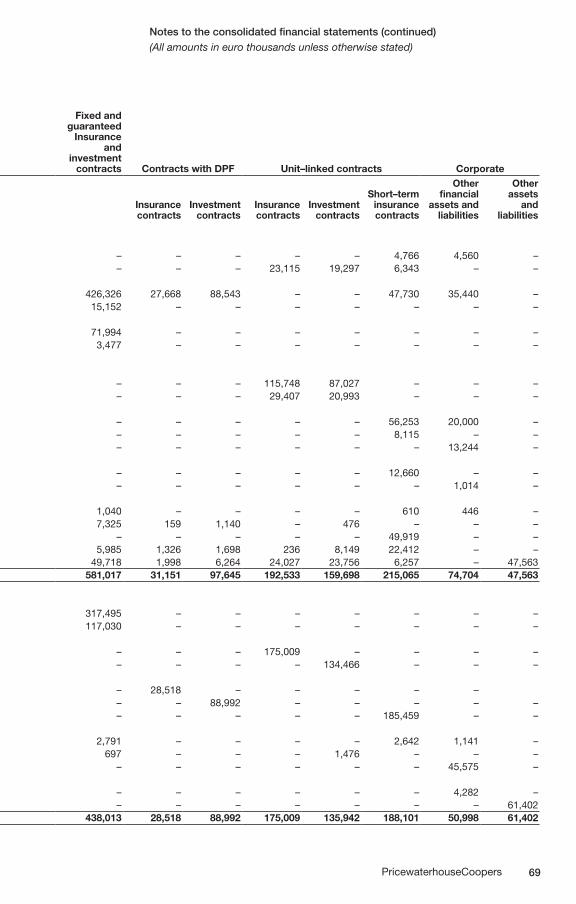
69PricewaterhouseCoopers
Notes to the consolidated financial statements (continued)(All amounts in euro thousands unless otherwise stated)
2008 Total
Fixed andguaranteed
Insurance and
investmentcontracts Contracts with DPF Unit–linked contracts Corporate
IFRS7p6-8 IFRS7 B2
Insurance contracts
Investment contracts
Insurance contracts
Investment contracts
Short–term insurance contracts
Other financial
assets andliabilities
Other assets
and liabilities
Debt securitiesAt fair value through income:– Unlisted securities 9,326 – – – – – 4,766 4,560 –– Listed securities 48,755 – – – 23,115 19,297 6,343 – –Available for sale:– Listed securities 625,707 426,326 27,668 88,543 – – 47,730 35,440 –– Unlisted securities 15,152 15,152 – – – – – – –Held to maturity:– Listed securities 71,994 71,994 – – – – – – –– Unlisted securities 3,477 3,477 – – – – – – –Equity securitiesAt fair value through income:– Listed securities 202,775 – – – 115,748 87,027 – – –– Unlisted securities 50,400 – – – 29,407 20,993 – – –Available for sale:– Listed securities 76,253 – – – – – 56,253 20,000 –– Unlisted securities 8,115 – – – – – 8,115 – –Investment in associates (Note 9) 13,244 – – – – – – 13,244 –Loans and receivables:– Insurance receivables (Note 12) 12,660 – – – – – 12,660 – –– Other (Note 12) at amortised cost 1,014 – – – – – – 1,014 –Derivative financial instruments, at fair value (Note 13):– Hedges 1,962 1,040 – – – – 610 446 –– Non hedges 9,234 7,325 159 1,140 – 476 – – –Reinsurance assets 49,919 – – – – – 49,919 – –Cash and cash equivalents 39,806 5,985 1,326 1,698 236 8,149 22,412 – –Other assets 159,583 49,718 1,998 6,264 24,027 23,756 6,257 – 47,563Total assets 1,399,376 581,017 31,151 97,645 192,533 159,698 215,065 74,704 47,563Long-term insurance contracts and investment contractsWith guaranteed and fixed terms:– Insurance contracts 317,495 317,495 – – – – – – –– Investment contracts – at amortised cost 117,030 117,030 – – – – – – –Without fixed terms:– Insurance contracts 175,009 – – – 175,009 – – – –– Investment contracts – at fair value through income 134,466 – – – – 134,466 – – –Long-term insurance contracts and investment contracts with DPF:– Insurance contracts 28,518 – 28,518 – – – – –– Investment contracts 88,992 – – 88,992 – – – – –Short-term insurance contracts 185,459 – – – – – 185,459 – –Derivative financial instruments, at fair value (Note 13):– Hedges 6,040 2,791 – – – – 2,642 1,141 –– Non hedges 2,707 697 – – – 1,476 – – –Borrowings – at amortised cost 45,575 – – – – – – 45,575 –Amounts due to related parties, trade payables, and other provisions, atamortised cost 4,282 – – – – – – 4,282 –Other liabilities 61,402 – – – – – – – 61,402Total liabilities 1,166,975 438,013 28,518 88,992 175,009 135,942 188,101 50,998 61,402
70 PricewaterhouseCoopers
Notes to the consolidated financial statements (continued)(All amounts in euro thousands unless otherwise stated)
4.2.1 Fixed and guaranteed insurance and investment contracts
Insurance and investment contracts with guaranteed and fixed terms have benefit payments that are fixed and guaranteed at the inception of the contract. The financial component of these benefits is usually a guaranteed fixed interest rate (for the insurance contracts, this rate may apply to maturity and/or death benefits) and hence the Group’s primary financial risk on these contracts is the risk that interest income and capital redemptions from the financial assets backing the liabilities is insufficient to fund the guaranteed benefits payable.
The Group monitors interest rate risk by calculating the mean duration of the investment portfolio and the liabilities issued. The mean duration is an indicator of the sensitivity of the assets and liabilities to changes in current interest rates The mean duration of the liabilities is determined by means of projecting expected cash flows from the contracts using best estimates of mortality and voluntary terminations. The mean duration of the assets is calculated in a consistent manner. Any gap between the mean duration of the assets and the mean duration of the liabilities is minimised by means of buying and selling fixed interest securities of different durations and use of interest rate swaps.
The following tables indicate the estimated amount and timing of cash flows arising from the liabilities in this category of the Group’s ALM framework and the extent of duration-matching for these contracts. They summarise the Group’s exposure to interest rate risks for these assets and liabilities. When debt securities mature, the proceeds not needed to meet liability cash flows will be re-invested in floating rate securities, and the interest rate swaps are used to secure fixed interest rate cash flows. The reinvestment of these net positive proceeds in the earlier years will fund the negative cash flows displayed in the table below for the later years.
Note: Maturity analysis of financial assets
IFRS 7 B11E requires an entity to disclose a maturity analysis of financial assets it holds for managing liquidity risk (for example, financial assets that are readily saleable or expected to generate cash inflows to meet cash outflows on financial liabilities), if that information is necessary to enable users of its financial statements to evaluate the nature and extent of liquidity risk.
Financial institutions typically use financial assets to manage their liquidity risk. In these circumstances, the information is likely to be necessary to enable users of financial statements to evaluate the nature and extent of liquidity risk, in which case we would expect them to present a maturity analysis of financial assets.
However, the disclosure requirements are not only relevant for financial institutions. Certain companies with significant trading activities (for example, energy companies) may hold financial assets to manage liquidity risk. Where such activities are a significant part of the company’s business, they should consider including a maturity analysis for assets.
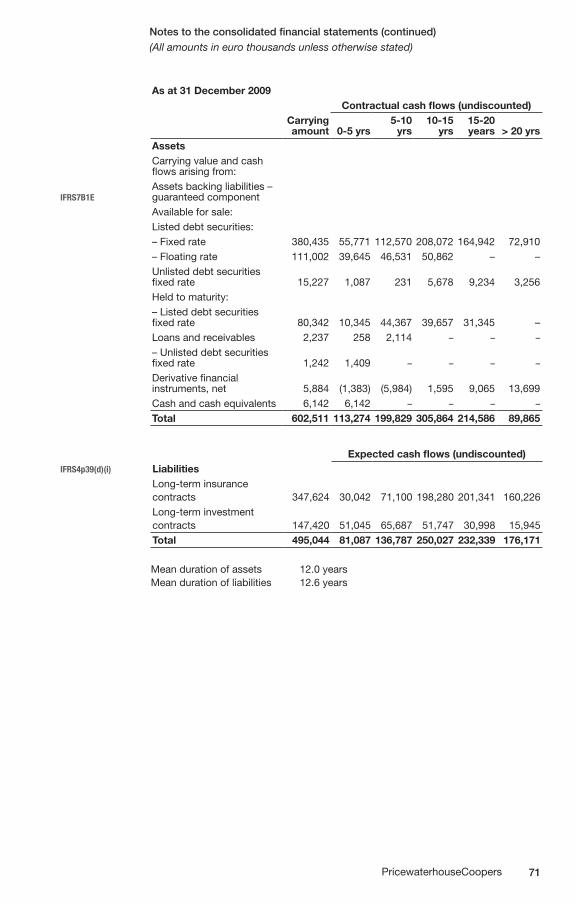
71PricewaterhouseCoopers
Notes to the consolidated financial statements (continued)(All amounts in euro thousands unless otherwise stated)
As at 31 December 2009Contractual cash flows (undiscounted)
Carrying amount 0-5 yrs
5-10 yrs
10-15 yrs
15-20 years > 20 yrs
AssetsCarrying value and cash flows arising from:
IFRS7B1EAssets backing liabilities – guaranteed componentAvailable for sale:Listed debt securities:– Fixed rate 380,435 55,771 112,570 208,072 164,942 72,910– Floating rate 111,002 39,645 46,531 50,862 – –Unlisted debt securities fixed rate 15,227 1,087 231 5,678 9,234 3,256Held to maturity:– Listed debt securities fixed rate 80,342 10,345 44,367 39,657 31,345 –Loans and receivables 2,237 258 2,114 – – –
– Unlisted debt securities fixed rate 1,242 1,409 – – – –
Derivative financial instruments, net 5,884 (1,383) (5,984) 1,595 9,065 13,699Cash and cash equivalents 6,142 6,142 – – – –
Total 602,511 113,274 199,829 305,864 214,586 89,865
Expected cash flows (undiscounted)IFRS4p39(d)(i) Liabilities
Long-term insurance contracts 347,624 30,042 71,100 198,280 201,341 160,226Long-term investment contracts 147,420 51,045 65,687 51,747 30,998 15,945Total 495,044 81,087 136,787 250,027 232,339 176,171
Mean duration of assets 12.0 years Mean duration of liabilities 12.6 years
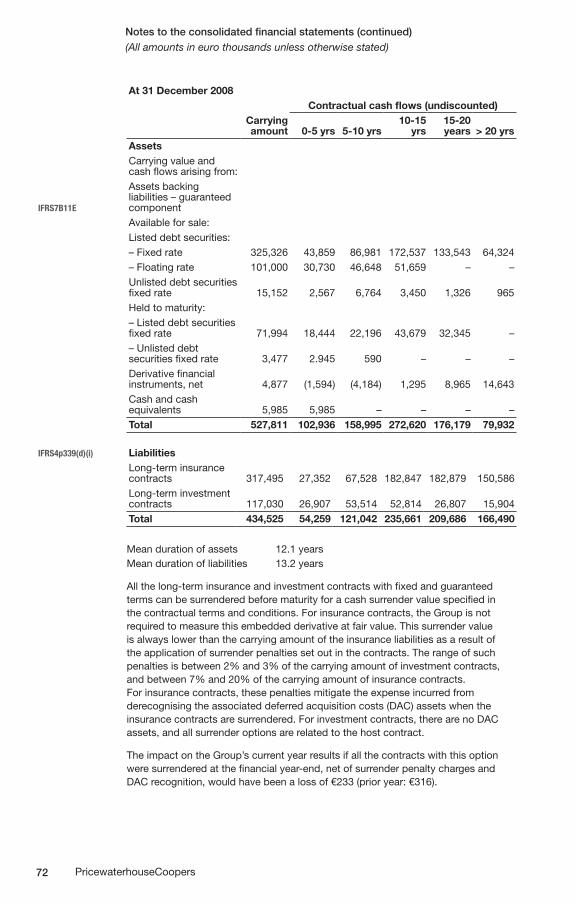
72 PricewaterhouseCoopers
Notes to the consolidated financial statements (continued)(All amounts in euro thousands unless otherwise stated)
At 31 December 2008Contractual cash flows (undiscounted)
Carrying amount 0-5 yrs 5-10 yrs
10-15 yrs
15-20 years > 20 yrs
AssetsCarrying value and cash flows arising from:
IFRS7B11E
Assets backing liabilities – guaranteed componentAvailable for sale:Listed debt securities:– Fixed rate 325,326 43,859 86,981 172,537 133,543 64,324– Floating rate 101,000 30,730 46,648 51,659 – –Unlisted debt securities fixed rate 15,152 2,567 6,764 3,450 1,326 965Held to maturity:– Listed debt securities fixed rate 71,994 18,444 22,196 43,679 32,345 –– Unlisted debt securities fixed rate 3,477 2.945 590 – – –Derivative financial instruments, net 4,877 (1,594) (4,184) 1,295 8,965 14,643Cash and cash equivalents 5,985 5,985 – – – –Total 527,811 102,936 158,995 272,620 176,179 79,932
IFRS4p339(d)(i) LiabilitiesLong-term insurance contracts 317,495 27,352 67,528 182,847 182,879 150,586Long-term investment contracts 117,030 26,907 53,514 52,814 26,807 15,904Total 434,525 54,259 121,042 235,661 209,686 166,490
Mean duration of assets 12.1 years Mean duration of liabilities 13.2 years
All the long-term insurance and investment contracts with fixed and guaranteed terms can be surrendered before maturity for a cash surrender value specified in the contractual terms and conditions. For insurance contracts, the Group is not required to measure this embedded derivative at fair value. This surrender value is always lower than the carrying amount of the insurance liabilities as a result of the application of surrender penalties set out in the contracts. The range of such penalties is between 2% and 3% of the carrying amount of investment contracts, and between 7% and 20% of the carrying amount of insurance contracts. For insurance contracts, these penalties mitigate the expense incurred from derecognising the associated deferred acquisition costs (DAC) assets when the insurance contracts are surrendered. For investment contracts, there are no DAC assets, and all surrender options are related to the host contract.
The impact on the Group’s current year results if all the contracts with this option were surrendered at the financial year-end, net of surrender penalty charges and DAC recognition, would have been a loss of €233 (prior year: €316).
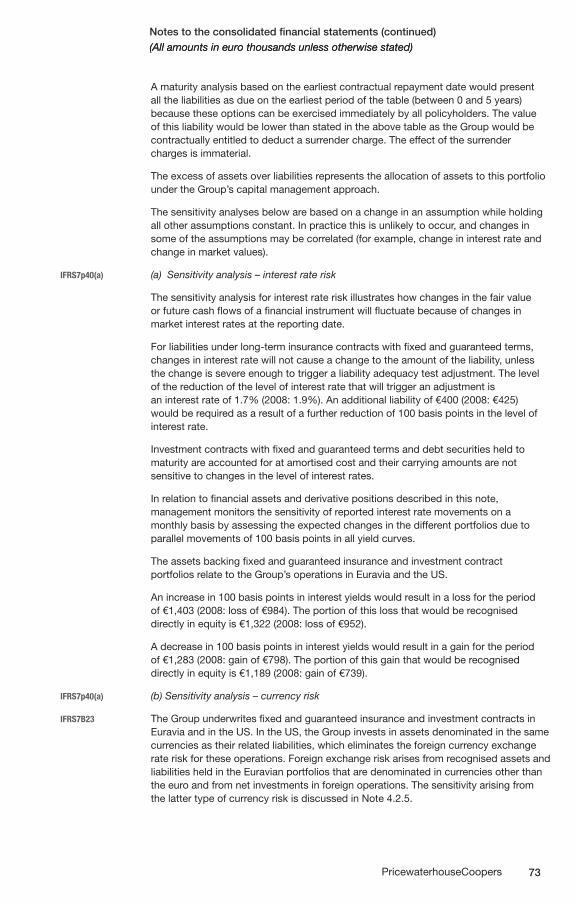
73PricewaterhouseCoopers
(All amounts in euro thousands unless otherwise stated)Notes to the consolidated financial statements (continued)(All amounts in euro thousands unless otherwise stated)
A maturity analysis based on the earliest contractual repayment date would present all the liabilities as due on the earliest period of the table (between 0 and 5 years) because these options can be exercised immediately by all policyholders. The value of this liability would be lower than stated in the above table as the Group would be contractually entitled to deduct a surrender charge. The effect of the surrender charges is immaterial.
The excess of assets over liabilities represents the allocation of assets to this portfolio under the Group’s capital management approach.
The sensitivity analyses below are based on a change in an assumption while holding all other assumptions constant. In practice this is unlikely to occur, and changes in some of the assumptions may be correlated (for example, change in interest rate and change in market values).
IFRS7p40(a) (a) Sensitivity analysis – interest rate risk
The sensitivity analysis for interest rate risk illustrates how changes in the fair value or future cash flows of a financial instrument will fluctuate because of changes in market interest rates at the reporting date.
For liabilities under long-term insurance contracts with fixed and guaranteed terms, changes in interest rate will not cause a change to the amount of the liability, unless the change is severe enough to trigger a liability adequacy test adjustment. The level of the reduction of the level of interest rate that will trigger an adjustment is an interest rate of 1.7% (2008: 1.9%). An additional liability of €400 (2008: €425) would be required as a result of a further reduction of 100 basis points in the level of interest rate.
Investment contracts with fixed and guaranteed terms and debt securities held to maturity are accounted for at amortised cost and their carrying amounts are not sensitive to changes in the level of interest rates.
In relation to financial assets and derivative positions described in this note, management monitors the sensitivity of reported interest rate movements on a monthly basis by assessing the expected changes in the different portfolios due to parallel movements of 100 basis points in all yield curves.
The assets backing fixed and guaranteed insurance and investment contract portfolios relate to the Group’s operations in Euravia and the US.
An increase in 100 basis points in interest yields would result in a loss for the period of €1,403 (2008: loss of €984). The portion of this loss that would be recognised directly in equity is €1,322 (2008: loss of €952).
A decrease in 100 basis points in interest yields would result in a gain for the period of €1,283 (2008: gain of €798). The portion of this gain that would be recognised directly in equity is €1,189 (2008: gain of €739).
IFRS7p40(a) (b) Sensitivity analysis – currency risk
IFRS7B23 The Group underwrites fixed and guaranteed insurance and investment contracts in Euravia and in the US. In the US, the Group invests in assets denominated in the same currencies as their related liabilities, which eliminates the foreign currency exchange rate risk for these operations. Foreign exchange risk arises from recognised assets and liabilities held in the Euravian portfolios that are denominated in currencies other than the euro and from net investments in foreign operations. The sensitivity arising from the latter type of currency risk is discussed in Note 4.2.5.
74 PricewaterhouseCoopers
(All amounts in euro thousands unless otherwise stated)Notes to the consolidated financial statements (continued)(All amounts in euro thousands unless otherwise stated)
The Group exposure to foreign currency risk within the portfolio supporting the Group’s eurozone fixed and guaranteed insurance and investment liabilities arises primarily from purchased investments that are denominated or payable in US dollars. The Group hedges in euros all foreign currency-denominated held-to-maturity debt securities supporting the eurozone operations, using foreign exchange forward contracts, in order to mitigate the risk that the interest and principal cash flows of these investments fluctuate as a result of changes in foreign exchange rates (see Note 13). The Group’s hedging strategy is fully effective, and if the euro weakened/strengthened against the US dollar, the impact on the Group net current year result would have been nil.
4.2.2 Insurance and investment contracts with discretionary participation features
The Group originates contracts with DPF only in the Euravian market. Insurance and investment contracts with DPF are backed by two distinct funds (the insurance DPF fund and the investment DPF fund) and can be single premium or regular premium contracts. These funds are segregated from the other Group’s assets and are presented in the table below, analysed between the liability and equity DPF component.
The supplemental benefits payable to holders of such contracts are based on historic and current rates of return on the fixed income securities in which the fund is invested, as well as the Group’s expectations of future investment returns.
The measurement of the liabilities under long-term insurance contracts and investment contracts with DPF is similar to that of insurance contracts with guaranteed and fixed terms. However, the impact of interest rate risk is different due to the presence of the DPF.
The Group only bears financial risk in relation to the guaranteed benefits payable under these contracts. These guaranteed benefits increase as supplemental benefits are declared and distributed to contract holders. While the Group recognises as a liability 90% of the excess of the carrying value of the underlying assets over the carrying value of the guaranteed liabilities, the Group does not bear any interest rate risk in relation to this DPF component liability.
Because there is a direct effect on the measurement of DPF liabilities when asset gains or losses are realised, changes in these liabilities are recognised directly in equity when, and only when, the valuation differences on the assets arise from gains or losses recognised directly in equity (‘shadow accounting’).
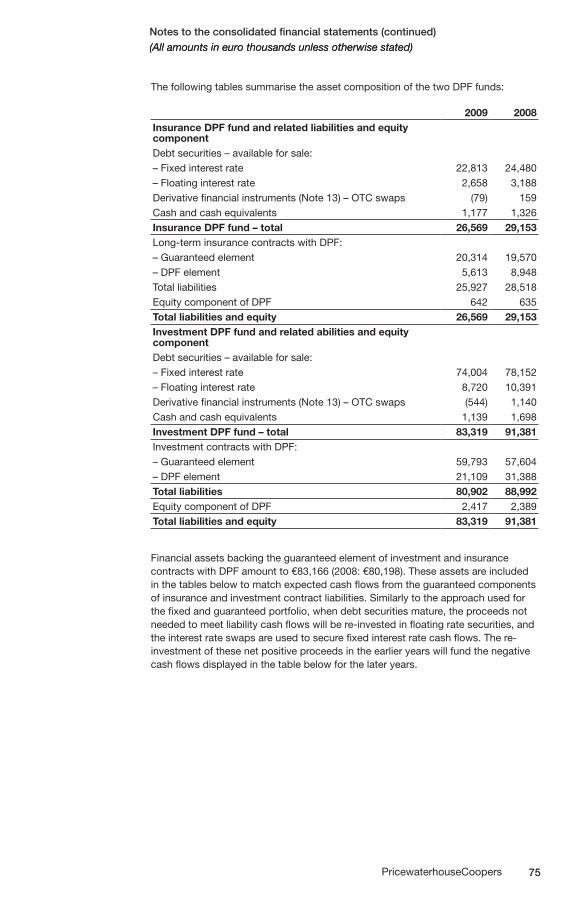
75PricewaterhouseCoopers
(All amounts in euro thousands unless otherwise stated)Notes to the consolidated financial statements (continued)(All amounts in euro thousands unless otherwise stated)
The following tables summarise the asset composition of the two DPF funds:
2009 2008Insurance DPF fund and related liabilities and equity componentDebt securities – available for sale:– Fixed interest rate 22,813 24,480– Floating interest rate 2,658 3,188Derivative financial instruments (Note 13) – OTC swaps (79) 159Cash and cash equivalents 1,177 1,326Insurance DPF fund – total 26,569 29,153Long-term insurance contracts with DPF:– Guaranteed element 20,314 19,570– DPF element 5,613 8,948Total liabilities 25,927 28,518Equity component of DPF 642 635Total liabilities and equity 26,569 29,153Investment DPF fund and related abilities and equity componentDebt securities – available for sale:– Fixed interest rate 74,004 78,152– Floating interest rate 8,720 10,391Derivative financial instruments (Note 13) – OTC swaps (544) 1,140Cash and cash equivalents 1,139 1,698Investment DPF fund – total 83,319 91,381Investment contracts with DPF:– Guaranteed element 59,793 57,604– DPF element 21,109 31,388Total liabilities 80,902 88,992Equity component of DPF 2,417 2,389Total liabilities and equity 83,319 91,381
Financial assets backing the guaranteed element of investment and insurance contracts with DPF amount to €83,166 (2008: €80,198). These assets are included in the tables below to match expected cash flows from the guaranteed components of insurance and investment contract liabilities. Similarly to the approach used for the fixed and guaranteed portfolio, when debt securities mature, the proceeds not needed to meet liability cash flows will be re-invested in floating rate securities, and the interest rate swaps are used to secure fixed interest rate cash flows. The re- investment of these net positive proceeds in the earlier years will fund the negative cash flows displayed in the table below for the later years.
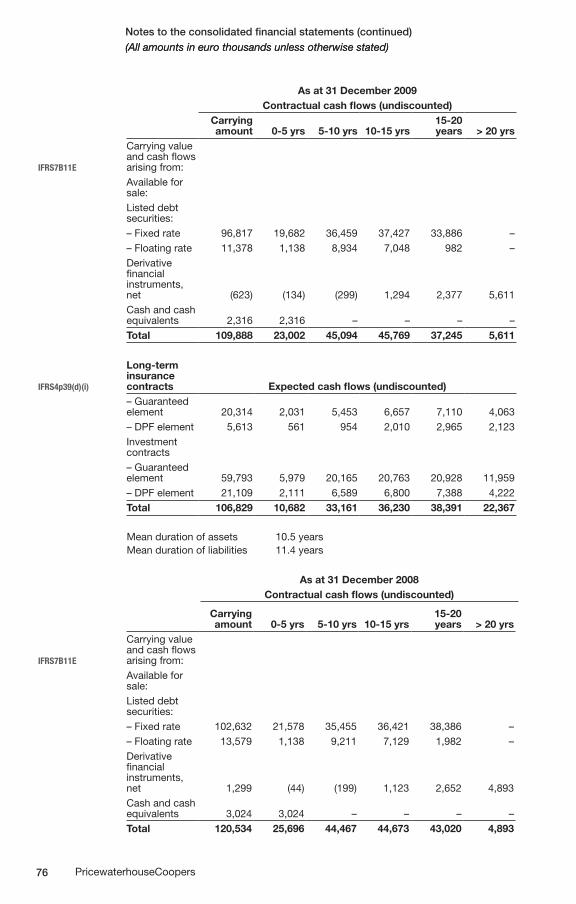
76 PricewaterhouseCoopers
(All amounts in euro thousands unless otherwise stated)Notes to the consolidated financial statements (continued)(All amounts in euro thousands unless otherwise stated)
As at 31 December 2009Contractual cash flows (undiscounted)
Carrying amount 0-5 yrs 5-10 yrs 10-15 yrs
15-20 years > 20 yrs
IFRS7B11E
Carrying value and cash flows arising from:Available for sale:Listed debt securities:– Fixed rate 96,817 19,682 36,459 37,427 33,886 –– Floating rate 11,378 1,138 8,934 7,048 982 –Derivative financial instruments, net (623) (134) (299) 1,294 2,377 5,611Cash and cash equivalents 2,316 2,316 – – – –Total 109,888 23,002 45,094 45,769 37,245 5,611
IFRS4p39(d)(i)
Long-term insurance contracts Expected cash flows (undiscounted)– Guaranteed element 20,314 2,031 5,453 6,657 7,110 4,063– DPF element 5,613 561 954 2,010 2,965 2,123Investment contracts– Guaranteed element 59,793 5,979 20,165 20,763 20,928 11,959– DPF element 21,109 2,111 6,589 6,800 7,388 4,222Total 106,829 10,682 33,161 36,230 38,391 22,367
Mean duration of assets 10.5 years Mean duration of liabilities 11.4 years
As at 31 December 2008Contractual cash flows (undiscounted)
Carrying amount 0-5 yrs 5-10 yrs 10-15 yrs
15-20 years > 20 yrs
IFRS7B11E
Carrying value and cash flows arising from:Available for sale:Listed debt securities:– Fixed rate 102,632 21,578 35,455 36,421 38,386 –– Floating rate 13,579 1,138 9,211 7,129 1,982 –Derivative financial instruments, net 1,299 (44) (199) 1,123 2,652 4,893Cash and cash equivalents 3,024 3,024 – – – –Total 120,534 25,696 44,467 44,673 43,020 4,893
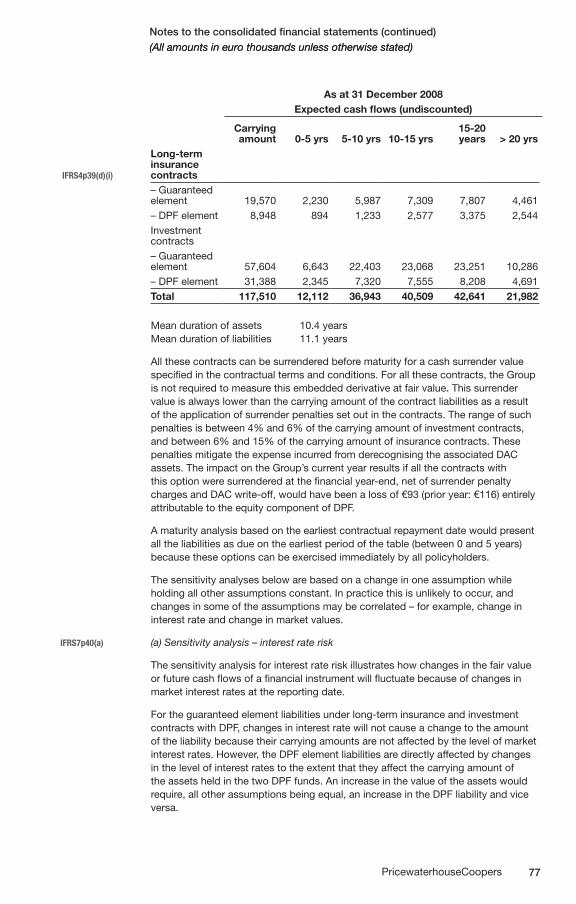
77PricewaterhouseCoopers
(All amounts in euro thousands unless otherwise stated)Notes to the consolidated financial statements (continued)(All amounts in euro thousands unless otherwise stated)
As at 31 December 2008Expected cash flows (undiscounted)
Carrying amount 0-5 yrs 5-10 yrs 10-15 yrs
15-20 years > 20 yrs
IFRS4p39(d)(i)
Long-term insurance contracts– Guaranteed element 19,570 2,230 5,987 7,309 7,807 4,461– DPF element 8,948 894 1,233 2,577 3,375 2,544Investment contracts– Guaranteed element 57,604 6,643 22,403 23,068 23,251 10,286– DPF element 31,388 2,345 7,320 7,555 8,208 4,691Total 117,510 12,112 36,943 40,509 42,641 21,982
Mean duration of assets 10.4 years Mean duration of liabilities 11.1 years
All these contracts can be surrendered before maturity for a cash surrender value specified in the contractual terms and conditions. For all these contracts, the Group is not required to measure this embedded derivative at fair value. This surrender value is always lower than the carrying amount of the contract liabilities as a result of the application of surrender penalties set out in the contracts. The range of such penalties is between 4% and 6% of the carrying amount of investment contracts, and between 6% and 15% of the carrying amount of insurance contracts. These penalties mitigate the expense incurred from derecognising the associated DAC assets. The impact on the Group’s current year results if all the contracts with this option were surrendered at the financial year-end, net of surrender penalty charges and DAC write-off, would have been a loss of €93 (prior year: €116) entirely attributable to the equity component of DPF.
A maturity analysis based on the earliest contractual repayment date would present all the liabilities as due on the earliest period of the table (between 0 and 5 years) because these options can be exercised immediately by all policyholders.
The sensitivity analyses below are based on a change in one assumption while holding all other assumptions constant. In practice this is unlikely to occur, and changes in some of the assumptions may be correlated – for example, change in interest rate and change in market values.
IFRS7p40(a) (a) Sensitivity analysis – interest rate risk
The sensitivity analysis for interest rate risk illustrates how changes in the fair value or future cash flows of a financial instrument will fluctuate because of changes in market interest rates at the reporting date.
For the guaranteed element liabilities under long-term insurance and investment contracts with DPF, changes in interest rate will not cause a change to the amount of the liability because their carrying amounts are not affected by the level of market interest rates. However, the DPF element liabilities are directly affected by changes in the level of interest rates to the extent that they affect the carrying amount of the assets held in the two DPF funds. An increase in the value of the assets would require, all other assumptions being equal, an increase in the DPF liability and vice versa.
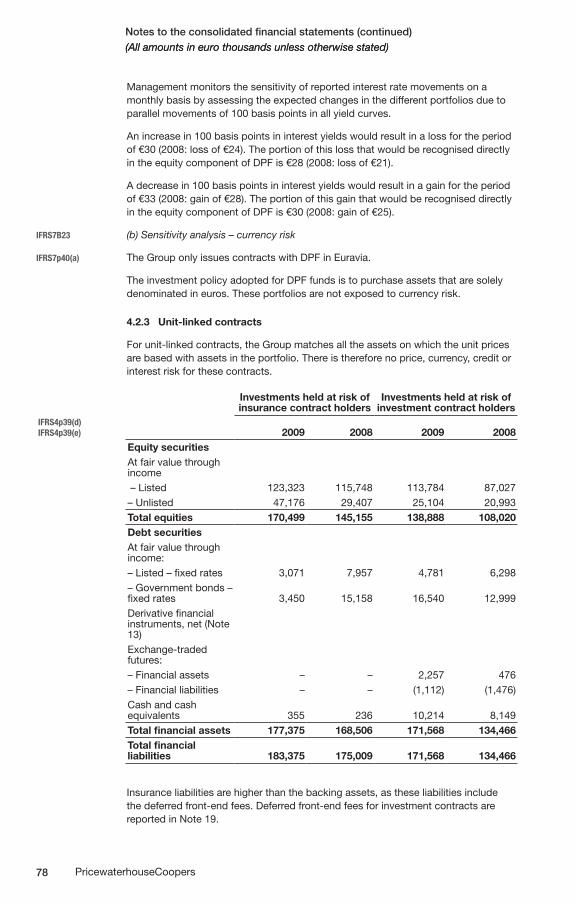
78 PricewaterhouseCoopers
(All amounts in euro thousands unless otherwise stated)Notes to the consolidated financial statements (continued)(All amounts in euro thousands unless otherwise stated)
Management monitors the sensitivity of reported interest rate movements on a monthly basis by assessing the expected changes in the different portfolios due to parallel movements of 100 basis points in all yield curves.
An increase in 100 basis points in interest yields would result in a loss for the period of €30 (2008: loss of €24). The portion of this loss that would be recognised directly in the equity component of DPF is €28 (2008: loss of €21).
A decrease in 100 basis points in interest yields would result in a gain for the period of €33 (2008: gain of €28). The portion of this gain that would be recognised directly in the equity component of DPF is €30 (2008: gain of €25).
IFRS7B23 (b) Sensitivity analysis – currency risk
IFRS7p40(a) The Group only issues contracts with DPF in Euravia.
The investment policy adopted for DPF funds is to purchase assets that are solely denominated in euros. These portfolios are not exposed to currency risk.
4.2.3 Unit-linked contracts
For unit-linked contracts, the Group matches all the assets on which the unit prices are based with assets in the portfolio. There is therefore no price, currency, credit or interest risk for these contracts.
Investments held at risk of insurance contract holders
Investments held at risk of investment contract holders
IFRS4p39(d) IFRS4p39(e) 2009 2008 2009 2008
Equity securitiesAt fair value through income – Listed 123,323 115,748 113,784 87,027– Unlisted 47,176 29,407 25,104 20,993Total equities 170,499 145,155 138,888 108,020Debt securitiesAt fair value through income:– Listed – fixed rates 3,071 7,957 4,781 6,298– Government bonds – fixed rates 3,450 15,158 16,540 12,999Derivative financial instruments, net (Note 13)Exchange-traded futures:– Financial assets – – 2,257 476– Financial liabilities – – (1,112) (1,476)Cash and cash equivalents 355 236 10,214 8,149Total financial assets 177,375 168,506 171,568 134,466Total financial liabilities 183,375 175,009 171,568 134,466
Insurance liabilities are higher than the backing assets, as these liabilities include the deferred front-end fees. Deferred front-end fees for investment contracts are reported in Note 19.
79PricewaterhouseCoopers
(All amounts in euro thousands unless otherwise stated)Notes to the consolidated financial statements (continued)(All amounts in euro thousands unless otherwise stated)
39AG33(g) Within this category of contracts, there are insurance contracts with minimum guaranteed death benefits that expose the Group to the risk that declines in the value of underlying investments as a result of changes in prices of financial assets. This may increase the Group’s net exposure to death risk (Note 4.1).
All these contracts can be surrendered before maturity for a cash surrender value specified in the contractual terms and conditions. For all these contracts the Group is not required to measure this embedded derivative at fair value. This surrender value is always lower than the carrying amount of the contract liabilities as a result of the application of surrender penalties set out in the contracts. The range of such penalties is between 4% and 6% of the carrying amount of investment contracts, and between 6% and 15% of the carrying amount of insurance contracts. These penalties mitigate the expense incurred from derecognising the associated DAC assets. The impact on the Group’s current-year results if all the contracts with this option were surrendered at the financial year-end, net of surrender penalty charges and DAC write-off, would have been a loss of €93 (prior year €116) entirely attributable to the equity component of DPF.
A maturity analysis based on the earliest contractual repayment date would present all the liabilities as due on the earliest period of the table (between 0 and 5 years) because these options can be exercised immediately by all policyholders.
The sensitivity analyses below are based on a change in an assumption while holding all other assumptions constant. In practice this is unlikely to occur, and changes in some of the assumptions may be correlated – for example, a change in interest rate and a change in market values.
IFRS7p40(a) (a) Sensitivity analysis – market risks
The Group’s primary exposure to market risk (being interest rate, equity price and currency risks) from these contracts is the risk of volatility in asset management fees due to the impact of interest rate, equity price and currency movements on the fair value of the assets held in the linked funds, on which investment management fees are based.
A decrease of 10% in the value of the assets would reduce the asset management fees by €500 per annum (2008: €480).
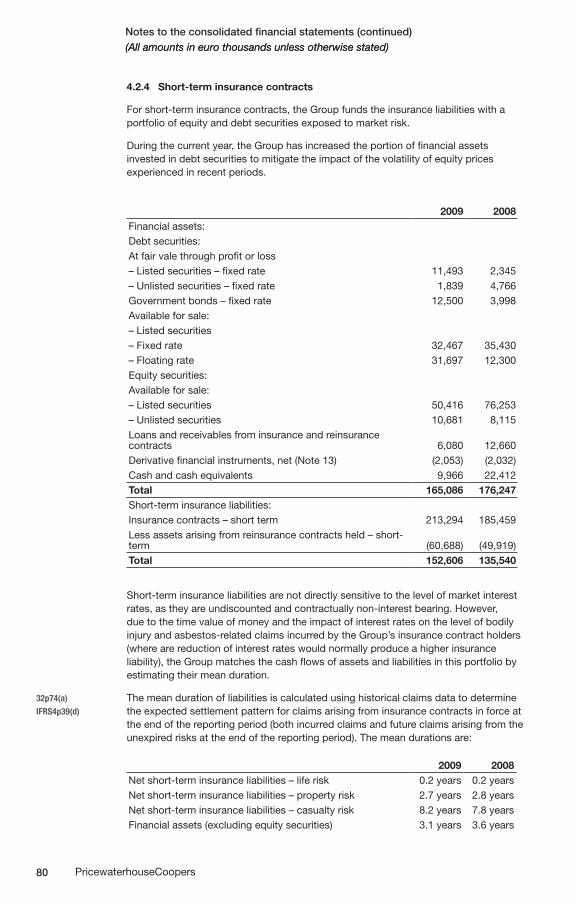
80 PricewaterhouseCoopers
(All amounts in euro thousands unless otherwise stated)Notes to the consolidated financial statements (continued)(All amounts in euro thousands unless otherwise stated)
4.2.4 Short-term insurance contracts
For short-term insurance contracts, the Group funds the insurance liabilities with a portfolio of equity and debt securities exposed to market risk.
During the current year, the Group has increased the portion of financial assets invested in debt securities to mitigate the impact of the volatility of equity prices experienced in recent periods.
2009 2008Financial assets:Debt securities:At fair vale through profit or loss– Listed securities – fixed rate 11,493 2,345– Unlisted securities – fixed rate 1,839 4,766Government bonds – fixed rate 12,500 3,998Available for sale:– Listed securities– Fixed rate 32,467 35,430– Floating rate 31,697 12,300Equity securities:Available for sale:– Listed securities 50,416 76,253– Unlisted securities 10,681 8,115Loans and receivables from insurance and reinsurance contracts 6,080 12,660Derivative financial instruments, net (Note 13) (2,053) (2,032) Cash and cash equivalents 9,966 22,412Total 165,086 176,247Short-term insurance liabilities:Insurance contracts – short term 213,294 185,459Less assets arising from reinsurance contracts held – short-term (60,688) (49,919)Total 152,606 135,540
Short-term insurance liabilities are not directly sensitive to the level of market interest rates, as they are undiscounted and contractually non-interest bearing. However, due to the time value of money and the impact of interest rates on the level of bodily injury and asbestos-related claims incurred by the Group’s insurance contract holders (where are reduction of interest rates would normally produce a higher insurance liability), the Group matches the cash flows of assets and liabilities in this portfolio by estimating their mean duration.
32p74(a) The mean duration of liabilities is calculated using historical claims data to determineIFRS4p39(d) the expected settlement pattern for claims arising from insurance contracts in force at
the end of the reporting period (both incurred claims and future claims arising from the unexpired risks at the end of the reporting period). The mean durations are:
2009 2008Net short-term insurance liabilities – life risk 0.2 years 0.2 yearsNet short-term insurance liabilities – property risk 2.7 years 2.8 yearsNet short-term insurance liabilities – casualty risk 8.2 years 7.8 yearsFinancial assets (excluding equity securities) 3.1 years 3.6 years
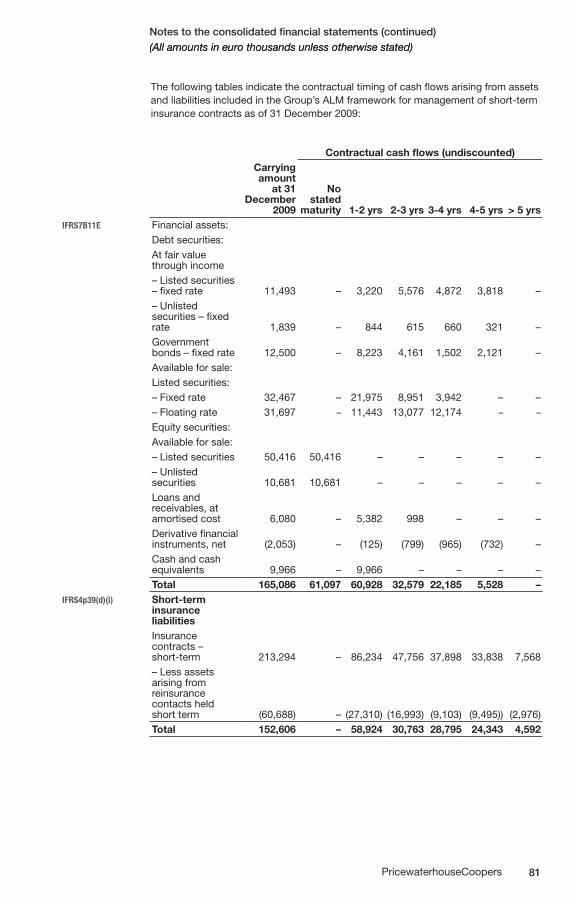
81PricewaterhouseCoopers
(All amounts in euro thousands unless otherwise stated)Notes to the consolidated financial statements (continued)(All amounts in euro thousands unless otherwise stated)
The following tables indicate the contractual timing of cash flows arising from assets and liabilities included in the Group’s ALM framework for management of short-term insurance contracts as of 31 December 2009:
Contractual cash flows (undiscounted)Carrying amount
at 31 December
2009
No stated
maturity 1-2 yrs 2-3 yrs 3-4 yrs 4-5 yrs > 5 yrsIFRS7B11E Financial assets:
Debt securities:At fair value through income– Listed securities – fixed rate 11,493 – 3,220 5,576 4,872 3,818 –– Unlisted securities – fixed rate 1,839 – 844 615 660 321 –Government bonds – fixed rate 12,500 – 8,223 4,161 1,502 2,121 –Available for sale:Listed securities:– Fixed rate 32,467 – 21,975 8,951 3,942 – – – Floating rate 31,697 – 11,443 13,077 12,174 – –
Equity securities:Available for sale:– Listed securities 50,416 50,416 – – – – –– Unlisted securities 10,681 10,681 – – – – –Loans and receivables, at amortised cost 6,080 – 5,382 998 – – –Derivative financial instruments, net (2,053) – (125) (799) (965) (732) –Cash and cash equivalents 9,966 – 9,966 – – – –Total 165,086 61,097 60,928 32,579 22,185 5,528 –
IFRS4p39(d)(i)
Short-term insurance liabilitiesInsurance contracts – short-term 213,294 – 86,234 47,756 37,898 33,838 7,568– Less assets arising from reinsurance contacts held short term (60,688) – (27,310) (16,993) (9,103) (9,495)) (2,976) Total 152,606 – 58,924 30,763 28,795 24,343 4,592
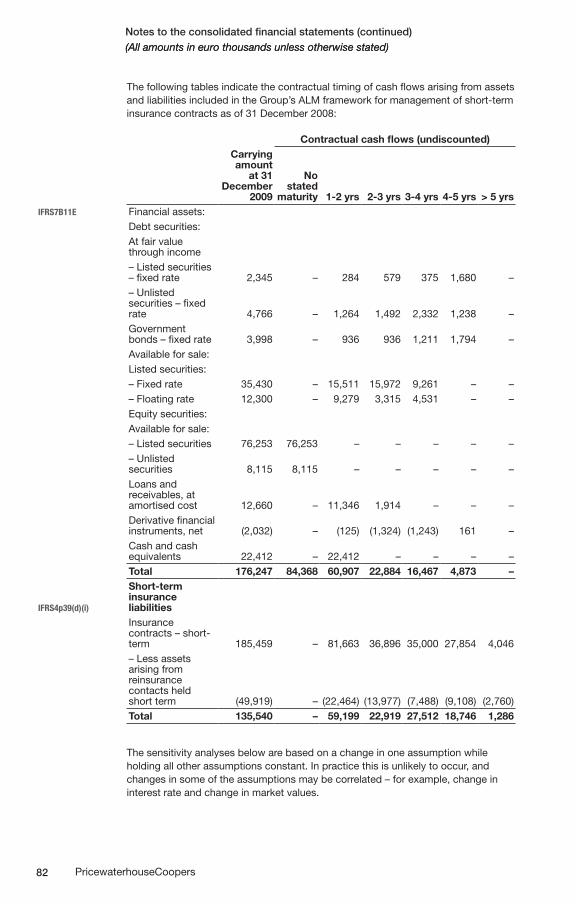
82 PricewaterhouseCoopers
(All amounts in euro thousands unless otherwise stated)Notes to the consolidated financial statements (continued)(All amounts in euro thousands unless otherwise stated)
The following tables indicate the contractual timing of cash flows arising from assets and liabilities included in the Group’s ALM framework for management of short-term insurance contracts as of 31 December 2008:
Contractual cash flows (undiscounted)Carrying amount
at 31 December
2009
No stated
maturity 1-2 yrs 2-3 yrs 3-4 yrs 4-5 yrs > 5 yrsIFRS7B11E Financial assets:
Debt securities:At fair value through income– Listed securities – fixed rate 2,345 – 284 579 375 1,680 –– Unlisted securities – fixed rate 4,766 – 1,264 1,492 2,332 1,238 –Government bonds – fixed rate 3,998 – 936 936 1,211 1,794 –Available for sale:Listed securities:– Fixed rate 35,430 – 15,511 15,972 9,261 – –– Floating rate 12,300 – 9,279 3,315 4,531 – –Equity securities:Available for sale:– Listed securities 76,253 76,253 – – – – –– Unlisted securities 8,115 8,115 – – – – –Loans and receivables, at amortised cost 12,660 – 11,346 1,914 – – –Derivative financial instruments, net (2,032) – (125) (1,324) (1,243) 161 –Cash and cash equivalents 22,412 – 22,412 – – – –Total 176,247 84,368 60,907 22,884 16,467 4,873 –
IFRS4p39(d)(i)
Short-term insurance liabilities Insurance contracts – short-term 185,459 – 81,663 36,896 35,000 27,854 4,046– Less assets arising from reinsurance contacts held short term (49,919) – (22,464) (13,977) (7,488) (9,108) (2,760)Total 135,540 – 59,199 22,919 27,512 18,746 1,286
The sensitivity analyses below are based on a change in one assumption while holding all other assumptions constant. In practice this is unlikely to occur, and changes in some of the assumptions may be correlated – for example, change in interest rate and change in market values.
83PricewaterhouseCoopers
(All amounts in euro thousands unless otherwise stated)Notes to the consolidated financial statements (continued)(All amounts in euro thousands unless otherwise stated)
IFRS7p40(a) (a) Sensitivity analysis – interest-rate risk
The sensitivity analysis for interest rate risk illustrates how changes in the fair value or future cash flows of a financial instrument will fluctuate because of changes in market interest rates at the reporting date. For financial instruments and insurance contracts described in this note, the sensitivity is solely associated with the former, as the carrying amounts of the latter are not directly affected by changes in market risks.
The Group’s management monitors the sensitivity of reported interest rate movements on a monthly basis by assessing the expected changes in the different portfolios due to a parallel movement of plus 100 basis points in all yield curves of financial assets and financial liabilities. These particular exposures illustrate the Group’s overall exposure to interest rate sensitivities included in the Group’s ALM framework and its impact in the Group’s profit or loss by business.
An increase of 100 basis points in interest yields would result in a loss for the period of €479 in 2009. Out of the total loss, €288 would have been recognised into equity (2008: total loss of €396, of which €311 would have been recognised in equity).
A decrease of 100 basis points in interest yields would result in a gain for the period of €465 in 2009. Out of the total gain, €279 would have been recognised in equity (2008: total gain of €388 of which €298 would have been recognised in equity).
(b) Sensitivity analysis – equity risk
The sensitivity analysis for equity risk illustrates how changes in the fair value of equity securities will fluctuate because of changes in market prices, whether those changes are caused by factors specific to the individual equity issuer, or factors affecting all similar equity securities traded in the market.
Management monitors movements of financial assets and equity price risk movements on a monthly basis by assessing the expected changes in the different portfolios due to parallel movements of a 15% increase or decrease in the various stock exchange indexes (for example, Eurostoxx, FTSE-100 and other) with all other variables held constant and all the Group’s equity instruments in that particular index moving proportionally.
The equity securities described in this note are classified as available for sale and are invested only in Euravia and UK operations. All the financial assets backing the US run-off casualty liabilities are floating rate listed debt securities.
An increase and a decrease in 15% in the Eurostoxx and in the FTSE-100 indexes would result in an impact on available-for-sale reserve in equity of €5,193 and €917 respectively in 2009 (2008: €7,172 and €1,266 respectively).
IFRS7p40(a) (c) Sensitivity analysis – currency risk
IFRS7B23 The Group underwrites short-term insurance contracts through operations in Euravia, the US and the UK. The Group’s US and UK short-term insurance portfolios invest in assets denominated in the same currencies as their insurance liabilities, which eliminates the foreign currency exchange rate risk for these operations. Foreign exchange risk arises from recognised assets and liabilities held in the Euravian portfolios that are denominated in currencies other than the euro and from net investments in foreign operations. The sensitivity arising from the latter type of currency risk is discussed in Note 4.2.5 below.
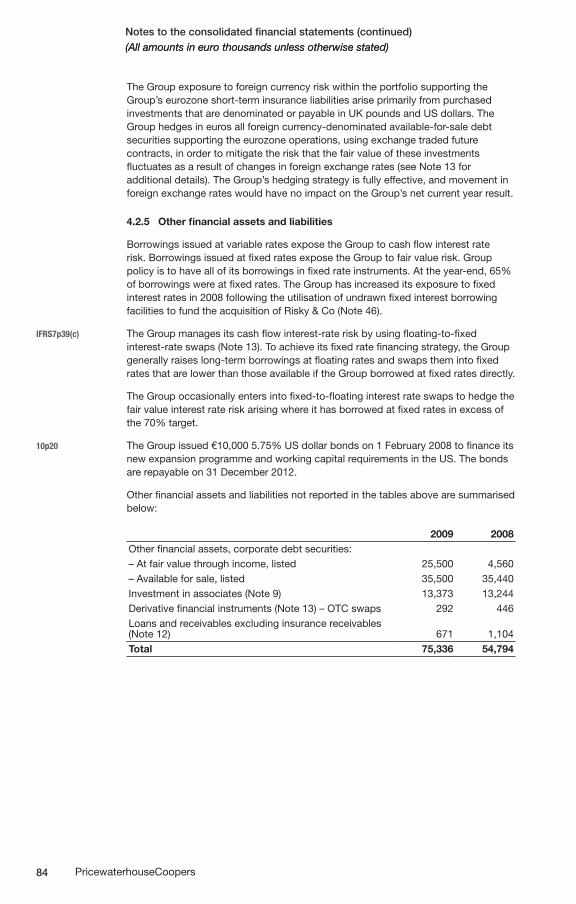
84 PricewaterhouseCoopers
(All amounts in euro thousands unless otherwise stated)Notes to the consolidated financial statements (continued)(All amounts in euro thousands unless otherwise stated)
The Group exposure to foreign currency risk within the portfolio supporting the Group’s eurozone short-term insurance liabilities arise primarily from purchased investments that are denominated or payable in UK pounds and US dollars. The Group hedges in euros all foreign currency-denominated available-for-sale debt securities supporting the eurozone operations, using exchange traded future contracts, in order to mitigate the risk that the fair value of these investments fluctuates as a result of changes in foreign exchange rates (see Note 13 for additional details). The Group’s hedging strategy is fully effective, and movement in foreign exchange rates would have no impact on the Group’s net current year result.
4.2.5 Other financial assets and liabilities
Borrowings issued at variable rates expose the Group to cash flow interest rate risk. Borrowings issued at fixed rates expose the Group to fair value risk. Group policy is to have all of its borrowings in fixed rate instruments. At the year-end, 65% of borrowings were at fixed rates. The Group has increased its exposure to fixed interest rates in 2008 following the utilisation of undrawn fixed interest borrowing facilities to fund the acquisition of Risky & Co (Note 46).
IFRS7p39(c) The Group manages its cash flow interest-rate risk by using floating-to-fixed interest-rate swaps (Note 13). To achieve its fixed rate financing strategy, the Group generally raises long-term borrowings at floating rates and swaps them into fixed rates that are lower than those available if the Group borrowed at fixed rates directly.
The Group occasionally enters into fixed-to-floating interest rate swaps to hedge the fair value interest rate risk arising where it has borrowed at fixed rates in excess of the 70% target.
10p20 The Group issued €10,000 5.75% US dollar bonds on 1 February 2008 to finance its new expansion programme and working capital requirements in the US. The bonds are repayable on 31 December 2012.
Other financial assets and liabilities not reported in the tables above are summarised below:
2009 2008Other financial assets, corporate debt securities:– At fair value through income, listed 25,500 4,560– Available for sale, listed 35,500 35,440Investment in associates (Note 9) 13,373 13,244Derivative financial instruments (Note 13) – OTC swaps 292 446Loans and receivables excluding insurance receivables (Note 12) 671 1,104Total 75,336 54,794
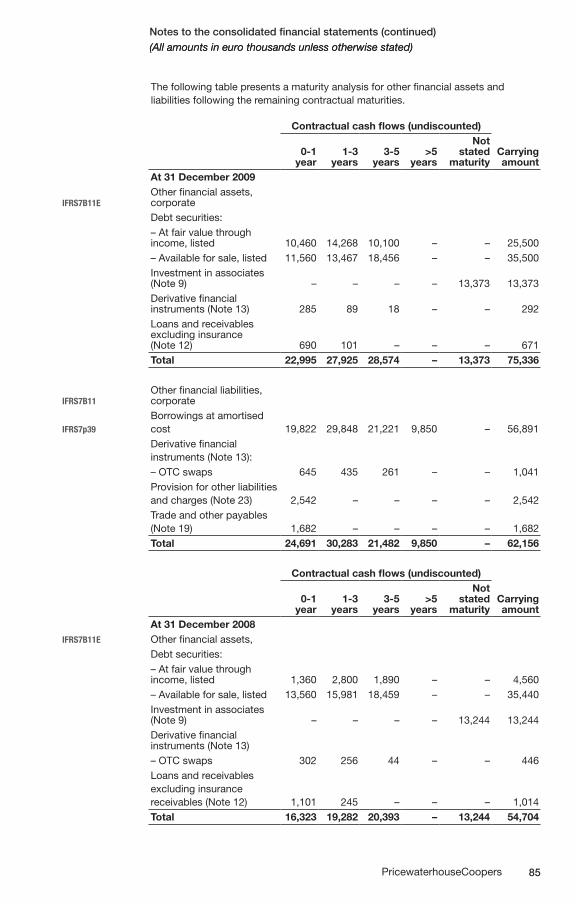
85PricewaterhouseCoopers
(All amounts in euro thousands unless otherwise stated)Notes to the consolidated financial statements (continued)(All amounts in euro thousands unless otherwise stated)
The following table presents a maturity analysis for other financial assets and liabilities following the remaining contractual maturities.
Contractual cash flows (undiscounted)
0-1 year
1-3 years
3-5 years
>5 years
Not stated
maturityCarrying amount
At 31 December 2009
IFRS7B11EOther financial assets, corporateDebt securities:– At fair value through income, listed 10,460 14,268 10,100 – – 25,500– Available for sale, listed 11,560 13,467 18,456 – – 35,500Investment in associates (Note 9) – – – – 13,373 13,373Derivative financial instruments (Note 13) 285 89 18 – – 292Loans and receivables excluding insurance (Note 12) 690 101 – – – 671Total 22,995 27,925 28,574 – 13,373 75,336
IFRS7B11Other financial liabilities, corporate
IFRS7p39
Borrowings at amortised cost 19,822 29,848 21,221 9,850 – 56,891Derivative financial instruments (Note 13):– OTC swaps 645 435 261 – – 1,041Provision for other liabilities and charges (Note 23) 2,542 – – – – 2,542Trade and other payables (Note 19) 1,682 – – – – 1,682Total 24,691 30,283 21,482 9,850 – 62,156
Contractual cash flows (undiscounted)
0-1 year
1-3 years
3-5 years
>5 years
Not stated
maturityCarrying amount
At 31 December 2008IFRS7B11E Other financial assets,
Debt securities:– At fair value through income, listed 1,360 2,800 1,890 – – 4,560– Available for sale, listed 13,560 15,981 18,459 – – 35,440Investment in associates (Note 9) – – – – 13,244 13,244Derivative financial instruments (Note 13)– OTC swaps 302 256 44 – – 446Loans and receivables excluding insurance receivables (Note 12) 1,101 245 – – – 1,014Total 16,323 19,282 20,393 – 13,244 54,704
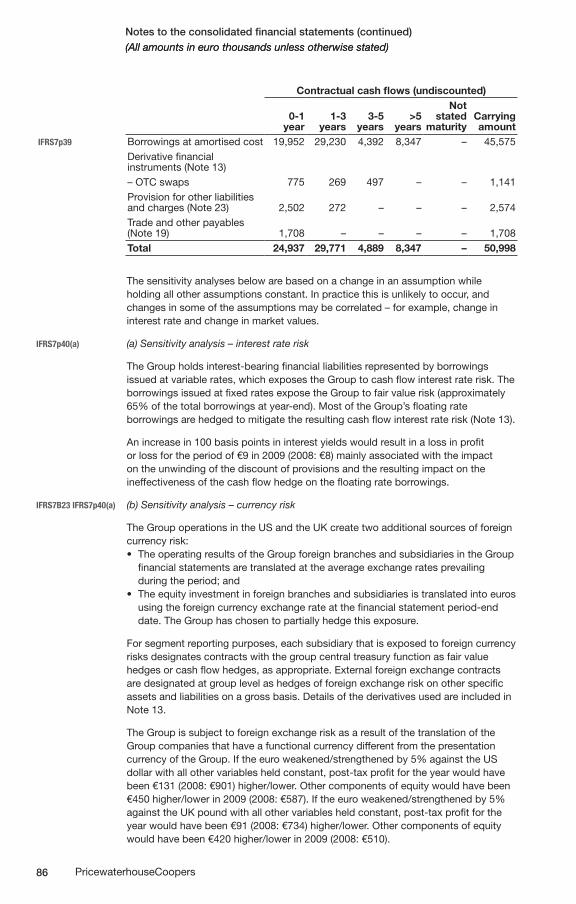
86 PricewaterhouseCoopers
(All amounts in euro thousands unless otherwise stated)Notes to the consolidated financial statements (continued)(All amounts in euro thousands unless otherwise stated)
Contractual cash flows (undiscounted)
0-1 year
1-3 years
3-5 years
>5 years
Not stated
maturityCarrying amount
IFRS7p39 Borrowings at amortised cost 19,952 29,230 4,392 8,347 – 45,575Derivative financial instruments (Note 13)– OTC swaps 775 269 497 – – 1,141Provision for other liabilities and charges (Note 23) 2,502 272 – – – 2,574Trade and other payables (Note 19) 1,708 – – – – 1,708Total 24,937 29,771 4,889 8,347 – 50,998
The sensitivity analyses below are based on a change in an assumption while holding all other assumptions constant. In practice this is unlikely to occur, and changes in some of the assumptions may be correlated – for example, change in interest rate and change in market values.
IFRS7p40(a) (a) Sensitivity analysis – interest rate risk
The Group holds interest-bearing financial liabilities represented by borrowings issued at variable rates, which exposes the Group to cash flow interest rate risk. The borrowings issued at fixed rates expose the Group to fair value risk (approximately 65% of the total borrowings at year-end). Most of the Group’s floating rate borrowings are hedged to mitigate the resulting cash flow interest rate risk (Note 13).
An increase in 100 basis points in interest yields would result in a loss in profit or loss for the period of €9 in 2009 (2008: €8) mainly associated with the impact on the unwinding of the discount of provisions and the resulting impact on the ineffectiveness of the cash flow hedge on the floating rate borrowings.
IFRS7B23 IFRS7p40(a) (b) Sensitivity analysis – currency risk
The Group operations in the US and the UK create two additional sources of foreign currency risk:
The operating results of the Group foreign branches and subsidiaries in the Group •financial statements are translated at the average exchange rates prevailing during the period; andThe equity investment in foreign branches and subsidiaries is translated into euros •using the foreign currency exchange rate at the financial statement period-end date. The Group has chosen to partially hedge this exposure.
For segment reporting purposes, each subsidiary that is exposed to foreign currency risks designates contracts with the group central treasury function as fair value hedges or cash flow hedges, as appropriate. External foreign exchange contracts are designated at group level as hedges of foreign exchange risk on other specific assets and liabilities on a gross basis. Details of the derivatives used are included in Note 13.
The Group is subject to foreign exchange risk as a result of the translation of the Group companies that have a functional currency different from the presentation currency of the Group. If the euro weakened/strengthened by 5% against the US dollar with all other variables held constant, post-tax profit for the year would have been €131 (2008: €901) higher/lower. Other components of equity would have been €450 higher/lower in 2009 (2008: €587). If the euro weakened/strengthened by 5% against the UK pound with all other variables held constant, post-tax profit for the year would have been €91 (2008: €734) higher/lower. Other components of equity would have been €420 higher/lower in 2009 (2008: €510).
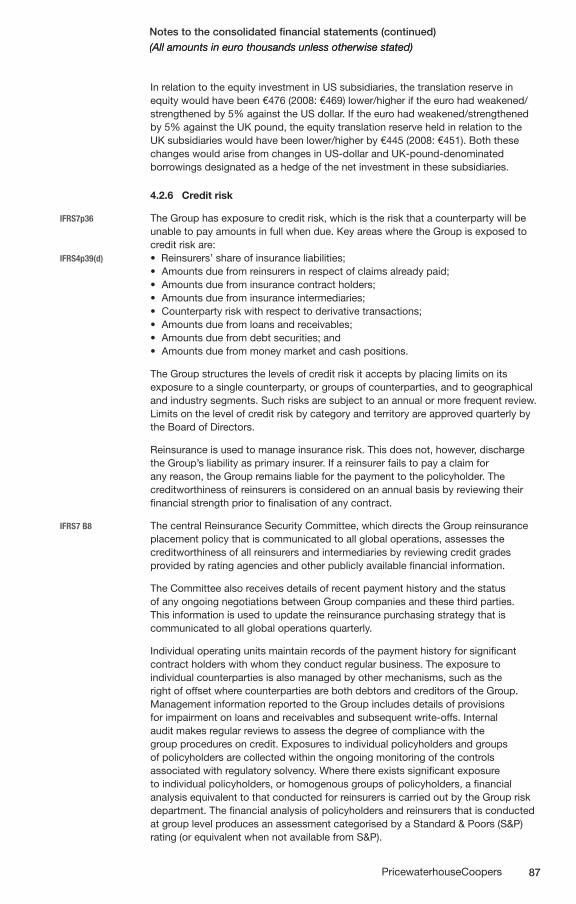
87PricewaterhouseCoopers
(All amounts in euro thousands unless otherwise stated)Notes to the consolidated financial statements (continued)(All amounts in euro thousands unless otherwise stated)
In relation to the equity investment in US subsidiaries, the translation reserve in equity would have been €476 (2008: €469) lower/higher if the euro had weakened/ strengthened by 5% against the US dollar. If the euro had weakened/strengthened by 5% against the UK pound, the equity translation reserve held in relation to the UK subsidiaries would have been lower/higher by €445 (2008: €451). Both these changes would arise from changes in US-dollar and UK-pound-denominated borrowings designated as a hedge of the net investment in these subsidiaries.
4.2.6 Credit risk
IFRS7p36 The Group has exposure to credit risk, which is the risk that a counterparty will be unable to pay amounts in full when due. Key areas where the Group is exposed to credit risk are:
IFRS4p39(d) •Reinsurers’shareofinsuranceliabilities;Amounts due from reinsurers in respect of claims already paid;•Amounts due from insurance contract holders;•Amounts due from insurance intermediaries; •Counterparty risk with respect to derivative transactions;•Amounts due from loans and receivables;•Amounts due from debt securities; and•Amounts due from money market and cash positions.•
The Group structures the levels of credit risk it accepts by placing limits on its exposure to a single counterparty, or groups of counterparties, and to geographical and industry segments. Such risks are subject to an annual or more frequent review. Limits on the level of credit risk by category and territory are approved quarterly by the Board of Directors.
Reinsurance is used to manage insurance risk. This does not, however, discharge the Group’s liability as primary insurer. If a reinsurer fails to pay a claim for any reason, the Group remains liable for the payment to the policyholder. The creditworthiness of reinsurers is considered on an annual basis by reviewing their financial strength prior to finalisation of any contract.
IFRS7 B8 The central Reinsurance Security Committee, which directs the Group reinsurance placement policy that is communicated to all global operations, assesses the creditworthiness of all reinsurers and intermediaries by reviewing credit grades provided by rating agencies and other publicly available financial information.
The Committee also receives details of recent payment history and the status of any ongoing negotiations between Group companies and these third parties. This information is used to update the reinsurance purchasing strategy that is communicated to all global operations quarterly.
Individual operating units maintain records of the payment history for significant contract holders with whom they conduct regular business. The exposure to individual counterparties is also managed by other mechanisms, such as the right of offset where counterparties are both debtors and creditors of the Group. Management information reported to the Group includes details of provisions for impairment on loans and receivables and subsequent write-offs. Internal audit makes regular reviews to assess the degree of compliance with the group procedures on credit. Exposures to individual policyholders and groups of policyholders are collected within the ongoing monitoring of the controls associated with regulatory solvency. Where there exists significant exposure to individual policyholders, or homogenous groups of policyholders, a financial analysis equivalent to that conducted for reinsurers is carried out by the Group risk department. The financial analysis of policyholders and reinsurers that is conducted at group level produces an assessment categorised by a Standard & Poors (S&P) rating (or equivalent when not available from S&P).
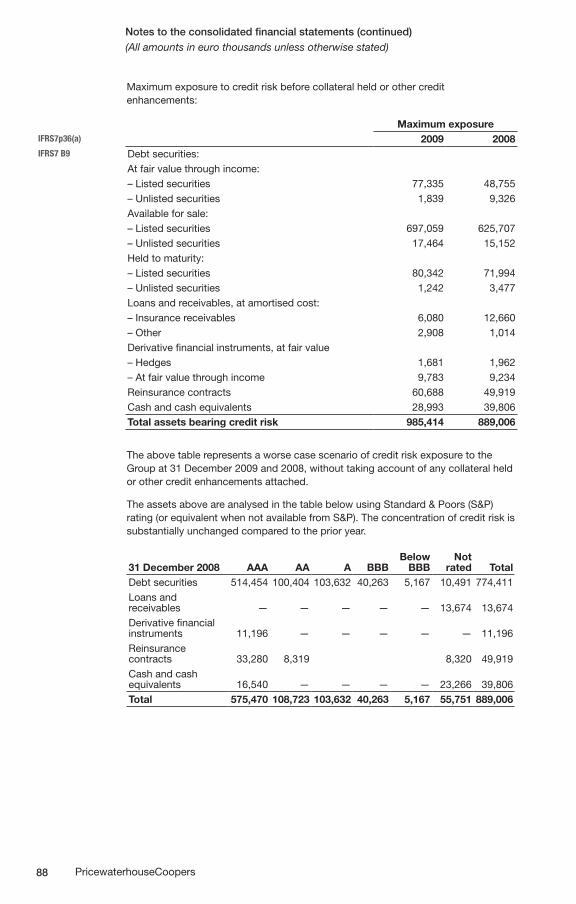
88 PricewaterhouseCoopers
Notes to the consolidated financial statements (continued)(All amounts in euro thousands unless otherwise stated)
Maximum exposure to credit risk before collateral held or other credit enhancements:
Maximum exposureIFRS7p36(a) 2009 2008IFRS7 B9 Debt securities:
At fair value through income:– Listed securities 77,335 48,755– Unlisted securities 1,839 9,326Available for sale:– Listed securities 697,059 625,707– Unlisted securities 17,464 15,152Held to maturity:– Listed securities 80,342 71,994– Unlisted securities 1,242 3,477Loans and receivables, at amortised cost:– Insurance receivables 6,080 12,660– Other 2,908 1,014Derivative financial instruments, at fair value– Hedges 1,681 1,962– At fair value through income 9,783 9,234Reinsurance contracts 60,688 49,919Cash and cash equivalents 28,993 39,806Total assets bearing credit risk 985,414 889,006
The above table represents a worse case scenario of credit risk exposure to the Group at 31 December 2009 and 2008, without taking account of any collateral held or other credit enhancements attached.
The assets above are analysed in the table below using Standard & Poors (S&P) rating (or equivalent when not available from S&P). The concentration of credit risk is substantially unchanged compared to the prior year.
31 December 2008 AAA AA A BBBBelow
BBBNot
rated TotalDebt securities 514,454 100,404 103,632 40,263 5,167 10,491 774,411Loans and receivables — — — — — 13,674 13,674Derivative financial instruments 11,196 — — — — — 11,196Reinsurance contracts 33,280 8,319 8,320 49,919Cash and cash equivalents 16,540 — — — — 23,266 39,806Total 575,470 108,723 103,632 40,263 5,167 55,751 889,006
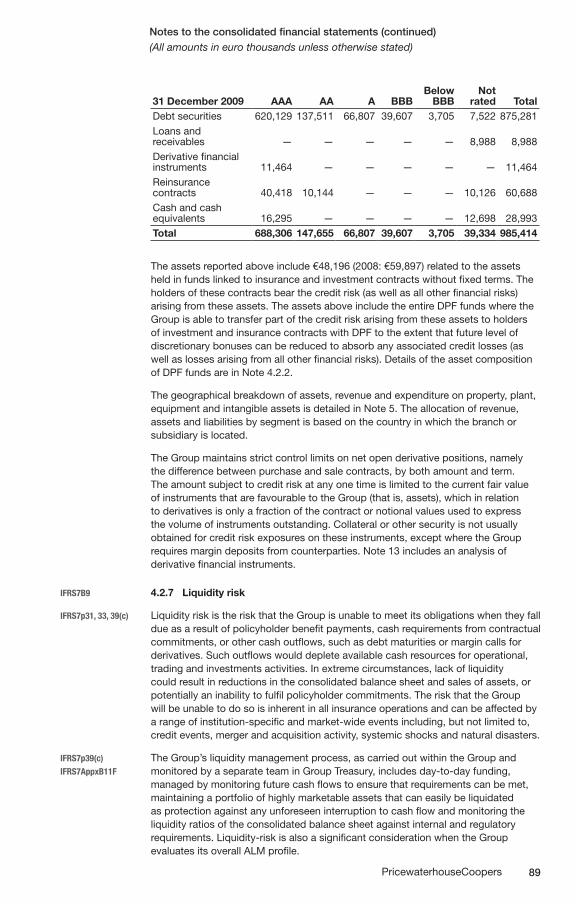
89PricewaterhouseCoopers
Notes to the consolidated financial statements (continued)(All amounts in euro thousands unless otherwise stated)
31 December 2009 AAA AA A BBBBelow
BBBNot
rated TotalDebt securities 620,129 137,511 66,807 39,607 3,705 7,522 875,281Loans and receivables — — — — — 8,988 8,988Derivative financial instruments 11,464 — — — — — 11,464Reinsurance contracts 40,418 10,144 — — — 10,126 60,688Cash and cash equivalents 16,295 — — — — 12,698 28,993Total 688,306 147,655 66,807 39,607 3,705 39,334 985,414
The assets reported above include €48,196 (2008: €59,897) related to the assets held in funds linked to insurance and investment contracts without fixed terms. The holders of these contracts bear the credit risk (as well as all other financial risks) arising from these assets. The assets above include the entire DPF funds where the Group is able to transfer part of the credit risk arising from these assets to holders of investment and insurance contracts with DPF to the extent that future level of discretionary bonuses can be reduced to absorb any associated credit losses (as well as losses arising from all other financial risks). Details of the asset composition of DPF funds are in Note 4.2.2.
The geographical breakdown of assets, revenue and expenditure on property, plant, equipment and intangible assets is detailed in Note 5. The allocation of revenue, assets and liabilities by segment is based on the country in which the branch or subsidiary is located.
The Group maintains strict control limits on net open derivative positions, namely the difference between purchase and sale contracts, by both amount and term. The amount subject to credit risk at any one time is limited to the current fair value of instruments that are favourable to the Group (that is, assets), which in relation to derivatives is only a fraction of the contract or notional values used to express the volume of instruments outstanding. Collateral or other security is not usually obtained for credit risk exposures on these instruments, except where the Group requires margin deposits from counterparties. Note 13 includes an analysis of derivative financial instruments.
IFRS7B9 4.2.7 Liquidity risk
IFRS7p31, 33, 39(c) Liquidity risk is the risk that the Group is unable to meet its obligations when they fall due as a result of policyholder benefit payments, cash requirements from contractual commitments, or other cash outflows, such as debt maturities or margin calls for derivatives. Such outflows would deplete available cash resources for operational, trading and investments activities. In extreme circumstances, lack of liquidity could result in reductions in the consolidated balance sheet and sales of assets, or potentially an inability to fulfil policyholder commitments. The risk that the Group will be unable to do so is inherent in all insurance operations and can be affected by a range of institution-specific and market-wide events including, but not limited to, credit events, merger and acquisition activity, systemic shocks and natural disasters.
IFRS7p39(c) The Group’s liquidity management process, as carried out within the Group andIFRS7AppxB11F monitored by a separate team in Group Treasury, includes day-to-day funding, managed by monitoring future cash flows to ensure that requirements can be met,
maintaining a portfolio of highly marketable assets that can easily be liquidated as protection against any unforeseen interruption to cash flow and monitoring the liquidity ratios of the consolidated balance sheet against internal and regulatory requirements. Liquidity-risk is also a significant consideration when the Group evaluates its overall ALM profile.
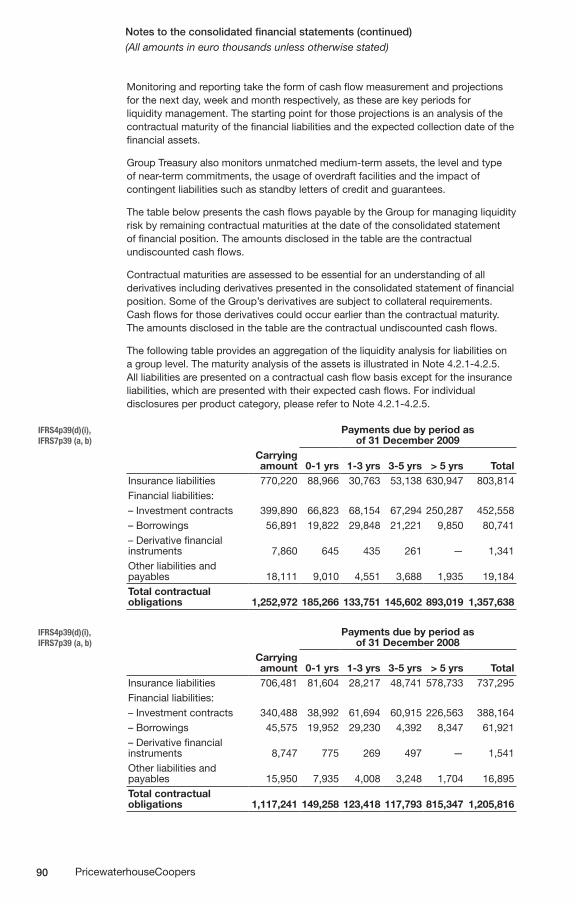
90 PricewaterhouseCoopers
Notes to the consolidated financial statements (continued)(All amounts in euro thousands unless otherwise stated)
Monitoring and reporting take the form of cash flow measurement and projections for the next day, week and month respectively, as these are key periods for liquidity management. The starting point for those projections is an analysis of the contractual maturity of the financial liabilities and the expected collection date of the financial assets.
Group Treasury also monitors unmatched medium-term assets, the level and type of near-term commitments, the usage of overdraft facilities and the impact of contingent liabilities such as standby letters of credit and guarantees.
The table below presents the cash flows payable by the Group for managing liquidity risk by remaining contractual maturities at the date of the consolidated statement of financial position. The amounts disclosed in the table are the contractual undiscounted cash flows.
Contractual maturities are assessed to be essential for an understanding of all derivatives including derivatives presented in the consolidated statement of financial position. Some of the Group’s derivatives are subject to collateral requirements. Cash flows for those derivatives could occur earlier than the contractual maturity. The amounts disclosed in the table are the contractual undiscounted cash flows.
The following table provides an aggregation of the liquidity analysis for liabilities on a group level. The maturity analysis of the assets is illustrated in Note 4.2.1-4.2.5. All liabilities are presented on a contractual cash flow basis except for the insurance liabilities, which are presented with their expected cash flows. For individual disclosures per product category, please refer to Note 4.2.1-4.2.5.
IFRS4p39(d)(i), IFRS7p39 (a, b)
Payments due by period as of 31 December 2009
Carrying amount 0-1 yrs 1-3 yrs 3-5 yrs > 5 yrs Total
Insurance liabilities 770,220 88,966 30,763 53,138 630,947 803,814Financial liabilities:– Investment contracts 399,890 66,823 68,154 67,294 250,287 452,558– Borrowings 56,891 19,822 29,848 21,221 9,850 80,741– Derivative financial instruments 7,860 645 435 261 — 1,341Other liabilities and payables 18,111 9,010 4,551 3,688 1,935 19,184Total contractual obligations 1,252,972 185,266 133,751 145,602 893,019 1,357,638
IFRS4p39(d)(i), IFRS7p39 (a, b)
Payments due by period as of 31 December 2008
Carrying amount 0-1 yrs 1-3 yrs 3-5 yrs > 5 yrs Total
Insurance liabilities 706,481 81,604 28,217 48,741 578,733 737,295Financial liabilities:– Investment contracts 340,488 38,992 61,694 60,915 226,563 388,164– Borrowings 45,575 19,952 29,230 4,392 8,347 61,921– Derivative financial instruments 8,747 775 269 497 — 1,541Other liabilities and payables 15,950 7,935 4,008 3,248 1,704 16,895Total contractual obligations 1,117,241 149,258 123,418 117,793 815,347 1,205,816
91PricewaterhouseCoopers
Notes to the consolidated financial statements (continued)(All amounts in euro thousands unless otherwise stated)
Note: Contractual maturity analysis
The amounts disclosed in the maturity analysis are the contractual undiscounted cash flows (IFRS7p39). Therefore, the table above does not reconcile to the discounted cash flows in the consolidated statement of financial position. IFRS 7 does not require such reconciliation. The requirement in IFRS 7 is to disclose each of the contractual payments in the period when it is due (including principal and interest). Therefore, in the maturity analysis, the cash flows are split into the maturity buckets in which the cash flows occur (including interest cash flows), rather than being included in a single bucket when the instrument matures.
Note: Net-settled derivatives
Net-settled derivatives that have a negative fair value at the reporting date (that is, those that are liabilities) are included in the liquidity analysis at contractual undiscounted amounts. Net-settled derivatives that have a positive fair value (that is, those that are assets) may also be included, although this is not a requirement of IFRS 7.
1Rp124A 4.2.8 Capital management
The Group’s objectives when managing capital are:To comply with the insurance capital requirements that the regulators of the •insurance markets where the Group operates require. In this respect the Group manages its capital on a basis of 150% of its minimum regulatory capital position presented in the table below. Management considers the quantitative threshold of 150% sufficient to maximise shareholders’ return and to support the capital required to write each of its businesses in the countries where the Group operates;To safeguard the Group’s ability to continue as a going concern, so that it can •continue to provide returns for shareholders and benefits for other stakeholders; andTo provide an adequate return to shareholders by pricing insurance and •investment contracts commensurately with the level of risk.
The defined Group capital includes equity and the redeemable preference shares.
In each country in which the Group operates, the local insurance regulator specifies the minimum amount and type of capital that must be held by each of the subsidiaries in addition to their insurance liabilities. The minimum required capital (presented in the table below for each of the businesses) must be maintained at all times throughout the year. The Group is subject to insurance solvency regulations in all the territories in which it issues insurance and investment contracts, and where it has complied with all the local solvency regulations. The Group has embedded in its ALM framework the necessary tests to ensure continuous and full compliance with such regulations.
The table below summarises the minimum required capital across the Group and the regulatory capital held against each of them. These figures are an aggregate number, being the sum of the statutory capital and surplus for each insurance company in each country subject to local regulatory requirements, which may differ from jurisdiction to jurisdiction. The current year is, in general, an estimate that is updated once calculations prepared for the regulators are final.
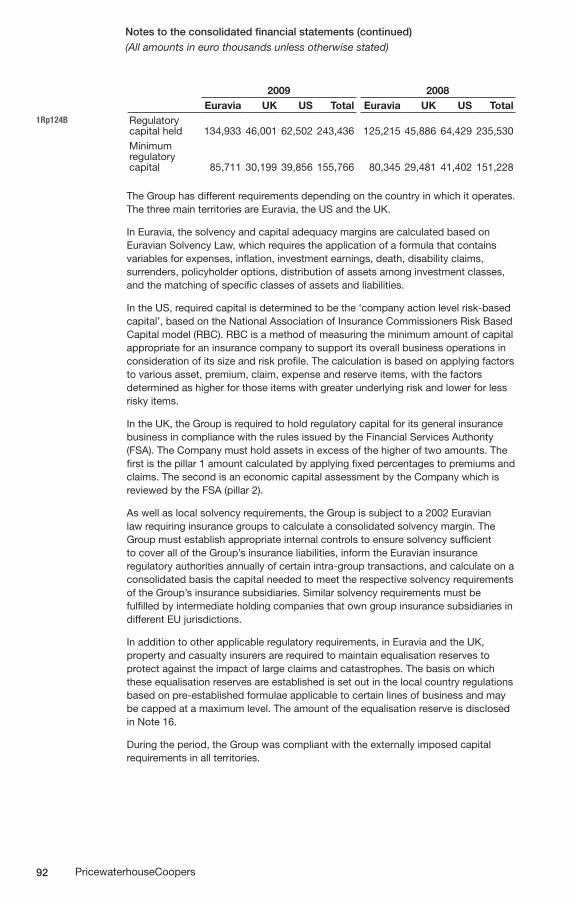
92 PricewaterhouseCoopers
Notes to the consolidated financial statements (continued)(All amounts in euro thousands unless otherwise stated)
2009 2008Euravia UK US Total Euravia UK US Total
1Rp124B Regulatory capital held 134,933 46,001 62,502 243,436 125,215 45,886 64,429 235,530Minimum regulatory capital 85,711 30,199 39,856 155,766 80,345 29,481 41,402 151,228
The Group has different requirements depending on the country in which it operates. The three main territories are Euravia, the US and the UK.
In Euravia, the solvency and capital adequacy margins are calculated based on Euravian Solvency Law, which requires the application of a formula that contains variables for expenses, inflation, investment earnings, death, disability claims, surrenders, policyholder options, distribution of assets among investment classes, and the matching of specific classes of assets and liabilities.
In the US, required capital is determined to be the ‘company action level risk-based capital’, based on the National Association of Insurance Commissioners Risk Based Capital model (RBC). RBC is a method of measuring the minimum amount of capital appropriate for an insurance company to support its overall business operations in consideration of its size and risk profile. The calculation is based on applying factors to various asset, premium, claim, expense and reserve items, with the factors determined as higher for those items with greater underlying risk and lower for less risky items.
In the UK, the Group is required to hold regulatory capital for its general insurance business in compliance with the rules issued by the Financial Services Authority (FSA). The Company must hold assets in excess of the higher of two amounts. The first is the pillar 1 amount calculated by applying fixed percentages to premiums and claims. The second is an economic capital assessment by the Company which is reviewed by the FSA (pillar 2).
As well as local solvency requirements, the Group is subject to a 2002 Euravian law requiring insurance groups to calculate a consolidated solvency margin. The Group must establish appropriate internal controls to ensure solvency sufficient to cover all of the Group’s insurance liabilities, inform the Euravian insurance regulatory authorities annually of certain intra-group transactions, and calculate on a consolidated basis the capital needed to meet the respective solvency requirements of the Group’s insurance subsidiaries. Similar solvency requirements must be fulfilled by intermediate holding companies that own group insurance subsidiaries in different EU jurisdictions.
In addition to other applicable regulatory requirements, in Euravia and the UK, property and casualty insurers are required to maintain equalisation reserves to protect against the impact of large claims and catastrophes. The basis on which these equalisation reserves are established is set out in the local country regulations based on pre-established formulae applicable to certain lines of business and may be capped at a maximum level. The amount of the equalisation reserve is disclosed in Note 16.
During the period, the Group was compliant with the externally imposed capital requirements in all territories.
93PricewaterhouseCoopers
Notes to the consolidated financial statements (continued)(All amounts in euro thousands unless otherwise stated)
4.3 Fair value hierarchy
At 31 December 2009, investments classified as Level 1 comprise approximately 26.6% of financial assets measured at fair value on a recurring basis. Fair value measurements classified as Level 1 include exchange-traded prices of fixed maturities, equity securities and derivative contracts.
At 31 December 2009, investments classified as Level 2 comprise approximately 64.03% of financial assets measured at fair value on a recurring basis. They primarily include government and agency securities and certain corporate debt securities, such as private fixed maturities. As market quotes generally are not readily available or accessible for these securities, their fair value measures are determined utilising relevant information generated by market transactions involving comparable securities. They are often based on model pricing techniques that effectively discount prospective cash flows to present value using appropriate sector-adjusted credit spreads commensurate with the security’s duration, also taking into consideration issuer-specific credit quality and liquidity. These valuation methodologies have been studied and evaluated by the Company and the resulting prices determined to be representative of exit values.
Observable inputs generally used to measure the fair value of securities classified as Level 2 include benchmark yields, reported secondary trades, broker-dealer quotes, issuer spreads, benchmark securities, bids, offers and reference data. Additional observable inputs are used when available, and as may be appropriate, for certain security types, such as pre-payment, default and collateral information for purpose of measuring the fair value of mortgage – and asset-backed securities. At 30 December 2009, approximately €92.6 million AAA-rated mortgage – and asset-backed securities are classified as Level 2, including commercial mortgage obligations, for which the observability of market inputs to their pricing models is supported by sufficient, albeit more recently contracted market activity in these sectors.
As disclosed in Note 13, the net fair value of free-standing derivative positions is approximately €3.6 million at 30 December 2009. All of these derivative contracts are traded in the over-the-counter (OTC) derivative market and are classified in Level 2. The fair values of derivative assets and liabilities traded in the OTC market are determined using quantitative models that require use of the contractual terms of the derivative instruments and multiple market inputs, including interest rates, prices and indices to generate continuous yield or pricing curves and volatility factors, which are then applied to value the positions. The predominance of market inputs is actively quoted and can be validated through external sources or reliably interpolated if less observable.
The credit risk of the counterparty and of Asfalia are considered in determining the fair values of all OTC derivative asset and liability positions, respectively, after taking into account the effects of master netting agreements and collateral arrangements. Each reporting period, Asfalia values its derivative positions using the standard swap curve and evaluates whether to adjust the embedded credit spread to reflect change in counterparty or its own credit standing.
At 30 December 2009, investments classified as Level 3 comprise approximately 9.31% of financial assets measured at fair value on a recurring basis. They primarily include corporate debt securities, such as private fixed maturities. Determinations to classify fair value measures within Level 3 of the valuation hierarchy are generally based on the significance of the unobservable factors to the overall fair value measurement. Included in the Level 3 classification at 30 December 2009 were approximately €109.3 million of fixed maturities with indicative pricing obtained from brokers that otherwise could not be corroborated to market observable data. Asfalia
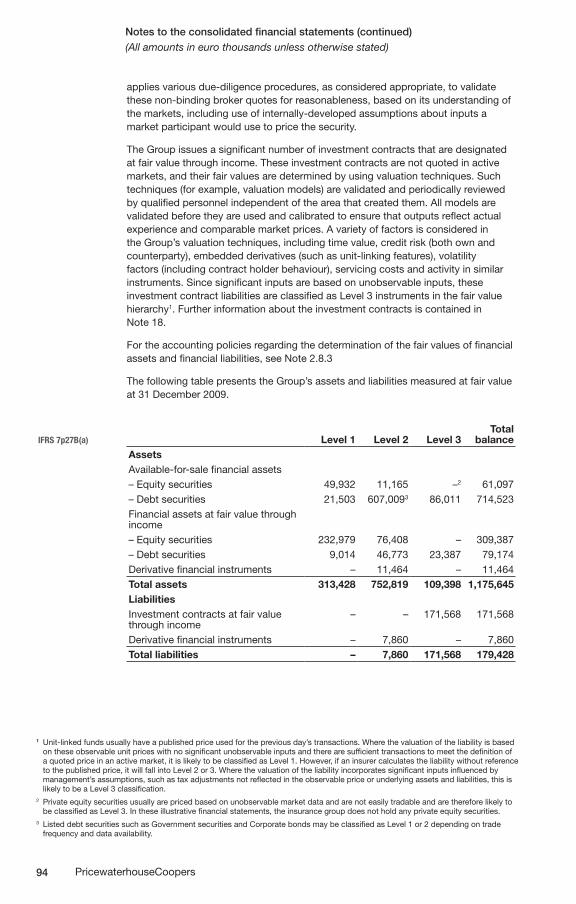
94 PricewaterhouseCoopers
Notes to the consolidated financial statements (continued)(All amounts in euro thousands unless otherwise stated)
applies various due-diligence procedures, as considered appropriate, to validate these non-binding broker quotes for reasonableness, based on its understanding of the markets, including use of internally-developed assumptions about inputs a market participant would use to price the security.
The Group issues a significant number of investment contracts that are designated at fair value through income. These investment contracts are not quoted in active markets, and their fair values are determined by using valuation techniques. Such techniques (for example, valuation models) are validated and periodically reviewed by qualified personnel independent of the area that created them. All models are validated before they are used and calibrated to ensure that outputs reflect actual experience and comparable market prices. A variety of factors is considered in the Group’s valuation techniques, including time value, credit risk (both own and counterparty), embedded derivatives (such as unit-linking features), volatility factors (including contract holder behaviour), servicing costs and activity in similar instruments. Since significant inputs are based on unobservable inputs, these investment contract liabilities are classified as Level 3 instruments in the fair value hierarchy1. Further information about the investment contracts is contained in Note 18.
For the accounting policies regarding the determination of the fair values of financial assets and financial liabilities, see Note 2.8.3
The following table presents the Group’s assets and liabilities measured at fair value at 31 December 2009.
IFRS 7p27B(a) Level 1 Level 2 Level 3Total
balanceAssetsAvailable-for-sale financial assets– Equity securities 49,932 11,165 –2 61,097– Debt securities 21,503 607,0093 86,011 714,523Financial assets at fair value through income– Equity securities 232,979 76,408 – 309,387– Debt securities 9,014 46,773 23,387 79,174Derivative financial instruments – 11,464 – 11,464Total assets 313,428 752,819 109,398 1,175,645LiabilitiesInvestment contracts at fair value through income
– – 171,568 171,568
Derivative financial instruments – 7,860 – 7,860Total liabilities – 7,860 171,568 179,428
1 Unit-linked funds usually have a published price used for the previous day’s transactions. Where the valuation of the liability is based on these observable unit prices with no significant unobservable inputs and there are sufficient transactions to meet the definition of a quoted price in an active market, it is likely to be classified as Level 1. However, if an insurer calculates the liability without reference to the published price, it will fall into Level 2 or 3. Where the valuation of the liability incorporates significant inputs influenced by management’s assumptions, such as tax adjustments not reflected in the observable price or underlying assets and liabilities, this is likely to be a Level 3 classification.
2 Private equity securities usually are priced based on unobservable market data and are not easily tradable and are therefore likely to be classified as Level 3. In these illustrative financial statements, the insurance group does not hold any private equity securities.
3 Listed debt securities such as Government securities and Corporate bonds may be classified as Level 1 or 2 depending on trade frequency and data availability.
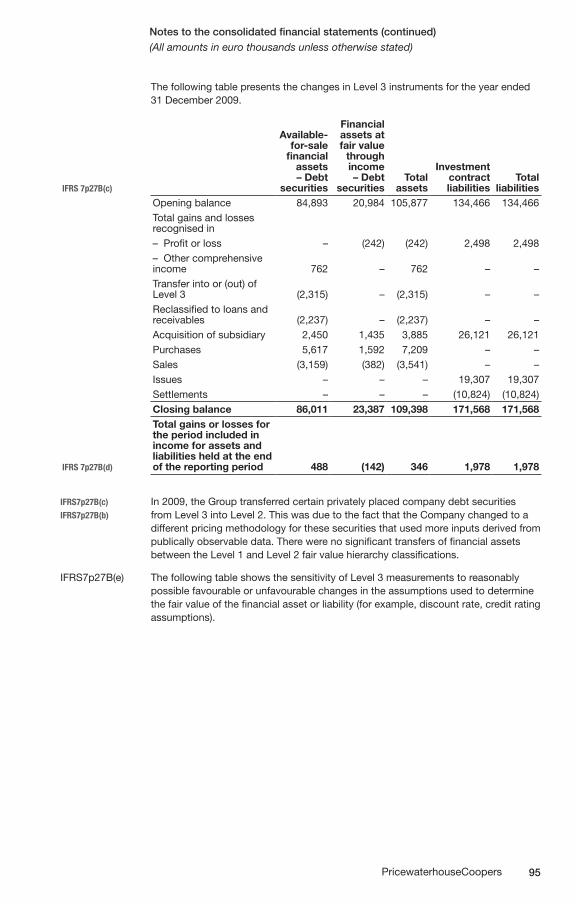
95PricewaterhouseCoopers
Notes to the consolidated financial statements (continued)(All amounts in euro thousands unless otherwise stated)
The following table presents the changes in Level 3 instruments for the year ended 31 December 2009.
IFRS 7p27B(c)
Available-for-sale
financial assets – Debt
securities
Financial assets at fair value
through income – Debt
securitiesTotal
assets
Investment contract liabilities
Total liabilities
Opening balance 84,893 20,984 105,877 134,466 134,466Total gains and losses recognised in– Profit or loss – (242) (242) 2,498 2,498– Other comprehensive income 762 – 762 – –Transfer into or (out) of Level 3 (2,315) – (2,315) – –Reclassified to loans and receivables (2,237) – (2,237) – –Acquisition of subsidiary 2,450 1,435 3,885 26,121 26,121Purchases 5,617 1,592 7,209 – –Sales (3,159) (382) (3,541) – –Issues – – – 19,307 19,307Settlements – – – (10,824) (10,824) Closing balance 86,011 23,387 109,398 171,568 171,568
IFRS 7p27B(d)
Total gains or losses for the period included in income for assets and liabilities held at the end of the reporting period 488 (142) 346 1,978 1,978
IFRS7p27B(c) In 2009, the Group transferred certain privately placed company debt securitiesIFRS7p27B(b) from Level 3 into Level 2. This was due to the fact that the Company changed to a
different pricing methodology for these securities that used more inputs derived from publically observable data. There were no significant transfers of financial assets between the Level 1 and Level 2 fair value hierarchy classifications.
IFRS7p27B(e) The following table shows the sensitivity of Level 3 measurements to reasonably possible favourable or unfavourable changes in the assumptions used to determine the fair value of the financial asset or liability (for example, discount rate, credit rating assumptions).
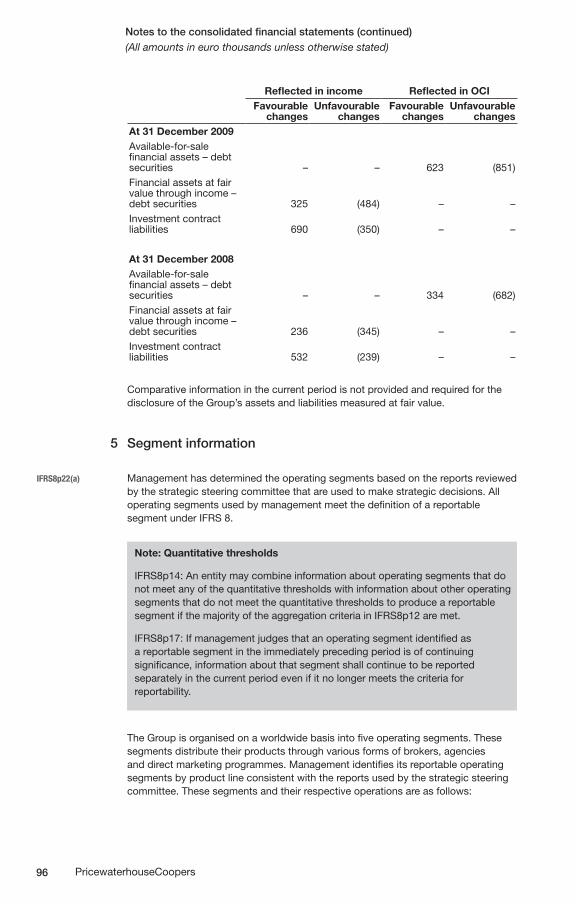
96 PricewaterhouseCoopers
Notes to the consolidated financial statements (continued)(All amounts in euro thousands unless otherwise stated)
Reflected in income Reflected in OCIFavourable
changesUnfavourable
changesFavourable
changesUnfavourable
changesAt 31 December 2009Available-for-sale financial assets – debt securities – – 623 (851)Financial assets at fair value through income – debt securities 325 (484) – –Investment contract liabilities 690 (350) – –
At 31 December 2008Available-for-sale financial assets – debt securities – – 334 (682)Financial assets at fair value through income – debt securities 236 (345) – –Investment contract liabilities 532 (239) – –
Comparative information in the current period is not provided and required for the disclosure of the Group’s assets and liabilities measured at fair value.
5 Segment information
IFRS8p22(a) Management has determined the operating segments based on the reports reviewed by the strategic steering committee that are used to make strategic decisions. All operating segments used by management meet the definition of a reportable segment under IFRS 8.
Note: Quantitative thresholds
IFRS8p14: An entity may combine information about operating segments that do not meet any of the quantitative thresholds with information about other operating segments that do not meet the quantitative thresholds to produce a reportable segment if the majority of the aggregation criteria in IFRS8p12 are met.
IFRS8p17: If management judges that an operating segment identified as a reportable segment in the immediately preceding period is of continuing significance, information about that segment shall continue to be reported separately in the current period even if it no longer meets the criteria for reportability.
The Group is organised on a worldwide basis into five operating segments. These segments distribute their products through various forms of brokers, agencies and direct marketing programmes. Management identifies its reportable operating segments by product line consistent with the reports used by the strategic steering committee. These segments and their respective operations are as follows:
97PricewaterhouseCoopers
Notes to the consolidated financial statements (continued)(All amounts in euro thousands unless otherwise stated)
IFRS8p22(b) • Savings:offersarangeofsavingsproductsdomesticallyandabroadtosuit customer’s long – and short-term investment needs. This segment comprises all
other types of long-term contracts issued by the Group (both with and without insurance risk, and with and without discretionary participation features). Revenue from this segment is derived primarily from insurance premiums, fee income, investment income, net realised gains on financial assets and net fair value gains on financial assets at fair value through income.
Life risk: protection of the Group’s customers against the risk of premature death, •disability, critical illness and other accidents. All contracts in this segment offer fixed and guaranteed benefits over the contractual term. Revenue from this segment is derived primarily from insurance premium, investment income, net realised gains on financial assets and net fair value gains on financial assets at fair value through income.
Property: the protection of customers’ assets (particularly their properties, both for •personal and commercial business.) All contracts in this segment are over a short contractual term. Revenue in this segment is derived primarily from insurance premiums, investment income, net realised gains on financial assets, and net fair value gains on financial assets at fair value through income.
Casualty: indemnification of other parties that have suffered damage as a result of •customers’ accidents – in particular, relating to asbestos and employer’s liability claims. All contracts in this segment are over a short contractual term. Revenue in this segment is derived primarily from insurance premiums, investment income, net realised gains on financial assets and net fair value gains on financial assets at fair value through income.
IFRS8p16 • Corporateandother:includescorporateoperations,afterallocationstoIFRS8p23 operating segments. Corporate operations consist primarily of (1) corporate-level
income and expenses, after allocations to any business segments, including income and expense from the Company’s post-employment benefit plans and investment returns on capital that is not deployed in any operating segments; (2) returns from investments not allocated to any operating segments, including debt-financed investment portfolios, as well as the impact of transactions with other segments.
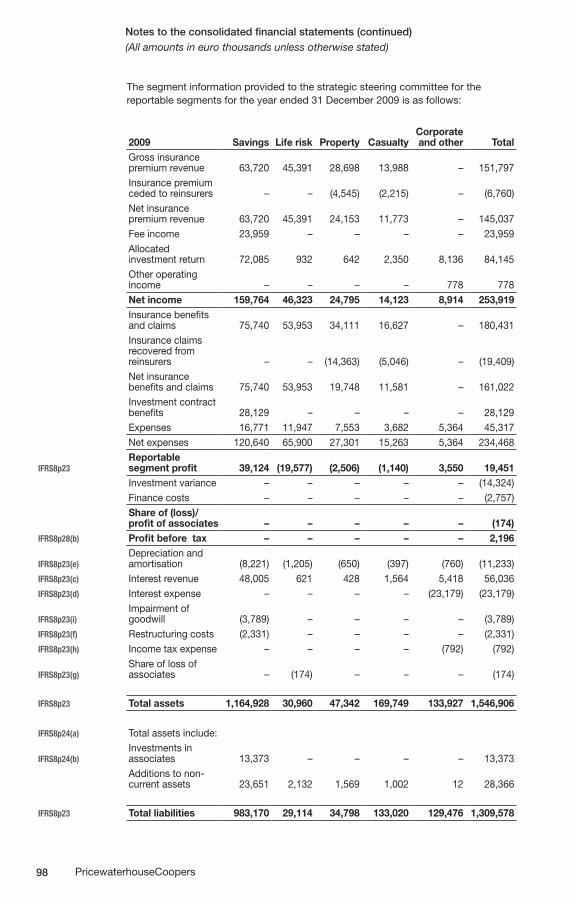
98 PricewaterhouseCoopers
Notes to the consolidated financial statements (continued)(All amounts in euro thousands unless otherwise stated)
The segment information provided to the strategic steering committee for the reportable segments for the year ended 31 December 2009 is as follows:
2009 Savings Life risk Property CasualtyCorporate and other Total
Gross insurance premium revenue 63,720 45,391 28,698 13,988 – 151,797Insurance premium ceded to reinsurers – – (4,545) (2,215) – (6,760)Net insurance premium revenue 63,720 45,391 24,153 11,773 – 145,037Fee income 23,959 – – – – 23,959Allocated investment return 72,085 932 642 2,350 8,136 84,145Other operating income – – – – 778 778Net income 159,764 46,323 24,795 14,123 8,914 253,919Insurance benefits and claims 75,740 53,953 34,111 16,627 – 180,431Insurance claims recovered from reinsurers – – (14,363) (5,046) – (19,409)Net insurance benefits and claims 75,740 53,953 19,748 11,581 – 161,022Investment contract benefits 28,129 – – – – 28,129Expenses 16,771 11,947 7,553 3,682 5,364 45,317Net expenses 120,640 65,900 27,301 15,263 5,364 234,468
IFRS8p23Reportable segment profit 39,124 (19,577) (2,506) (1,140) 3,550 19,451Investment variance – – – – – (14,324)Finance costs – – – – – (2,757)Share of (loss)/profit of associates – – – – – (174)
IFRS8p28(b) Profit before tax – – – – – 2,196
IFRS8p23(e)Depreciation and amortisation (8,221) (1,205) (650) (397) (760) (11,233)
IFRS8p23(c) Interest revenue 48,005 621 428 1,564 5,418 56,036IFRS8p23(d) Interest expense – – – – (23,179) (23,179)
IFRS8p23(i)Impairment of goodwill (3,789) – – – – (3,789)
IFRS8p23(f) Restructuring costs (2,331) – – – – (2,331)IFRS8p23(h) Income tax expense – – – – (792) (792)
IFRS8p23(g)Share of loss of associates – (174) – – – (174)
IFRS8p23 Total assets 1,164,928 30,960 47,342 169,749 133,927 1,546,906
IFRS8p24(a) Total assets include:
IFRS8p24(b)Investments in associates 13,373 – – – – 13,373Additions to non- current assets 23,651 2,132 1,569 1,002 12 28,366
IFRS8p23 Total liabilities 983,170 29,114 34,798 133,020 129,476 1,309,578
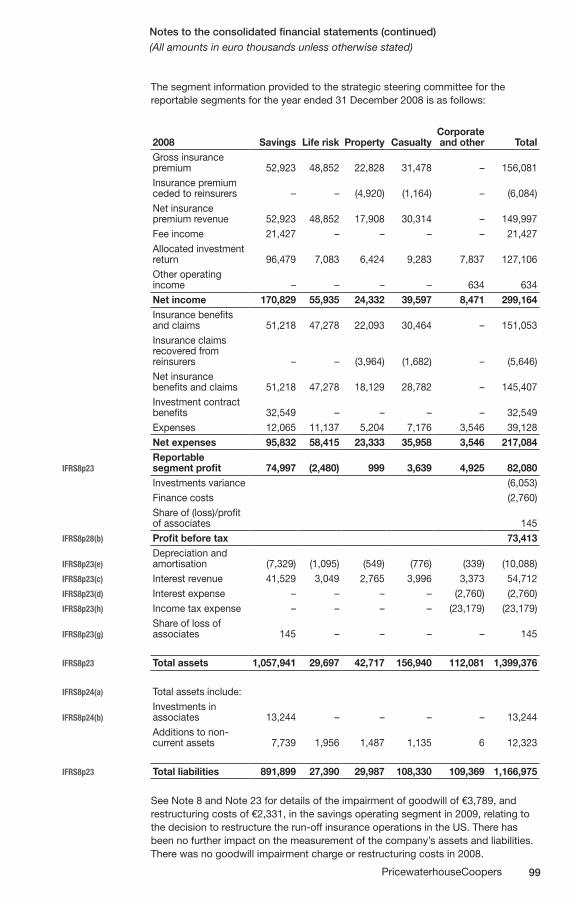
99PricewaterhouseCoopers
Notes to the consolidated financial statements (continued)(All amounts in euro thousands unless otherwise stated)
The segment information provided to the strategic steering committee for the reportable segments for the year ended 31 December 2008 is as follows:
2008 Savings Life risk Property CasualtyCorporate and other Total
Gross insurance premium 52,923 48,852 22,828 31,478 – 156,081Insurance premium ceded to reinsurers – – (4,920) (1,164) – (6,084)Net insurance premium revenue 52,923 48,852 17,908 30,314 – 149,997Fee income 21,427 – – – – 21,427Allocated investment return 96,479 7,083 6,424 9,283 7,837 127,106Other operating income – – – – 634 634Net income 170,829 55,935 24,332 39,597 8,471 299,164Insurance benefits and claims 51,218 47,278 22,093 30,464 – 151,053Insurance claims recovered from reinsurers – – (3,964) (1,682) – (5,646)Net insurance benefits and claims 51,218 47,278 18,129 28,782 – 145,407Investment contract benefits 32,549 – – – – 32,549Expenses 12,065 11,137 5,204 7,176 3,546 39,128Net expenses 95,832 58,415 23,333 35,958 3,546 217,084
IFRS8p23Reportable segment profit 74,997 (2,480) 999 3,639 4,925 82,080Investments variance (6,053)Finance costs (2,760)Share of (loss)/profit of associates 145
IFRS8p28(b) Profit before tax 73,413
IFRS8p23(e)Depreciation and amortisation (7,329) (1,095) (549) (776) (339) (10,088)
IFRS8p23(c) Interest revenue 41,529 3,049 2,765 3,996 3,373 54,712IFRS8p23(d) Interest expense – – – – (2,760) (2,760)IFRS8p23(h) Income tax expense – – – – (23,179) (23,179)
IFRS8p23(g)Share of loss of associates 145 – – – – 145
IFRS8p23 Total assets 1,057,941 29,697 42,717 156,940 112,081 1,399,376
IFRS8p24(a) Total assets include:
IFRS8p24(b)Investments in associates 13,244 – – – – 13,244Additions to non-current assets 7,739 1,956 1,487 1,135 6 12,323
IFRS8p23 Total liabilities 891,899 27,390 29,987 108,330 109,369 1,166,975
See Note 8 and Note 23 for details of the impairment of goodwill of €3,789, and restructuring costs of €2,331, in the savings operating segment in 2009, relating to the decision to restructure the run-off insurance operations in the US. There has been no further impact on the measurement of the company’s assets and liabilities. There was no goodwill impairment charge or restructuring costs in 2008.
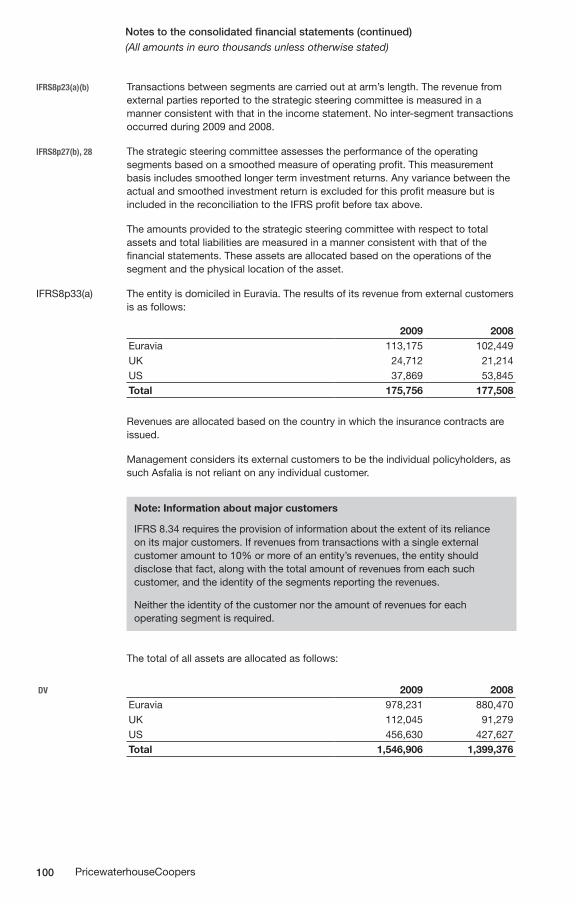
100 PricewaterhouseCoopers
Notes to the consolidated financial statements (continued)(All amounts in euro thousands unless otherwise stated)
IFRS8p23(a)(b) Transactions between segments are carried out at arm’s length. The revenue from external parties reported to the strategic steering committee is measured in a manner consistent with that in the income statement. No inter-segment transactions occurred during 2009 and 2008.
IFRS8p27(b), 28 The strategic steering committee assesses the performance of the operating segments based on a smoothed measure of operating profit. This measurement basis includes smoothed longer term investment returns. Any variance between the actual and smoothed investment return is excluded for this profit measure but is included in the reconciliation to the IFRS profit before tax above.
The amounts provided to the strategic steering committee with respect to total assets and total liabilities are measured in a manner consistent with that of the financial statements. These assets are allocated based on the operations of the segment and the physical location of the asset.
IFRS8p33(a) The entity is domiciled in Euravia. The results of its revenue from external customers is as follows:
2009 2008Euravia 113,175 102,449UK 24,712 21,214US 37,869 53,845Total 175,756 177,508
Revenues are allocated based on the country in which the insurance contracts are issued.
Management considers its external customers to be the individual policyholders, as such Asfalia is not reliant on any individual customer.
Note: Information about major customers
IFRS 8.34 requires the provision of information about the extent of its reliance on its major customers. If revenues from transactions with a single external customer amount to 10% or more of an entity’s revenues, the entity should disclose that fact, along with the total amount of revenues from each such customer, and the identity of the segments reporting the revenues.
Neither the identity of the customer nor the amount of revenues for each operating segment is required.
The total of all assets are allocated as follows:
DV 2009 2008Euravia 978,231 880,470UK 112,045 91,279US 456,630 427,627Total 1,546,906 1,399,376
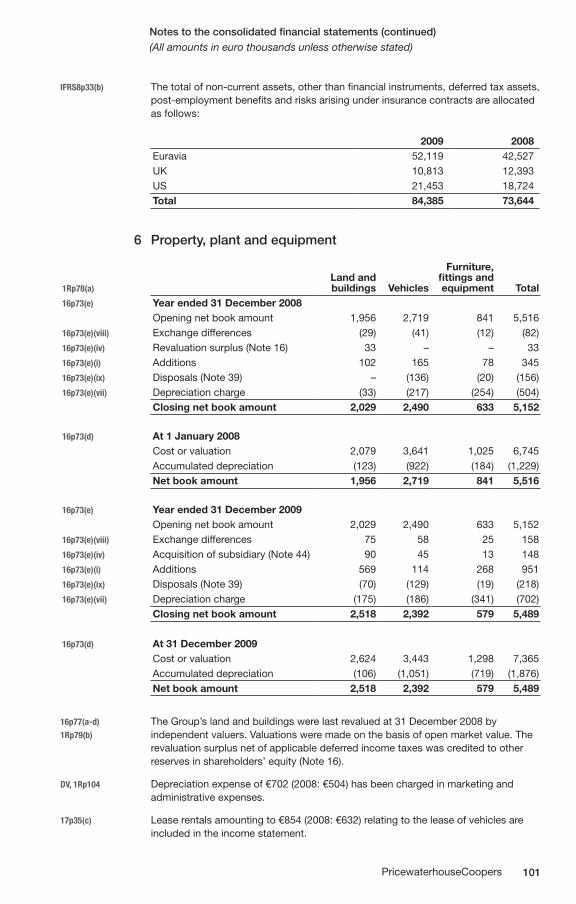
101PricewaterhouseCoopers
Notes to the consolidated financial statements (continued)(All amounts in euro thousands unless otherwise stated)
IFRS8p33(b) The total of non-current assets, other than financial instruments, deferred tax assets, post-employment benefits and risks arising under insurance contracts are allocated as follows:
2009 2008Euravia 52,119 42,527UK 10,813 12,393US 21,453 18,724Total 84,385 73,644
6 Property, plant and equipment
1Rp78(a)Land and buildings Vehicles
Furniture, fittings and equipment Total
16p73(e) Year ended 31 December 2008Opening net book amount 1,956 2,719 841 5,516
16p73(e)(viii) Exchange differences (29) (41) (12) (82)16p73(e)(iv) Revaluation surplus (Note 16) 33 – – 3316p73(e)(i) Additions 102 165 78 34516p73(e)(ix) Disposals (Note 39) – (136) (20) (156)16p73(e)(vii) Depreciation charge (33) (217) (254) (504)
Closing net book amount 2,029 2,490 633 5,152
16p73(d) At 1 January 2008Cost or valuation 2,079 3,641 1,025 6,745Accumulated depreciation (123) (922) (184) (1,229)Net book amount 1,956 2,719 841 5,516
16p73(e) Year ended 31 December 2009Opening net book amount 2,029 2,490 633 5,152
16p73(e)(viii) Exchange differences 75 58 25 15816p73(e)(iv) Acquisition of subsidiary (Note 44) 90 45 13 14816p73(e)(i) Additions 569 114 268 95116p73(e)(ix) Disposals (Note 39) (70) (129) (19) (218)16p73(e)(vii) Depreciation charge (175) (186) (341) (702)
Closing net book amount 2,518 2,392 579 5,489
16p73(d) At 31 December 2009Cost or valuation 2,624 3,443 1,298 7,365Accumulated depreciation (106) (1,051) (719) (1,876)Net book amount 2,518 2,392 579 5,489
16p77(a-d) The Group’s land and buildings were last revalued at 31 December 2008 by1Rp79(b) independent valuers. Valuations were made on the basis of open market value. The
revaluation surplus net of applicable deferred income taxes was credited to other reserves in shareholders’ equity (Note 16).
DV, 1Rp104 Depreciation expense of €702 (2008: €504) has been charged in marketing and administrative expenses.
17p35(c) Lease rentals amounting to €854 (2008: €632) relating to the lease of vehicles are included in the income statement.
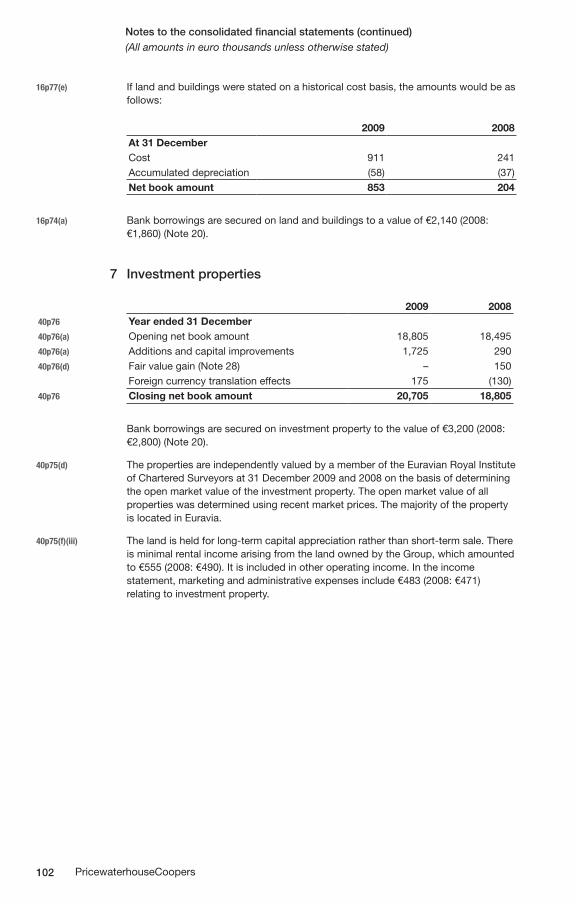
102 PricewaterhouseCoopers
Notes to the consolidated financial statements (continued)(All amounts in euro thousands unless otherwise stated)
16p77(e) If land and buildings were stated on a historical cost basis, the amounts would be as follows:
2009 2008At 31 DecemberCost 911 241Accumulated depreciation (58) (37)Net book amount 853 204
16p74(a) Bank borrowings are secured on land and buildings to a value of €2,140 (2008: €1,860) (Note 20).
7 Investment properties
2009 200840p76 Year ended 31 December40p76(a) Opening net book amount 18,805 18,49540p76(a) Additions and capital improvements 1,725 29040p76(d) Fair value gain (Note 28) – 150
Foreign currency translation effects 175 (130)40p76 Closing net book amount 20,705 18,805
Bank borrowings are secured on investment property to the value of €3,200 (2008: €2,800) (Note 20).
40p75(d) The properties are independently valued by a member of the Euravian Royal Institute of Chartered Surveyors at 31 December 2009 and 2008 on the basis of determining the open market value of the investment property. The open market value of all properties was determined using recent market prices. The majority of the property is located in Euravia.
40p75(f)(iii) The land is held for long-term capital appreciation rather than short-term sale. There is minimal rental income arising from the land owned by the Group, which amounted to €555 (2008: €490). It is included in other operating income. In the income statement, marketing and administrative expenses include €483 (2008: €471) relating to investment property.
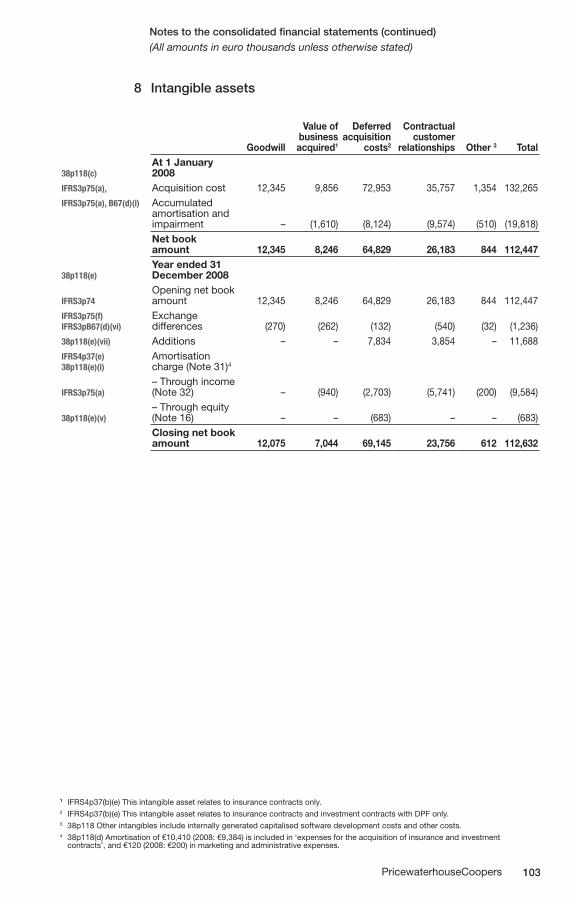
103PricewaterhouseCoopers
Notes to the consolidated financial statements (continued)(All amounts in euro thousands unless otherwise stated)
8 Intangible assets
Goodwill
Value of business acquired1
Deferred acquisition
costs2
Contractual customer
relationships Other 3 Total
38p118(c)At 1 January 2008
IFRS3p75(a), Acquisition cost 12,345 9,856 72,953 35,757 1,354 132,265IFRS3p75(a), B67(d)(i)
Accumulated amortisation and impairment – (1,610) (8,124) (9,574) (510) (19,818)Net book amount 12,345 8,246 64,829 26,183 844 112,447
38p118(e)Year ended 31 December 2008
IFRS3p74Opening net book amount 12,345 8,246 64,829 26,183 844 112,447
IFRS3p75(f) IFRS3pB67(d)(vi)
Exchange differences (270) (262) (132) (540) (32) (1,236)
38p118(e)(vii) Additions – – 7,834 3,854 – 11,688IFRS4p37(e) 38p118(e)(i)
Amortisation charge (Note 31)4
IFRS3p75(a)– Through income (Note 32) – (940) (2,703) (5,741) (200) (9,584)
38p118(e)(v)– Through equity (Note 16) – – (683) – – (683)Closing net book amount 12,075 7,044 69,145 23,756 612 112,632
1 IFRS4p37(b)(e) This intangible asset relates to insurance contracts only.2 IFRS4p37(b)(e) This intangible asset relates to insurance contracts and investment contracts with DPF only.3 38p118 Other intangibles include internally generated capitalised software development costs and other costs.4 38p118(d) Amortisation of €10,410 (2008: €9,384) is included in ‘expenses for the acquisition of insurance and investment contracts’, and €120 (2008: €200) in marketing and administrative expenses.
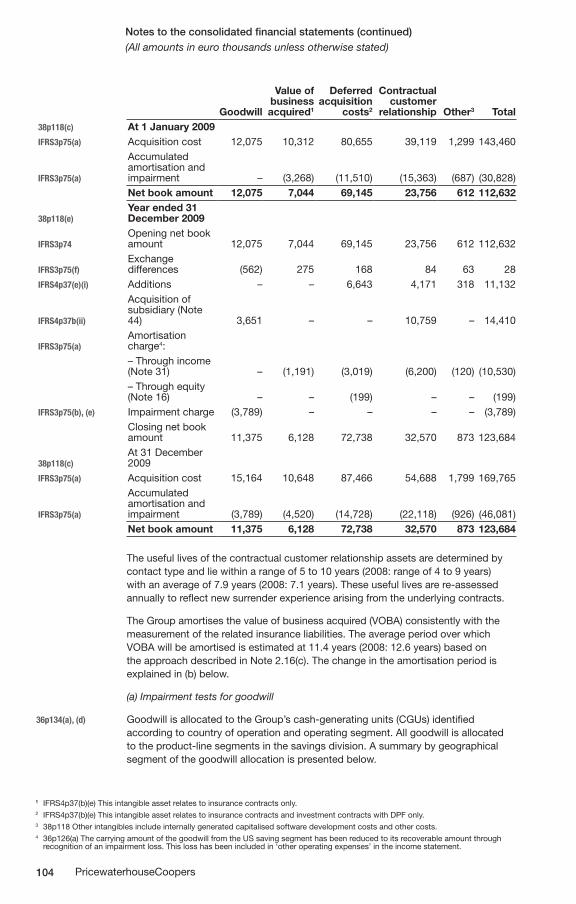
104 PricewaterhouseCoopers
Notes to the consolidated financial statements (continued)(All amounts in euro thousands unless otherwise stated)
Goodwill
Value of business acquired1
Deferred acquisition
costs2
Contractual customer
relationship Other3 Total38p118(c) At 1 January 2009IFRS3p75(a) Acquisition cost 12,075 10,312 80,655 39,119 1,299 143,460
IFRS3p75(a)
Accumulated amortisation and impairment – (3,268) (11,510) (15,363) (687) (30,828)Net book amount 12,075 7,044 69,145 23,756 612 112,632
38p118(e)Year ended 31 December 2009
IFRS3p74Opening net book amount 12,075 7,044 69,145 23,756 612 112,632
IFRS3p75(f)Exchange differences (562) 275 168 84 63 28
IFRS4p37(e)(i) Additions – – 6,643 4,171 318 11,132
IFRS4p37b(ii)
Acquisition of subsidiary (Note 44) 3,651 – – 10,759 – 14,410
IFRS3p75(a)Amortisation charge4:– Through income (Note 31) – (1,191) (3,019) (6,200) (120) (10,530)– Through equity (Note 16) – – (199) – – (199)
IFRS3p75(b), (e) Impairment charge (3,789) – – – – (3,789)Closing net book amount 11,375 6,128 72,738 32,570 873 123,684
38p118(c)At 31 December 2009
IFRS3p75(a) Acquisition cost 15,164 10,648 87,466 54,688 1,799 169,765
IFRS3p75(a)
Accumulated amortisation and impairment (3,789) (4,520) (14,728) (22,118) (926) (46,081)Net book amount 11,375 6,128 72,738 32,570 873 123,684
The useful lives of the contractual customer relationship assets are determined by contact type and lie within a range of 5 to 10 years (2008: range of 4 to 9 years) with an average of 7.9 years (2008: 7.1 years). These useful lives are re-assessed annually to reflect new surrender experience arising from the underlying contracts.
The Group amortises the value of business acquired (VOBA) consistently with the measurement of the related insurance liabilities. The average period over which VOBA will be amortised is estimated at 11.4 years (2008: 12.6 years) based on the approach described in Note 2.16(c). The change in the amortisation period is explained in (b) below.
(a) Impairment tests for goodwill
36p134(a), (d) Goodwill is allocated to the Group’s cash-generating units (CGUs) identified according to country of operation and operating segment. All goodwill is allocated
to the product-line segments in the savings division. A summary by geographical segment of the goodwill allocation is presented below.
1 IFRS4p37(b)(e) This intangible asset relates to insurance contracts only.2 IFRS4p37(b)(e) This intangible asset relates to insurance contracts and investment contracts with DPF only.3 38p118 Other intangibles include internally generated capitalised software development costs and other costs.4 36p126(a) The carrying amount of the goodwill from the US saving segment has been reduced to its recoverable amount through recognition of an impairment loss. This loss has been included in ‘other operating expenses’ in the income statement.
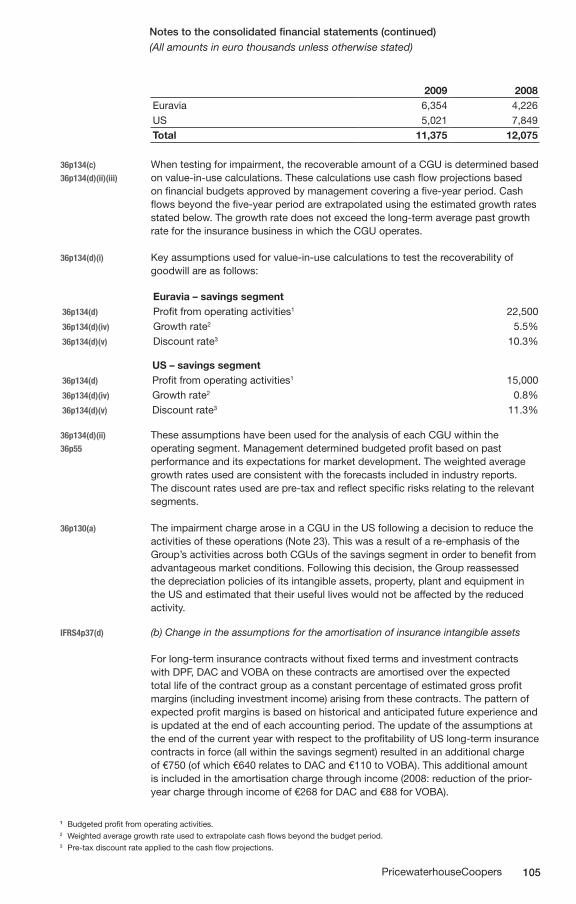
105PricewaterhouseCoopers
Notes to the consolidated financial statements (continued)(All amounts in euro thousands unless otherwise stated)
2009 2008Euravia 6,354 4,226US 5,021 7,849Total 11,375 12,075
36p134(c) When testing for impairment, the recoverable amount of a CGU is determined based36p134(d)(ii)(iii) on value-in-use calculations. These calculations use cash flow projections based on financial budgets approved by management covering a five-year period. Cash
flows beyond the five-year period are extrapolated using the estimated growth rates stated below. The growth rate does not exceed the long-term average past growth rate for the insurance business in which the CGU operates.
36p134(d)(i) Key assumptions used for value-in-use calculations to test the recoverability of goodwill are as follows:
Euravia – savings segment36p134(d) Profit from operating activities1 22,50036p134(d)(iv) Growth rate2 5.5%36p134(d)(v) Discount rate3 10.3%
US – savings segment36p134(d) Profit from operating activities1 15,00036p134(d)(iv) Growth rate2 0.8%36p134(d)(v) Discount rate3 11.3%
36p134(d)(ii) These assumptions have been used for the analysis of each CGU within the36p55 operating segment. Management determined budgeted profit based on past
performance and its expectations for market development. The weighted average growth rates used are consistent with the forecasts included in industry reports. The discount rates used are pre-tax and reflect specific risks relating to the relevant segments.
36p130(a) The impairment charge arose in a CGU in the US following a decision to reduce the activities of these operations (Note 23). This was a result of a re-emphasis of the Group’s activities across both CGUs of the savings segment in order to benefit from advantageous market conditions. Following this decision, the Group reassessed the depreciation policies of its intangible assets, property, plant and equipment in the US and estimated that their useful lives would not be affected by the reduced activity.
IFRS4p37(d) (b) Change in the assumptions for the amortisation of insurance intangible assets
For long-term insurance contracts without fixed terms and investment contracts with DPF, DAC and VOBA on these contracts are amortised over the expected total life of the contract group as a constant percentage of estimated gross profit margins (including investment income) arising from these contracts. The pattern of expected profit margins is based on historical and anticipated future experience and is updated at the end of each accounting period. The update of the assumptions at the end of the current year with respect to the profitability of US long-term insurance contracts in force (all within the savings segment) resulted in an additional charge of €750 (of which €640 relates to DAC and €110 to VOBA). This additional amount is included in the amortisation charge through income (2008: reduction of the prior- year charge through income of €268 for DAC and €88 for VOBA).
1 Budgeted profit from operating activities.2 Weighted average growth rate used to extrapolate cash flows beyond the budget period.3 Pre-tax discount rate applied to the cash flow projections.
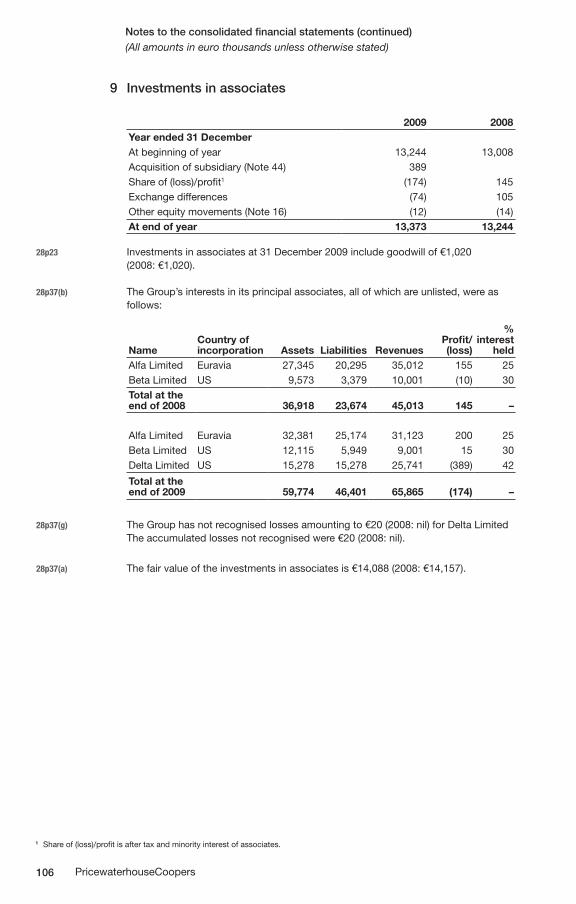
106 PricewaterhouseCoopers
Notes to the consolidated financial statements (continued)(All amounts in euro thousands unless otherwise stated)
9 Investments in associates
2009 2008Year ended 31 DecemberAt beginning of year 13,244 13,008Acquisition of subsidiary (Note 44) 389 Share of (loss)/profit1 (174) 145Exchange differences (74) 105Other equity movements (Note 16) (12) (14)At end of year 13,373 13,244
28p23 Investments in associates at 31 December 2009 include goodwill of €1,020 (2008: €1,020).
28p37(b) The Group’s interests in its principal associates, all of which are unlisted, were as follows:
NameCountry of incorporation Assets Liabilities Revenues
Profit/ (loss)
% interest
heldAlfa Limited Euravia 27,345 20,295 35,012 155 25Beta Limited US 9,573 3,379 10,001 (10) 30Total at the end of 2008 36,918 23,674 45,013 145 –
Alfa Limited Euravia 32,381 25,174 31,123 200 25Beta Limited US 12,115 5,949 9,001 15 30Delta Limited US 15,278 15,278 25,741 (389) 42
Total at the end of 2009 59,774 46,401 65,865 (174) –
28p37(g) The Group has not recognised losses amounting to €20 (2008: nil) for Delta Limited The accumulated losses not recognised were €20 (2008: nil).
28p37(a) The fair value of the investments in associates is €14,088 (2008: €14,157).
1 Share of (loss)/profit is after tax and minority interest of associates.
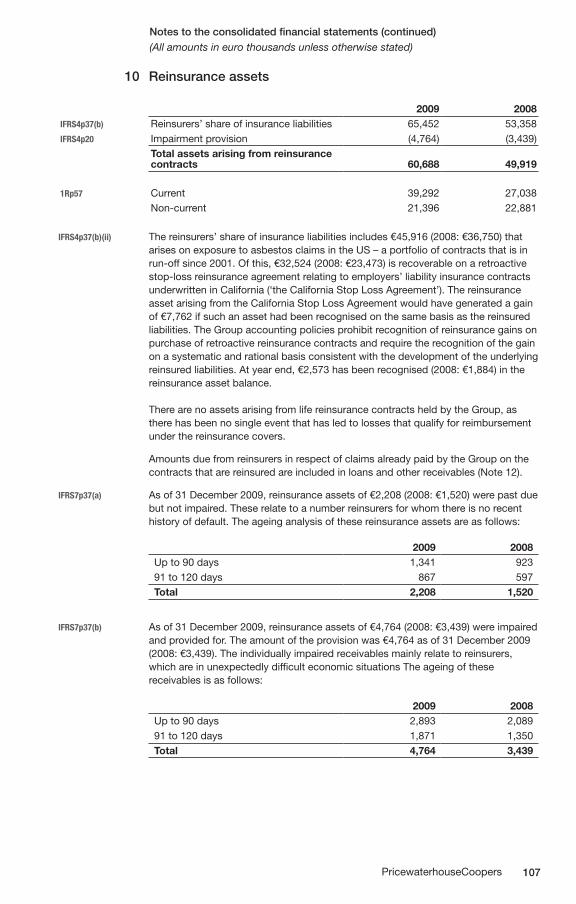
107PricewaterhouseCoopers
Notes to the consolidated financial statements (continued)(All amounts in euro thousands unless otherwise stated)
10 Reinsurance assets
2009 2008IFRS4p37(b) Reinsurers’ share of insurance liabilities 65,452 53,358IFRS4p20 Impairment provision (4,764) (3,439)
Total assets arising from reinsurance contracts 60,688 49,919
1Rp57 Current 39,292 27,038Non-current 21,396 22,881
IFRS4p37(b)(ii) The reinsurers’ share of insurance liabilities includes €45,916 (2008: €36,750) that arises on exposure to asbestos claims in the US – a portfolio of contracts that is in run-off since 2001. Of this, €32,524 (2008: €23,473) is recoverable on a retroactive stop-loss reinsurance agreement relating to employers’ liability insurance contracts underwritten in California (‘the California Stop Loss Agreement’). The reinsurance asset arising from the California Stop Loss Agreement would have generated a gain of €7,762 if such an asset had been recognised on the same basis as the reinsured liabilities. The Group accounting policies prohibit recognition of reinsurance gains on purchase of retroactive reinsurance contracts and require the recognition of the gain on a systematic and rational basis consistent with the development of the underlying reinsured liabilities. At year end, €2,573 has been recognised (2008: €1,884) in the reinsurance asset balance.
There are no assets arising from life reinsurance contracts held by the Group, as there has been no single event that has led to losses that qualify for reimbursement under the reinsurance covers.
Amounts due from reinsurers in respect of claims already paid by the Group on the contracts that are reinsured are included in loans and other receivables (Note 12).
IFRS7p37(a) As of 31 December 2009, reinsurance assets of €2,208 (2008: €1,520) were past due but not impaired. These relate to a number reinsurers for whom there is no recent history of default. The ageing analysis of these reinsurance assets are as follows:
2009 2008Up to 90 days 1,341 92391 to 120 days 867 597Total 2,208 1,520
IFRS7p37(b) As of 31 December 2009, reinsurance assets of €4,764 (2008: €3,439) were impaired and provided for. The amount of the provision was €4,764 as of 31 December 2009 (2008: €3,439). The individually impaired receivables mainly relate to reinsurers, which are in unexpectedly difficult economic situations The ageing of these receivables is as follows:
2009 2008Up to 90 days 2,893 2,08991 to 120 days 1,871 1,350Total 4,764 3,439
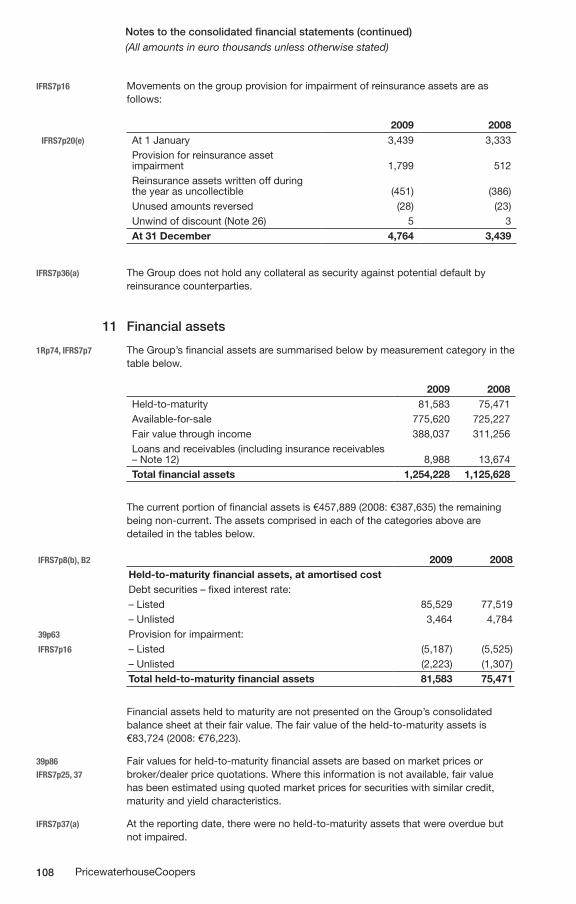
108 PricewaterhouseCoopers
Notes to the consolidated financial statements (continued)(All amounts in euro thousands unless otherwise stated)
IFRS7p16 Movements on the group provision for impairment of reinsurance assets are as follows:
2009 2008IFRS7p20(e) At 1 January 3,439 3,333
Provision for reinsurance asset impairment 1,799 512Reinsurance assets written off during the year as uncollectible (451) (386)Unused amounts reversed (28) (23)Unwind of discount (Note 26) 5 3At 31 December 4,764 3,439
IFRS7p36(a) The Group does not hold any collateral as security against potential default by reinsurance counterparties.
11 Financial assets
1Rp74, IFRS7p7 The Group’s financial assets are summarised below by measurement category in the table below.
2009 2008Held-to-maturity 81,583 75,471Available-for-sale 775,620 725,227Fair value through income 388,037 311,256Loans and receivables (including insurance receivables – Note 12) 8,988 13,674Total financial assets 1,254,228 1,125,628
The current portion of financial assets is €457,889 (2008: €387,635) the remaining being non-current. The assets comprised in each of the categories above are detailed in the tables below.
IFRS7p8(b), B2 2009 2008Held-to-maturity financial assets, at amortised costDebt securities – fixed interest rate:– Listed 85,529 77,519– Unlisted 3,464 4,784
39p63 Provision for impairment:IFRS7p16 – Listed (5,187) (5,525)
– Unlisted (2,223) (1,307)Total held-to-maturity financial assets 81,583 75,471
Financial assets held to maturity are not presented on the Group’s consolidated balance sheet at their fair value. The fair value of the held-to-maturity assets is €83,724 (2008: €76,223).
39p86 Fair values for held-to-maturity financial assets are based on market prices orIFRS7p25, 37 broker/dealer price quotations. Where this information is not available, fair value has been estimated using quoted market prices for securities with similar credit, maturity and yield characteristics.
IFRS7p37(a) At the reporting date, there were no held-to-maturity assets that were overdue but not impaired.
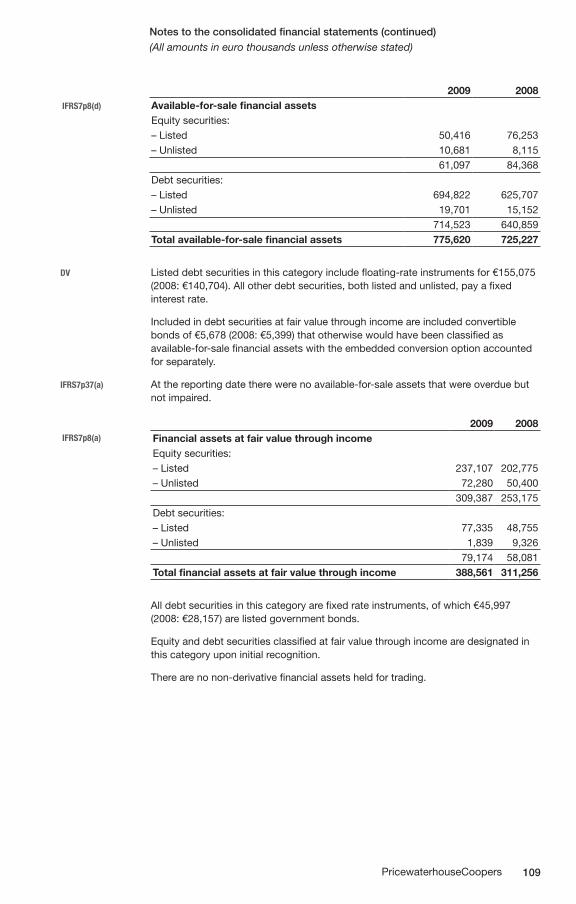
109PricewaterhouseCoopers
Notes to the consolidated financial statements (continued)(All amounts in euro thousands unless otherwise stated)
2009 2008IFRS7p8(d) Available-for-sale financial assets
Equity securities:– Listed 50,416 76,253– Unlisted 10,681 8,115
61,097 84,368Debt securities:– Listed 694,822 625,707– Unlisted 19,701 15,152
714,523 640,859Total available-for-sale financial assets 775,620 725,227
DV Listed debt securities in this category include floating-rate instruments for €155,075 (2008: €140,704). All other debt securities, both listed and unlisted, pay a fixed interest rate.
Included in debt securities at fair value through income are included convertible bonds of €5,678 (2008: €5,399) that otherwise would have been classified as available-for-sale financial assets with the embedded conversion option accounted for separately.
IFRS7p37(a) At the reporting date there were no available-for-sale assets that were overdue but not impaired.
2009 2008IFRS7p8(a) Financial assets at fair value through income
Equity securities:– Listed 237,107 202,775– Unlisted 72,280 50,400
309,387 253,175Debt securities:– Listed 77,335 48,755– Unlisted 1,839 9,326
79,174 58,081Total financial assets at fair value through income 388,561 311,256
All debt securities in this category are fixed rate instruments, of which €45,997 (2008: €28,157) are listed government bonds.
Equity and debt securities classified at fair value through income are designated in this category upon initial recognition.
There are no non-derivative financial assets held for trading.
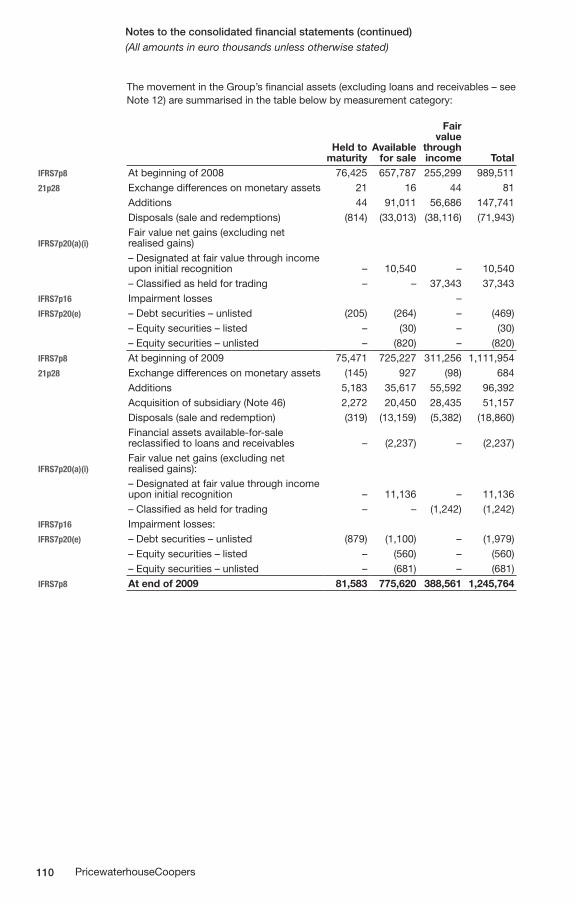
110 PricewaterhouseCoopers
Notes to the consolidated financial statements (continued)(All amounts in euro thousands unless otherwise stated)
The movement in the Group’s financial assets (excluding loans and receivables – see Note 12) are summarised in the table below by measurement category:
Held to maturity
Available for sale
Fair value
through income Total
IFRS7p8 At beginning of 2008 76,425 657,787 255,299 989,51121p28 Exchange differences on monetary assets 21 16 44 81
Additions 44 91,011 56,686 147,741Disposals (sale and redemptions) (814) (33,013) (38,116) (71,943)
IFRS7p20(a)(i)Fair value net gains (excluding net realised gains)– Designated at fair value through income upon initial recognition – 10,540 – 10,540– Classified as held for trading – – 37,343 37,343
IFRS7p16 Impairment losses –IFRS7p20(e) – Debt securities – unlisted (205) (264) – (469)
– Equity securities – listed – (30) – (30)– Equity securities – unlisted – (820) – (820)
IFRS7p8 At beginning of 2009 75,471 725,227 311,256 1,111,95421p28 Exchange differences on monetary assets (145) 927 (98) 684
Additions 5,183 35,617 55,592 96,392Acquisition of subsidiary (Note 46) 2,272 20,450 28,435 51,157Disposals (sale and redemption) (319) (13,159) (5,382) (18,860)Financial assets available-for-sale reclassified to loans and receivables – (2,237) – (2,237)
IFRS7p20(a)(i)Fair value net gains (excluding net realised gains):– Designated at fair value through income upon initial recognition – 11,136 – 11,136– Classified as held for trading – – (1,242) (1,242)
IFRS7p16 Impairment losses:IFRS7p20(e) – Debt securities – unlisted (879) (1,100) – (1,979)
– Equity securities – listed – (560) – (560)– Equity securities – unlisted – (681) – (681)
IFRS7p8 At end of 2009 81,583 775,620 388,561 1,245,764
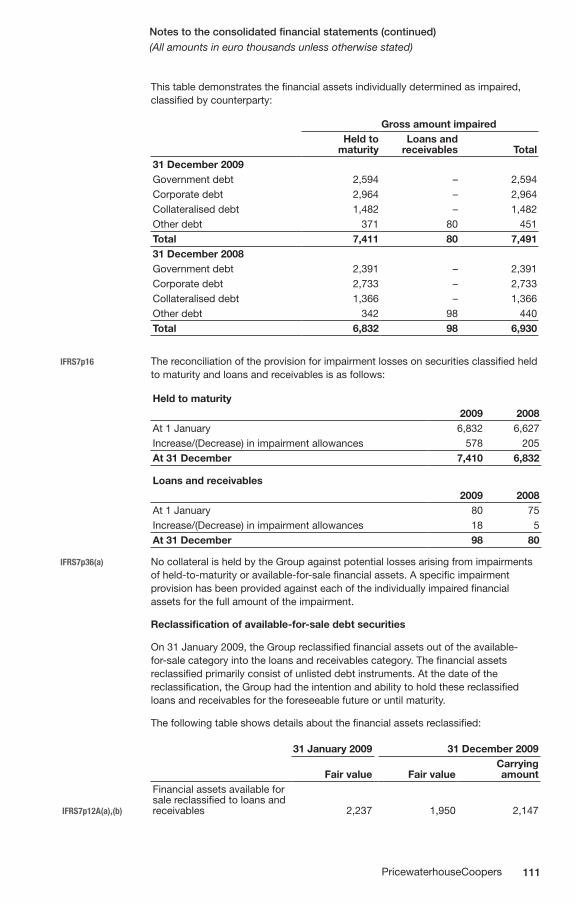
111PricewaterhouseCoopers
Notes to the consolidated financial statements (continued)(All amounts in euro thousands unless otherwise stated)
This table demonstrates the financial assets individually determined as impaired, classified by counterparty:
Gross amount impairedHeld to
maturityLoans and
receivables Total31 December 2009Government debt 2,594 – 2,594Corporate debt 2,964 – 2,964Collateralised debt 1,482 – 1,482Other debt 371 80 451Total 7,411 80 7,49131 December 2008Government debt 2,391 – 2,391Corporate debt 2,733 – 2,733Collateralised debt 1,366 – 1,366Other debt 342 98 440Total 6,832 98 6,930
IFRS7p16 The reconciliation of the provision for impairment losses on securities classified held to maturity and loans and receivables is as follows:
Held to maturity2009 2008
At 1 January 6,832 6,627Increase/(Decrease) in impairment allowances 578 205At 31 December 7,410 6,832
Loans and receivables2009 2008
At 1 January 80 75Increase/(Decrease) in impairment allowances 18 5At 31 December 98 80
IFRS7p36(a) No collateral is held by the Group against potential losses arising from impairments of held-to-maturity or available-for-sale financial assets. A specific impairment provision has been provided against each of the individually impaired financial assets for the full amount of the impairment.
Reclassification of available-for-sale debt securities
On 31 January 2009, the Group reclassified financial assets out of the available-for-sale category into the loans and receivables category. The financial assets reclassified primarily consist of unlisted debt instruments. At the date of the reclassification, the Group had the intention and ability to hold these reclassified loans and receivables for the foreseeable future or until maturity.
The following table shows details about the financial assets reclassified:
31 January 2009 31 December 2009
Fair value Fair valueCarrying amount
IFRS7p12A(a),(b)
Financial assets available for sale reclassified to loans and receivables 2,237 1,950 2,147
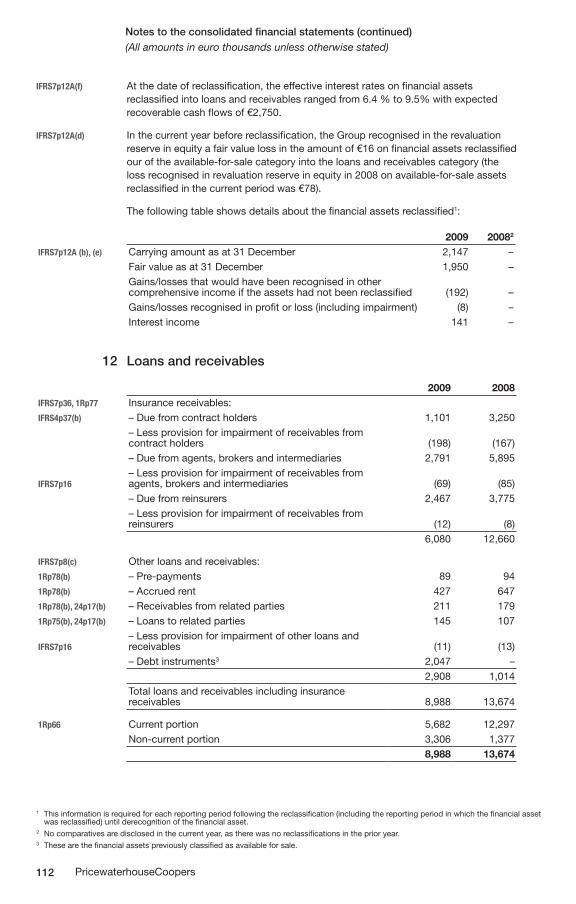
112 PricewaterhouseCoopers
Notes to the consolidated financial statements (continued)(All amounts in euro thousands unless otherwise stated)
IFRS7p12A(f) At the date of reclassification, the effective interest rates on financial assets reclassified into loans and receivables ranged from 6.4 % to 9.5% with expected recoverable cash flows of €2,750.
IFRS7p12A(d) In the current year before reclassification, the Group recognised in the revaluation reserve in equity a fair value loss in the amount of €16 on financial assets reclassified our of the available-for-sale category into the loans and receivables category (the loss recognised in revaluation reserve in equity in 2008 on available-for-sale assets reclassified in the current period was €78).
The following table shows details about the financial assets reclassified1:
2009 20082 IFRS7p12A (b), (e) Carrying amount as at 31 December 2,147 –
Fair value as at 31 December 1,950 –Gains/losses that would have been recognised in other comprehensive income if the assets had not been reclassified (192) –Gains/losses recognised in profit or loss (including impairment) (8) –Interest income 141 –
12 Loans and receivables
2009 2008IFRS7p36, 1Rp77 Insurance receivables:IFRS4p37(b) – Due from contract holders 1,101 3,250
– Less provision for impairment of receivables from contract holders (198) (167)– Due from agents, brokers and intermediaries 2,791 5,895
IFRS7p16– Less provision for impairment of receivables from agents, brokers and intermediaries (69) (85)– Due from reinsurers 2,467 3,775– Less provision for impairment of receivables from reinsurers (12) (8)
6,080 12,660
IFRS7p8(c) Other loans and receivables:1Rp78(b) – Pre-payments 89 941Rp78(b) – Accrued rent 427 6471Rp78(b), 24p17(b) – Receivables from related parties 211 1791Rp75(b), 24p17(b) – Loans to related parties 145 107
IFRS7p16– Less provision for impairment of other loans and receivables (11) (13)– Debt instruments3 2,047 –
2,908 1,014Total loans and receivables including insurance receivables 8,988 13,674
1Rp66 Current portion 5,682 12,297Non-current portion 3,306 1,377
8,988 13,674
1 This information is required for each reporting period following the reclassification (including the reporting period in which the financial asset was reclassified) until derecognition of the financial asset. 2 No comparatives are disclosed in the current year, as there was no reclassifications in the prior year.3 These are the financial assets previously classified as available for sale.
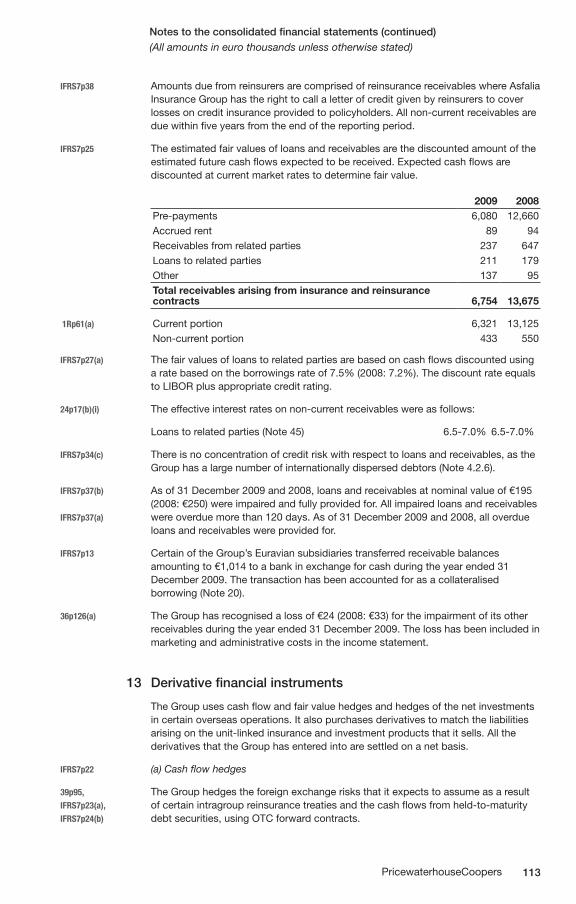
113PricewaterhouseCoopers
Notes to the consolidated financial statements (continued)(All amounts in euro thousands unless otherwise stated)
IFRS7p38 Amounts due from reinsurers are comprised of reinsurance receivables where Asfalia Insurance Group has the right to call a letter of credit given by reinsurers to cover losses on credit insurance provided to policyholders. All non-current receivables are due within five years from the end of the reporting period.
IFRS7p25 The estimated fair values of loans and receivables are the discounted amount of the estimated future cash flows expected to be received. Expected cash flows are discounted at current market rates to determine fair value.
2009 2008Pre-payments 6,080 12,660Accrued rent 89 94Receivables from related parties 237 647Loans to related parties 211 179Other 137 95Total receivables arising from insurance and reinsurance contracts 6,754 13,675
1Rp61(a) Current portion 6,321 13,125Non-current portion 433 550
IFRS7p27(a) The fair values of loans to related parties are based on cash flows discounted using a rate based on the borrowings rate of 7.5% (2008: 7.2%). The discount rate equals to LIBOR plus appropriate credit rating.
24p17(b)(i) The effective interest rates on non-current receivables were as follows:
Loans to related parties (Note 45) 6.5-7.0% 6.5-7.0%
IFRS7p34(c) There is no concentration of credit risk with respect to loans and receivables, as the Group has a large number of internationally dispersed debtors (Note 4.2.6).
IFRS7p37(b) As of 31 December 2009 and 2008, loans and receivables at nominal value of €195 (2008: €250) were impaired and fully provided for. All impaired loans and receivables
IFRS7p37(a) were overdue more than 120 days. As of 31 December 2009 and 2008, all overdue loans and receivables were provided for.
IFRS7p13 Certain of the Group’s Euravian subsidiaries transferred receivable balances amounting to €1,014 to a bank in exchange for cash during the year ended 31 December 2009. The transaction has been accounted for as a collateralised borrowing (Note 20).
36p126(a) The Group has recognised a loss of €24 (2008: €33) for the impairment of its other receivables during the year ended 31 December 2009. The loss has been included in marketing and administrative costs in the income statement.
13 Derivative financial instruments
The Group uses cash flow and fair value hedges and hedges of the net investments in certain overseas operations. It also purchases derivatives to match the liabilities arising on the unit-linked insurance and investment products that it sells. All the derivatives that the Group has entered into are settled on a net basis.
IFRS7p22 (a) Cash flow hedges
39p95, The Group hedges the foreign exchange risks that it expects to assume as a result IFRS7p23(a), of certain intragroup reinsurance treaties and the cash flows from held-to-maturity IFRS7p24(b) debt securities, using OTC forward contracts.
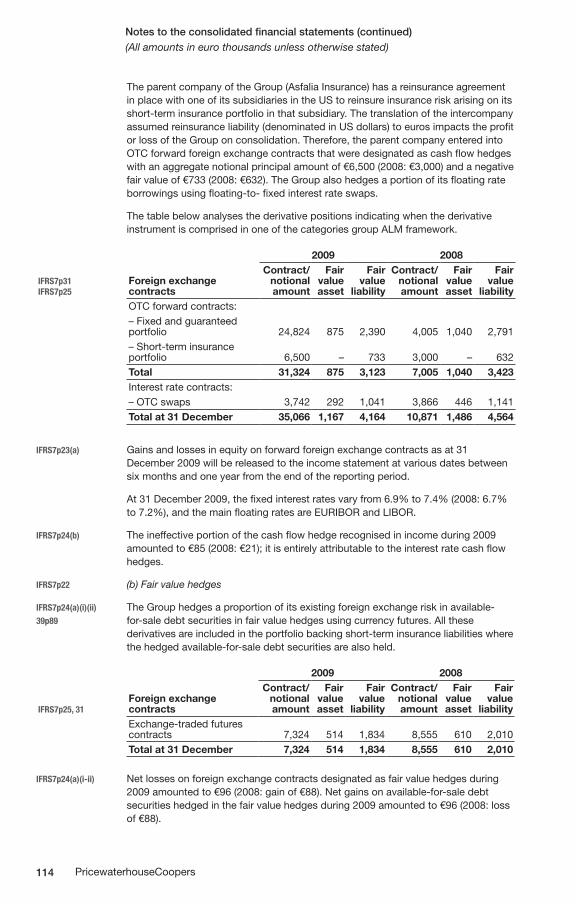
114 PricewaterhouseCoopers
Notes to the consolidated financial statements (continued)(All amounts in euro thousands unless otherwise stated)
The parent company of the Group (Asfalia Insurance) has a reinsurance agreement in place with one of its subsidiaries in the US to reinsure insurance risk arising on its short-term insurance portfolio in that subsidiary. The translation of the intercompany assumed reinsurance liability (denominated in US dollars) to euros impacts the profit or loss of the Group on consolidation. Therefore, the parent company entered into OTC forward foreign exchange contracts that were designated as cash flow hedges with an aggregate notional principal amount of €6,500 (2008: €3,000) and a negative fair value of €733 (2008: €632). The Group also hedges a portion of its floating rate borrowings using floating-to- fixed interest rate swaps.
The table below analyses the derivative positions indicating when the derivative instrument is comprised in one of the categories group ALM framework.
2009 2008
IFRS7p31 IFRS7p25
Foreign exchange contracts
Contract/ notional amount
Fair value asset
Fair value
liability
Contract/ notional amount
Fair value asset
Fair value
liabilityOTC forward contracts:– Fixed and guaranteed portfolio 24,824 875 2,390 4,005 1,040 2,791– Short-term insurance portfolio 6,500 – 733 3,000 – 632Total 31,324 875 3,123 7,005 1,040 3,423Interest rate contracts:– OTC swaps 3,742 292 1,041 3,866 446 1,141Total at 31 December 35,066 1,167 4,164 10,871 1,486 4,564
IFRS7p23(a) Gains and losses in equity on forward foreign exchange contracts as at 31 December 2009 will be released to the income statement at various dates between six months and one year from the end of the reporting period.
At 31 December 2009, the fixed interest rates vary from 6.9% to 7.4% (2008: 6.7% to 7.2%), and the main floating rates are EURIBOR and LIBOR.
IFRS7p24(b) The ineffective portion of the cash flow hedge recognised in income during 2009 amounted to €85 (2008: €21); it is entirely attributable to the interest rate cash flow hedges.
IFRS7p22 (b) Fair value hedges
IFRS7p24(a)(i)(ii) The Group hedges a proportion of its existing foreign exchange risk in available-39p89 for-sale debt securities in fair value hedges using currency futures. All these derivatives are included in the portfolio backing short-term insurance liabilities where the hedged available-for-sale debt securities are also held.
2009 2008
IFRS7p25, 31Foreign exchange contracts
Contract/ notional amount
Fair value asset
Fair value
liability
Contract/ notional amount
Fair value asset
Fair value
liabilityExchange-traded futures contracts 7,324 514 1,834 8,555 610 2,010Total at 31 December 7,324 514 1,834 8,555 610 2,010
IFRS7p24(a)(i-ii) Net losses on foreign exchange contracts designated as fair value hedges during 2009 amounted to €96 (2008: gain of €88). Net gains on available-for-sale debt securities hedged in the fair value hedges during 2009 amounted to €96 (2008: loss of €88).
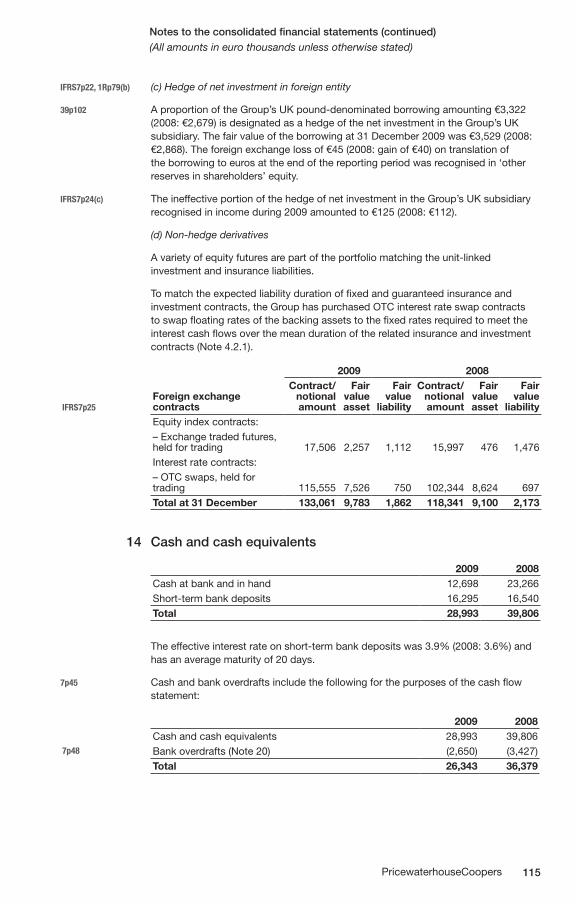
115PricewaterhouseCoopers
Notes to the consolidated financial statements (continued)(All amounts in euro thousands unless otherwise stated)
IFRS7p22, 1Rp79(b) (c) Hedge of net investment in foreign entity
39p102 A proportion of the Group’s UK pound-denominated borrowing amounting €3,322 (2008: €2,679) is designated as a hedge of the net investment in the Group’s UK subsidiary. The fair value of the borrowing at 31 December 2009 was €3,529 (2008: €2,868). The foreign exchange loss of €45 (2008: gain of €40) on translation of the borrowing to euros at the end of the reporting period was recognised in ‘other reserves in shareholders’ equity.
IFRS7p24(c) The ineffective portion of the hedge of net investment in the Group’s UK subsidiary recognised in income during 2009 amounted to €125 (2008: €112).
(d) Non-hedge derivatives
A variety of equity futures are part of the portfolio matching the unit-linked investment and insurance liabilities.
To match the expected liability duration of fixed and guaranteed insurance and investment contracts, the Group has purchased OTC interest rate swap contracts to swap floating rates of the backing assets to the fixed rates required to meet the interest cash flows over the mean duration of the related insurance and investment contracts (Note 4.2.1).
2009 2008
IFRS7p25Foreign exchange contracts
Contract/ notional amount
Fair value asset
Fair value
liability
Contract/ notional amount
Fair value asset
Fair value
liabilityEquity index contracts:– Exchange traded futures, held for trading 17,506 2,257 1,112 15,997 476 1,476Interest rate contracts:– OTC swaps, held for trading 115,555 7,526 750 102,344 8,624 697Total at 31 December 133,061 9,783 1,862 118,341 9,100 2,173
14 Cash and cash equivalents
2009 2008Cash at bank and in hand 12,698 23,266Short-term bank deposits 16,295 16,540Total 28,993 39,806
The effective interest rate on short-term bank deposits was 3.9% (2008: 3.6%) and has an average maturity of 20 days.
7p45 Cash and bank overdrafts include the following for the purposes of the cash flow statement:
2009 2008Cash and cash equivalents 28,993 39,806
7p48 Bank overdrafts (Note 20) (2,650) (3,427)Total 26,343 36,379
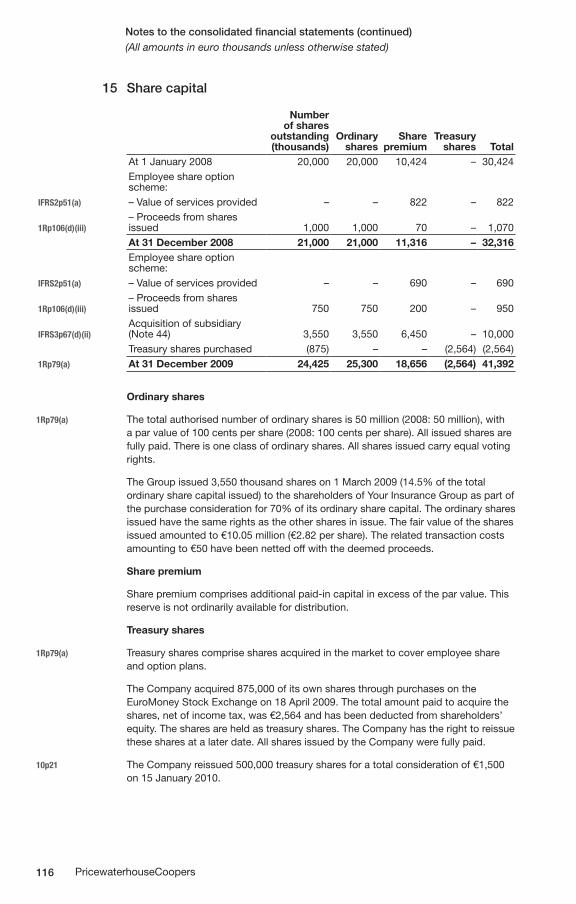
116 PricewaterhouseCoopers
Notes to the consolidated financial statements (continued)(All amounts in euro thousands unless otherwise stated)
15 Share capital
Number of shares
outstanding (thousands)
Ordinary shares
Share premium
Treasury shares Total
At 1 January 2008 20,000 20,000 10,424 – 30,424Employee share option scheme:
IFRS2p51(a) – Value of services provided – – 822 – 822
1Rp106(d)(iii)– Proceeds from shares issued 1,000 1,000 70 – 1,070At 31 December 2008 21,000 21,000 11,316 – 32,316Employee share option scheme:
IFRS2p51(a) – Value of services provided – – 690 – 690
1Rp106(d)(iii)– Proceeds from shares issued 750 750 200 – 950
IFRS3p67(d)(ii)Acquisition of subsidiary (Note 44) 3,550 3,550 6,450 – 10,000Treasury shares purchased (875) – – (2,564) (2,564)
1Rp79(a) At 31 December 2009 24,425 25,300 18,656 (2,564) 41,392
Ordinary shares
1Rp79(a) The total authorised number of ordinary shares is 50 million (2008: 50 million), with a par value of 100 cents per share (2008: 100 cents per share). All issued shares are fully paid. There is one class of ordinary shares. All shares issued carry equal voting rights.
The Group issued 3,550 thousand shares on 1 March 2009 (14.5% of the total ordinary share capital issued) to the shareholders of Your Insurance Group as part of the purchase consideration for 70% of its ordinary share capital. The ordinary shares issued have the same rights as the other shares in issue. The fair value of the shares issued amounted to €10.05 million (€2.82 per share). The related transaction costs amounting to €50 have been netted off with the deemed proceeds.
Share premium
Share premium comprises additional paid-in capital in excess of the par value. This reserve is not ordinarily available for distribution.
Treasury shares
1Rp79(a) Treasury shares comprise shares acquired in the market to cover employee share and option plans.
The Company acquired 875,000 of its own shares through purchases on the EuroMoney Stock Exchange on 18 April 2009. The total amount paid to acquire the shares, net of income tax, was €2,564 and has been deducted from shareholders’ equity. The shares are held as treasury shares. The Company has the right to reissue these shares at a later date. All shares issued by the Company were fully paid.
10p21 The Company reissued 500,000 treasury shares for a total consideration of €1,500 on 15 January 2010.
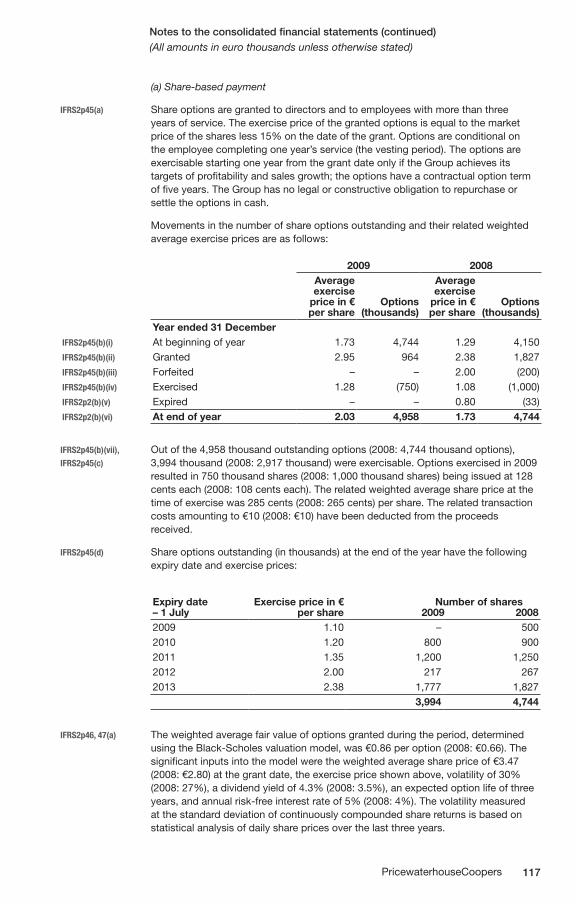
117PricewaterhouseCoopers
Notes to the consolidated financial statements (continued)(All amounts in euro thousands unless otherwise stated)
(a) Share-based payment
IFRS2p45(a) Share options are granted to directors and to employees with more than three years of service. The exercise price of the granted options is equal to the market price of the shares less 15% on the date of the grant. Options are conditional on the employee completing one year’s service (the vesting period). The options are exercisable starting one year from the grant date only if the Group achieves its targets of profitability and sales growth; the options have a contractual option term of five years. The Group has no legal or constructive obligation to repurchase or settle the options in cash.
Movements in the number of share options outstanding and their related weighted average exercise prices are as follows:
2009 2008Average exercise
price in € per share
Options (thousands)
Average exercise
price in € per share
Options (thousands)
Year ended 31 DecemberIFRS2p45(b)(i) At beginning of year 1.73 4,744 1.29 4,150IFRS2p45(b)(ii) Granted 2.95 964 2.38 1,827IFRS2p45(b)(iii) Forfeited – – 2.00 (200)IFRS2p45(b)(iv) Exercised 1.28 (750) 1.08 (1,000)IFRS2p2(b)(v) Expired – – 0.80 (33)IFRS2p2(b)(vi) At end of year 2.03 4,958 1.73 4,744
IFRS2p45(b)(vii), Out of the 4,958 thousand outstanding options (2008: 4,744 thousand options),IFRS2p45(c) 3,994 thousand (2008: 2,917 thousand) were exercisable. Options exercised in 2009
resulted in 750 thousand shares (2008: 1,000 thousand shares) being issued at 128 cents each (2008: 108 cents each). The related weighted average share price at the time of exercise was 285 cents (2008: 265 cents) per share. The related transaction costs amounting to €10 (2008: €10) have been deducted from the proceeds received.
IFRS2p45(d) Share options outstanding (in thousands) at the end of the year have the following expiry date and exercise prices:
Expiry date – 1 July
Exercise price in € per share
Number of shares
2009 20082009 1.10 – 5002010 1.20 800 9002011 1.35 1,200 1,2502012 2.00 217 2672013 2.38 1,777 1,827
3,994 4,744
IFRS2p46, 47(a) The weighted average fair value of options granted during the period, determined using the Black-Scholes valuation model, was €0.86 per option (2008: €0.66). The significant inputs into the model were the weighted average share price of €3.47 (2008: €2.80) at the grant date, the exercise price shown above, volatility of 30% (2008: 27%), a dividend yield of 4.3% (2008: 3.5%), an expected option life of three years, and annual risk-free interest rate of 5% (2008: 4%). The volatility measured at the standard deviation of continuously compounded share returns is based on statistical analysis of daily share prices over the last three years.
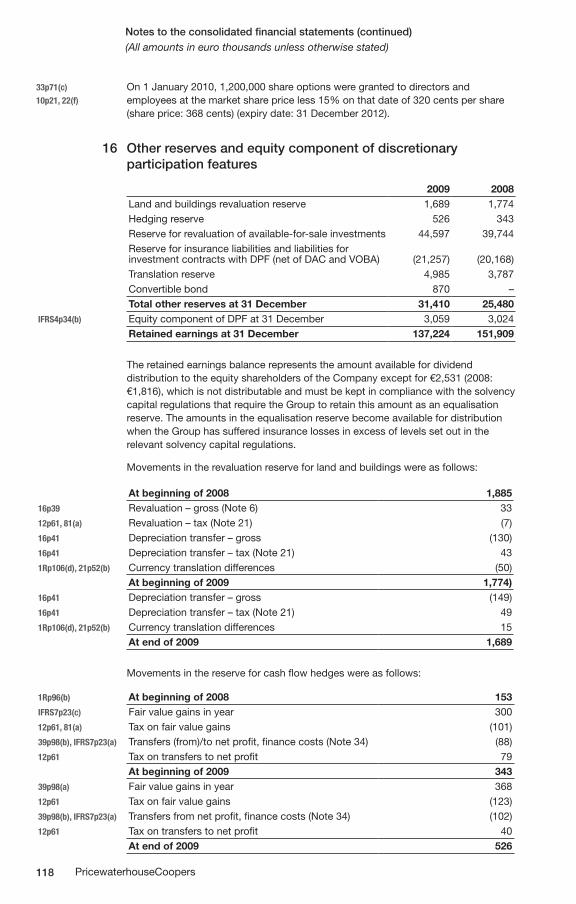
118 PricewaterhouseCoopers
Notes to the consolidated financial statements (continued)(All amounts in euro thousands unless otherwise stated)
33p71(c) On 1 January 2010, 1,200,000 share options were granted to directors and10p21, 22(f) employees at the market share price less 15% on that date of 320 cents per share
(share price: 368 cents) (expiry date: 31 December 2012).
16 Other reserves and equity component of discretionary participation features
2009 2008Land and buildings revaluation reserve 1,689 1,774Hedging reserve 526 343Reserve for revaluation of available-for-sale investments 44,597 39,744Reserve for insurance liabilities and liabilities for investment contracts with DPF (net of DAC and VOBA) (21,257) (20,168)Translation reserve 4,985 3,787Convertible bond 870 –Total other reserves at 31 December 31,410 25,480
IFRS4p34(b) Equity component of DPF at 31 December 3,059 3,024Retained earnings at 31 December 137,224 151,909
The retained earnings balance represents the amount available for dividend distribution to the equity shareholders of the Company except for €2,531 (2008: €1,816), which is not distributable and must be kept in compliance with the solvency capital regulations that require the Group to retain this amount as an equalisation reserve. The amounts in the equalisation reserve become available for distribution when the Group has suffered insurance losses in excess of levels set out in the relevant solvency capital regulations.
Movements in the revaluation reserve for land and buildings were as follows:
At beginning of 2008 1,88516p39 Revaluation – gross (Note 6) 3312p61, 81(a) Revaluation – tax (Note 21) (7)16p41 Depreciation transfer – gross (130)16p41 Depreciation transfer – tax (Note 21) 431Rp106(d), 21p52(b) Currency translation differences (50)
At beginning of 2009 1,774)16p41 Depreciation transfer – gross (149)16p41 Depreciation transfer – tax (Note 21) 491Rp106(d), 21p52(b) Currency translation differences 15
At end of 2009 1,689
Movements in the reserve for cash flow hedges were as follows:
1Rp96(b) At beginning of 2008 153IFRS7p23(c) Fair value gains in year 30012p61, 81(a) Tax on fair value gains (101)39p98(b), IFRS7p23(a) Transfers (from)/to net profit, finance costs (Note 34) (88)12p61 Tax on transfers to net profit 79
At beginning of 2009 34339p98(a) Fair value gains in year 36812p61 Tax on fair value gains (123)39p98(b), IFRS7p23(a) Transfers from net profit, finance costs (Note 34) (102)12p61 Tax on transfers to net profit 40
At end of 2009 526
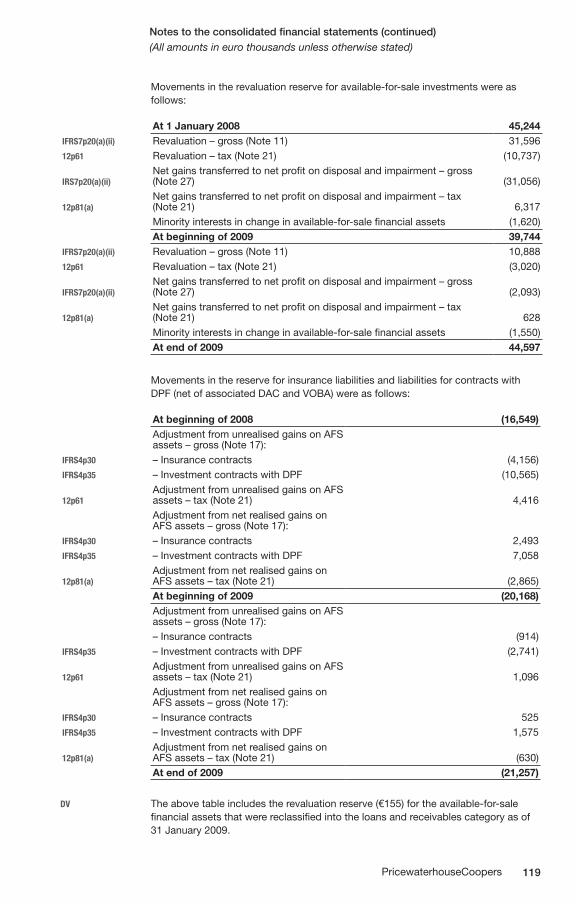
119PricewaterhouseCoopers
Notes to the consolidated financial statements (continued)(All amounts in euro thousands unless otherwise stated)
Movements in the revaluation reserve for available-for-sale investments were as follows:
At 1 January 2008 45,244IFRS7p20(a)(ii) Revaluation – gross (Note 11) 31,59612p61 Revaluation – tax (Note 21) (10,737)
IRS7p20(a)(ii)Net gains transferred to net profit on disposal and impairment – gross (Note 27) (31,056)
12p81(a)Net gains transferred to net profit on disposal and impairment – tax (Note 21) 6,317Minority interests in change in available-for-sale financial assets (1,620)At beginning of 2009 39,744
IFRS7p20(a)(ii) Revaluation – gross (Note 11) 10,88812p61 Revaluation – tax (Note 21) (3,020)
IFRS7p20(a)(ii)Net gains transferred to net profit on disposal and impairment – gross (Note 27) (2,093)
12p81(a)Net gains transferred to net profit on disposal and impairment – tax (Note 21) 628Minority interests in change in available-for-sale financial assets (1,550)At end of 2009 44,597
Movements in the reserve for insurance liabilities and liabilities for contracts with DPF (net of associated DAC and VOBA) were as follows:
At beginning of 2008 (16,549)Adjustment from unrealised gains on AFS assets – gross (Note 17):
IFRS4p30 – Insurance contracts (4,156)IFRS4p35 – Investment contracts with DPF (10,565)
12p61Adjustment from unrealised gains on AFS assets – tax (Note 21) 4,416Adjustment from net realised gains on AFS assets – gross (Note 17):
IFRS4p30 – Insurance contracts 2,493IFRS4p35 – Investment contracts with DPF 7,058
12p81(a)Adjustment from net realised gains on AFS assets – tax (Note 21) (2,865)At beginning of 2009 (20,168)Adjustment from unrealised gains on AFS assets – gross (Note 17):– Insurance contracts (914)
IFRS4p35 – Investment contracts with DPF (2,741)
12p61Adjustment from unrealised gains on AFS assets – tax (Note 21) 1,096Adjustment from net realised gains on AFS assets – gross (Note 17):
IFRS4p30 – Insurance contracts 525IFRS4p35 – Investment contracts with DPF 1,575
12p81(a)Adjustment from net realised gains on AFS assets – tax (Note 21) (630)At end of 2009 (21,257)
DV The above table includes the revaluation reserve (€155) for the available-for-sale financial assets that were reclassified into the loans and receivables category as of 31 January 2009.
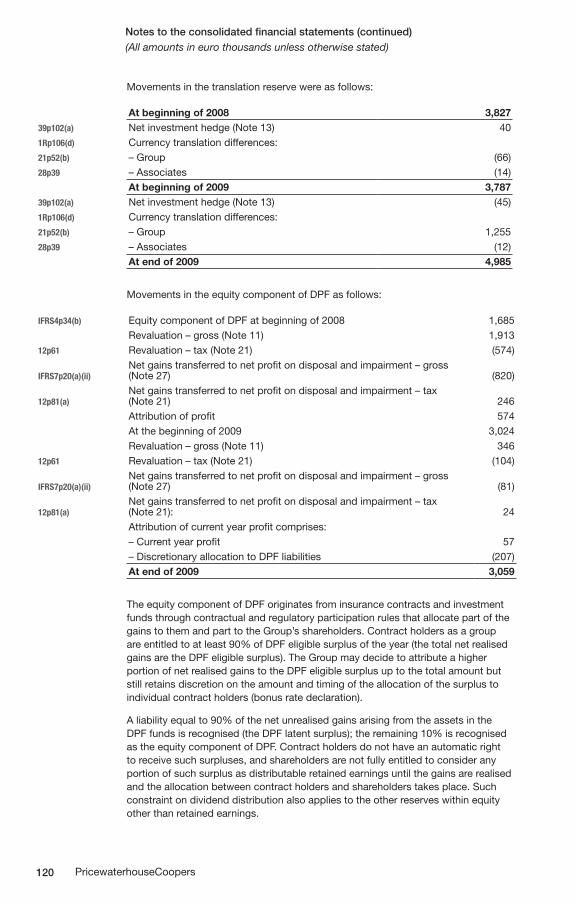
120 PricewaterhouseCoopers
Notes to the consolidated financial statements (continued)(All amounts in euro thousands unless otherwise stated)
Movements in the translation reserve were as follows:
At beginning of 2008 3,82739p102(a) Net investment hedge (Note 13) 401Rp106(d) Currency translation differences:21p52(b) – Group (66)28p39 – Associates (14)
At beginning of 2009 3,78739p102(a) Net investment hedge (Note 13) (45)1Rp106(d) Currency translation differences:21p52(b) – Group 1,25528p39 – Associates (12)
At end of 2009 4,985
Movements in the equity component of DPF as follows:
IFRS4p34(b) Equity component of DPF at beginning of 2008 1,685Revaluation – gross (Note 11) 1,913
12p61 Revaluation – tax (Note 21) (574)
IFRS7p20(a)(ii)Net gains transferred to net profit on disposal and impairment – gross (Note 27) (820)
12p81(a)Net gains transferred to net profit on disposal and impairment – tax (Note 21) 246Attribution of profit 574At the beginning of 2009 3,024Revaluation – gross (Note 11) 346
12p61 Revaluation – tax (Note 21) (104)
IFRS7p20(a)(ii)Net gains transferred to net profit on disposal and impairment – gross (Note 27) (81)
12p81(a)Net gains transferred to net profit on disposal and impairment – tax (Note 21): 24Attribution of current year profit comprises:– Current year profit 57– Discretionary allocation to DPF liabilities (207)At end of 2009 3,059
The equity component of DPF originates from insurance contracts and investment funds through contractual and regulatory participation rules that allocate part of the gains to them and part to the Group’s shareholders. Contract holders as a group are entitled to at least 90% of DPF eligible surplus of the year (the total net realised gains are the DPF eligible surplus). The Group may decide to attribute a higher portion of net realised gains to the DPF eligible surplus up to the total amount but still retains discretion on the amount and timing of the allocation of the surplus to individual contract holders (bonus rate declaration).
A liability equal to 90% of the net unrealised gains arising from the assets in the DPF funds is recognised (the DPF latent surplus); the remaining 10% is recognised as the equity component of DPF. Contract holders do not have an automatic right to receive such surpluses, and shareholders are not fully entitled to consider any portion of such surplus as distributable retained earnings until the gains are realised and the allocation between contract holders and shareholders takes place. Such constraint on dividend distribution also applies to the other reserves within equity other than retained earnings.
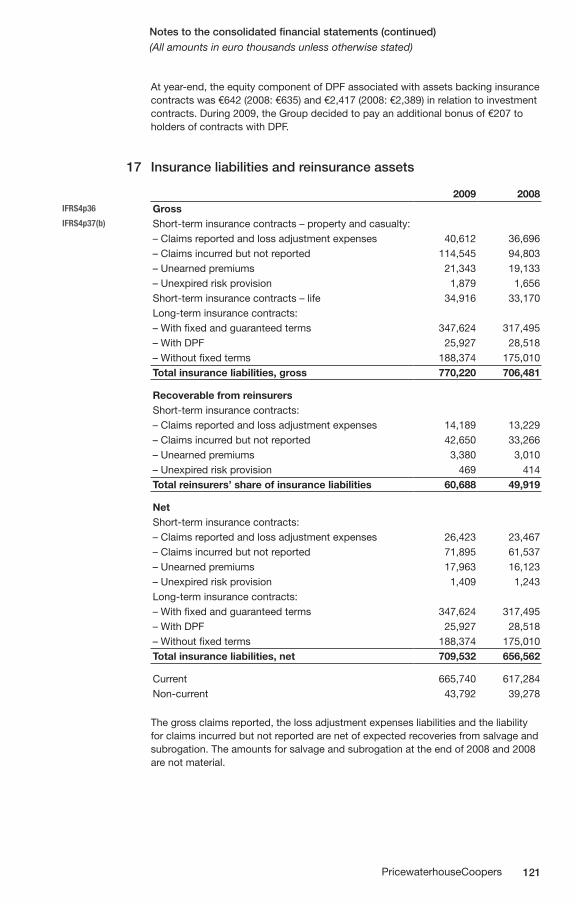
121PricewaterhouseCoopers
Notes to the consolidated financial statements (continued)(All amounts in euro thousands unless otherwise stated)
At year-end, the equity component of DPF associated with assets backing insurance contracts was €642 (2008: €635) and €2,417 (2008: €2,389) in relation to investment contracts. During 2009, the Group decided to pay an additional bonus of €207 to holders of contracts with DPF.
17 Insurance liabilities and reinsurance assets
2009 2008IFRS4p36 GrossIFRS4p37(b) Short-term insurance contracts – property and casualty:
– Claims reported and loss adjustment expenses 40,612 36,696– Claims incurred but not reported 114,545 94,803– Unearned premiums 21,343 19,133– Unexpired risk provision 1,879 1,656Short-term insurance contracts – life 34,916 33,170Long-term insurance contracts:– With fixed and guaranteed terms 347,624 317,495– With DPF 25,927 28,518– Without fixed terms 188,374 175,010Total insurance liabilities, gross 770,220 706,481
Recoverable from reinsurersShort-term insurance contracts:– Claims reported and loss adjustment expenses 14,189 13,229– Claims incurred but not reported 42,650 33,266– Unearned premiums 3,380 3,010– Unexpired risk provision 469 414Total reinsurers’ share of insurance liabilities 60,688 49,919
NetShort-term insurance contracts:– Claims reported and loss adjustment expenses 26,423 23,467– Claims incurred but not reported 71,895 61,537– Unearned premiums 17,963 16,123– Unexpired risk provision 1,409 1,243Long-term insurance contracts:– With fixed and guaranteed terms 347,624 317,495– With DPF 25,927 28,518– Without fixed terms 188,374 175,010Total insurance liabilities, net 709,532 656,562
Current 665,740 617,284Non-current 43,792 39,278
The gross claims reported, the loss adjustment expenses liabilities and the liability for claims incurred but not reported are net of expected recoveries from salvage and subrogation. The amounts for salvage and subrogation at the end of 2008 and 2008 are not material.
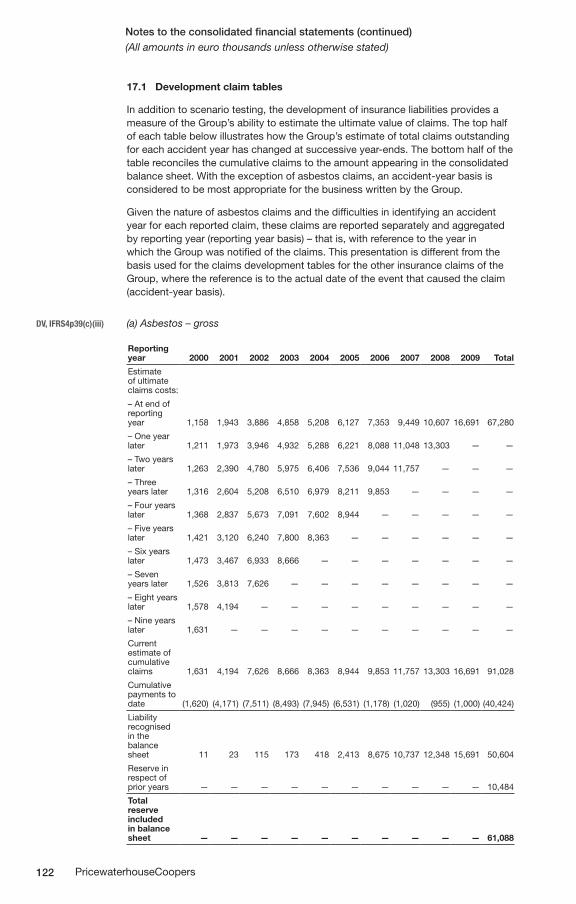
122 PricewaterhouseCoopers
Notes to the consolidated financial statements (continued)(All amounts in euro thousands unless otherwise stated)
17.1 Development claim tables
In addition to scenario testing, the development of insurance liabilities provides a measure of the Group’s ability to estimate the ultimate value of claims. The top half of each table below illustrates how the Group’s estimate of total claims outstanding for each accident year has changed at successive year-ends. The bottom half of the table reconciles the cumulative claims to the amount appearing in the consolidated balance sheet. With the exception of asbestos claims, an accident-year basis is considered to be most appropriate for the business written by the Group.
Given the nature of asbestos claims and the difficulties in identifying an accident year for each reported claim, these claims are reported separately and aggregated by reporting year (reporting year basis) – that is, with reference to the year in which the Group was notified of the claims. This presentation is different from the basis used for the claims development tables for the other insurance claims of the Group, where the reference is to the actual date of the event that caused the claim (accident-year basis).
DV, IFRS4p39(c)(iii) (a) Asbestos – gross
Reporting year 2000 2001 2002 2003 2004 2005 2006 2007 2008 2009 Total
Estimate of ultimate claims costs:
– At end of reporting year 1,158 1,943 3,886 4,858 5,208 6,127 7,353 9,449 10,607 16,691 67,280
– One year later 1,211 1,973 3,946 4,932 5,288 6,221 8,088 11,048 13,303 — —
– Two years later 1,263 2,390 4,780 5,975 6,406 7,536 9,044 11,757 — — —
– Three years later 1,316 2,604 5,208 6,510 6,979 8,211 9,853 — — — —
– Four years later 1,368 2,837 5,673 7,091 7,602 8,944 — — — — —
– Five years later 1,421 3,120 6,240 7,800 8,363 — — — — — —
– Six years later 1,473 3,467 6,933 8,666 — — — — — — —
– Seven years later 1,526 3,813 7,626 — — — — — — — —
– Eight years later 1,578 4,194 — — — — — — — — —
– Nine years later 1,631 — — — — — — — — — —
Current estimate of cumulative claims 1,631 4,194 7,626 8,666 8,363 8,944 9,853 11,757 13,303 16,691 91,028
Cumulative payments to date (1,620) (4,171) (7,511) (8,493) (7,945) (6,531) (1,178) (1,020) (955) (1,000) (40,424)
Liability recognised in the balance sheet 11 23 115 173 418 2,413 8,675 10,737 12,348 15,691 50,604
Reserve in respect of prior years — — — — — — — — — — 10,484
Total reserve included in balance sheet — — — — — — — — — — 61,088
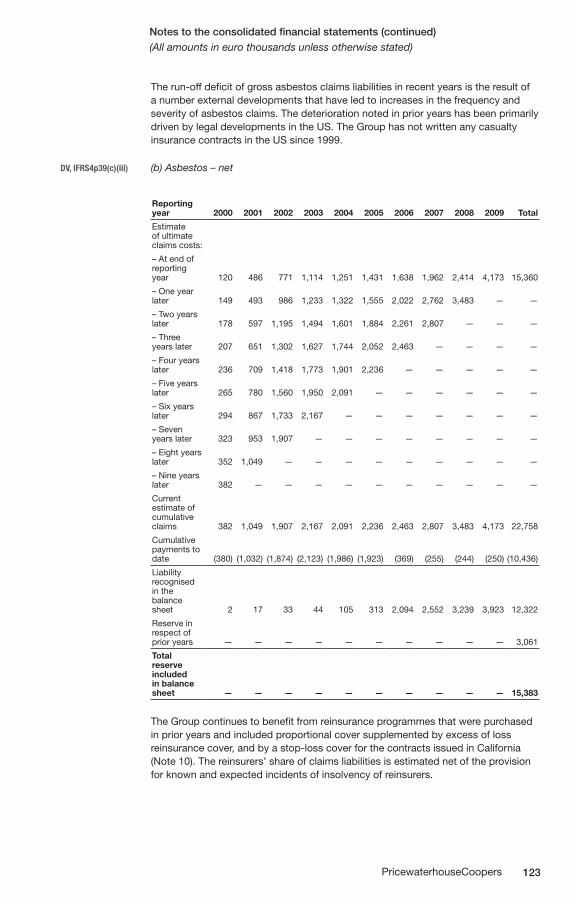
123PricewaterhouseCoopers
Notes to the consolidated financial statements (continued)(All amounts in euro thousands unless otherwise stated)
The run-off deficit of gross asbestos claims liabilities in recent years is the result of a number external developments that have led to increases in the frequency and severity of asbestos claims. The deterioration noted in prior years has been primarily driven by legal developments in the US. The Group has not written any casualty insurance contracts in the US since 1999.
DV, IFRS4p39(c)(iii) (b) Asbestos – net
Reporting year 2000 2001 2002 2003 2004 2005 2006 2007 2008 2009 Total
Estimate of ultimate claims costs:
– At end of reporting year 120 486 771 1,114 1,251 1,431 1,638 1,962 2,414 4,173 15,360
– One year later 149 493 986 1,233 1,322 1,555 2,022 2,762 3,483 — —
– Two years later 178 597 1,195 1,494 1,601 1,884 2,261 2,807 — — —
– Three years later 207 651 1,302 1,627 1,744 2,052 2,463 — — — —
– Four years later 236 709 1,418 1,773 1,901 2,236 — — — — —
– Five years later 265 780 1,560 1,950 2,091 — — — — — —
– Six years later 294 867 1,733 2,167 — — — — — — —
– Seven years later 323 953 1,907 — — — — — — — —
– Eight years later 352 1,049 — — — — — — — — —
– Nine years later 382 — — — — — — — — — —
Current estimate of cumulative claims 382 1,049 1,907 2,167 2,091 2,236 2,463 2,807 3,483 4,173 22,758
Cumulative payments to date (380) (1,032) (1,874) (2,123) (1,986) (1,923) (369) (255) (244) (250) (10,436)
Liability recognised in the balance sheet 2 17 33 44 105 313 2,094 2,552 3,239 3,923 12,322
Reserve in respect of prior years — — — — — — — — — — 3,061
Total reserve included in balance sheet — — — — — — — — — — 15,383
The Group continues to benefit from reinsurance programmes that were purchased in prior years and included proportional cover supplemented by excess of loss reinsurance cover, and by a stop-loss cover for the contracts issued in California (Note 10). The reinsurers’ share of claims liabilities is estimated net of the provision for known and expected incidents of insolvency of reinsurers.
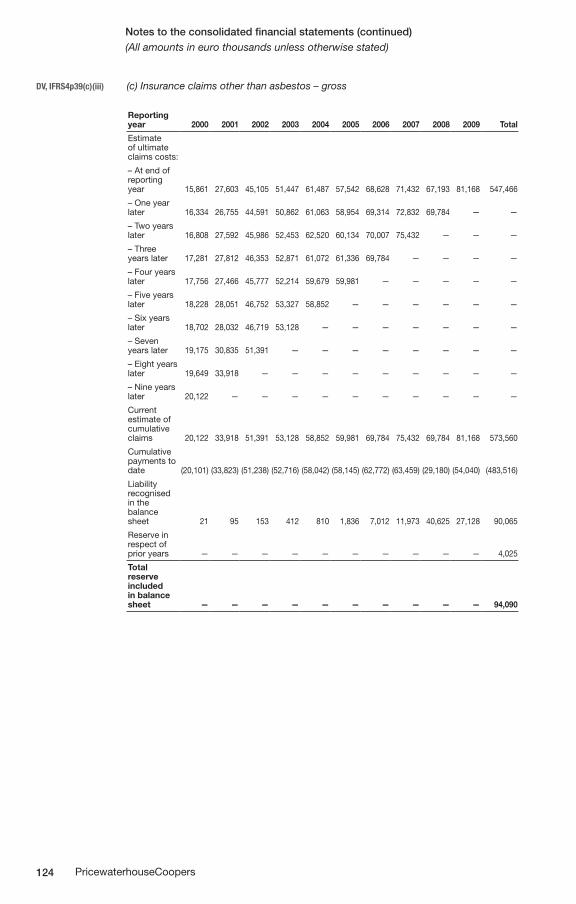
124 PricewaterhouseCoopers
Notes to the consolidated financial statements (continued)(All amounts in euro thousands unless otherwise stated)
DV, IFRS4p39(c)(iii) (c) Insurance claims other than asbestos – gross
Reporting year 2000 2001 2002 2003 2004 2005 2006 2007 2008 2009 Total
Estimate of ultimate claims costs:
– At end of reporting year 15,861 27,603 45,105 51,447 61,487 57,542 68,628 71,432 67,193 81,168 547,466
– One year later 16,334 26,755 44,591 50,862 61,063 58,954 69,314 72,832 69,784 — —
– Two years later 16,808 27,592 45,986 52,453 62,520 60,134 70,007 75,432 — — —
– Three years later 17,281 27,812 46,353 52,871 61,072 61,336 69,784 — — — —
– Four years later 17,756 27,466 45,777 52,214 59,679 59,981 — — — — —
– Five years later 18,228 28,051 46,752 53,327 58,852 — — — — — —
– Six years later 18,702 28,032 46,719 53,128 — — — — — — —
– Seven years later 19,175 30,835 51,391 — — — — — — — —
– Eight years later 19,649 33,918 — — — — — — — — —
– Nine years later 20,122 — — — — — — — — — —
Current estimate of cumulative claims 20,122 33,918 51,391 53,128 58,852 59,981 69,784 75,432 69,784 81,168 573,560
Cumulative payments to date (20,101)
(33,823)
(51,238)
(52,716)
(58,042)
(58,145)
(62,772)
(63,459)
(29,180)
(54,040) (483,516)
Liability recognised in the balance sheet 21 95 153 412 810 1,836 7,012 11,973 40,625 27,128 90,065
Reserve in respect of prior years — — — — — — — — — — 4,025
Total reserve included in balance sheet — — — — — — — — — — 94,090
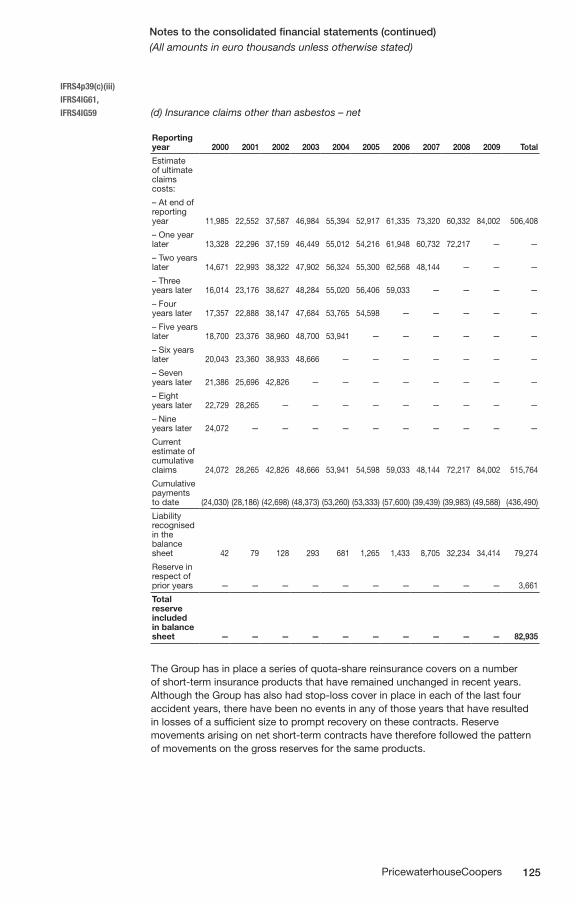
125PricewaterhouseCoopers
Notes to the consolidated financial statements (continued)(All amounts in euro thousands unless otherwise stated)
IFRS4p39(c)(iii)
IFRS4IG61,
IFRS4IG59 (d) Insurance claims other than asbestos – net
Reporting year 2000 2001 2002 2003 2004 2005 2006 2007 2008 2009 Total
Estimate of ultimate claims costs:
– At end of reporting year 11,985 22,552 37,587 46,984 55,394 52,917 61,335 73,320 60,332 84,002 506,408
– One year later 13,328 22,296 37,159 46,449 55,012 54,216 61,948 60,732 72,217 — —
– Two years later 14,671 22,993 38,322 47,902 56,324 55,300 62,568 48,144 — — —
– Three years later 16,014 23,176 38,627 48,284 55,020 56,406 59,033 — — — —
– Four years later 17,357 22,888 38,147 47,684 53,765 54,598 — — — — —
– Five years later 18,700 23,376 38,960 48,700 53,941 — — — — — —
– Six years later 20,043 23,360 38,933 48,666 — — — — — — —
– Seven years later 21,386 25,696 42,826 — — — — — — — —
– Eight years later 22,729 28,265 — — — — — — — — —
– Nine years later 24,072 — — — — — — — — — —
Current estimate of cumulative claims 24,072 28,265 42,826 48,666 53,941 54,598 59,033 48,144 72,217 84,002 515,764
Cumulative payments to date (24,030) (28,186) (42,698) (48,373) (53,260)
(53,333)
(57,600)
(39,439)
(39,983)
(49,588)
(436,490)
Liability recognised in the balance sheet 42 79 128 293 681 1,265 1,433 8,705 32,234 34,414 79,274
Reserve in respect of prior years — — — — — — — — — — 3,661
Total reserve included in balance sheet — — — — — — — — — — 82,935
The Group has in place a series of quota-share reinsurance covers on a number of short-term insurance products that have remained unchanged in recent years. Although the Group has also had stop-loss cover in place in each of the last four accident years, there have been no events in any of those years that have resulted in losses of a sufficient size to prompt recovery on these contracts. Reserve movements arising on net short-term contracts have therefore followed the pattern of movements on the gross reserves for the same products.
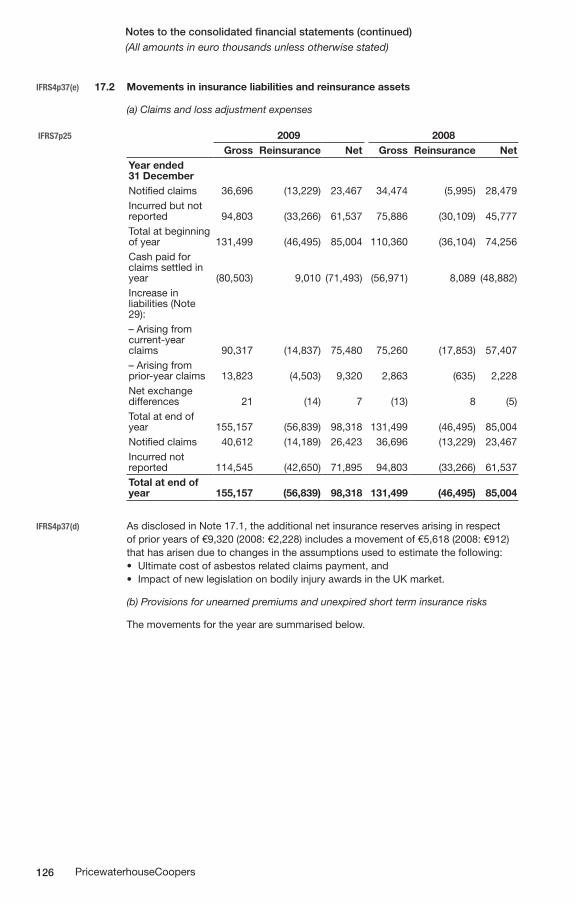
126 PricewaterhouseCoopers
Notes to the consolidated financial statements (continued)(All amounts in euro thousands unless otherwise stated)
IFRS4p37(e) 17.2 Movements in insurance liabilities and reinsurance assets
(a) Claims and loss adjustment expenses
IFRS7p25 2009 2008Gross Reinsurance Net Gross Reinsurance Net
Year ended 31 DecemberNotified claims 36,696 (13,229) 23,467 34,474 (5,995) 28,479Incurred but not reported 94,803 (33,266) 61,537 75,886 (30,109) 45,777Total at beginning of year 131,499 (46,495) 85,004 110,360 (36,104) 74,256Cash paid for claims settled in year (80,503) 9,010 (71,493) (56,971) 8,089 (48,882)Increase in liabilities (Note 29):– Arising from current-year claims 90,317 (14,837) 75,480 75,260 (17,853) 57,407– Arising from prior-year claims 13,823 (4,503) 9,320 2,863 (635) 2,228Net exchange differences 21 (14) 7 (13) 8 (5)Total at end of year 155,157 (56,839) 98,318 131,499 (46,495) 85,004Notified claims 40,612 (14,189) 26,423 36,696 (13,229) 23,467Incurred not reported 114,545 (42,650) 71,895 94,803 (33,266) 61,537Total at end of year 155,157 (56,839) 98,318 131,499 (46,495) 85,004
IFRS4p37(d) As disclosed in Note 17.1, the additional net insurance reserves arising in respect of prior years of €9,320 (2008: €2,228) includes a movement of €5,618 (2008: €912) that has arisen due to changes in the assumptions used to estimate the following:
Ultimate cost of asbestos related claims payment, and•Impact of new legislation on bodily injury awards in the UK market.•
(b) Provisions for unearned premiums and unexpired short term insurance risks
The movements for the year are summarised below.
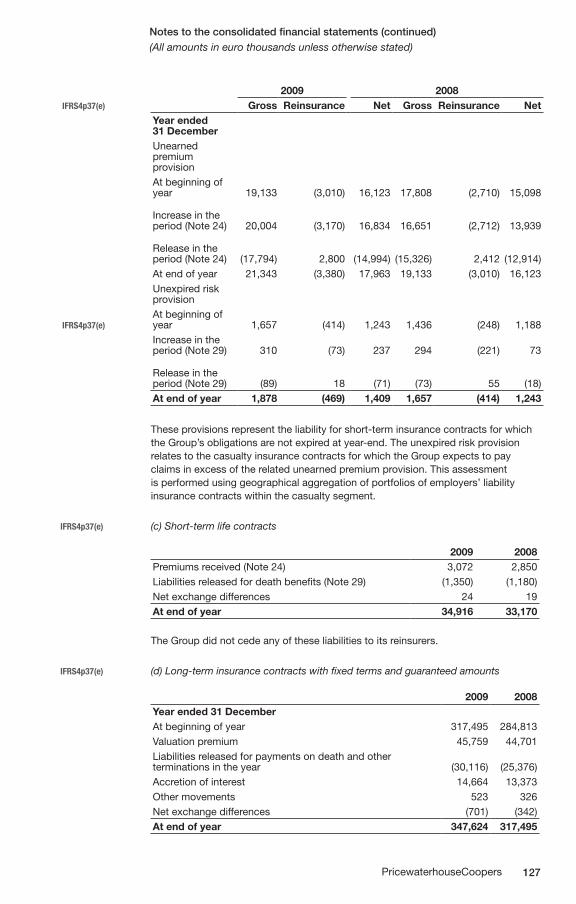
127PricewaterhouseCoopers
Notes to the consolidated financial statements (continued)(All amounts in euro thousands unless otherwise stated)
2009 2008IFRS4p37(e) Gross Reinsurance Net Gross Reinsurance Net
Year ended 31 DecemberUnearned premium provisionAt beginning of year 19,133 (3,010) 16,123 17,808 (2,710) 15,098
Increase in the period (Note 24) 20,004 (3,170) 16,834 16,651 (2,712) 13,939
Release in the period (Note 24) (17,794) 2,800
(14,994) (15,326) 2,412 (12,914)
At end of year 21,343 (3,380) 17,963 19,133 (3,010) 16,123Unexpired risk provision
IFRS4p37(e)At beginning of year 1,657 (414) 1,243 1,436 (248) 1,188Increase in the period (Note 29) 310 (73) 237 294 (221) 73
Release in the period (Note 29) (89) 18 (71) (73) 55 (18)At end of year 1,878 (469) 1,409 1,657 (414) 1,243
These provisions represent the liability for short-term insurance contracts for which the Group’s obligations are not expired at year-end. The unexpired risk provision relates to the casualty insurance contracts for which the Group expects to pay claims in excess of the related unearned premium provision. This assessment is performed using geographical aggregation of portfolios of employers’ liability insurance contracts within the casualty segment.
IFRS4p37(e) (c) Short-term life contracts
2009 2008Premiums received (Note 24) 3,072 2,850Liabilities released for death benefits (Note 29) (1,350) (1,180)Net exchange differences 24 19At end of year 34,916 33,170
The Group did not cede any of these liabilities to its reinsurers.
IFRS4p37(e) (d) Long-term insurance contracts with fixed terms and guaranteed amounts
2009 2008Year ended 31 DecemberAt beginning of year 317,495 284,813Valuation premium 45,759 44,701Liabilities released for payments on death and other terminations in the year (30,116) (25,376)Accretion of interest 14,664 13,373Other movements 523 326Net exchange differences (701) (342)At end of year 347,624 317,495
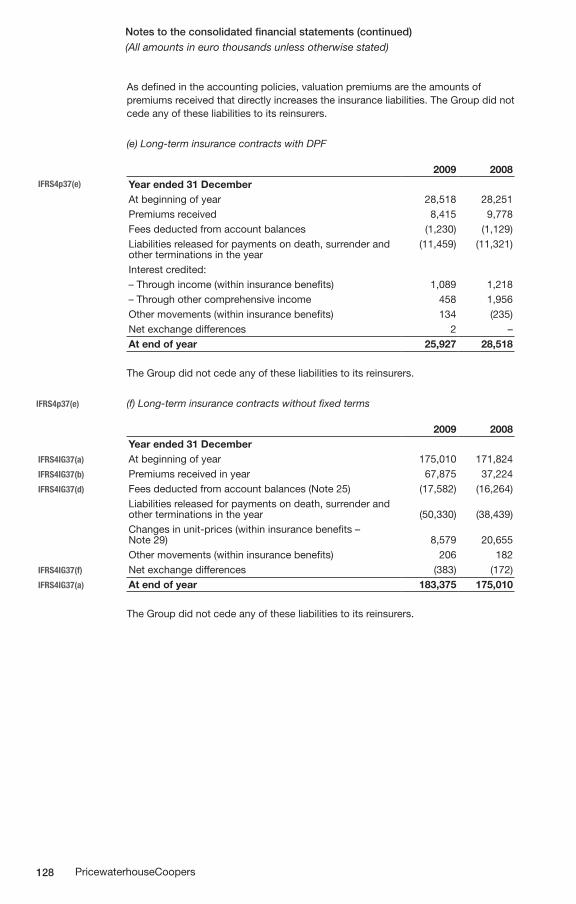
128 PricewaterhouseCoopers
Notes to the consolidated financial statements (continued)(All amounts in euro thousands unless otherwise stated)
As defined in the accounting policies, valuation premiums are the amounts of premiums received that directly increases the insurance liabilities. The Group did not cede any of these liabilities to its reinsurers.
(e) Long-term insurance contracts with DPF
2009 2008IFRS4p37(e) Year ended 31 December
At beginning of year 28,518 28,251Premiums received 8,415 9,778Fees deducted from account balances (1,230) (1,129)Liabilities released for payments on death, surrender and other terminations in the year
(11,459) (11,321)
Interest credited:– Through income (within insurance benefits) 1,089 1,218– Through other comprehensive income 458 1,956Other movements (within insurance benefits) 134 (235)Net exchange differences 2 –At end of year 25,927 28,518
The Group did not cede any of these liabilities to its reinsurers.
IFRS4p37(e) (f) Long-term insurance contracts without fixed terms
2009 2008Year ended 31 December
IFRS4IG37(a) At beginning of year 175,010 171,824IFRS4IG37(b) Premiums received in year 67,875 37,224IFRS4IG37(d) Fees deducted from account balances (Note 25) (17,582) (16,264)
Liabilities released for payments on death, surrender and other terminations in the year (50,330) (38,439)Changes in unit-prices (within insurance benefits – Note 29) 8,579 20,655Other movements (within insurance benefits) 206 182
IFRS4IG37(f) Net exchange differences (383) (172)IFRS4IG37(a) At end of year 183,375 175,010
The Group did not cede any of these liabilities to its reinsurers.
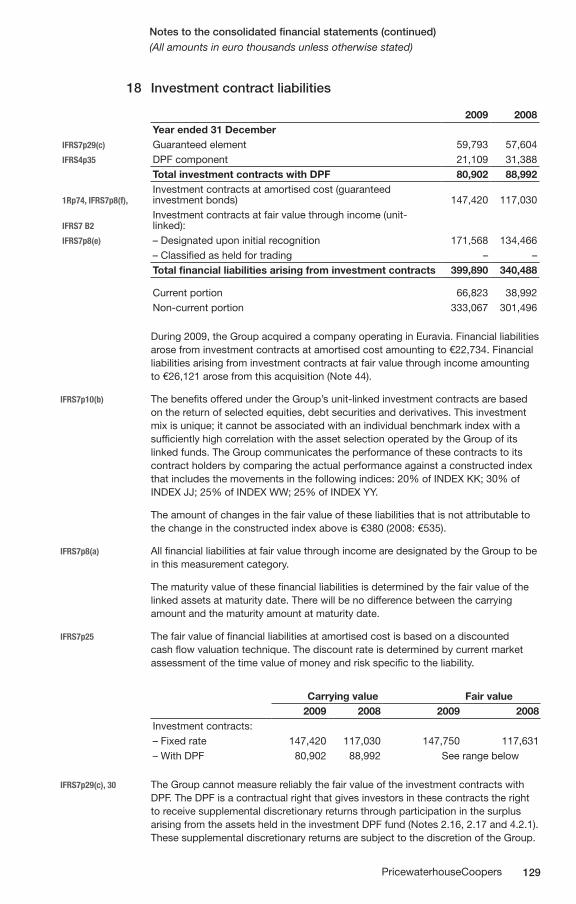
129PricewaterhouseCoopers
Notes to the consolidated financial statements (continued)(All amounts in euro thousands unless otherwise stated)
18 Investment contract liabilities
2009 2008Year ended 31 December
IFRS7p29(c) Guaranteed element 59,793 57,604IFRS4p35 DPF component 21,109 31,388
Total investment contracts with DPF 80,902 88,992
1Rp74, IFRS7p8(f),Investment contracts at amortised cost (guaranteed investment bonds) 147,420 117,030
IFRS7 B2Investment contracts at fair value through income (unit-linked):
IFRS7p8(e) – Designated upon initial recognition 171,568 134,466– Classified as held for trading – –Total financial liabilities arising from investment contracts 399,890 340,488
Current portion 66,823 38,992Non-current portion 333,067 301,496
During 2009, the Group acquired a company operating in Euravia. Financial liabilities arose from investment contracts at amortised cost amounting to €22,734. Financial liabilities arising from investment contracts at fair value through income amounting to €26,121 arose from this acquisition (Note 44).
IFRS7p10(b) The benefits offered under the Group’s unit-linked investment contracts are based on the return of selected equities, debt securities and derivatives. This investment mix is unique; it cannot be associated with an individual benchmark index with a sufficiently high correlation with the asset selection operated by the Group of its linked funds. The Group communicates the performance of these contracts to its contract holders by comparing the actual performance against a constructed index that includes the movements in the following indices: 20% of INDEX KK; 30% of INDEX JJ; 25% of INDEX WW; 25% of INDEX YY.
The amount of changes in the fair value of these liabilities that is not attributable to the change in the constructed index above is €380 (2008: €535).
IFRS7p8(a) All financial liabilities at fair value through income are designated by the Group to be in this measurement category.
The maturity value of these financial liabilities is determined by the fair value of the linked assets at maturity date. There will be no difference between the carrying amount and the maturity amount at maturity date.
IFRS7p25 The fair value of financial liabilities at amortised cost is based on a discounted cash flow valuation technique. The discount rate is determined by current market assessment of the time value of money and risk specific to the liability.
Carrying value Fair value2009 2008 2009 2008
Investment contracts:– Fixed rate 147,420 117,030 147,750 117,631– With DPF 80,902 88,992 See range below
IFRS7p29(c), 30 The Group cannot measure reliably the fair value of the investment contracts with DPF. The DPF is a contractual right that gives investors in these contracts the right to receive supplemental discretionary returns through participation in the surplus arising from the assets held in the investment DPF fund (Notes 2.16, 2.17 and 4.2.1). These supplemental discretionary returns are subject to the discretion of the Group.
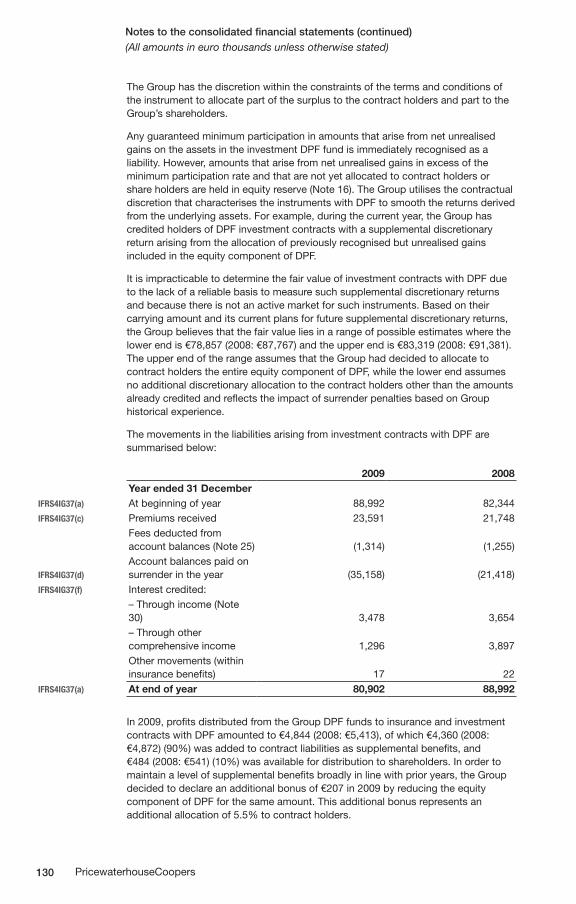
130 PricewaterhouseCoopers
Notes to the consolidated financial statements (continued)(All amounts in euro thousands unless otherwise stated)
The Group has the discretion within the constraints of the terms and conditions of the instrument to allocate part of the surplus to the contract holders and part to the Group’s shareholders.
Any guaranteed minimum participation in amounts that arise from net unrealised gains on the assets in the investment DPF fund is immediately recognised as a liability. However, amounts that arise from net unrealised gains in excess of the minimum participation rate and that are not yet allocated to contract holders or share holders are held in equity reserve (Note 16). The Group utilises the contractual discretion that characterises the instruments with DPF to smooth the returns derived from the underlying assets. For example, during the current year, the Group has credited holders of DPF investment contracts with a supplemental discretionary return arising from the allocation of previously recognised but unrealised gains included in the equity component of DPF.
It is impracticable to determine the fair value of investment contracts with DPF due to the lack of a reliable basis to measure such supplemental discretionary returns and because there is not an active market for such instruments. Based on their carrying amount and its current plans for future supplemental discretionary returns, the Group believes that the fair value lies in a range of possible estimates where the lower end is €78,857 (2008: €87,767) and the upper end is €83,319 (2008: €91,381). The upper end of the range assumes that the Group had decided to allocate to contract holders the entire equity component of DPF, while the lower end assumes no additional discretionary allocation to the contract holders other than the amounts already credited and reflects the impact of surrender penalties based on Group historical experience.
The movements in the liabilities arising from investment contracts with DPF are summarised below:
2009 2008Year ended 31 December
IFRS4IG37(a) At beginning of year 88,992 82,344IFRS4IG37(c) Premiums received 23,591 21,748
Fees deducted from account balances (Note 25) (1,314) (1,255)
IFRS4IG37(d)
Account balances paid on surrender in the year (35,158) (21,418)
IFRS4IG37(f) Interest credited:– Through income (Note 30) 3,478 3,654– Through other comprehensive income 1,296 3,897Other movements (within insurance benefits) 17 22
IFRS4IG37(a) At end of year 80,902 88,992
In 2009, profits distributed from the Group DPF funds to insurance and investment contracts with DPF amounted to €4,844 (2008: €5,413), of which €4,360 (2008: €4,872) (90%) was added to contract liabilities as supplemental benefits, and €484 (2008: €541) (10%) was available for distribution to shareholders. In order to maintain a level of supplemental benefits broadly in line with prior years, the Group decided to declare an additional bonus of €207 in 2009 by reducing the equity component of DPF for the same amount. This additional bonus represents an additional allocation of 5.5% to contract holders.
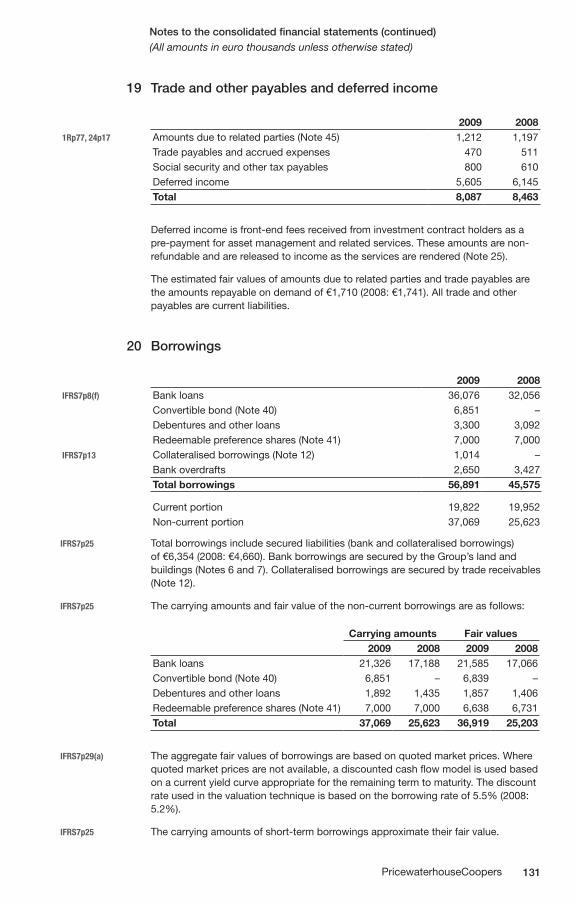
131PricewaterhouseCoopers
Notes to the consolidated financial statements (continued)(All amounts in euro thousands unless otherwise stated)
19 Trade and other payables and deferred income
2009 20081Rp77, 24p17 Amounts due to related parties (Note 45) 1,212 1,197
Trade payables and accrued expenses 470 511Social security and other tax payables 800 610Deferred income 5,605 6,145Total 8,087 8,463
Deferred income is front-end fees received from investment contract holders as a pre-payment for asset management and related services. These amounts are non-refundable and are released to income as the services are rendered (Note 25).
The estimated fair values of amounts due to related parties and trade payables are the amounts repayable on demand of €1,710 (2008: €1,741). All trade and other payables are current liabilities.
20 Borrowings
2009 2008IFRS7p8(f) Bank loans 36,076 32,056
Convertible bond (Note 40) 6,851 –Debentures and other loans 3,300 3,092Redeemable preference shares (Note 41) 7,000 7,000
IFRS7p13 Collateralised borrowings (Note 12) 1,014 –Bank overdrafts 2,650 3,427Total borrowings 56,891 45,575
Current portion 19,822 19,952Non-current portion 37,069 25,623
IFRS7p25 Total borrowings include secured liabilities (bank and collateralised borrowings) of €6,354 (2008: €4,660). Bank borrowings are secured by the Group’s land and buildings (Notes 6 and 7). Collateralised borrowings are secured by trade receivables (Note 12).
IFRS7p25 The carrying amounts and fair value of the non-current borrowings are as follows:
Carrying amounts Fair values2009 2008 2009 2008
Bank loans 21,326 17,188 21,585 17,066Convertible bond (Note 40) 6,851 – 6,839 –Debentures and other loans 1,892 1,435 1,857 1,406Redeemable preference shares (Note 41) 7,000 7,000 6,638 6,731Total 37,069 25,623 36,919 25,203
IFRS7p29(a) The aggregate fair values of borrowings are based on quoted market prices. Where quoted market prices are not available, a discounted cash flow model is used based on a current yield curve appropriate for the remaining term to maturity. The discount rate used in the valuation technique is based on the borrowing rate of 5.5% (2008: 5.2%).
IFRS7p25 The carrying amounts of short-term borrowings approximate their fair value.
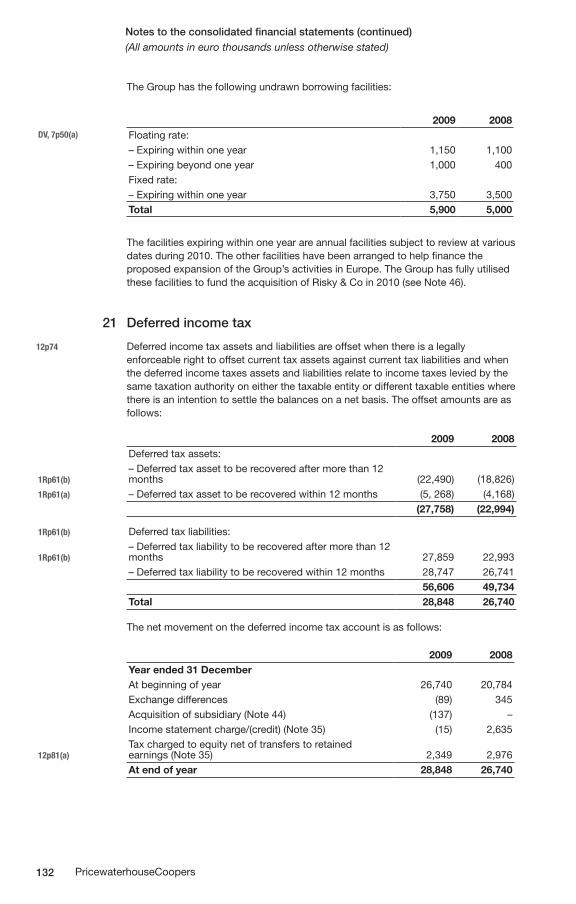
132 PricewaterhouseCoopers
Notes to the consolidated financial statements (continued)(All amounts in euro thousands unless otherwise stated)
The Group has the following undrawn borrowing facilities:
2009 2008DV, 7p50(a) Floating rate:
– Expiring within one year 1,150 1,100– Expiring beyond one year 1,000 400Fixed rate:– Expiring within one year 3,750 3,500Total 5,900 5,000
The facilities expiring within one year are annual facilities subject to review at various dates during 2010. The other facilities have been arranged to help finance the proposed expansion of the Group’s activities in Europe. The Group has fully utilised these facilities to fund the acquisition of Risky & Co in 2010 (see Note 46).
21 Deferred income tax
12p74 Deferred income tax assets and liabilities are offset when there is a legally enforceable right to offset current tax assets against current tax liabilities and when the deferred income taxes assets and liabilities relate to income taxes levied by the same taxation authority on either the taxable entity or different taxable entities where there is an intention to settle the balances on a net basis. The offset amounts are as follows:
2009 2008Deferred tax assets:
1Rp61(b)– Deferred tax asset to be recovered after more than 12 months (22,490) (18,826)
1Rp61(a) – Deferred tax asset to be recovered within 12 months (5, 268) (4,168)(27,758) (22,994)
1Rp61(b) Deferred tax liabilities:
1Rp61(b)– Deferred tax liability to be recovered after more than 12 months 27,859 22,993– Deferred tax liability to be recovered within 12 months 28,747 26,741
56,606 49,734Total 28,848 26,740
The net movement on the deferred income tax account is as follows:
2009 2008Year ended 31 DecemberAt beginning of year 26,740 20,784Exchange differences (89) 345Acquisition of subsidiary (Note 44) (137) –Income statement charge/(credit) (Note 35) (15) 2,635
12p81(a)Tax charged to equity net of transfers to retained earnings (Note 35) 2,349 2,976At end of year 28,848 26,740
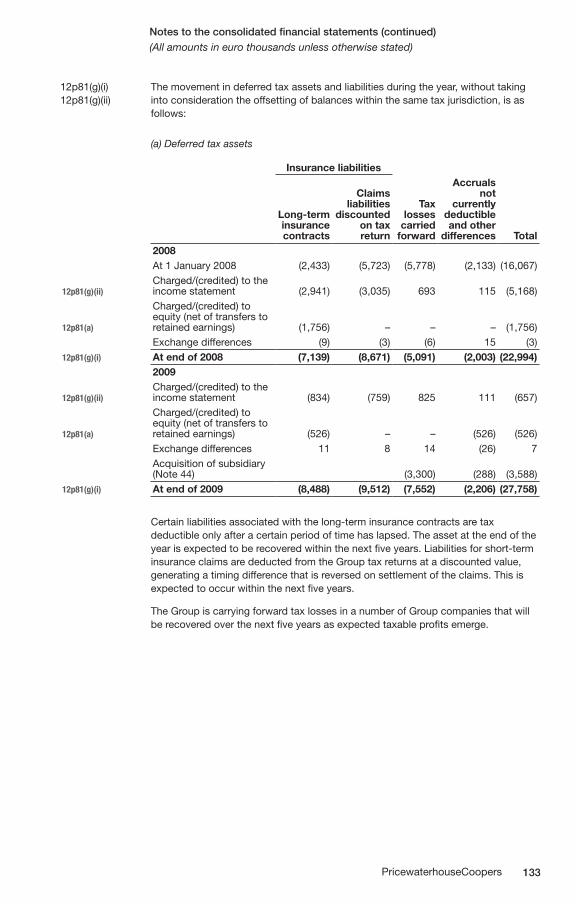
133PricewaterhouseCoopers
Notes to the consolidated financial statements (continued)(All amounts in euro thousands unless otherwise stated)
12p81(g)(i) The movement in deferred tax assets and liabilities during the year, without taking12p81(g)(ii) into consideration the offsetting of balances within the same tax jurisdiction, is as follows:
(a) Deferred tax assets
Insurance liabilities
Long-term insurance contracts
Claims liabilities
discounted on tax return
Tax losses
carried forward
Accruals not
currently deductible and other
differences Total2008At 1 January 2008 (2,433) (5,723) (5,778) (2,133) (16,067)
12p81(g)(ii)Charged/(credited) to the income statement (2,941) (3,035) 693 115 (5,168)
12p81(a)
Charged/(credited) to equity (net of transfers to retained earnings) (1,756) – – – (1,756) Exchange differences (9) (3) (6) 15 (3)
12p81(g)(i) At end of 2008 (7,139) (8,671) (5,091) (2,003) (22,994)2009
12p81(g)(ii)Charged/(credited) to the income statement (834) (759) 825 111 (657)
12p81(a)
Charged/(credited) to equity (net of transfers to retained earnings) (526) – – (526) (526)Exchange differences 11 8 14 (26) 7Acquisition of subsidiary (Note 44) (3,300) (288) (3,588)
12p81(g)(i) At end of 2009 (8,488) (9,512) (7,552) (2,206) (27,758)
Certain liabilities associated with the long-term insurance contracts are tax deductible only after a certain period of time has lapsed. The asset at the end of the year is expected to be recovered within the next five years. Liabilities for short-term insurance claims are deducted from the Group tax returns at a discounted value, generating a timing difference that is reversed on settlement of the claims. This is expected to occur within the next five years.
The Group is carrying forward tax losses in a number of Group companies that will be recovered over the next five years as expected taxable profits emerge.
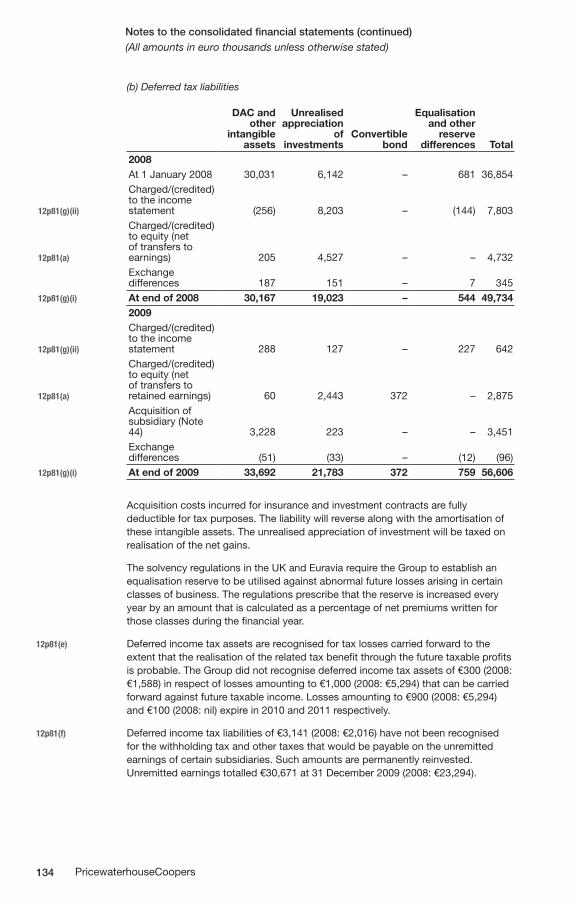
134 PricewaterhouseCoopers
Notes to the consolidated financial statements (continued)(All amounts in euro thousands unless otherwise stated)
(b) Deferred tax liabilities
DAC and other
intangible assets
Unrealised appreciation
of investments
Convertible bond
Equalisation and other
reserve differences Total
2008At 1 January 2008 30,031 6,142 – 681 36,854
12p81(g)(ii)
Charged/(credited) to the income statement (256) 8,203 – (144) 7,803
12p81(a)
Charged/(credited) to equity (net of transfers to earnings) 205 4,527 – – 4,732Exchange differences 187 151 – 7 345
12p81(g)(i) At end of 2008 30,167 19,023 – 544 49,7342009
12p81(g)(ii)
Charged/(credited) to the income statement 288 127 – 227 642
12p81(a)
Charged/(credited) to equity (net of transfers to retained earnings) 60 2,443 372 – 2,875Acquisition of subsidiary (Note 44) 3,228 223 – – 3,451Exchange differences (51) (33) – (12) (96)
12p81(g)(i) At end of 2009 33,692 21,783 372 759 56,606
Acquisition costs incurred for insurance and investment contracts are fully deductible for tax purposes. The liability will reverse along with the amortisation of these intangible assets. The unrealised appreciation of investment will be taxed on realisation of the net gains.
The solvency regulations in the UK and Euravia require the Group to establish an equalisation reserve to be utilised against abnormal future losses arising in certain classes of business. The regulations prescribe that the reserve is increased every year by an amount that is calculated as a percentage of net premiums written for those classes during the financial year.
12p81(e) Deferred income tax assets are recognised for tax losses carried forward to the extent that the realisation of the related tax benefit through the future taxable profits is probable. The Group did not recognise deferred income tax assets of €300 (2008: €1,588) in respect of losses amounting to €1,000 (2008: €5,294) that can be carried forward against future taxable income. Losses amounting to €900 (2008: €5,294) and €100 (2008: nil) expire in 2010 and 2011 respectively.
12p81(f) Deferred income tax liabilities of €3,141 (2008: €2,016) have not been recognised for the withholding tax and other taxes that would be payable on the unremitted earnings of certain subsidiaries. Such amounts are permanently reinvested. Unremitted earnings totalled €30,671 at 31 December 2009 (2008: €23,294).
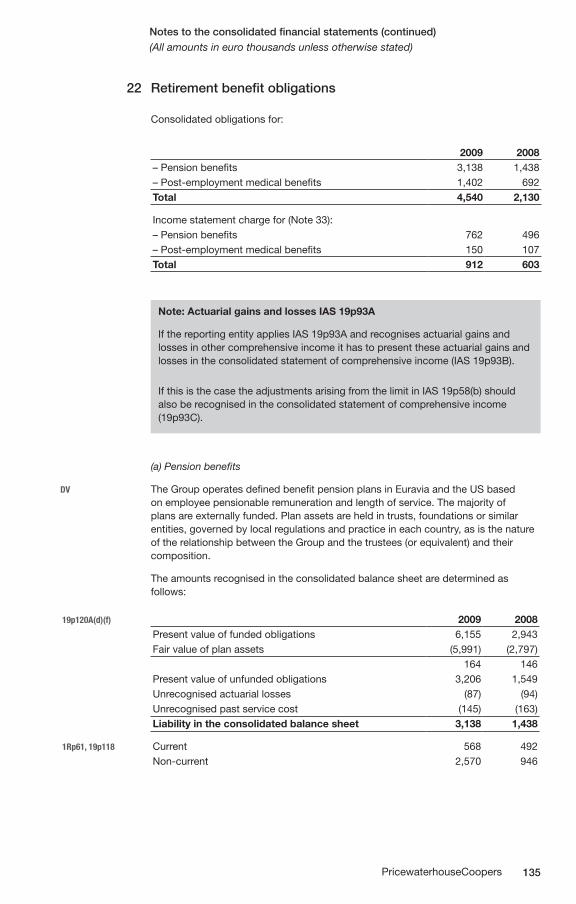
135PricewaterhouseCoopers
Notes to the consolidated financial statements (continued)(All amounts in euro thousands unless otherwise stated)
22 Retirement benefit obligations
Consolidated obligations for:
2009 2008– Pension benefits 3,138 1,438– Post-employment medical benefits 1,402 692Total 4,540 2,130
Income statement charge for (Note 33):– Pension benefits 762 496– Post-employment medical benefits 150 107Total 912 603
Note: Actuarial gains and losses IAS 19p93A
If the reporting entity applies IAS 19p93A and recognises actuarial gains and losses in other comprehensive income it has to present these actuarial gains and losses in the consolidated statement of comprehensive income (IAS 19p93B).
If this is the case the adjustments arising from the limit in IAS 19p58(b) should also be recognised in the consolidated statement of comprehensive income (19p93C).
(a) Pension benefits
DV The Group operates defined benefit pension plans in Euravia and the US based on employee pensionable remuneration and length of service. The majority of plans are externally funded. Plan assets are held in trusts, foundations or similar entities, governed by local regulations and practice in each country, as is the nature of the relationship between the Group and the trustees (or equivalent) and their composition.
The amounts recognised in the consolidated balance sheet are determined as follows:
19p120A(d)(f) 2009 2008Present value of funded obligations 6,155 2,943Fair value of plan assets (5,991) (2,797)
164 146Present value of unfunded obligations 3,206 1,549Unrecognised actuarial losses (87) (94)Unrecognised past service cost (145) (163)Liability in the consolidated balance sheet 3,138 1,438
1Rp61, 19p118 Current 568 492Non-current 2,570 946
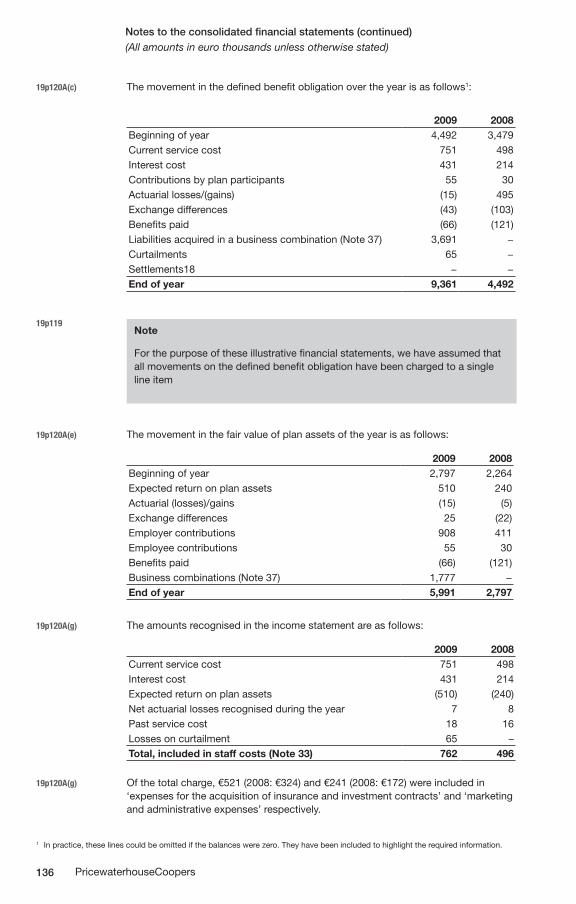
136 PricewaterhouseCoopers
Notes to the consolidated financial statements (continued)(All amounts in euro thousands unless otherwise stated)
19p120A(c) The movement in the defined benefit obligation over the year is as follows1:
2009 2008Beginning of year 4,492 3,479Current service cost 751 498Interest cost 431 214Contributions by plan participants 55 30Actuarial losses/(gains) (15) 495Exchange differences (43) (103)Benefits paid (66) (121)Liabilities acquired in a business combination (Note 37) 3,691 −Curtailments 65 −Settlements18 − −End of year 9,361 4,492
19p119 Note
For the purpose of these illustrative financial statements, we have assumed that all movements on the defined benefit obligation have been charged to a single line item
19p120A(e) The movement in the fair value of plan assets of the year is as follows:
2009 2008Beginning of year 2,797 2,264Expected return on plan assets 510 240Actuarial (losses)/gains (15) (5)Exchange differences 25 (22)Employer contributions 908 411Employee contributions 55 30Benefits paid (66) (121)Business combinations (Note 37) 1,777 −End of year 5,991 2,797
19p120A(g) The amounts recognised in the income statement are as follows:
2009 2008Current service cost 751 498Interest cost 431 214Expected return on plan assets (510) (240)Net actuarial losses recognised during the year 7 8Past service cost 18 16Losses on curtailment 65 –Total, included in staff costs (Note 33) 762 496
19p120A(g) Of the total charge, €521 (2008: €324) and €241 (2008: €172) were included in ‘expenses for the acquisition of insurance and investment contracts’ and ‘marketing and administrative expenses’ respectively.
1 In practice, these lines could be omitted if the balances were zero. They have been included to highlight the required information.
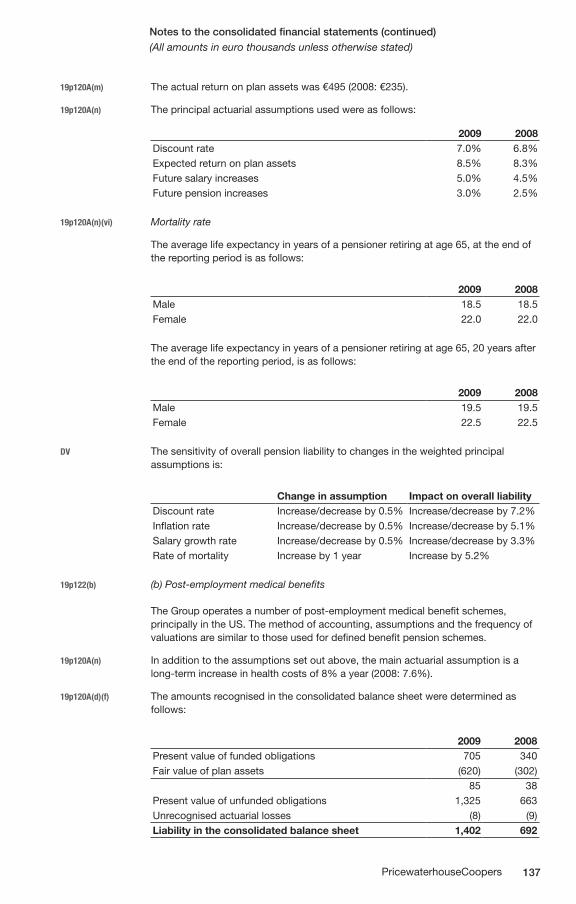
137PricewaterhouseCoopers
Notes to the consolidated financial statements (continued)(All amounts in euro thousands unless otherwise stated)
19p120A(m) The actual return on plan assets was €495 (2008: €235).
19p120A(n) The principal actuarial assumptions used were as follows:
2009 2008Discount rate 7.0% 6.8%Expected return on plan assets 8.5% 8.3%Future salary increases 5.0% 4.5%Future pension increases 3.0% 2.5%
19p120A(n)(vi) Mortality rate
The average life expectancy in years of a pensioner retiring at age 65, at the end of the reporting period is as follows:
2009 2008Male 18.5 18.5Female 22.0 22.0
The average life expectancy in years of a pensioner retiring at age 65, 20 years after the end of the reporting period, is as follows:
2009 2008Male 19.5 19.5Female 22.5 22.5
DV The sensitivity of overall pension liability to changes in the weighted principal assumptions is:
Change in assumption Impact on overall liabilityDiscount rate Increase/decrease by 0.5% Increase/decrease by 7.2%Inflation rate Increase/decrease by 0.5% Increase/decrease by 5.1%Salary growth rate Increase/decrease by 0.5% Increase/decrease by 3.3%Rate of mortality Increase by 1 year Increase by 5.2%
19p122(b) (b) Post-employment medical benefits
The Group operates a number of post-employment medical benefit schemes, principally in the US. The method of accounting, assumptions and the frequency of valuations are similar to those used for defined benefit pension schemes.
19p120A(n) In addition to the assumptions set out above, the main actuarial assumption is a long-term increase in health costs of 8% a year (2008: 7.6%).
19p120A(d)(f) The amounts recognised in the consolidated balance sheet were determined as follows:
2009 2008Present value of funded obligations 705 340Fair value of plan assets (620) (302)
85 38Present value of unfunded obligations 1,325 663Unrecognised actuarial losses (8) (9)Liability in the consolidated balance sheet 1,402 692
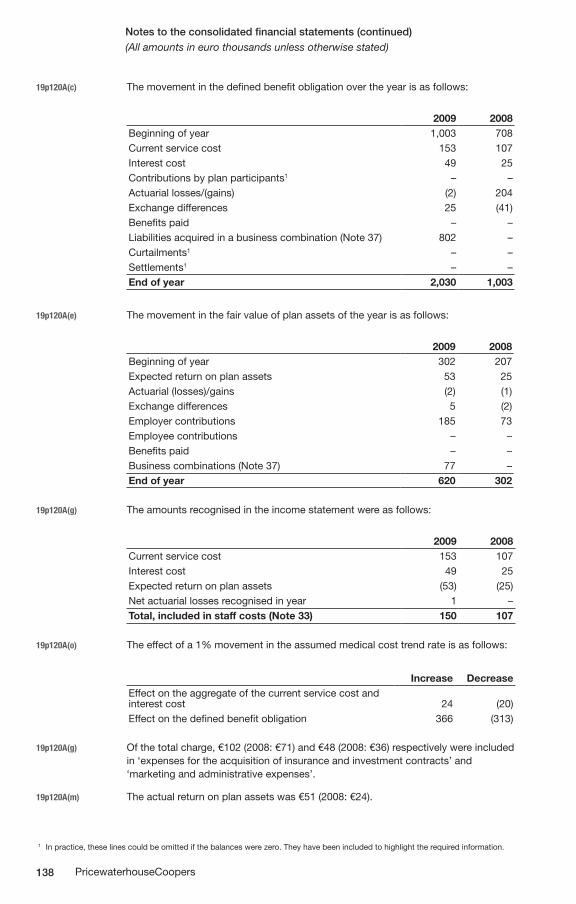
138 PricewaterhouseCoopers
Notes to the consolidated financial statements (continued)(All amounts in euro thousands unless otherwise stated)
19p120A(c) The movement in the defined benefit obligation over the year is as follows:
2009 2008Beginning of year 1,003 708Current service cost 153 107Interest cost 49 25Contributions by plan participants1 – –Actuarial losses/(gains) (2) 204Exchange differences 25 (41)Benefits paid – –Liabilities acquired in a business combination (Note 37) 802 –Curtailments1 – –Settlements1 – –End of year 2,030 1,003
19p120A(e) The movement in the fair value of plan assets of the year is as follows:
2009 2008Beginning of year 302 207Expected return on plan assets 53 25Actuarial (losses)/gains (2) (1)Exchange differences 5 (2)Employer contributions 185 73Employee contributions – –Benefits paid – –Business combinations (Note 37) 77 –End of year 620 302
19p120A(g) The amounts recognised in the income statement were as follows:
2009 2008Current service cost 153 107Interest cost 49 25Expected return on plan assets (53) (25)Net actuarial losses recognised in year 1 –Total, included in staff costs (Note 33) 150 107
19p120A(o) The effect of a 1% movement in the assumed medical cost trend rate is as follows:
Increase DecreaseEffect on the aggregate of the current service cost and interest cost 24 (20)Effect on the defined benefit obligation 366 (313)
19p120A(g) Of the total charge, €102 (2008: €71) and €48 (2008: €36) respectively were included in ‘expenses for the acquisition of insurance and investment contracts’ and ‘marketing and administrative expenses’.
19p120A(m) The actual return on plan assets was €51 (2008: €24).
1 In practice, these lines could be omitted if the balances were zero. They have been included to highlight the required information.
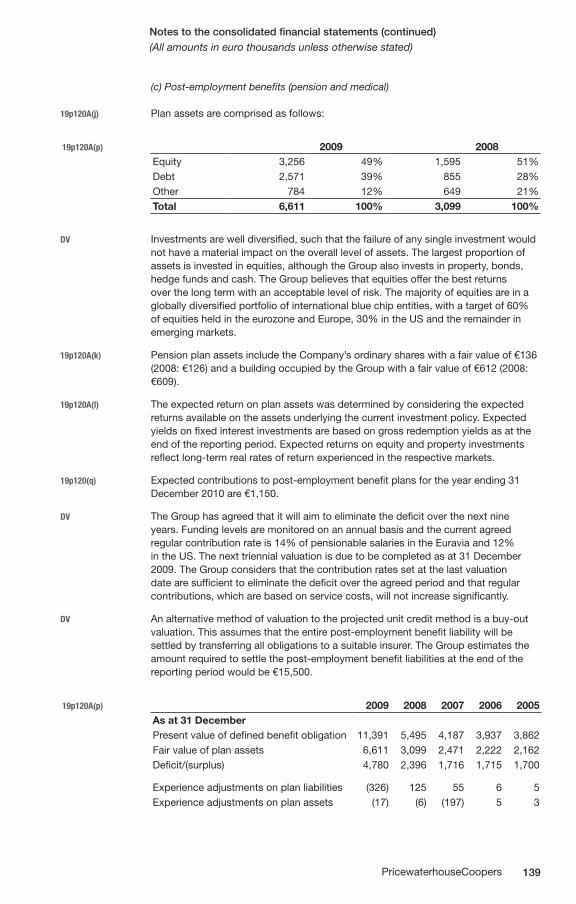
139PricewaterhouseCoopers
Notes to the consolidated financial statements (continued)(All amounts in euro thousands unless otherwise stated)
(c) Post-employment benefits (pension and medical)
19p120A(j) Plan assets are comprised as follows:
19p120A(p) 2009 2008Equity 3,256 49% 1,595 51%Debt 2,571 39% 855 28%Other 784 12% 649 21%Total 6,611 100% 3,099 100%
DV Investments are well diversified, such that the failure of any single investment would not have a material impact on the overall level of assets. The largest proportion of assets is invested in equities, although the Group also invests in property, bonds, hedge funds and cash. The Group believes that equities offer the best returns over the long term with an acceptable level of risk. The majority of equities are in a globally diversified portfolio of international blue chip entities, with a target of 60% of equities held in the eurozone and Europe, 30% in the US and the remainder in emerging markets.
19p120A(k) Pension plan assets include the Company’s ordinary shares with a fair value of €136 (2008: €126) and a building occupied by the Group with a fair value of €612 (2008: €609).
19p120A(l) The expected return on plan assets was determined by considering the expected returns available on the assets underlying the current investment policy. Expected yields on fixed interest investments are based on gross redemption yields as at the end of the reporting period. Expected returns on equity and property investments reflect long-term real rates of return experienced in the respective markets.
19p120(q) Expected contributions to post-employment benefit plans for the year ending 31 December 2010 are €1,150.
DV The Group has agreed that it will aim to eliminate the deficit over the next nine years. Funding levels are monitored on an annual basis and the current agreed regular contribution rate is 14% of pensionable salaries in the Euravia and 12% in the US. The next triennial valuation is due to be completed as at 31 December 2009. The Group considers that the contribution rates set at the last valuation date are sufficient to eliminate the deficit over the agreed period and that regular contributions, which are based on service costs, will not increase significantly.
DV An alternative method of valuation to the projected unit credit method is a buy-out valuation. This assumes that the entire post-employment benefit liability will be settled by transferring all obligations to a suitable insurer. The Group estimates the amount required to settle the post-employment benefit liabilities at the end of the reporting period would be €15,500.
19p120A(p) 2009 2008 2007 2006 2005As at 31 DecemberPresent value of defined benefit obligation 11,391 5,495 4,187 3,937 3,862Fair value of plan assets 6,611 3,099 2,471 2,222 2,162Deficit/(surplus) 4,780 2,396 1,716 1,715 1,700
Experience adjustments on plan liabilities (326) 125 55 6 5Experience adjustments on plan assets (17) (6) (197) 5 3
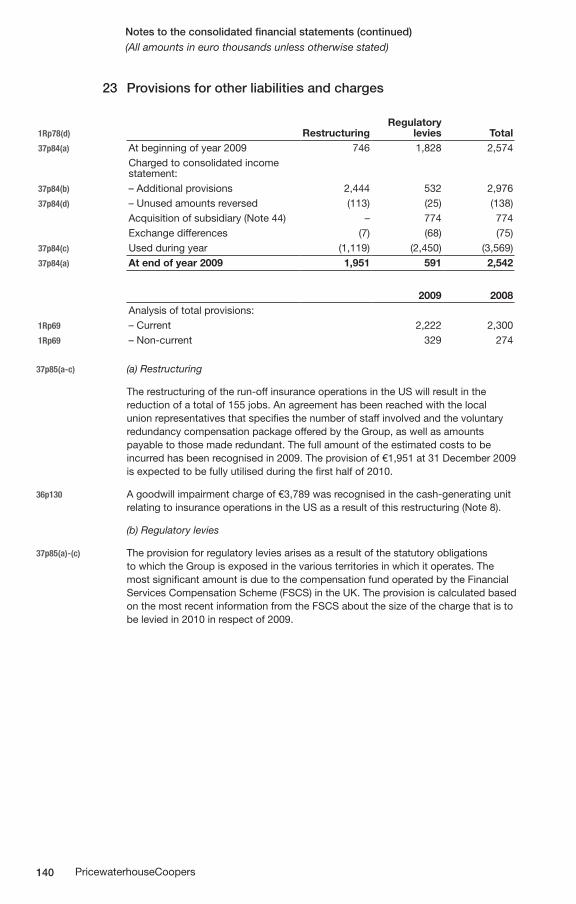
140 PricewaterhouseCoopers
Notes to the consolidated financial statements (continued)(All amounts in euro thousands unless otherwise stated)
23 Provisions for other liabilities and charges
1Rp78(d) RestructuringRegulatory
levies Total37p84(a) At beginning of year 2009 746 1,828 2,574
Charged to consolidated income statement:
37p84(b) – Additional provisions 2,444 532 2,97637p84(d) – Unused amounts reversed (113) (25) (138)
Acquisition of subsidiary (Note 44) – 774 774Exchange differences (7) (68) (75)
37p84(c) Used during year (1,119) (2,450) (3,569)37p84(a) At end of year 2009 1,951 591 2,542
2009 2008Analysis of total provisions:
1Rp69 – Current 2,222 2,3001Rp69 – Non-current 329 274
37p85(a-c) (a) Restructuring
The restructuring of the run-off insurance operations in the US will result in the reduction of a total of 155 jobs. An agreement has been reached with the local union representatives that specifies the number of staff involved and the voluntary redundancy compensation package offered by the Group, as well as amounts payable to those made redundant. The full amount of the estimated costs to be incurred has been recognised in 2009. The provision of €1,951 at 31 December 2009 is expected to be fully utilised during the first half of 2010.
36p130 A goodwill impairment charge of €3,789 was recognised in the cash-generating unit relating to insurance operations in the US as a result of this restructuring (Note 8).
(b) Regulatory levies
37p85(a)-(c) The provision for regulatory levies arises as a result of the statutory obligations to which the Group is exposed in the various territories in which it operates. The most significant amount is due to the compensation fund operated by the Financial Services Compensation Scheme (FSCS) in the UK. The provision is calculated based on the most recent information from the FSCS about the size of the charge that is to be levied in 2010 in respect of 2009.
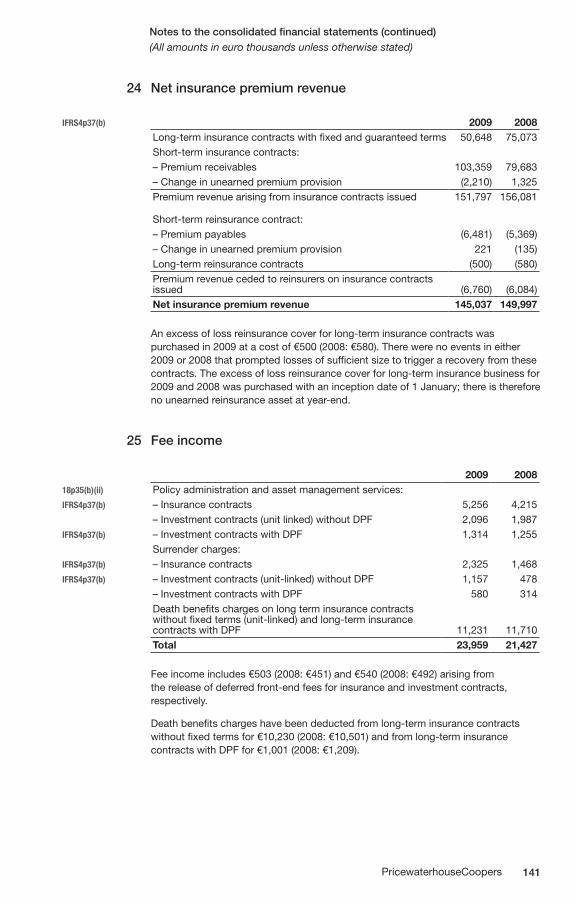
141PricewaterhouseCoopers
Notes to the consolidated financial statements (continued)(All amounts in euro thousands unless otherwise stated)
24 Net insurance premium revenue
IFRS4p37(b) 2009 2008Long-term insurance contracts with fixed and guaranteed terms 50,648 75,073Short-term insurance contracts:– Premium receivables 103,359 79,683– Change in unearned premium provision (2,210) 1,325Premium revenue arising from insurance contracts issued 151,797 156,081
Short-term reinsurance contract:– Premium payables (6,481) (5,369)– Change in unearned premium provision 221 (135)Long-term reinsurance contracts (500) (580)Premium revenue ceded to reinsurers on insurance contracts issued (6,760) (6,084)Net insurance premium revenue 145,037 149,997
An excess of loss reinsurance cover for long-term insurance contracts was purchased in 2009 at a cost of €500 (2008: €580). There were no events in either 2009 or 2008 that prompted losses of sufficient size to trigger a recovery from these contracts. The excess of loss reinsurance cover for long-term insurance business for 2009 and 2008 was purchased with an inception date of 1 January; there is therefore no unearned reinsurance asset at year-end.
25 Fee income
2009 200818p35(b)(ii) Policy administration and asset management services:IFRS4p37(b) – Insurance contracts 5,256 4,215
– Investment contracts (unit linked) without DPF 2,096 1,987IFRS4p37(b) – Investment contracts with DPF 1,314 1,255
Surrender charges:IFRS4p37(b) – Insurance contracts 2,325 1,468IFRS4p37(b) – Investment contracts (unit-linked) without DPF 1,157 478
– Investment contracts with DPF 580 314Death benefits charges on long term insurance contracts without fixed terms (unit-linked) and long-term insurance contracts with DPF 11,231 11,710Total 23,959 21,427
Fee income includes €503 (2008: €451) and €540 (2008: €492) arising from the release of deferred front-end fees for insurance and investment contracts, respectively.
Death benefits charges have been deducted from long-term insurance contracts without fixed terms for €10,230 (2008: €10,501) and from long-term insurance contracts with DPF for €1,001 (2008: €1,209).
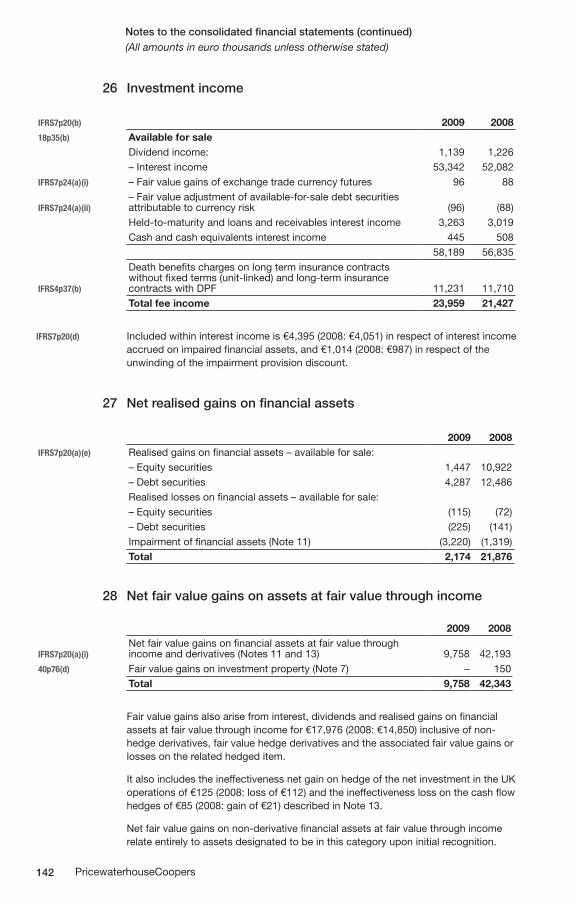
142 PricewaterhouseCoopers
Notes to the consolidated financial statements (continued)(All amounts in euro thousands unless otherwise stated)
26 Investment income
IFRS7p20(b) 2009 200818p35(b) Available for sale
Dividend income: 1,139 1,226– Interest income 53,342 52,082
IFRS7p24(a)(i) – Fair value gains of exchange trade currency futures 96 88
IFRS7p24(a)(ii)– Fair value adjustment of available-for-sale debt securities attributable to currency risk (96) (88)Held-to-maturity and loans and receivables interest income 3,263 3,019Cash and cash equivalents interest income 445 508
58,189 56,835
IFRS4p37(b)
Death benefits charges on long term insurance contracts without fixed terms (unit-linked) and long-term insurance contracts with DPF 11,231 11,710Total fee income 23,959 21,427
IFRS7p20(d) Included within interest income is €4,395 (2008: €4,051) in respect of interest income accrued on impaired financial assets, and €1,014 (2008: €987) in respect of the unwinding of the impairment provision discount.
27 Net realised gains on financial assets
2009 2008IFRS7p20(a)(e) Realised gains on financial assets – available for sale:
– Equity securities 1,447 10,922– Debt securities 4,287 12,486Realised losses on financial assets – available for sale:– Equity securities (115) (72)– Debt securities (225) (141)Impairment of financial assets (Note 11) (3,220) (1,319)Total 2,174 21,876
28 Net fair value gains on assets at fair value through income
2009 2008
IFRS7p20(a)(i)Net fair value gains on financial assets at fair value through income and derivatives (Notes 11 and 13) 9,758 42,193
40p76(d) Fair value gains on investment property (Note 7) – 150Total 9,758 42,343
Fair value gains also arise from interest, dividends and realised gains on financial assets at fair value through income for €17,976 (2008: €14,850) inclusive of non- hedge derivatives, fair value hedge derivatives and the associated fair value gains or losses on the related hedged item.
It also includes the ineffectiveness net gain on hedge of the net investment in the UK operations of €125 (2008: loss of €112) and the ineffectiveness loss on the cash flow hedges of €85 (2008: gain of €21) described in Note 13.
Net fair value gains on non-derivative financial assets at fair value through income relate entirely to assets designated to be in this category upon initial recognition.
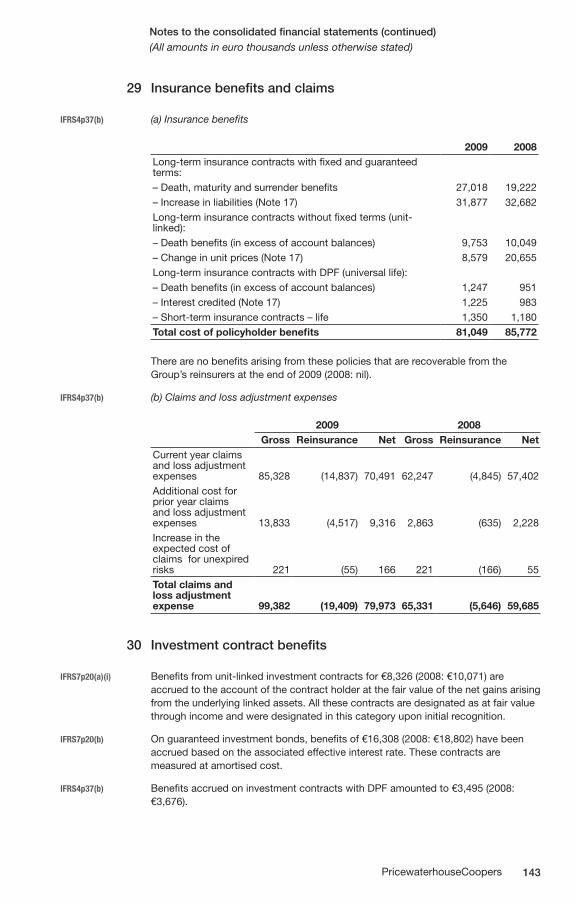
143PricewaterhouseCoopers
Notes to the consolidated financial statements (continued)(All amounts in euro thousands unless otherwise stated)
29 Insurance benefits and claims
IFRS4p37(b) (a) Insurance benefits
2009 2008Long-term insurance contracts with fixed and guaranteed terms:– Death, maturity and surrender benefits 27,018 19,222– Increase in liabilities (Note 17) 31,877 32,682Long-term insurance contracts without fixed terms (unit-linked):– Death benefits (in excess of account balances) 9,753 10,049– Change in unit prices (Note 17) 8,579 20,655Long-term insurance contracts with DPF (universal life):– Death benefits (in excess of account balances) 1,247 951– Interest credited (Note 17) 1,225 983– Short-term insurance contracts – life 1,350 1,180Total cost of policyholder benefits 81,049 85,772
There are no benefits arising from these policies that are recoverable from the Group’s reinsurers at the end of 2009 (2008: nil).
IFRS4p37(b) (b) Claims and loss adjustment expenses
2009 2008Gross Reinsurance Net Gross Reinsurance Net
Current year claims and loss adjustment expenses 85,328 (14,837) 70,491 62,247 (4,845) 57,402Additional cost for prior year claims and loss adjustment expenses 13,833 (4,517) 9,316 2,863 (635) 2,228Increase in the expected cost of claims for unexpired risks 221 (55) 166 221 (166) 55Total claims and loss adjustment expense 99,382 (19,409) 79,973 65,331 (5,646) 59,685
30 Investment contract benefits
IFRS7p20(a)(i) Benefits from unit-linked investment contracts for €8,326 (2008: €10,071) are accrued to the account of the contract holder at the fair value of the net gains arising from the underlying linked assets. All these contracts are designated as at fair value through income and were designated in this category upon initial recognition.
IFRS7p20(b) On guaranteed investment bonds, benefits of €16,308 (2008: €18,802) have been accrued based on the associated effective interest rate. These contracts are measured at amortised cost.
IFRS4p37(b) Benefits accrued on investment contracts with DPF amounted to €3,495 (2008: €3,676).
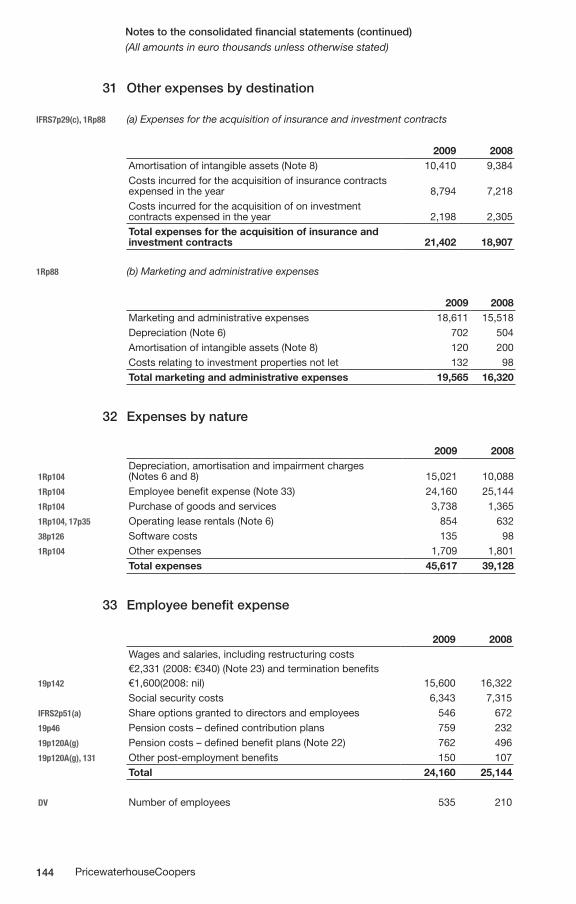
144 PricewaterhouseCoopers
Notes to the consolidated financial statements (continued)(All amounts in euro thousands unless otherwise stated)
31 Other expenses by destination
IFRS7p29(c), 1Rp88 (a) Expenses for the acquisition of insurance and investment contracts
2009 2008Amortisation of intangible assets (Note 8) 10,410 9,384Costs incurred for the acquisition of insurance contracts expensed in the year 8,794 7,218Costs incurred for the acquisition of on investment contracts expensed in the year 2,198 2,305Total expenses for the acquisition of insurance and investment contracts 21,402 18,907
1Rp88 (b) Marketing and administrative expenses
2009 2008Marketing and administrative expenses 18,611 15,518Depreciation (Note 6) 702 504Amortisation of intangible assets (Note 8) 120 200Costs relating to investment properties not let 132 98Total marketing and administrative expenses 19,565 16,320
32 Expenses by nature
2009 2008
1Rp104Depreciation, amortisation and impairment charges (Notes 6 and 8) 15,021 10,088
1Rp104 Employee benefit expense (Note 33) 24,160 25,1441Rp104 Purchase of goods and services 3,738 1,3651Rp104, 17p35 Operating lease rentals (Note 6) 854 63238p126 Software costs 135 981Rp104 Other expenses 1,709 1,801
Total expenses 45,617 39,128
33 Employee benefit expense
2009 2008
19p142
Wages and salaries, including restructuring costs€2,331 (2008: €340) (Note 23) and termination benefits€1,600(2008: nil) 15,600 16,322Social security costs 6,343 7,315
IFRS2p51(a) Share options granted to directors and employees 546 67219p46 Pension costs – defined contribution plans 759 23219p120A(g) Pension costs – defined benefit plans (Note 22) 762 49619p120A(g), 131 Other post-employment benefits 150 107
Total 24,160 25,144
DV Number of employees 535 210
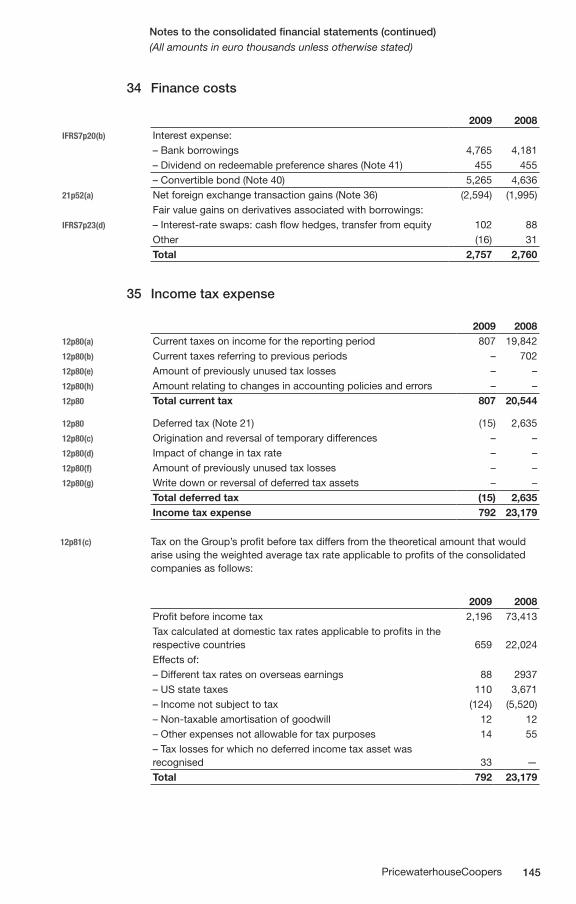
145PricewaterhouseCoopers
Notes to the consolidated financial statements (continued)(All amounts in euro thousands unless otherwise stated)
34 Finance costs
2009 2008IFRS7p20(b) Interest expense:
– Bank borrowings 4,765 4,181– Dividend on redeemable preference shares (Note 41) 455 455– Convertible bond (Note 40) 5,265 4,636
21p52(a) Net foreign exchange transaction gains (Note 36) (2,594) (1,995)Fair value gains on derivatives associated with borrowings:
IFRS7p23(d) – Interest-rate swaps: cash flow hedges, transfer from equity 102 88Other (16) 31Total 2,757 2,760
35 Income tax expense
2009 200812p80(a) Current taxes on income for the reporting period 807 19,84212p80(b) Current taxes referring to previous periods – 70212p80(e) Amount of previously unused tax losses – –12p80(h) Amount relating to changes in accounting policies and errors – –12p80 Total current tax 807 20,544
12p80 Deferred tax (Note 21) (15) 2,63512p80(c) Origination and reversal of temporary differences – –12p80(d) Impact of change in tax rate – –12p80(f) Amount of previously unused tax losses – –12p80(g) Write down or reversal of deferred tax assets – –
Total deferred tax (15) 2,635Income tax expense 792 23,179
12p81(c) Tax on the Group’s profit before tax differs from the theoretical amount that would arise using the weighted average tax rate applicable to profits of the consolidated companies as follows:
2009 2008Profit before income tax 2,196 73,413Tax calculated at domestic tax rates applicable to profits in the respective countries 659 22,024Effects of:– Different tax rates on overseas earnings 88 2937– US state taxes 110 3,671– Income not subject to tax (124) (5,520)– Non-taxable amortisation of goodwill 12 12– Other expenses not allowable for tax purposes 14 55– Tax losses for which no deferred income tax asset was recognised 33 —Total 792 23,179
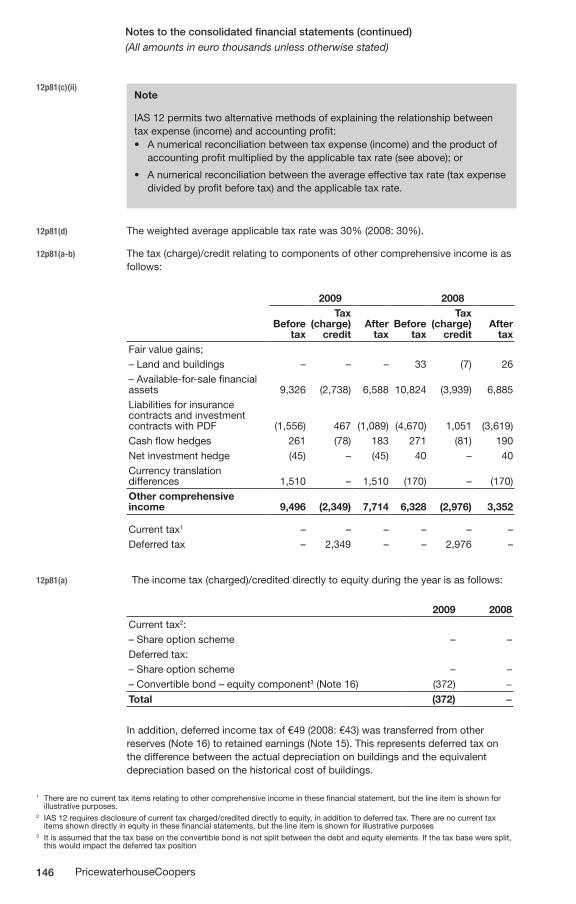
146 PricewaterhouseCoopers
Notes to the consolidated financial statements (continued)(All amounts in euro thousands unless otherwise stated)
12p81(c)(ii) Note
IAS 12 permits two alternative methods of explaining the relationship between tax expense (income) and accounting profit: • Anumericalreconciliationbetweentaxexpense(income)andtheproductof accounting profit multiplied by the applicable tax rate (see above); or
A numerical reconciliation between the average effective tax rate (tax expense • divided by profit before tax) and the applicable tax rate.
12p81(d) The weighted average applicable tax rate was 30% (2008: 30%).
12p81(a-b) The tax (charge)/credit relating to components of other comprehensive income is as follows:
2009 2008
Before tax
Tax (charge)
creditAfter
taxBefore
tax
Tax (charge)
creditAfter
taxFair value gains;– Land and buildings – – – 33 (7) 26– Available-for-sale financial assets 9,326 (2,738) 6,588 10,824 (3,939) 6,885Liabilities for insurance contracts and investment contracts with PDF (1,556) 467 (1,089) (4,670) 1,051 (3,619)Cash flow hedges 261 (78) 183 271 (81) 190Net investment hedge (45) – (45) 40 – 40Currency translation differences 1,510 – 1,510 (170) – (170)Other comprehensive income 9,496 (2,349) 7,714 6,328 (2,976) 3,352
Current tax1 – – – – – –Deferred tax – 2,349 – – 2,976 –
12p81(a) The income tax (charged)/credited directly to equity during the year is as follows:
2009 2008Current tax2:– Share option scheme – –Deferred tax: – Share option scheme – –– Convertible bond – equity component3 (Note 16) (372) −
Total (372) −
In addition, deferred income tax of €49 (2008: €43) was transferred from other reserves (Note 16) to retained earnings (Note 15). This represents deferred tax on the difference between the actual depreciation on buildings and the equivalent depreciation based on the historical cost of buildings.
1 There are no current tax items relating to other comprehensive income in these financial statement, but the line item is shown for illustrative purposes.2 IAS 12 requires disclosure of current tax charged/credited directly to equity, in addition to deferred tax. There are no current tax items shown directly in equity in these financial statements, but the line item is shown for illustrative purposes3 It is assumed that the tax base on the convertible bond is not split between the debt and equity elements. If the tax base were split, this would impact the deferred tax position
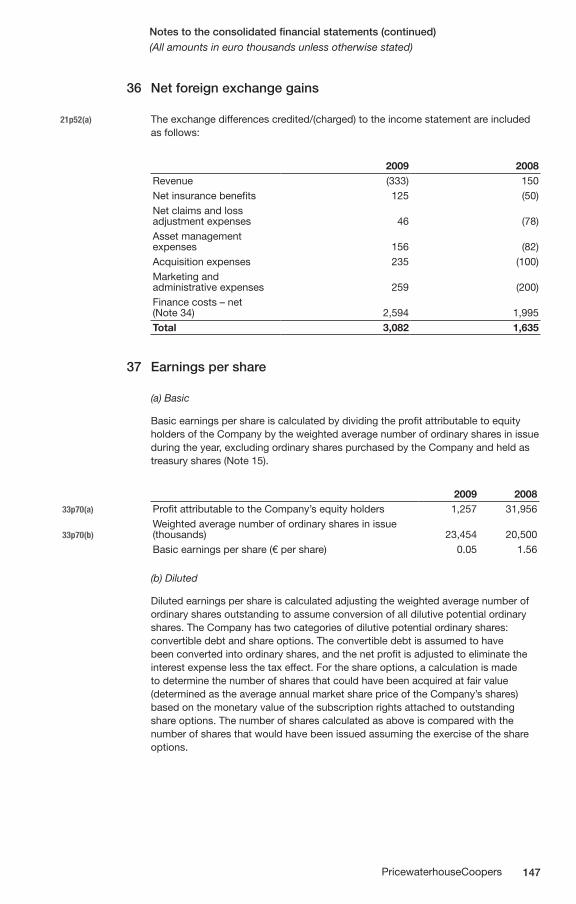
147PricewaterhouseCoopers
Notes to the consolidated financial statements (continued)(All amounts in euro thousands unless otherwise stated)
36 Net foreign exchange gains
21p52(a) The exchange differences credited/(charged) to the income statement are included as follows:
2009 2008Revenue (333) 150Net insurance benefits 125 (50)Net claims and loss adjustment expenses 46 (78)Asset management expenses 156 (82)Acquisition expenses 235 (100)Marketing and administrative expenses 259 (200)Finance costs – net (Note 34) 2,594 1,995Total 3,082 1,635
37 Earnings per share
(a) Basic
Basic earnings per share is calculated by dividing the profit attributable to equity holders of the Company by the weighted average number of ordinary shares in issue during the year, excluding ordinary shares purchased by the Company and held as treasury shares (Note 15).
2009 200833p70(a) Profit attributable to the Company’s equity holders 1,257 31,956
33p70(b)Weighted average number of ordinary shares in issue (thousands) 23,454 20,500Basic earnings per share (€ per share) 0.05 1.56
(b) Diluted
Diluted earnings per share is calculated adjusting the weighted average number of ordinary shares outstanding to assume conversion of all dilutive potential ordinary shares. The Company has two categories of dilutive potential ordinary shares: convertible debt and share options. The convertible debt is assumed to have been converted into ordinary shares, and the net profit is adjusted to eliminate the interest expense less the tax effect. For the share options, a calculation is made to determine the number of shares that could have been acquired at fair value (determined as the average annual market share price of the Company’s shares) based on the monetary value of the subscription rights attached to outstanding share options. The number of shares calculated as above is compared with the number of shares that would have been issued assuming the exercise of the share options.
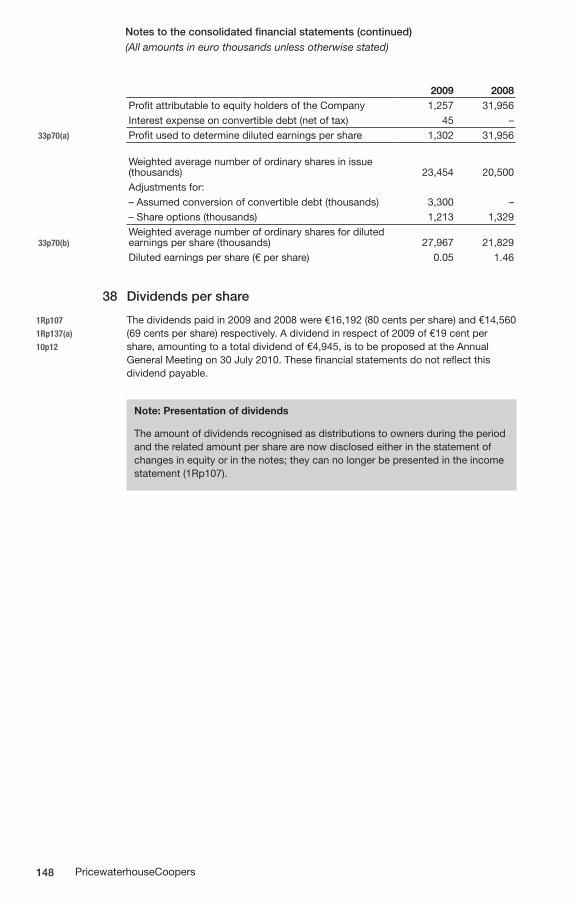
148 PricewaterhouseCoopers
Notes to the consolidated financial statements (continued)(All amounts in euro thousands unless otherwise stated)
2009 2008Profit attributable to equity holders of the Company 1,257 31,956Interest expense on convertible debt (net of tax) 45 –
33p70(a) Profit used to determine diluted earnings per share 1,302 31,956
Weighted average number of ordinary shares in issue (thousands) 23,454 20,500Adjustments for:– Assumed conversion of convertible debt (thousands) 3,300 –– Share options (thousands) 1,213 1,329
33p70(b)Weighted average number of ordinary shares for diluted earnings per share (thousands) 27,967 21,829Diluted earnings per share (€ per share) 0.05 1.46
38 Dividends per share
1Rp107 The dividends paid in 2009 and 2008 were €16,192 (80 cents per share) and €14,5601Rp137(a) (69 cents per share) respectively. A dividend in respect of 2009 of €19 cent per10p12 share, amounting to a total dividend of €4,945, is to be proposed at the Annual
General Meeting on 30 July 2010. These financial statements do not reflect this dividend payable.
Note: Presentation of dividends
The amount of dividends recognised as distributions to owners during the period and the related amount per share are now disclosed either in the statement of changes in equity or in the notes; they can no longer be presented in the income statement (1Rp107).
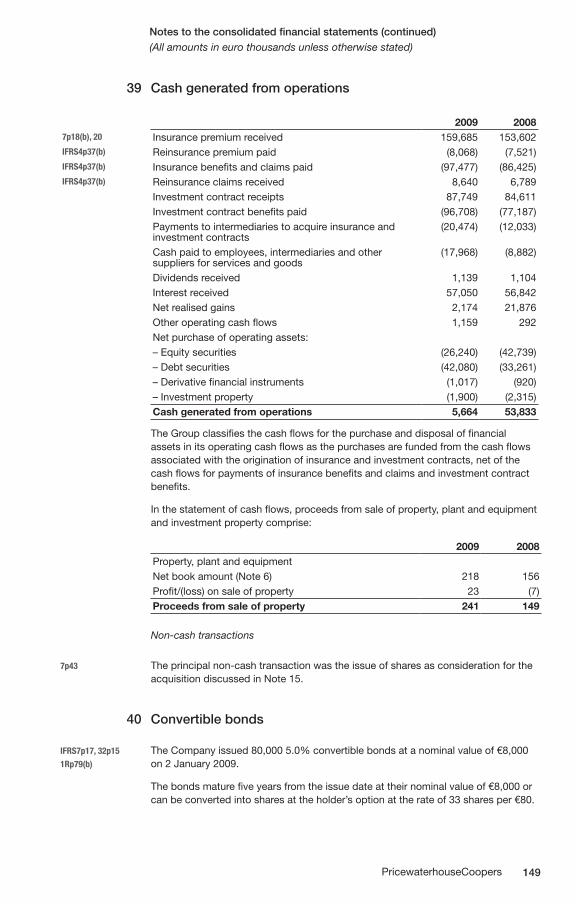
149PricewaterhouseCoopers
Notes to the consolidated financial statements (continued)(All amounts in euro thousands unless otherwise stated)
39 Cash generated from operations
2009 20087p18(b), 20 Insurance premium received 159,685 153,602IFRS4p37(b) Reinsurance premium paid (8,068) (7,521)IFRS4p37(b) Insurance benefits and claims paid (97,477) (86,425)IFRS4p37(b) Reinsurance claims received 8,640 6,789
Investment contract receipts 87,749 84,611Investment contract benefits paid (96,708) (77,187)Payments to intermediaries to acquire insurance and investment contracts
(20,474) (12,033)
Cash paid to employees, intermediaries and other suppliers for services and goods
(17,968) (8,882)
Dividends received 1,139 1,104Interest received 57,050 56,842Net realised gains 2,174 21,876Other operating cash flows 1,159 292Net purchase of operating assets:– Equity securities (26,240) (42,739)– Debt securities (42,080) (33,261)– Derivative financial instruments (1,017) (920)– Investment property (1,900) (2,315)Cash generated from operations 5,664 53,833
The Group classifies the cash flows for the purchase and disposal of financial assets in its operating cash flows as the purchases are funded from the cash flows associated with the origination of insurance and investment contracts, net of the cash flows for payments of insurance benefits and claims and investment contract benefits.
In the statement of cash flows, proceeds from sale of property, plant and equipment and investment property comprise:
2009 2008Property, plant and equipmentNet book amount (Note 6) 218 156Profit/(loss) on sale of property 23 (7)Proceeds from sale of property 241 149
Non-cash transactions
7p43 The principal non-cash transaction was the issue of shares as consideration for the acquisition discussed in Note 15.
40 Convertible bonds
IFRS7p17, 32p15 The Company issued 80,000 5.0% convertible bonds at a nominal value of €8,0001Rp79(b) on 2 January 2009.
The bonds mature five years from the issue date at their nominal value of €8,000 or can be converted into shares at the holder’s option at the rate of 33 shares per €80.
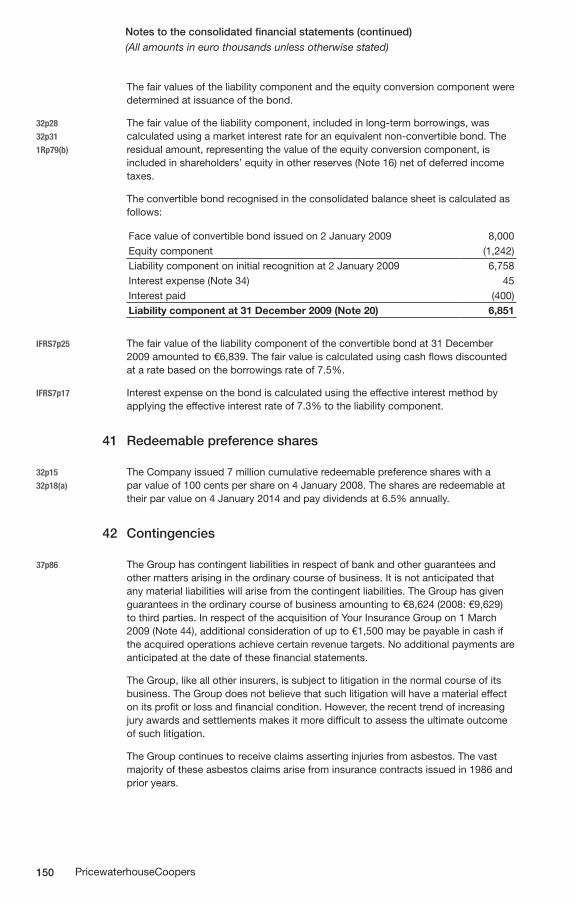
150 PricewaterhouseCoopers
Notes to the consolidated financial statements (continued)(All amounts in euro thousands unless otherwise stated)
The fair values of the liability component and the equity conversion component were determined at issuance of the bond.
32p28 The fair value of the liability component, included in long-term borrowings, was32p31 calculated using a market interest rate for an equivalent non-convertible bond. The1Rp79(b) residual amount, representing the value of the equity conversion component, is
included in shareholders’ equity in other reserves (Note 16) net of deferred income taxes.
The convertible bond recognised in the consolidated balance sheet is calculated as follows:
Face value of convertible bond issued on 2 January 2009 8,000Equity component (1,242)Liability component on initial recognition at 2 January 2009 6,758Interest expense (Note 34) 45Interest paid (400)Liability component at 31 December 2009 (Note 20) 6,851
IFRS7p25 The fair value of the liability component of the convertible bond at 31 December 2009 amounted to €6,839. The fair value is calculated using cash flows discounted at a rate based on the borrowings rate of 7.5%.
IFRS7p17 Interest expense on the bond is calculated using the effective interest method by applying the effective interest rate of 7.3% to the liability component.
41 Redeemable preference shares
32p15 The Company issued 7 million cumulative redeemable preference shares with a32p18(a) par value of 100 cents per share on 4 January 2008. The shares are redeemable at
their par value on 4 January 2014 and pay dividends at 6.5% annually.
42 Contingencies
37p86 The Group has contingent liabilities in respect of bank and other guarantees and other matters arising in the ordinary course of business. It is not anticipated that any material liabilities will arise from the contingent liabilities. The Group has given guarantees in the ordinary course of business amounting to €8,624 (2008: €9,629) to third parties. In respect of the acquisition of Your Insurance Group on 1 March 2009 (Note 44), additional consideration of up to €1,500 may be payable in cash if the acquired operations achieve certain revenue targets. No additional payments are anticipated at the date of these financial statements.
The Group, like all other insurers, is subject to litigation in the normal course of its business. The Group does not believe that such litigation will have a material effect on its profit or loss and financial condition. However, the recent trend of increasing jury awards and settlements makes it more difficult to assess the ultimate outcome of such litigation.
The Group continues to receive claims asserting injuries from asbestos. The vast majority of these asbestos claims arise from insurance contracts issued in 1986 and prior years.
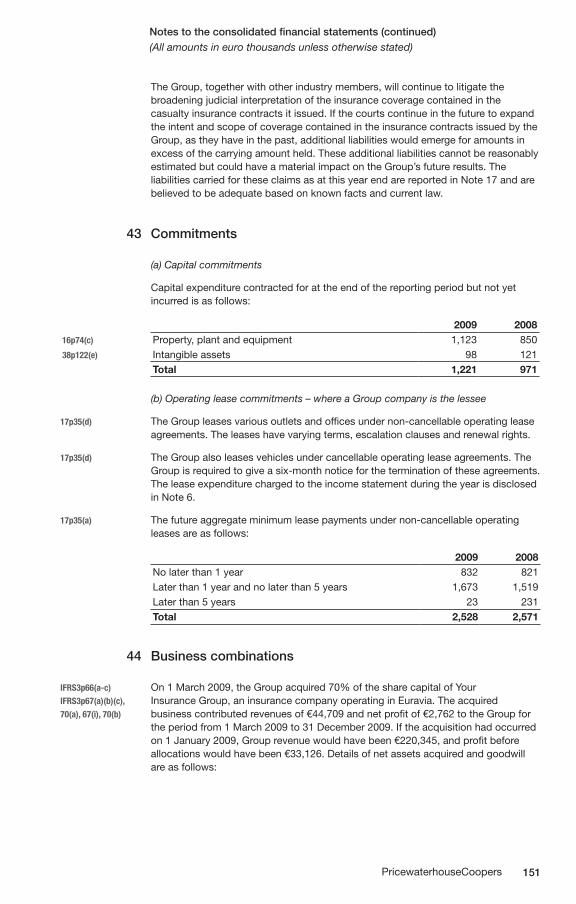
151PricewaterhouseCoopers
Notes to the consolidated financial statements (continued)(All amounts in euro thousands unless otherwise stated)
The Group, together with other industry members, will continue to litigate the broadening judicial interpretation of the insurance coverage contained in the casualty insurance contracts it issued. If the courts continue in the future to expand the intent and scope of coverage contained in the insurance contracts issued by the Group, as they have in the past, additional liabilities would emerge for amounts in excess of the carrying amount held. These additional liabilities cannot be reasonably estimated but could have a material impact on the Group’s future results. The liabilities carried for these claims as at this year end are reported in Note 17 and are believed to be adequate based on known facts and current law.
43 Commitments
(a) Capital commitments
Capital expenditure contracted for at the end of the reporting period but not yet incurred is as follows:
2009 200816p74(c) Property, plant and equipment 1,123 85038p122(e) Intangible assets 98 121
Total 1,221 971
(b) Operating lease commitments – where a Group company is the lessee
17p35(d) The Group leases various outlets and offices under non-cancellable operating lease agreements. The leases have varying terms, escalation clauses and renewal rights.
17p35(d) The Group also leases vehicles under cancellable operating lease agreements. The Group is required to give a six-month notice for the termination of these agreements. The lease expenditure charged to the income statement during the year is disclosed in Note 6.
17p35(a) The future aggregate minimum lease payments under non-cancellable operating leases are as follows:
2009 2008No later than 1 year 832 821Later than 1 year and no later than 5 years 1,673 1,519Later than 5 years 23 231Total 2,528 2,571
44 Business combinations
IFRS3p66(a-c) On 1 March 2009, the Group acquired 70% of the share capital of Your IFRS3p67(a)(b)(c), Insurance Group, an insurance company operating in Euravia. The acquired70(a), 67(i), 70(b) business contributed revenues of €44,709 and net profit of €2,762 to the Group for
the period from 1 March 2009 to 31 December 2009. If the acquisition had occurred on 1 January 2009, Group revenue would have been €220,345, and profit before allocations would have been €33,126. Details of net assets acquired and goodwill are as follows:
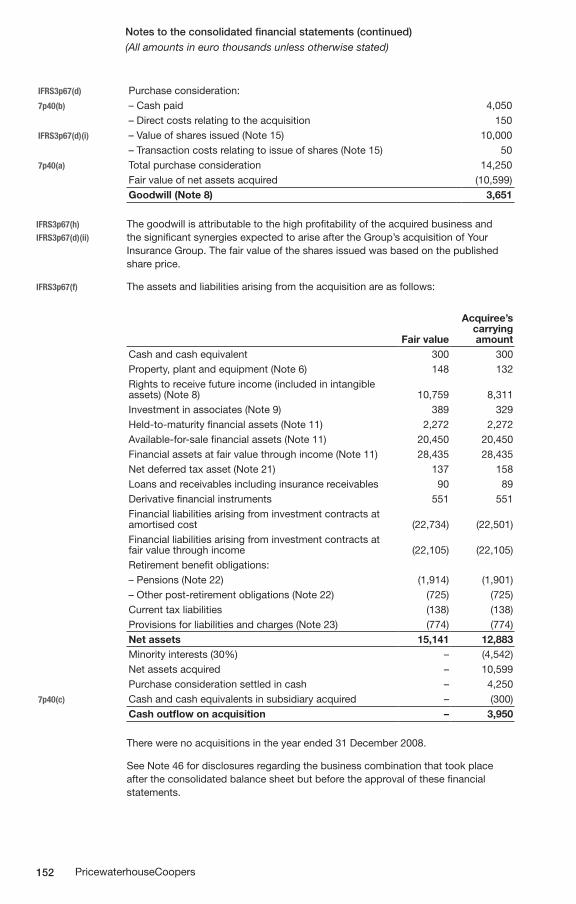
152 PricewaterhouseCoopers
Notes to the consolidated financial statements (continued)(All amounts in euro thousands unless otherwise stated)
IFRS3p67(d) Purchase consideration:7p40(b) – Cash paid 4,050
– Direct costs relating to the acquisition 150IFRS3p67(d)(i) – Value of shares issued (Note 15) 10,000
– Transaction costs relating to issue of shares (Note 15) 507p40(a) Total purchase consideration 14,250
Fair value of net assets acquired (10,599)Goodwill (Note 8) 3,651
IFRS3p67(h) The goodwill is attributable to the high profitability of the acquired business andIFRS3p67(d)(ii) the significant synergies expected to arise after the Group’s acquisition of Your
Insurance Group. The fair value of the shares issued was based on the published share price.
IFRS3p67(f) The assets and liabilities arising from the acquisition are as follows:
Fair value
Acquiree’s carrying amount
Cash and cash equivalent 300 300Property, plant and equipment (Note 6) 148 132Rights to receive future income (included in intangible assets) (Note 8) 10,759 8,311Investment in associates (Note 9) 389 329Held-to-maturity financial assets (Note 11) 2,272 2,272Available-for-sale financial assets (Note 11) 20,450 20,450Financial assets at fair value through income (Note 11) 28,435 28,435Net deferred tax asset (Note 21) 137 158Loans and receivables including insurance receivables 90 89Derivative financial instruments 551 551Financial liabilities arising from investment contracts at amortised cost (22,734) (22,501)Financial liabilities arising from investment contracts at fair value through income (22,105) (22,105)Retirement benefit obligations:– Pensions (Note 22) (1,914) (1,901)– Other post-retirement obligations (Note 22) (725) (725)Current tax liabilities (138) (138)Provisions for liabilities and charges (Note 23) (774) (774)Net assets 15,141 12,883Minority interests (30%) – (4,542)Net assets acquired – 10,599Purchase consideration settled in cash – 4,250
7p40(c) Cash and cash equivalents in subsidiary acquired – (300)Cash outflow on acquisition – 3,950
There were no acquisitions in the year ended 31 December 2008.
See Note 46 for disclosures regarding the business combination that took place after the consolidated balance sheet but before the approval of these financial statements.
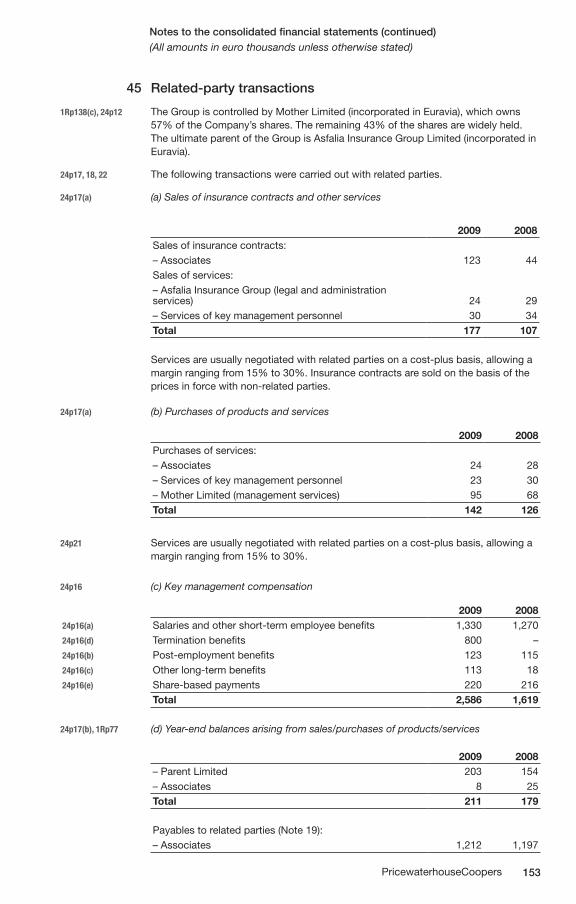
153PricewaterhouseCoopers
Notes to the consolidated financial statements (continued)(All amounts in euro thousands unless otherwise stated)
45 Related-party transactions
1Rp138(c), 24p12 The Group is controlled by Mother Limited (incorporated in Euravia), which owns 57% of the Company’s shares. The remaining 43% of the shares are widely held. The ultimate parent of the Group is Asfalia Insurance Group Limited (incorporated in Euravia).
24p17, 18, 22 The following transactions were carried out with related parties.
24p17(a) (a) Sales of insurance contracts and other services
2009 2008Sales of insurance contracts:– Associates 123 44Sales of services:– Asfalia Insurance Group (legal and administration services) 24 29– Services of key management personnel 30 34Total 177 107
Services are usually negotiated with related parties on a cost-plus basis, allowing a margin ranging from 15% to 30%. Insurance contracts are sold on the basis of the prices in force with non-related parties.
24p17(a) (b) Purchases of products and services
2009 2008Purchases of services:– Associates 24 28– Services of key management personnel 23 30– Mother Limited (management services) 95 68Total 142 126
24p21 Services are usually negotiated with related parties on a cost-plus basis, allowing a margin ranging from 15% to 30%.
24p16 (c) Key management compensation
2009 200824p16(a) Salaries and other short-term employee benefits 1,330 1,27024p16(d) Termination benefits 800 –24p16(b) Post-employment benefits 123 11524p16(c) Other long-term benefits 113 1824p16(e) Share-based payments 220 216
Total 2,586 1,619
24p17(b), 1Rp77 (d) Year-end balances arising from sales/purchases of products/services
2009 2008– Parent Limited 203 154– Associates 8 25Total 211 179
Payables to related parties (Note 19):– Associates 1,212 1,197
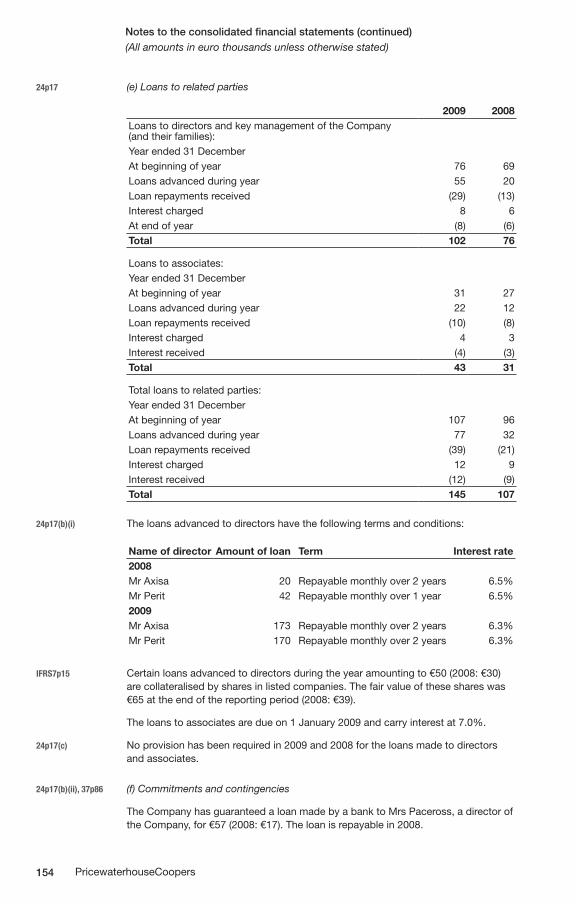
154 PricewaterhouseCoopers
Notes to the consolidated financial statements (continued)(All amounts in euro thousands unless otherwise stated)
24p17 (e) Loans to related parties
2009 2008Loans to directors and key management of the Company (and their families):Year ended 31 DecemberAt beginning of year 76 69Loans advanced during year 55 20Loan repayments received (29) (13)Interest charged 8 6At end of year (8) (6)Total 102 76
Loans to associates:Year ended 31 DecemberAt beginning of year 31 27Loans advanced during year 22 12Loan repayments received (10) (8)Interest charged 4 3Interest received (4) (3)Total 43 31
Total loans to related parties:Year ended 31 DecemberAt beginning of year 107 96Loans advanced during year 77 32Loan repayments received (39) (21)Interest charged 12 9Interest received (12) (9)Total 145 107
24p17(b)(i) The loans advanced to directors have the following terms and conditions:
Name of director Amount of loan Term Interest rate2008Mr Axisa 20 Repayable monthly over 2 years 6.5%Mr Perit 42 Repayable monthly over 1 year 6.5%2009Mr Axisa 173 Repayable monthly over 2 years 6.3% Mr Perit 170 Repayable monthly over 2 years 6.3%
IFRS7p15 Certain loans advanced to directors during the year amounting to €50 (2008: €30) are collateralised by shares in listed companies. The fair value of these shares was €65 at the end of the reporting period (2008: €39).
The loans to associates are due on 1 January 2009 and carry interest at 7.0%.
24p17(c) No provision has been required in 2009 and 2008 for the loans made to directors and associates.
24p17(b)(ii), 37p86 (f) Commitments and contingencies
The Company has guaranteed a loan made by a bank to Mrs Paceross, a director of the Company, for €57 (2008: €17). The loan is repayable in 2008.
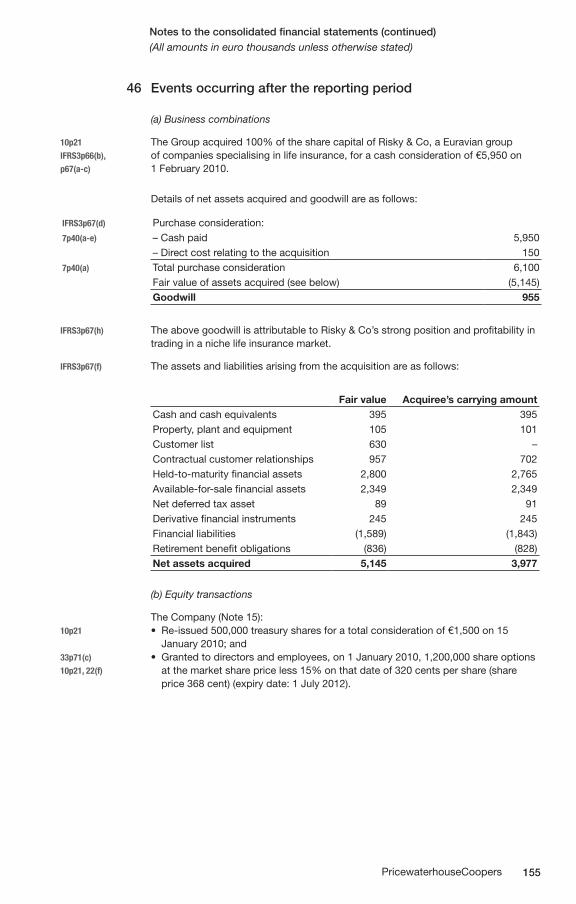
155PricewaterhouseCoopers
Notes to the consolidated financial statements (continued)(All amounts in euro thousands unless otherwise stated)
46 Events occurring after the reporting period
(a) Business combinations
10p21 The Group acquired 100% of the share capital of Risky & Co, a Euravian group IFRS3p66(b), of companies specialising in life insurance, for a cash consideration of €5,950 on p67(a-c) 1 February 2010.
Details of net assets acquired and goodwill are as follows:
IFRS3p67(d) Purchase consideration:7p40(a-e) – Cash paid 5,950
– Direct cost relating to the acquisition 1507p40(a) Total purchase consideration 6,100
Fair value of assets acquired (see below) (5,145)Goodwill 955
IFRS3p67(h) The above goodwill is attributable to Risky & Co’s strong position and profitability in trading in a niche life insurance market.
IFRS3p67(f) The assets and liabilities arising from the acquisition are as follows:
Fair value Acquiree’s carrying amountCash and cash equivalents 395 395Property, plant and equipment 105 101Customer list 630 –Contractual customer relationships 957 702Held-to-maturity financial assets 2,800 2,765Available-for-sale financial assets 2,349 2,349Net deferred tax asset 89 91Derivative financial instruments 245 245Financial liabilities (1,589) (1,843)Retirement benefit obligations (836) (828)Net assets acquired 5,145 3,977
(b) Equity transactions
The Company (Note 15):10p21 • Re-issued500,000treasurysharesforatotalconsiderationof€1,500on15 January 2010; and33p71(c) • Grantedtodirectorsandemployees,on1January2010,1,200,000shareoptions10p21, 22(f) at the market share price less 15% on that date of 320 cents per share (share
price 368 cent) (expiry date: 1 July 2012).
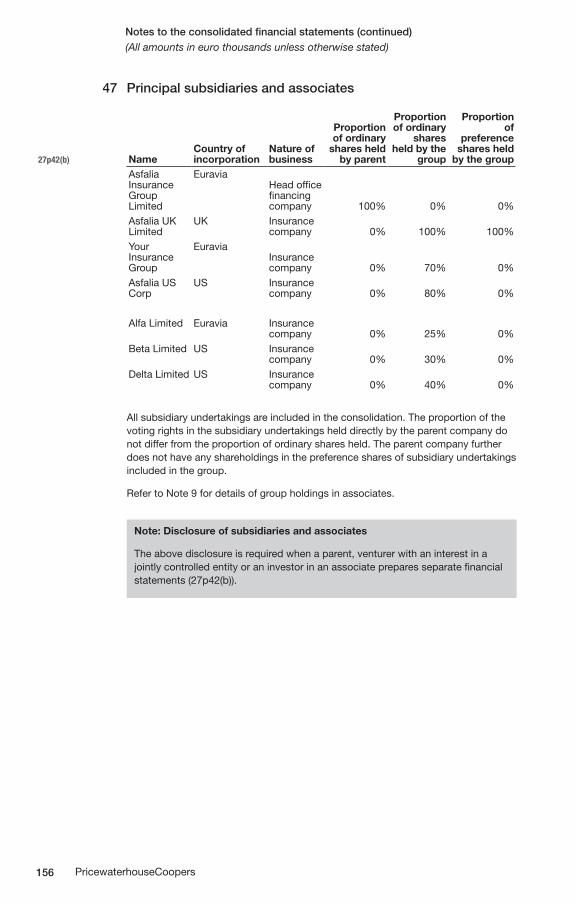
156 PricewaterhouseCoopers
Notes to the consolidated financial statements (continued)(All amounts in euro thousands unless otherwise stated)
47 Principal subsidiaries and associates
27p42(b) NameCountry of incorporation
Nature of business
Proportion of ordinary
shares held by parent
Proportion of ordinary
shares held by the
group
Proportion of
preference shares held
by the group
Asfalia Insurance Group Limited
EuraviaHead office financing company 100% 0% 0%
Asfalia UK Limited
UK Insurance company 0% 100% 100%
Your Insurance Group
EuraviaInsurance company 0% 70% 0%
Asfalia US Corp
US Insurance company 0% 80% 0%
Alfa Limited Euravia Insurance
company 0% 25% 0%
Beta Limited US Insurance
company 0% 30% 0%
Delta Limited US Insurance
company 0% 40% 0%
All subsidiary undertakings are included in the consolidation. The proportion of the voting rights in the subsidiary undertakings held directly by the parent company do not differ from the proportion of ordinary shares held. The parent company further does not have any shareholdings in the preference shares of subsidiary undertakings included in the group.
Refer to Note 9 for details of group holdings in associates.
Note: Disclosure of subsidiaries and associates
The above disclosure is required when a parent, venturer with an interest in a jointly controlled entity or an investor in an associate prepares separate financial statements (27p42(b)).
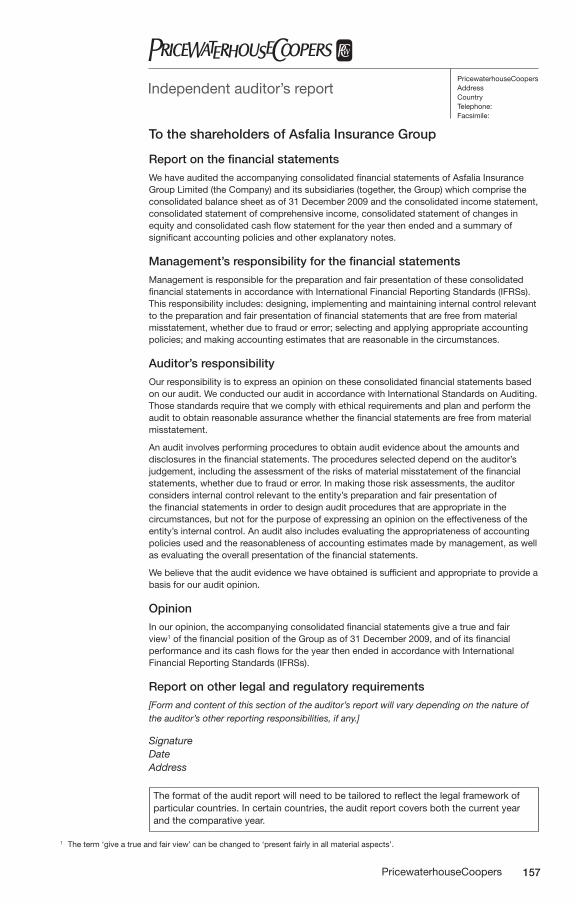
157PricewaterhouseCoopers
Independent auditor’s report
To the shareholders of Asfalia Insurance Group
Report on the financial statements
We have audited the accompanying consolidated financial statements of Asfalia Insurance Group Limited (the Company) and its subsidiaries (together, the Group) which comprise the consolidated balance sheet as of 31 December 2009 and the consolidated income statement, consolidated statement of comprehensive income, consolidated statement of changes in equity and consolidated cash flow statement for the year then ended and a summary of significant accounting policies and other explanatory notes.
Management’s responsibility for the financial statements
Management is responsible for the preparation and fair presentation of these consolidated financial statements in accordance with International Financial Reporting Standards (IFRSs). This responsibility includes: designing, implementing and maintaining internal control relevant to the preparation and fair presentation of financial statements that are free from material misstatement, whether due to fraud or error; selecting and applying appropriate accounting policies; and making accounting estimates that are reasonable in the circumstances.
Auditor’s responsibility
Our responsibility is to express an opinion on these consolidated financial statements based on our audit. We conducted our audit in accordance with International Standards on Auditing. Those standards require that we comply with ethical requirements and plan and perform the audit to obtain reasonable assurance whether the financial statements are free from material misstatement.
An audit involves performing procedures to obtain audit evidence about the amounts and disclosures in the financial statements. The procedures selected depend on the auditor’s judgement, including the assessment of the risks of material misstatement of the financial statements, whether due to fraud or error. In making those risk assessments, the auditor considers internal control relevant to the entity’s preparation and fair presentation of the financial statements in order to design audit procedures that are appropriate in the circumstances, but not for the purpose of expressing an opinion on the effectiveness of the entity’s internal control. An audit also includes evaluating the appropriateness of accounting policies used and the reasonableness of accounting estimates made by management, as well as evaluating the overall presentation of the financial statements.
We believe that the audit evidence we have obtained is sufficient and appropriate to provide a basis for our audit opinion.
Opinion
In our opinion, the accompanying consolidated financial statements give a true and fair view1 of the financial position of the Group as of 31 December 2009, and of its financial performance and its cash flows for the year then ended in accordance with International Financial Reporting Standards (IFRSs).
Report on other legal and regulatory requirements
[Form and content of this section of the auditor’s report will vary depending on the nature of the auditor’s other reporting responsibilities, if any.]
SignatureDateAddress
The format of the audit report will need to be tailored to reflect the legal framework of particular countries. In certain countries, the audit report covers both the current year and the comparative year.
PricewaterhouseCoopersAddressCountryTelephone:Facsimile:
1 The term ‘give a true and fair view’ can be changed to ‘present fairly in all material aspects’.
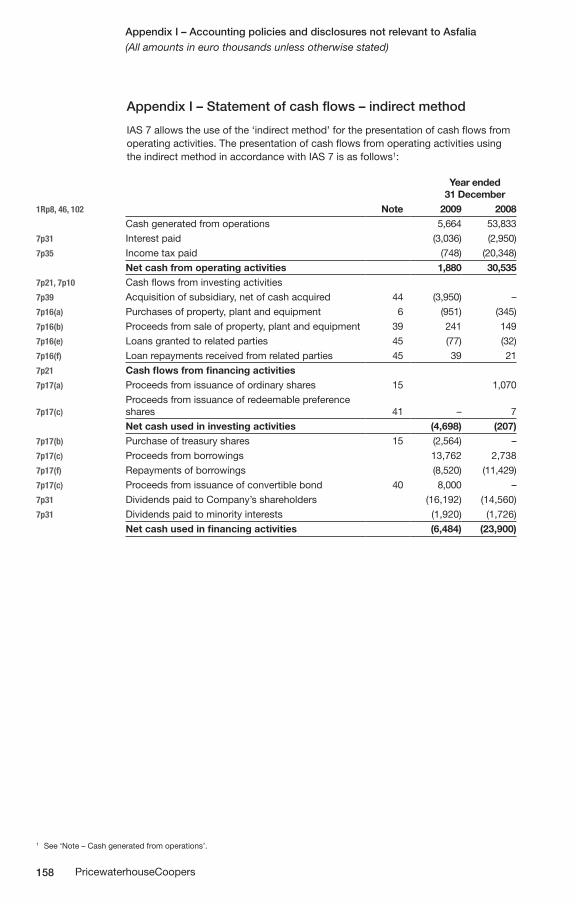
158 PricewaterhouseCoopers
Appendix I – Statement of cash flows – indirect method
IAS 7 allows the use of the ‘indirect method’ for the presentation of cash flows from operating activities. The presentation of cash flows from operating activities using the indirect method in accordance with IAS 7 is as follows1:
Year ended 31 December
1Rp8, 46, 102 Note 2009 2008Cash generated from operations 5,664 53,833
7p31 Interest paid (3,036) (2,950)
7p35 Income tax paid (748) (20,348)
Net cash from operating activities 1,880 30,5357p21, 7p10 Cash flows from investing activities
7p39 Acquisition of subsidiary, net of cash acquired 44 (3,950) –
7p16(a) Purchases of property, plant and equipment 6 (951) (345)
7p16(b) Proceeds from sale of property, plant and equipment 39 241 149
7p16(e) Loans granted to related parties 45 (77) (32)
7p16(f) Loan repayments received from related parties 45 39 21
7p21 Cash flows from financing activities7p17(a) Proceeds from issuance of ordinary shares 15 1,070
7p17(c)Proceeds from issuance of redeemable preference shares 41 – 7
Net cash used in investing activities (4,698) (207)7p17(b) Purchase of treasury shares 15 (2,564) –
7p17(c) Proceeds from borrowings 13,762 2,738
7p17(f) Repayments of borrowings (8,520) (11,429)
7p17(c) Proceeds from issuance of convertible bond 40 8,000 –
7p31 Dividends paid to Company’s shareholders (16,192) (14,560)
7p31 Dividends paid to minority interests (1,920) (1,726)
Net cash used in financing activities (6,484) (23,900)
Appendix I – Accounting policies and disclosures not relevant to Asfalia(All amounts in euro thousands unless otherwise stated)
1 See ‘Note – Cash generated from operations’.
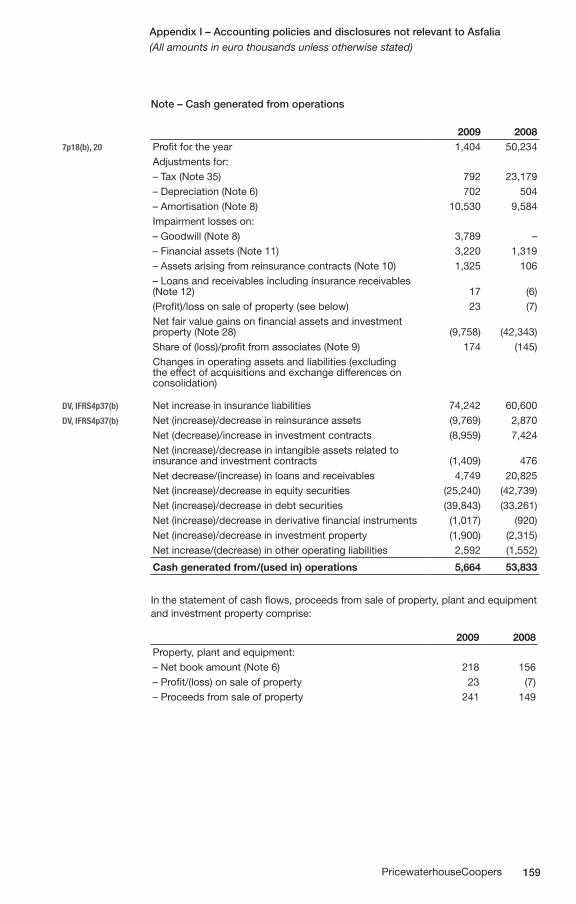
159PricewaterhouseCoopers
Note – Cash generated from operations
2009 20087p18(b), 20 Profit for the year 1,404 50,234
Adjustments for:– Tax (Note 35) 792 23,179– Depreciation (Note 6) 702 504– Amortisation (Note 8) 10,530 9,584Impairment losses on:– Goodwill (Note 8) 3,789 –– Financial assets (Note 11) 3,220 1,319– Assets arising from reinsurance contracts (Note 10) 1,325 106– Loans and receivables including insurance receivables (Note 12) 17 (6)(Profit)/loss on sale of property (see below) 23 (7)Net fair value gains on financial assets and investment property (Note 28) (9,758) (42,343)Share of (loss)/profit from associates (Note 9) 174 (145)Changes in operating assets and liabilities (excluding the effect of acquisitions and exchange differences on consolidation)
DV, IFRS4p37(b) Net increase in insurance liabilities 74,242 60,600DV, IFRS4p37(b) Net (increase)/decrease in reinsurance assets (9,769) 2,870
Net (decrease)/increase in investment contracts (8,959) 7,424Net (increase)/decrease in intangible assets related to insurance and investment contracts (1,409) 476Net decrease/(increase) in loans and receivables 4,749 20,825Net (increase)/decrease in equity securities (25,240) (42,739)Net (increase)/decrease in debt securities (39,843) (33,261)Net (increase)/decrease in derivative financial instruments (1,017) (920)Net (increase)/decrease in investment property (1,900) (2,315)Net increase/(decrease) in other operating liabilities 2,592 (1,552)
Cash generated from/(used in) operations 5,664 53,833
In the statement of cash flows, proceeds from sale of property, plant and equipment and investment property comprise:
2009 2008Property, plant and equipment:– Net book amount (Note 6) 218 156– Profit/(loss) on sale of property 23 (7)– Proceeds from sale of property 241 149
Appendix I – Accounting policies and disclosures not relevant to Asfalia(All amounts in euro thousands unless otherwise stated)
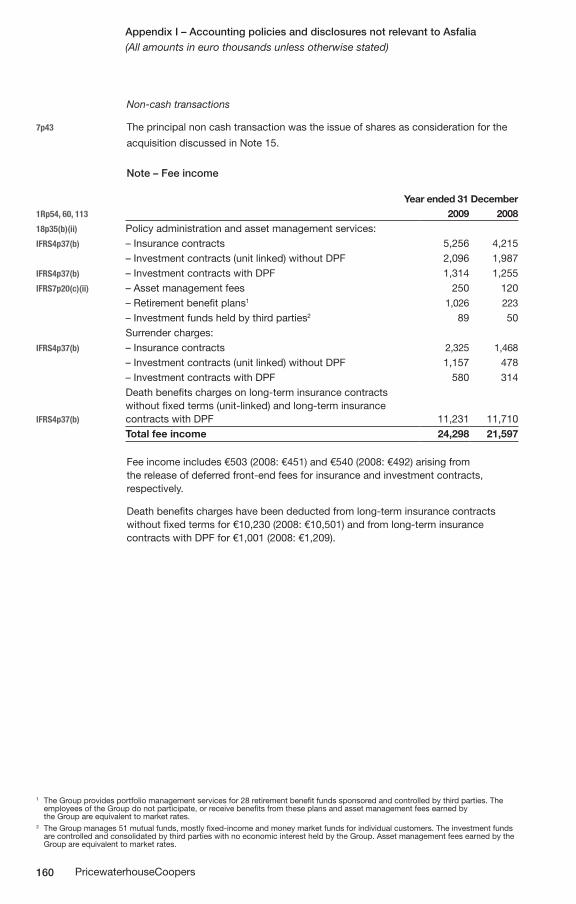
160 PricewaterhouseCoopers
Appendix I – Accounting policies and disclosures not relevant to Asfalia(All amounts in euro thousands unless otherwise stated)
Non-cash transactions
7p43 The principal non cash transaction was the issue of shares as consideration for the
acquisition discussed in Note 15.
Note – Fee income
Year ended 31 December1Rp54, 60, 113 2009 2008
18p35(b)(ii) Policy administration and asset management services:IFRS4p37(b) – Insurance contracts 5,256 4,215
– Investment contracts (unit linked) without DPF 2,096 1,987IFRS4p37(b) – Investment contracts with DPF 1,314 1,255IFRS7p20(c)(ii) – Asset management fees 250 120
– Retirement benefit plans1 1,026 223
– Investment funds held by third parties2 89 50Surrender charges:
IFRS4p37(b) – Insurance contracts 2,325 1,468
– Investment contracts (unit linked) without DPF 1,157 478– Investment contracts with DPF 580 314
IFRS4p37(b)
Death benefits charges on long-term insurance contracts without fixed terms (unit-linked) and long-term insurance contracts with DPF 11,231 11,710Total fee income 24,298 21,597
Fee income includes €503 (2008: €451) and €540 (2008: €492) arising from the release of deferred front-end fees for insurance and investment contracts, respectively.
Death benefits charges have been deducted from long-term insurance contracts without fixed terms for €10,230 (2008: €10,501) and from long-term insurance contracts with DPF for €1,001 (2008: €1,209).
1 The Group provides portfolio management services for 28 retirement benefit funds sponsored and controlled by third parties. The employees of the Group do not participate, or receive benefits from these plans and asset management fees earned by the Group are equivalent to market rates.2 The Group manages 51 mutual funds, mostly fixed-income and money market funds for individual customers. The investment funds are controlled and consolidated by third parties with no economic interest held by the Group. Asset management fees earned by the Group are equivalent to market rates.
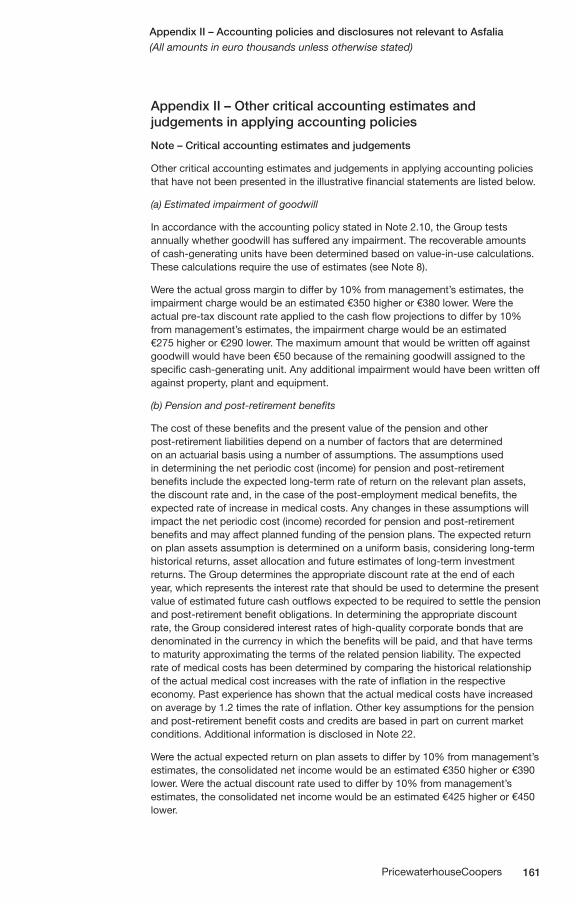
161PricewaterhouseCoopers
Appendix II – Other critical accounting estimates and judgements in applying accounting policies
Note – Critical accounting estimates and judgements
Other critical accounting estimates and judgements in applying accounting policies that have not been presented in the illustrative financial statements are listed below.
(a) Estimated impairment of goodwill
In accordance with the accounting policy stated in Note 2.10, the Group tests annually whether goodwill has suffered any impairment. The recoverable amounts of cash-generating units have been determined based on value-in-use calculations. These calculations require the use of estimates (see Note 8).
Were the actual gross margin to differ by 10% from management’s estimates, the impairment charge would be an estimated €350 higher or €380 lower. Were the actual pre-tax discount rate applied to the cash flow projections to differ by 10% from management’s estimates, the impairment charge would be an estimated €275 higher or €290 lower. The maximum amount that would be written off against goodwill would have been €50 because of the remaining goodwill assigned to the specific cash-generating unit. Any additional impairment would have been written off against property, plant and equipment.
(b) Pension and post-retirement benefits
The cost of these benefits and the present value of the pension and other post-retirement liabilities depend on a number of factors that are determined on an actuarial basis using a number of assumptions. The assumptions used in determining the net periodic cost (income) for pension and post-retirement benefits include the expected long-term rate of return on the relevant plan assets, the discount rate and, in the case of the post-employment medical benefits, the expected rate of increase in medical costs. Any changes in these assumptions will impact the net periodic cost (income) recorded for pension and post-retirement benefits and may affect planned funding of the pension plans. The expected return on plan assets assumption is determined on a uniform basis, considering long-term historical returns, asset allocation and future estimates of long-term investment returns. The Group determines the appropriate discount rate at the end of each year, which represents the interest rate that should be used to determine the present value of estimated future cash outflows expected to be required to settle the pension and post-retirement benefit obligations. In determining the appropriate discount rate, the Group considered interest rates of high-quality corporate bonds that are denominated in the currency in which the benefits will be paid, and that have terms to maturity approximating the terms of the related pension liability. The expected rate of medical costs has been determined by comparing the historical relationship of the actual medical cost increases with the rate of inflation in the respective economy. Past experience has shown that the actual medical costs have increased on average by 1.2 times the rate of inflation. Other key assumptions for the pension and post-retirement benefit costs and credits are based in part on current market conditions. Additional information is disclosed in Note 22.
Were the actual expected return on plan assets to differ by 10% from management’s estimates, the consolidated net income would be an estimated €350 higher or €390 lower. Were the actual discount rate used to differ by 10% from management’s estimates, the consolidated net income would be an estimated €425 higher or €450 lower.
Appendix II – Accounting policies and disclosures not relevant to Asfalia(All amounts in euro thousands unless otherwise stated)
162 PricewaterhouseCoopers
Appendix(All amounts in euro thousands unless otherwise stated)
Illustrative IFRS consolidated financial statements 2009 – Insurance is designed for the information of readers. While every effort has been made to ensure accuracy, information contained in this publication may not be comprehensive or some information may have been omitted that may be relevant to a particular reader. This publication is not intended as a study of all aspects of IFRS or as a substitute for reading the actual standards and interpretations when dealing with specific issues. No responsibility for loss to any person acting or refraining from acting as a result of any material in this publication can be accepted by PricewaterhouseCoopers. Recipients should not act on the basis of this publication without seeking professional advice.

163PricewaterhouseCoopers

164 PricewaterhouseCoopers