Illustrated Properties - Simply Waterfront · Illustrated Properties is a legend in the Florida...
9
Illustrated Properties Luxury Market Report With Illustrated Properties, you get: hometown savvy regional influence, and world-class reach. WHO WE ARE For over 90 years Illustrated Properties and our network of companies have been exceeding the real estate needs of astute buyers and sellers in South Florida. The largest family-owned brokerage network exceeds $6 Billion in annual sales volume throughout our network of 3,000+ Realtors®. As a founding member of Leading Real Estate Companies of the World® and Luxury Portfolio International™ our reach spans the globe. Illustrated Properties is a legend in the Florida real estate market. Let our unmatched experience and knowledge work for you. Your quarterly snapshot of the South Florida housing market: • South Florida • Palm Beach County • Martin County • Boca Raton/Delray Beach • West Palm Beach • Wellington • PBG/North Palm Beach • Jupiter ipre.com
Transcript of Illustrated Properties - Simply Waterfront · Illustrated Properties is a legend in the Florida...

Illustrated Properties Luxury Market Report
With Illustrated Properties, you get: hometown savvy regional influence, and world-class reach.
WHOWEARE
For over 90 years Illustrated Properties and our network of companies have been exceeding the real estate needs of astute buyers and sellers in South Florida. The largest family-owned brokerage network exceeds $6 Billion in annual sales volume throughout our network of 3,000+ Realtors®.
As a founding member of Leading Real Estate Companies of the World® and Luxury Portfolio International™ our reach spans the globe.
Illustrated Properties is a legend in the Florida real estate market. Let our unmatched experience and knowledge work for you.
Your quarterly snapshot of the South Floridahousing market:
• South Florida
• Palm Beach County
• Martin County
• Boca Raton/Delray Beach
• West Palm Beach
• Wellington
• PBG/North Palm Beach
• Jupiter
ip re .com

YOUR 2019 Q1 SUMMARY
South Florida
Luxury sales began 2019 on a cool note in South Florida, and it is anticipated that sales will be lower thisyear compared to a hot 2018 market. That does not mean that it will be a down year for residential real
estate in the region. Prices have not faltered, and buyer interest is healthy within a strong economy.
Total sales were down 14.8 percent for single-family residential homes and 10.7 percent for condos /townhomes this quarter. Median sales prices remained higher – up 1.5 percent for single-family homes and 8.1 percent for condos / townhomes – largely due to a competitive marketplace.
Luxury sales were down in Q1 2019 compared to Q1 2018 for the SouthFlorida housing market. Prices were up, but there may be a shift this yearif sales continue to drop.
THETOP
SALE$25.0 MILLION
YOUR Q1TAKEAWAYS:
A 7-bedroom, 7.1-bathroomsingle-family home located at 23 Star Island Drive in Miami Beach includes approximately 10,000 square feet of living space on a 1.85-acre estate on the prestigious Star Island. Built in 1973, this was the property’s first time on the market in 44 years.
Q1 AT A GLANCE: SINGLE FAMILY
Q1 AT A GLANCE: CONDO/TOWNHOME
Single-Family Residential Q1 2018 Q1 2019 %Change
Condo/Townhome Q1 2018 Q1 2019 %Change
Number of Sales 771 657 -14.8%Average Sales Price $2,529,805 $2,497,206 -1.3%Median Sales Price $1,650,000 $1,675,000 +1.5%Average Square Footage 4,366 4,578 +4.9%Price Per Square Foot $544 $529 -2.8%
Number of Sales 392 350 -10.7%Average Sales Price $2,103,443 $2,484,215 +18.1%Median Sales Price $1,475,000 $1,593,750 +8.1%Average Square Footage 2,542 2,763 +8.7%Price Per Square Foot $803 $827 +3.0%
ip re .com
▼▼▲▲▼
▼▲▲▲▲
Figures exclusively represent sales of $1 million or more.

Palm Beach County
Total sales across all home types were lower in the Palm Beach County luxury market in Q1 2019,but the Condo / Townhome category had a 2.9 percent increase. Median sales prices and average
square footage were up for both single-family residential homes and condos / townhomes.
While single-family residential housing metrics were mixed in Palm Beach County this quarter, all condo / townhome metrics were up, punctuated by a 42.2 percent increase in average sales price and 14.5 percent increase in price per square foot.
The Palm Beach County luxury housing market began the year witha sales decline of single-family residential homes, but the condo /townhome market remains in healthy balance.
THETOP
SALE$24.6 MILLION
YOUR Q1TAKEAWAYS:
A new 2019 condo located at 1100 South Flagler Drive, 24S, in West Palm Beach contains 4 bedrooms and 5.1 bathrooms within more than 8,000 square feet of living space. The home includes floor-toceiling glass, expansive balconies, and unobstructed ocean and Intracoastal views.
Q1 AT A GLANCE: SINGLE FAMILY
Q1 AT A GLANCE: CONDO/TOWNHOME
Single-Family Residential Q1 2018 Q1 2019 %Change
Condo/Townhome Q1 2018 Q1 2019 %Change
Number of Sales 345 274 -20.6%Average Sales Price $3,014,863 $2,727,399 -9.5%Median Sales Price $1,800,000 $1,851,100 +2.8%Average Square Footage 4,661 4,725 +1.4%Price Per Square Foot $602 $574 -4.7%
Number of Sales 103 106 +2.9%Average Sales Price $1,862,309 $2,648,962 +42.2%Median Sales Price $1,475,000 $1,550,000 +5.1%Average Square Footage 2,680 3,007 +12.2%Price Per Square Foot $683 $782 +14.5%
ip re .com
▲▲▲▲▲
▼▼▲▲▼
YOUR 2019 Q1 SUMMARYFigures exclusively represent sales of $1 million or more.

Martin County
The Martin County luxury residential real estate market performed well in Q1 2019, showing a 10.7sales increase in single-family residential homes compared to Q1 2018 and a 17.8 percent median
sales price increase that landed at $2 million.
With three more sales than last year at this time, luxury housing activity in Martin County began 2019 in good shape. Other metrics reflected higher prices being paid for moderately smaller homes.
Higher sales totals and prices are an impressive way to begin 2019 in the Martin County luxury housing market.
THETOP
SALE$9.6 MILLION
YOUR Q1TAKEAWAYS:
An oceanfront estate built in1962 at 489 South Beach Road in Hobe Sound boasts breathtaking views and retreat-like amenities with 6 bedrooms and 6.1 bathrooms within more than 7,000 square feet of living space surrounded by an immaculate tropical landscape.
Q1 AT A GLANCE: SINGLE FAMILYSingle-Family Residential Q1 2018 Q1 2019 %Change
Number of Sales 28 31 +10.7%Average Sales Price $2,081,589 $2,607,339 +25.3%Median Sales Price $1,697,500 $2,000,000 +17.8%Average Square Footage 4,856 4,791 -1.3%Price Per Square Foot $436 $537 +23.2%
ip re .com
▲▲▲▼▲
YOUR 2019 Q1 SUMMARYFigures exclusively represent sales of $1 million or more.

Boca Raton/Delray Beach
The condo / townhome side of the Boca Raton / Delray Beach luxury market had an outstanding Q12019 in terms of year-over-year home sales, size and price increases. The single-family residential
side of the market had mixed results but did show a 3.2 percent median sales price increase.
The Boca Raton / Delray Beach luxury market completed 2018 with more overall sales than 2017 and may very well do the same this year, but as with much of the rest of South Florida, Q1 2019provided a slow start. Price increases, however, show no sign of abating.
Luxury sales in Boca Raton / Delray Beach were down for single-familyresidential homes but up for condos / townhomes. Increased prices show that the region is still a hotbed of buyer demand.
THETOP
SALE$16.5 MILLION
YOUR Q1TAKEAWAYS:
An Intracoastal estate at 250 NE 5th Avenue in Boca Raton built in 2008 includes 7 bedrooms and 8.2 bathrooms within more than 10,000 square feet of living space. The British West Indies-inspired masterpiece invokes tropical island living. Includes multi-yacht dockage and no-wake frontage.
Q1 AT A GLANCE: SINGLE FAMILY
Q1 AT A GLANCE: CONDO/TOWNHOME
Single-Family Residential Q1 2018 Q1 2019 %Change
Condo/Townhome Q1 2018 Q1 2019 %Change
Number of Sales 124 109 -12.1%Average Sales Price $2,553,369 $2,511,369 -1.6%Median Sales Price $1,575,000 $1,625,000 +3.2%Average Square Footage 4,911 4,803 -2.2%Price Per Square Foot $490 $496 +1.2%
Number of Sales 33 36 +9.1%Average Sales Price $1,467,433 $2,134,665 +45.5%Median Sales Price $1,295,000 $1,650,000 +27.4%Average Square Footage 2,762 3,083 +11.6%Price Per Square Foot $539 $659 +22.3%
ip re .com
▲▲▲▲▲
▼▼▲▼▲
YOUR 2019 Q1 SUMMARYFigures exclusively represent sales of $1 million or more.

West Palm Beach
The West Palm Beach luxury housing market was mixed to begin 2019. Single-family residential saleswere down by 36.0 percent but increased by 125.0 percent for condos / townhomes. The median salesprice was up by 9.0 percent for single-family homes but down 11.3 percent for condos / townhomes.
The West Palm Beach luxury housing market is still fairly balanced, but further declines in sales could turn favor toward the buyer.
Q1 AT A GLANCE: SINGLE FAMILY
Q1 AT A GLANCE: CONDO/TOWNHOME
Single-Family Residential Q1 2018 Q1 2019 %Change
Condo/Townhome Q1 2018 Q1 2019 %Change
Number of Sales 25 16 -36.0%Average Sales Price $1,722,965 $1,835,125 +6.5%Median Sales Price $1,450,000 $1,580,000 +9.0%Average Square Footage 4,090 4,144 +1.3%Price Per Square Foot $436 $436 0.0%
Number of Sales 4 9 +125.0%Average Sales Price $3,431,250 $9,195,203 +168.0%Median Sales Price $3,512,500 $3,116,000 -11.3%Average Square Footage 4,555 5,168 +13.5%Price Per Square Foot $719 $1,433 +99.3%
ip re .com
▼▲▲▲
▲▲▼▲▲
The West Palm Beach luxury market had four fewer sales in Q1 2019 compared to Q1 2018. Although condo / townhome sales performed admirably, there were fewer single-family residential sales. Lower sales totals were both a regional and national trend to begin the year.
THETOP
SALE$24.6 MILLION
YOUR Q1TAKEAWAYS:
A new 2019 condo located at 1100 South Flagler Drive, 24S, in West Palm Beach contains 4 bedrooms and 5.1 bathrooms within more than 8,000 square feet of living space. The home includes floor-to-ceiling glass, expansive balconies, and unobstructed ocean and Intracoastal views.
YOUR 2019 Q1 SUMMARYFigures exclusively represent sales of $1 million or more.
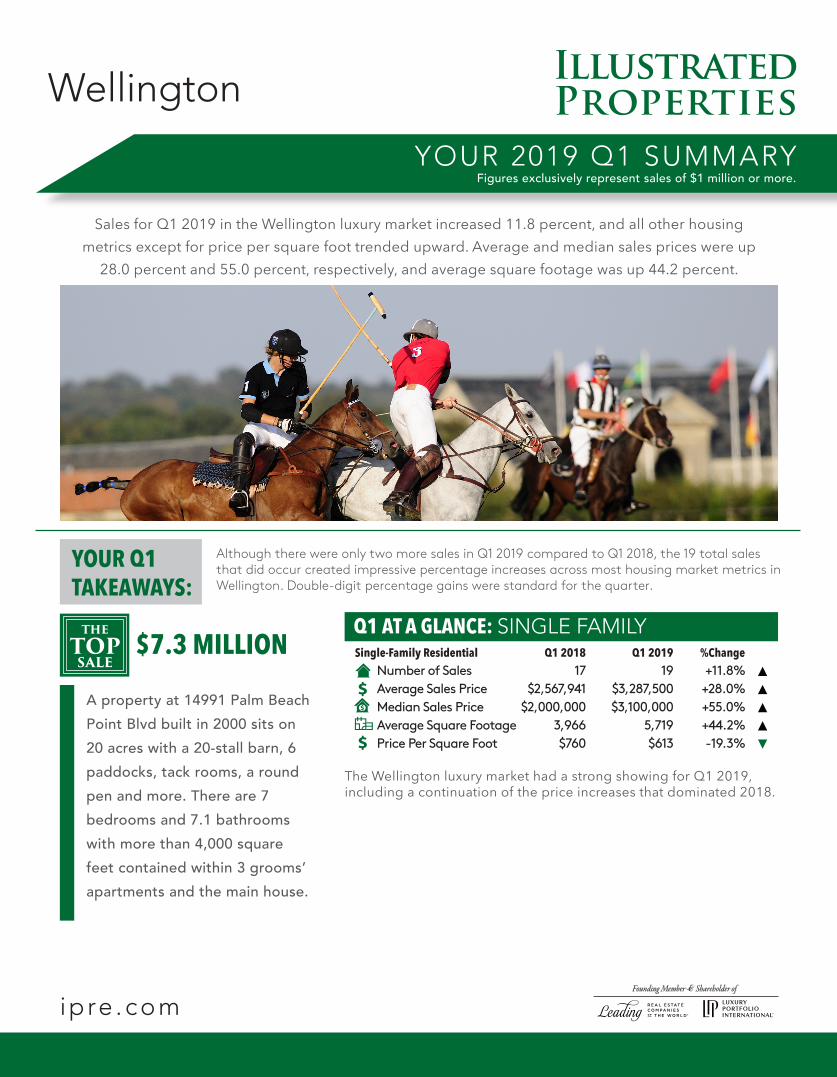
Wellington
Sales for Q1 2019 in the Wellington luxury market increased 11.8 percent, and all other housingmetrics except for price per square foot trended upward. Average and median sales prices were up
28.0 percent and 55.0 percent, respectively, and average square footage was up 44.2 percent.
The Wellington luxury market had a strong showing for Q1 2019, including a continuation of the price increases that dominated 2018.
Q1 AT A GLANCE: SINGLE FAMILYSingle-Family Residential Q1 2018 Q1 2019 %Change
Number of Sales 17 19 +11.8%Average Sales Price $2,567,941 $3,287,500 +28.0%Median Sales Price $2,000,000 $3,100,000 +55.0%Average Square Footage 3,966 5,719 +44.2%Price Per Square Foot $760 $613 -19.3%
ip re .com
▲▲▲▲▼
Although there were only two more sales in Q1 2019 compared to Q1 2018, the 19 total sales that did occur created impressive percentage increases across most housing market metrics in Wellington. Double-digit percentage gains were standard for the quarter.
THETOP
SALE$7.3 MILLION
YOUR Q1TAKEAWAYS:
A property at 14991 Palm Beach Point Blvd built in 2000 sits on 20 acres with a 20-stall barn, 6 paddocks, tack rooms, a round pen and more. There are 7 bedrooms and 7.1 bathrooms with more than 4,000 square feet contained within 3 grooms’ apartments and the main house.
YOUR 2019 Q1 SUMMARYFigures exclusively represent sales of $1 million or more.

PBG/North Palm Beach
The Palm Beach Gardens / North Palm Beach luxury market had fewer sales in Q1 2019 compared to Q12018. Single-family home sales were down 18.0 percent, and condos / townhomes had a sales decrease
of 27.3 percent. Average sales prices and average square footage were up in both categories.
Overall sales were lower in the Palm Beach Garden / North Palm Beach luxury market by 12 sales.
Q1 AT A GLANCE: SINGLE FAMILY
Q1 AT A GLANCE: CONDO/TOWNHOME
Single-Family Residential Q1 2018 Q1 2019 %Change
Condo/Townhome Q1 2018 Q1 2019 %Change
Number of Sales 50 41 -18.0%Average Sales Price $2,125,360 $2,412,704 +13.5%Median Sales Price $1,725,000 $1,949,000 +13.0%Average Square Footage 4,844 5,364 +10.7%Price Per Square Foot $427 $443 +3.7%
Number of Sales 11 8 -27.3%Average Sales Price $1,712,636 $1,767,524 +3.2%Median Sales Price $1,700,000 $1,450,000 -14.7%Average Square Footage 2,600 2,624 +0.9%Price Per Square Foot $686 $671 -2.2%
ip re .com
▼▲▲▲▲
▼▲▼▲▼
The Palm Beach Gardens / North Palm Beach luxury market enjoyed a quarter with more sales and moderately higher prices. It was predicted that sales would increase in the third quarter, and they certainly did. The fourth quarter could go either way amid healthy market balance.
THETOP
SALE$6.0 MILLION
YOUR Q1TAKEAWAYS:
This golf course estate at 12411 Hautree Court in Palm Beach Gardens contains 5 bedrooms and 6.2 bathrooms in more than 11,000 square feet of living space with water views. Built in 2013, the home includes a gourmet chef’s kitchen, formal entertaining areas and a private putting green.
YOUR 2019 Q1 SUMMARYFigures exclusively represent sales of $1 million or more.

Jupiter
Condos / townhomes sold well in the Jupiter luxury housing market to begin 2019, showing a150.0 percent increase. There were just enough single-family residential sales to cause an
overall increase of two sales – 49 luxury sales in Q1 2019 compared to 47 in Q1 2018.
The Jupiter luxury market was active and fairly balanced during the first quarter of 2019. A continuation of lower prices could occur if sales begin to slow down.
Q1 AT A GLANCE: SINGLE FAMILY
Q1 AT A GLANCE: CONDO/TOWNHOME
Single-Family Residential Q1 2018 Q1 2019 %Change
Condo/Townhome Q1 2018 Q1 2019 %Change
Number of Sales 43 39 -9.3%Average Sales Price $2,628,046 $2,306,685 -12.2%Median Sales Price $2,055,000 $1,922,500 -6.4%Average Square Footage 4,894 4,258 -13.0%Price Per Square Foot $518 $534 +3.1%
Number of Sales 4 10 +150.0%Average Sales Price $1,609,250 $1,424,500 -11.5%Median Sales Price $1,515,000 $1,312,500 -13.4%Average Square Footage 2,711 2,613 -3.6%Price Per Square Foot $591 $542 -8.3%
ip re .com
▼▼▼▼▲
▲▼▼▼▼
Sales were up by six compared to last year at this time for condos / townhomes in the Jupiter luxury market but down by four for single-family homes. While that meant market balance for sales totals, median sales prices declined.
THETOP
SALE$8.0 MILLION
YOUR Q1TAKEAWAYS:
A newly renovated waterfrontestate at 482 Mariner Drivebuilt in 1999 with 5 bedroomsand 7.1 bathrooms in more than10,000 square feet of livingspace includes water views froma master sitting area and arear yard loggia among manyincredible amenities.
YOUR 2019 Q1 SUMMARYFigures exclusively represent sales of $1 million or more.