Illll'2511111'IIII' ----4I
97
,'+.i,_+ _+ AIIM _ Association for Information and Image Management ,++ _+ C_.<::> Centimeter 1 2 3 4 5 6 7 8 9 10 11 12 13 14 15 mm 1 2 3 4 5 Inches ilijl_.O +++_:+_ !_ I1.+._ Illll '2511111'----4 IIIII '_ + +'+" MRNUFI-qCTURED TO RIIII STIqNDRRDS ,4, _+_+ ,+,
Transcript of Illll'2511111'IIII' ----4I

,'+.i,_+_+ AIIM
_ Association for Information and Image Management ,++ _+C_.<::>
Centimeter1 2 3 4 5 6 7 8 9 10 11 12 13 14 15 mm
1 2 3 4 5
Inches ilijl_.O +++_:+_!_ I1.+._
Illll'2511111'----4IIIII'_
+ +'+"MRNUFI-qCTURED TO RIIII STIqNDRRDS ,4, _+_+ ,+,


.'ItUCRL-ID- 110446
s.
Fatigue and Fracture Behavior ofU-6 Wt. Pct. Nb
M. J. Strum
D. C. Freeman
J. W. Elmer
May 21, 1993
This is an informal report intended primarily for internal or limited e×ternaidistribution. The opinions and conclusions stated are those of the author and '
may or may not be those of the Laboratory.Work performed under the auspices of the U,S, Department of Energy by theLawrence Livermore National Laboratory under Contract W-7405-Eng-48.
MASTJ,

DISCLAIMER _I
Thisdocument was preparedasan accountofwork sponsoredby an agencyoftheUnitedStatesGovernment.
Neither the United States Government nor the University of California nor any of their employees, makes any _,_warranty, express or implied, or assumes any legal liability or responsibility for the accuracy, completeness,or usefulness of any informatic_n, apparatus, product, or process disclosed, or represents that its use would notinfringe privately owned rights. Reference herein to any specific commercial products, process, or service bytrade name, trademark, manufacturer, or otherwise, does not necessarily constitute or imply its endorsement,recommendation, or favoring by the United States Government or the University of California. The views andopinions of authors expressed herein do not necessarily state or reflect those of the United States Governmentor the University of California, and snail not be used for advertising or product endorsement purposes.
This report has been reproduceddirectly from the best available copy.
Available to DOE and DOE contractors from theOffice of Scientific and Technical Information
P.O. Box 62, Oak Ridge, TN 37831Prices available from (615) 576-8401, FTS 626-8401
Available to the public from theNational Technical Information Service
U.S. Department of Commerce5285 Port Royal Rd.,
Springfield, VA 22161
/!

Fatigue and Fracture Behavior of U-6 Wt. Pct. Nb
M. J. Strum, D. C. Freeman, and J. W. Elmer
Lawrence Livermore National Laboratory
Livermore, CA 94550
UCRL-ID-110446

ii
ABSTRACT
The fatigue and fracture properties of U6Nb were measured to provide the
materials property data needed for structural designs in material processed by
solution quenching and aging 200°C/2h. Limited testing was also performed on
as-quenched U6Nb. We have extended the database on fatigue properties in U6Nb
to include both crack initiation data (fatigue strengths) and crack propagation data
(fatigue crack growth rates). The static load carrying capabilities have been
characterized through fracture toughness and tensile property measurements.
Using a rotating beam fatigue machine, a fatigue strength of 248 MPa was
measured at 108 cycles for smooth bars at zero mean load. As is typical of
nonferrous alloys, U6Nb does not exhibit a fatigue endurance limit. Reductions
in fatigue strength for notched bars and for mean loads of 276 MPa (40 ksi) and 483
MPa (70 ksi) were also determined. The predominant sites for fatigue crack
initiation were identified as niobium carbide and uranium oxide inclusion
clusters and the distribution of these inclusions are presented.
' Fatigue crack propagation rates were measured in the near-threshold
regime using compact tension specimens. The fatigue threshold for crack growth
rates below 10-7 mm/cycle were measured at both R=0.1, for which a fatigue
threshold of 3.2 MPa_m--was measured, and for constant Kmax cycles with Kmax
values of 14.6 MPa_-m-and 30.5 MPa,_m, for which the fatigue threshold was
reduced to 0.9 MPa_-and 0.6 MPa_, respectively. Crack closure effects were
present in near-threshold testing for R=0.1 based upon specimen compliance data,
and an effective threshold AK was calculated as 2.1 MPa_-_-. Fatigue crack growth
rates were measured for both as-quenched and quenched plus aged (200°C/2h)
conditions, and for environments of laboratory air, dry nitrogen, and 100RH air.
- Crack branching was observed in all environments for AK's below approximately
...d
t,
iii
10 MPa_/m. Reduced crack growth rates in dry nitrogen at R=0.1 and the Kmax
dependence of near-threshold behavior in air are ascribed to environmentally-
"" assisted-fatigue.
$

iv
ACKNOWLEDGEMENTS
-_ The authors acknowledge D. Selway (LLNL), D. Wood (LLNL),, R. Riddle (LLNL),
and I. Finnie (U. C. Berkeley) for contributions in directing the scope of this work,
N. Nguyen for assistance with the DCPD system, R. Kershaw for metallographic
preparations, E. Sedillo for SEM assistance, B. Westfall for assistance with the S-N
tests, R. Oakes (Y-12) for the low temperature fracture toughness measurements,
and L. Chapman (Y-12) for statistical data on inclusion distributions in U6Nb.
.._,r

V
TABLE OF CONTENTSm .
ABSTRACT ii
ACKNOWLEDGEMENTS i v
TABLE OF CONTENTS v
INTRODUCTION 1
EXPERIMENTAL METHOD 3
Static Mechanical Behavior, 4
Fatigue Crack Initiation Testing, 5
Fatigue Crack Propagation Testing, 6
RESULTS 8
Static Mechanical Properties, 8
Fatigue Crack Initiation, 10
Fatigue Crack Propagation, 12
Crack Closure Phenomena, 13
Constant Kmax Fatigue Crack Propagation, 15
Environmental Effects, 17
Microstructural Characterization, 18
DISCUSSION 21
Static Mechanical Properties, 21
Fatigue Crack Initiation Behavior, 24
.,.q¢/"

vi
DISCUSSION (cont'd)m
Fatigue Crack Propagation, 27
"- Mean Loading Effects, 27
Environmental Effects, 28
Fatigue Design, 31
CONCLUSIONS 33
REFERENCES 36
TABLES 38
FIGURES 44-85
"1,

i
1
INTRODUCTION.,
The utility of the depleted uranium alloy U-6 wt.% Nb (U6Nb) as a structural
material is a result of the beneficial effects of Nb in improving the resistance to
general corrosion and stress corrosion cracking while providing a substantial
strengthening increment [1-3]. In the present investigation, the fatigue and
fracture properties of U6Nb were measured to provide the materials property data
needed for structural designs. Previous to this work, no fatigue crack propagation
data has been published for this material and the only reported fatigue strengths
are for smooth-bar tests of as-quenched U6Nb [2]. We have extended the fatigue
property measurements of U6Nb to provide data for predictions of both crack
initiation lifetime (fatigue strengths) and crack propagation lifetime (fatigue crack
growth rates). The static load carrying capabilities have been characterized
through fracture toughness and tensile property measurements.
Fatigue can be defined as the progressive localized damage produced by the
cyclic application of tensile stresses, usually at levels below that required for bulk
deformation. This damage can be separated into three regimes: crack initiation,
crack propagation, and final failure. Crack initiation testing provides the most
traditional fatigue design data. The total number of fatigue cycles required for
failure is measured vs. the applied cyclic stress amplitude and the fatigue strength
is determined based on the required cyclic lifetime. For high-cycle fatigue
conditions, the total lifetime is principally governed by the number of fatigue
cycles necessary to initiate a crack. The fatigue strength is therefore dependent on
the surface condition and stress concentrations in the component. The fatigue
strength can also be altered by mean tensile loads, test environment, and the
metallurgical condition of the material. In this investigation, each of these
, variables were incorporated into the test matrix by using anticipated service

i
2
conditions and/or worst-case conditions for each variable as described in the
experimental procedures.
An alternative fatigue design approach is to use fracture mechanics methods. .-
The fatigue lifetime can be calculated for a given loading history by integrating the
crack growth rates for the stress intensities produced between an initial and final
crack length. This design method is more conservative than the previous
approach since it assumes the pre-existence of a crack-like flaw in the material and
allows calculation of the remaining cyclic lifetime. The cyclic stress intensity can
be calculated for any component from the applied stresses and geometric factors
which greatly facilitates the application of test data to specific component designs.
At sufficiently low cyclic stress intensities a fatigue threshold is reached, below
which crack growth rates decrease asymptotically to below 10-8 mm/cycle. The
value of the fatigue threshold is expected to be sensitive to the mean stress level,
the fatigue environment, and the metallurgical condition of the material [24].
Again, these variables have been evaluated as described in the experimental
. procedures.
The strength and corrosion properties of U6Nb are known to be sensitive to
the thermal history of the material [1-3, 11, 18-21]. The two heat treatment
conditions in most common use are the as-quenched condition in which the Nb
remains in solid solution or a condition consisting of subsequent aging at 200 °C
for 2 hr in which early stage precipitation of a Nb-rich phase occurs [1]. While the
200°C/2h heat treatment produces an under-aged microstructure, it avoids the
severe degradation in corrosion resistance which accompanies the higher strength
microstructures achieved with further aging [1-3]. The influence of metallurgical
condition on the propagation behavior and fatigue threshold was evaluated in
this investigation by testing both as-quenched, and under-aged U6Nb, though
testing has focused on (under)aged material heat treated at 200°C/2h. The baseline..

3
. fatigue propagation behavior of U6Nb was determined for a cyclic load ratio. R
(minimum load/ maximum load), of 0.1 in laboratory air. Comparison behavior
was measured for conditions of high mean tensile loads and atmospheres of
moisture-saturated air and dry nitrogen. The room temperature tensile properties
were measured for both as-quenched and aged conditions. The fracture toughness
of the aged material was measured at both room temperature and at-55 °C [4]. In
addition, the distributions of inherent internal flaws in the form of oxide and
carbide inclusions are summarized for use in fracture meciLanics-based fatigue
analyses. Finally, the methodology for fatigue lifetime predictions based on the
property data reported here will be discussed.
EXPERIMENTAL METHOD
The U6Nb plates used in this investigation were produced at Martin Marietta's
. Y-12 Plant using standard production procedures. The plates were warm cross-
rolled to a thickness of 16 mm (5/8 inch), and were received in the as-quenched
condition (part number WR6854). The compositions of the two plates used in this
study are listed in Table 1. Residual carbon in the alloy is an undesirable impurity
which forms U and Nb carbide inclusions and the test compositions were selected
to span the range of typical carbon contents. Plate 'A' contains a high carbon
content of 100 ppm, which is near the maximum impurity level produced by Y-12.
Plate 'B' contains only 65 ppm carbon. The tensile and fractt're toughness
properties were measured for each of the two plates. Fatigue measurements were
made using material from the high carbon plate 'A', which should provide
. conservative property data due to the potentially detrimental effects of carbide
inclusions.

4
Specimen preparation consisted of cutting specimens in the plane of the cross-
rolled plates and rough machining to size. Where aging treatments were
required, the rough-machined samples were heat-treated in an air furnace at 200 ..
°C. A thermocouple was placed in contact with the parts and the time at
temperature was controlled (commencing for a temperature of >195 °C). A typical
aging treatment required a heating time of approximately 1 h. A more prolonged
heating time was required for the vacuum furnace treatments performed on the
first series of specimens which consisted of three tensile and six 0.5" thick compact
tension specimens (#1AH to #6AH). These specimens were used for toughness
testing and initial fatigue propagation tests. They are distinguished from the
remaining aged samples by an elevated yield strength. Fatigue crack propagation
measurements were performed initially on the vacuum treated specimens
(constant R=0.1) but all the remaining samples were heat treated 200°C/2h in air.
The influence of such heat treatment variations on the fatigue crack propagation
behavior is expected to be minor based on the similar FCGR's measured in
comparison tests of aged and unaged material, as discussed later. All subsequent.i
specimens were heat treated in air at atmospheric pressure under standardized
conditions. The test specimens were finish-machined using a standard series of
cuts with decreasing depths of material removal simulating conventional
machining schedules in component fabrication. Semi-finish cuts of 0.005" (0.13
mm), 0.002" (0.051 mm), and 0.002" (0.051 mm) were followed by a finish cut of
0.001" (0.025 mm) depth.
Static Mechanical Behavior
Tensile testing was performed using standard round tensile specimens with a
1.0"( 25.4 mm) gage length and 0.25" (6.35 mm) gage diameter. Yield strength and
elastic modulus values were measured using a clip-gauge extensometer. Total
• ,m.

elongation and reduction in area values were determined from final specimena.
dimensiops. All specimens were tested in the ambient laboratory air
". environment.
Fracture toughness was measured using the single-specimen JIc technique,
following the recommended procedures in ASTM E813-87. Standard compact
tension specimens, 0.5" (12.7 mm) thick, were used in fracture toughness testing of
both as-quenched and aged (200 °C/2 hr) conditions. A clip gauge positioned at
the crack mouth opening was used to measure the unloading compliance for crack
length determinations. The fracture toughness was also measured at-55°C using
the multiple specimen JIc method with specimens 0.4" (10 mm) thick [4].
Fatigue Crack Initiation Testing
Fatigue stress vs. fatigue life (S-N) tests at zero mean load were performed on a
single-cantilever, rotating-beam fatigue machine (Fatigue Dynamics RBF-200).
Smooth-bar tests were performed using a tapered specimen with the dimensions
shown in Figure la. The surface finish was characteristic of that produced by
standard machining procedures, as outlined above. The specimens were coated
with oil after final machining (Gulf No-Rust C), stored in the laboratory
environment, and wiped dry prior to testing. The stresses were applied to the
rotating specimens through bending loads which produce a sinusoidal waveform
of fully reversed tensile and compressive stresses at a frequency of 50 Hz. The
failure criterion for these tests was crack propagation sufficient to trigger a
displacement-actuated microswitch. Typically, the remaining ligament at failure
comprised less than 25% of the original diameter. Testing was interrupted upon
exceeding 108 cycles without failure, with the exception of a limited number of
tests which were extended further. Testing was performed in the ambient
" laboratory environment with an average humidity of between 40 and 60%.

6
The effect of stress concentrations on the fatigue life was evaluated by S-N
testing of severely notched specimens. A V-notch with a 0.005" (0.13 mm) root
radius (p) and depth (a) was cut into 0.5" (12.7 mm) diameter bars such that the ""
remaining ligament was equivalent in diameter to the tapered smooth bar
specimen, as shown in Figure lb. This notch produces a theoretical stress
concentration factor, Kt , of eleven, where Kt = 1 . 2 qa/p. Test conditions were
identical to those used for smooth bars.
The effect of mean tensile stresses on the fatigue strength was evaluated using
an axially-loaded specimen tested in a conventional tensile loadframe. The
specimen was designed with a uniform cross-section over the center 0.5" of the
reduced section as shown in Figure lc. The failure criterion for fatigue life
determinations was total failure. In addition, crack initiation lifetimes were
monitored by novel application of a direct-current potential-drop system with
i current leads attached through threaded holes at the specimen ends, and voltage
leads attached through mechanically-fastened copper collars at the shoulders of
. the gage section [15]. The voltage was automatically sampled at a rate of I Hz from
a digital nanovoltmeter and stored on disk. The fatigue cycle was applied by
hydraulic actuator at a frequency of 50 1tz using a square-wave function generator.
Fatigue Crack Propagation Testing
Fatigue crack growth rates (FCGR's) were measured vs cyclic stress intensity
(AK) using compact tension specimens. A specimen thickness of 0.5" (12.7 mm)
was used initially, then decreased to as thin as 0.1" (2.5 mm) for tests at constant
maximum K to eliminate potential residual stress effects. Testing was performed
exclusively at 20 Hz with a square wave applied by a hydraulic actuator on a 4-post
MTS load-frame. The testing procedures followed ASTM standard E647-88
methods. Initial tests were performed under K-increasing conditions with
e
?
constant load cycles and constant stress ratio (R) of 0.1 (Note: K increases with
increasing crack length). All near-threshold FCGR testing was performed under
"" K-decreasing conditions using a stepped load shedding technique, with dAK/da
limited by standard load decreases of 10% after a minimum of 0.02" (0.5 mm) of
crack growth. Crack closure loads were determined from the unloading
compliance measured using a clip gauge mounted on integral knife edges at the
crack mouth opening. To prevent unwanted crack closure and to simulate service
environments with mean tensile stresses, the FCGR's at constant maximum K
values were also evaluated. The constant plastic zone size produced for
conditions of constant maximum K allows increased rates of load shedding [5], but
were maintained in general. Exceptions were overnight fatigue cycles at near-
threshold conditions to determine the near threshold behavior.
The crack lengths were monitored by either physical examination with an
optical microscope or by voltage changes in a direct-current potential drop (DCPD)
system. For initial tests at R=0.1, the crack was wedged open at the minimum.i
load, and optical surface measurements of crack length were performed to the
nearest 0.0001" (0.025 ram) at a magnification of 100X. Later tests, including all
environmental testing, utilized the in-situ DCPD method of crack length
measurement. Procedures for the DCPD measurements are detailed in [6].
Environmental testing was performed in a vacuum tight chamber which was
specifically designed for these tests. An atmosphere of saturated water vapor was
achieved by bubbling inlet air through a water bath and verified by humidity
measurements. Testing in dry nitrogen was performed by evacuating the test
chamber and backfilling with ultrahigh-purity nitrogen gas passed through
drierite. The chamber was continuously purged while maintaining a slightlyrl
positive internal gas pressure.

i
8
RESULTS
Static mechanical properties -"
The tensile properties of the two U6Nb compositions were measured in both
the as-quenched condition and after aging at 200°C/2h. The first series of tensile
specimens were heat treated in a vacuum furnace along with compact tension
specimens 1AH to 6AH. The room temperature tensile properties for the series-1
heat treatments are summarized in Table II. The average values of yield strength,
tensile strength, elongation to failure, and reduction-in-area at fracture for the as-
received condition are 24.2 ksi (167 MPa), 122.6 ksi (845 MPa), 33 %, and 44 %,
respectively, and for the aged condition 78.4 ksi (540 MPa), 129.3 ksi (892 MPa), 31
%, and 44 %, respectively. The difference in properties measured for compositions
'A' and 'B' differ by less than the specimen-to-specimen variations. The most
significant difference between the as-received and aged conditions is the more
than doubling of the yield strength (0.2 % offset criterion) after heat treatment.
Conversely, the ultimate tensile strength increases mildly after heat treatment,
and the tensile ductility is not significantly affected. The elastic modulus increases
from 65 GPa (9.5 (106) psi) in the as-received material to 77 GPa (11.2 (106) psi) after
2 h at 200 °C.
The tensile stress/strain curves for the as-received and vacuum aged
specimens are presented in Figure 2a,b. The shapes of the curves are complex,
with initial yield regions followed by high rates of work hardening prior to a
second yield region and with extensive uniform plastic deformation and
significant localized plastic deformation (necking) prior to final failure. The
principal effect of aging at 200 °C is to alter the material behavior at small strains.
While aging more than doubles the 0.2% offset yield strength the second yieldr,

9
. stress increases only 16% from 725 MPa (105 Ksi) to 840 MPa (122 Ksi) and the
tensile strength increases just 5%.
The sensitivity of the tensile properties to soaking time at 200°C was also
evaluated by comparing 1 h and 2 h heat treatments in air using standardized
methods. The stress vs. strain curves for specimens aged 1 h and 2 h at 200°C are
compared in Figure 2c, d. As summarized in Table II, the yield strength increases
from 63.3 ksi (436 MPa) after 1 hr at 200 °C to 67.7 ksi (467 MPa) after 2 hrs at 200
°C. The ultimate tensile strength, elongation to failure, and reduction-in-area at
fracture were not measurably different.
The fracture toughness of the high-carbon composition (A) was measured in
both the as-received and the aged (200 °C/2h) conditions using 0.5 inch thick
compact tension specimens. With the exception of an aged specimen, the
provisional values, JQ, did not meet minimum specimen thickness requirements
due to the high ratio of JQ relative to the effective yield strength. These JQ values
therefore represent the resistance to extension of a sharp crack in section
. thicknesses less than or equal to 0.5 inch (12.7 mm) but not in larger section
thicknesses. The J-integral toughness of the aged material exceeded that of the as-
quenched material (1722 in-lbs/in 2 vs. 1215 in-lbs/in 2) despite the higher 0.2%
offset yield strength (79 ksi vs. 23 ksi).
The temperature dependence of the fracture toughness was evaluated through
comparison tests at RT and-54°C [4]. While the toughness values are lower than
those measured at LLNL, the toughness did not decrease between RT and -54°C.
Subsequent tests at LLNL using newly implemented test methods resulted in JQ
values closer to those measured by Y-12 [4]. A summary of the fracture toughness
measurements is presented in Table III. Despite the variations in toughness
values, the resistance of U6Nb to static propagation of a sharp crack remained high
mow

i
10
in all tests and the fracture surfaces were all ductile in appearance (see
Microstructural Characterization section).
_Fatigue Crack Initiation
The fatigue stress vs. fatigue life (S-N) characteristics of smooth-bar specimens
aged at 200°C/2h are plotted in Figure 3. The fatigue strength decreases
continuously for increasing fatigue lifetimes. This trend continues to at least 108
cycles with no indication of a fatigue endurance limit; fatigue failures were
observed at lifetimes exceeding 108 cycles. Because of this absence of a fatigue
endurance limit, the fatigue strength is reported for specific cyclic lifetimes. From
Figure 3, the lower bound fatigue strength at 108 cyc]e._ is 36 ksi (248 MPa),
increasing to 43.5 ksi (300 MPa) at 107 cycles. Average fatigue strengths are
approximately 7 ksi (50 MPa) higher than the lower-bound v:alues for these
conditions.
The sensitivity of the fatigue strength to stress concentrations was evaluated
. for specimens containing a severe notch, and the test results are summarized in
Figure 4. For a lifetime of 108 cycles, the notched-bar fatigue strength decreases to a
lower-bound value of 11 ksi (75 MPa). The experimentally determined fatigue
strength reduction factor due to the presence of the notch is therefore equal to 3.3.
This is much lower than the theoretical stress concentration factor, Kt, of 11
calculated from elastic theory (see Exper. Methods Section).
The influence of mean tensile stresses on the smooth-bar fatigue strength were
evaluated using axially-loaded specimens subjected to tension-tension cycles. Fori
a mean load of 40 ksi (275 MPa), the fatigue strength at 107 cycles is reduced to 15
ksi (103 MPa), as shown in Figure 5. Under these conditions, the specimen-to-
specimen variation in fatigue lifetime is much larger than for rotating beam testsb-
at zero mean load. For a mean load of 70 ksi (483 MPa), which exceeds the bulk..
tt.

11
. 0.2% offset yield strength of the material, the fatigue strength is further reduced to
a minimum value of 6 ksi (41 MPa), as plotted in Figure 6. A summary of the!,
influence of mean tensile loads on the fatigue strength of aged U6Nb for lifetimes
of 107 cycles is plotted in Figure 7 and compared to three empirical relations
developed for other material systems. The fatigue strength of 43.5 ksi (300 MPa) at
zero mean load and 107 cycles is taken from the rotating beam data. Only the
relation by Soderberg, which predicts zero fatigue strength at mean loads above
the bulk yield strength of the material, is conservative in estimating the fatigue
strength reductions due to mean stresses in U6Nb.
A summary of the fatigue strength data is presented in Table IV. The ratio of
fatigue strength to tensile strength varies from 0.28 for smooth bar specimens to
0.09 for notched bars (Kt=11) at zero mean load, and 0.05 for smooth bars at mean
loads of 70 ksi (483 MPa).
In addition to measurements of total fatigue lifetime, several of the tension-
tension fatigue specimens were instrumented with a direct-current potential-drop
(DCPD) system for early crack detection. Under an imposed constant current, the
potential between copper collars fixed to the specimen was continuously
monitored during the tests. The initiation of a fatigue crack results in an increase
in the potential drop above baseline values. After first detection of a crack, the
rate of voltage rise increases continuously until final failure occurs. Typical DCPD
initiation data is plotted in Figures 8 a,b for mean stresses of 40 ksi (276 MPa), and
70 ksi (483 MPa), respectively. The crack initiation lifetime constituted a
minimum of 85% and as much as 99.9% of the total fatigue life. The crack
propagation lifetime can be calculated as the difference between the total lifetime
and the crack initiation lifetime, and is included in a summary of the DCPD data
in Table V. For similar loading conditions, the specimen to specimen variation in
total lifetime is approximately 70, while the calculated fatigue propagation
12
lifetimes vary by less than a factor of 2. The large differences in fatigue life
between these specimen can be attributed to variations in crack initiation lifetime
and emphasize the statistical nature of fatigue crack initiation. ."
The source of fatigue crack initiation was identified through fractographic
analysis of fractured smooth-bar S-N samples. In every case examined, the crack
initiation event could be traced to an inclusion near the specimen surface. Two
types of incll,sions were identified using energy-dispersive x-ray (EDX) analysis in
the SEM; niobium carbides, and uranium oxides. On a typical fracture surface
from a rotating-beam S-N test such as shown in Figure 9, the fracture surface
markings clearly point to a thumbnail-shaped region near the specimen surface as
the crack initiation source. Closer examination identified inclusions at the edge of
the thumbnail-shaped region as the crack initiation site, as shown in Figure 10.
The crack first propagated to the specimen surface to produce the thumbnail-
shaped region, and then propagated across the sample leaving classical fatigue
striations in some areas, as shown in Figure 11.
.I
Fatimae Crack Propagation
The fatigue crack growth rates (FCGR's) of aged U6Nb (200 °C/2h) vs. cyclic
stress intensity range are summarized in Figure 12 for tests in laboratory air at a
constant R-ratio of 0.1. Measurements from five 0.5" (12.7 mm) thick specimens
are presented in this plot. The data at high stress-intensity-range (AK) was
determined using K-increasing methods and overlaps the data at lower AK
determined using K-decreasing methods. The FCGR behavior in the overlap
region is similar irrespective of which of the two methods were used. Overall,
there are three characteristic regions present in this data as plotted in Figure 12. At
cyclic stress intensity ranges, AK, exceedingly approximately 20 MPa_-_, the
FCGR's increase rapidly with increasing AK, reaching a growth rate of 3(10-3)

13
- ram/cycle at a AK of 54 MPa_-_-. This low-cycle fatigue region is bordered by a
mid-growth-rate region at lower AK's, which can be characterized as low-n power-
law behavior:
da/dN = C(AK)n [Eq. 1]
where da/dN is the cyclic crack growth rate, C is a constant, aK is the cyclic stress
intensity range and n is the Paris-Law exponent. This exponent, n, decreases from
a value of 3.9 in the low-cycle fatigue region to a value of approximately 1.5 in the
mid-growth-rate region. With further decreases in AK, a threshold region is
normally expected at which growth rates rapidly decrease to below 10-7 mm/cycle.
The start of the threshold transition region is indicated at the lowest AK test
values.
For comparison purposes, the FCGR behavior of as-quenched U6Nb was also
evaluated. The FCGR's for constant R=0.1 and K-decreasing test methods are
compared in Figure 13. The FCGR's of the as-quenched material are similar
within the range of overlap but can be characterized as having a lower Paris Law
exponent, n (see Equation 1). For a AK of 10 MPa_/_, the FCGR's are slightly
lower than for the aged condition, while the FCGR's are slightly higher in the
near-threshold region. The threshold AK for as-quenched material can be
estimated as no lower than 3.4 MPa'_, which is based on three data points
defined by their maximum undetected growth rates.
Crack Closure Phenomena. The magnitude of the fatigue threshold is well
known to be sensitive to many material and environmental variables, especially
those which induce crack closure effects. Crack closure is a phenomenon which
occurs upon unloading where-in previously open crack faces make contact at
loads greater than the minimum cyclic load, even though the minimum cyclic
. load is tensile. Because this phenomenon reduces the cyclic load range at the crack
tip, the effective AK at the crack tip is also reduced. Crack closure can be detectedI

14
by a change in the specimen compliance (slope of the load vs. displacement
curve). The compliance of the as-quenched specimen was measured after 106
cycles at a AK of 3.1 MPa_/m---and R=0.1 (Kmax=3.5 and Kmin=0.35 MPa_/m). ."
Opening of the crack faces upon reloading was identified by a decrease in
compliance at a load of 9.5 lbs or K of 1.1 MPa-_. Because this crack-opening K
value is greater than the applied Kmin, the effective AK is reduced to K(max)-
K(opening) or 2.4 MPaq_
To determine the influence of fatigue crack length on crack closure, the length
of fatigue crack surfaces able to mechanically interact was incrementally shortened
by widening the crack mouth with an abrasive blade. The length of crack behind
the crack tip available for mechanical crack closure was therefore incrementally
reduced. The original fatigue length of 0.784" (20 ram) was shortened to 0.284" (7.2
ram) and 0.173" (4.4 mm), successively. The corresponding crack opening loads
decreased from 9.5 lbs (K=l.13 MPa_m-), to 5.5 lbs (K=0.65 MPa_), and finally 1.85
lbs (K=0.22 MPa_. This final K-opening value is below Kmin, and no closure
effects are expected in this condition. Subsequent FCGR's with the shortened.J
effective crack length were similar to those measured at high crack opening loads,
however, as shown in Figure 13.
One common source of crack closure relevant to these tests is that of crack
surface roughening. The typical fatigue crack path in the near-threshold region is
severely branched, as shown in Figure 14, and the fracture surface is highly
roughened by the numerous changes in crack propagation directian. The large
number of secondary fatigue cracks form a "lightning-bolt" crack morphology.
The crack propagation direction is dominantly transgranular in nature but with
preferred directions within each grain, as evidenced by numerous parallel cracks
in some individual grains. From observations on several test specimens, the
crack branching consistently initiates only when AK decreases to near 10 MPa_--_.
15
- Once started, the crack branching continues for all lower values of _K. In regions
exhibiting crack branching, cracks emanating from inclusion particles are
commonly observed, and the principal crack paths preferentially intersect these
particles. The fracture surfaces are also darkened during fatigue testing and the
extent of darkening increases with decreasing fatigue crack growth rates. This
surface darkening is primarily attributed to surface oxidation during fatigue crack
propagation.
The potential role of residual stresses within the processed plates on branching
of the crack away from the direction of highest applied stress was evaluated by
testing specimens with a reduced thickness of 0.1 inch (2.5 ram). Crack branching
was again first observed for a AK of approximately 10 MPa_-'-and continued with
decreasing aK. The crack growth rate behavior is compared with that for thicker
specimens in Figure 15. The fatigue threshold is reduced to approximately 3.2
MPa_ --- with an accompanying plateau in growth rate at
4(10 -6) mm/cycle for aK's between approximately 3.5 and 6.5 MPa_m-_-. This
fatigue threshold value is close to that determined for as-quenched U6Nb with a
specimen thickness of 0.5 inch (12.7 mm). Compliance measurements were
performed after 2(106) cycles at a aK of 3.1 MPa'_r-m--(Kmax=3.44 and Kmin=0.344
MPa_-Y with no measurable crack growth. A change in compliance at 10.3 lbs
(K=1.21 MPa_') was determined from the compliance measurements
(load/displacement), which identifies the crack opening load. Because K-opening
is above the applied Kmin, the effective fatigue cycle at the threshold is (Kmax)-(K
opening) or 2:2 MPa_.
Constant Kmax Fatigue Crack Propagation. While crack closure effects can
increase the fatigue threshold, crack closure is often absent in service when short
cracks or high load ratios (R) are present. In order to evaluate the fatigue crack
propagation behavior for high mean tensile loads and without crack closure,

16
testing was performed for a loading cycle in which the maximum stress intensity
Kmax is kept constant. In this case, the minimum load increases as the cyclic
stress intensity range decreases. Thus, as the fatigue threshold is approached, the .-
minimum load increases toward the load at Kmax, the R-ratio approaches unity,
and crack closure is prevented.
The FCGR's at a constant Kmax of 14.6 MPa_---are compared with those at
constant R-ratio of 0.1 in Figure 16 for a 0.1 inch (2.5 ram) thick sample. For
constant Kmax conditions, the fatigue threshold is shifted to lower AK and the
low-n plateau in growth rates between AK's of 3 MPa'_and 10 MPa_--'is shifted
up to growth rates of approximately 6(10 -6) ram/cycle. The growth rates begin to
decrease again for AK's below approximately 3 MPa_and the fatigue threshold
(defined by growth rates of 10-7 mm/cycle) is decreased to 0.95 MPa_. The onset
of crack branching continues to occur for AK's less than 10 MPa_-m_.
The FCGR behavior at higher mean loads was evaluated by increasing Kmax
from 14.6 MPa_--to 30.5 MPa_. The data is plotted in Figure 17. The FCGR's
are similar for the two conditions in the mid-growth-rate regime but increaseb
rapidly for the higher Kmax condition when AK exceeds approximately 10
MPa-_.
Additional fatigue data was acquired at a Kmax of 30.5 MPa'_for a specimen
thickness of 0.5 inch (12.7 mm). This and all subsequent FCGR data was acquired
using a direct-current potential-drop (DCPD) system to measure the fatigue crack
length in-situ. DCPD calibration data and test methods are included in a report on
near-threshold fatigue testing [6]. As shown in Figure 18, the mid-growth-rate
plateau has disappeared and the growth rates decrease at a nearly constant power
law exponent of 2.2 for AK's below approximately 10 MPa-_. The fatigue
threshold is depressed from 0.95 MPa_-- for a constant Kmax of 14.6 MPa_to
below 0.5 MPa_for these conditions. Comparing data at a constant Kmax of 30.5
By,
iIi

17
- MPa'_--to that measured at a constant R-ratio of 0.1 in Figure 19, the FCGR's are
significantly higher for the conditions of higher mean stress (constant Kmax) at all
" values of AK.
Environmental Effects. A final variable explored in this investigation is that of
the fatigue enviironment. To evaluate the contributions of fatigue environment
to FCGR's, comparison tests were performed in an inert environment of dry
nitrogen, and an aggresive environment of air with 100% relative humidity (RH).
Previous tests were all performed in laboratory air with RH ranging between 40
and ,60%. The FCGR's in dry nitrogen are compared to lab air for constant Kmax
values of 14.6 MPa'_in Figure 20. A FCGR plateau is clearly present in both
environments, but at lower growth rates in dry nitrogen than in lab air, e.g. 1 to 2
(10-61)mm/cycle vs. 7 (10-6) mm/cycle, respectively. The fatigue threshold defined
as a FCGR of 10-7 ram/cycle increases to 1.5 MPa'_--for dry nitrogen relative to 0.9
MPa'_/m for lab air. However, the fatigue threshold does not asymptote at this
value and decreases to 0.9 MPa_--for growth rates of 10-8 ram/cycle in dry
. nitrogen.
At higher mean stresses with Kmax equal to 30.5 MPa'_, the FCGR's increase
relative to behavior at the lower Kmax value. Like tests in lab air, the FCGR's in
dry nitrogen decrease in a logarithmic manner with decreasing aK, without a clear
mid-growth-rate plateau, as shown in Figure 21. Unlike in lab air, where no
threshold region, is observed, the FCGR's in dry nitrogen decrease rapidly from
3x10⁻⁷ mm/cyde at a AK of 0.9 MPa_f-m-to below 10-8 turn/cycle at approximately
0.8 MPa_-_. For comparison, the FCGR in lab air is 3x10 -7 mm/cycle at a _K of
0.55 MPa_-_.
Fatigue crack propagation behavior in a more aggressive environment of
moisture-saturated air (100RH) is plotted in Figure 22. The FCGR's decrease
continuously following logarithmic behavior (da/dN=CAK n) where n=3.3 for a

18
constant Kmax value of 14.6 MPa_-and n=2.9 for a constant Kmax value of 30.5
MPa_m_ -. For both values of Kmax there is no mid-growth-rate plateau and no
indication of an asymptotic threshold stress intensity at FCGR's as low as 10-8 ""
mm/cycle. Despite the absence of these features, the FCGR's in 100RH air are
significantly lower than in standard lab air tests for aK's less than 10 MPa_-m-.
As-quenched U6Nb was also tested in conditions of dry nitrogen and lab air at a
constant Kmax of 14.6 MPa_m--for comparison with aged material. The near-
threshold fatigue behavior is similar for both environments with a threshold
stress intensity of approximately 0.95 MPa'_m--at growth rates of 10-7 or 10-8
mm/cycle, as shown in Figure 23. A mid-growth-rate plateau at FCGR's of 2 to
4x10 -6 mm/cycle is more pronounced in the dry nitrogen environment, extending
to aK's above 10 MPa'_. The FCGR's in lab air increase above the plateau rates
for aK's greater than approximately 6 MPa_. In dry nitrogen atmospheres, the
fatigue crack propagation behavior of as-quenched material is remarkably Similar
to that of U6Nb aged 200°C/2h, as shown in Figure 24.
. Microstructural Characterization
The general microstructure of U6Nb aged at 200°C for 2 h is shown in Figure
25. It consists of equiaxed prior-_ grains which t':ansform to (z" martensite upon
cooling from above approximately 640°C [7]. With proper illumination,
•additional substructure can be seen within the prior-_ grains. In some regions, a
subgrain network is visible within the prior-7 grains, and in other regions the
finely banded 0_"martensite can be seen, as in Figure 26. In addition to the banded
martensite, acicular martensite is observed in isolated areas at relatively low
volume fraction. The1"e are also two types of inclusion particles present in the
material, uran_um oxide and niobium carbide, both of which are visible in Figure
25. These are the same inclusions identified by Chapman in a quantitativea.
evaluation of inclusion types and distributions in 57 heats of U6Nb produced at Y-|

19
° 12 [8]. The maximum inclusion sizes reported by Chapman are similar to that
observed in the material evaluated in this investigation. Carbides dominate the
" high end of the inclusion size distribution. The mean of the maximum size
carbide found in each heat (from several 1.9 mm 2 areas selected for evaluation)
was 200 square microns (1.6(10 -2) mm equivalent spherical diameter). The overall
maximum sized carbide was 650 square microns (2.9(10 -2) mm equivalent
spherical diameter), as can be seen in the plot of Figure 27. The carbide
distributions were similar for both center and edge sections, as illustrated in the
distributions plotted in Figure 28. The role of these inclusions as crack initiation
sites make their sizes relevant to estimates of maximum initial flaw sizes
inherent to U6Nb components.
A typical fracture surface producedby tensile overload is shown in Figure 29.
The fracture mode is ductile void coalescence which is generally a high-energy-
absorption process. The nucleation of voids at inclusion particles is verified by the
presence of inclusion particles within the voids on the fracture surface. Many of
. these inclusions, especially the larger ones, are fractured. These fractured
inclusions were previously shown to initiate fatigue failure in smooth-bar fatigue
specimens.
The relationships between fatigue crack propagation directions and the
microstructures were evaluated from fracture profiles and fracture surface
examinations. Fatigue crack propagation occurs exclusively along transgranular
paths for all testing conditions. The presence of numerous secondary cracks in the
near threshold region at AK's of less than 10 MPa'_m--was commonly found. In
Figure 14, the primary fatigue crack path as well as numerous secondary crack
paths can be seen in the fracture profile of a specimen tested in lab air at a constant
R-ratio of 0.1. Secondary cracks exist as both as connected branches to the primary
crack and as disconnected segments. The disconnected segments are typically

20
parallel to the connected cracks. All fatigue cracks are characterized by jogs in the
crack propagation direction, with several jogs within single grains being most.
common. These jogs are often parallel to each other within a single prior-_, grain, "
showing preferential crystallographic directionality. The crack paths also
preferentially intersect large inclusion particles although the numerous crack
branches and segments are not clearly accounted for solely by these particles•
When the test atmosphere is changed from laboratory air to 100RH air or dry
nitrogen, the crack morphologies remain similar and continue to contain
secondary cracking, as shown in Figure 30 and 31, respectively.
The fracture surfaces of fatigued specimens differ substantially from those
produced during tensile overload fracture. The fracture surfaces produced by
these two loading conditions are compared in Figure 32 for tests in lab air and
fatigue loading at a constant Kmax of 30.5 MPa_/m--. The macroscopic crack
branches present in the fatigue zone are extinguished upon application of a tensile
overload and the fracture surface becomes relatively planar. At higher
. magnification, the fatigue fracture surface can be seen to be composed of
numerous cleavage-like facets whereas the tensile overload is completely covered
with ductile voids. The influence of test environment on the fatigue fracture
surface characteristics are illustrated in Figure 33. The macroscopic crack surface
roughness is reduced relative to that in 100RH air and increases in 100RH air with
an increase in Kmax from 14.6 MPa_to 30.5 MPa_ The fracture surface
characteristics in dry nitrogen at a constant Krnax of 14.6 MPa'_--are further
illustrated in Figures 34 and 35. Fine-scale features nearly perpendicular to the
macroscopic fracture plane indicate crack branching and a prominent cracked
inclusion particle is present in each figure. Back-scattered electron images more
clearly reveal the extensive degree of secondary cracking in dry nitrogen as shown
in Figure 36 for a constant Krnax of 30.5 MPa_-.
°

21
. In an atmosphere of 100RH air, cleavage-like fracture surfaces are produced in
fatigue at constant Kmax values of 14.6 MPa_--and 30.5 MPa_/m, as shown in
Figures 37 and 38, respectively. The facet size and the macroscopic planarity of the
fracture surfaces both increase at the higher Kmax testing condition. Again,
prominent fractured inclusion particles are present in each Figure.
The presence of chemical heterogeneity in the form of Nb banding has been
reported in U6Nb by other investigators [9,10]. In this study, the distribution of Nb
perpendicular to the primary fatigue crack and crossing secondary cracks was
examined by electron probe microanalysis (EPMA). This direction is parallel to
the original rolling plane during plate fabrication. As shown in Figure 39, no Nb
segregation was detected in this direction over a distance of 60 microns.
DISCUSSION
Static Mechanical Properties.b
The alloy U6Nb has a number of characteristics which are desirable for a
structural material. Among these are a moderately high tensile strength and good
toughness in the as-quenched or underaged conditions (e.g. quenched and aged
200°C/2h). The yield strength is raised substantially with quench and age heat
treatments which cause fine-scale precipitation of a Nb-rich phase [1]. The
optimum material condition depends on the application, but for maintenance of
good corrosion resistance, U6Nb is normally used either in the as-quenched
condition or in the underaged condition. The underaged heat treatment limits
the amount of Nb precipitation and the resulting strengthening increment but
prevents large decreases in corrosion resistance. Underaging also adds
22
dimensional stability to machined components by preventing the o_"a to Y0
transformation [3].
The most common aging heat treatment for U6Nb is 200°C/2hrs. This heat "
treatment typically produces properties which meet the requirements of D.O.E.
specification RM254952 which a yield strength between 52.2 ksi (360 MPa) and 70.4
ksi (485 MPa), a minimum tensile strength of 111.5 ksi (769 MPa), and minimum
elongation of 25% at room temperature are specified. All of the material tested in
this investigation meets these requirements with the exception of high yield
strengths in the initial series of heat treatments in vacuum. As summarized 'in
Table I, the yield strength more than doubles after 1 hr at 200°C and increases
another 7% after 2 hrs at 200°C. Vacuum heat treatments are inherently difficult
to control at low temperatures due to negligible convective heat transfer and the
resulting extension of heating and cooling times resulted in extended aging and
associated strengthening. Although the yield strength increased for the vacuum
treated specimens, the tensile strength, elongation, and reduction-in-area at
. fracture all remained largely unaffected. It is of interest to note that the major
changes in the tensile stress/strain curves after heat treatment at 200°C are limited
to the flow stresses at low-strains. As substantiated in Figure 2, low temperature
aging inhibits initial yielding but does not largely affect the flow stress at strains
greater than 5 percent. Similar results have been found by others [11].
Fracture toughness testing has verified the high resistance to unstable crack
extension at RT in both the as-quenched and in the aged conditions and at-54°C
for aged material. Although uniaxial tensile data predicts a large decrease in
ductility between RT and-50°C [12], the toughness values determined here at RT
and -54°C are nearly equivalent [4]. In Charpy impact tests between +100°C and
-100°C by Anderson [13], the absorbed impact energy decreased with decreasing test
temperature but remained relatively high and the fracture mode remained ductile

23
. void coalescence at the lowest test temperature. Between RT and -50°C, the
absorbed impact energy decreased from 34 J to 27 J. These results confirm that the
resistance of aged U6Nb to unstable crack propagation remains high at-54°C.
Valid fracture toughness measurements were only obtained for the aged 0.5
inch (12.7 ram) thick samples due to dimensional requirements for small-scale
yielding in J-integral tests (ASTM E813). The specimens used in the Y-12 tests at
RT and -54°C were 0.4 inch (10 mm) square bars. While specimens of greater
thickness may exhibit a lower resistance to unstable crack extension, the behavior
of components of equal or lesser constraint (e.g. thickness) is confirmed. The early
test measurements which gave the higher toughness values (1A, 2A, and 1AH)
used a procedure which has subsequently been identified in round-robin testing as
overestimating the toughness by approximately 25%. Modified test procedures
were used for specimen 2AH, and the toughness value more closely matches the
results by Y-12, as shown in Table IV.
A typical application of the fracture toughness data is to calculate the critical
. crack length required for unstable crack extension. For a through-thickness crack
from the edge of a semi-infinite plate, the critical crack length can be calculated
from the relation:
Kc=1.12__ac [Eq. 2]
where Kc is the critical stress intensity, a is the applied stress, and ac is the critical
crack length. Using a worst-case applied load equal to the yield strength of aged
U6Nb (68 ksi (470 MPa)), the critical crack length is 0.35 inch. Such critical crack
length determinations can also be usefuU for prediction of the extent of available
fatigue crack growth prior to unstable crack extension for a given maximum
applied stress.

24
Fatigue Crack Initiation Behavior
Stress vs. life fatigue tests have been used to determine the fatigue strength for -"
both smooth and notched specimens, to evaluate the effects of mean tensile loads
on the fatigue strength, to identify the source of fatigue crack initiation, and to
measure crack initiation lifetimes through novel use of.the direct-current
potential-drop (DCPD) technique.
It is evident from the smooth-bar data in Figure 3 that U6Nb does not exhibit a
fatigue endurance limit. The fatigue strength continues to decrease for increasing
cyclic lifetimes to beyond 108 cycles, unlike steels for which the fatigue strength is
typically constant beyond approximately 106 cycles..This lack of a fatigue
endurance limit in U6Nb is similar to the behavior of several other nonferrous
rna__eriais such as aluminum and copper alloys [14]. The fatigue strength used in
design decisions must therefore be made based on the cyclic lifetime requirements.
For 108 cycles, the lower-bound fatigue strength is 36 ksi (248 MPa). The ratio of
. fatigue strength to tensile strength under these conditions is 0.28, which is well
below the trend for steels of 0.5.
A microstructural factor with a significant influence on the fatigue strength is
that of the niobium carbide and uranium oxide inclusion particles. These
particles have been identified as the source of fatigue crack initiation in smooth-
bar fatigue specimens, and are also void initiation sites in tensile overload
failures. Although mixed inclusion types are often clustered together, the
niobium carbides appear to be the most common source of crack initiation. The
niobium carbides also constitute the largest inclusion particles found in this
material. For these reasons, high carbon contents can be expected to degrade the
mechanical properties, especially with respect to fatigue crack initiation. The bulk
of the testing in this investigation was performed on an alloy with a carbon

25
• content of 100 ppm (wt.) which is near the maximum level produced by Y-12 as
WR6854 plate [16] even though D.O.E. specification RM254952 allows up to 200o
ppm carbon.
Stress concentrations in the form of a machined notch also caused significant
reductions in fatigue strength. The test results for a severe notch with theoretical
stress concentration factor of 11 are summarized in Figure 4. The effective
reduction in fatigue strength of 3.3 relative to levels for smooth-bar specimens is
much lower than that predicted by elastic theory. This can be attributed in part to
the low yield to tensile strength ratio and the role of plastic deformation in
limiting the stress concentration. An additional factor is the presence of
inclusions which provide intrinsic stress concentration sites and lower the
smooth bar fatigue strength which is used as a baseline value.
The sensitivity of the fatigue strength to mean tensile stresses was evaluated
for mean stresses of 40 ksi (275 MPa), or approximately two-thirds of the 0.2%
offset yield strength, and just above the yield strength at 70 ksi (483 MPa). The
comparisons of mean loading effects in U6Nb with empirical models proposed by
Gerber, Goodman, and Soderberg (Figure 7A) show that U6Nb is relatively
sensitive to mean loading. For most material, the fatigue properties fall between
the Gerber and Goodman curves [17]. The U6Nb data is compares closest with the
Soderberg curve in which the fatigue strength approaches zero at the yield
strength of the material. The tests at 40 ksi (275 MPa) had more scatter than tests
in the other conditions, with specimens either failing at less than 106 cycles or
beyond 107 cycles. This could be related to early crack initiation at high mean
loads for specimens containing statistically large inclusions.
The crack initiation lifetime is expected to be statistical in nature when the
initiation event occurs at worst-case flaws which are randomly distributed, as for
inclusion particles. A distinct measurement of crack initiation lifetime vs. total

26
lifetime was performed for several of the same axially-loaded tensile specimens
used to measure mean loading effects. A novel use of a DCPD system was applied
as a method of early crack detection; crack initiation was detected from an increase ""
in electrical potential due to a local reduction in conducting cross-section
associated with a fatigue crack [15]. The maximum undetected crack length can be
conservatively estimated from the calibrations performed on the compact tension
(CT) specimens (Note: the conducting cross sections of the CT specimens are larger
than for the axially-loaded fatigue specimens). For the CT specimens, a voltage
resolution of approximately 5 microvolts yields a minimum crack size detectibility
of 2x10⁻⁴ inch ( 5(10-3) mm) and this voltage increase was used as a basis for the
crack initiation determinations. The time to initiate a detectable crack accounts for
up to 99.9 percent of the total lifetime in the mean tensile loaded specimens. It is
of interest to note from Table V that although the total fatigue lifetimes vary by a
factor of 70 for identical loading conditions the calculated crack propagation
lifetime varies by less than a factor of 2, as expected. Due to a requirement for
. tension-tension load cycles, crack initiation lifetimes could not be measured for
specimens tested at zero mean load.
Because of the statistical nature of crack initiation lifetimes, the lower bound
values for fatigue strengths are recommended as the appropriate design criteria for
high confidence levels. The maximum observed inclusion sizes of approximately
3(10 -2) mm (0.0012 inch) equivalent spherical diameter also give a basis for
comparison of worst-case intrinsic flaws relative to flaws introduced by material
processing or machining. The surfaces of the smooth bar specimens evaluated
here were prepared by methods typical of machining practice for component
fabrication as detailed in the procedures section and should therefore represent
actual service conditions. A more conservative approach to fatigue design than
the use of S-N test data is to assume the presence of a worst-case pre-existing flaw

l
27
in the material and to calculate the fatigue lifetime based on fatigue crack¢,
propagation data as discussed below.
Fatigue Crack Propagation
The fatigue crack propagation (FCP) behavior of U6Nb shares many of the
characteristics common to typical engineering materials. First, the dependence of
fatigue crack growth rates (FCGR's) on the cyclic stress intensity range has three
characteristic regimes. These regimes can be compared by fitting the data to Eq. 1
and determining the power-law exponent, n. For standard test conditions of R=0.1
and laboratory air, an n-value of 3.9 was measured in the low-cycle fatigue region
at high AK's (region III), decreasing to an n-value of approximately 1.5 in the mid-
growth regime (region II). As AK decreased further, the growth rates decreased
asymptotically, corresponding to a large n-value. Secondly, the FCGR's for these
conditions are placed within the trends for other structural materials for modulus
compensated AK's, as shown in Figure 40. Thirdly, the near-threshold fatigue
behavior is modified by the presence of crack closure under standard test
conditions. Crack closure decreases the effective AK and therefore increases the
apparent fatigue threshold. This investigation has shown that the fatigue
threshold is not single-valued, but that it is influenced by both load ratio (R-value)
and test environment as summarized in Table VI.
Mean Loading Effects. The effects of mean tensile loads on the fatigue crack
propagation behavior was evaluated through the use of loading cycles with
constant Kmax values at two levels. With a constant value of Kmax, the R-ratio
increases toward unity as the imposed AK decreases and should therefore prevent
or limit the extent of crack closure. For a constant Kmax of 14.6 MPa'_, the R-
ratio increases from an initial value of 0.1 to a value of 0.93 at a AK of 1 MPa-_-_.
The fatigue threshold decreases from 3.2 MPa_--for constant R=0.1 to 0.9 MPa_--
• •

28
for a constant Kmax of 14.6 MPa'_, as shown in Figure 16. An increase in Kmax
to 30.5 MPa_--resulted in a further decrease of the fatigue threshold to below 0.6
MPa_/m This behavior cannot be explained solely on the basis of crack closure -
and suggests the contribution of an environmentally-assisted fatigue mechanism
at high mean tensile loads.
Environmental Effects. A contribution of environmentally-assisted fatigue
(EAF) crack propagation was confirmed through comparative tests in inert and
aggressive environments. The fatigue properties in an inert environment of dry
nitrogen can be considered to provide baseline fatigue behavior in the absence of
EAF. While EAF has not been previously investigated in U6Nb, a number of
investigators have evaluated the static susceptibility to environmentally-assisted
cracking (EAC) which is also known as stress corrosion cracking (SCC) [2, 18-21].
There is general agreement among these investigators that the as-quenched
material possesses the best environmental resistance. The general corrosic_n
resistance remains high for material aged 200 °C/2 hrs but decreases substantially
when aged to peak strength. Likewise, the resistance to EAC is decreased by aging.
The critical stress intensity for stress corrosion cracking, KIEAC in 100% RH air has
been reported [20] to decrease from 24 MPa "_/mfor as-quenched U6Nb to 17 MPa "_
after aging at 200 °C/2 hrs, and to 9 MPa "_--'after aging at 360 °C/1.2 hrs. The
maximum susceptibility to EAC is reported to occur for aging treatments between
400 °C and 450 °C [21]. The susceptibility to EAC is also highly dependent on the
environmental conditions. KIEAC in as-quenched material has been reported as 80
MPa _-"in 50% RH air, decreasing to 30 MPa "_-in 100% RH air [19]. While
increasing moisture contents increase EAC susceptibility in H 2 or 0 2
environments, EAC is reported to be absent in N 2 environments [20].
Based upon the data in the literature, EAC is only expected in the fatigue tests.
performed in 100RH air at Kmax values of 30.5 MPa_ As shown in Figure 22,

i
29
• the FCGR behavior is similar for Kmax values of both 30.5 MPa_m and 14.6
MPa_m--in 100RH air and both exhibit an absence of a clear fatigue threshold.
However, the FCGR's are reduced relative to values in inert atmospheres within
the mid-growth-rate region. The source of these reduced growth rates can only be
speculated but may be related to the increased severity of off-axis crack growth and
associated crack tip stress reductions or the presence of crack closure due to
increased amounts of roughening and oxide debris.
The stress inten._.ties during fatigue testing in all other conditions evaluated in
this investigation were below the reported critical stress intensity, KIEAC. The
increase in FCGR's in 50RH and 100RH air air relative to dry nitrogen are
attributed to true environmentally assisted fatigue (EAF) in which a synergism
occurs between the environmental and fatigue contributions to crack growth.
Similar behavior has been observed in aluminum alloys which are susceptible to
EAC such as alloy 7039-T651 [22]. In these alloys fatigue crack propagation is
accelerated in environments that accelerate EAC even though the stress
intensities are below KIEAC.
Conversely, there is no clear environmental effect on the near-threshold
fatigue behavior of as-quenched U6Nb for atmospheres of dry nitrogen and lab air
at a constant Kmax of 14.6MPaXm-"although the growth rates do increase in lab air
at the highest AK values tested (see Figure 23). The differences in FCGR's for aged
and as-quenched material are also minor for these test conditions, as illustrated by
comparing Figures 20 and 23.
Common to much of the FCGR data is a plateau region where the FCGR is
relatively independent of AK and "n" approaches unity. This behavior occurs in a
region between the fatigue threshold and AK's of approximately 10 MPa'_. The
exceptions are for aggressive environments at moderate values of Kmax (14.6
MPa_-m-) and for all environments at high values of Kmax (30.5 MPa_/m--) for. •

i
3O
which the plateau is absent. While a decrease in the fatigue threshold occurs at
high values of Kmax and in aggressive environments, the plateau behavior is
replaced by FCGR's that are below those for conditions exhibiting plateau
behavior. As discussed above, this decrease in FCGR's in aggressive
environments is contrary to traditional behavior and may be related to changes in
crack path or due to crack closure from oxide debris.
The source of crack branching in these alloys is also open to speculation. It is
generally agreed that microstructural effects become important for AK's in which
the cyclic plastic zone size decreases below the size of a controlling microstructural
feature. Similar to the behavior observed here, crack branching occurs in a
titanium alloy below a critical AK [17]. In the case of the titanium alloy, crack
branching occurs when the cyclic plastic zone size decreases below the
Widmanstatten packet size. For U6Nb, the onset of crack branching occurs at aK's
of approximately 10 MPa'_,-which corresponds to a cyclic plastic zone size of 0.02
mm, calculated from the relation [17]:
rc =0.033(AKT/6_ [Eq.3]
where rc is the cyclic plastic zone length above the Mode I plane, AKT is the AK
value at the fracture transition, and ays is the cyclic yield strength, estimated here
as equivalent to the monotonic yield strength of 68 ksi (469 MPa). Both the prior-y
grain size (0.06 mm mean linear intercept grain size) and the mean inclusion
spacing (estimated as 0.07 ram) are significantly larger than rc. The fracture
surfaces indicate, however, that while jogs in crack path occur at martensite
boundaries within the prior-_, grains (such as those shown in Figure 26), the major
crack branching occurs on a scale larger than the prior-_, grain size in U6Nb. The
obvious microstructural feature present on a scale where major crack branches
occur (e.g. between 0.1 and 1 ram) is macrosegregation of Nb. The presence of Nb
macrosegregation in U6Nb castings is not avoidable [9,10] and has been measured

31
with a band spacing of 5 mm in the as-cast condition and reduced to 0.6 mm after
rolling into plate [9]. It is speculated that although Nb banding was not detectable
"- within the rolling plane as measured in this study, that it still exists in the
through thickness direction, and causes the preferential crack paths due to
associated variations in strength and environmental resistance and from carbide
banding.
Fatigue Desim_v v
The application of fatigue crack propagation data to component design may
follow either of two general approaches. The first approach is to limit the applied
cyclic stress intensity range to levels below the fatigue threshold. In making this
assessment, the experimental test conditions used in determining the fatigue
threshold value must incorporate the anticipated service conditions of the
component. Thus for conditions where high mean tensile loads (high R-ratios) or
short cracks limit crack closure, threshold measurements made under these same
conditions should be used. The fatigue threshold measurement represents a stress
intensity range at which the fatigue crack growth rate is below a critical valuei
(reported here as 10-7 mm/cycle unless otherwise noted). In most test conditions,
an asymptotic threshold behavior was measured but in some cases, such as in
100RH air, the power-law behavior extends to below crack growth rates of 10-8
mm/cycle. In using the fatigue threshold as a design parameter it is important to
consider potential crack growth increments due to the finite growth rates,
especially with non-asymptotic thresholds. The potential for accelerated
propagation of short cracks should also be incorporated [23]. In addition,
environmentally assisted fatigue crack growth rates are typically dependent on the
cyclic waveform and frequency. Accelerated environmental damage is expected
with an increase in the period at high stress and with low loading frequencies.m
Y

32
A second design method is to calculate the fatigue life by integrating a growth
rate law fit to the measured data. The most commonly used growth rate law (Eq.
1) assumes power-law behavior with a constant exponent, n. Of course, the data ..
can be fit to many additional mathematical forms which may more closely match
the data over the desired range of AK. To assess the fatigue life using this method,
one must make estimates of the initial crack length, the loading history, the stress
intensity due to component and crack geometry, the appropriate growth rate law,
and the critical stress intensity for unstable crack growth. A simple example is
given below.
First we assume a component and crack geometry which approximates a
single-edge cracked plate for which:
K=o_ [Eq. 4]
where K is the Mode I stress intensity, (_ is the applied stress, and "a" is the crack
length. Next we assume an alternating stress of a(_= (_max-amin and the growth
rate law of Eq. 1. Substituting for AK and integrating from an initial crack size ao
to a final crack size af for a total life of Nf fatigue cycles, then:' af Nf
da = CAO,n n / 2 f dN [Eq.5]f an/28O O
and,
(n-2)_-_nKn/2 a(on-21/2a(n-2) 2c [Eq.6]
The initial crack size can be estimated from intrinsic defects observed in
metallography, from the largest undected flaw size during non-destructive
evaluation, or from proof testing. The final crack size may be determined from
some allowable shape change or from the critical stress intensity for unstable crack
growth (KIC).
33
CONCLUSIONS
The fatigue properties of U6Nb have been measured to support design
evaluations based upon either the fatigue strengths determined from stress vs. life
(S-N) testing or fracture mechanics methods using fatigue crack propagation rate
data. The three stages of fatigue: crack initiation, crack propagation, and final
overload failure have each been characterized in this investigation. While most
of the testing was performed on material aged at 200°C for 2 h, tensile properties
and fatigue crack propagation rates were also measured in as-quenched material.
A number of specific conclusions are listed below.
Stress vs. fatigue life characteristics (aged U6Nb in lab air):
As is typical of nonferrous alloys, U6Nb does not exhibit a fatigue endurance
limit. The smooth bar fatigue strength decreases with increasing lifetime
requirements and failures continue to occur at lifetimes beyond (108) cycles.
The smooth bar fatigue strength is 248 MPa (36 ksi) and 300 MPa (43.5 ksi) for.i
fatigue lifetimes of 108 cycles and 107 cycles, respectively, using a lower-bound fit
to the data.
The fatigue strength is reduced by a factor of 3.3 for a severe notch with a
theoretical (elastic) stress concentration factor of 11. The notched bar fatigue
strength is 75 MPa (11 ksi) for a fatigue lifetime of 108 cycles.
For mean tensile loads of 275 MPa (40 ksi), the fatigue strength is reduced to 103
MPa (15 ksi) for a fatigue lifetime of 107 cycles. For mean loads of 483 MPa (70 ksi),
the fatigue strength is approximately 40 MPa (6 ksi) for a fatigue lifetime of 107
cycles.
Fatigue crack initiation occurs preferentially at inclusions identified as mixed
niobium-carbide and uranium-oxide. The largest inclusions observed in the
. J

°, - ,a
34
fatigue test plates were niobium carbides with a maximum diameter of 1.6(10 -2)
mm. Fractured inclusions are present in enhanced density along fatigue crack
paths and dominate as sources of ductile void initiation sites during overload .-
fracture.
Crack initiation lifetimes of 85 to 99.9 percent of the total lifetime were
measured for smooth bar specimens subjected to high mean tensile loads. A
novel application of a direct-current potential-drop technique was used for these
measurements with an estimated crack length detectability of 5(10 -3) mm (2x10 -4
inch).
Fatigue crack propagation rates:
Fatigue crack growth rates (FCGR's) of aged U6Nb in lab air decrease rapidly
with decreasing cyclic stress intensity (aK) to approximately 10 MPa_-_, below
which a plateau in growth rates occurs in which the FCGR's are relatively
insensitive to aK, and at lower aK decrease asymptotically to a threshold aK.
The fatigue threshold is 3.2 MPa'_-for FCGR's below 10-7 ram/cycle at an R-
ratio of 0.1. This threshold value was determined to be influenced by crack closure
which occurs above Kmin. The effective threshold AK, calculated as the difference
between the Kmax and K at crack opening is reduced to 2.1 MPa_.
With an increase in mean tensile loading imposed by constant Kmax fatigue
cycles, the fatigue threshold decreased further. At a Kmax of 14.6 MPa'_-_, the
fatigue threshold decreased to 0.9 MPa_--and at a Kmax of 30.5 MPa_/_, power-
law growth continued to below 0.6 MPa'_-with no asymptotic decreases in
FCGR's.
Fatigue crack propagation below AK's of approximately 10 MPa_resulted in
severe crack branching with multiple crack fronts. This crack branching persisted
for reductions in specimen thickness from 12.7 to 2.5 mm, for high R-ratios, and
for dry nitrogen (inert) environments. Macroscopic crack path tortuosity, as.,

35
observed on the fracture surfaces, increased in an aggressive environment of
100RH air and with increased mean tensile loads imposed by constant Kmax
• fatigue cycles.
In an inert environment of dry nitrogen, the FCGR's decreased relative to
those in lab air but maintained similar characteristics. An exception is the
presence of asymptotic threshold behavior at both Kmax values in the nitrogen
environment. The fatigue threshold was measured as 1.5 MPa_m--'and 0.8 MPa_---
for Kmax values of 14.6 MPa_-and 30.5 MPa_, respectively.
In an environment of 100RH air, power law growth continues to growth rates
below (10-8) mm/cycle for constant Kmax fatigue cycles of both 14.6 MPa_--and
30.5 MPa-_. FCGR's are reduced in this environment with respect to lab air or
dry nitrogen while the fracture path becomes increasingly tortuous. A clear
microstructural correlation with the crack path deviations could not be confirmed
although Nb banding is expected to exist on the appropriate microstructural scale.
Environmentally-assisted cracking is expected to be operative at a Kmax of 30.5
MPa'_ in high humidity environments based upon previous investigations..i

36(,
REFERENCES
1. K. H. Ecklemeyer, A. D. Romig, Jr., and L. J. Weirick, "The Effect of Quench Rate
on the Microstructure, Mechanical Properties, and Corrosion Behavior of U-6 Wt o°
Pct Nb", Met. Trans., 15A (7), 1319-30 (1984).
2. P.M. Finnerty, S.J. Hull, and P.A. Mackett, Proceedings of Conference, JOWOG
22C, A.W.R.E., Aldermaston, United Kingdom, 59-82 (1987).
3. K. H. Ecklemeyer, "Uranium and Uranium Alloys", from Metals Handbook, 2,
10th Edition, ASM International (1991)•
4. R. Oakes, supporting work performed at Oak Ridge Y-12 Plant, Development
Division (1990).
5. W.A. Herman, R.W. Hertzberg, and R. Jaccard, "A Simplified Laboratory
Approach for the Prediction of Short Crack Behavior in Engineering Structures",
Fatigue Fract. Engng Mater. Struct., 11 (4), 303-320 (1988).
6. D.C. Freeman and M.J. Strum, "Near Threshold Fatigue Testing", UCRL-ID-
2608, Lawrence Livermore National Laboratory (1992).
7. R.W. Bacon.)
8. L.R. Chapman, unpublished work, Oak Ridge Y-12 Plant, Development
Division (1989).
9. W.B. Snyder, "Fabrication and Characterization of Uranium-6 Noibium Alloy
Plate with Improved Homogeneity", Oak Ridge Y-12 Plant internal report Y-2135,
(1978).
10. R.J. Jackson, "Metallographic Study of Segregation in Uranium-Base Niobium
Alloys", Metallography, 6, 347-359 (1973).
11. D.H. Wood, J.W. Dini, and H.R. Johnson, "Tensile Testing of U/5.3 wt% Nb
and U/6.8 wt% Nb Alloys", J. Nucl. Matls., 114, 199-207 (1983).
12. Technical datasheet No. 2.2.6 Rev. 4, October 14, 1988, Oak Ridge Y-12 Plant.
_"w °

37
13. R.C. Anderson, "Impact Strength of the Uranium-6 Weight Percent Niobium
Alloy Between -198°C and +200°C '', Oak Ridge Y-12 Plant Internal Report Y-2248
-. (1981).
14. from "Atlas of Fatigue Curves", H. E. Boyer, editor, American Society for
Metals (1986).
15. M.J. Strum, D. C. Freeman, and N. Q. Nguyen; unpublished work.
16. W.G. Northcutt, Jr., Oak Ridge Y-12 Plant Development Division, private
communication (1989).
17. R.W. Hertzberg, in "Deformation and Fracture Mechanics of Engineering
Materials", John Wiley & Sons (1989).
18. R.W. Bacon, "Stress Corrosion and Corrosion Susceptibility of Depleted
Uranium-6 w/o Nb", A.W.R.E., United Kingdom, Report No. 026/84 (1984).
19. R.W. Bacon and A.N. Hughes, "Stress Corrosion and Corrosion Susceptibility
of Depleted Uranium-6 Nb", Proceedings of Conference, JOWOG 22C, A.W.R.E.,
Aldermaston, United Kingdom, 505-521 (1985).
20. N.J. Magnani, Sandia Albuquerque National Laboratory Internal Report,,i
SAND78-0439 (1978).
21. J.W. Koger, A.M. Ammons, and Ferguson, Oak Ridge Y-12 Plant Internal
Report Y-1999 (1975).
22. J.M. Barsom and S.T. Rolfe, in "Fracture and Fatigue Control in Structures:
Applications of Fracture Mechanics", 2nd Edition, Prentice Hall Publ., 407 (1987).
23. S. Suresh and R.O. Ritchie, "Propagation of Short Fatigue Cracks",
International Metals Reviews, 29, 445-476 (1984).
24. D. Taylor, in "Fatigue Thresholds", Butterworth & Co. Ltd. (1989).
Q

J
a
' '" "" Table I: Chemical Composition of U6Nb Test Plates .' ' "
Plate ID Ingot Location U (wt%) Nb (wt%) C (wt ppm)
A top center 93.32 6.39 103top edge - - 9 7
bottom center 94.3 5.91 -,,,
B top center 93.82 5.85 72top edge - - 5 8
bottom center 93.97 5.9 -


i
' " " Table UI: U6Nb Fracture loughness ." '
Specimen ID Material Condition Temperature Test Method Thickness (J)Q (K)Q
°C in. in-lb/in^2 MPa*m*0.5
1A, 2A ,as-Quenched 23 compact tension 0.5 1215* 114*
Aged 200C/2h
1AH (vacuum) 23 " " 0.5 1722* 137"
multi-specimenY-12 Aged 200°C/2h 23 bend 0.394 675 97
Y-12 Aged 200°C/2h -54 " " 0.394 655 96
2AH Aged 200°C/2h 23 compact tension 0.5 642 ° 95.....,,
* valid J(IC), K(IC)

Table IV: Fatigue Strength Reduction Factors
Material Specimen Mean Fatigue Strength Tensile Fatigue,TensileCondition Type Stress (10^8 cycles) Strength Strength Ratio
MPa (ksi) Mpa (ksi) MPa (ksi) %
quenched smooth RBF 0 240 (35)* 845 (123) 28
aged 200°C/2h smooth RBF 0 248 (36) 882 (128) 28
aged 200°C/2h notched RBF (Kt=11) 0 75 (11) 882 (128) 9
aged 200°C/2h smooth axial 275 (40) 103 (15) 882 (128) 12
aged 200°C/2h smooth axial 483 (70) 41 (6) 882 (128) 5
* from P. M. Finned'y, S.J. Hull, and P. A. Mackett; JOWOG 22C, June 1987.

_' • lb
' '" " Table V: Crack Initiation Lifetimes ."
Mean Load, Cyclic Amplitude, Total Lifetime, Initiation Lifetime, Propagation Lifetime,
MPa (k_si) UPa (ksi) # cycles # cycles (% of total) # cycles
276 (40) 121 (17.5) 4.1 E5 3.6 E5 (89) 4.5 E4
276 (40) 121 (17.5) 5.3 E5 4.5 E5 (86) 7.4 E4
,,,,,, ,
276 (40) 121 (17.5) 2.9 E7 2.9 E7 (99.87) 3.8 E4
276 (40) 129 (18.8) 2.0E5 1.7 E5 (86.5) 2.7 E4
483 (70) 52 (7.5) 1.9 E6 1.9 E6 (99.88) 2.3 E3

Table VI: Fatigue Thresholds for U6Nb Aged 200°C/2h
Load Ratio (R) or Test Environment Threshold Stress
constant Kmax value Intensity Range
(UPa'm^0.5) (MPa'm^0.5)
R=0.1 air (50RH) 3.2
14.6 air (50RH) 0.9
30.5 air (50RH) <0.6
14.6 dry nitrogen 1.5
30.5 dry nitrogen 0.8

. (.) Smooth-Bar Rotating Beam Fatigue Specimen
_ a x. cT,<,,.} I_¢/-/_/d/J I_/_i.oT, / J_l,' Vt i/i t
.5oo 1'/'44. I_z
co) Notched-Bar Rotating Beam Fatigue Specimen
(o Axial Mean Load Fatigue SpecimenR3.0000"
_'-___ 4.2_7B0' i=>
0.2 _ 0.5000"
r--- ------ " O. 1.650"
....-Illil _....Figure 1. Test specimen geometry for stress/life fatigue (S-N) tests: (a) smooth
.." bar specimen, Co)notched-bar specimen, (¢) mean axial-load specimen.

(a) ,so.._-nTT-n-TI_n,, ,__,i,'n_TTr'1 _rrrFrr_-lTnTrrrrnTrrFrr-rn-r_l_Trt.Nt-r,_ p rTrr'rrrq-T_rtTr_5
120. "_
_1...t-I "-" lOC_" _ Nx
- i_ 90,
_'_ _s,
111
p_ 60.
4$°
IS.
q. _111111tlltllltllt111 tlltlllllllltlI IlllLlllt1[lllltlllltl Illlllitlliltlt tlllJtl iltiltlllll_lt _lll{l_ tt111t_
-0.0_ 0. 0.0S 0. ! 0.15 0.2 0.2_. 0.3 0.3_ q. 4 0.4_ 0._
STRAIN( INo/INo I
t3S. --.-
-12'0.
\ -
u'_ =,,,,.. ...
-,.-, "
t.U -cr _- =t-- _o. _ ..:
4S. _
iO, llllltll 1111 I IIIII1 illlilll Illtlll Iullllll lllllll llll|ll lillllll I111 III l_l_ll{ I 11|_| !_l|l_ll Ill|Ill lilll_-0. O_ O, O. O_ O. 1 O. |_ O. 2' O. 2_ o, 3 _,.SE ,_.4 O. 4_ O.
"" STRAINt IN,,/IN,, J
. .-" Figure 2. (a, b) Stress vs strain curve for U6Nb: (a) as-received wrought condition, (b)vacuum heat treated 200 °C/2 h.

_00. _11111111]11111)111jIiil1111_iiIiiii 1111111111111]lli111iiii111111111j11111|l|ljl_iillllijl1111 i11 !
(d)
180. --=
160. ""
"5 -
140. _-
(19 120,
._., 2=_
09(/)UJ lO0" I
(:J (60,
40. -'_
=-,
20.r- _-
_
o. -I__j_||_|_i_Ij__|_j_1_j__I___|_I_z'O. 0.0_ O, I O. IE 0.2 0.2_ 0._ 0.3g 0.4 0,4g )._
STRAIN ): IN/I I',1)=
Figure 2. (c, d) Stress vs strain curve for U6Nb: (c) air furnace treated 200 °C/._h, (d)air furnace treated 200 °C/2h. "-

O_l fatigue amplitude, MPa
0 0 0 0 0 0• 0 0 0 0 0 0
.,.,i
o - -
° = _a/_I_ ....................................
"> .., __.,_LI.- 3o__........................ #
....................... __,__i '-'-0 _ " /- "= ¢_l __ : ...... • # ..IL ...........r,,l'l 0 ::Li2 _'..................... ._L:L_:_ ! L____:: :LL:L.:2::::2:_-<__--::2:::2_-----:::L.]:_-
g tli __ .D 5"=1-'-=. o I_IIIIIIIIIIILLIIII_717117171113'rT_;:......7777-71111111111777-77-71;7771© -"_" .......... - ,__/--.. - _ ," - -- - :............ l-----t---:iv- ............................ -'----- .............
.--.--- - :: -kz--::::-_ :::::: -_ ::_J._'_L!::.__::! : : 77::::-:: .::--:-:: ::L__:_ :::: :--L:--,7{:{:-
! ° .............r.,= ...............
. "11
-::_.:-::_;",-!./ ...................................._,_,............:........_=_.___-.....-_-__-_--_,-.........._-i...........................Ul _ _ : _: _ - : -- ,-- -:_,-,, I:::• --:7-:-::_--_---:-:_-:-L--_--:'-:--!i7_::i_7:!:_,:::::7--7:::7_p:_::_7<-<<<_7:_77_7777:7_r-:7ill
0
<<> /
:_:_'iii__iii:7::i7__:'ii_i:i::.............'...... :ii:i_i:i:i_;7i_!i-_i`..iiii::_i_<-':_i::i_'::-t:::_i_:i-::_!_iiii!i_:--i_iiiii_-•...i --'_-_"-_'_--_-_\L----_--_"\-_--\-_--_'_-_-_-_-:-_--_--:--:L-_-_-:-L--_-_-:-L-L1 :-'_'-"--_'.'_-_-\L'_'__"--"-"-----L--""----------'-'--'-'----:--_:L\--'----------"11--:----:----"-'£--------
0

.
J
Figure 4. Fatigue strength of notched-bar specimens.

U6Nb Aged 200°C/2h:275 MPa (40 ksi) Mean Load
150
140 -m"i_.....................................................................................................................X
¢iO. 130 "----_-_.,i --r i_- _-: ........::-: .................. '....
o"o E,.., 120
= j
m 100 ..... .. "_" --
.f,
a..w.80
10 5 10 6 10 7 10 8
# cycles to failure
,=
Figure 5. Axial bar fatigue strength for 40 Ksi (275 MPa) mean load.
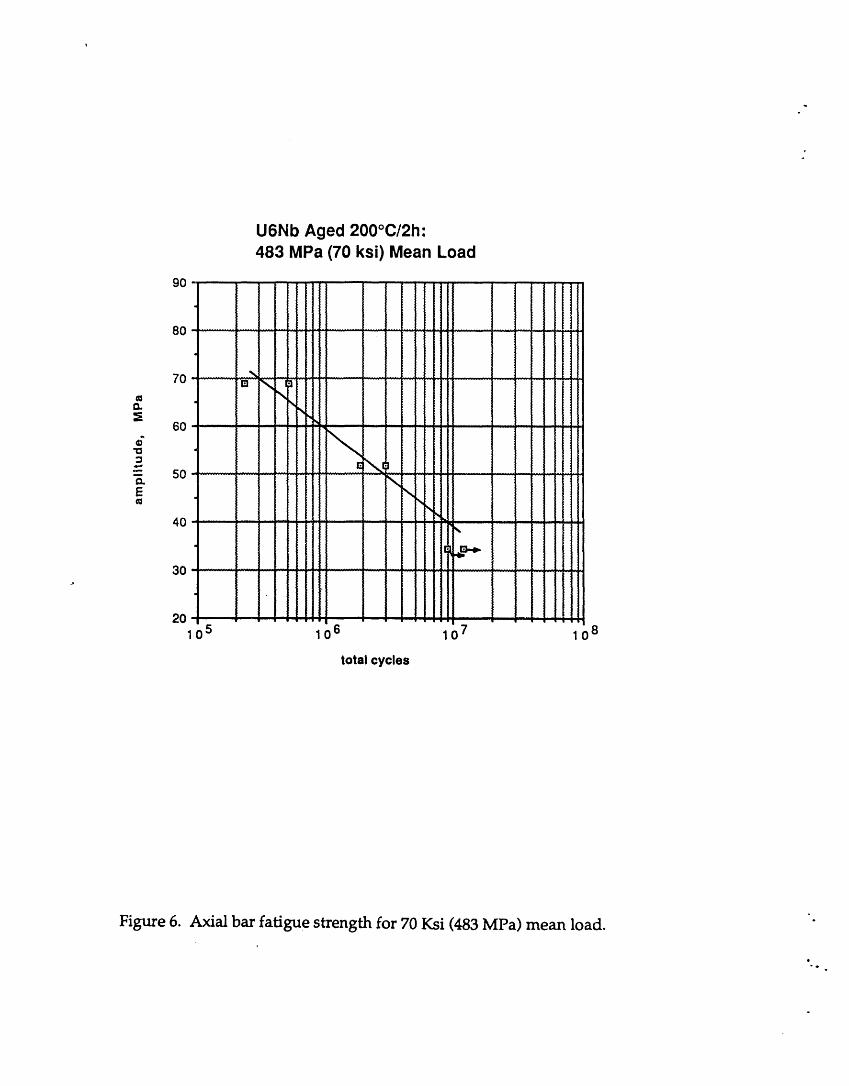
U6Nb Aged 200°C/2h:483 MPa (70 ksi) Mean Load
90
80
7O
¢Ua.
606"0
= 5OE
40
3O.i
2010 5 10 6 10 7 10 8
total cycles
Figure 6. Axial bar fatigue strength for 70 Ksi (483 MPa) mean load. "
°o

°
U6Nb Aged 200°C/2h:Fatigue Strength vs. Mean Stress
30O
1= U6Nb Aged 200°C/2h I
13.
200 \ \
"% \ _ Gerber
= \ \
Soderberg N\
0 . . , . . ,\... , . . , '_..0 200 400 600 800 1000
mean stress, MPa
/=
Figure 7. Fatigue strength vs. mean tensile load (10^7 cycles to failure).

Fatigue Test-Binary AlloySpecimen #16
0.0320 i J i i l ! i i , i
0.0318 - 278 Mpe-mean etrenm121 Mpa-eyclic amplltude
0.0316 - Felled et 5.3x1Oacyclee
"_ 0.0314-v
o. 0.0312-o
D0.0310 -m
U
c 0.0308 -..-.
o /m 0.0306 - / -
./--
o 0304 ............. --11-e
• - ................ -": "'"" " -.- baseline
0.0302 -
0.0300 t I I I t I l I l I80 82 84 86 88 90 92 94 96 98 100 102
of Cycles to Failure
Figure 8. (a) Direct-current potential-drop (DCPD) crack initiation data for a mean stress of 40 Ksi (276 MPa).

High Mean Stress Fatigue Test-Binary AlloySpecimen #3
I I I I
• 0.0334 -4fl3 Mpa-mean 8tresa
52 Idpa-cyclic amplitude0.0332 -Failed at 1.gxlOecyelen
0.0330 -
>v 0.0328-a.o" 0.0326 -
a
.o 0.0,324 -t-o..,-, 0.0322 -
" 0I'1
0.0320 :"-"""" ..... rr '- ....... ' ............. -.--baseline
0.0,318 -
0.0316 -I I I I
99.6 99.7 99.8 99.9 100.0 100.1
of Cycles to Failure
Figure 8. (b) Direct-current potential-drop (DCPD) crack initiation data for a mean stress of 70 Ksi (483 MPa).

Fatigue crack initiation in aged U-6Nb;Rotating-Beam-Fatigue Test2.5 (106) cycles to failure at 400 MPa (57 ksi) peak stress
21xm 20txmu I I II I i i
Figure 9. (a) Typical fracture surfaces of smooth-bar bend specimens loaded to an amplitude of57 Ksi (400 MPa).

20 pmi
5 l.u'n
• "" Figure 9. (b) Typical fracture surfaces of smooth-bar bend specimens loaded to anamplitude of 50.8 Ksi (350 MPa).

Fatigue crack initiation in aged U-6Nb;Rotating-Beam-Fatigue Test2.5 (lOS) cycles to failure at 400 MPa (57 ksi) peak stress
t
t
Niobium-carbide inclusion (marked)adjacent to uranium-oxide inclusion
Figure 10. Fatigue initiation site identified as a cluster of niobium carbide and uranium oxide inclusions.

Fatigue striations in aged U-6Nb; Rotating-Beam-Fatigue Test2.5 (106) cycles at 400 MPa peak stress
5 I.I.m 2 I_mI, ] ! I
Figure 11. Fatigue striations on a smooth bar bend specimen loaded to an amplitude of 57 Ksi (400 MPa).

U6Nb Aged 200°C/2h • Lab Air, R=0.1
10"2, ..........................
IIv v !
II• B=12.7 mm
_.=o 4 =1 , " " " II K-incr. test (2,3,4.AH)>, 10" +.............
" _ m K-decr. test (5,6.AH)E u
k"E zzmI
10" 5 ...................... i __mg"o
,= =.=1_=t]""o ..iz
10 6 I L
10-7 ....1 10 100
Kmax-Kmln, MPa*m^0.5
Figure 12. Fatigue crack growth rates of U6Nb aged 200 °C/2 hr.; R = 0.1 in -.laboratory air environment.
,0-t +

As-Quenched vs Aged (200°C/2h) U6Nb:Lab Air, R=0.1
10" .....
&
10" 5, _....................................................... .&. ............ 1.....
Q"_ la as-quenched>, - 6, zz as-quenched(noclosure)o 10 -........... " ...................... i ..... ................................E & aged 200°C/2hE
Zi
10.8 ..... I .......1 10 100
Kmax-Kmln,MPa*m^.5
t.
Figure 13. Fatigue crack growth rates of as-quenched vs. aged U6Nb; R = 0.1 inlaboratory air environment.
,i

Fatigue crack-growth-rate specimen profile; i
Aged U-6Nb
501_mI _!I I
Figure 14. Fatigue fracture cross-section illustrating the path of fatigue crack " •propagation for aged U6Nb; R = 0.1 in laboratory air environment.

U6Nb Aged 200°C/2h: Lab Air, R=0.1
.J
10"8.1 10 100
Kmax-Kmin, MPa*m^0.5
Figure 15. Fatigue mac1<,growth rates in 2.5 mm and 12.7 mm thick aged°
" specimens; R = 0.1 in laboratory air environment.
Q

U6Nb Aged 200°C/2h: Lab Air
10-4.,
10"5 .............................. I
_, [] B=2.5 mmo
E n a [] Constant Kmax=14.6E 10" 6 ........... , _--=.................................. -........................... m Constant R=0.1
i =IQ
"0
10" 7 .............................................. i............
g
10 .8. _ ]i.1 1 10 100
Kmax-Kmin, MPa*m^0.5
Figure 16. Fatigue crack growth rates at constant Kmax = 14.6 MPa'_and atconstant R-0.1; 2.5 mm thick, aged specimens, tested in laboratory airenvironment. ..
,i

U6Nb Aged 200°C/2h: AirConstant Kmax
10-3
[] Kmax=14.6 MPa*m^0.5
10" 4 • Kmax=30.5 MPa°m^0.5
.t
10-8.1 1 10 100
dK, MPa*m^0.5
Figure 17. Fatigue crack growth rates at constant Kmax = 14.6 MPa'_and
30.5 MPa'_-; 2.5 mm thick specimens, aged, tested in laboratory air" envrionment.
oo.
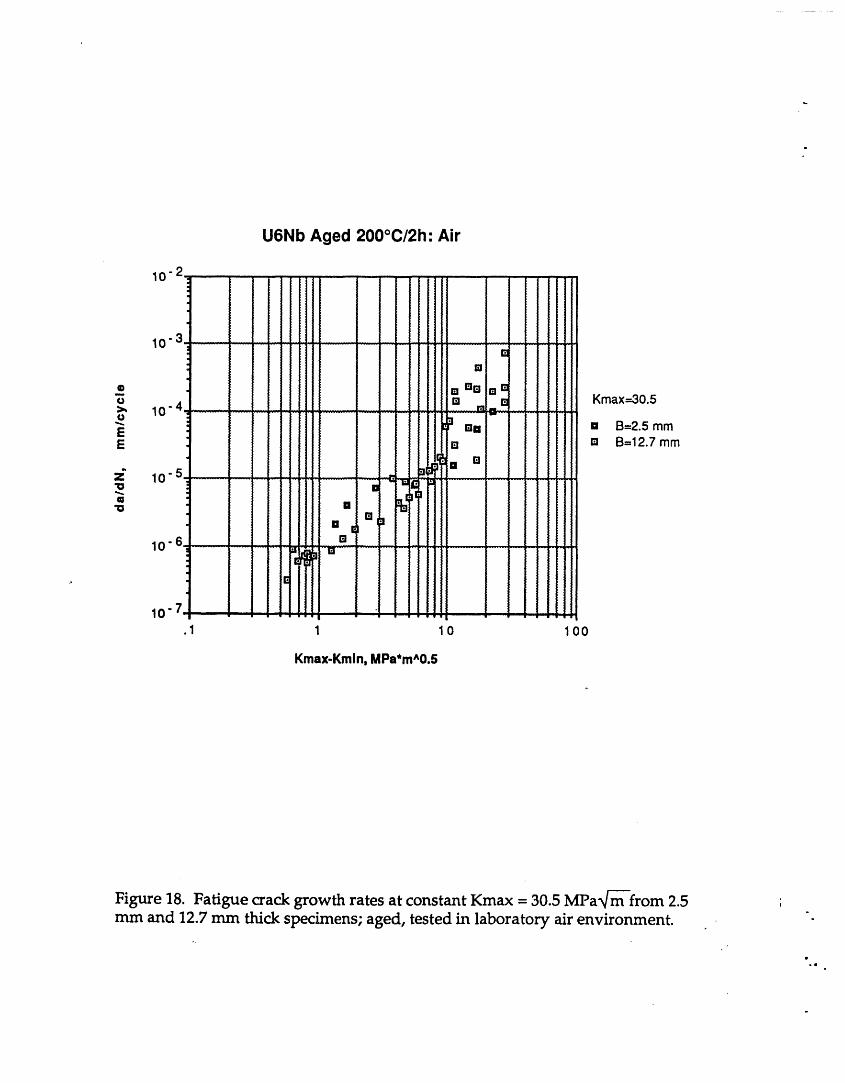
U6Nb Aged 200°C/2h: Air
10"3.
10-6.
10-7.
.1 1 10 100
Kmax-Kmin, MPa*m^0.5
Figure 18. Fatigue crack growth rates at constant Kmax = 30.5 MPa_--from 2.5mm and 12.7 mm thick specimens; aged, tested in laboratory air environment.
..
.e

U6Nb Aged 200°C/2h: Air
.i
10-7..1 1 10 100
Kmax-Kmin, MPa*m^0.5
Figt_re 19. Fatigue crack growth rates at constant-R = 0.1 and constant Kmax =
30.5 MPa'_ aged specimens, 12.7 mm thick, tested in laboratory air" environment.
o
I.
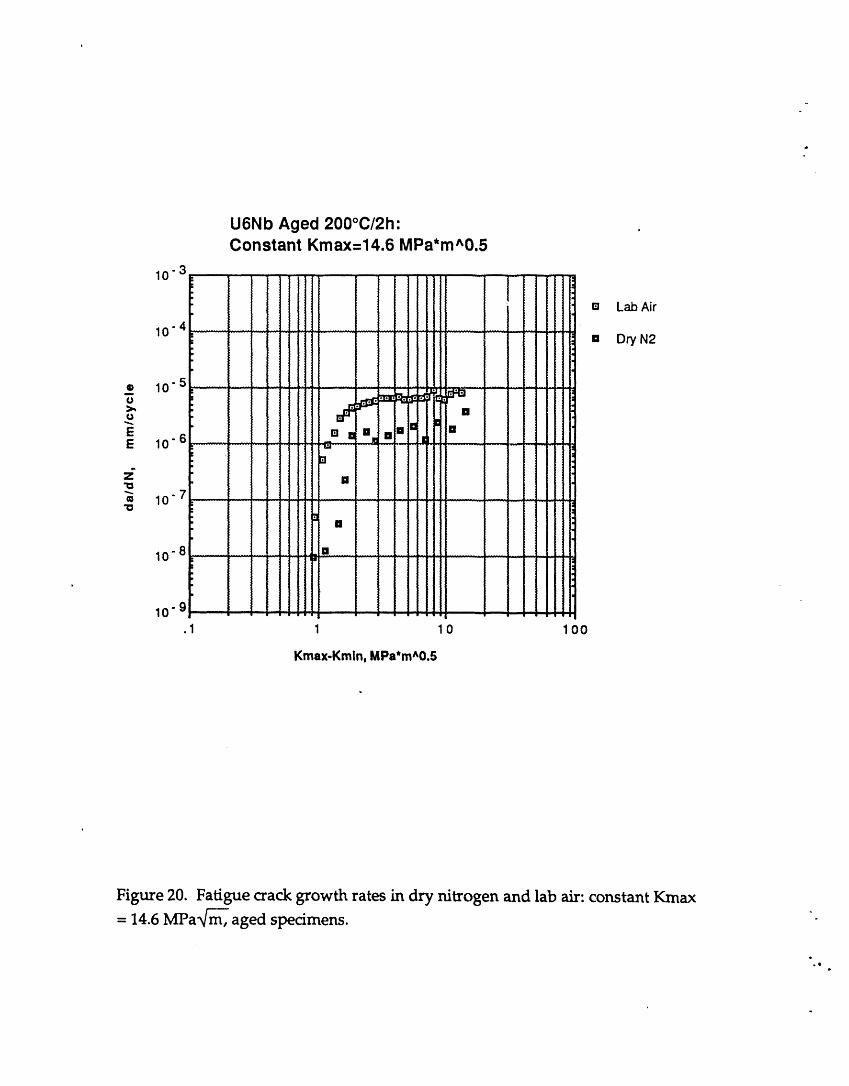
U6Nb Aged 200°C/2h:Constant Kmax=14.6 MPa*m^0.5
10-3
m Lab Air
10-4m DryN2
• 10 5o>,,o
EE 10 -6
z"
w 10
10"8
10"9.1 1 10 100
Kmax-Kmin, MPa*m^0.5
Figure 20. Fatigue crack growth rates in dry nitrogen and lab air: constant Kmax= 14.6 MPa_, aged specimens.
_Q

U6Nb Aged 200°C/2h:Kmax=30.5 MPa*m^0.5
10-3.
10"4.
10"9.1 1 10 100
Kmax-Kmin, MPa*m^0.5
Figure 21. Fatigue crack growth rates in dry nitrogen and lab air: constant Kmax" = 30.5 MPa_, aged specimens, 12.7 mm thick.
..
0,.

Figure 22. Fatigue crack growth rates in moisture-saturated air at constant Kmax
= 14.6 and 30.5 MPar_ aged U6Nb, 12.7 mm thick.
°e

As-Quenched U6Nb:
Constant Kmax=14.6 Mpa*m^0.5
10"3,
10"4,
_.e 10"5 B=12.7mmo
tJ
E[] /,., I..,AirE 10" 6. '-='.'
i • DryN2"0
m -7.-o 10
i
10"9..1 1 10 100
Kmax-Kmin,MPa*m^0.5
Figure 23. Fatigue crack growth rates in lab air and dry nitrogen; constant Kmax
- = 14.6 MPa_, as-qu.enc.hed U6Nb, 12.7 mm thick...

Figure 24. Fatigue crack growth rates of as-quenched plate vs. plate aged U6Nb;
dry"nitrogen atmosphere, constant Kmax = 14.6 MPa_, 12.7 mm thickspecimens.
.11

20 _mI _II I
t
Figure 25. Optical micrograph of U6Nb aged 200 °C/2h.wI

50 _m
2O_mm,,Mmm,w_..,..
o
Figure 26. Fracture profile of U6Nb aged 200 °C/2h showing martensitic "-"substructures and secondary fatigue cracks.

Maximum Individual Carbide Sizes in each of 57 heats of U6Nb
(from 1.9 mm^2 random areas of ingot center and edge samples) [8].
3O
O:1•_ 20
Q
U.
10
0100 150 200 250 300 350 400 450 500 550 600 650 700
Maximum Carbide Area, ml©ron=^2
.. Figure 27. Maximum carbide sizes observed from center and edge sections ofeach of 57 heats of U6Nb [8].
Q_

0
P
Inclusion Characterization of U6Nb
(from 57 heats produced at Y-12 [8])lO0
.10-10 10-100 100-200 >200
carbidesize(mlcrons*2)
Figure 28. Mean carbide size distributions at edge and center sections of 57 heatsof U6Nb [8].
..
tt
_IIM ,,

10 I_mi
"- Figure 29. Fracture surface of aged U6Nb produced by tensile overload.

Figure 30. Fracture profile showing secondary fatigue cracks in test atmospheresof 100 RH air at constant Kmax = 30.5 MPa_.
50 _.m
Figure 31. Fracture profile showing secondary fatigue cracks in test atmospheres "-"of dry nitrogen at constant Kmax = 14.6 MPa_.
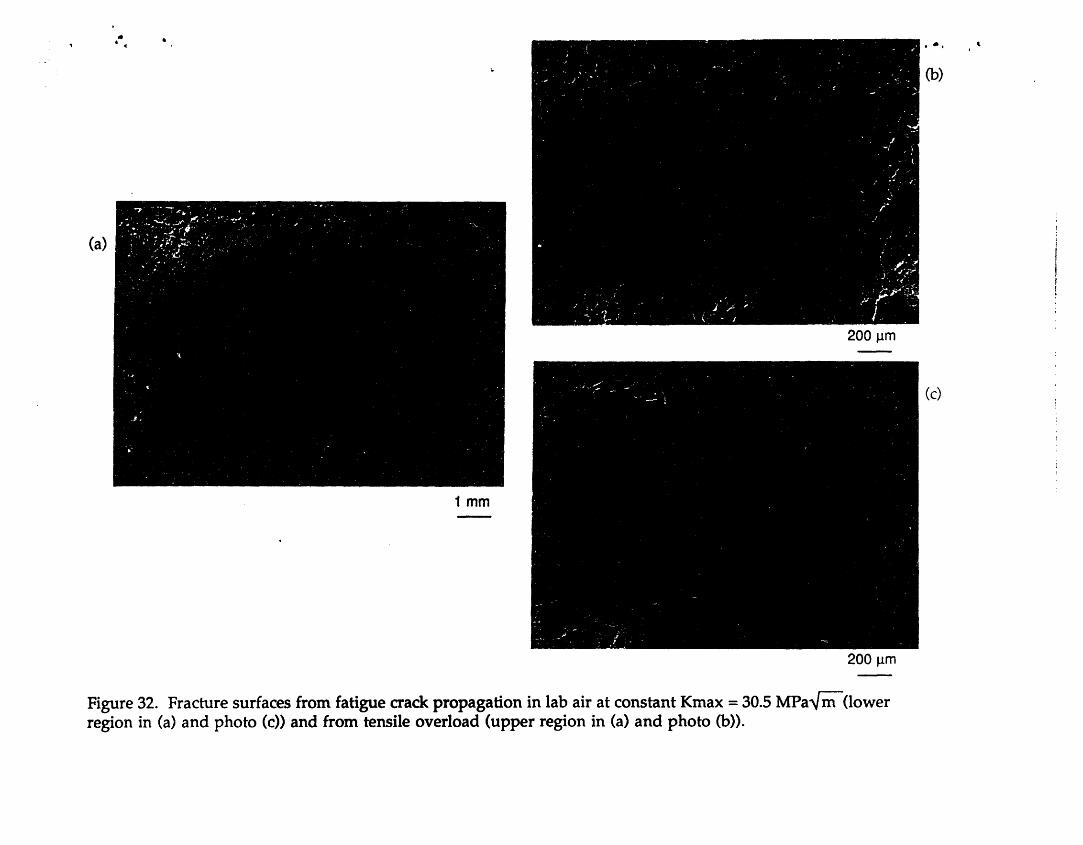
(a)
200 I_m
(c)
1mmI
200 p.m
Figure 32. Fracture surfaces from fatigue crack propagation in lab air at constant Kmax = 30.5 MPa_m--(lowerregion in (a) and photo (c)) and from tensile overload (upper region in (a) and photo (b)).
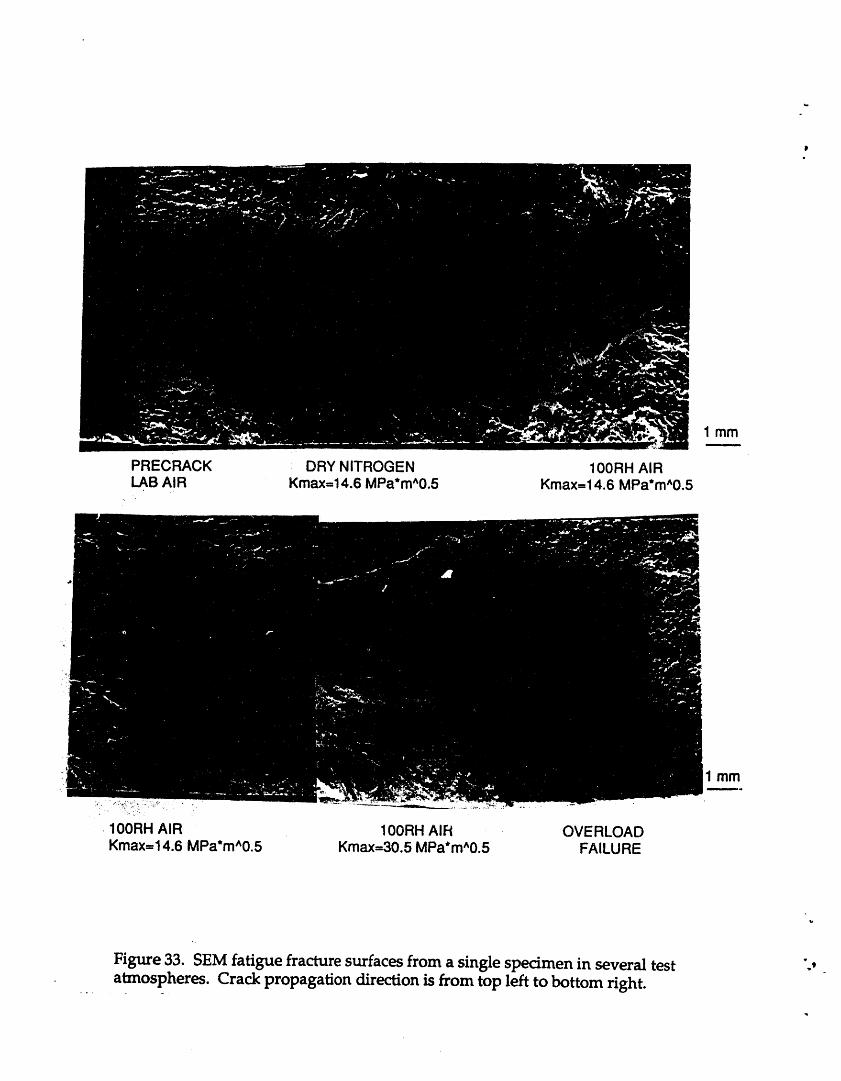
1 mm
PRECRACK DRY NITROGEN 100RH AIRLABAIR Kmax=14.6MPa*m^0.5 Kmax=14.6 MPa*m^0.5
/_ 1 mm,m,...mm.mm.
100RH AIR 100RH AIH OVERLOADKmax-14.6 MPa*m^0.5 Kmax-30.5 MPa*m*0.5 FAILURE
,b
Figure 33. SEM fatigue fracture surfaces from a single specimen in several test ".,
atmospheres. Crack propagation direction is from top left to bottom right.• ° .

• °-" Figure 34. SEM fatigue fracture surface from tests in dry N2 at constant Kmax =
14.6 MPa'_. Crack propagation direction is left-to-right.

2O _m
Figure 35. Fatigue fracture surface from tests in dry N2 at constant Kmax = 30.5
MPa_. Crack propagation direction is left-to-right.

". Figure 36. SEM fatigue fracture surface imaged with backscattered electrons
from tests in dry N2 at constant Kmax = 14.6 MPa_. Crack propagation. direction is left-to-right.

illql _1 I II II IIIIII I ................. Iii [ .................. il,,,,,,,,, ,,, "
,i i
I
"IP
100 l_m--
10p'n
Figure 37. Fatigue fracture surface from tests in 100 RH air at constant Kmax = -'
14.6 MPa_. Crack propagation direction is left-to-right.

qt
10 pm
v Figure 38. Fatigue fracture surface from tests in 100 RH air at constant Krnax =
,_ 30.5 MPa_. Crack propagation direction is left-to-right.f

,e
Height _. &Totais Data E;_!822.DT2"rota1% TRAVERSE 90 DE(;; TO CRACK
180-'- -. _ '..... _...... i ....................=
- U
=
....
10 2_ 38
LII'IE TRAVERSE, SCALE MICRONS X 2
w
Figure 39. Electron microprobe line profile of Nb and U concentrations parallel , •to the original rolling plane and perpendicular to a secondary fatigue crack. "
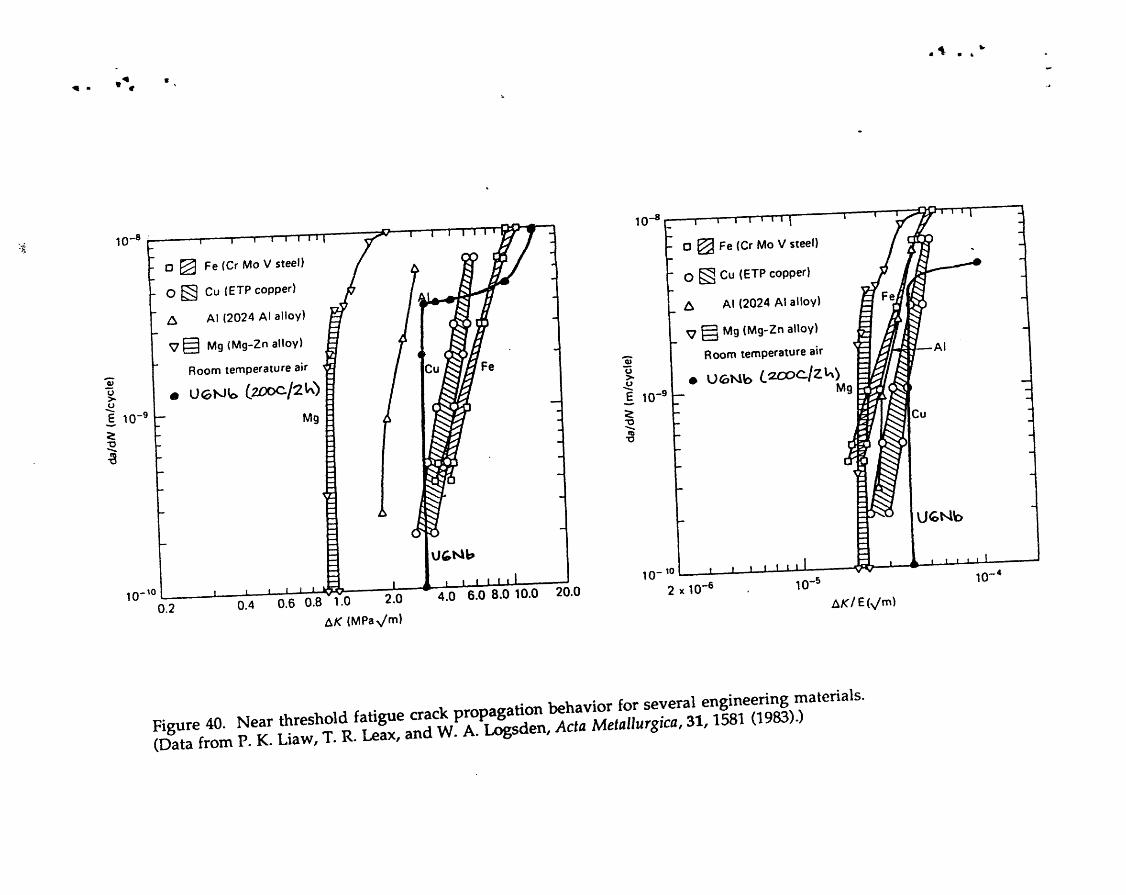
tqlp •
10-8 7_, 10 -s
13 _ Fe (Cr Mo V steel) .
13 E_ Fe (Cr Mo V steel)0 _ Cu (ETP copper) I2
O_] Cu(ETPcopper) ! e_A A! (2024 AI alloy) _ AI (2024 AI alloy) F
_ Mg (Mg-Zn alloy) V _ Mg (Mg-Zn alloy) _, ,lk*lrl
Room temperature air _::_j_j_
Room temperature air Fe "6o
E 1v
E 10 -9 Mg _ Cu
--_"
+ iU_b
U_t4b• I I | t t I
10- to ' -- 10 -4
10-_o 2 10 -s 10-s0.2 0.4 0.6 0.8 1.0 2.0 4.0 6.0 8.0 10.0 2U.0 x ,',KIE(\/m)
AK (MPa _/m)
. fat1 e crack propagation behavior for several engineering materials.Figure 40. Near threshold "gu "ca 31 1581 (1983).)(Data from P. K. Liaw, T. R. Leax, and W. A. Logsden, Acta Metal|urgz , •