Illinois Metropolitan Investment Fund · America Merrill Lynch 91 Day T-Bill Index. Please refer to...
95
Year ended September 30, 2016 Illinois Metropolitan Investment Fund Comprehensive Annual Financial Report
Transcript of Illinois Metropolitan Investment Fund · America Merrill Lynch 91 Day T-Bill Index. Please refer to...
Year ended September 30, 2016
Illinois Metropolitan Investment Fund
Comprehensive Annual Financial Report
Sofia Anastopoulos
Executive Director
Chief Investment Officer
Illinois Metropolitan Investment Fund
Comprehensive Annual Financial Report
Year ended September 30, 2016
Transmittal Letter i - iv
Board of Trustees v
Supporting Chicago Area Councils of Government and External Advisors vi
Organizational Chart vii
Certificate of Achievement for Excellence in Financial Reporting viii
Independent Auditors' Report 1 - 3
Management's Discussion and Analysis (Unaudited) 4 - 8
Basic Financial Statements:
Combining Statement of Fiduciary Net Position 9
Combining Statement of Changes in Fiduciary Net Position 10
Notes to the Financial Statements 11 - 29
Required Supplementary Information (Unaudited)Multiyear Schedule of Changes in Net Pension Liability and Related Ratios -
Illinois Municipal Retirement Fund 30Multiyear Schedule of Contributions - Illinois Municipal Retirement Fund 31Notes to the Required Supplementary Information 32
Other Supplementary Information
Schedule of Net Position - IMET Administrative Operations 33Schedule of Changes in Net Position - IMET Administrative Operations 34
Schedule of Administrative and Other Expenses - Budget and Actual 35
(Continued)
FINANCIAL SECTION
ILLINOIS METROPOLITAN INVESTMENT FUND
Comprehensive Annual Financial ReportYear Ended September 30, 2016
Table of Contents
INTRODUCTORY SECTION
36 - 39
Select Comparative Data - IMET 1-3 Year Series 40
Select Comparative Data - IMET Convenience Series 41
Schedule of Investments - IMET 1-3 Year Series 42 - 45
Schedule of Cash and Investments - IMET Convenience Series 46 - 49
Schedule of Management Fees 50
Schedule of Participants by Concentration 51
Investment Policy - IMET 1-3 Year Series 52 - 59
Investment Policy - IMET Convenience Series 60 - 67
Index for Statistical Section 68
69 - 70
71 - 72
73 - 74
75
76
STATISTICAL SECTION (Unaudited)
INVESTMENT SECTION (Unaudited)
Report on Investment Activity
ILLINOIS METROPOLITAN INVESTMENT FUND
Comprehensive Annual Financial ReportYear Ended September 30, 2016
Table of Contents (Continued)
Principal employers - State of Illinois - fiscal years 2015 and nine years ago
Demographic and economic statistics - State of Illinois - last ten calendar years
Schedule of fiduciary net position - last ten fiscal years
Schedule of changes in fiduciary net position - IMET 1-3 Year Fund - last ten fiscal years
Schedule of changes in fiduciary net position - IMET Convenience Series - last ten fiscal years

INTRODUCTORY SECTION

Christy Powell
Superintendent of Finance
& Personnel
Geneva Park District
Chairman
Eileen Santschi
Accounting Manager
South Suburban Mayors and
Managers Association
Vice Chairman
Gary Szott
Director of Finance/Treasurer
Village of Bloomingdale
Treasurer
John Harrington
Director of Finance/Treasurer
Village of Minooka
Secretary
Scott Anderson
Director of Finance/Treasurer
Village of Buffalo Grove
Trustee
Chris Minick
Director of Finance
City of St. Charles
Trustee
Brian Murphy Village Administrator Village of Plainfield Trustee
Sofia Anastopoulos, CFA
Executive Director
Chief Investment Officer
Debra A. Zimmerman
Associate Director
Investing together for our communities
1220 OAK BROOK ROAD | OAK BROOK, IL 60523 | PHONE 630-571-0480, ext. 229 | FAX 630-571-0484 | www.investIMET.com
-i-
February 13, 2017
Dear IMET Participants:
We hereby submit to you the twentieth Comprehensive Annual Financial Report of
the Illinois Metropolitan Investment Fund (IMET), which covers the fiscal year of
October 1, 2015 through September 30, 2016. In accordance with the Illinois
Compiled Statutes and the Illinois Metropolitan Investment Fund Second Amended
and Restated Declaration of Trust, dated as of January 20, 2012, an annual
independent audit of all funds and accounts of IMET shall be conducted by certified
public accountants licensed to practice public accounting in the State of Illinois. This
report is published to fulfill that requirement, for the fiscal year ended September 30,
2016. Responsibility for the accuracy of the data and the completeness and fairness
of the presentation, including all disclosures, rests with the Board of Trustees and
Executive Director, and is based upon a comprehensive framework of internal
controls that is established for this purpose.
To the best of our knowledge and belief, the enclosed data are accurate in all material
respects, and are reported in a manner designed to present fairly the financial position
and changes in financial position of IMET in conformity with accounting principles
generally accepted in the United States of America (GAAP) and audited in
accordance with auditing standards generally accepted in the United States of
America, by a firm of licensed certified public accountants. Because the cost of a
control should not exceed the benefits to be derived, the objective is to provide
reasonable, rather than absolute assurance, that the financial statements are free of
any material misstatements. Management is responsible for maintaining a system of
adequate internal accounting controls designed to provide reasonable assurance that
transactions are executed in accordance with management’s general or specific
authorization, and are recorded as necessary to maintain accountability of assets and
to permit preparation of financial statements in accordance with GAAP. We believe
the internal controls in effect during the fiscal year ended September 30, 2016,
adequately safeguard IMET’s assets and provide reasonable assurance regarding the
proper recording of financial transactions. All disclosures necessary to enable the
reader to gain an understanding of IMET’s financial activities have been included.
The data presented in the Investment Section is prepared on a basis consistent with
the other sections of the report using data provided by reliable third party sources.
Miller, Cooper & Co., Ltd., Certified Public Accountants, have issued an unmodified
opinion on IMET’s financial statements, for the fiscal year ended September 30,
2016. The independent auditors’ report is located at the front of the Financial Section
of this report.
-ii-
1220 OAK BROOK ROAD | OAK BROOK, IL 60523 | PHONE 630-571-0480, ext. 229 | FAX 630-571-0484 | www.investIMET.com
Generally accepted accounting principles (GAAP) require that management provide a narrative introduction,
overview, and analysis to accompany the basic financial statements in the form of Management’s Discussion
and Analysis (MD&A). This letter of transmittal is designed to complement the MD&A and should be read in
conjunction with it. IMET’s MD&A can be found immediately following the report of the independent
auditors.
IMET PROFILE
IMET is a local government investment pool created in 1996. In the early 1990’s, the idea to develop an
intermediate term investment fund was formed out of the discussions of various individuals who were not
satisfied with the low returns being earned on the investments then currently available to public funds
managers. Changes were occurring on the permissible investments for pension funds and the time seemed
appropriate to research and create an investment vehicle to meet the needs for public funds managers. A
committee was formed by five Chicago Metro Councils of Government (COGs) - the Will County
Governmental League, West Central Municipal Conference, DuPage Mayors and Managers Conference, South
Suburban Mayors and Managers Association, and the Northwest Municipal Conference to evaluate various
strategies for the creation of the investment fund. The newly formed committee received legal assistance and
direction from Chapman & Cutler LLP, in the creation of the investment fund. After numerous committee
meetings over the course of a few years, the Illinois Metropolitan Investment Fund (IMET) was established, as
a not-for-profit investment fund under the Intergovernmental Cooperation Act and the Illinois Municipal Code,
on July 1, 1996. The investment fund, called the IMET 1-3 Year Series, was designed as a pooled, intermediate
term investment vehicle intended for funds that could be invested for more than one year. The Series was
structured with a fluctuating Net Asset Value (NAV) and an average maturity of one-to-three years, with
investments exclusively in U.S. government backed securities (Treasuries and agencies). Each of the five
founding COGs secured commitments from at least one of their respective members for an initial deposit into
the fund. In September 2003, a second investment option was developed for IMET members. This second
investment option, called the Convenience Series (CVF), was created to provide members with an additional
asset allocation option for their public funds and is designed with money market-like characteristics. The CVF
is managed to maintain a stable $1.00 share price and holds deposits and investments authorized by the Illinois
Public Funds Investment Act. IMET is available to all governmental units in the State of Illinois for the
purpose of jointly investing the funds of which the governmental unit treasurer has custody. IMET has 273
members, as of September 30, 2016.
INVESTMENT POLICIES AND PRACTICES
The primary objectives of the IMET investment pools – the 1-3 Year Series and the Convenience Series, as set
forth in their respective Investment Policies included in the Investment Section, are preservation of principal,
liquidity, and return on investment. It is the policy of IMET to invest public funds of Illinois governments in a
manner that seeks to provide the best return while pursuing the preservation of capital. IMET investment funds
conform to Illinois state statutes governing the investment of public funds. The standard of prudence used for
all investment activities is the “prudent person” standard and is applied in conducting all investment
transactions. Investments are made with the judgment and care, under circumstances then prevailing, that
persons of prudence, discretion and intelligence exercise in the management of their own affairs, not for
speculation, but for investment, considering the probable preservation of their capital as well as the probable
income to be derived thereof.
-iii-
1220 OAK BROOK ROAD | OAK BROOK, IL 60523 | PHONE 630-571-0480, ext. 229 | FAX 630-571-0484 | www.investIMET.com
YEAR END REPORT
Volatility continued in 2016 due to national and global economic and political forces. For fiscal year 2016, the
1-3 Year Series had a total return of 0.89% on a gross of fees basis (0.61% net of fees) compared to a return of
0.89% for its benchmark, the Barclay’s Capital 1-3 Year Government Bond Index. For fiscal year 2016, the
Convenience Series yield was 0.44% (net of fees) compared to a 0.27% yield for its benchmark, the Bank of
America Merrill Lynch 91 Day T-Bill Index. Please refer to the Investment Section of this CAFR for additional
information on investments for each investment fund.
During 2016, the 1-3 Year Series had a 4.1% increase in assets to $182.0 million. The Convenience Series had
a 6.3% decrease in assets during FY 2016 to $497.1 million. This decrease was due primarily to the on-going
dislocation from the First Farmer’s Financial fraud. A victim of this fraud, IMET continues to work diligently
with the court appointed Overall Receiver and to explore other avenues with counsel to recover assets for fund
participants. The Convenience Series continued to provide solid performance, providing returns that are
attractive compared to other Illinois investment pools and very competitive compared to local bank rates. In
certain cases, IMET’s advantage compared to local bank offerings is the feature for participants to invest in the
Convenience Series without restriction, whereas certain banks may offer higher rates, but may place restrictions
(such as on amounts or withdrawals). IMET continues to negotiate attractive rates for investments in the
Convenience Series for participants, and we expect the Convenience Fund rate to continue to keep pace with the
rising rate environment anticipated in 2017. IMET serves more than 270 units of government, including
municipalities, pension funds, park districts, library districts, school districts, and other public agencies.
IMET had a productive FY 2016. A major accomplishment of fiscal year 2016 was the selection and
appointment of IMET’s new Executive Director, Sofia Anastopoulos, after an exhaustive national search. The
Executive Director and the IMET Board of Trustees, along with IMET’s partners, the Mischler Financial Group
Inc., Fifth Third Securities, Associated Bank and US Ameribank continue to position the Convenience Series
for continued competitive risk-adjusted rates of return.
IMET’s goals for FY 2017 are to continue to add value to our participants in a rising interest rate environment.
We will strive to maintain stability and strength in the 1-3 Year Series and Convenience Series, while
continuously looking for opportunities to enhance yields for participants without compromising safety. IMET’s
Trustees wish to secure sustainable growth.
In everything we do, IMET seeks to be a steward for participants, earn their trust and deserve their confidence.
-iv-
1220 OAK BROOK ROAD | OAK BROOK, IL 60523 | PHONE 630-571-0480, ext. 229 | FAX 630-571-0484 | www.investIMET.com
AWARDS AND ACKNOWLEDGEMENTS
The Government Finance Officers Association of the United States and Canada (GFOA) awarded a Certificate
of Achievement for Excellence in Financial Reporting to the Illinois Metropolitan Investment Fund for its
Comprehensive Annual Financial Report for the fiscal year ended September 30, 2015. This was the fifth
consecutive year that IMET has achieved this prestigious award. In order to be awarded a Certificate of
Achievement, a government must publish an easily readable and efficiently organized comprehensive annual
financial report. This report must satisfy both generally accepted accounting principles and applicable legal
requirements.
A Certificate of Achievement is valid for a period of one year only. We believe that our current Comprehensive
Annual Financial Report continues to meet the Certificate of Achievement Program’s requirements and we are
submitting it to the GFOA to determine its eligibility for another certificate.
Each member of the Board, each volunteer on IMET’s standing committees, and each participant makes IMET
the strong, creative, and cooperative membership organization that it is today and will continue to be. Your
continued participation in this joint endeavor is welcome and sincerely embraced.
The preparation of the Comprehensive Annual Financial Report on a timely basis was made possible by the
dedication and hard work of the Board of Trustees, our Audit standing committee and staff. Each member of
the Board of Trustees, audit committee volunteer and staff has our sincere appreciation for the contributions
made in the preparation of this report. In addition, our appreciation is made to the independent auditors who
have contributed to making this report possible.
On behalf of the IMET Board of Trustees and staff, we look forward to continuing to work with participants for
the long-term success of IMET. We are proud to offer IMET’s services to all units of government in the state of
Illinois.
In service with you,
Christy Powell
IMET Chairman
Sofia Anastopoulos, CFA
IMET Executive Director
Secretary: John Harrington
Chair: Christy Powell
Executive Director: Sofia Anastopoulos
South Suburban Mayors and Managers Association
Trustee: Chris Minick
City of St. Charles
Vice Chair: Eileen Santschi
Village of Minooka
Trustee: Scott Anderson
Village of Buffalo Grove
Village of Bloomingdale
Trustee: Brian Murphy
Village of Plainfield
ILLINOIS METROPOLITAN INVESTMENT FUND
Board of Trustees
September 30, 2016
Treasurer: Gary Szott
Facsimile: (630) 571-0484
BOARD OF TRUSTEES
ILLINOIS METROPOLITAN INVESTMENT FUND
1220 Oak Brook Road
Oak Brook, Illinois 60523
Telephone: (630) 571-0480, ext. 229
Geneva Park District
-v-
Hugh O'Hara
Executive Director
FUND ACCOUNTANT
Chicago, Illinois
SOUTH SUBURBAN MAYORS AND MANAGERS ASSOCIATION
Executive Director
WILL COUNTY GOVERNMENTAL LEAGUE
Ed Paesel
Denver, Colorado
EXTERNAL ADVISORS
1-3 YEAR SERIES INVESTMENT ADVISOR
JP Morgan Asset Management
Columbus, Ohio
ALPS Fund Services, Inc.
ILLINOIS METROPOLITAN INVESTMENT FUND
Supporting Chicago Area Councils of Government
September 30, 2016
and External Advisors
SUPPORTING CHICAGO AREA COUNCILS OF GOVERNMENT
DUPAGE MAYORS AND MANAGERS CONFERENCE
Mark Baloga
Executive Director
NORTHWEST MUNICIPAL CONFERENCE
Executive Director
Mark Fowler
Chicago, Illinois
1-3 YEAR SERIES EXTERNAL PERFORMANCE MONITORING
LEGAL COUNSEL
Vedder Price
The Consulting Group of Smith Barney
Deerfield, Illinois
-vi-
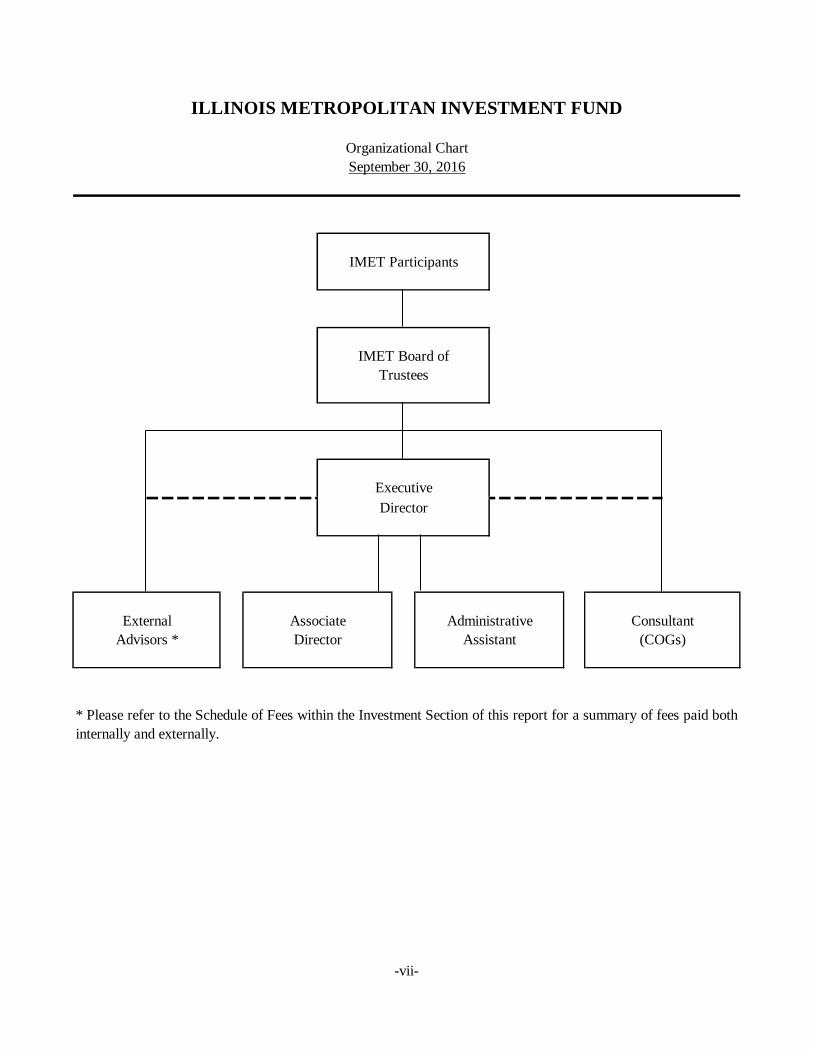
IMET Board of
Trustees
Executive
Director
ILLINOIS METROPOLITAN INVESTMENT FUND
Organizational Chart
IMET Participants
September 30, 2016
* Please refer to the Schedule of Fees within the Investment Section of this report for a summary of fees paid both
internally and externally.
Administrative
Assistant
Consultant
(COGs)
External
Advisors *
Associate
Director
-vii-
-viii-

FINANCIAL SECTION
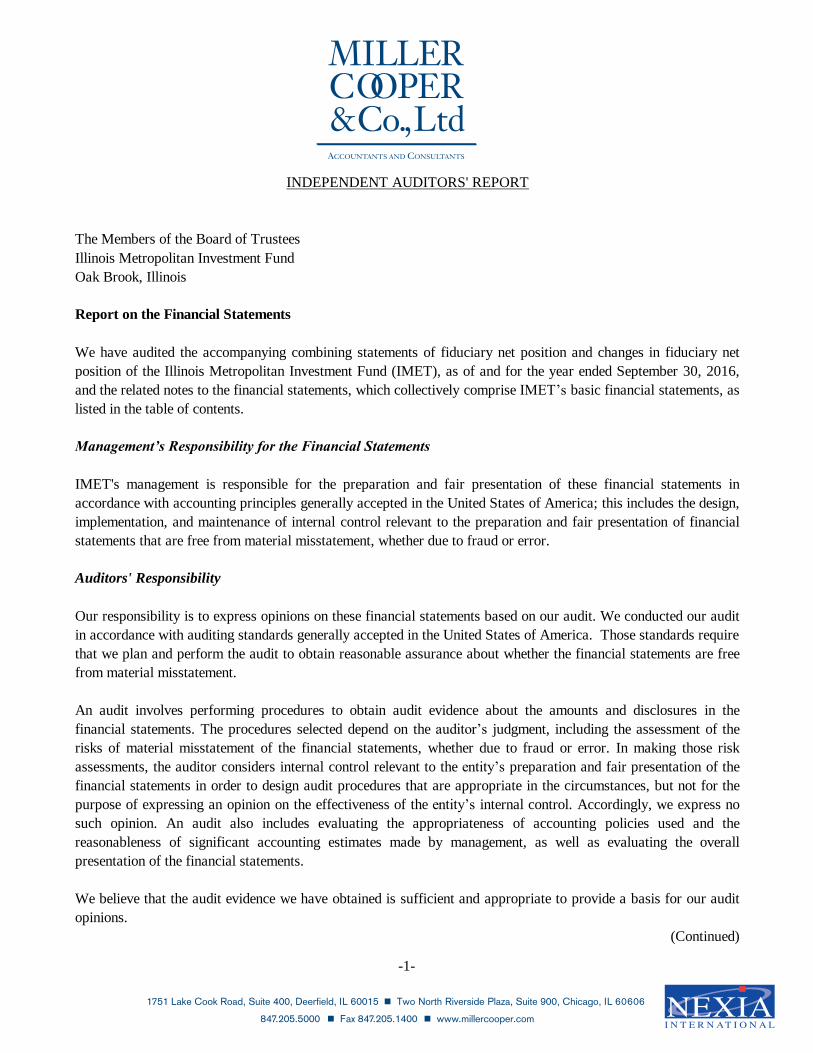
Report on the Financial Statements
Management’s Responsibility for the Financial Statements
Auditors' Responsibility
Our responsibility is to express opinions on these financial statements based on our audit. We conducted our audit
in accordance with auditing standards generally accepted in the United States of America. Those standards require
that we plan and perform the audit to obtain reasonable assurance about whether the financial statements are free
from material misstatement.
An audit involves performing procedures to obtain audit evidence about the amounts and disclosures in the
financial statements. The procedures selected depend on the auditor’s judgment, including the assessment of the
risks of material misstatement of the financial statements, whether due to fraud or error. In making those risk
assessments, the auditor considers internal control relevant to the entity’s preparation and fair presentation of the
financial statements in order to design audit procedures that are appropriate in the circumstances, but not for the
purpose of expressing an opinion on the effectiveness of the entity’s internal control. Accordingly, we express no
such opinion. An audit also includes evaluating the appropriateness of accounting policies used and the
reasonableness of significant accounting estimates made by management, as well as evaluating the overall
presentation of the financial statements.
We believe that the audit evidence we have obtained is sufficient and appropriate to provide a basis for our audit
opinions.
(Continued)
INDEPENDENT AUDITORS' REPORT
The Members of the Board of Trustees
Illinois Metropolitan Investment Fund
Oak Brook, Illinois
We have audited the accompanying combining statements of fiduciary net position and changes in fiduciary net
position of the Illinois Metropolitan Investment Fund (IMET), as of and for the year ended September 30, 2016,
and the related notes to the financial statements, which collectively comprise IMET’s basic financial statements, as
listed in the table of contents.
IMET's management is responsible for the preparation and fair presentation of these financial statements in
accordance with accounting principles generally accepted in the United States of America; this includes the design,
implementation, and maintenance of internal control relevant to the preparation and fair presentation of financial
statements that are free from material misstatement, whether due to fraud or error.
-1-
Opinions
Other Matters
Required Supplementary Information
Other Information
(Continued)
Our audit was conducted for the purpose of forming opinions on the financial statements that collectively comprise
IMET’s basic financial statements. The other information listed in the table of contents, including the introductory
section, investment section, statistical section, and the other supplementary information, are presented for purposes
of additional analysis and are not a required part of the basic financial statements.
The Members of the Board of Trustees
(Continued)
In our opinion, the financial statements referred to above present fairly, in all material respects, the respective
financial position of IMET, as of September 30, 2016, and the respective changes in financial position for the year
then ended, in accordance with accounting principles generally accepted in the United States of America.
Accounting principles generally accepted in the United States of America require that the management’s
discussion and analysis on pages 4 through 8, the Illinois Municipal Retirement Fund pension data on pages 30
through 31, and notes to the required supplementary information on page 32 be presented to supplement the basic
financial statements. Such information, although not a part of the basic financial statements, is required by the
Governmental Accounting Standards Board, who considers it to be an essential part of financial reporting for
placing the basic financial statements in an appropriate operational, economic, or historical context. We have
applied certain limited procedures to the required supplementary information in accordance with auditing
standards generally accepted in the United States of America, which consisted of inquiries of management about
the methods of preparing the information and comparing the information for consistency with management’s
responses to our inquiries, the basic financial statements, and other knowledge we obtained during our audit of the
basic financial statements. We do not express an opinion or provide any assurance on the information because the
limited procedures do not provide us with sufficient evidence to express an opinion or provide any assurance.
Illinois Metropolitan Investment Fund
-2-
Other Information (Continued)
MILLER, COOPER & CO., LTD.
The Members of the Board of Trustees
The other supplementary information is the responsibility of management and was derived from and relates
directly to the underlying accounting and other records used to prepare the basic financial statements. Such
information has been subjected to the auditing procedures applied in the audit of the basic financial statements and
certain additional procedures, including comparing and reconciling such information directly to the underlying
accounting and other records used to prepare the basic financial statements or to the basic financial statements
themselves, and other additional procedures in accordance with auditing standards generally accepted in the United
States of America. In our opinion, the other supplementary information is fairly stated, in all material respects, in
relation to the basic financial statements as a whole.
The introductory section, investment section, and statistical sections have not been subjected to the auditing
procedures applied in the audit of the basic financial statements, and accordingly, we do not express an opinion or
provide any assurance on them.
Illinois Metropolitan Investment Fund (Continued)
Certified Public Accountants
Deerfield, Illinois
February 13, 2017
-3-
-4-
ILLINOIS METROPOLITAN INVESTMENT FUND
Management’s Discussion and Analysis (Unaudited)
Year ended September 30, 2016
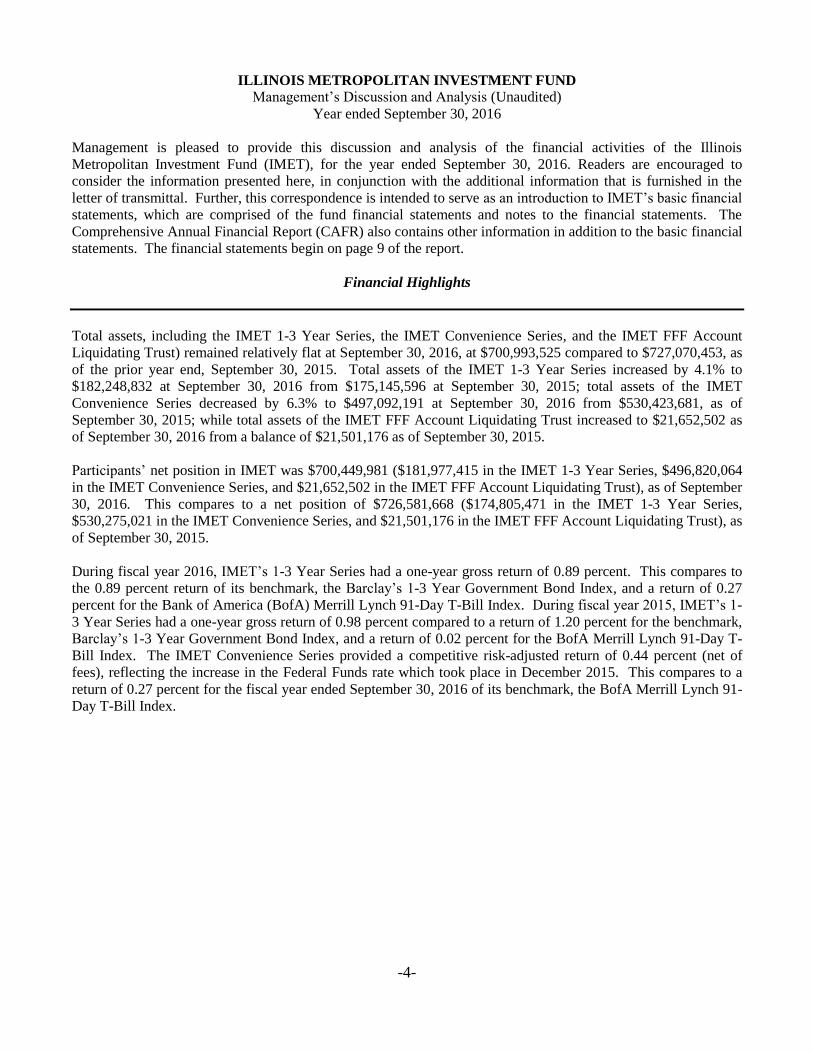
Management is pleased to provide this discussion and analysis of the financial activities of the Illinois
Metropolitan Investment Fund (IMET), for the year ended September 30, 2016. Readers are encouraged to
consider the information presented here, in conjunction with the additional information that is furnished in the
letter of transmittal. Further, this correspondence is intended to serve as an introduction to IMET’s basic financial
statements, which are comprised of the fund financial statements and notes to the financial statements. The
Comprehensive Annual Financial Report (CAFR) also contains other information in addition to the basic financial
statements. The financial statements begin on page 9 of the report.
Financial Highlights
Total assets, including the IMET 1-3 Year Series, the IMET Convenience Series, and the IMET FFF Account
Liquidating Trust) remained relatively flat at September 30, 2016, at $700,993,525 compared to $727,070,453, as
of the prior year end, September 30, 2015. Total assets of the IMET 1-3 Year Series increased by 4.1% to
$182,248,832 at September 30, 2016 from $175,145,596 at September 30, 2015; total assets of the IMET
Convenience Series decreased by 6.3% to $497,092,191 at September 30, 2016 from $530,423,681, as of
September 30, 2015; while total assets of the IMET FFF Account Liquidating Trust increased to $21,652,502 as
of September 30, 2016 from a balance of $21,501,176 as of September 30, 2015.
Participants’ net position in IMET was $700,449,981 ($181,977,415 in the IMET 1-3 Year Series, $496,820,064
in the IMET Convenience Series, and $21,652,502 in the IMET FFF Account Liquidating Trust), as of September
30, 2016. This compares to a net position of $726,581,668 ($174,805,471 in the IMET 1-3 Year Series,
$530,275,021 in the IMET Convenience Series, and $21,501,176 in the IMET FFF Account Liquidating Trust), as
of September 30, 2015.
During fiscal year 2016, IMET’s 1-3 Year Series had a one-year gross return of 0.89 percent. This compares to
the 0.89 percent return of its benchmark, the Barclay’s 1-3 Year Government Bond Index, and a return of 0.27
percent for the Bank of America (BofA) Merrill Lynch 91-Day T-Bill Index. During fiscal year 2015, IMET’s 1-
3 Year Series had a one-year gross return of 0.98 percent compared to a return of 1.20 percent for the benchmark,
Barclay’s 1-3 Year Government Bond Index, and a return of 0.02 percent for the BofA Merrill Lynch 91-Day T-
Bill Index. The IMET Convenience Series provided a competitive risk-adjusted return of 0.44 percent (net of
fees), reflecting the increase in the Federal Funds rate which took place in December 2015. This compares to a
return of 0.27 percent for the fiscal year ended September 30, 2016 of its benchmark, the BofA Merrill Lynch 91-
Day T-Bill Index.
-5-
ILLINOIS METROPOLITAN INVESTMENT FUND
Management’s Discussion and Analysis
Year ended September 30, 2016
Overview of the Financial Statements
The two basic financial statements of the Fund are the Combining Statement of Fiduciary Net Position and the
Combining Statement of Changes in Fiduciary Net Position, which represent the basic financial statements. The
statements are prepared in conformity with accounting principles generally accepted in the United States of
America, as applied to governmental units.
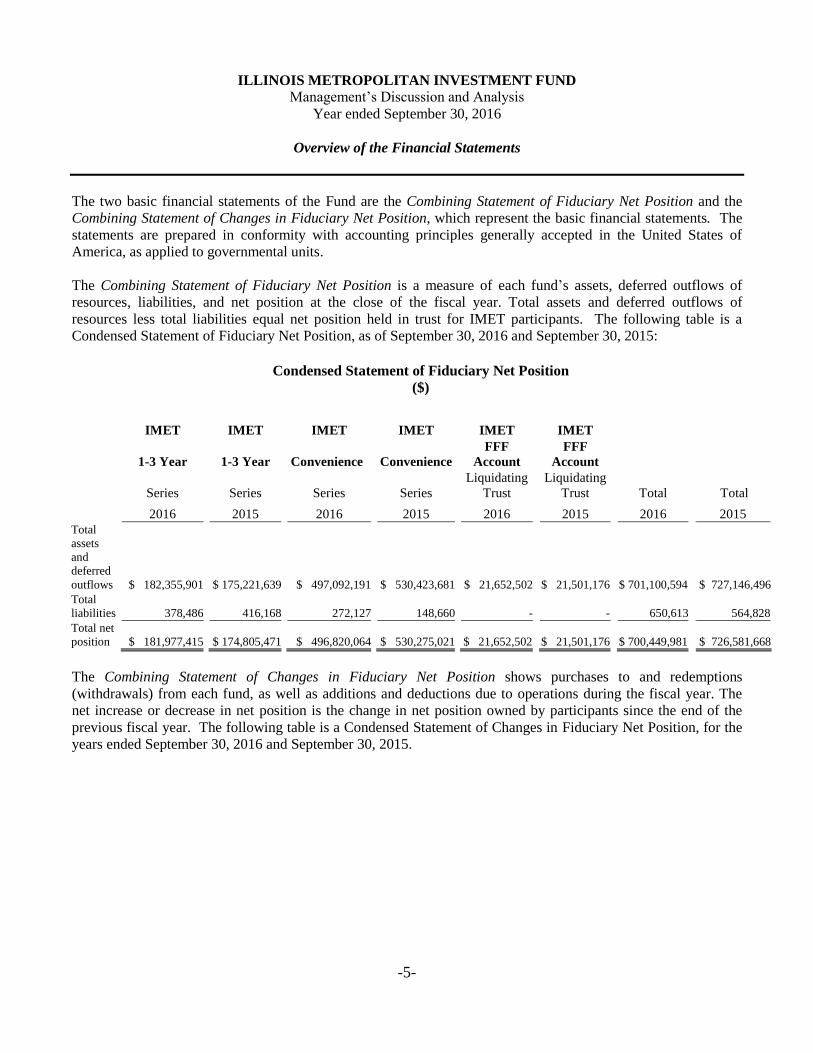
The Combining Statement of Fiduciary Net Position is a measure of each fund’s assets, deferred outflows of
resources, liabilities, and net position at the close of the fiscal year. Total assets and deferred outflows of
resources less total liabilities equal net position held in trust for IMET participants. The following table is a
Condensed Statement of Fiduciary Net Position, as of September 30, 2016 and September 30, 2015:
Condensed Statement of Fiduciary Net Position
($)
IMET IMET IMET IMET IMET IMET
1-3 Year 1-3 Year Convenience Convenience
FFF
Account
FFF
Account
Series Series Series Series
Liquidating
Trust
Liquidating
Trust Total Total
2016 2015 2016 2015 2016 2015 2016 2015
Total
assets
and
deferred
outflows $ 182,355,901
$ 175,221,639 $ 497,092,191 $ 530,423,681 $ 21,652,502 $ 21,501,176 $ 701,100,594 $ 727,146,496
Total
liabilities 378,486 416,168 272,127 148,660 - - 650,613 564,828
Total net
position $ 181,977,415 $ 174,805,471 $ 496,820,064 $ 530,275,021 $ 21,652,502 $ 21,501,176 $ 700,449,981 $ 726,581,668
The Combining Statement of Changes in Fiduciary Net Position shows purchases to and redemptions
(withdrawals) from each fund, as well as additions and deductions due to operations during the fiscal year. The
net increase or decrease in net position is the change in net position owned by participants since the end of the
previous fiscal year. The following table is a Condensed Statement of Changes in Fiduciary Net Position, for the
years ended September 30, 2016 and September 30, 2015.
-6-
ILLINOIS METROPOLITAN INVESTMENT FUND
Management’s Discussion and Analysis
Year ended September 30, 2016
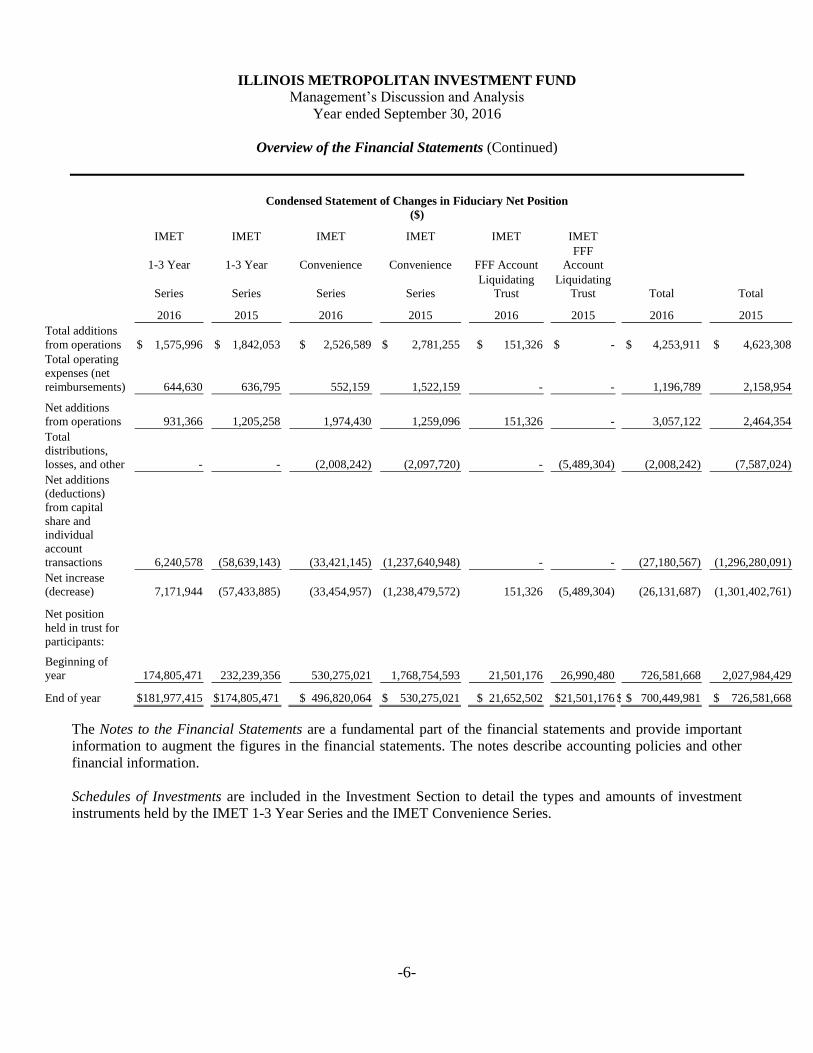
Overview of the Financial Statements (Continued)
Condensed Statement of Changes in Fiduciary Net Position
($)
IMET IMET IMET IMET IMET IMET
1-3 Year 1-3 Year Convenience Convenience FFF Account
FFF
Account
Series Series Series Series
Liquidating
Trust
Liquidating
Trust Total Total
2016 2015 2016 2015 2016 2015 2016 2015
Total additions
from operations $ 1,575,996 $ 1,842,053
$ 2,526,589 $ 2,781,255 $ 151,326 $ -
$ 4,253,911 $ 4,623,308
Total operating
expenses (net
reimbursements) 644,630 636,795 552,159 1,522,159 - - 1,196,789 2,158,954
Net additions
from operations 931,366 1,205,258 1,974,430 1,259,096 151,326 - 3,057,122 2,464,354
Total
distributions,
losses, and other
-
- (2,008,242) (2,097,720) - (5,489,304) (2,008,242) (7,587,024)
Net additions
(deductions)
from capital
share and
individual
account
transactions 6,240,578 (58,639,143) (33,421,145) (1,237,640,948) - - (27,180,567) (1,296,280,091)
Net increase
(decrease) 7,171,944 (57,433,885) (33,454,957) (1,238,479,572) 151,326 (5,489,304) (26,131,687) (1,301,402,761)
Net position
held in trust for
participants:
Beginning of
year 174,805,471
232,239,356 530,275,021 1,768,754,593 21,501,176 26,990,480 726,581,668 2,027,984,429
End of year $181,977,415 $174,805,471 $ 496,820,064 $ 530,275,021 $ 21,652,502 $21,501,176 $ $ 700,449,981 $ 726,581,668
The Notes to the Financial Statements are a fundamental part of the financial statements and provide important
information to augment the figures in the financial statements. The notes describe accounting policies and other
financial information.
Schedules of Investments are included in the Investment Section to detail the types and amounts of investment
instruments held by the IMET 1-3 Year Series and the IMET Convenience Series.
-7-
ILLINOIS METROPOLITAN INVESTMENT FUND
Management’s Discussion and Analysis
Year ended September 30, 2016
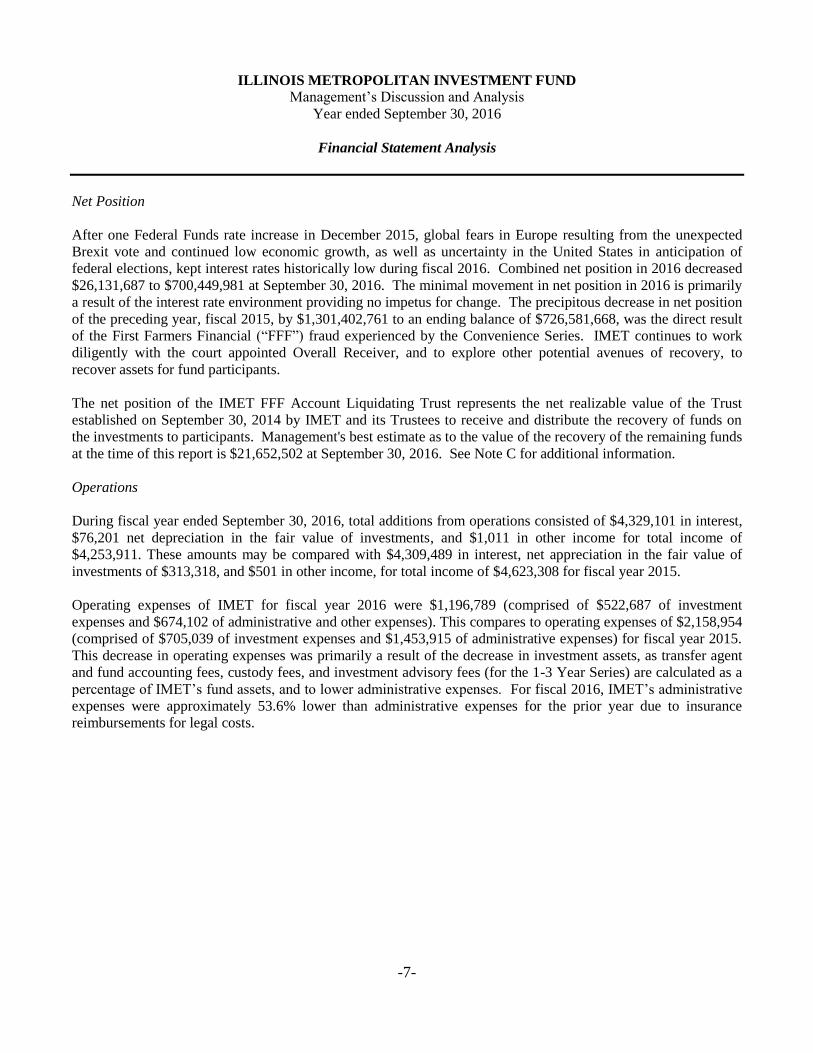
Financial Statement Analysis
Net Position
After one Federal Funds rate increase in December 2015, global fears in Europe resulting from the unexpected
Brexit vote and continued low economic growth, as well as uncertainty in the United States in anticipation of
federal elections, kept interest rates historically low during fiscal 2016. Combined net position in 2016 decreased
$26,131,687 to $700,449,981 at September 30, 2016. The minimal movement in net position in 2016 is primarily
a result of the interest rate environment providing no impetus for change. The precipitous decrease in net position
of the preceding year, fiscal 2015, by $1,301,402,761 to an ending balance of $726,581,668, was the direct result
of the First Farmers Financial (“FFF”) fraud experienced by the Convenience Series. IMET continues to work
diligently with the court appointed Overall Receiver, and to explore other potential avenues of recovery, to
recover assets for fund participants.
The net position of the IMET FFF Account Liquidating Trust represents the net realizable value of the Trust
established on September 30, 2014 by IMET and its Trustees to receive and distribute the recovery of funds on
the investments to participants. Management's best estimate as to the value of the recovery of the remaining funds
at the time of this report is $21,652,502 at September 30, 2016. See Note C for additional information.
Operations
During fiscal year ended September 30, 2016, total additions from operations consisted of $4,329,101 in interest,
$76,201 net depreciation in the fair value of investments, and $1,011 in other income for total income of
$4,253,911. These amounts may be compared with $4,309,489 in interest, net appreciation in the fair value of
investments of $313,318, and $501 in other income, for total income of $4,623,308 for fiscal year 2015.
Operating expenses of IMET for fiscal year 2016 were $1,196,789 (comprised of $522,687 of investment
expenses and $674,102 of administrative and other expenses). This compares to operating expenses of $2,158,954
(comprised of $705,039 of investment expenses and $1,453,915 of administrative expenses) for fiscal year 2015.
This decrease in operating expenses was primarily a result of the decrease in investment assets, as transfer agent
and fund accounting fees, custody fees, and investment advisory fees (for the 1-3 Year Series) are calculated as a
percentage of IMET’s fund assets, and to lower administrative expenses. For fiscal 2016, IMET’s administrative
expenses were approximately 53.6% lower than administrative expenses for the prior year due to insurance
reimbursements for legal costs.
-8-
ILLINOIS METROPOLITAN INVESTMENT FUND
Management’s Discussion and Analysis
Year ended September 30, 2016
Investment Performance
Despite the FFF fraud, IMET’s participants enjoy a yield in the Convenience Fund among the highest available in
local government investment pools available in the state of Illinois. The 1-3 Year Series continues to offer
members competitive risk-adjusted returns with the safety provided by U.S. Government securities. Together, the
Convenience Fund Series and the 1-3 Year Series provide members complementary strategies.
During fiscal year 2016, the IMET 1-3 Year Series performed in line with its benchmark on a gross of fees basis,
performing 0.89 percent versus 0.89 percent for the benchmark, the Barclay’s Capital 1-3 Year Government Bond
Index. The 1-3 Year Series meaningfully outperformed the BofA Merrill Lynch 91 Day T-Bill Index which had a
performance of 0.27 percent for the year ended September 30, 2016. For the same one-year period ending
September 30, 2016, the IMET Convenience Series had a rate of 0.44 percent, outperforming its benchmark, the
BofA Merrill Lynch 91 Day T-Bill Index, which had a rate of 0.27 percent.
For additional information regarding performance returns of IMET and asset allocation, please refer to the
Investment section beginning on page 36 of this report.
Requests for Information
Questions about any information provided in this report should be addressed to:
The Illinois Metropolitan Investment Fund (IMET)
ATTN: Sofia Anastopoulos, Executive Director
1220 Oak Brook Road
Oak Brook, IL 60523

BASIC FINANCIAL STATEMENTS

IMETIMET IMET FFF Account
1 - 3 Year Convenience LiquidatingFund Series Trust Total
Cash and short-term investments $ 2,598,858 $ 450,861,310 $ - $ 453,460,168Interest receivable 459,141 242,752 - 701,893Other receivables 70,137 - - 70,137Investments:
U.S. Treasury obligations 121,223,097 - - 121,223,097U.S. Government agency and
agency-guaranteed obligations 50,585,717 45,988,129 - 96,573,846Asset and mortgage-
backed securities 7,170,459 - - 7,170,459FFF investment - - 21,652,502 21,652,502
Other assets 141,423 - - 141,423
Total assets 182,248,832 497,092,191 21,652,502 700,993,525
DEFERRED OUTFLOWS OFRESOURCES
Deferred outflows related topensions 107,069 - - 107,069
LIABILITIESCurrent liabilities:
Payables:Dividends payable to participants - 215,874 - 215,874Management fees 25,813 22,186 - 47,999Consultant fee 35,400 - - 35,400Administrative fee - 33,820 - 33,820Accounts payable 58,035 - - 58,035 Other 22,926 247 - 23,173
Non-current liabilities:IMRF net pension liability 236,312 - - 236,312
Total liabilities 378,486 272,127 - 650,613
NET POSITIONNet position held in trust for participants
(units outstanding: 9,373,943, 496,805,311, and47,932,859 at September 30, 2016 for IMET1-3 Year Series, IMET Convenience Series,and IMET FFF Account Liquidating Trust,respectively, equivalent to $19.41, $1.00, and$0.45 per unit outstanding at September 30, 2016for IMET 1-3 Year Series, IMET ConvenienceSeries, and IMET FFF Account Liquidating
Trust, respectively
Total net position $ 181,977,415 $ 496,820,064 $ 21,652,502 $ 700,449,981
The accompanying notes are an integral part of this statement.
ASSETS
Illinois Metropolitan Investment FundCombining Statement of Fiduciary Net Position
September 30, 2016
-9-
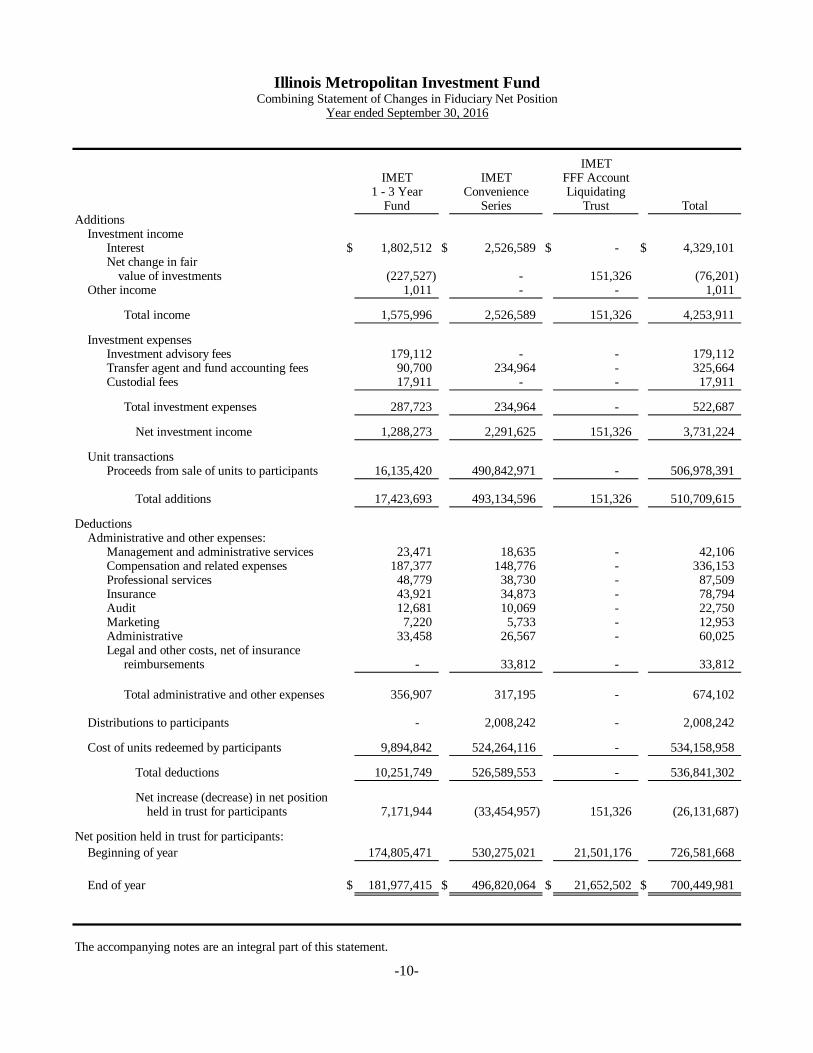
IMETIMET IMET FFF Account
1 - 3 Year Convenience LiquidatingFund Series Trust Total
Investment incomeInterest $ 1,802,512 $ 2,526,589 $ - $ 4,329,101 Net change in fair
value of investments (227,527) - 151,326 (76,201) Other income 1,011 - - 1,011
Total income 1,575,996 2,526,589 151,326 4,253,911
Investment expensesInvestment advisory fees 179,112 - - 179,112 Transfer agent and fund accounting fees 90,700 234,964 - 325,664 Custodial fees 17,911 - - 17,911
Total investment expenses 287,723 234,964 - 522,687
Net investment income 1,288,273 2,291,625 151,326 3,731,224
Unit transactionsProceeds from sale of units to participants 16,135,420 490,842,971 - 506,978,391
Total additions 17,423,693 493,134,596 151,326 510,709,615
DeductionsAdministrative and other expenses:
Management and administrative services 23,471 18,635 - 42,106 Compensation and related expenses 187,377 148,776 - 336,153 Professional services 48,779 38,730 - 87,509 Insurance 43,921 34,873 - 78,794 Audit 12,681 10,069 - 22,750 Marketing 7,220 5,733 - 12,953 Administrative 33,458 26,567 - 60,025 Legal and other costs, net of insurance
reimbursements - 33,812 - 33,812
Total administrative and other expenses 356,907 317,195 - 674,102
Distributions to participants - 2,008,242 - 2,008,242
Cost of units redeemed by participants 9,894,842 524,264,116 - 534,158,958
Total deductions 10,251,749 526,589,553 - 536,841,302
Net increase (decrease) in net positionheld in trust for participants 7,171,944 (33,454,957) 151,326 (26,131,687)
Net position held in trust for participants:
Beginning of year 174,805,471 530,275,021 21,501,176 726,581,668
End of year $ 181,977,415 $ 496,820,064 $ 21,652,502 $ 700,449,981
The accompanying notes are an integral part of this statement.
Additions
Illinois Metropolitan Investment FundCombining Statement of Changes in Fiduciary Net Position
Year ended September 30, 2016
-10-
NOTE A - NATURE OF OPERATIONS
NOTE B - SUMMARY OF SIGNIFICANT ACCOUNTING POLICIES
1. Reporting Entity
Illinois Metropolitan Investment FundNotes to the Financial Statements
September 30, 2016
Based upon the required GASB criteria, IMET has no component units and is not a component unit of any
other entity. The following is a brief description of IMET's funds:
The financial statements of the Illinois Metropolitan Investment Fund (IMET) have been prepared in conformity
with accounting principles generally accepted in the United States of America (GAAP) as applied to government
units. The Governmental Accounting Standards Board (GASB) is the accepted standard-setting body for
establishing governmental accounting and financial reporting principles. The more significant of IMET's
accounting policies are described below.
IMET is governed by a Board of Trustees comprised of seven Illinois public officials representing the Fund's
investors. The Board meets no less than ten times during the year to review goals, objectives, and the direction of
the Fund. Participants also benefit from IMET's standing committees, which include Audit, New Products, and
Vendor Selection. IMET's committees consist of Trustees as well as at-large participants.
The Illinois Metropolitan Investment Fund (IMET) is an actively managed investment fund for Illinois units of
local government and for other official custodians of public funds. IMET offers two investment options, the 1-3
Year Series and the Convenience Series. IMET’s 1-3 Year Series is designed as an investment vehicle for funds
not required to be spent in the short term and which are available for investment in securities with average
maturities and returns generally greater than those for money market instruments. The Convenience Series
provides a short-term investment option with total liquidity that operates much like a money market account.
IMET also manages the FFF Account Liquidating Trust (see Note B-1, below).
The authority for the creation and continued existence of the Fund comes from the Illinois Municipal Code, which
specifically includes the Intergovernmental Cooperation Act, and the Local Government Debt Reform Act, as
amended, which provides that each official custodian of a governmental unit may jointly invest with other official
custodians of other governmental units the funds of the respective governmental unit.
The IMET 1-3 Year Fund comprises investments in U.S. Treasury obligations, U.S. government agency and
agency-backed securities, and asset and mortgage-backed securities made on behalf of its participants. The
Fund also comprises cash and money market mutual funds.
The IMET Convenience Series comprises investments in bank and money market accounts, and shorter-term
U.S. government agency obligations made on behalf of its participants.
-11-
Illinois Metropolitan Investment FundNotes to the Financial Statements
September 30, 2016
NOTE B - SUMMARY OF SIGNIFICANT ACCOUNTING POLICIES (Continued)
1. Reporting Entity (Continued)
2.
3.
4. Security Valuation
5. Security Transactions and Income
Basis of Accounting
The IMET 1-3 Year Fund, Convenience Series, and FFF Account Liquidating Trust Fund operate as fiduciary
(trust) funds, and report on the accrual basis of accounting.
The IMET FFF Account Liquidating Trust was established during the fiscal year ended September 30, 2014,
for the purpose described in Note C.
New Accounting Pronouncement
GASB has issued Statement No. 72, Fair Value Measurement and Application, issued in February 2015,
which was implemented by the IMET during the fiscal year ended September 30, 2016. This Statement
addresses accounting and financial reporting issues related to fair value measurements. This Statement
provides guidance for determining fair value measurement for financial reporting purposes. This Statement
also provides guidance for applying fair value to certain investments and disclosures related to all fair value
investments.
Security transactions are accounted for no later than one business day after the securities are purchased or
sold. Gains and losses on investments are realized at the time of the sale, and the cost of securities sold is
determined on the first-in, first-out basis. Interest income from fixed income and money market investments is
accrued on a daily basis. Discounts and premiums on all fixed income securities are amortized or accreted on
a constant-yield basis.
Investments of the IMET 1-3 Year Fund and the IMET Convenience Series are reported at fair value, as
disclosed in the related notes. All investment income for the IMET 1-3 Year Fund and the IMET Convenience
Series, including changes in the fair value of investments, has been recognized as income in the combining
statement of changes in net position.
The IMET FFF Account Liquidating Trust's investments are reported at the estimated net realizable value of
assets seized for the purpose of liquidating the related investments (see Note C).
-12-
Illinois Metropolitan Investment FundNotes to the Financial Statements
September 30, 2016
NOTE B - SUMMARY OF SIGNIFICANT ACCOUNTING POLICIES (Continued)
6. Deferred Outflows / Deferred Inflows
7. Subscriptions and Redemptions
8. Compensated Absences
9. Pensions
For purposes of measuring the net pension liability, deferred outflows of resources related to pensions, pension
expense, information about the fiduciary net position of the pension plan and additions to/deductions from the
pension plan's fiduciary net position have been determined on the same basis as they are reported by the
pension plan. For this purpose, benefit payments (including refunds of employee contributions) are recognized
when due and payable in accordance with the benefit terms.
Permanent full-time employees also earn sick leave at a rate of twelve days per year. No more than one
hundred and thirty days of sick leave may be accumulated. One third of accrued, unused sick days may be
paid, at the employee's option, at the time of retirement. Remaining unpaid sick days may be applied towards
IMRF credit upon retirement or the death of the employee, if surviving spouse benefits are payable.
Participants may subscribe to either of the funds on any business day. Purchase instructions received by
IMET before 12:00 noon central time are credited to accounts at the net asset value as of the close of business
that day. Participants may redeem shares of the IMET 1-3 Year Fund with five days' notice at the net asset
value as of the close of business on the third business day following the day of notification. Participants may
redeem from the IMET Convenience Series with same day or next day notice at the current value as of the day
of redemption. Redemptions from the IMET Convenience Series that are requested by 12:00 noon central time
will be completed on the same day.
In addition to assets, the combining statement of fiduciary net position may report deferred outflows of
resources. Deferred outflows of resources represent a consumption of net position that applies to future
periods. At September 30, 2016, IMET had deferred outflows of resources related to pensions. In addition to
liabilities, IMET may report deferred inflows of resources. Deferred inflows of resources represent the
acquisition of resources that is applicable to a future reporting period.
Permanent full-time employees earn vacation at a rate of ten days per year in the first year of service, fifteen
days in the second through fifth years, and twenty days in the sixth and subsequent years. No more than one
year's vacation may be carried over to the following year. Upon voluntary or involuntary termination, the
employee is entitled to be paid out for all earned but unpaid vacation, subject to the foregoing limitation.
-13-
Illinois Metropolitan Investment FundNotes to the Financial Statements
September 30, 2016
NOTE B - SUMMARY OF SIGNIFICANT ACCOUNTING POLICIES (Continued)
10. Use of Estimates
11. Fair Value Measurements
Inputs to the valuation methodology include the following:
* Quoted prices for similar assets or liabilities in active markets;
* Quoted prices for identical or similar assets or liabilities in inactive markets;
* Inputs other than quoted prices that are observable for the asset or liability;
* Inputs that are derived principally from or corroborated by observable market
data by correlation or other means.
Current accounting standards establish a framework for measuring fair value. That framework provides a fair
value hierarchy that prioritizes the inputs to valuation techniques used to measure fair value. The hierarchy
gives the highest priority to unadjusted quoted prices in active markets for identical assets or liabilities (Level
1 measurements) and the lowest priority to unobservable inputs (Level 3 measurements). The three levels of
the fair value hierarchy are described below:
Inputs to the valuation methodology are unadjusted quoted market prices for identical assets or
liabilities in active markets that the Plan has the ability to access.
If the asset or liability has a specified (contractual) term, the Level 2 input must be observable
for substantially the full term of the asset or liability.
Inputs to the valuation methodology are unobservable and significant to the fair value
measurement.
The asset's or liability's fair value measurement level within the fair value hierarchy is based on the lowest
level of any input that is significant to the fair value measurement. Valuation techniques used need to
maximize the use of observable inputs and minimize the use of unobservable inputs.
Level 2
Level 3
Level 1
In preparing IMET's financial statements, management is required to make estimates and assumptions that
affect the reported amounts of assets, deferred outflows of resources, liabilities, deferred inflows of resources,
the disclosure of contingent assets, deferred outflows of resources, liabilities, and deferred inflows of resources
at the date of the financial statements, and the reported amounts of revenues and expenses during the reporting
period. Actual results could differ from those estimates.
-14-
Illinois Metropolitan Investment FundNotes to the Financial Statements
September 30, 2016
NOTE B - SUMMARY OF SIGNIFICANT ACCOUNTING POLICIES (Continued)
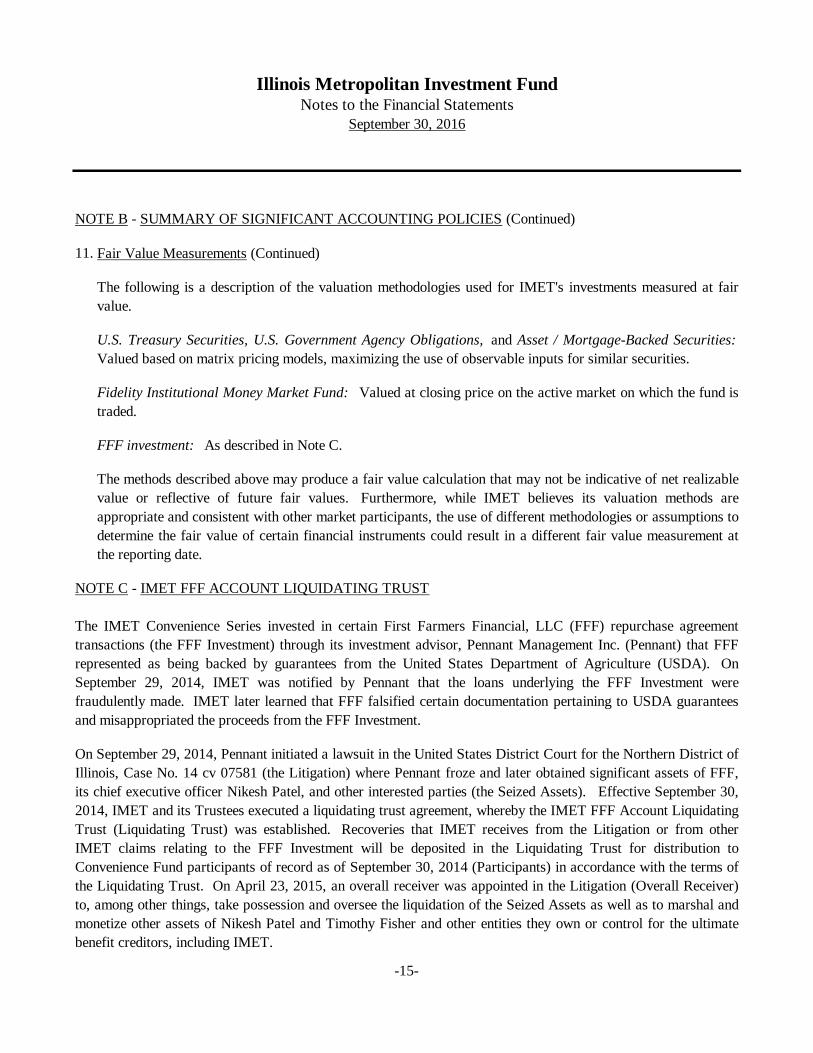
11. Fair Value Measurements (Continued)
NOTE C - IMET FFF ACCOUNT LIQUIDATING TRUST
FFF investment: As described in Note C.
The following is a description of the valuation methodologies used for IMET's investments measured at fair
value.
U.S. Treasury Securities, U.S. Government Agency Obligations, and Asset / Mortgage-Backed Securities:
Valued based on matrix pricing models, maximizing the use of observable inputs for similar securities.
The methods described above may produce a fair value calculation that may not be indicative of net realizable
value or reflective of future fair values. Furthermore, while IMET believes its valuation methods are
appropriate and consistent with other market participants, the use of different methodologies or assumptions to
determine the fair value of certain financial instruments could result in a different fair value measurement at
the reporting date.
Fidelity Institutional Money Market Fund: Valued at closing price on the active market on which the fund is
traded.
The IMET Convenience Series invested in certain First Farmers Financial, LLC (FFF) repurchase agreement
transactions (the FFF Investment) through its investment advisor, Pennant Management Inc. (Pennant) that FFF
represented as being backed by guarantees from the United States Department of Agriculture (USDA). On
September 29, 2014, IMET was notified by Pennant that the loans underlying the FFF Investment were
fraudulently made. IMET later learned that FFF falsified certain documentation pertaining to USDA guarantees
and misappropriated the proceeds from the FFF Investment.
On September 29, 2014, Pennant initiated a lawsuit in the United States District Court for the Northern District of
Illinois, Case No. 14 cv 07581 (the Litigation) where Pennant froze and later obtained significant assets of FFF,
its chief executive officer Nikesh Patel, and other interested parties (the Seized Assets). Effective September 30,
2014, IMET and its Trustees executed a liquidating trust agreement, whereby the IMET FFF Account Liquidating
Trust (Liquidating Trust) was established. Recoveries that IMET receives from the Litigation or from other
IMET claims relating to the FFF Investment will be deposited in the Liquidating Trust for distribution to
Convenience Fund participants of record as of September 30, 2014 (Participants) in accordance with the terms of
the Liquidating Trust. On April 23, 2015, an overall receiver was appointed in the Litigation (Overall Receiver)
to, among other things, take possession and oversee the liquidation of the Seized Assets as well as to marshal and
monetize other assets of Nikesh Patel and Timothy Fisher and other entities they own or control for the ultimate
benefit creditors, including IMET.
-15-
Illinois Metropolitan Investment FundNotes to the Financial Statements
September 30, 2016
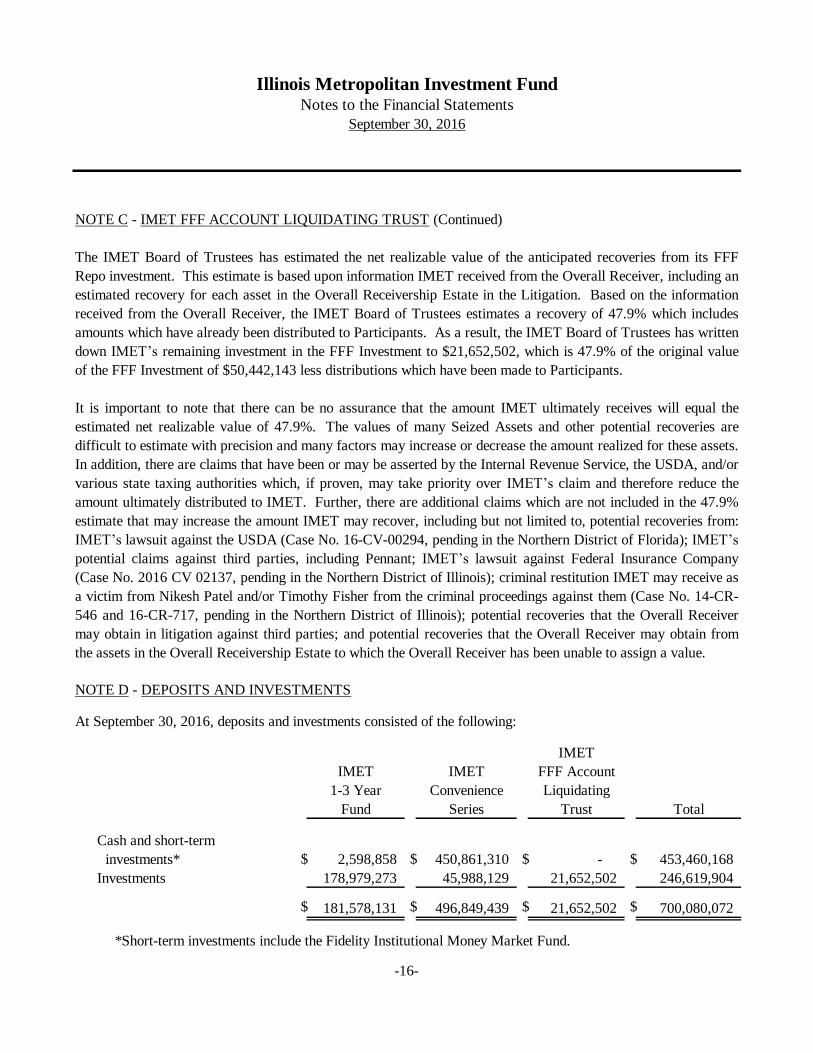
NOTE D - DEPOSITS AND INVESTMENTS
IMET
IMET IMET FFF Account
1-3 Year Convenience Liquidating
Fund Series Trust Total
Cash and short-term
investments* $ 2,598,858 $ 450,861,310 $ - $ 453,460,168
Investments 178,979,273 45,988,129 21,652,502 246,619,904
$ 181,578,131 $ 496,849,439 $ 21,652,502 $ 700,080,072
*Short-term investments include the Fidelity Institutional Money Market Fund.
The IMET Board of Trustees has estimated the net realizable value of the anticipated recoveries from its FFF
Repo investment. This estimate is based upon information IMET received from the Overall Receiver, including an
estimated recovery for each asset in the Overall Receivership Estate in the Litigation. Based on the information
received from the Overall Receiver, the IMET Board of Trustees estimates a recovery of 47.9% which includes
amounts which have already been distributed to Participants. As a result, the IMET Board of Trustees has written
down IMET’s remaining investment in the FFF Investment to $21,652,502, which is 47.9% of the original value
of the FFF Investment of $50,442,143 less distributions which have been made to Participants.
NOTE C - IMET FFF ACCOUNT LIQUIDATING TRUST (Continued)
It is important to note that there can be no assurance that the amount IMET ultimately receives will equal the
estimated net realizable value of 47.9%. The values of many Seized Assets and other potential recoveries are
difficult to estimate with precision and many factors may increase or decrease the amount realized for these assets.
In addition, there are claims that have been or may be asserted by the Internal Revenue Service, the USDA, and/or
various state taxing authorities which, if proven, may take priority over IMET’s claim and therefore reduce the
amount ultimately distributed to IMET. Further, there are additional claims which are not included in the 47.9%
estimate that may increase the amount IMET may recover, including but not limited to, potential recoveries from:
IMET’s lawsuit against the USDA (Case No. 16-CV-00294, pending in the Northern District of Florida); IMET’s
potential claims against third parties, including Pennant; IMET’s lawsuit against Federal Insurance Company
(Case No. 2016 CV 02137, pending in the Northern District of Illinois); criminal restitution IMET may receive as
a victim from Nikesh Patel and/or Timothy Fisher from the criminal proceedings against them (Case No. 14-CR-
546 and 16-CR-717, pending in the Northern District of Illinois); potential recoveries that the Overall Receiver
may obtain in litigation against third parties; and potential recoveries that the Overall Receiver may obtain from
the assets in the Overall Receivership Estate to which the Overall Receiver has been unable to assign a value.
At September 30, 2016, deposits and investments consisted of the following:
-16-
Illinois Metropolitan Investment FundNotes to the Financial Statements
September 30, 2016
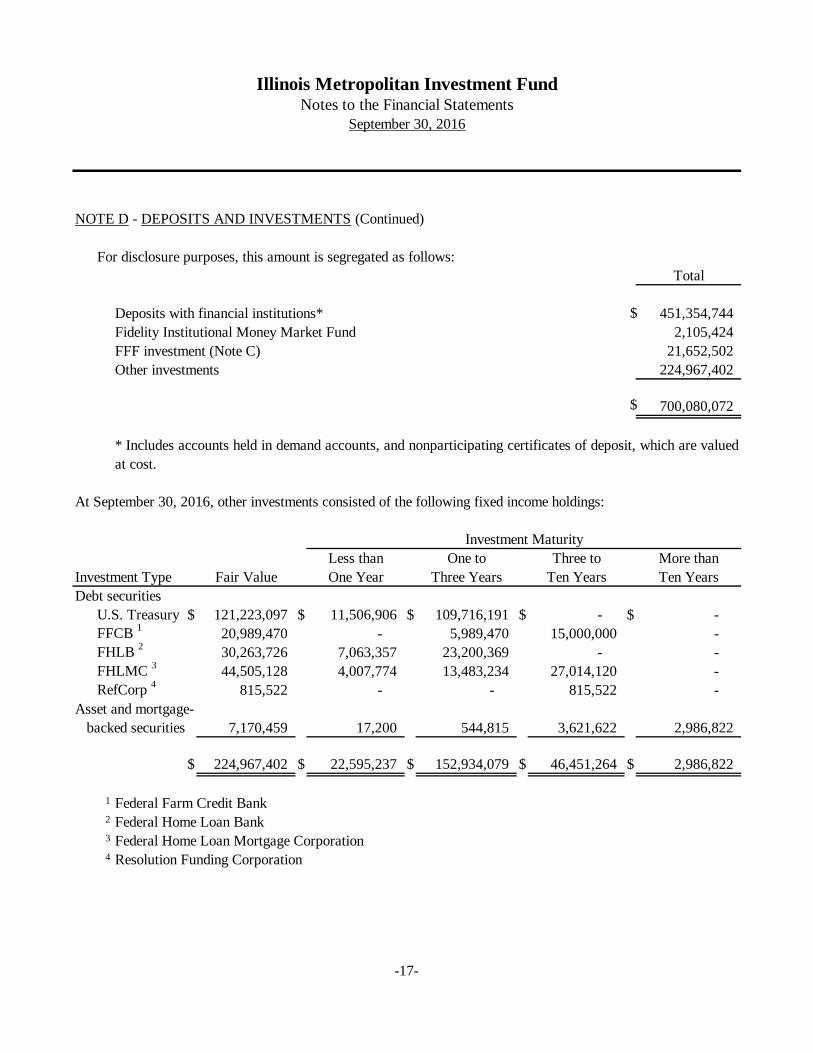
NOTE D - DEPOSITS AND INVESTMENTS (Continued)
For disclosure purposes, this amount is segregated as follows:
Total
Deposits with financial institutions* $ 451,354,744
Fidelity Institutional Money Market Fund 2,105,424
FFF investment (Note C) 21,652,502
Other investments 224,967,402
$ 700,080,072
At September 30, 2016, other investments consisted of the following fixed income holdings:
Less than One to Three to More than
Investment Type Fair Value One Year Three Years Ten Years Ten Years
Debt securities
U.S. Treasury $ 121,223,097 $ 11,506,906 $ 109,716,191 $ - $ -
FFCB 1
20,989,470 - 5,989,470 15,000,000 -
FHLB 2
30,263,726 7,063,357 23,200,369 - -
FHLMC 3
44,505,128 4,007,774 13,483,234 27,014,120 -
RefCorp 4
815,522 - - 815,522 -
Asset and mortgage-
backed securities 7,170,459 17,200 544,815 3,621,622 2,986,822
$ 224,967,402 $ 22,595,237 $ 152,934,079 $ 46,451,264 $ 2,986,822
1 Federal Farm Credit Bank2 Federal Home Loan Bank3 Federal Home Loan Mortgage Corporation4 Resolution Funding Corporation
* Includes accounts held in demand accounts, and nonparticipating certificates of deposit, which are valued
at cost.
Investment Maturity
-17-

Illinois Metropolitan Investment FundNotes to the Financial Statements
September 30, 2016
NOTE D - DEPOSITS AND INVESTMENTS (Continued)
1.
2. Credit Risk
Moody's Standard
Investment Investor & Poor's
U.S. Treasury Aaa AA+
Federal Farm Credit Bank Aaa AA+
Federal Home Loan Bank Aaa AA+
Federal Home Loan Mortgage Corporation Aaa AA+
Resolution Funding Corporation Aaa AA+
3. Concentration of Credit Risk
Interest Rate Risk
The investments in asset and mortgage-backed securities are rated in the top rating category issued by
NRSROs.
For the IMET Convenience Series, IMET manages interest rate risk in accordance with its investment policy
by requiring at least 50 percent of the fund’s investments to mature in 397 days or less, and limiting the dollar-
weighted average portfolio maturity of the fund to one year under normal conditions. Individual securities may
have remaining maturities of greater than one year, but in any event not greater than five years from the date
of the Convenience Series’ purchase thereof.
At September 30, 2016, the Fidelity Institutional Money Market was rated AAA-mf by Moody's and AAAm
by Standard & Poor's.
For the IMET 1-3 Year Series, IMET manages its exposure to fair value losses arising from increasing
interest rates in accordance with its investment policy, by limiting the duration of its investment portfolio to
within 25% of that of the Barclay's Capital 1-3 Year Government Bond Index, under normal conditions. The
duration for total investments represents the weighted average of the durations for the respective categories of
investments. As of September 30, 2016, the durations of the IMET 1-3 Year Series and the Barclay's Capital
1-3 Year Government Bond Fund were 1.75 years and 1.92 years, respectively.
Credit risk is the risk that an issuer or other counterparty to an investment will not fulfill its obligations.
IMET's investment policies limit investments to those investments specifically authorized in the Public
Investment Act of the State of Illinois (30 ILCS 235/1). As of September 30, 2016, IMET's other investments
had ratings with the following nationally recognized statistical rating organizations (NRSROs) as follows.
IMET's investment policies for the IMET 1-3 Year Series and IMET Convenience Series do not restrict the
allowable concentration of total assets invested in the securities of the United States Government, its agencies,
or mortgage pass-through securities.
-18-
Illinois Metropolitan Investment FundNotes to the Financial Statements
September 30, 2016
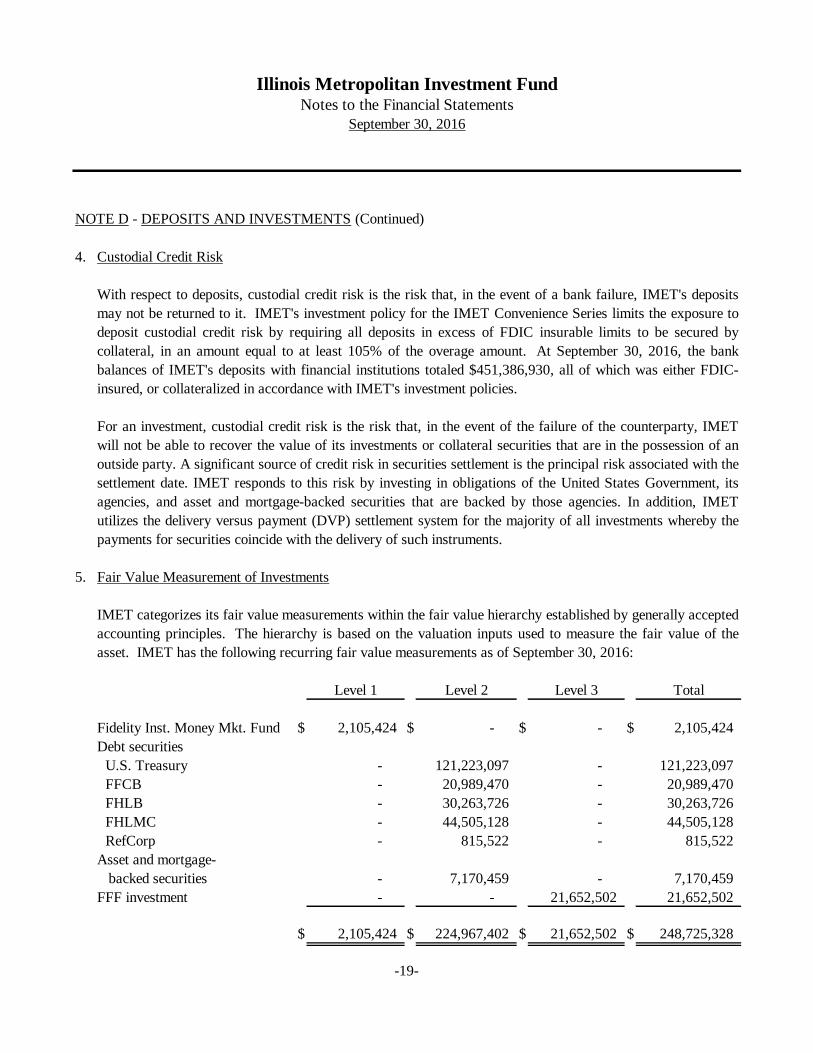
NOTE D - DEPOSITS AND INVESTMENTS (Continued)
4.
5.
Level 1 Level 2 Level 3 Total
Fidelity Inst. Money Mkt. Fund $ 2,105,424 $ - $ - $ 2,105,424
Debt securities
U.S. Treasury - 121,223,097 - 121,223,097
FFCB - 20,989,470 - 20,989,470
FHLB - 30,263,726 - 30,263,726
FHLMC - 44,505,128 - 44,505,128
RefCorp - 815,522 - 815,522
Asset and mortgage-
backed securities - 7,170,459 - 7,170,459
FFF investment - - 21,652,502 21,652,502
$ 2,105,424 $ 224,967,402 $ 21,652,502 $ 248,725,328
IMET categorizes its fair value measurements within the fair value hierarchy established by generally accepted
accounting principles. The hierarchy is based on the valuation inputs used to measure the fair value of the
asset. IMET has the following recurring fair value measurements as of September 30, 2016:
Custodial Credit Risk
With respect to deposits, custodial credit risk is the risk that, in the event of a bank failure, IMET's deposits
may not be returned to it. IMET's investment policy for the IMET Convenience Series limits the exposure to
deposit custodial credit risk by requiring all deposits in excess of FDIC insurable limits to be secured by
collateral, in an amount equal to at least 105% of the overage amount. At September 30, 2016, the bank
balances of IMET's deposits with financial institutions totaled $451,386,930, all of which was either FDIC-
insured, or collateralized in accordance with IMET's investment policies.
For an investment, custodial credit risk is the risk that, in the event of the failure of the counterparty, IMET
will not be able to recover the value of its investments or collateral securities that are in the possession of an
outside party. A significant source of credit risk in securities settlement is the principal risk associated with the
settlement date. IMET responds to this risk by investing in obligations of the United States Government, its
agencies, and asset and mortgage-backed securities that are backed by those agencies. In addition, IMET
utilizes the delivery versus payment (DVP) settlement system for the majority of all investments whereby the
payments for securities coincide with the delivery of such instruments.
Fair Value Measurement of Investments
-19-

Illinois Metropolitan Investment FundNotes to the Financial Statements
September 30, 2016
NOTE E - FUND EXPENSES - IMET 1-3 YEAR FUND
1. Fund Management
Fee Rate
0.10%
Next $150 million 0.08%
Amount over $500 million 0.06%
Fee Rate
0.060%
Next $500 million 0.030%
Amount over $1 billion 0.020%
In addition, for the year ended September 30, 2016, IMET management administrative and operating expenses
of $187,026 were charged to the IMET 1-3 Year Fund.
For the year ended September 30, 2016, the IMET 1-3 Year Fund incurred expenses of $179,112 for services
provided by JP Morgan Asset Management, $90,700 for services provided by ALPS Fund Services, and
$17,911 for services provided by BMO Harris Bank.
IMET pays a management fee to JP Morgan Asset Management, which acts as the investment advisor. The
management fee is calculated each day and paid monthly based upon the average daily net position of the fund
as follows:
The total expenses, including consulting fees, for the IMET 1-3 Year Series were approximately 0.36% of the
average daily net position, for the year ended September 30, 2016. The average daily net position of the IMET 1-
3 Year Series was approximately $176.8 million, for the year ended September 30, 2016. The contractually
obligated expenses are described below.
First $350 million
Average daily net position:
IMET has an agreement with ALPS Fund Service, to provide administrative services including fund
accounting and transfer agent services. The fee is calculated each day and paid monthly based upon the
combined average daily net position of the IMET 1-3 Year Fund and the IMET Convenience Series, as
follows:
Average daily net position:
IMET has an agreement with BMO Harris Bank to provide custody services. The fee associated with these
services is calculated at an annual rate of 0.01% of the average daily net position within the fund.
First $500 million
-20-
Illinois Metropolitan Investment FundNotes to the Financial Statements
September 30, 2016
NOTE E - FUND EXPENSES - IMET 1-3 YEAR FUND (Continued)
2. Consultant
NOTE F - FUND EXPENSES - IMET CONVENIENCE SERIES
1. Fund Management
In addition, for the year ended September 30, 2016, IMET management administrative and operating expenses
of $282,210 were charged to the IMET Convenience Series.
The DuPage Mayors and Managers Conference, Northwest Municipal Conference, South Suburban Mayors
and Managers Association, and the Will County Governmental League act collectively as the IMET 1-3 Year
Series' Consultant. Services provided by the Consultant typically include identification and solicitation of
potential investors. IMET pays the Consultant an annual fee in arrears equal to 0.02% of the IMET 1-3 Year
Series' average daily net position for each fiscal year, not to exceed $125,000 in any fiscal year. No annual
fee shall be payable for any fiscal year unless the assets of the IMET 1-3 Year Series exceed $100 million for
at least 31 consecutive calendar days during such fiscal year and the total return to fund participants for such
fiscal year equals or exceeds the average 90-day Treasury bill rate during such fiscal year. For fiscal year
2016, the IMET 1-3 Year Series' return exceeded the average 90-day Treasury bill rate. Accordingly, IMET
incurred consulting fees expense of $35,400, for the year ended September 30, 2016, which was accrued in the
IMET 1-3 Year Fund.
The total expenses, including consulting fees, for the IMET Convenience Series, were approximately 0.12% of the
average daily net position for the year ended September 30, 2016. The average daily net position of the IMET
Convenience Series was approximately $457.1 million, for the year ended September 30, 2016. The contractually
obligated expenses are described below.
For the year ended September 30, 2016, the IMET Convenience Series incurred expenses of $234,965 for
services provided by ALPS Fund Services.
IMET has an agreement with ALPS Fund Services, to provide administrative services including fund
accounting and transfer agent services. The fees associated with these services are calculated at annual rates
as described in Note E-1, above.
-21-
Illinois Metropolitan Investment FundNotes to the Financial Statements
September 30, 2016
NOTE G - UNIT TRANSACTIONS
IMET IMET IMET
1 - 3 Year Convenience FFF Account
Series Series Liquidating Trust
Unit transactions:
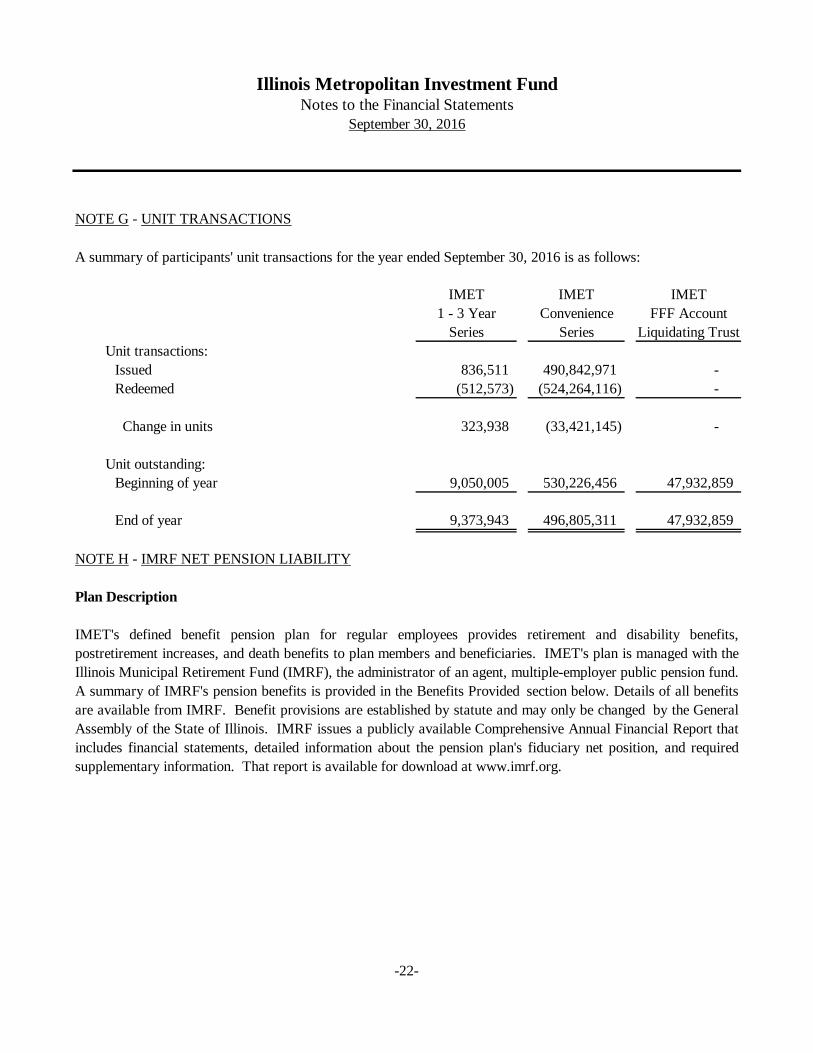
Issued 836,511 490,842,971 -
Redeemed (512,573) (524,264,116) -
Change in units 323,938 (33,421,145) -
Unit outstanding:
Beginning of year 9,050,005 530,226,456 47,932,859
End of year 9,373,943 496,805,311 47,932,859
NOTE H - IMRF NET PENSION LIABILITY
A summary of participants' unit transactions for the year ended September 30, 2016 is as follows:
Plan Description
IMET's defined benefit pension plan for regular employees provides retirement and disability benefits,
postretirement increases, and death benefits to plan members and beneficiaries. IMET's plan is managed with the
Illinois Municipal Retirement Fund (IMRF), the administrator of an agent, multiple-employer public pension fund.
A summary of IMRF's pension benefits is provided in the Benefits Provided section below. Details of all benefits
are available from IMRF. Benefit provisions are established by statute and may only be changed by the General
Assembly of the State of Illinois. IMRF issues a publicly available Comprehensive Annual Financial Report that
includes financial statements, detailed information about the pension plan's fiduciary net position, and required
supplementary information. That report is available for download at www.imrf.org.
-22-
Illinois Metropolitan Investment FundNotes to the Financial Statements
September 30, 2016
NOTE H - IMRF NET PENSION LIABILITY (Continued)
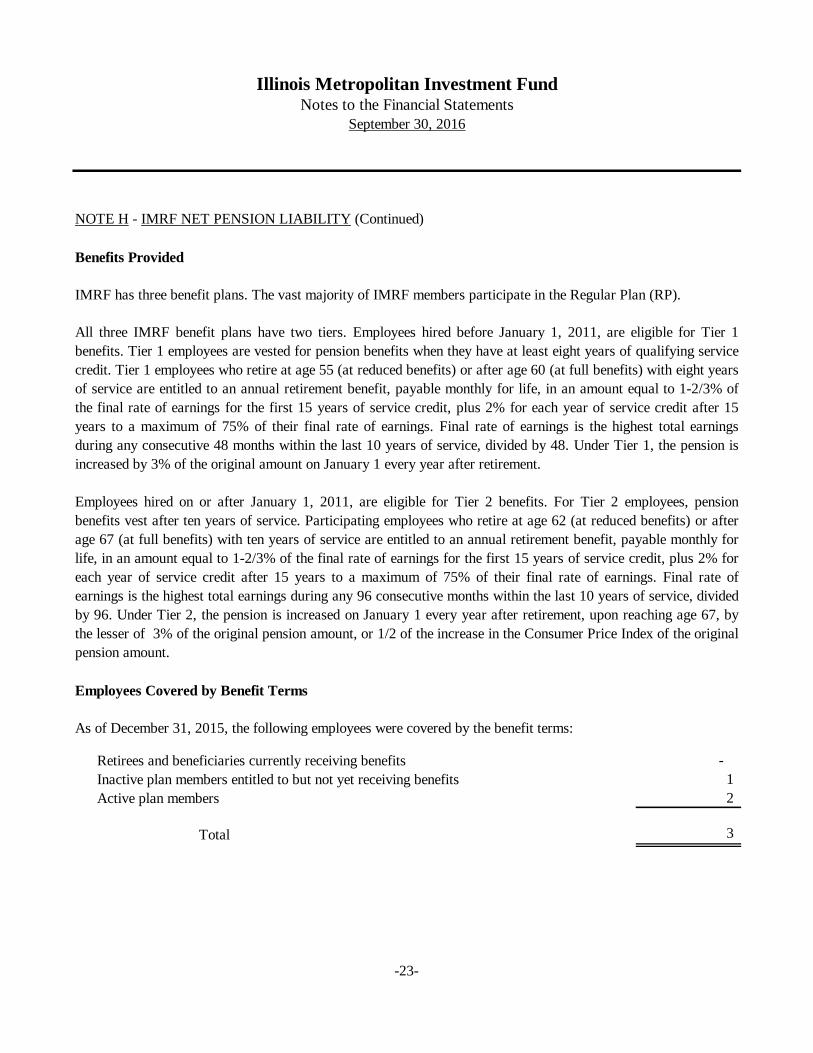
Retirees and beneficiaries currently receiving benefits -
Inactive plan members entitled to but not yet receiving benefits 1
Active plan members 2
Total 3
All three IMRF benefit plans have two tiers. Employees hired before January 1, 2011, are eligible for Tier 1
benefits. Tier 1 employees are vested for pension benefits when they have at least eight years of qualifying service
credit. Tier 1 employees who retire at age 55 (at reduced benefits) or after age 60 (at full benefits) with eight years
of service are entitled to an annual retirement benefit, payable monthly for life, in an amount equal to 1-2/3% of
the final rate of earnings for the first 15 years of service credit, plus 2% for each year of service credit after 15
years to a maximum of 75% of their final rate of earnings. Final rate of earnings is the highest total earnings
during any consecutive 48 months within the last 10 years of service, divided by 48. Under Tier 1, the pension is
increased by 3% of the original amount on January 1 every year after retirement.
Employees hired on or after January 1, 2011, are eligible for Tier 2 benefits. For Tier 2 employees, pension
benefits vest after ten years of service. Participating employees who retire at age 62 (at reduced benefits) or after
age 67 (at full benefits) with ten years of service are entitled to an annual retirement benefit, payable monthly for
life, in an amount equal to 1-2/3% of the final rate of earnings for the first 15 years of service credit, plus 2% for
each year of service credit after 15 years to a maximum of 75% of their final rate of earnings. Final rate of
earnings is the highest total earnings during any 96 consecutive months within the last 10 years of service, divided
by 96. Under Tier 2, the pension is increased on January 1 every year after retirement, upon reaching age 67, by
the lesser of 3% of the original pension amount, or 1/2 of the increase in the Consumer Price Index of the original
pension amount.
Employees Covered by Benefit Terms
As of December 31, 2015, the following employees were covered by the benefit terms:
Benefits Provided
IMRF has three benefit plans. The vast majority of IMRF members participate in the Regular Plan (RP).
-23-
Illinois Metropolitan Investment FundNotes to the Financial Statements
September 30, 2016
NOTE H - IMRF NET PENSION LIABILITY (Continued)
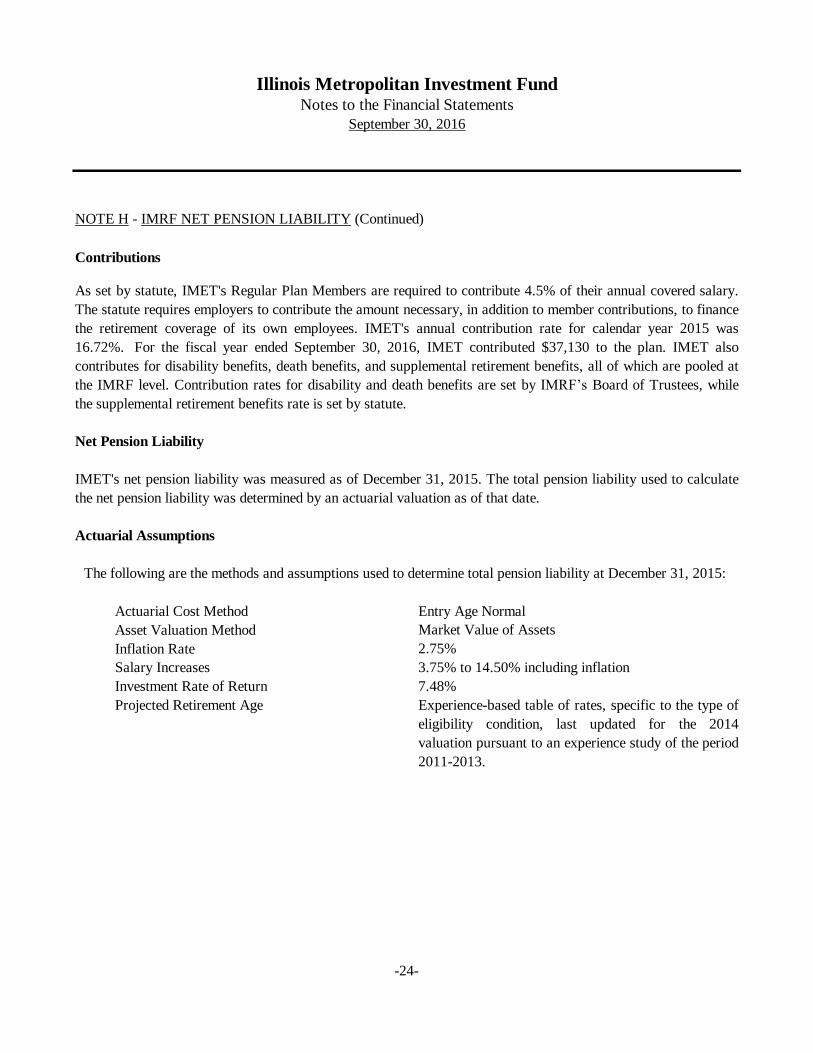
Actuarial Cost Method
Asset Valuation Method Market Value of Assets
Inflation Rate 2.75%
Salary Increases 3.75% to 14.50% including inflation
Investment Rate of Return 7.48%
Projected Retirement Age
Entry Age Normal
Experience-based table of rates, specific to the type of
eligibility condition, last updated for the 2014
valuation pursuant to an experience study of the period
2011-2013.
Contributions
As set by statute, IMET's Regular Plan Members are required to contribute 4.5% of their annual covered salary.
The statute requires employers to contribute the amount necessary, in addition to member contributions, to finance
the retirement coverage of its own employees. IMET's annual contribution rate for calendar year 2015 was
16.72%. For the fiscal year ended September 30, 2016, IMET contributed $37,130 to the plan. IMET also
contributes for disability benefits, death benefits, and supplemental retirement benefits, all of which are pooled at
the IMRF level. Contribution rates for disability and death benefits are set by IMRF’s Board of Trustees, while
the supplemental retirement benefits rate is set by statute.
Net Pension Liability
IMET's net pension liability was measured as of December 31, 2015. The total pension liability used to calculate
the net pension liability was determined by an actuarial valuation as of that date.
Actuarial Assumptions
The following are the methods and assumptions used to determine total pension liability at December 31, 2015:
-24-
Illinois Metropolitan Investment FundNotes to the Financial Statements
September 30, 2016
NOTE H - IMRF NET PENSION LIABILITY (Continued)
Mortality For non-disabled retirees, the IMRF-specific mortality
table was used with fully generational projection scale
MP-2014 (base year 2014). The IMRF specific rates
were developed from the RP-2014 Blue Collar Health
Annuitant Mortality Table with adjustments to match
current IMRF experience. For disabled retirees, an
IMRF-specific mortality table was used with fully
generational projection scale MP-2014 (base year
2014). The IMRF-specific rates were developed from
the RP-2014 Disabled Retirees Mortality Table,
applying the same adjustments that were applied for
non-disabled lives. For active members, an IMRF-
specific mortality table was used with fully
generational projection scale MP-2014 (base year
2014). The IMRF-specific rates were developed from
the RP-2014 Employee Mortality Table with
adjustments to match current IMRF experience.
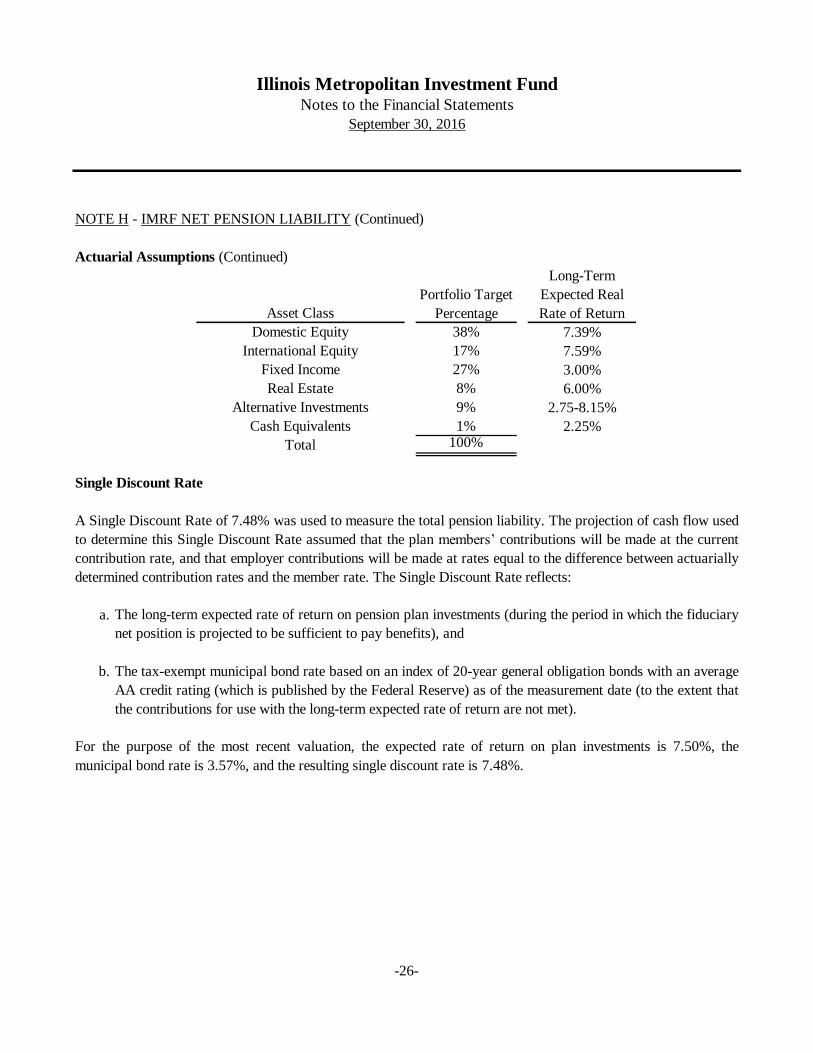
The long-term expected rate of return on pension plan
investments was determined using a building-block
method in which best-estimate ranges of expected
future real rates of return (expected returns, net of
pension plan investment expense, and inflation) are
developed for each major asset class. These ranges are
combined to produce the long-term expected rate of
return by weighting the expected future real rates of
return to the target asset allocation percentage and
adding expected inflation. The target allocation and
best estimates of geometric real rates of return for each
major asset class are summarized in the following
table:
Long-term Expected Rate of Return
Actuarial Assumptions (Continued)
-25-
Illinois Metropolitan Investment FundNotes to the Financial Statements
September 30, 2016
NOTE H - IMRF NET PENSION LIABILITY (Continued)
38%
17%
27%
8%
9%
1%100%
a.
b.
A Single Discount Rate of 7.48% was used to measure the total pension liability. The projection of cash flow used
to determine this Single Discount Rate assumed that the plan members’ contributions will be made at the current
contribution rate, and that employer contributions will be made at rates equal to the difference between actuarially
determined contribution rates and the member rate. The Single Discount Rate reflects:
For the purpose of the most recent valuation, the expected rate of return on plan investments is 7.50%, the
municipal bond rate is 3.57%, and the resulting single discount rate is 7.48%.
Fixed Income
Total
Real Estate 6.00%
Alternative Investments 2.75-8.15%
Cash Equivalents 2.25%
Domestic Equity 7.39%
International Equity
3.00%
7.59%
Actuarial Assumptions (Continued)
Single Discount Rate
The long-term expected rate of return on pension plan investments (during the period in which the fiduciary
net position is projected to be sufficient to pay benefits), and
The tax-exempt municipal bond rate based on an index of 20-year general obligation bonds with an average
AA credit rating (which is published by the Federal Reserve) as of the measurement date (to the extent that
the contributions for use with the long-term expected rate of return are not met).
Portfolio Target
Percentage
Long-Term
Expected Real
Rate of ReturnAsset Class
-26-
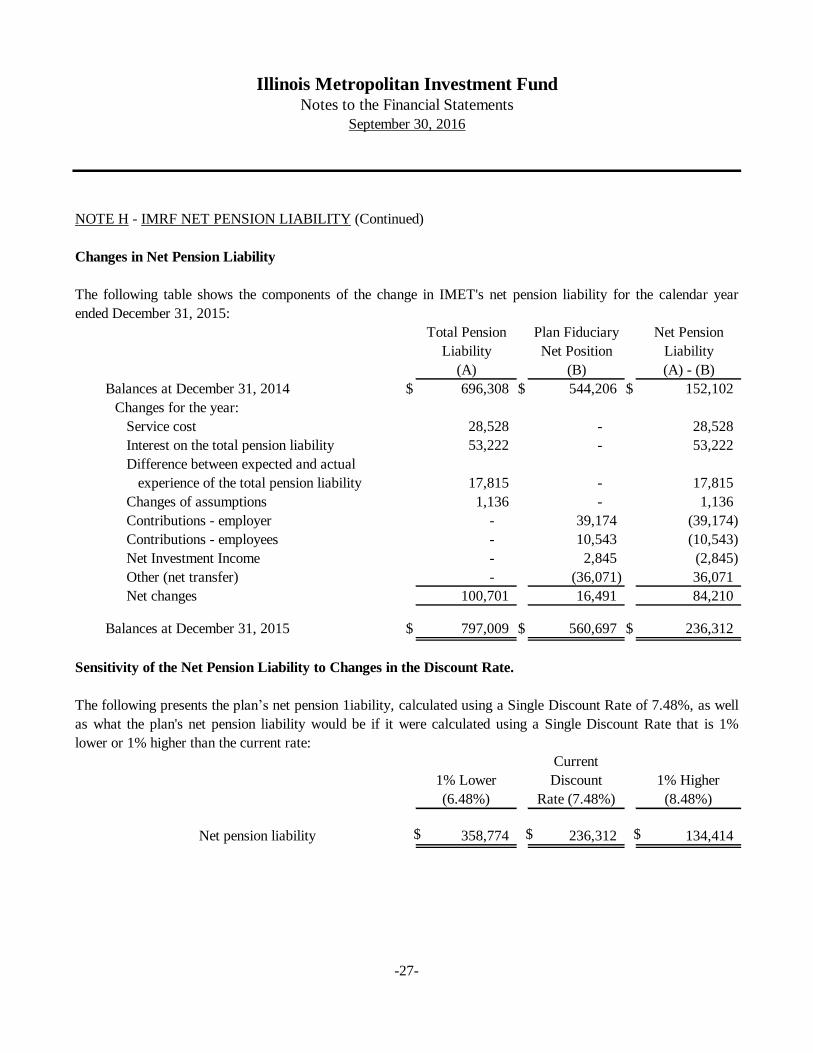
Illinois Metropolitan Investment FundNotes to the Financial Statements
September 30, 2016
NOTE H - IMRF NET PENSION LIABILITY (Continued)
Total Pension Plan Fiduciary Net Pension
Liability Net Position Liability
(A) (B) (A) - (B)
Balances at December 31, 2014 $ 696,308 $ 544,206 $ 152,102
Changes for the year:
Service cost 28,528 - 28,528
Interest on the total pension liability 53,222 - 53,222
Difference between expected and actual
experience of the total pension liability 17,815 - 17,815
Changes of assumptions 1,136 - 1,136
Contributions - employer - 39,174 (39,174)
Contributions - employees - 10,543 (10,543)
Net Investment Income - 2,845 (2,845)
Other (net transfer) - (36,071) 36,071
Net changes 100,701 16,491 84,210
Balances at December 31, 2015 $ 797,009 $ 560,697 $ 236,312
Current
1% Lower Discount 1% Higher
(6.48%) Rate (7.48%) (8.48%)
Net pension liability $ 358,774 $ 236,312 $ 134,414
Changes in Net Pension Liability
The following table shows the components of the change in IMET's net pension liability for the calendar year
ended December 31, 2015:
Sensitivity of the Net Pension Liability to Changes in the Discount Rate.
The following presents the plan’s net pension 1iability, calculated using a Single Discount Rate of 7.48%, as well
as what the plan's net pension liability would be if it were calculated using a Single Discount Rate that is 1%
lower or 1% higher than the current rate:
-27-
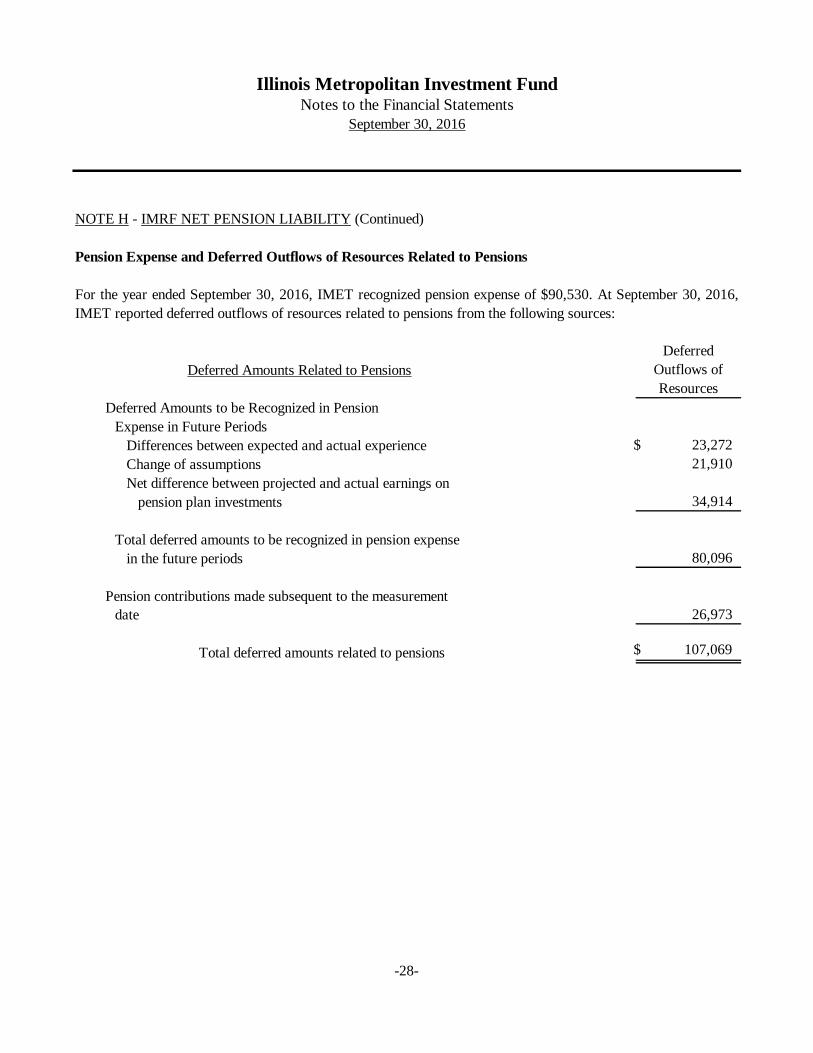
Illinois Metropolitan Investment FundNotes to the Financial Statements
September 30, 2016
NOTE H - IMRF NET PENSION LIABILITY (Continued)
Deferred
Deferred Amounts Related to Pensions Outflows of
Resources
Deferred Amounts to be Recognized in Pension
Expense in Future Periods
Differences between expected and actual experience $ 23,272
Change of assumptions 21,910
Net difference between projected and actual earnings on
pension plan investments 34,914
Total deferred amounts to be recognized in pension expense
in the future periods 80,096
Pension contributions made subsequent to the measurement
date 26,973
Total deferred amounts related to pensions $ 107,069
Pension Expense and Deferred Outflows of Resources Related to Pensions
For the year ended September 30, 2016, IMET recognized pension expense of $90,530. At September 30, 2016,
IMET reported deferred outflows of resources related to pensions from the following sources:
-28-
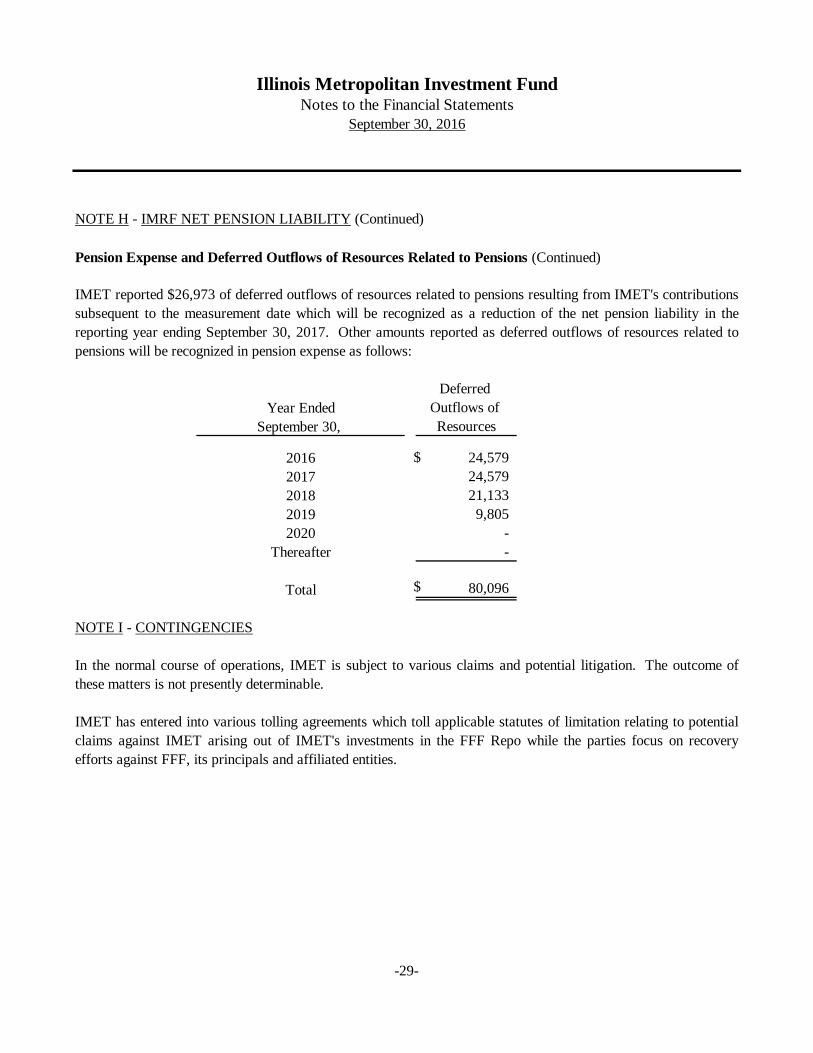
Illinois Metropolitan Investment FundNotes to the Financial Statements
September 30, 2016
NOTE H - IMRF NET PENSION LIABILITY (Continued)
Deferred
Outflows of
Resources
$ 24,579
24,579
21,133
9,805
-
-
$ 80,096
Thereafter
Total
2016
2017
2018
2019
2020
Year Ended
September 30,
Pension Expense and Deferred Outflows of Resources Related to Pensions (Continued)
IMET reported $26,973 of deferred outflows of resources related to pensions resulting from IMET's contributions
subsequent to the measurement date which will be recognized as a reduction of the net pension liability in the
reporting year ending September 30, 2017. Other amounts reported as deferred outflows of resources related to
pensions will be recognized in pension expense as follows:
IMET has entered into various tolling agreements which toll applicable statutes of limitation relating to potential
claims against IMET arising out of IMET's investments in the FFF Repo while the parties focus on recovery
efforts against FFF, its principals and affiliated entities.
NOTE I - CONTINGENCIES
In the normal course of operations, IMET is subject to various claims and potential litigation. The outcome of
these matters is not presently determinable.
-29-
REQUIRED SUPPLEMENTARY INFORMATION (Unaudited)
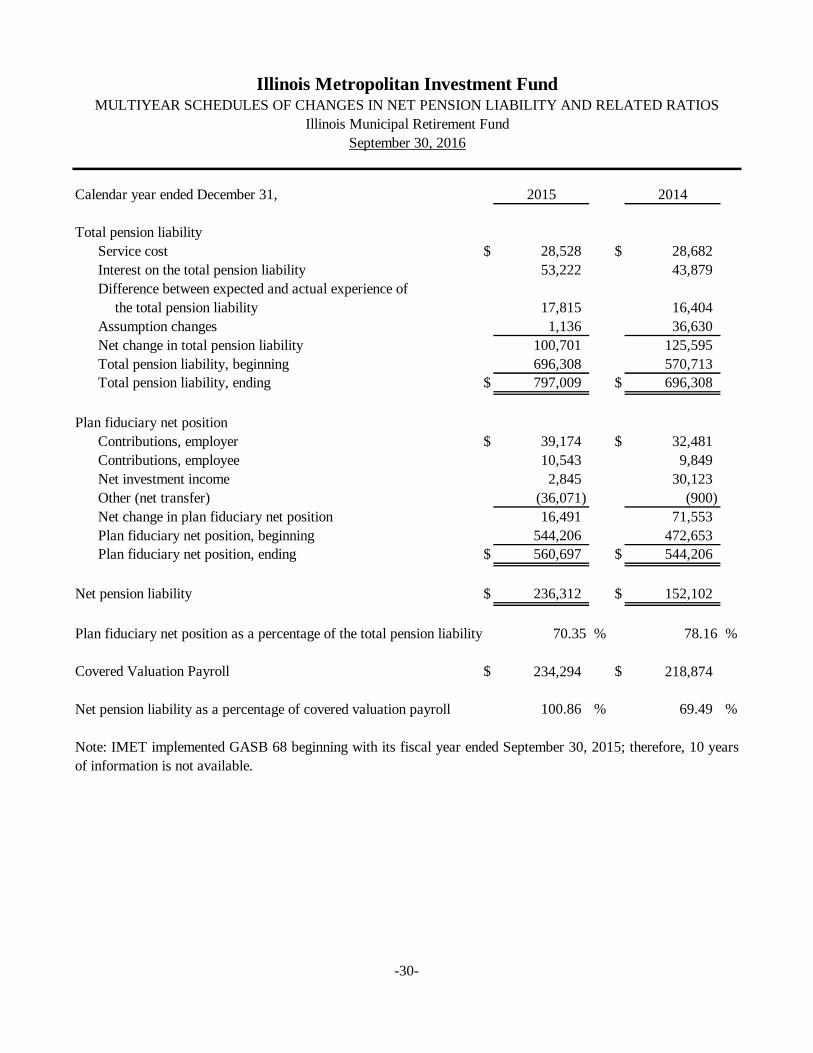
Calendar year ended December 31, 2015 2014
Total pension liability
Service cost $ 28,528 $ 28,682
Interest on the total pension liability 53,222 43,879
Difference between expected and actual experience of
the total pension liability 17,815 16,404
Assumption changes 1,136 36,630
Net change in total pension liability 100,701 125,595
Total pension liability, beginning 696,308 570,713
Total pension liability, ending $ 797,009 $ 696,308
Plan fiduciary net position
Contributions, employer $ 39,174 $ 32,481
Contributions, employee 10,543 9,849
Net investment income 2,845 30,123
Other (net transfer) (36,071) (900)
Net change in plan fiduciary net position 16,491 71,553
Plan fiduciary net position, beginning 544,206 472,653
Plan fiduciary net position, ending $ 560,697 $ 544,206
Net pension liability $ 236,312 $ 152,102
Plan fiduciary net position as a percentage of the total pension liability 70.35 % 78.16 %
Covered Valuation Payroll $ 234,294 $ 218,874
Net pension liability as a percentage of covered valuation payroll 100.86 % 69.49 %
Illinois Metropolitan Investment FundMULTIYEAR SCHEDULES OF CHANGES IN NET PENSION LIABILITY AND RELATED RATIOS
Illinois Municipal Retirement Fund
September 30, 2016
Note: IMET implemented GASB 68 beginning with its fiscal year ended September 30, 2015; therefore, 10 years
of information is not available.
-30-

Calendar Year Actuarially Contribution Covered Actual Contribution
Ending Determined Actual Deficiency Valuation as a % of
December 31, Contribution Contribution (Excess) Payroll Covered Valuation Payroll
2015 $ 39,174 * $ 39,174 $ - $ 234,294 16.72 %
2014 32,481 32,481 - 218,874 14.84
* Estimated based on contribution rate of 16.72% and covered valuation payroll of $234,294.
Illinois Metropolitan Investment FundMULTIYEAR SCHEDULE OF CONTRIBUTIONS
Illinois Municipal Retirement Fund
September 30, 2016
Note: IMET implemented GASB 68 beginning with its fiscal year ended September 30, 2015; therefore, 10 years of
information is not available.
-31-

1.
Valuation Date:
Notes
Methods and Assumptions Used to Determine the 2015 Contribution Rate:
Actuarial Cost Method Aggregate Entry Age Normal
Amortization Method Level Percentage of Payroll, Closed
Remaining Amortization Period Non-Taxing bodies: 10-year rolling period.
Asset Valuation Method 5-year smoothed market; 20% corridor
Wage Growth 4.00%
Price Inflation
Salary Increases 4.40% to 16.00%, including inflation
Investment Rate of Return 7.50%
Retirement Age
Mortality
Other Information:
Notes There were no benefit changes during the year.
* Based on Valuation Assumptions used in the December 31, 2013 actuarial valuation.
Early Retirement Incentive Plan liabilities: a period up to 10 years selected by the
Employer upon adoption of ERI.
3.0% - approximate; no explicit price inflation assumption is used in this valuation.
Experience-based table of rates that are specific to the type of eligibility condition.
Last updated for the 2011 calculation pursuant to an experience study of the period
2008-2010.
RP-2000 Combined Healthy Mortality Table, adjusted for mortality improvements
to 2020 using projection scale AA. For men, 120% of the table rates were used.
For women, 92% of the table rates were used. For disabled lives, the mortality
rates are the rates applicable to non-disabled lives set forward 10 years.
Illinois Metropolitan Investment FundNOTES TO THE REQUIRED SUPPLEMENTARY INFORMATION
September 30, 2016
Actuarially determined contribution rates are calculated as of December 31 each
year, which are 12 months prior to the beginning of the fiscal year in which
contributions are reported.
Taxing bodies (Regular members): 28-year closed period until remaining period
reaches 15 years (then 15-year rolling period).
SUMMARY OF ACTUARIAL METHODS AND ASSUMPTIONS USED IN THE CALCULATION OF
THE 2015 IMRF CONTRIBUTION RATE*
SLEP supplemental liabilities attributable to Public Act 94-712 were financed
over 23 years for most employers (two employers were financed over 32 years).
-32-

OTHER SUPPLEMENTARY INFORMATION
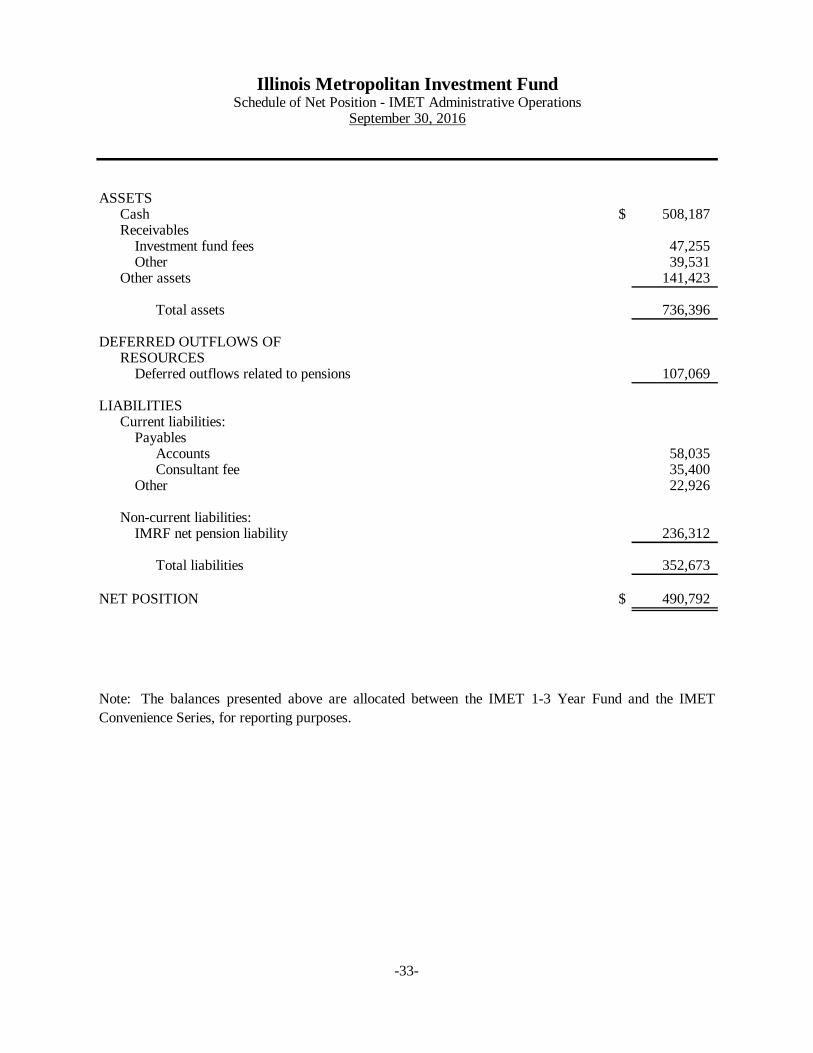
Cash $ 508,187 Receivables
Investment fund fees 47,255 Other 39,531
Other assets 141,423
Total assets 736,396
DEFERRED OUTFLOWS OFRESOURCES
Deferred outflows related to pensions 107,069
LIABILITIESCurrent liabilities:
PayablesAccounts 58,035 Consultant fee 35,400
Other 22,926
Non-current liabilities:IMRF net pension liability 236,312
Total liabilities 352,673
NET POSITION $ 490,792
Illinois Metropolitan Investment FundSchedule of Net Position - IMET Administrative Operations
September 30, 2016
ASSETS
Note: The balances presented above are allocated between the IMET 1-3 Year Fund and the IMET
Convenience Series, for reporting purposes.
-33-
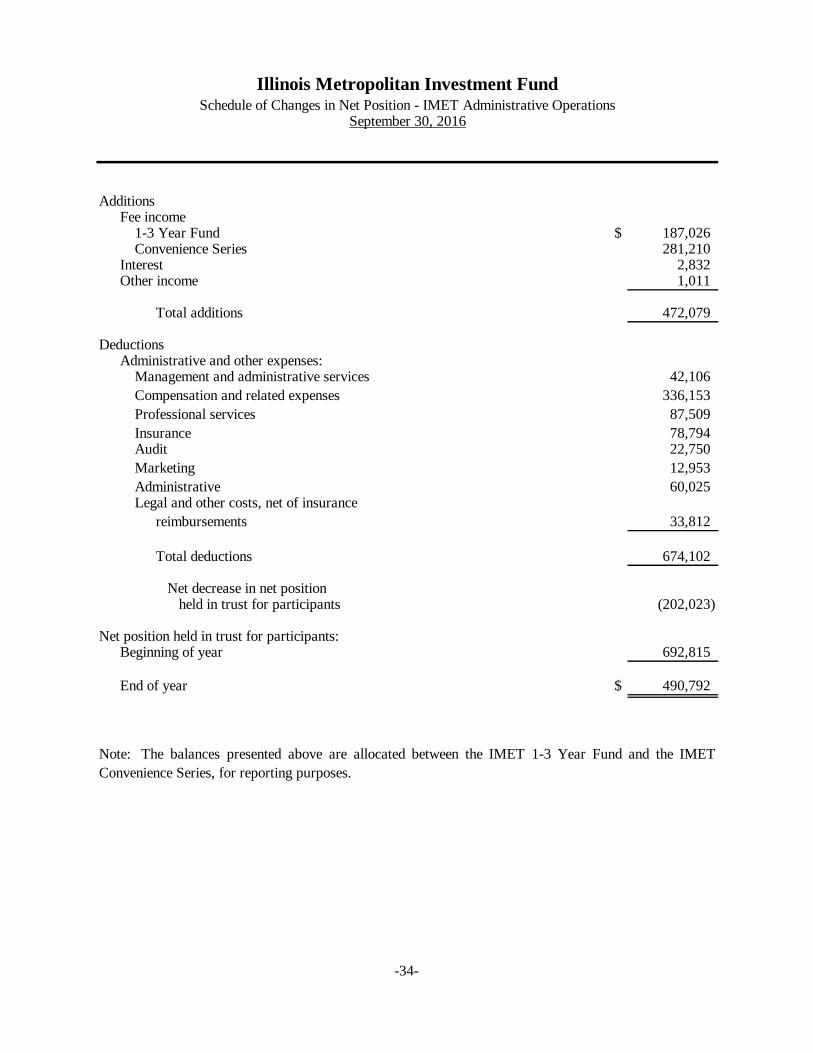
Fee income1-3 Year Fund $ 187,026 Convenience Series 281,210
Interest 2,832 Other income 1,011
Total additions 472,079
DeductionsAdministrative and other expenses:
Management and administrative services 42,106
Compensation and related expenses 336,153
Professional services 87,509
Insurance 78,794 Audit 22,750
Marketing 12,953
Administrative 60,025 Legal and other costs, net of insurance
reimbursements 33,812
Total deductions 674,102
Net decrease in net positionheld in trust for participants (202,023)
Net position held in trust for participants:Beginning of year 692,815
End of year $ 490,792
Illinois Metropolitan Investment FundSchedule of Changes in Net Position - IMET Administrative Operations
September 30, 2016
Additions
Note: The balances presented above are allocated between the IMET 1-3 Year Fund and the IMET
Convenience Series, for reporting purposes.
-34-

IMET IMET VarianceOriginal and 1-3 Year Convenience from FinalFinal Budget Fund Series Total Budget
Management and administrativeservices Accounting services $ 6,600 $ 3,738 $ 2,968 $ 6,706 $ (106) Consultant repayment 35,000 19,733 15,667 35,400 (400)
Total 41,600 23,471 18,635 42,106 (506)
Compensation and relatedexpensesSalary expense 225,616 107,242 85,150 192,392 33,224
Wages 10,920 5,853 4,647 10,500 420 Taxes 17,402 8,331 6,614 14,945 2,457 Insurance benefits 43,440 15,466 12,279 27,745 15,695 IMRF pension 41,463 50,341 39,971 90,312 (48,849) Other - 144 115 259 (259)
Total 338,841 187,377 148,776 336,153 2,688
Professional services Asset monitoring 15,600 8,361 6,639 15,000 600
Interim Director - 32,051 25,448 57,499 (57,499) Legal services 15,000 8,367 6,643 15,010 (10)
Total 30,600 48,779 38,730 87,509 (56,909)
Insurance 81,250 43,921 34,873 78,794 2,456
Audit 22,250 12,681 10,069 22,750 (500)
Marketing 21,810 7,220 5,733 12,953 8,857
AdministrativeAdministrative assistance 161 128 289 (289)
Conferences 9,650 1,129 896 2,025 7,625 Dues and publications 11,115 6,011 4,773 10,784 331 Fund rating 19,700 10,981 8,719 19,700 - Office expense 20,000 8,429 6,692 15,121 4,879 Rent expense 6,000 3,344 2,656 6,000 - Travel 8,000 3,256 2,586 5,842 2,158
Web site maintenance 600 147 117 264 336
Total 75,065 33,458 26,567 60,025 15,040
Legal and other costs, net of
insurance reimbursements 160,280 - 33,812 33,812 126,468
Total administrative and other
expenses $ 771,696 $ 356,907 $ 317,195 $ 674,102 $ 97,594
Illinois Metropolitan Investment FundSchedule of Administrative and Other Expenses - Budget and Actual
Year Ended September 30, 2016
Actual
-35-

INVESTMENT SECTION (Unaudited)
(Continued)
Markets entered the fourth quarter of 2015 uncertain about the next move by the Federal Reserve (the “Fed”) and
fearful about the persistent weakness in commodities. However, as the fourth quarter got under way, U.S. labor
markets showed strength, inflation stabilized and appeared to resurface in wages, financial conditions improved, and
doubts began to fade as the Fed set the stage for a hike in rates at its December 2015 Federal Open Market
Committee (“FOMC”) meeting. U.S. Treasury yields moved higher as the meeting approached, leading to a muted
reaction in the bond market during and after the announcement.
Illinois Metropolitan Investment FundReport on Investment Activity
September 30, 2016
Description of the Investment Funds
The Illinois Metropolitan Investment Fund (IMET) is a quasi-governmental investment fund created under the
Illinois Municipal Code. IMET, formed on July 17, 1996, actively manages two investment funds for municipal
treasurers, official custodians of municipal funds, and other public agencies in the state of Illinois. These funds are
the IMET 1-3 Year Series and the IMET Convenience Series. IMET also offers arbitrage rebate calculation
services for participants whose bond proceeds are subject to federal arbitrage restrictions.
The IMET 1-3 Year Series is designed as an investment vehicle for funds not required for immediate use or,
generally, for liquidity purposes. Such funds allow for investment in securities with average maturities generally
longer than those of money market instruments. Typically, longer maturities have greater returns.
Market Review
The objectives of the IMET 1-3 Year Series are to provide safety, liquidity and appropriate risk-adjusted return
(high current yield). This is accomplished through a diversified portfolio of investment grade fixed income
instruments as permitted under the Public Funds Investment Act of the State of Illinois. The benchmark for the
IMET 1-3 Year Series is the Barclay's 1-3 year Government Bond Index.
The IMET Convenience Series was established on September 2, 2003 as an investment alternative for IMET
participants. It is intended for use as a short-term investment for funds that may or may not be needed for near-
term disbursement. The IMET Convenience Series is comprised of collateralized and FDIC insured bank deposit
products with same day or next day liquidity and U.S. government securities. The Convenience Series currently
provides a return that is pegged to the federal funds target interest rate.
The objective of the IMET Convenience Series is to provide safety, liquidity and appropriate risk-adjusted return.
It provides a money market like vehicle for the convenient investment of bond proceeds, for the temporary
investment of intermediate funds, and/or for cash management and liquidity purposes. As such, the IMET
Convenience Series serves as a companion vehicle to the IMET 1-3 Year Series.
-36-
(Continued)
Overall portfolio duration for the 1-3 Year Series remained shorter than its benchmark, which was a detractor from
performance as rates moved lower during the first quarter of 2016.
It was a volatile start to 2016 for global markets as equity prices plunged before rebounding to end the first quarter
of 2016 in positive territory, oil prices plummeted to 12-year lows only to reverse course to end slightly above
where they began and global growth concerns continued to dampen investors’ outlook. The turmoil during the first
half of the quarter can be attributed to China’s accelerated pace of yuan devaluation, persistent oversupply in the oil
markets and poor economic data across the globe. At its worst point, the credit markets had priced in recessionary
spread levels. The rebound in the second half of the quarter was led by the turnaround in the commodity market.
After sinking roughly 29% since the beginning of 2016, crude oil prices rose as the world’s major oil producing
countries began talks to curtail production. Furthermore, strong U.S. economic momentum along with a stabilized
currency in China added support for the market rebound.
The FOMC decided, as expected, not to raise rates during its March 2016 meeting. The tone of the meeting was
dovish as the committee revised down its expectations for the Federal Funds Rate (“FFR”) with the median
projection moving from four to two rate hikes for 2016 year, stating that the “global economic and financial
developments continue to pose risks.” Outside of the U.S., major central banks remained accommodative as
inflation expectations continued to fall and rates moved further into negative territory.
While the U.S. embarked on tighter monetary policy, the rest of the major global central banks continued their
easing programs. At the beginning of the fourth quarter of 2015, the European Central Bank (“ECB”) President
Mario Draghi primed markets for strong stimulus moves by the end of the year to boost low inflation and growth.
His announcement later at the December ECB meeting disappointed the market as investors expected a greater
reduction than 0.10% in the deposit rate, an increase in the amount of bond purchases per month and a larger
extension of the program than the announced six months.
Overall portfolio duration for the 1-3 Year Series remained shorter than duration of its benchmark, which was a
positive to performance as short-term rates moved higher during the fourth quarter of 2015.
Illinois Metropolitan Investment FundReport on Investment Activity (Continued)
Market Review (Continued)
September 30, 2016
-37-
(Continued)
Markets started the second quarter of 2016 with a constructive tone as credit spreads tightened, equities rose and
U.S. Treasury yields increased. However, equities sold off sharply, credit spreads widened and high quality global
government bond yields declined significantly at the end of the quarter in response to ‘Brexit’ as markets had
assigned a high probability to a victory for “remain.” When British voters opted to leave the European Union, it
came as a shock to markets. However, in the last three trading days of the second quarter of 2016, markets
stabilized as fears of an immediate exit of the United Kingdom from the EU diminished and equities rebounded,
credit spreads retraced most of their widening since Brexit in industrials and U.S. banks, while Yankee banks
remained at the wider levels through quarter end.
Illinois Metropolitan Investment Fund
September 30, 2016
Market Review (Continued)
Report on Investment Activity (Continued)
U.S. Treasury yields fell across the curve during the second quarter of 2016, with two-year yields finishing the
quarter at 0.58%. Overall portfolio duration remained shorter than the benchmark, which was a detractor from
performance relative to the benchmark as rates moved continued to move lower during the quarter.
For most of the third quarter of 2016, financial markets were stable and uneventful, with risk assets performing well
and U.S. Treasuries selling off. Although the quarter began amid uncertainty surrounding Brexit, the market impact
of the United Kingdom vote to exit the EU was fairly muted. U.S. job growth continued on a strong path, while
commodities, the U.S. dollar, global growth and China all stabilized.
The more interesting events occurred at the end of the quarter when the decisions of three major central banks – the
Bank of Japan (“BoJ”), the European Central Bank (“ECB”) and the Fed – drew investors’ focus. This year, the
BoJ and ECB both embarked on negative interest rate policy, which has hurt both savers and financial companies.
At its September meetings, the BoJ introduced a new tool, “yield curve control”, with the aim of anchoring the 10-
year government bond yield at close to zero percent to ensure an upward-sloping yield curve. The ECB did not
extend its asset purchase program past its March 2017 deadline. These announcements caused investors to focus on
the limitations of monetary policy, which has so far been ineffective in efforts to reflate the global economies.
Finally, the Fed left policy unchanged at its September meeting but prepared the market for one rate hike by the end
of the year.
Overall portfolio duration of the 1-3 Year Series remained shorter than the benchmark, which was a slight positive
to performance on the quarter.
Because, to a great extent, the Convenience Fund is comprised of collateralized bank deposits, the rates of which
are pegged to the FFR, the Convenience Fund tracked that closely during the year, immediately increasing when the
Fed raised that rate in December 2015. Unlike some of its competitor funds in the state, the Convenience Fund does
not invest in any credit products, such as commercial paper, so its performance did not reflect any contribution from
credit exposure.
-38-
Basis of Presentation
(Concluded)
In general, as rates rise, the price of a fixed rate securities will fall, and vice versa. Interest rate risk is commonly
measured by duration. The 1-3 Year Series is managed versus the Barclays 1-3 Government Index. The duration
of the 1-3 Year as of September 30, 2016 was approximately 1.75. The portfolio was comprised of short maturity
investment grade US Government securities. In the context of the broad fixed income market, the portfolio of the 1-
3 Year Series has a low risk profile. Investors should remain aware that the Series does have risk to principal when
interest rates increase (interest rate risk) and when credit risk or perception of such to the US government and
related entities changes.
The Convenience Fund has a very low risk profile. The Convenience Series is managed to maintain a stable $1.00
share price, although there is no guarantee that it will do so. As of September 30, 2016, the Convenience Series
was invested entirely in collateralized and FDIC insured bank obligations and US Government securities.
The Investment Section has been prepared in conformity with accounting principles generally accepted in the United
States of America (GAAP) as applied to government units. The Governmental Accounting Standards Board
(GASB) is the accepted standard-setting body for establishing governmental accounting and financial reporting
principles.
Risk Profile
Illinois Metropolitan Investment FundReport on Investment Activity (Continued)
September 30, 2016
-39-
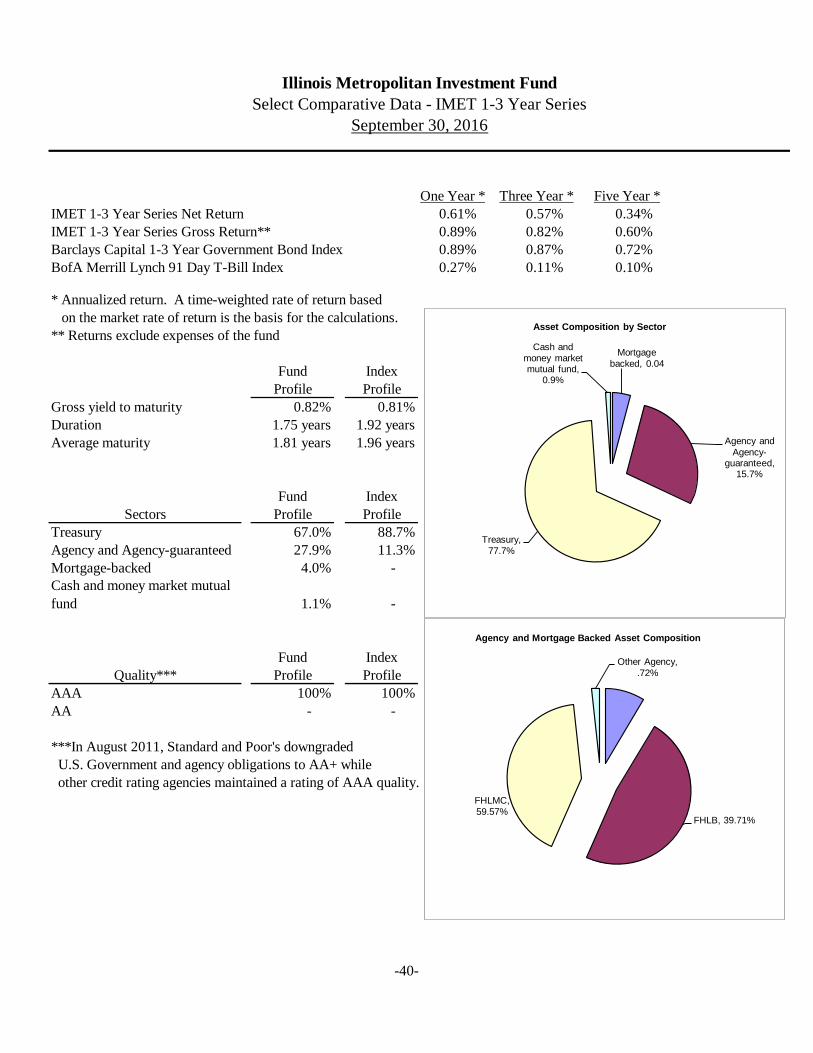
One Year * Three Year * Five Year *
IMET 1-3 Year Series Net Return 0.61% 0.57% 0.34%
IMET 1-3 Year Series Gross Return** 0.89% 0.82% 0.60%
Barclays Capital 1-3 Year Government Bond Index 0.89% 0.87% 0.72%
BofA Merrill Lynch 91 Day T-Bill Index 0.27% 0.11% 0.10%
* Annualized return. A time-weighted rate of return based
on the market rate of return is the basis for the calculations.
** Returns exclude expenses of the fund
Fund Index
Profile Profile
Gross yield to maturity 0.82% 0.81%
Duration 1.75 years 1.92 years
Average maturity 1.81 years 1.96 years
Fund Index
Sectors Profile Profile
Treasury 67.0% 88.7%
Agency and Agency-guaranteed 27.9% 11.3%
Mortgage-backed 4.0% -
Cash and money market mutual
fund 1.1% -
Fund Index
Quality*** Profile Profile
AAA 100% 100%
AA - -
***In August 2011, Standard and Poor's downgraded
U.S. Government and agency obligations to AA+ while
other credit rating agencies maintained a rating of AAA quality.
Illinois Metropolitan Investment Fund
Select Comparative Data - IMET 1-3 Year Series
September 30, 2016
Mortgage
backed, 0.04
Agency and
Agency-guaranteed,
15.7%
Treasury,
77.7%
Cash and
money market mutual fund,
0.9%
Asset Composition by Sector
FHLB, 39.71%
FHLMC,
59.57%
Other Agency,
.72%
Agency and Mortgage Backed Asset Composition
-40-

One Year * Three Year * Five Year*
IMET Convenience Series 0.44% 0.36% 0.34%
IL Funds Money Market Fund Index 0.25% 0.10% 0.09%
BofA Merrill Lynch 91 Day T-Bill Index 0.27% 0.11% 0.10%
* Annualized return. An internal rate of return based on the average
annualized monthly yield is the basis for the calculations.
BofA Merrill Lynch
Fund IL Funds 91 Day T-Bill Index
Profile Profile Profile
Average maturity (days) 166 41 55
BofA Merrill Lynch
Fund IL Funds 91 Day T-Bill Index
Sectors Profile Profile Profile
Collateralized Bank Deposits 85.9% 0.0%
Certificates of Deposit 4.8% 0.0%
Repurchase Agreements 0.0% 30.3%
Money Market Funds 0.0% 22.8%
Commercial Paper 0.0% 10.6%
Agencies 9.3% 30.1%
Treasuries 0.0% 6.4% 100.0%
Illinois Metropolitan Investment Fund
Select Comparative Data - IMET Convenience Series
September 30, 2016
FHLMCOther Agency
Collateralized Bank Deposits
85.9%
CDs4.8%
Agencies9.3%
Asset Composition by Sector
Collateralized Bank Deposits CDs Agencies
-41-
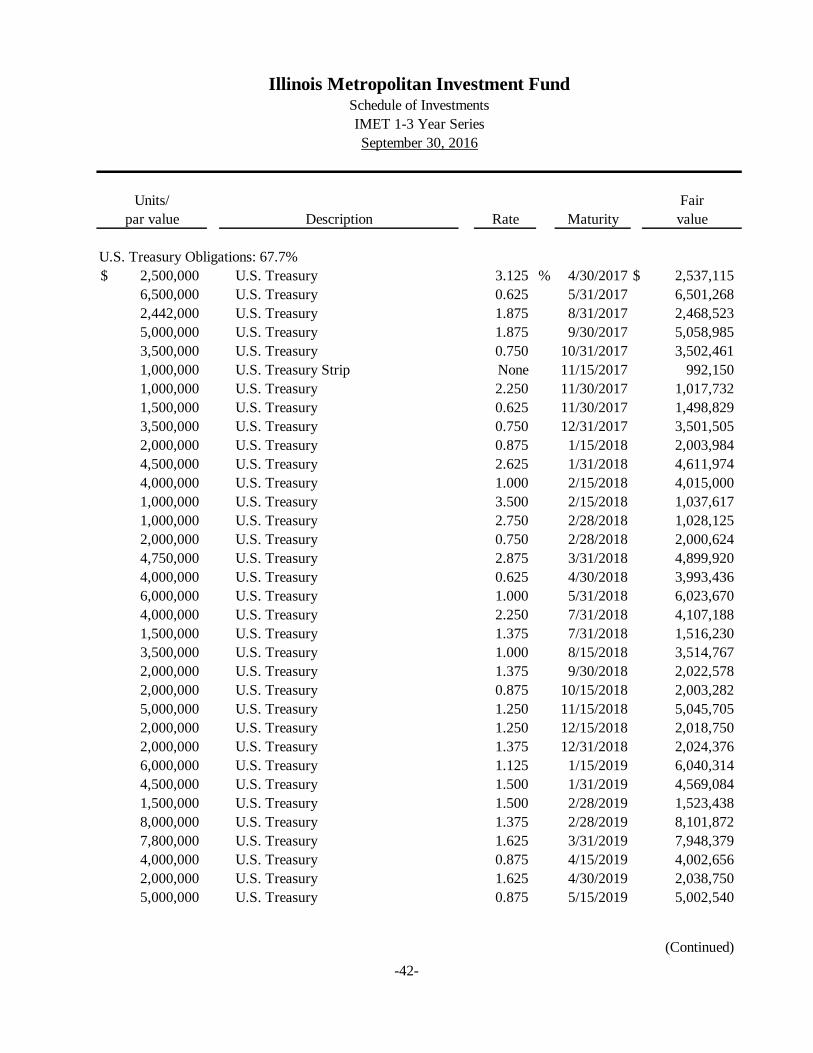
Fair
Rate Maturity value
U.S. Treasury Obligations: 67.7%
$ 2,500,000 U.S. Treasury 3.125 % 4/30/2017 $ 2,537,115
6,500,000 U.S. Treasury 0.625 5/31/2017 6,501,268
2,442,000 U.S. Treasury 1.875 8/31/2017 2,468,523
5,000,000 U.S. Treasury 1.875 9/30/2017 5,058,985
3,500,000 U.S. Treasury 0.750 10/31/2017 3,502,461
1,000,000 U.S. Treasury Strip None 11/15/2017 992,150
1,000,000 U.S. Treasury 2.250 11/30/2017 1,017,732
1,500,000 U.S. Treasury 0.625 11/30/2017 1,498,829
3,500,000 U.S. Treasury 0.750 12/31/2017 3,501,505
2,000,000 U.S. Treasury 0.875 1/15/2018 2,003,984
4,500,000 U.S. Treasury 2.625 1/31/2018 4,611,974
4,000,000 U.S. Treasury 1.000 2/15/2018 4,015,000
1,000,000 U.S. Treasury 3.500 2/15/2018 1,037,617
1,000,000 U.S. Treasury 2.750 2/28/2018 1,028,125
2,000,000 U.S. Treasury 0.750 2/28/2018 2,000,624
4,750,000 U.S. Treasury 2.875 3/31/2018 4,899,920
4,000,000 U.S. Treasury 0.625 4/30/2018 3,993,436
6,000,000 U.S. Treasury 1.000 5/31/2018 6,023,670
4,000,000 U.S. Treasury 2.250 7/31/2018 4,107,188
1,500,000 U.S. Treasury 1.375 7/31/2018 1,516,230
3,500,000 U.S. Treasury 1.000 8/15/2018 3,514,767
2,000,000 U.S. Treasury 1.375 9/30/2018 2,022,578
2,000,000 U.S. Treasury 0.875 10/15/2018 2,003,282
5,000,000 U.S. Treasury 1.250 11/15/2018 5,045,705
2,000,000 U.S. Treasury 1.250 12/15/2018 2,018,750
2,000,000 U.S. Treasury 1.375 12/31/2018 2,024,376
6,000,000 U.S. Treasury 1.125 1/15/2019 6,040,314
4,500,000 U.S. Treasury 1.500 1/31/2019 4,569,084
1,500,000 U.S. Treasury 1.500 2/28/2019 1,523,438
8,000,000 U.S. Treasury 1.375 2/28/2019 8,101,872
7,800,000 U.S. Treasury 1.625 3/31/2019 7,948,379
4,000,000 U.S. Treasury 0.875 4/15/2019 4,002,656
2,000,000 U.S. Treasury 1.625 4/30/2019 2,038,750
5,000,000 U.S. Treasury 0.875 5/15/2019 5,002,540
(Continued)
Description
Illinois Metropolitan Investment FundSchedule of Investments
September 30, 2016
IMET 1-3 Year Series
par value
Units/
-42-
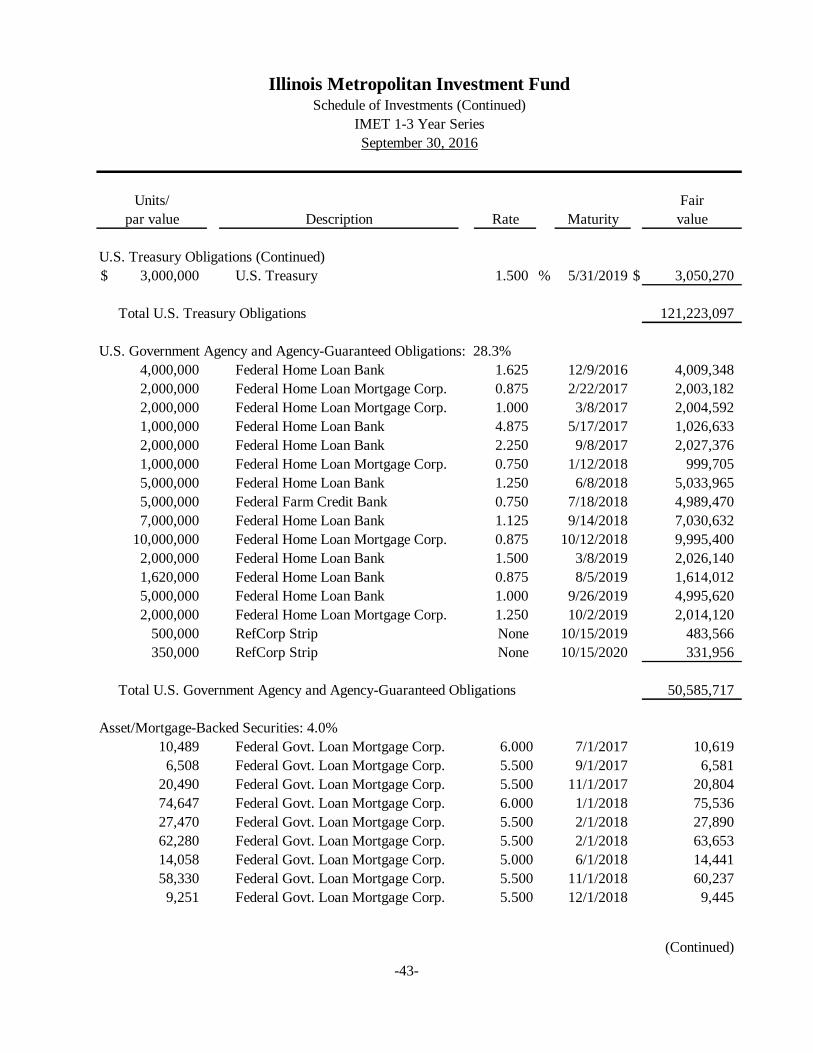
Fair
Rate Maturity value
U.S. Treasury Obligations (Continued)
$ 3,000,000 U.S. Treasury 1.500 % 5/31/2019 $ 3,050,270
Total U.S. Treasury Obligations 121,223,097
U.S. Government Agency and Agency-Guaranteed Obligations: 28.3%
4,000,000 Federal Home Loan Bank 1.625 12/9/2016 4,009,348
2,000,000 Federal Home Loan Mortgage Corp. 0.875 2/22/2017 2,003,182
2,000,000 Federal Home Loan Mortgage Corp. 1.000 3/8/2017 2,004,592
1,000,000 Federal Home Loan Bank 4.875 5/17/2017 1,026,633
2,000,000 Federal Home Loan Bank 2.250 9/8/2017 2,027,376
1,000,000 Federal Home Loan Mortgage Corp. 0.750 1/12/2018 999,705
5,000,000 Federal Home Loan Bank 1.250 6/8/2018 5,033,965
5,000,000 Federal Farm Credit Bank 0.750 7/18/2018 4,989,470
7,000,000 Federal Home Loan Bank 1.125 9/14/2018 7,030,632
10,000,000 Federal Home Loan Mortgage Corp. 0.875 10/12/2018 9,995,400
2,000,000 Federal Home Loan Bank 1.500 3/8/2019 2,026,140
1,620,000 Federal Home Loan Bank 0.875 8/5/2019 1,614,012
5,000,000 Federal Home Loan Bank 1.000 9/26/2019 4,995,620
2,000,000 Federal Home Loan Mortgage Corp. 1.250 10/2/2019 2,014,120
500,000 RefCorp Strip None 10/15/2019 483,566
350,000 RefCorp Strip None 10/15/2020 331,956
Total U.S. Government Agency and Agency-Guaranteed Obligations 50,585,717
Asset/Mortgage-Backed Securities: 4.0%
10,489 Federal Govt. Loan Mortgage Corp. 6.000 7/1/2017 10,619
6,508 Federal Govt. Loan Mortgage Corp. 5.500 9/1/2017 6,581
20,490 Federal Govt. Loan Mortgage Corp. 5.500 11/1/2017 20,804
74,647 Federal Govt. Loan Mortgage Corp. 6.000 1/1/2018 75,536
27,470 Federal Govt. Loan Mortgage Corp. 5.500 2/1/2018 27,890
62,280 Federal Govt. Loan Mortgage Corp. 5.500 2/1/2018 63,653
14,058 Federal Govt. Loan Mortgage Corp. 5.000 6/1/2018 14,441
58,330 Federal Govt. Loan Mortgage Corp. 5.500 11/1/2018 60,237
9,251 Federal Govt. Loan Mortgage Corp. 5.500 12/1/2018 9,445
(Continued)
par value Description
Illinois Metropolitan Investment FundSchedule of Investments (Continued)
IMET 1-3 Year Series
September 30, 2016
Units/
-43-

Fair
Rate Maturity value
Asset/Mortgage-Backed Securities (Continued)
$ 17,583 Government National Mortgage Assoc. 4.500 % 12/15/2018 $ 17,935
44,674 Federal Govt. Loan Mortgage Corp. 5.000 1/1/2019 45,995
40,938 Federal Home Loan Mortgage Corp. 4.500 1/1/2019 41,944
161,546 Federal Govt. Loan Mortgage Corp. 5.000 5/1/2019 166,935
21,043 Federal Govt. Loan Mortgage Corp. 5.500 12/1/2019 21,778
32,802 Federal Govt. Loan Mortgage Corp. 5.000 2/1/2020 33,819
36,281 Federal Govt. Loan Mortgage Corp. 5.500 4/1/2020 37,851
52,191 Federal Govt. Loan Mortgage Corp. 6.000 6/1/2020 54,521
58,953 Federal Govt. Loan Mortgage Corp. 5.000 8/1/2020 60,633
167,764 Federal Govt. Loan Mortgage Corp. 5.000 11/1/2020 175,623
60,472 Federal Govt. Loan Mortgage Corp. 5.000 12/1/2020 63,606
54,451 Federal Govt. Loan Mortgage Corp. 5.500 12/1/2020 57,579
84,623 Federal Govt. Loan Mortgage Corp. 5.500 1/1/2021 90,141
69,508 Federal Govt. Loan Mortgage Corp. 5.000 3/1/2021 73,909
43,879 Federal Govt. Loan Mortgage Corp. 5.000 6/1/2021 46,683
18,175 Federal Govt. Loan Mortgage Corp. 7.000 9/1/2021 19,406
62,332 Federal Govt. Loan Mortgage Corp. 5.500 10/1/2021 66,605
86,187 Federal Govt. Loan Mortgage Corp. 5.500 12/1/2021 92,507
87,443 Federal Govt. Loan Mortgage Corp. 5.500 12/1/2021 93,162
165,709 Federal Govt. Loan Mortgage Corp. 5.000 4/1/2022 177,721
81,012 Federal Govt. Loan Mortgage Corp. 5.500 6/1/2022 87,436
20,062 Federal Govt. Loan Mortgage Corp. 6.000 6/1/2022 21,810
78,592 Federal Govt. Loan Mortgage Corp. 5.500 10/1/2022 84,827
166,413 Federal Govt. Loan Mortgage Corp. 5.500 10/1/2022 179,736
120,921 Federal Govt. Loan Mortgage Corp. 5.500 2/1/2023 129,332
116,380 Federal Home Loan Mortgage Corp. 5.500 2/1/2023 123,818
131,332 Federal Govt. Loan Mortgage Corp. 6.500 3/1/2023 142,938
58,412 Federal Govt. Loan Mortgage Corp. 5.000 7/1/2023 62,608
253,305 Federal Govt. Loan Mortgage Corp. 5.500 10/1/2023 273,637
85,946 Federal Govt. Loan Mortgage Corp. 6.000 11/1/2023 93,792
45,737 Federal Govt. Loan Mortgage Corp. 4.500 6/1/2024 49,229
32,785 Federal Govt. Loan Mortgage Corp. 4.500 7/1/2024 34,992
145,861 Federal Govt. Loan Mortgage Corp. 4.500 9/1/2024 157,081
75,833 Federal Govt. Loan Mortgage Corp. 5.500 12/1/2024 81,237
(Continued)
Illinois Metropolitan Investment FundSchedule of Investments (Continued)
IMET 1-3 Year Series
September 30, 2016
Units/
par value Description
-44-

Fair
Rate Maturity value
Asset/Mortgage-Backed Securities (Continued)
$ 10,180 Government National Mortgage Assoc. 9.500 % 12/15/2024 $ 11,457
72,024 Federal Govt. Loan Mortgage Corp. 4.500 03/01/2025 77,323
155,692 Federal Govt. Loan Mortgage Corp. 4.500 04/01/2025 166,281
87,949 Federal Govt. Loan Mortgage Corp. 4.500 05/01/2025 94,174
12,059 Government National Mortgage Assoc. 8.500 05/20/2025 13,650
113,316 Federal Govt. Loan Mortgage Corp. 4.500 08/01/2025 120,911
423,255 Federal Govt. Loan Mortgage Corp. 4.000 06/01/2026 449,806
2,853 Government National Mortgage Assoc. 8.000 11/20/2026 3,488
258,206 Federal Govt. Loan Mortgage Corp. 6.000 09/01/2027 294,538
132,959 Federal Govt. Loan Mortgage Corp. 6.000 11/01/2027 151,667
14,617 Government National Mortgage Assoc. 8.000 11/20/2027 17,181
123,540 Federal Govt. Loan Mortgage Corp. 5.500 12/01/2027 138,544
56,307 Federal Home Loan Mortgage Corp. Float 12/01/2027 58,868
635,686 Federal Govt. Loan Mortgage Corp. 2.000 03/01/2028 647,135
351 Government National Mortgage Assoc. 8.000 03/20/2028 352
1,230 Government National Mortgage Assoc. 8.000 08/20/2028 1,297
1,653 Government National Mortgage Assoc. 8.000 09/20/2028 1,731
81,257 Federal Govt. Loan Mortgage Corp. 6.500 01/01/2029 94,058
210,788 Federal Govt. Loan Mortgage Corp. 5.500 02/01/2029 236,388
27,173 Federal Home Loan Mortgage Corp. Float 01/01/2030 28,446
493,084 Federal Home Loan Mortgage Corp. 4.000 08/01/2031 533,572
200,355 Federal Home Loan Mortgage Corp. Float 12/01/2034 214,173
197,330 Federal Home Loan Mortgage Corp. Float 03/01/2035 206,567
48,459 Federal Home Loan Mortgage Corp. Float 01/01/2036 51,649
101,697 Federal Home Loan Mortgage Corp. Float 05/01/2037 107,478
78,831 Federal Home Loan Mortgage Corp. Float 07/01/2037 82,631
102,210 Government National Mortgage Assoc. 6.000 09/20/2038 117,059
Total Asset/Mortgage-Backed Securities 7,170,459
Total investments, other than short-term $ 178,979,273
Short-Term Investment:
2,105,424 Fidelity Inst. Money Market Fund 0.010 None $ 2,105,424
Float - Security has a floating coupon rate
(Concluded)
September 30, 2016
par value Description
Illinois Metropolitan Investment FundSchedule of Investments (Continued)
IMET 1-3 Year Series
Units/
-45-
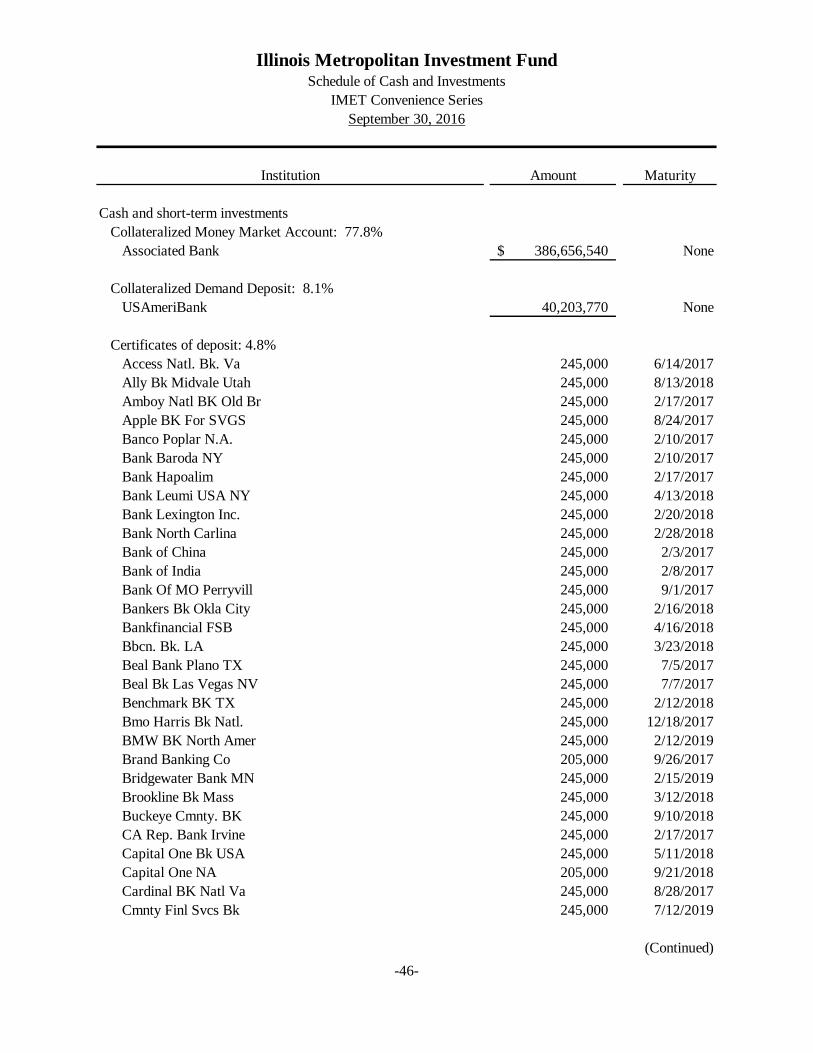
Institution Amount Maturity
Cash and short-term investments
Collateralized Money Market Account: 77.8%
Associated Bank 386,656,540$ None
Collateralized Demand Deposit: 8.1%
USAmeriBank 40,203,770 None
Certificates of deposit: 4.8%
Access Natl. Bk. Va 245,000 6/14/2017
Ally Bk Midvale Utah 245,000 8/13/2018
Amboy Natl BK Old Br 245,000 2/17/2017
Apple BK For SVGS 245,000 8/24/2017
Banco Poplar N.A. 245,000 2/10/2017
Bank Baroda NY 245,000 2/10/2017
Bank Hapoalim 245,000 2/17/2017
Bank Leumi USA NY 245,000 4/13/2018
Bank Lexington Inc. 245,000 2/20/2018
Bank North Carlina 245,000 2/28/2018
Bank of China 245,000 2/3/2017
Bank of India 245,000 2/8/2017
Bank Of MO Perryvill 245,000 9/1/2017
Bankers Bk Okla City 245,000 2/16/2018
Bankfinancial FSB 245,000 4/16/2018
Bbcn. Bk. LA 245,000 3/23/2018
Beal Bank Plano TX 245,000 7/5/2017
Beal Bk Las Vegas NV 245,000 7/7/2017
Benchmark BK TX 245,000 2/12/2018
Bmo Harris Bk Natl. 245,000 12/18/2017
BMW BK North Amer 245,000 2/12/2019
Brand Banking Co 205,000 9/26/2017
Bridgewater Bank MN 245,000 2/15/2019
Brookline Bk Mass 245,000 3/12/2018
Buckeye Cmnty. BK 245,000 9/10/2018
CA Rep. Bank Irvine 245,000 2/17/2017
Capital One Bk USA 245,000 5/11/2018
Capital One NA 205,000 9/21/2018
Cardinal BK Natl Va 245,000 8/28/2017
Cmnty Finl Svcs Bk 245,000 7/12/2019
(Continued)
Illinois Metropolitan Investment FundSchedule of Cash and Investments
IMET Convenience Series
September 30, 2016
-46-
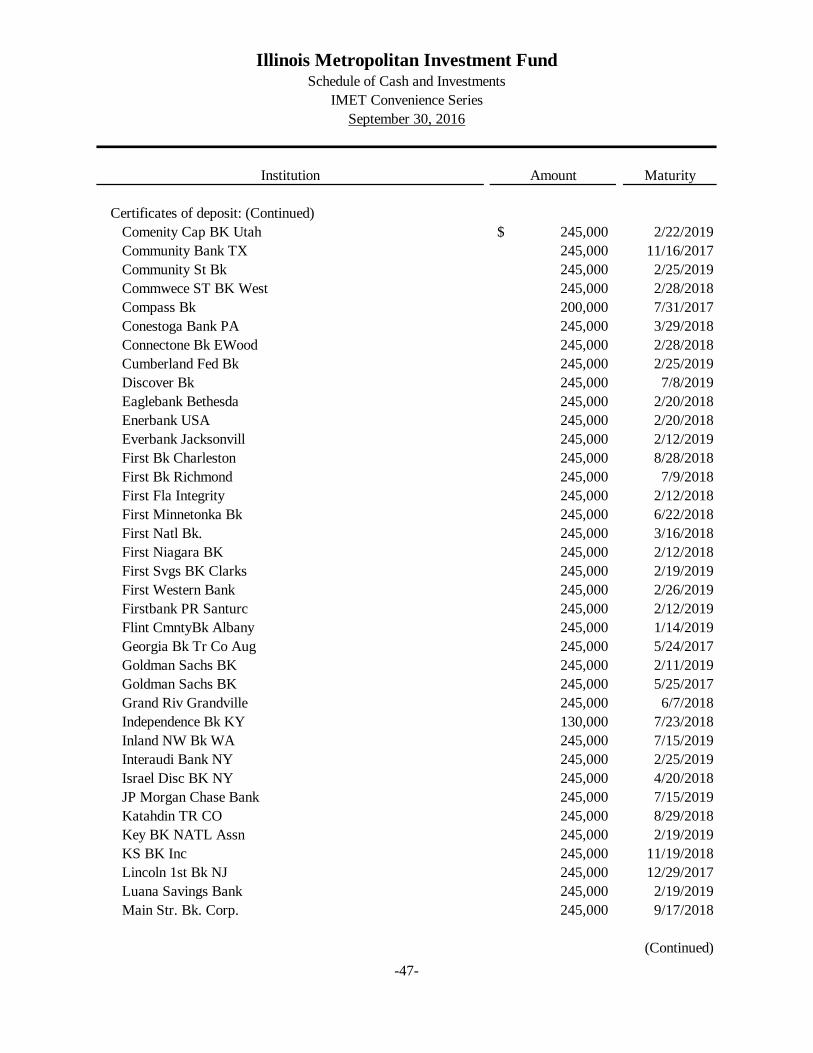
Institution Amount Maturity
Illinois Metropolitan Investment FundSchedule of Cash and Investments
IMET Convenience Series
September 30, 2016
Certificates of deposit: (Continued)
Comenity Cap BK Utah 245,000$ 2/22/2019
Community Bank TX 245,000 11/16/2017
Community St Bk 245,000 2/25/2019
Commwece ST BK West 245,000 2/28/2018
Compass Bk 200,000 7/31/2017
Conestoga Bank PA 245,000 3/29/2018
Connectone Bk EWood 245,000 2/28/2018
Cumberland Fed Bk 245,000 2/25/2019
Discover Bk 245,000 7/8/2019
Eaglebank Bethesda 245,000 2/20/2018
Enerbank USA 245,000 2/20/2018
Everbank Jacksonvill 245,000 2/12/2019
First Bk Charleston 245,000 8/28/2018
First Bk Richmond 245,000 7/9/2018
First Fla Integrity 245,000 2/12/2018
First Minnetonka Bk 245,000 6/22/2018
First Natl Bk. 245,000 3/16/2018
First Niagara BK 245,000 2/12/2018
First Svgs BK Clarks 245,000 2/19/2019
First Western Bank 245,000 2/26/2019
Firstbank PR Santurc 245,000 2/12/2019
Flint CmntyBk Albany 245,000 1/14/2019
Georgia Bk Tr Co Aug 245,000 5/24/2017
Goldman Sachs BK 245,000 2/11/2019
Goldman Sachs BK 245,000 5/25/2017
Grand Riv Grandville 245,000 6/7/2018
Independence Bk KY 130,000 7/23/2018
Inland NW Bk WA 245,000 7/15/2019
Interaudi Bank NY 245,000 2/25/2019
Israel Disc BK NY 245,000 4/20/2018
JP Morgan Chase Bank 245,000 7/15/2019
Katahdin TR CO 245,000 8/29/2018
Key BK NATL Assn 245,000 2/19/2019
KS BK Inc 245,000 11/19/2018
Lincoln 1st Bk NJ 245,000 12/29/2017
Luana Savings Bank 245,000 2/19/2019
Main Str. Bk. Corp. 245,000 9/17/2018
(Continued)
-47-
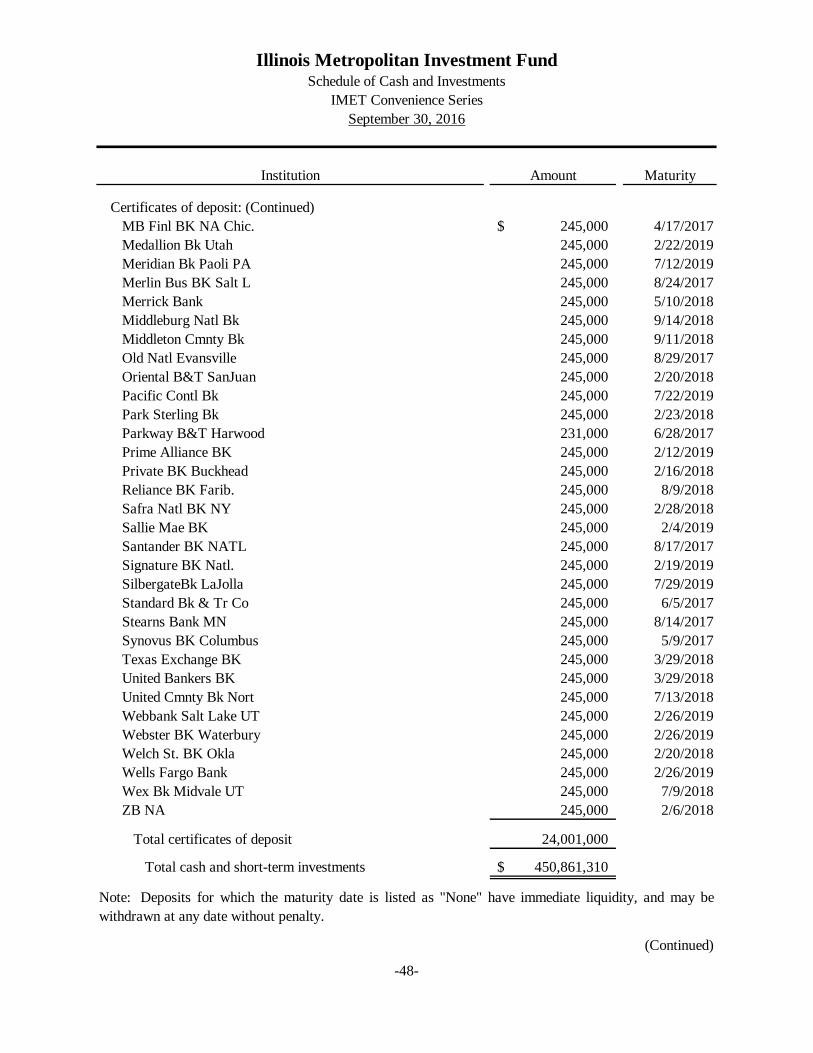
Institution Amount Maturity
Illinois Metropolitan Investment FundSchedule of Cash and Investments
IMET Convenience Series
September 30, 2016
Certificates of deposit: (Continued)
MB Finl BK NA Chic. 245,000$ 4/17/2017
Medallion Bk Utah 245,000 2/22/2019
Meridian Bk Paoli PA 245,000 7/12/2019
Merlin Bus BK Salt L 245,000 8/24/2017
Merrick Bank 245,000 5/10/2018
Middleburg Natl Bk 245,000 9/14/2018
Middleton Cmnty Bk 245,000 9/11/2018
Old Natl Evansville 245,000 8/29/2017
Oriental B&T SanJuan 245,000 2/20/2018
Pacific Contl Bk 245,000 7/22/2019
Park Sterling Bk 245,000 2/23/2018
Parkway B&T Harwood 231,000 6/28/2017
Prime Alliance BK 245,000 2/12/2019
Private BK Buckhead 245,000 2/16/2018
Reliance BK Farib. 245,000 8/9/2018
Safra Natl BK NY 245,000 2/28/2018
Sallie Mae BK 245,000 2/4/2019
Santander BK NATL 245,000 8/17/2017
Signature BK Natl. 245,000 2/19/2019
SilbergateBk LaJolla 245,000 7/29/2019
Standard Bk & Tr Co 245,000 6/5/2017
Stearns Bank MN 245,000 8/14/2017
Synovus BK Columbus 245,000 5/9/2017
Texas Exchange BK 245,000 3/29/2018
United Bankers BK 245,000 3/29/2018
United Cmnty Bk Nort 245,000 7/13/2018
Webbank Salt Lake UT 245,000 2/26/2019
Webster BK Waterbury 245,000 2/26/2019
Welch St. BK Okla 245,000 2/20/2018
Wells Fargo Bank 245,000 2/26/2019
Wex Bk Midvale UT 245,000 7/9/2018
ZB NA 245,000 2/6/2018
Total certificates of deposit 24,001,000
Total cash and short-term investments 450,861,310$
(Continued)
Note: Deposits for which the maturity date is listed as "None" have immediate liquidity, and may be
withdrawn at any date without penalty.
-48-
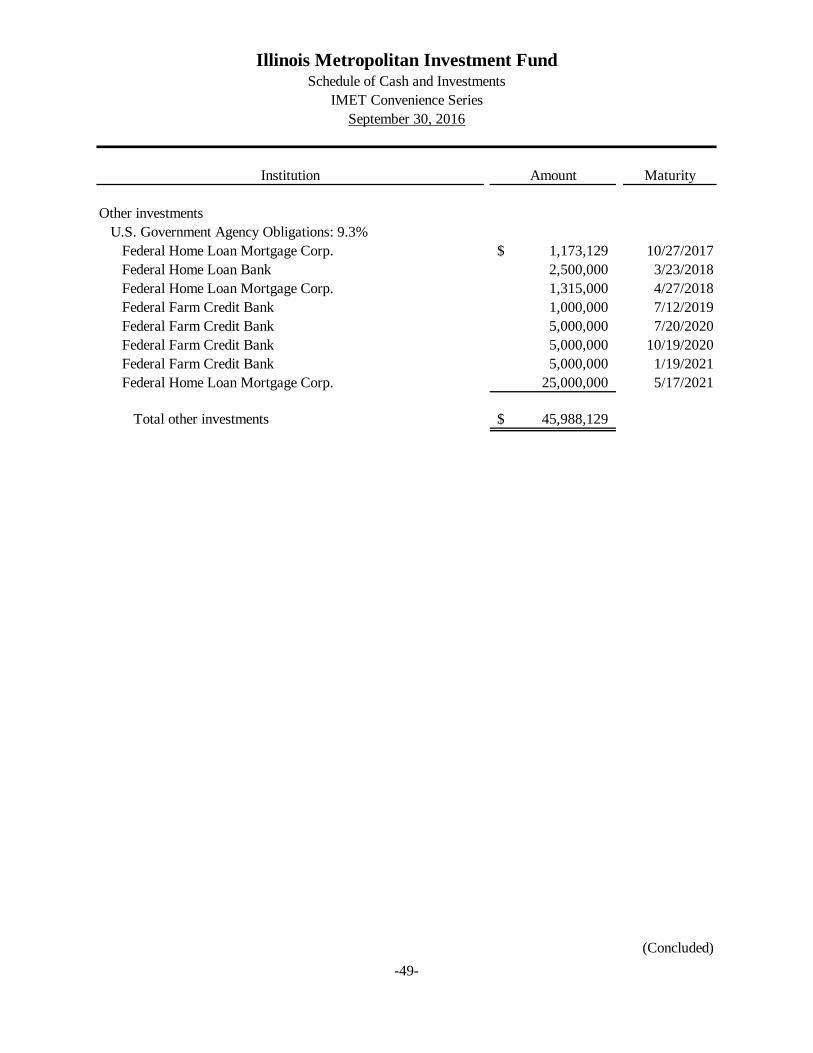
Institution Amount Maturity
Illinois Metropolitan Investment FundSchedule of Cash and Investments
IMET Convenience Series
September 30, 2016
Other investments
U.S. Government Agency Obligations: 9.3%
Federal Home Loan Mortgage Corp. 1,173,129$ 10/27/2017
Federal Home Loan Bank 2,500,000 3/23/2018
Federal Home Loan Mortgage Corp. 1,315,000 4/27/2018
Federal Farm Credit Bank 1,000,000 7/12/2019
Federal Farm Credit Bank 5,000,000 7/20/2020
Federal Farm Credit Bank 5,000,000 10/19/2020
Federal Farm Credit Bank 5,000,000 1/19/2021
Federal Home Loan Mortgage Corp. 25,000,000 5/17/2021
Total other investments 45,988,129$
(Concluded)
-49-
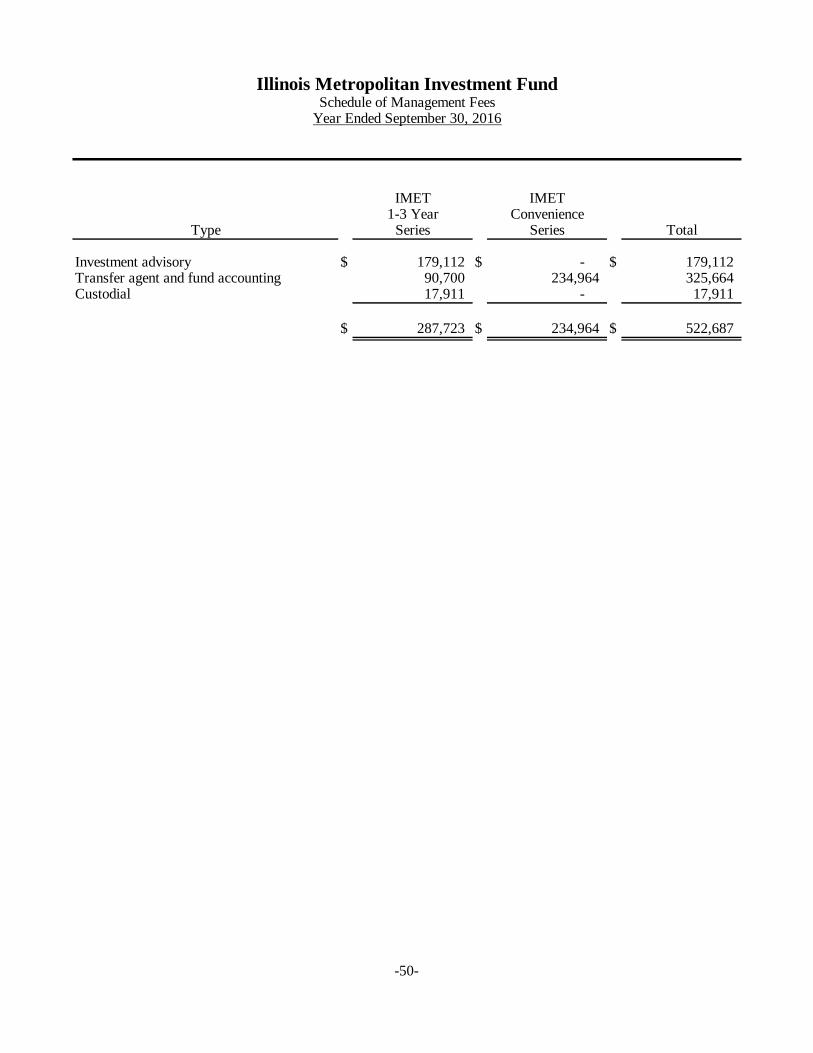
IMET IMET1-3 Year Convenience
Type Series Series Total
Investment advisory $ 179,112 $ - $ 179,112 Transfer agent and fund accounting 90,700 234,964 325,664 Custodial 17,911 - 17,911
$ 287,723 $ 234,964 $ 522,687
Illinois Metropolitan Investment FundSchedule of Management Fees
Year Ended September 30, 2016
-50-
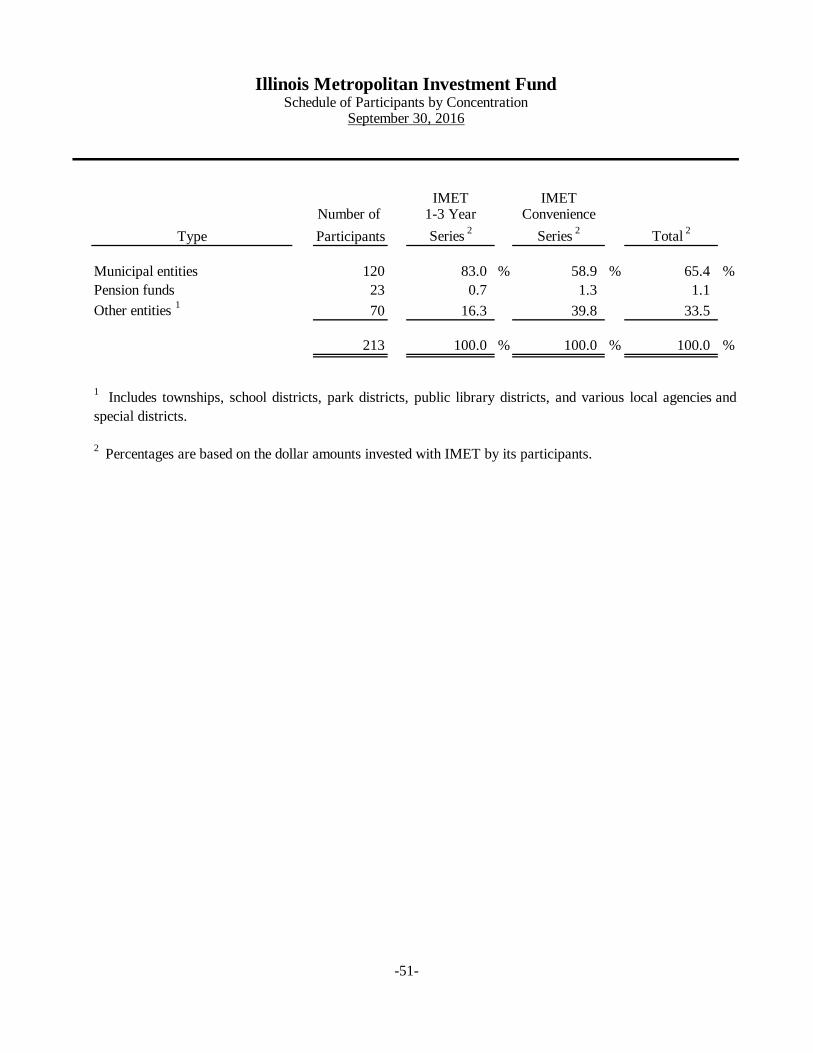
IMET IMETNumber of 1-3 Year Convenience
Type Participants Series 2
Series 2
Total 2
Municipal entities 120 83.0 % 58.9 % 65.4 %
Pension funds 23 0.7 1.3 1.1
Other entities 1
70 16.3 39.8 33.5
213 100.0 % 100.0 % 100.0 %
Illinois Metropolitan Investment FundSchedule of Participants by Concentration
September 30, 2016
1Includes townships, school districts, park districts, public library districts, and various local agencies and
special districts.
2 Percentages are based on the dollar amounts invested with IMET by its participants.
-51-
1.0 Policy
2.0 Funds
3.0 Prudence
4.0 Objective
A.
Illinois Metropolitan Investment FundInvestment Policy - IMET 1-3 Year Series
September 30, 2016
The Illinois Metropolitan Investment Fund (“IMET” or “Fund” ) is an actively managed investment fund for
Illinois local governments. The IMET 1-3 Year Fund has a fluctuating net asset value and an average maturity of
one-to-three years. Designed for public funds that may be invested for more than one year, IMET invests
exclusively in government-backed securities (Treasuries, agencies, and municipals) that are permissible under the
IL Public Funds Investment Act.
It is the policy of IMET to invest public funds of Illinois governments in a manner which seeks to provide the best
return while pursuing the preservation of capital. IMET is designed as an investment vehicle for funds not
required to be spent immediately and available for investment in securities with maturities and returns generally
greater than those for money market instruments. IMET will conform to Illinois state statutes governing the
investment of public funds.
Monies invested in this Fund will be those of participating Illinois governments whose treasurers become members
of the Fund. Any funds that an Illinois government can invest in under Illinois state statutes are eligible for
investment in IMET. This is an intermediate investment fund, however, and short-term cash monies which are
needed for immediate liquidity demands will not be encouraged to be invested in this Fund.
The standard of prudence to be used for all investment activities shall be the following “prudent person”
standards, as stated below, and shall be applied while conducting all investment transactions.
"Investments shall be made with judgment and care, under circumstances then prevailing, which persons of
prudence, discretion, and intelligence exercise in the management of their own affairs, not for speculation, but for
investment, considering the probable preservation of their capital as well as the probable income to be derived."
This actively managed portfolio will be invested in certain fixed income securities and cash equivalents. In
summary, the investment objectives of IMET are:
Preservation of Principal: Preservation of principal is the foremost objective of IMET. Investments shall
be undertaken in a manner that seeks to ensure the preservation of capital in the overall portfolio.
-52-
4.0 Objective (Continued)
B.
C.
5.0 Delegation of Authority
A.
B.
C.
6.0 Ethics and Conflicts of Interest
The Board of Trustees of IMET (the “Board” ) seeks to employ an investment advisor who possesses superior
capabilities in the management of assets of the Councils of Governments’ governmental bodies. The Board
further requires the investment advisor selected and working on its behalf to meet the following set of conditions.
To take, in its discretion, actions which in its best professional judgment are in the best interests of IMET,
in accordance with this Investment Policy and the Investment Circular distributed by the Fund, to meet
IMET investment objectives. Such actions include but are not limited to (A) the allocation of funds among
alternative types of investments; (B) specific investment opportunities regarding the acquisition, retention,
or disposition of investments; and (C) the recommendation of the addition, deletion, or modification of
authorized investments.
To execute all investment transactions on behalf of the Fund at the best net price, utilizing such brokers and
dealers as they deem appropriate to obtain the best execution capabilities and/or valuable information with
respect to the economy and the affairs of corporations at the lowest cost to the Fund.
Illinois Metropolitan Investment Fund
Liquidity: IMET will seek to remain sufficiently liquid to allow for withdrawals by Fund members with
five business days' notice of that withdrawal to the Fund, and will otherwise remain sufficiently liquid in
accordance with prudent fund management.
Investment Policy - IMET 1-3 Year Series (Continued)
September 30, 2016
Additional responsibilities as detailed in each investment advisor’s agreement with the Board.
Officers and employees of the Fund involved in the investment process shall refrain from personal business
activity that could conflict with proper execution of the investment program, or which could impair their ability to
make impartial investment decisions. Employees and investment officials shall disclose to the IMET chairperson
any material financial interests in financial institutions that conduct business with IMET, and they shall further
disclose any large personal financial/investment positions that could be related to the performance of IMET,
particularly with regard to the time of purchases and sales.
Return on Investment: IMET’s assets will be invested with the objective of obtaining an appropriate
market rate of return in relation to the prevailing monetary environment. See also “Performance Standards”
herein.
-53-
7.0 Authorized Financial Dealers and Institutions
8.0 Authorized and Suitable Investments
(i)
The advisor will make investments only in those investments specifically authorized in the Public Investment Act
of the State of Illinois (30 ILCS 235/1) (the “Investment Act ”). The administrator shall perform its duties in
conformance with the Declaration of Trust, By-Laws, and Investment Circular of the Fund. The distributor shall
be competent and fully qualified under federal and state securities laws and the rules and regulations of the
Comptroller of the Currency or the National Association of Securities Dealers, as applicable, to engage in
marketing and sales efforts.
Illinois Metropolitan Investment FundInvestment Policy - IMET 1-3 Year Series (Continued)
All fixed income securities (other than obligations of the U.S. or its agencies or obligations of any county,
township, city, village, incorporated town, municipal corporation, or school district, of the State of Illinois
or any other state, or of any political subdivision or agency of the State of Illinois or of any other state) at
the time of purchase shall be rated at the highest rating classification established by at least two standard
rating services (without regard to any refinement or gradation of rating category by numerical modifier or
otherwise). However, issues that are reclassified after purchase so that they are no longer at the highest
classifications established by at least two standard rating services may be sold by the advisor to the Fund
after the date of the security’s reclassification or held to maturity, in either case based on the investment
advisor’s discretion.
September 30, 2016
All investments shall be made in compliance with the Investment Act, including, without limitation, the definition
of “agency” contained therein. In seeking to achieve its investment objective, the Fund intends to invest under
normal market conditions at least fifty percent (50%) in (i) obligations issued or secured by the U.S. Government
and/or its agencies and/or (ii) money market mutual funds that are permitted investments under the Investment
Act, and/or (iii) interest bearing bonds of any county, township, city, village, incorporated town, municipal
corporation, or school district, of the State of Illinois, or any other state, or of any political subdivision or agency
of the State of Illinois or of any other state, whether the interest earned thereon is taxable or tax-exempt under
federal law. In extraordinary circumstances, such as when the investment advisor believes that market conditions
indicate that the Fund should adopt a temporary defensive position, the Fund may invest up to one hundred
percent (100%) in cash and/or such money market mutual funds.
The Fund portfolio is restricted to a maximum dollar weighted-average maturity of five years or less, under
normal conditions. The net asset value will fluctuate on a daily basis according to the change in market value of
its underlying portfolio obligations.
The following are additional investment restrictions:
-54-
8.0 Authorized and Suitable Investments (Continued)
(ii)
(iii)
(iv)
Mortgage pass-through securities must be issued by an agency of the United States government. There are
three major types of such agency pass-throughs, guaranteed by three organizations: Government National
Mortgage Association (“Ginnie Mae” ), Federal Home Loan Mortgage Corporation (“Freddie Mac” ), and
Federal National Mortgage Association (“Fannie Mae” ). Pass-through securities or collateralized
mortgage obligations of Fannie Mae are not permitted investments under Illinois law. In addition, privately
structured and issued mortgage pass-through securities or collateralized mortgage obligations are not
permitted investments.
Investment Policy - IMET 1-3 Year Series (Continued)
September 30, 2016
Illinois Metropolitan Investment Fund
All investments are required to be made in compliance with the Investment Act, including, without
limitation, the definition of “agency” contained therein.
All interest bearing bonds of any county, township, city, village, incorporated town, municipal corporation,
or school district, of the State of Illinois, or any other state, or any political subdivision or agency of the
State of Illinois or any other state, whether the interest earned thereon is taxable or tax-exempt under
federal law at the time of purchase shall be rated within the four highest general classifications (i.e.
obligations rated A or higher by Standard & Poor’s or A or higher by Moody’s, without regard to any
refinement or gradation of rating category by numerical modifier or otherwise) established by a rating
service of nationally recognized expertise in rating bonds of states and their political subdivisions.
-55-

8.0 Authorized and Suitable Investments (Continued)
1) Reverse repurchase agreements.
2)
3) Futures and options.
4)
5)
6)
7)
8)
9)
10)
11)
12)
13)
14)
15)
Illinois Metropolitan Investment FundInvestment Policy - IMET 1-3 Year Series (Continued)
The following transactions are prohibited in the portfolio managed by the investment advisor.
Common or preferred stocks.
September 30, 2016
Private or direct placements.
Commodities.
Direct ownership of real estate or mortgages.
Non-U.S. dollar-denominated securities.
Margin purchases or intentional use of leverage.
Structured notes—however, the Portfolio may invest in federal government agency securities whose
coupon rates are scheduled to “step up” (i.e. increase) one or more times before they mature.
Lending of Fund securities.
Collateralized mortgage obligations.
Investments not allowed under the Investment Act.
Stripped mortgage-backed securities (i.e. , interest-only (IO) and principal-only (PO) securities).
Convertible notes or bonds.
Purchase, participation, or other direct interest in gas, oil, or other mineral exploration or development
programs.
-56-
8.0 Authorized and Suitable Investments (Continued)
9.0 Safekeeping and Custody
10.0 Diversification
A)
B)
C)
11.0
Fixed income securities in the Fund will have the following characteristics:
United States Treasury, agency, and agency mortgage pass-through securities may be used without
limitation. Under normal market conditions, such obligations, along with money market mutual funds that
are permitted investments under the Investment Act, will constitute at least 50% of the portfolio.
Commercial paper investment, pursuant to Illinois law, must mature within 180 days from the date of
purchase and cannot exceed 10% of the corporation’s total commercial paper. The Fund will have no more
than one-third of its monies invested in commercial paper.
Illinois Metropolitan Investment FundInvestment Policy - IMET 1-3 Year Series (Continued)
September 30, 2016
Maturities
The advisor shall indemnify and make whole the Fund and its shareholders for any losses incurred by the Fund as
a result of the advisor’s own or any subadvisor’s gross negligence or its failure to comply with the provisions of
the Investment Act as those provisions are communicated to the investment advisor in writing by IMET or by
IMET’s legal counsel.
Securities purchased for IMET, as well as collateral for repurchase agreements, shall be delivered against
payment and held in a custodial safekeeping account with a broker or bank acting as custodian. The custodian
will be designated by the Board and all transactions will be evidenced by safekeeping receipts or confirmations.
At no time may the portfolio own more than 5% of the outstanding amount of any one fixed income issue
(other than securities of the United States Government or its agencies) or have more than 7% of its total
assets invested in the securities (including cash equivalents) of any permissible fixed income issuer (other
than securities of the United States government or its agencies) without prior notification and approval of
the Board.
Portfolio duration is to be maintained within 25% of that of the Barclay's Capital 1-3 Year Government Bond
Index under normal conditions; provided, however, that the portfolio’s dollar weighted-average maturity will not
exceed five years under normal conditions. Individual securities may have remaining maturities of greater than
five years, but in any event not greater than ten years from the date of the Fund’s purchase thereof. The
remaining life of any agency mortgage pass-through security will be determined based on the weighted-average
life of the security.
-57-
12.0 Internal Control
13.0 Performance Standards
14.0 Reporting
A)
B)
C)
D)
E)
F)
G)
The advisor shall establish a system of internal controls, which shall be documented in writing. The controls shall
be annually reviewed by their auditor and shall be designed to prevent losses of public funds arising from failure
to comply with the provisions of the Investment Act, fraud, employee error, misrepresentation by third parties, or
imprudent actions by employees and officers of the firm. The advisor shall at all times have in place a fidelity
bond or bonds covering the actions of its employees and officers relating to fraud, theft, dishonesty, and other
willful acts which may result in the loss of Fund assets. Such bond or bonds shall be maintained in amounts not
less than $5,000,000 per occurrence and $10,000,000 in the annual aggregate, covering its duties. The advisor
will also maintain a fidelity bond against employee theft, dishonesty, and related risk, and cover its duties in an
amount not less than $10,000,000 in the annual aggregate.
Significant changes in the portfolio under their management during the quarter.
Economic and investment outlook for the near and long term.
Monthly purchase and sale transactions.
Any change in key personnel.
IMET’s investment strategy is targeted active management. The performance objective for this portfolio is to
meet or exceed the Lehman Brothers 1-3 Year Government Bond Index (the benchmark) prior to payment of Fund
expenses.
The advisor shall report to the Board at least quarterly on:
Any deviation from the guidelines herein established.
Performance as compared to the benchmark.
Asset allocation and duration as compared to the benchmark.
Illinois Metropolitan Investment FundInvestment Policy - IMET 1-3 Year Series (Continued)
September 30, 2016
-58-

15.0 Investment Policy Adoption
(Concluded)
Last amended June 19, 2013
IMET’s investment policy shall be adopted by resolution of the Board. The policy shall be reviewed annually by
the Board and any modifications made thereto must be approved by the Board.
Illinois Metropolitan Investment FundInvestment Policy - IMET 1-3 Year Series (Continued)
September 30, 2016
-59-
1.0 Governing Authority
2.0 Funds
3.0 Prudence
4.0 Objective
A.
Illinois Metropolitan Investment FundInvestment Policy - IMET Convenience Series
September 30, 2016
It is the policy of IMET to invest public funds of Illinois governments in a manner which seeks to provide the best
return while pursuing the preservation of capital. The Convenience Series will conform to Illinois state statutes
governing the investment of public funds.
The Illinois Metropolitan Investment Fund (“IMET” or “Fund” ) is an actively managed investment fund for
Illinois local governments. IMET’s Convenience Series (“Convenience Series”) is a short-term vehicle for use
exclusively by members of IMET. This policy applies to the investment of Convenience Series funds. The
Convenience Series is designed as an investment vehicle for: a) near-term investment of funds intended for
eventual placement into the IMET 1-3 Year Series, b) the investment of bond proceeds, and c) any purpose
deemed necessary and beneficial by Fund participants.
Monies invested in this Convenience Series will be those of participating Illinois governments whose treasurers are
members of the IMET. Any funds that an Illinois government can invest in under Illinois state statutes are eligible
for investment in the Convenience Series.
The standard of prudence to be used for all investment activities shall be the following “prudent person”
standards, as stated below, and shall be applied while conducting all investment transactions.
"Investments shall be made with judgment and care, under circumstances then prevailing, which persons of
prudence, discretion, and intelligence exercise in the management of their own affairs, not for speculation, but for
investment, considering the probable preservation of their capital as well as the probable income to be derived."
This portfolio will be invested in certain fixed income securities and cash equivalents. In summary, the investment
objectives of the Convenience Series are:
Preservation of Principal: Preservation of principal is the foremost objective of the Convenience Series.
Investments shall be undertaken in a manner that seeks to ensure the preservation of capital in the overall
portfolio.
-60-
4.0 Objective (Continued)
B.
C.
5.0 Delegation of Authority
A.
B.
C.
September 30, 2016
The Board of Trustees of IMET and of the Convenience Series (the “Board” ) seeks to employ financial
institutions possessing established capabilities in the management of assets of the Councils of Governments’
governmental bodies. The Board further requires the financial institution(s) selected and working on its behalf to
meet the following set of conditions.
To take, in its discretion, to the extent allowed by the financial institution’s agreement with IMET, actions
which in its best professional judgment are in the best interests of the Convenience Series, in accordance
with this Investment Policy distributed by IMET, to meet Convenience Series investment objectives. Such
actions include but are not limited to (A) the allocation of funds among alternative types of investments; (B)
specific investment opportunities regarding the acquisition, retention, or disposition of investments; and (C)
the recommendation of the addition, deletion, or modification of authorized investments.
To execute all investment transactions on behalf of the Convenience Series at the best net price, utilizing
such brokers and dealers as deemed appropriate to obtain the best execution capabilities and/or valuable
information with respect to the economy and the affairs of corporations at the lowest cost to the
Convenience Series.
Additional responsibilities as detailed in each financial institution’s agreement with the Board.
Liquidity: The Convenience Series will seek to remain sufficiently liquid to accommodate Convenience
Series members and will otherwise remain sufficiently liquid in accordance with prudent fund management.
Return on Investment: The Convenience Series’ assets will be invested with the objective of obtaining an
appropriate market rate of return in relation to the prevailing monetary environment. See also
“Performance Standards” herein.
Illinois Metropolitan Investment FundInvestment Policy - IMET Convenience Series (Continued)
-61-
6.0 Ethics and Conflicts of Interest
7.0 Authorized Financial Dealers and Institutions
8.0 Authorized and Suitable Investments
Officers and employees of the Convenience Series involved in the investment process shall refrain from personal
business activity that could conflict with proper execution of the investment program, or which could impair their
ability to make impartial investment decisions. Employees and investment officials shall disclose to the Board
chairperson any material financial interests in financial institutions that conduct business with IMET and the
Convenience Series, and they shall further disclose any large personal financial/investment positions that could be
related to the performance of the Convenience Series, particularly with regard to the time of purchases and sales.
The financial institution(s) will make investments only in those investments specifically authorized by the Public
Investment Act of the State of Illinois (30 ILCS 235/1) (the “Investment Act”) and by this Investment Policy.
The financial institution(s) shall perform its duties in conformance with the IMET Declaration of Trust, the IMET
By-Laws, and the Convenience Series Investment Policy. The distributor shall be competent and fully qualified
under federal and state securities laws and the rules and regulations of the Comptroller of the Currency or the
National Association of Securities Dealers, as applicable, to engage in marketing and sales efforts.
Illinois Metropolitan Investment FundInvestment Policy - IMET Convenience Series (Continued)
September 30, 2016
The investments permitted by this policy are those defined by the Investment Act, including, without limitation, the
definition of “agency” contained therein. In seeking to achieve its investment objective, the Convenience Series
intends to invest under normal market conditions at least fifty percent (50%) in (i) interest-bearing savings
accounts, interest-bearing certificates of deposit, or interest-bearing time deposits, or any other investments
constituting direct obligations of any bank as defined by the Illinois Banking Act, or (ii) money market mutual
funds that are permitted investments under the Investment Act, or (iii) securities now or hereafter issued that
constitute direct obligations of the U.S. Treasury which are guaranteed by the full faith and credit of the United
States of America as to principal and interest, or (iv) other similar obligations of the United States of America or
its agencies, or (v) interest bearing bonds of any county, township, city, village, incorporated town, municipal
corporation, or school district, of the State of Illinois, or any other state, or of any political subdivision or agency
of the State of Illinois or of any other state, whether the interest earned thereon is taxable or tax-exempt under
federal law. In circumstances when the investment advisor believes that market conditions indicate that the
Convenience Series should adopt a defensive position, the Convenience Series may invest up to one hundred
percent (100%) in bank obligations and/or such money market mutual funds.
-62-
8.0 Authorized and Suitable Investments (Continued)
(i)
(ii)
(iii)
(iv)
Mortgage pass-through securities must be issued by an agency of the United States government and must
have a liquid market with a readily determinable market value. There are three major types of such agency
pass-throughs, guaranteed by three organizations: Government National Mortgage Association (“Ginnie
Mae”), Federal Home Loan Mortgage Corporation (“Freddie Mac”), and Federal National Mortgage
Association (“Fannie Mae”). Pass-through securities or collateralized mortgage obligations of Fannie
Mae are not permitted investments under Illinois law. In addition, privately structured and issued mortgage
pass-through securities or collateralized mortgage obligations are not permitted investments.
All investments are required to be made in compliance with the Investment Act, including, without
limitation, the definition of “agency” contained therein.
All interest bearing bonds of any county, township, city, village, incorporated town, municipal corporation,
or school district, of the State of Illinois, or any other state, or of any political subdivision or agency of the
State of Illinois or of any other state, whether the interest earned thereon is taxable or tax-exempt under
federal law at the time of purchase shall be rated within the four highest general classifications (i.e.
obligations rated A or higher by Standard & Poor’s or A or higher by Moody’s, without regard to any
refinement or gradation of rating category by numerical modifier or otherwise) established by a rating
service of nationally recognized expertise in rating bonds of states and their political subdivisions.
The Convenience Series portfolio is restricted to a maximum dollar weighted-average maturity of one year or less,
under normal conditions. The Convenience Series will be managed so as to maintain a stable $1.00 share price,
although there is no guarantee that it will do so.
The following are additional investment restrictions:
All fixed income securities (other than obligations of the U.S., treasury, agencies, instrumentalities,
repurchase agreements, or obligations of any county, township, city, village, incorporated town, municipal
corporation, or school district, of the State of Illinois or any other state, or of any political subdivision or
agency of the State of Illinois or of any other state) at the time of purchase shall be rated at the highest
rating classification established by at least two standard rating services (without regard to any refinement or
gradation of rating category by numerical modifier or otherwise). However, issues that are reclassified after
purchase so that they are no longer at the highest classifications established by at least two standard rating
services may be sold by the financial institution(s) maintaining the Convenience Series after the date of the
security’s reclassification or held to maturity, in either case based on the financial institutions' discretion.
Illinois Metropolitan Investment FundInvestment Policy - IMET Convenience Series (Continued)
September 30, 2016
-63-
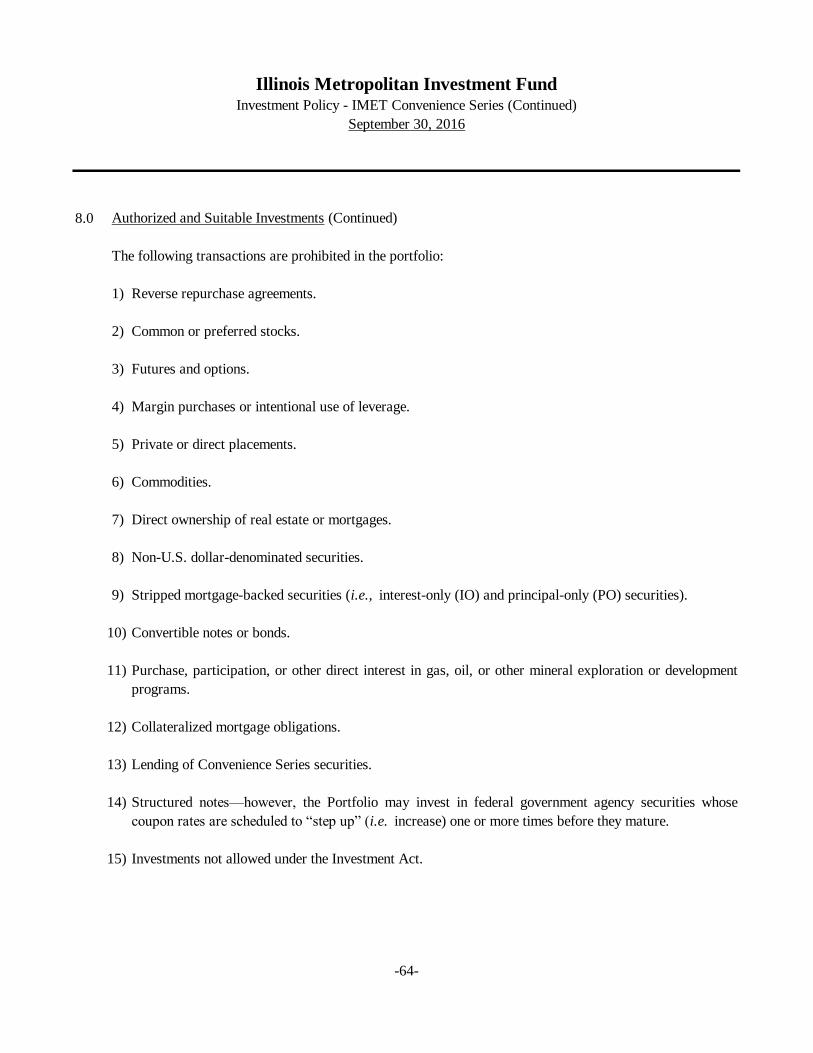
8.0 Authorized and Suitable Investments (Continued)
1) Reverse repurchase agreements.
2)
3) Futures and options.
4)
5)
6)
7)
8)
9)
10)
11)
12)
13)
14)
15)
Structured notes—however, the Portfolio may invest in federal government agency securities whose
coupon rates are scheduled to “step up” (i.e. increase) one or more times before they mature.
Investments not allowed under the Investment Act.
Stripped mortgage-backed securities (i.e., interest-only (IO) and principal-only (PO) securities).
Convertible notes or bonds.
Purchase, participation, or other direct interest in gas, oil, or other mineral exploration or development
programs.
Collateralized mortgage obligations.
Lending of Convenience Series securities.
Private or direct placements.
Commodities.
Direct ownership of real estate or mortgages.
Non-U.S. dollar-denominated securities.
Illinois Metropolitan Investment FundInvestment Policy - IMET Convenience Series (Continued)
September 30, 2016
The following transactions are prohibited in the portfolio:
Common or preferred stocks.
Margin purchases or intentional use of leverage.
-64-
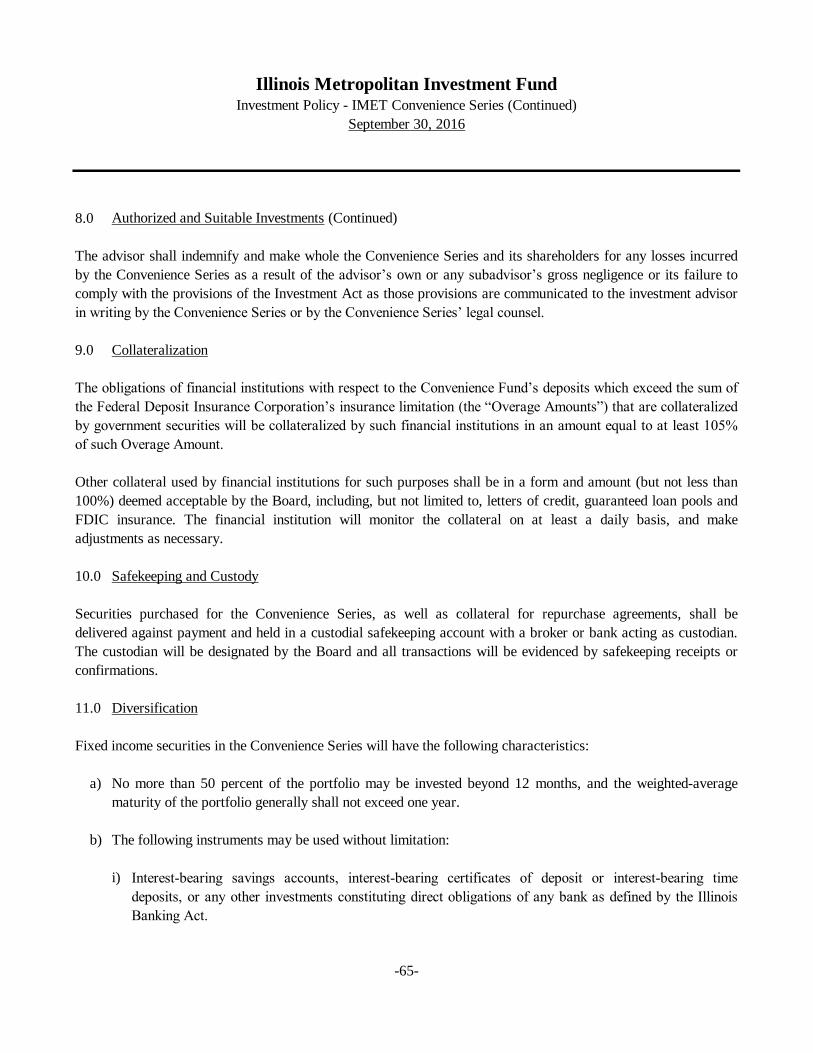
8.0 Authorized and Suitable Investments (Continued)
Collateralization
10.0 Safekeeping and Custody
11.0 Diversification
a)
b) The following instruments may be used without limitation:
i)
The advisor shall indemnify and make whole the Convenience Series and its shareholders for any losses incurred
by the Convenience Series as a result of the advisor’s own or any subadvisor’s gross negligence or its failure to
comply with the provisions of the Investment Act as those provisions are communicated to the investment advisor
in writing by the Convenience Series or by the Convenience Series’ legal counsel.
Securities purchased for the Convenience Series, as well as collateral for repurchase agreements, shall be
delivered against payment and held in a custodial safekeeping account with a broker or bank acting as custodian.
The custodian will be designated by the Board and all transactions will be evidenced by safekeeping receipts or
confirmations.
Interest-bearing savings accounts, interest-bearing certificates of deposit or interest-bearing time
deposits, or any other investments constituting direct obligations of any bank as defined by the Illinois
Banking Act.
Fixed income securities in the Convenience Series will have the following characteristics:
No more than 50 percent of the portfolio may be invested beyond 12 months, and the weighted-average
maturity of the portfolio generally shall not exceed one year.
9.0
The obligations of financial institutions with respect to the Convenience Fund’s deposits which exceed the sum of
the Federal Deposit Insurance Corporation’s insurance limitation (the “Overage Amounts”) that are collateralized
by government securities will be collateralized by such financial institutions in an amount equal to at least 105%
of such Overage Amount.
September 30, 2016
Illinois Metropolitan Investment FundInvestment Policy - IMET Convenience Series (Continued)
Other collateral used by financial institutions for such purposes shall be in a form and amount (but not less than
100%) deemed acceptable by the Board, including, but not limited to, letters of credit, guaranteed loan pools and
FDIC insurance. The financial institution will monitor the collateral on at least a daily basis, and make
adjustments as necessary.
-65-
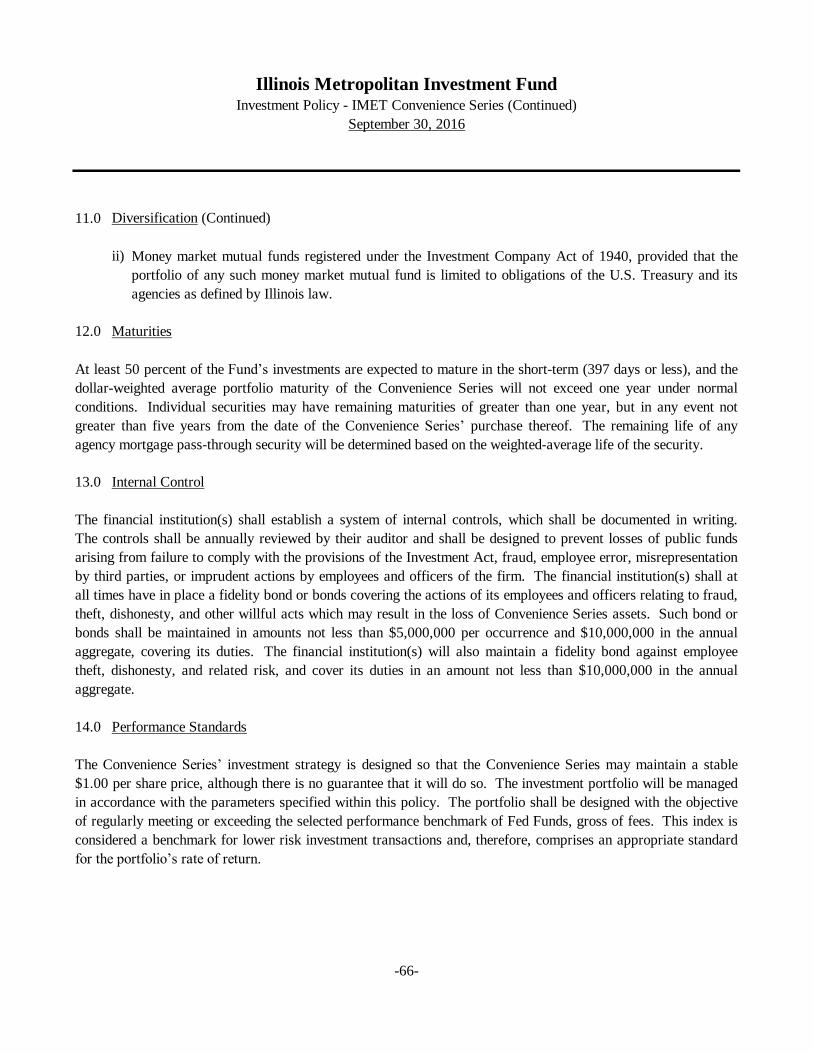
11.0 Diversification (Continued)
ii)
12.0
13.0 Internal Control
14.0 Performance Standards
Illinois Metropolitan Investment Fund
At least 50 percent of the Fund’s investments are expected to mature in the short-term (397 days or less), and the
dollar-weighted average portfolio maturity of the Convenience Series will not exceed one year under normal
conditions. Individual securities may have remaining maturities of greater than one year, but in any event not
greater than five years from the date of the Convenience Series’ purchase thereof. The remaining life of any
agency mortgage pass-through security will be determined based on the weighted-average life of the security.
The financial institution(s) shall establish a system of internal controls, which shall be documented in writing.
The controls shall be annually reviewed by their auditor and shall be designed to prevent losses of public funds
arising from failure to comply with the provisions of the Investment Act, fraud, employee error, misrepresentation
by third parties, or imprudent actions by employees and officers of the firm. The financial institution(s) shall at
all times have in place a fidelity bond or bonds covering the actions of its employees and officers relating to fraud,
theft, dishonesty, and other willful acts which may result in the loss of Convenience Series assets. Such bond or
bonds shall be maintained in amounts not less than $5,000,000 per occurrence and $10,000,000 in the annual
aggregate, covering its duties. The financial institution(s) will also maintain a fidelity bond against employee
theft, dishonesty, and related risk, and cover its duties in an amount not less than $10,000,000 in the annual
aggregate.
The Convenience Series’ investment strategy is designed so that the Convenience Series may maintain a stable
$1.00 per share price, although there is no guarantee that it will do so. The investment portfolio will be managed
in accordance with the parameters specified within this policy. The portfolio shall be designed with the objective
of regularly meeting or exceeding the selected performance benchmark of Fed Funds, gross of fees. This index is
considered a benchmark for lower risk investment transactions and, therefore, comprises an appropriate standard
for the portfolio’s rate of return.
Money market mutual funds registered under the Investment Company Act of 1940, provided that the
portfolio of any such money market mutual fund is limited to obligations of the U.S. Treasury and its
agencies as defined by Illinois law.
Maturities
Investment Policy - IMET Convenience Series (Continued)
September 30, 2016
-66-
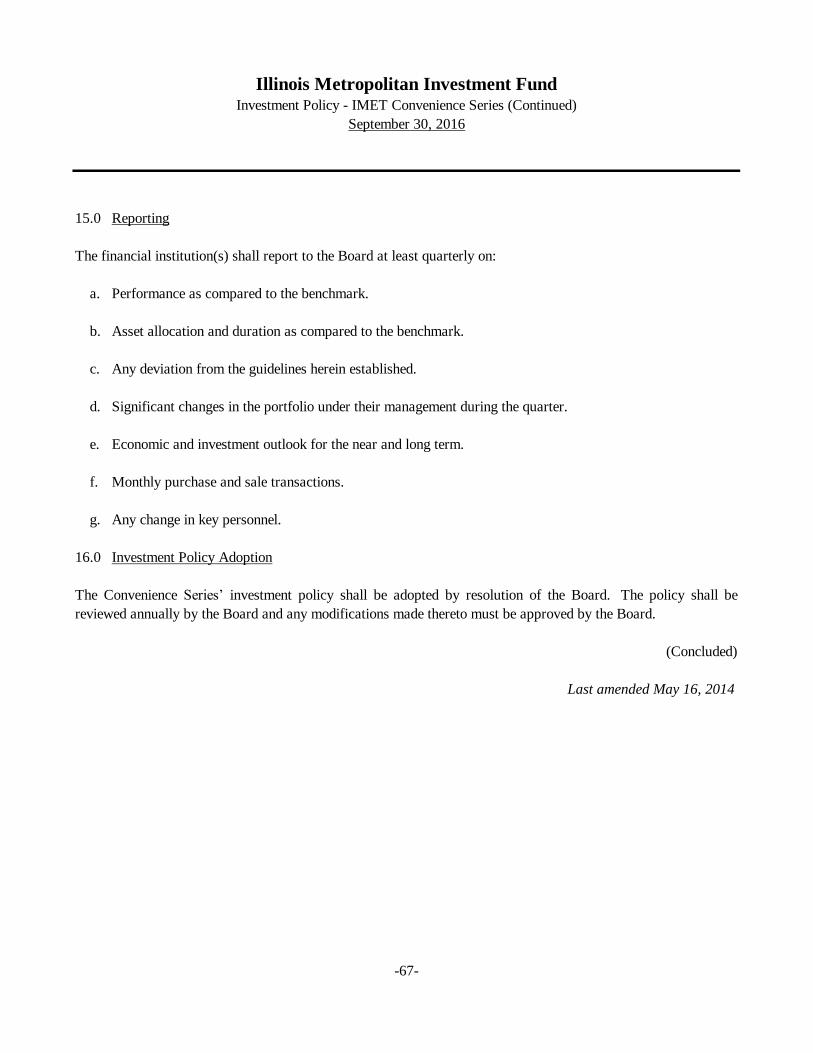
15.0 Reporting
a.
b.
c.
d.
e.
f.
g.
16.0 Investment Policy Adoption
(Concluded)
Last amended May 16, 2014
The Convenience Series’ investment policy shall be adopted by resolution of the Board. The policy shall be
reviewed annually by the Board and any modifications made thereto must be approved by the Board.
Economic and investment outlook for the near and long term.
Any change in key personnel.
Monthly purchase and sale transactions.
The financial institution(s) shall report to the Board at least quarterly on:
Performance as compared to the benchmark.
Asset allocation and duration as compared to the benchmark.
Any deviation from the guidelines herein established.
Significant changes in the portfolio under their management during the quarter.
September 30, 2016
Illinois Metropolitan Investment FundInvestment Policy - IMET Convenience Series (Continued)
-67-

STATISTICAL SECTION (Unaudited)
Contents Page (s)
Financial Trends
69 - 74
Demographic and Economic Information
75 - 76
These schedules offer demographic and economic indicators to help the reader understand the
environment in which IMET's activities take place.
Illinois Metropolitan Investment FundIndex for Statistical Section
September 30, 2016
This part of the Illinois Metropolitan Investment Fund's (IMET's) comprehensive annual financial report presents
detailed information as a context for understanding what the information in the financial statements, note
disclosures, and required supplementary information says about IMET's overall financial health. Revenue
capacity, debt capacity, and operating information are not applicable to IMET.
These schedules contain trend information to help the reader understand how IMET's financial
performance and well-being have changed over time.
-68-

2016 2015 2014 2
2013
Net position held in trust for participants
IMET 1-3 Year Fund 1
$ 181,977,415 $ 174,805,471 $ 232,311,616 $ 280,917,840
IMET Convenience Series 496,820,064 530,275,021 1,768,754,593 1,390,063,626
IMET Administration Fund 1
- - 1,774,377 1,669,020
Total $ 678,797,479 $ 705,080,492 $ 2,002,840,586 $ 1,672,650,486
Number of units outstanding
IMET 1-3 Year Series 1
9,373,943 9,050,005 12,158,529 14,757,571
IMET Convenience Series 496,805,311 530,226,456 1,768,754,593 1,390,063,626
Total 506,179,254 539,276,461 1,780,913,122 1,404,821,197
Price per unit
IMET 1-3 Year Series 1
$ 19.413 $ 19.316 $ 19.107 $ 19.036
IMET Convenience Series 1.000 1.000 1.000 1.000
1
2
Data Source: Illinois Metropolitan Investment Fund Comprehensive Annual Financial Reports
Note:
Illinois Metropolitan Investment FundSCHEDULE OF FIDUCIARY NET POSITION
LAST TEN FISCAL YEARS
IMET's operations activities were included in the 1-3 Year Fund in fiscal years 2007 - 2010 and, in fiscal year
2011, through December 31, 2010. Effective January 1, 2011 through September 30, 2014, those activities
were reported separately in the Administration Fund. Beginning in fiscal year 2015, administrative expenses
were allocated between the 1-3 Year Fund and the Convenience Series.
Data pertaining to the IMET FFF Account Liquidating Trust is not presented above, due to the nature of that
fund. See Note C in the Notes to the financial statements.
As originally stated. These amounts were not restated for the implementation of GASB Statements No. 68 and
71.
-69-
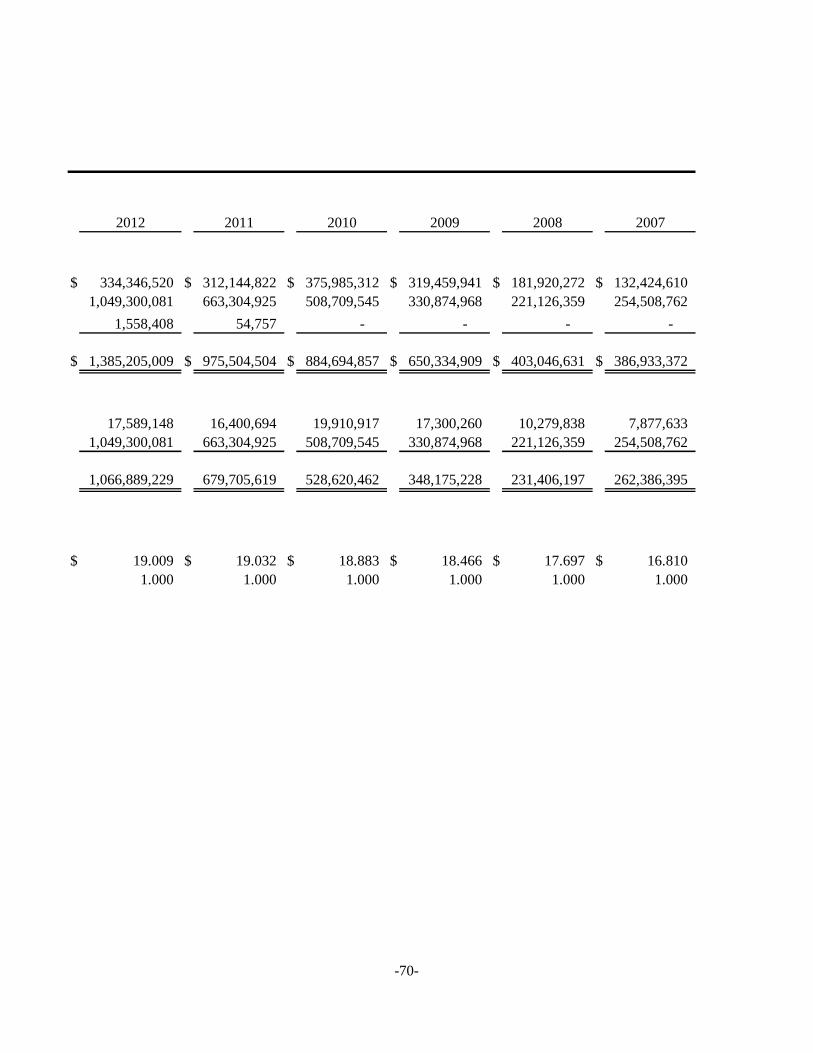
2012 2011 2010 2009 2008 2007
$ 334,346,520 $ 312,144,822 $ 375,985,312 $ 319,459,941 $ 181,920,272 $ 132,424,610
1,049,300,081 663,304,925 508,709,545 330,874,968 221,126,359 254,508,762
1,558,408 54,757 - - - -
$ 1,385,205,009 $ 975,504,504 $ 884,694,857 $ 650,334,909 $ 403,046,631 $ 386,933,372
17,589,148 16,400,694 19,910,917 17,300,260 10,279,838 7,877,633
1,049,300,081 663,304,925 508,709,545 330,874,968 221,126,359 254,508,762
1,066,889,229 679,705,619 528,620,462 348,175,228 231,406,197 262,386,395
$ 19.009 $ 19.032 $ 18.883 $ 18.466 $ 17.697 $ 16.810
1.000 1.000 1.000 1.000 1.000 1.000
-70-
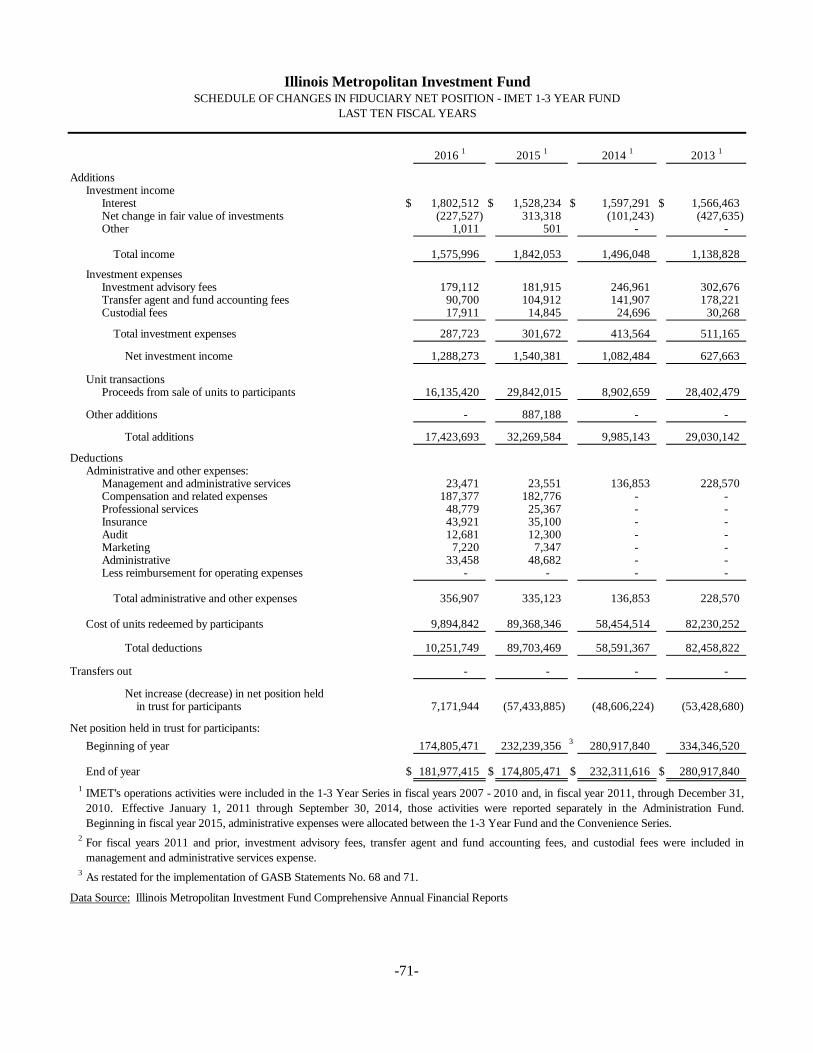
2016 1
2015 1
2014 1
2013 1
AdditionsInvestment income
Interest $ 1,802,512 $ 1,528,234 $ 1,597,291 $ 1,566,463 Net change in fair value of investments (227,527) 313,318 (101,243) (427,635) Other 1,011 501 - -
Total income 1,575,996 1,842,053 1,496,048 1,138,828
Investment expensesInvestment advisory fees 179,112 181,915 246,961 302,676 Transfer agent and fund accounting fees 90,700 104,912 141,907 178,221 Custodial fees 17,911 14,845 24,696 30,268
Total investment expenses 287,723 301,672 413,564 511,165
Net investment income 1,288,273 1,540,381 1,082,484 627,663
Unit transactionsProceeds from sale of units to participants 16,135,420 29,842,015 8,902,659 28,402,479
Other additions - 887,188 - -
Total additions 17,423,693 32,269,584 9,985,143 29,030,142
DeductionsAdministrative and other expenses:
Management and administrative services 23,471 23,551 136,853 228,570 Compensation and related expenses 187,377 182,776 - - Professional services 48,779 25,367 - - Insurance 43,921 35,100 - - Audit 12,681 12,300 - - Marketing 7,220 7,347 - - Administrative 33,458 48,682 - - Less reimbursement for operating expenses - - - -
Total administrative and other expenses 356,907 335,123 136,853 228,570
Cost of units redeemed by participants 9,894,842 89,368,346 58,454,514 82,230,252
Total deductions 10,251,749 89,703,469 58,591,367 82,458,822
Transfers out - - - -
Net increase (decrease) in net position heldin trust for participants 7,171,944 (57,433,885) (48,606,224) (53,428,680)
Net position held in trust for participants:
Beginning of year 174,805,471 232,239,3563
280,917,840 334,346,520
End of year $ 181,977,415 $ 174,805,471 $ 232,311,616 $ 280,917,840
1
2
3
Data Source: Illinois Metropolitan Investment Fund Comprehensive Annual Financial Reports
As restated for the implementation of GASB Statements No. 68 and 71.
Illinois Metropolitan Investment FundSCHEDULE OF CHANGES IN FIDUCIARY NET POSITION - IMET 1-3 YEAR FUND
LAST TEN FISCAL YEARS
IMET's operations activities were included in the 1-3 Year Series in fiscal years 2007 - 2010 and, in fiscal year 2011, through December 31,
2010. Effective January 1, 2011 through September 30, 2014, those activities were reported separately in the Administration Fund.
Beginning in fiscal year 2015, administrative expenses were allocated between the 1-3 Year Fund and the Convenience Series.
For fiscal years 2011 and prior, investment advisory fees, transfer agent and fund accounting fees, and custodial fees were included in
management and administrative services expense.
-71-
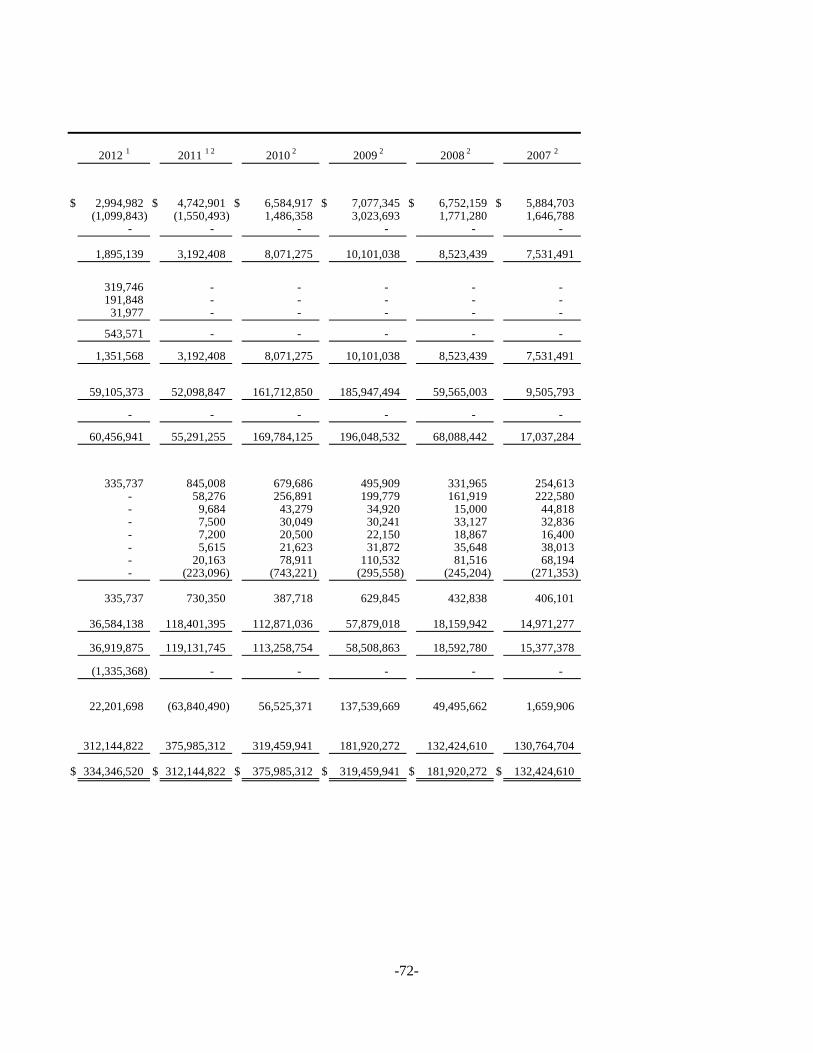
2012 1
2011 1 2
2010 2
2009 2
2008 2
2007 2
$ 2,994,982 $ 4,742,901 $ 6,584,917 $ 7,077,345 $ 6,752,159 $ 5,884,703 (1,099,843) (1,550,493) 1,486,358 3,023,693 1,771,280 1,646,788
- - - - - -
1,895,139 3,192,408 8,071,275 10,101,038 8,523,439 7,531,491
319,746 - - - - - 191,848 - - - - -
31,977 - - - - -
543,571 - - - - -
1,351,568 3,192,408 8,071,275 10,101,038 8,523,439 7,531,491
59,105,373 52,098,847 161,712,850 185,947,494 59,565,003 9,505,793
- - - - - -
60,456,941 55,291,255 169,784,125 196,048,532 68,088,442 17,037,284
335,737 845,008 679,686 495,909 331,965 254,613 - 58,276 256,891 199,779 161,919 222,580 - 9,684 43,279 34,920 15,000 44,818 - 7,500 30,049 30,241 33,127 32,836 - 7,200 20,500 22,150 18,867 16,400 - 5,615 21,623 31,872 35,648 38,013 - 20,163 78,911 110,532 81,516 68,194 - (223,096) (743,221) (295,558) (245,204) (271,353)
335,737 730,350 387,718 629,845 432,838 406,101
36,584,138 118,401,395 112,871,036 57,879,018 18,159,942 14,971,277
36,919,875 119,131,745 113,258,754 58,508,863 18,592,780 15,377,378
(1,335,368) - - - - -
22,201,698 (63,840,490) 56,525,371 137,539,669 49,495,662 1,659,906
312,144,822 375,985,312 319,459,941 181,920,272 132,424,610 130,764,704
$ 334,346,520 $ 312,144,822 $ 375,985,312 $ 319,459,941 $ 181,920,272 $ 132,424,610
-72-

2016 2015 2014 2013
Additions
Investment income
Interest $ 2,526,589 $ 2,781,255 $ 6,582,520 $ 4,897,189
Investment expenses
Transfer agent and fund accounting fees 234,964 403,367 826,690 650,812
Net investment income 2,291,625 2,377,888 5,755,830 4,246,377
Proceeds from sale of units to participants 490,842,971 487,281,716 1,523,219,269 1,279,047,571
Other additions - 887,189 - -
Total additions 493,134,596 490,546,793 1,528,975,099 1,283,293,948
Deductions
Administrative and other expenses 317,195 1,118,792 577,512 457,330
Distributions to participants 2,008,242 2,097,720 5,178,318 3,789,047
Cost of units redeemed by participants 524,264,116 1,725,809,853 1,094,086,159 938,284,026
Total deductions 526,589,553 1,729,026,365 1,099,841,989 942,530,403
Transfer to Liquidating Trust - - (50,442,143) -
Net increase (decrease) in net position
held in trust for participants (33,454,957) (1,238,479,572) 378,690,967 340,763,545
Net position held in trust for participants:
Beginning of year 530,275,021 1,768,754,593 1,390,063,626 1,049,300,081
End of year $ 496,820,064 $ 530,275,021 $ 1,768,754,593 $ 1,390,063,626
1
Data Source: Illinois Metropolitan Investment Fund Comprehensive Annual Financial Reports
Illinois Metropolitan Investment FundSCHEDULE OF CHANGES IN FIDUCIARY NET POSITION - IMET CONVENIENCE SERIES
LAST TEN FISCAL YEARS
For fiscal years 2011 and prior, transfer agent and fund accounting fees were included in management and administrative
services expense.
-73-
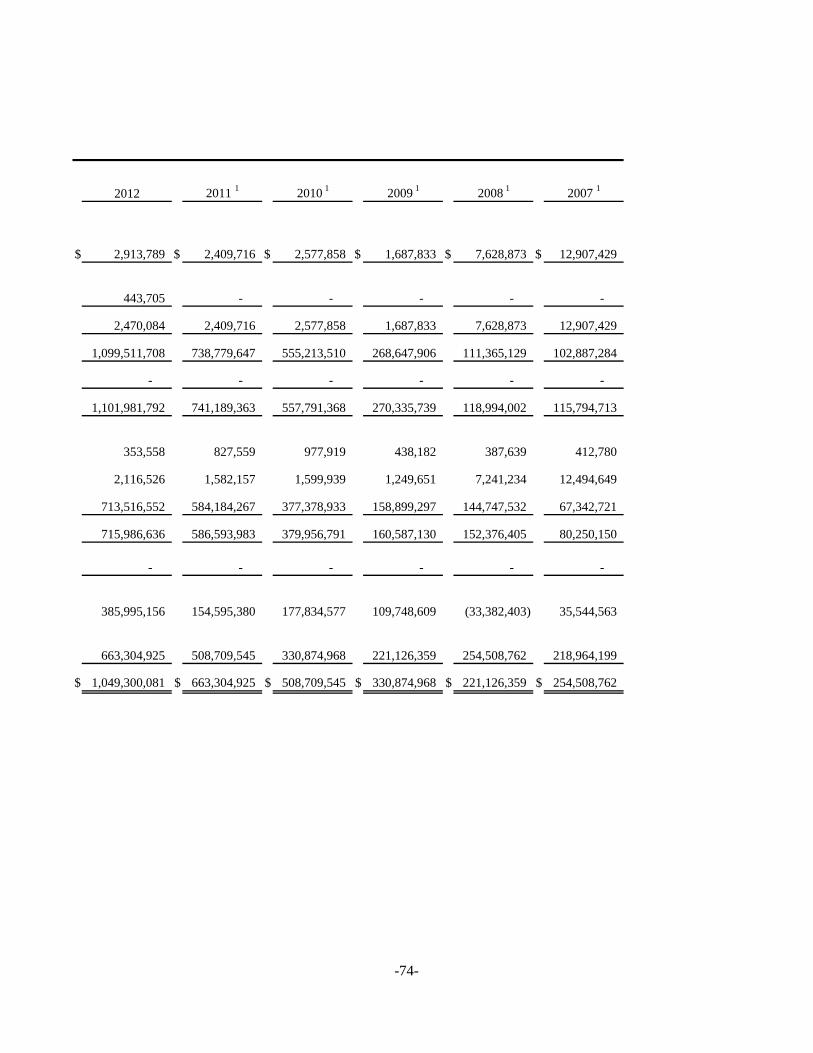
2012 2011 1
2010 1
2009 1
2008 1
2007 1
$ 2,913,789 $ 2,409,716 $ 2,577,858 $ 1,687,833 $ 7,628,873 $ 12,907,429
443,705 - - - - -
2,470,084 2,409,716 2,577,858 1,687,833 7,628,873 12,907,429
1,099,511,708 738,779,647 555,213,510 268,647,906 111,365,129 102,887,284
- - - - - -
1,101,981,792 741,189,363 557,791,368 270,335,739 118,994,002 115,794,713
353,558 827,559 977,919 438,182 387,639 412,780
2,116,526 1,582,157 1,599,939 1,249,651 7,241,234 12,494,649
713,516,552 584,184,267 377,378,933 158,899,297 144,747,532 67,342,721
715,986,636 586,593,983 379,956,791 160,587,130 152,376,405 80,250,150
- - - - - -
385,995,156 154,595,380 177,834,577 109,748,609 (33,382,403) 35,544,563
663,304,925 508,709,545 330,874,968 221,126,359 254,508,762 218,964,199
$ 1,049,300,081 $ 663,304,925 $ 508,709,545 $ 330,874,968 $ 221,126,359 $ 254,508,762
-74-
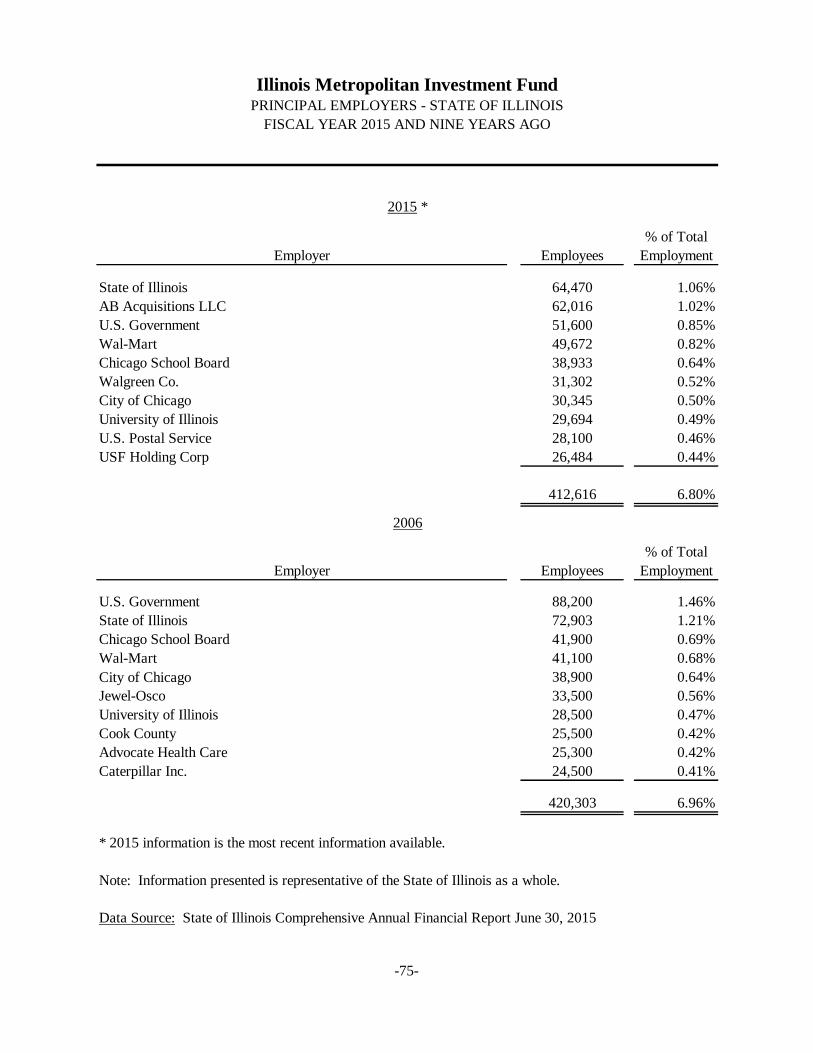
% of Total
Employer Employees Employment
State of Illinois 64,470 1.06%
AB Acquisitions LLC 62,016 1.02%
U.S. Government 51,600 0.85%
Wal-Mart 49,672 0.82%
Chicago School Board 38,933 0.64%
Walgreen Co. 31,302 0.52%
City of Chicago 30,345 0.50%
University of Illinois 29,694 0.49%
U.S. Postal Service 28,100 0.46%
USF Holding Corp 26,484 0.44%
412,616 6.80%
% of Total
Employer Employees Employment
U.S. Government 88,200 1.46%
State of Illinois 72,903 1.21%
Chicago School Board 41,900 0.69%
Wal-Mart 41,100 0.68%
City of Chicago 38,900 0.64%
Jewel-Osco 33,500 0.56%
University of Illinois 28,500 0.47%
Cook County 25,500 0.42%
Advocate Health Care 25,300 0.42%
Caterpillar Inc. 24,500 0.41%
420,303 6.96%
* 2015 information is the most recent information available.
Note: Information presented is representative of the State of Illinois as a whole.
Data Source: State of Illinois Comprehensive Annual Financial Report June 30, 2015
2006
Illinois Metropolitan Investment FundPRINCIPAL EMPLOYERS - STATE OF ILLINOIS
FISCAL YEAR 2015 AND NINE YEARS AGO
2015 *
-75-
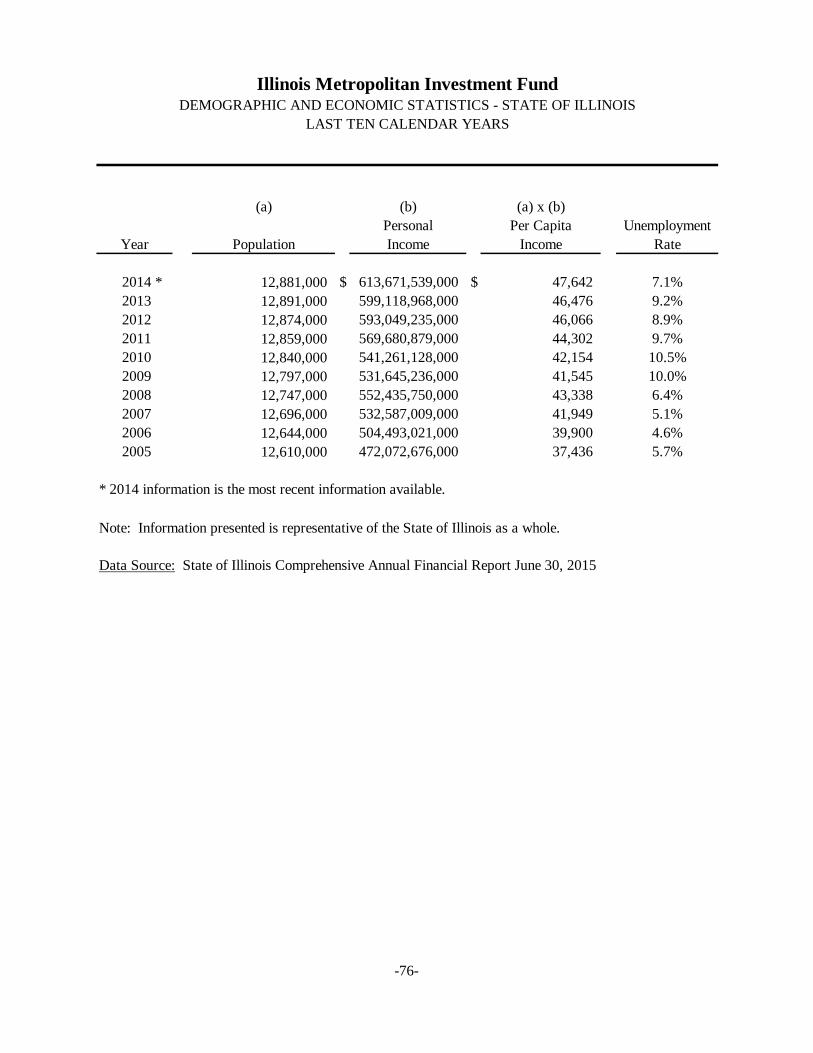
(a) (b) (a) x (b)
Personal Per Capita Unemployment
Year Population Income Income Rate
2014 * 12,881,000 $ 613,671,539,000 $ 47,642 7.1%
2013 12,891,000 599,118,968,000 46,476 9.2%
2012 12,874,000 593,049,235,000 46,066 8.9%
2011 12,859,000 569,680,879,000 44,302 9.7%
2010 12,840,000 541,261,128,000 42,154 10.5%
2009 12,797,000 531,645,236,000 41,545 10.0%
2008 12,747,000 552,435,750,000 43,338 6.4%
2007 12,696,000 532,587,009,000 41,949 5.1%
2006 12,644,000 504,493,021,000 39,900 4.6%
2005 12,610,000 472,072,676,000 37,436 5.7%
* 2014 information is the most recent information available.
Note: Information presented is representative of the State of Illinois as a whole.
Data Source: State of Illinois Comprehensive Annual Financial Report June 30, 2015
Illinois Metropolitan Investment FundDEMOGRAPHIC AND ECONOMIC STATISTICS - STATE OF ILLINOIS
LAST TEN CALENDAR YEARS
-76-