ILL1 - NASAobu_t frequency versus intens;ty. _c:'dents hr.',.e _ccurred _n;,vinGshe._rs ... Major...
26
THE ADVANCED LOW-LEVEL WINDSHEAR ALERT SYSTEM OPERATIONAL DEMONSTRATION RESULTS SUMMER, 1987 DENVER STAPLETON INTERNATIONAL AIRPORT BY JAMES MOORE ATMOSPHERIC TECHNOLOGY DMSION NATIONAL CENTER FOR ATMOSPHERIC RESEARCH FOR THE FIRST COMBINED MANUFACTURERS" AND TECHNOLOGY AIRBORNE WIND SHEAR REVIEW MEETING NASA LANGLEY RESEARCH CENTER OCTOBER 22-23, 1987 N88-17633 481 https://ntrs.nasa.gov/search.jsp?R=19880008249 2018-06-22T19:55:57+00:00Z
Transcript of ILL1 - NASAobu_t frequency versus intens;ty. _c:'dents hr.',.e _ccurred _n;,vinGshe._rs ... Major...

THE ADVANCED LOW-LEVEL WINDSHEAR ALERT SYSTEM
OPERATIONAL DEMONSTRATION RESULTS
SUMMER, 1987
DENVER STAPLETON INTERNATIONAL AIRPORT
BY
JAMES MOORE
ATMOSPHERIC TECHNOLOGY DMSION
NATIONAL CENTER FOR ATMOSPHERIC RESEARCH
FOR THE
FIRST COMBINED MANUFACTURERS" AND TECHNOLOGY
AIRBORNE WIND SHEAR REVIEW MEETING
NASA LANGLEY RESEARCH CENTER
OCTOBER 22-23, 1987
N88-17633
481
https://ntrs.nasa.gov/search.jsp?R=19880008249 2018-06-22T19:55:57+00:00Z

UKAI- I
\Virga orRain
\
Steady \_
Wind \Fie!d \
- \
Clou_
owndraft
\ HorizontalVortex /'_'_
1000 nApprox
ScaleO_
1000 tt
First: DetectionI
IMax Velocity Dit/erential j. 24 kn
Max
.... Intensity :_.::_
47 kn ......• , . ; . . .
Distance 0.9 nmi • 1.5nm| ' 'i_..::.
Time to Max Intensity_ 6.4 rain
482

4Number of
Measured
Microbursts
(500 I1 JAWS
Doppler 2Radar Data)
Figure 17.
10 20 30
AJFK
13! !
IIIIILL1Jillllll40 50
A A AMSY OEN CRO
• Maximum windshear c:zpability of
jet transports at heavy weight.for a shear encounter at a criticalIoc:2tion, is 40 to 50 knots
windspeed change
60 70 80 90 100
A A A " Acc:aent
OEN OFW DEN Inc:=entWinctsoeed
C_angesMaximum Horizontal Windspeed Change (kt)
Mic:obu_t frequency versus intens;ty. _c:'dents hr.',.e _ccurred _n ;,vinGshe._rs
within pe.dorm_nc_ c_.caCfiir/ oi a_r.ci_ne. Some wir, csr, e=rs c_.nnet be esc=..cedr'O¢ ; ' [suc,...s,utly.
483
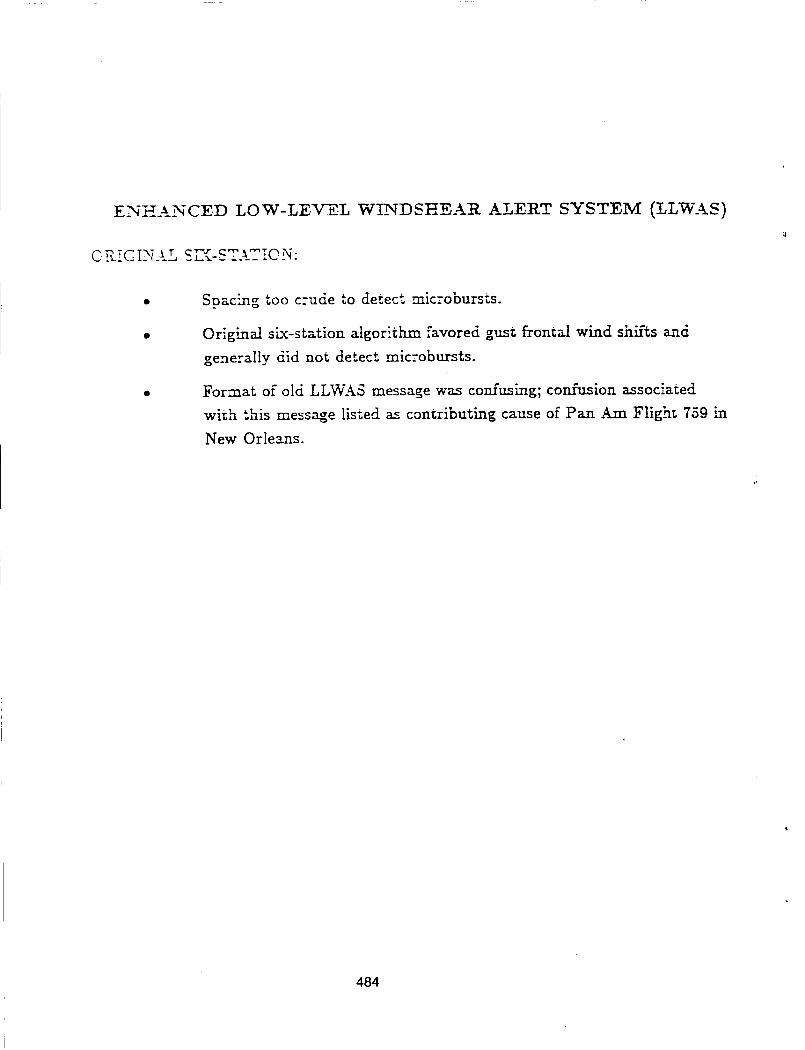
E_.-N-HA_,_-CED LOW-LEVEL WITCDS_EAR ALERT SYSTEI_ (LLW-__S)
C ,._!GI>[AL [E_-STATION:
Spacing too c:ude to detect microbursts.
Original sLx-station algor:.th.m favored gust frontal wind shifts euud
generally did not detect mic-obursts.
Format of old LLWAS message was confusing; confusion assoc'ated
with ".his message lis_ed as contributing cause of Pan A.m Flight 759 in
New Orleans.
484
DRAFT
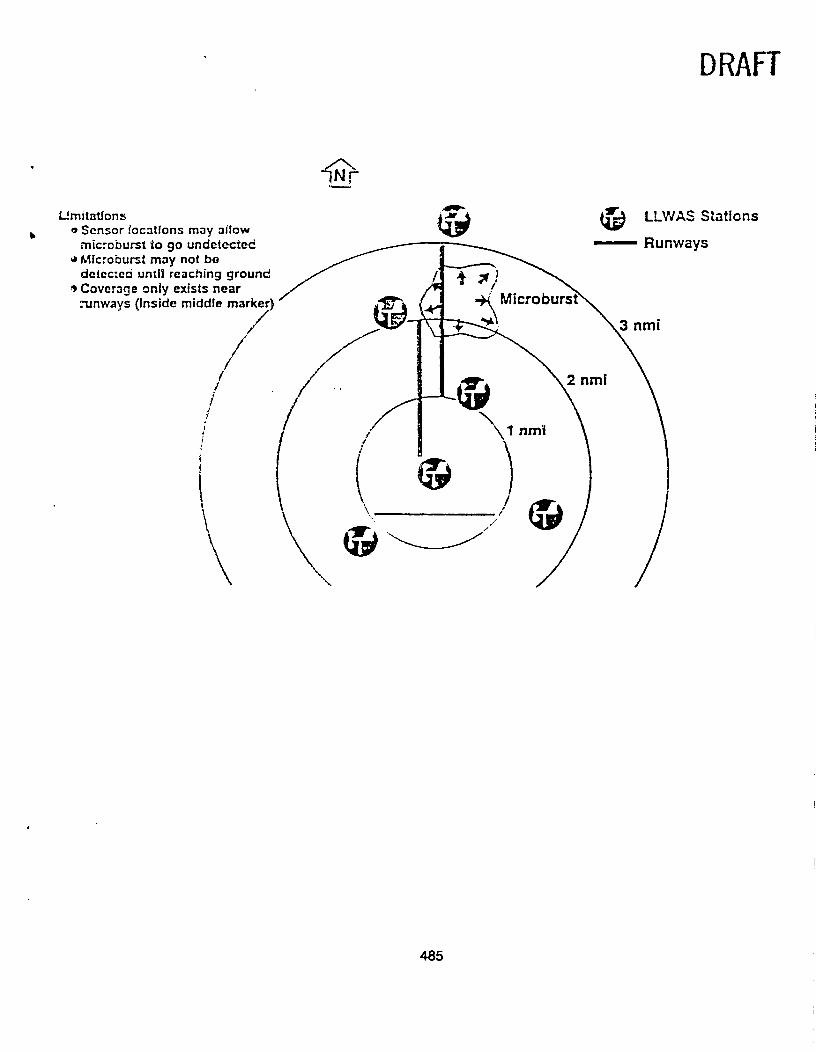
_mitaUon_ ,=.i-, @ LLWAS Stationse Sensor Jocnllons may -'tllow
microburst to go undetected _ _ _ RunwaysMlcroburs, may not be _ , _detec:ed until reaching grounc J /' ,_ ,_ }
--/Coverage only exists near J /1= - _ / .... "_.
,_Jnwavs. (inside middle marker),, / j,_ (._. =_ Mi_oburst'_
// __L_-l_ ._ \3 nmi,J
!,,/
- , /ml I
k 2 ://
485
G
®
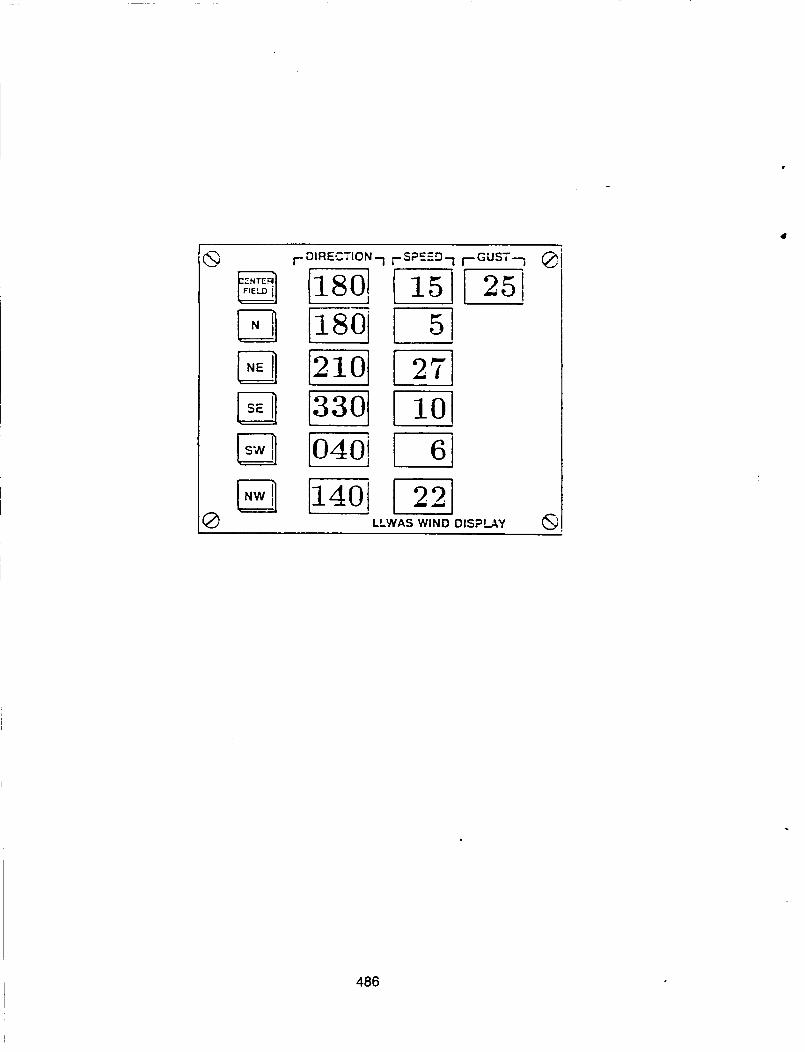
180! I 15l[ 25i_so[ 5l2_oj [ 2713301 101
040] 611_40i 221
LLWAS WIND DISPLAY Q
486

ORIGINAL PAGE IS
OF POOR QUALITY
ENHANCED LOW'-LE'V'EL W-LNDSHEA_ ALERT SYSTEM (LL'WAS)
Z_"_"_£___N C E D T VvZ L\'-E-'_"T_tT !© N:
de'-ecdnz microbm-._.
A_zor'hh_.-ISspec:.ficailyidentify _rr,--o,--.,_--_-,,,-,r - -. .,_,_.._l._ c .,_... WZ.VD 51£EA_ A:aRT
m a 5rsz prio_;y, then identifies all other wind shear events dezec-ed
WfND _¢,.,._.._-v_..,_ALERT.
Format of enhanced svszem provides piiots with runway-or:,ented wind
sneaz m___=..
UNITED FLIGHT 226, RUNW._If 26 LEFT, M!CROBURST
ALERT. 50 "....._Oz T n:._ ON TPI.: PUNW'V
_'= T" t TS ....DELTA FLIGHT ° '!, RuN ,_Ax 17 PdGET, WiND S_EAR ALERT,
15 KNOT GAIN. 1 }fiLE =,_,"_T THRESHOLD W.,_'D 2S0 _' "_'_
CESSNA 9477 MIKE. RUbWAY 08 VTC._T WE_'D SHEAR ALERT.• -L_-_-_TJ_- -- _ .
" - 'T" ...... . -T '-" -.15 K:NO = S_E _ R ! M,__n FINAL, THRESHOLD WIND 090 _T i5;
WIND SHEAR OUTSIDE TZV NETWORK
..... -_'_"----"":'_)" " ma.D-_',De disvlav in the tower._,i_,'e _r __ _S_i_ _. 8---_.-_'-"_":"--" Si_i/_,_iOr'. ....
-.oaooraise_.,.m.,,olh_---- ,_'- interest it.such _.-disolav.
487

UKAI- J
-N
NW°
°
o NE
• CF
oSW
-SE
A2
1.= A3
A10 A0
_9A6
A8A 7
A4
A5
488

0
0
!IIII
I
i
l!I
I1i
II
Y!
I!
I"x/._
_. "/.Vzt
er_NlY/b,'/f J,
i
III
° I- i
I
iI ,
u'JtD
N
c_
T
ffl
_4
P
m
489
i I
___ c:. c:
i'- _ c:
c
N
P
P_..<C
cl .II
EEE
ol
_D
C_ e-
ir--1..,.: ..,,2"
EE
I l___J 1__1
_ r-2--_ff.jo
_-- _J _-

n N|
OJ
la
w,--
-...
/:J
"% 490
r_O
0 _ CU

I_IBA 26 A
CF
330
190 15 G 25
15 G 25 P..WY 35-
MBA 8A 045 15 P.WY 20-
MBA 26 D 045 15 P..WY 35-
MBA 8D 330 15 G 25 ItWY 20-
491

CF 190 16 G 25
MBA 35 LD 160 22 G 30 B.WY 50-
MBA 35 RD 180 5 RWW 25-
MBA 35 LA 030 23 G 30 1 MF 55-
35 RA 180 10 3 MF 60-
MBA 17 LA 180 5 RWY 25-
MBA 17 RA 160 22 G 30 RWY 55-
17 LD 180 10 RWY 60-
MBA 17 RD 030 23 G 30 RWY 55-
492

CF 280 6
35 LD
35 RD
270
290
5
4
35 LA CALM
35 RA 280 6
17 LA 290 4
17RA 270 5
17 LD 280 6
17 RD CALM
493

No
Na
(. E_CH (=-SEE. PoLL
S
HO
NO
ye--3
• J
494

The Enhanced LLW:&S issues three kinds of alarms:
M-BA: ,.Microbur3t Alarm (Los_- _> 25)
_W_A-: W'nd ,.aelr Alarm with LOSS.
WSA+: Wind 5hear Alarm with G_a ,,-N
,_wL
We have comDiled alarm stati-zticz for the month_ of AuG 1987 and have
distinguished between the active a.fte:-noon and evening period and the more
passive night and morning period. On average, we have found the following:
MBA
WSA+
WSA-
Total Alar.m_.
MQH'7-_/-Y| ii i
ACTYv'E
Min/iO l=2rs Min/!4 Krs
/.G oT_ .g .&
q._ I.q 1.5 .1
i;_,3 5.9 I . 5 .2
COZvfBIN ...,_,
MW-_yAu_
(,.S p.,o
14..3 g./i
/ _,.a 7.'q,
c gA I/.2 1.3 1,1..s
44f34
AuG ao ta_4O ?,,_
A _- q l-rlle_ , S
<_OME AC'I-IUE- Z)AVS
to _ -F Co E,_- ToT4 t
a'ct I1,_ 1_'o5
3.e 5.5 ') ._
/o,¢/ 13._"
( ,,, _,, / , o ,,_)
C F:,4
/3. l
:_,1
lg.E
495

WHAT WE -LEARNED FROM THE ADVANCED LLWAS OPERATIONAL D_MONSTRATION
MCCARTHY (OCTOBER 1987)
l o Alpha-numeric message quite successful frem controller
usage; several minor changes recommended that are being
implemented.
2 o Advanced LLWAS geographical situation display developed and
fielded for NCAR tower meteoro!cqist wer_ successful:
provided:
Advanced LLWAS wind field over runway map in a manner
that provided supervisory controller with means of
"seeing" two-dimensional wind field at airport, on an
approximately 5 n mi radius map overlay. In a non-
alert status, this map provided limited ability for
supervisor to reconfigure runways, based on prevailing
wind situation (of course, wind shift prediction of
TDWR would substantially improve this capability, after
CLAWS results).
Map-type display of wind shear alert information, that
allowed supervisory controller to reconfigure
approach�departures, depending on where alerts were
occurring (i.e., if alerts were occurring only on N-S
runways, controller would frequently use GSD to
determine that E-W runways remained viable.
496

o
°
--Page 2--
Pr_!iminary Advanced LLWAS algorithm results (general
impressions):
Microburst detection alerted on approximately 25 knot
differential (although alert threshold was divergence-
dependent). Worked apparently well, except that very
rare thermal that appeared divergent alerted system.
Microburst detecnion always reported loss, based on a
fit to a symmetric microburst mode!; likely
misrepresented wind field on some occasions, presumably
due to microburst asymmetries, or to semi-divergent
winds imbedded in gust frontal structures.
Wind shear alerts (station anomaly algorithm) worked
very well, except that thermals occasionally fired the
alarm; two types of WSAs occurred: wind speed loss,
wind speed gain.
No alarms were sounded if computed runway loss or gain
did not exceed ten knots; this was a demonstration
glitch - threshold should have been 15 knots. This
would have eliminated some inappropriate alarms (alarms
that presumably did not represent hazards).
Some sheltering clearly caused some false alarms; this
includes microburst and wind shear alarms.
Controller and Pilot feedback; still under review. Initial
reactions suggest controllers wildly enthusiastic. All
written pilot reaction favorable, but I have observed
caution regarding accuracy of advanced LLWAS.
497

lo
2 °
3 •
4 °
--Page 3--
MCC_R_."q_Y'S G_NERAL IMPRESSION OF ADVANCED LLWAS
OperaTional User Group display product concept very
successful; estimate of runway effects, tailored to each
_anway direction, made quantum advance in terminal
information content.
Ncn-aler_ szatus of advanced LLWAS provided exce!ien_
routine and very useful information to ATC; area supe_,iscr
will get advanced LLWAS alpha-numeric display in T_ACON; is
requesting GSD for supe_sisors in tower and TRACON.
Visual inspection of comparison between wind field seen cn
advanced LLWAS and alert message indicated at least
qualitative and some quantitative agreement; somewhat but
not always substantiated by pilots.
Advanced LL;_AS ccncept should be cornerstone of TDWR
operational display. In non-alert status, advanced LLWAS
winds need to be displayed on TDW_ 5 and 12? n mi GSD
display, and on TDWR alpha-numeric display.
498

TER_II!NAL DOPPLER V¢_ATEE.R RADAR (TDWR)
.... , - '_Z.-
• 2_unr.inz au_cma=ic mlc_-churz= ie--ac=icn algcri_hmz, off-:.ine, _o ;',erL+-
accuracy.
• Maintaining indeoendent a_sessmenz of microburs +. presence; verification
of all microbu_rst._ oresent.
• Over 200 microbursts identified within 30 km of Lincoln Lab radar since
18 May 1987!
Q u_ ta'se _iar_.• Goal is a .0.0 probability of microburst detection, and a I0n : ' "
Scor;.ng is not yet ¢omple:e, bu_ results to da_e are very encouraging.
• A_suming 1987 scoring "_ sat':sfactory, plan to have full TDWR . *" '•- 0oera_ior_al
demonstrat'_on in !988.
ORIGINAE PAGE IS
OF POOR QUALITY
499

1.
2.
3.
4o
SUMMARY OF TERMINAL DOPPLER WEATH]KR RADAR ACTMTIES
SUMMER, 1987
Mc__ (10-19-87)
Over 300 microbursts identified within 30 km of MIT/Lincoin
Lab radar'
Microburst surface divergence detection ground truthing
provided POD greater than 90% and FAR less than 5 % (target
was 90/10).
Microburst lines not well identified.
Gust front/wind shift detection/prediction not adequate.
50O
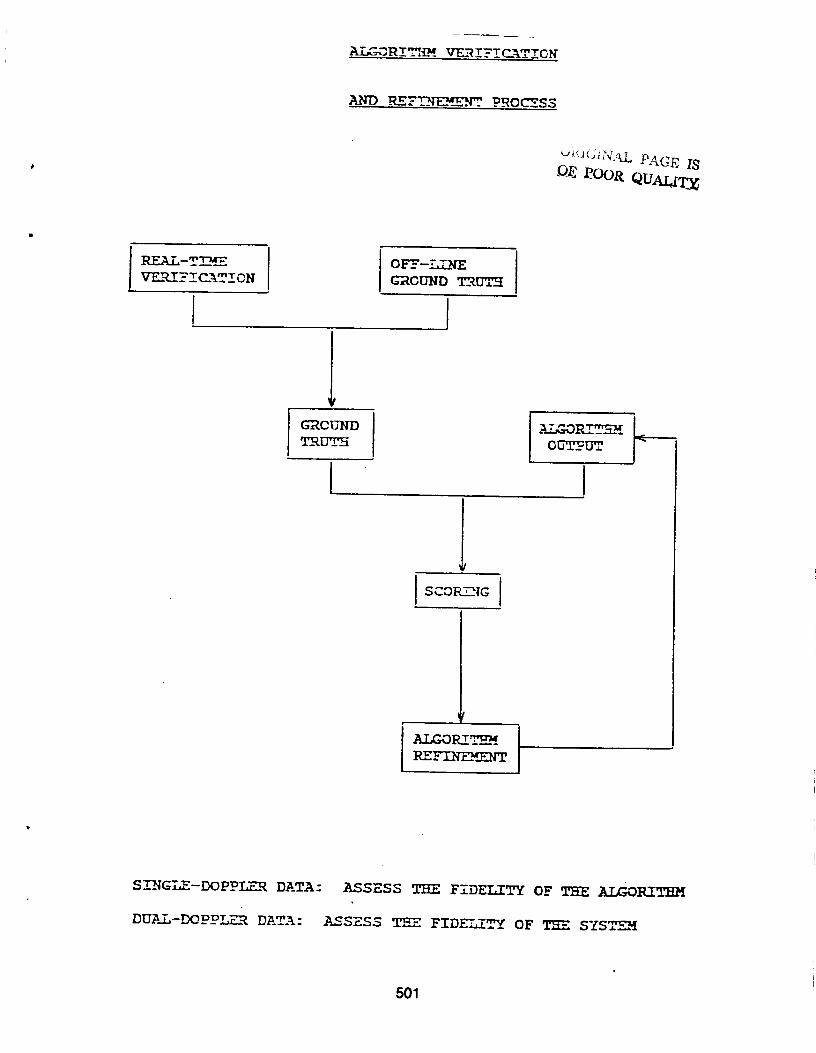
AiC-ORI ="_£M VER IFIC__.TXON
AND -_F_ PROC__-SS
CJ_<I',_;.LNALPAGE IS
.0_ P-OOR QUA/_T._
REA.L-'Im_
VF--R.IFIC_kTION
G'AOUND
TRUTH
I
l
S--rNGLE-DOPPL_-_ DATA: ASSESS THE FIDELITY OF THE _RITHi_
DU_-L-DOPPT_.--_ DATA: ASSESS _ FIDEL/._"_/ OF THE SYS_
501

1.
2 .
PLANS FOR SUMMER, 1988 OPERATIONAL DEMONSTRATION
Major RAP concentration on making microburst algorithm
output user friendly and displayable to ATC, using model of
Operational User Group as demonstrated with Advanced LLWAS;
Cleon Biter and Wayne Sand have action here.
MIT/LLwill concentrate on making 3-D microburst algorithm
run faster in real time.
3 .
4 .
5.
NSSL will concentrate on getting gust front/wind shift
algorithm to work effectively.
RAP will concentrate on developing sophisticated NOWCASTING
display system, utilizing Alliant/Symbolics/Pixar
combination with Lutz/Barron/J. Wilson talents.
Summer, 1989 advanced operational demonstration is
anticipated.
502
LOW-ALTITUDE WIND SHEAR RESEARCH AND DEVELOPMENT
THE MAJOR PLAYERS
THE LLWAS SYSTEM:
FEDERAL AVIATION ADMINISTRATION
NATIONAL CENTER FOR ATMOSPHERIC RESEARCH
FAA TECHNICAL CENTER
FAIRCHILD-WESTON, INC.
CLIMATRONICS, INC.
MARTIN-MARIETTA CORP.
THE TDWR PROGRAM:
FEDERAL AVIATION ADMINISTRATION
MIT LINCOLN LABORATORY
NATIONAL CENTER FOR ATMOSPHERIC RESEARCH
NATIONAL SEVERE STORMS LABORATORY
UNIVERSITY OF NORTH DAKOTA
MARTIN-MARIETTA CORP.
TRANSPORTATION SYSTEMS CENTER, DOT
503
QUESTIONS AND ANSWERS
RICK PAGE (FAA Tech Center) - Jim, just a point of
clarification. The graphic display that was in the tower during
the period of test in Denver -- I might want to point out to the
audience -- was not part of the LLWAS system itself. That
display Js not part of the LLWAS.
JIM MOORE (NCAR) - If I didn't make that clear, the LLWAS
display itself was a this and/or this [pointing to slide]. If
there was an alert status, this type of a display would be there
and if there was not an alert status there would be this type of
a display. The situation display was a separate color
graphic--it being used by people like myself and others to help
evaluate the system. The issue, the thing though is that the
supervisors especially were very interested in that display and
did come over and look at that quite often during these events to
see what was going on. Not only during the alert situations but
during more normal scenarios where they were interested in just
what the wind pattern was across the airport.
RICK PAGE (FAA Tech Center) - And another point of
clarification, although that graphic display will be looked at in
the future, it is not intended to be installed as part of the
LLWAS system in the immediate future. I want to make that pointclear.
JOHN CHISHOLM (Sierra Nevada Corp.) - Mark Merritt when he
was discussing his doppler radar said he had sort of a scorecard
or 95% probability 10% false alarms. If you did that for the oldLLWAS what wot_id the number be? And what would it be for the new
LLWAS? My gue£s maybe is a ... (paused)
RICK PAGE (FAA Tech Center) - As a result of the summer test
we are in the process right now of evaluating in a quick-look
report those exact figures. What we did is take an event and we
broke the event down into time slices and we evaluated, or are in
the process of evaluating, the relationship between the old LLWAS
and the new LLWAS. And we will have those figures within the next
week or two. The report is in draft status now and that will be
available to the community. So you might look for that.
JIM MOORE (NCAR) - In addition, I indicated that we had a
doppler radar on the airport that was looking up the runway
components as well. At NCAR we are trying to do some analysis
with the new LLWAS and comparing that to doppler radar data to
see how well we did.
JOHN CHISHOLM (Sierra Nevada Corp.) - One last question.
Has anybody said in order to make LLWAS as good as a doppler
radar I would have to put out so many anemometers and they would
cost so much versus the cost of a TDWR. Is it I00 or i000 or
would it be 2,000,000 dollars versus 5,000,000. Does anybody have
504
a crude number to that? I'm just sort of curious.
JIM MOORE (NCAR) - I don't know that a specific number hasbeen addressed, I do know that there have been studies done with
respect to what the spacing needs to be in order to cover a
phenomenon like microburst. The number 12 seems to be some
reasonable compromise. With respect to the resolution you would
get with a doppler radar (which might be 150-200 meters versuswhat you are able to do here which is on the order of a
kilometer), you have a ways to go. I'm not familiar with the
exact number that would be required to make the match a trueone.
TODD CERNI (OPHIR Corp.) - Just a comment on his question,
you have to keep in mind that the surface base sensors don't
measure quite the same thing as the remote sensors. That is, the
LLWAS does not give you velocity along the glidescope. Okay? So
the LLWAS may sound an alarm after the events pass through the
glidescope and it's too late. This is part of the problem in the
Dallas crash. Another problem with the Dallas crash is that the
event was outside the airport property and the LLWAS sounded the
alert after the event took place.
EMEDIO BRACALENTE (NASA LaRC) - Are these measurements made
at i0 meters altitude? How high are they above the ground.
JIM MOORE (NCAR) - That's the standard height but there is
some variation. In the Denver area, especially to the west of
the airport there is the problem with a tree canopy very close tothe end of the runway. So they actually had to run the tower up
through the trees.
EMEDIO BRACALENTE'(NASA LaRC) - Has there been any thought
given to doing profiling to try to get winds at higher altitude
by acoustic techniques or whatever that looks up, would that beuseful information if that could be gathered?
JIM MOORE (NCAR) - Well there is a profiler in Denver for
which data is provided to go back to several of the groups in
Boulder. At that point it still is a point observation and if you
have a microburst that is not right on the beam, you are never
going to ... (paused)
EMEDIO BRACALENTE (NASA LaRC) - Well I was thinking at every
LLWAS location to have a profile in addition to it.
JIM MOORE (NCAR) - That could get pretty pricey.
HERB SCHLICKENMAIER (FAA) - Well, if I can add--and Rick you
can probably update this even more--there was some work looking
into using acoustics, lasers, not as a profiler but as a
replacement for i000 ft. tall towers. As Jim was saying, with
505

the practical day-to-day things that the LLWAS program has been
dealing with for years, one of those practical problems is very
very tall towers to get out of obstruction-type shear. Some
consideration has been given to it at this point--some very
preliminary tests have been going on. It is, in essence, to
reproduce what an anemometer does, and also be able to program
the height without all the mechanical constraints of a tower.
noticed there was about one more question to go.
BUD LAYNOR (NTSB) - Just in addressing the gentlemen's
question on the TDWR comparison with the LLWAS, I thought maybe
Mark might want to address some aspect of that. But it was our
impression that the TDWR can also be used to look at the upper
level convergence or the twisting of the core which would provide
some lead-time predictive capability that the LLWAS is never
going to provide. Even if you did go out beyond the field withthe anemometers on the surface.
JIM MOORE (NCAR)- Well I think John's [Chisholm] question
was only with reference to making a surface-similar type, the
lowest level scan and what the comparison might be.
BUD LAYNOR (NTSB) - Well I agree, but I think that if the
algorithm can be developed to give lead time it certainly is very
important.
JIM MOORE (NCAR) - Yes, the predictive capabilities of the
radar clearly outweigh whatever LLWAS ... (paused)
BUD LAYNOR (NTSB) - And the other question I'll ask Rick
Page is: I don't understand why the FAA would be reluctant to put
the CRT display in the towers as part of the LLWAS, or certainly
as part of the TDWR when it comes along. If it is indeed as
effective for the supervisor as it seemed to me as it was when I
was out in the Denver tower.
RICK PAGE (FAA Tech Center) - I did not say we were
reluctant to put it in. I just said that there were no immediate
plans to put it in the tower. We will be looking at that
particular display and other types of graphic representation of
the data. It is just that that particular display (although it
was in the Denver tower--and it was being looked at by the
supervisors) for reconfiguration of runways was not part of the
test, and the data that we acquired and the decisions we were
making in relationship to the display itself did not include this
particular display. That is why I made the distinction. The
reports that we will be issuing will be based upon the CRT
display.
506