IJGUC 10209 Dehne et al - Dalhousie University
13
Int. J. Grid and Utility Computing, Vol. 1, No. 2, 2009 169 Copyright © 2009 Inderscience Enterprises Ltd. Cooperative caching for grid-enabled OLAP F. Dehne* School of Computer Science, Carleton University, Ottawa, Canada E-mail: [email protected] *Corresponding author M. Lawrence Department of Computer Science, University of British Columbia, Vancouver, Canada E-mail: [email protected] A. Rau-Chaplin Faculty of Computer Science, Dalhousie University, Halifax, NS Canada E-mail: [email protected] Abstract: In this paper, we propose a grid-based On-Line Analytical Processing (OLAP) application which distributes query computation across an enterprise grid. Our application follows a two-tiered process for answering queries based on sharing Cached OLAP data between the users at the local grid site and using grid scheduling approaches to execute the remaining parts of a query amongst a distributed set of OLAP Servers. A new technique for extraction and aggregation of shared Cached OLAP data is proposed, along with an efficient, aggregate-aware Cache controller. An experimental evaluation of the proposed query processing and cooperative Caching methods shows a significant reduction in query times compared to previously proposed methods. Keywords: OLAP; grid; Caching. Reference to this paper should be made as follows: Dehne, F., Lawrence, M. and Rau-Chaplin, A. (2009) ‘Cooperative caching for grid-enabled OLAP’, Int. J. Grid and Utility Computing, Vol. 1, No. 2, pp.169–181. Biographical notes: F. Dehne is a Professor of computer science at Carleton University in Ottawa, Canada. He is specialised in parallel algorithm design and applications of parallel algorithms in large-scale data analysis and bioinformatics. M. Lawrence is a PhD student at the University of British Columbia in Vancouver, Canada. A. Rau-Chaplin is a Professor of computer science at Dalhousie University in Halifax, Canada. He is currently on leave at Dalhousie and Heading the parallel computing group at Flagstone Reinsurance, developing parallel computing methods for catastrophe risk modelling. 1 Introduction The operation of modern distributed organisations, be they commercial, scientific or health related, generates massive quantities of data. Decision makers increasingly construct large-scale data warehouses and utilise On-Line Analytical Processing (OLAP) tools to glean from these rich data resource nuggets of information which can be used to better run their enterprises. A typical approach to OLAP-based data warehouses is to construct a single centralised data repository by copying all of the raw data from the sites where it is generated to a central location, where it is integrated and then to route all queries to that central location. As the amount of data and number of sites and users grow, this approach suffers from significant scalability problems. More recently, distributed enterprises are adopting grid computing as a means of tackling computing problems requiring large amounts of computational power or reliable access to large amounts of data. There has been growing interest in distributed data warehouses in the context of grid- based computing resources (Niemi et al., 2002; Niemi et al., 2003; Dubitzky et al., 2004; Fiser et al., 2004;Lawrence and Rau-Chaplin, 2006).
Transcript of IJGUC 10209 Dehne et al - Dalhousie University

Int. J. Grid and Utility Computing, Vol. 1, No. 2, 2009 169
Copyright © 2009 Inderscience Enterprises Ltd.
Cooperative caching for grid-enabled OLAP
F. Dehne* School of Computer Science, Carleton University, Ottawa, Canada E-mail: [email protected] *Corresponding author
M. Lawrence Department of Computer Science, University of British Columbia, Vancouver, Canada E-mail: [email protected]
A. Rau-Chaplin
Faculty of Computer Science, Dalhousie University, Halifax, NS Canada E-mail: [email protected]
Abstract: In this paper, we propose a grid-based On-Line Analytical Processing (OLAP) application which distributes query computation across an enterprise grid. Our application follows a two-tiered process for answering queries based on sharing Cached OLAP data between the users at the local grid site and using grid scheduling approaches to execute the remaining parts of a query amongst a distributed set of OLAP Servers. A new technique for extraction and aggregation of shared Cached OLAP data is proposed, along with an efficient, aggregate-aware Cache controller. An experimental evaluation of the proposed query processing and cooperative Caching methods shows a significant reduction in query times compared to previously proposed methods.
Keywords: OLAP; grid; Caching.
Reference to this paper should be made as follows: Dehne, F., Lawrence, M. and Rau-Chaplin, A. (2009) ‘Cooperative caching for grid-enabled OLAP’, Int. J. Grid and Utility Computing, Vol. 1, No. 2, pp.169–181.
Biographical notes: F. Dehne is a Professor of computer science at Carleton University in Ottawa, Canada. He is specialised in parallel algorithm design and applications of parallel algorithms in large-scale data analysis and bioinformatics.
M. Lawrence is a PhD student at the University of British Columbia in Vancouver, Canada.
A. Rau-Chaplin is a Professor of computer science at Dalhousie University in Halifax, Canada. He is currently on leave at Dalhousie and Heading the parallel computing group at Flagstone Reinsurance, developing parallel computing methods for catastrophe risk modelling.
1 Introduction
The operation of modern distributed organisations, be they commercial, scientific or health related, generates massive quantities of data. Decision makers increasingly construct large-scale data warehouses and utilise On-Line Analytical Processing (OLAP) tools to glean from these rich data resource nuggets of information which can be used to better run their enterprises. A typical approach to OLAP-based data warehouses is to construct a single centralised data repository by copying all of the raw data from the sites where it is generated to a central location, where it is integrated and then
to route all queries to that central location. As the amount of data and number of sites and users grow, this approach suffers from significant scalability problems.
More recently, distributed enterprises are adopting grid computing as a means of tackling computing problems requiring large amounts of computational power or reliable access to large amounts of data. There has been growing interest in distributed data warehouses in the context of grid-based computing resources (Niemi et al., 2002; Niemi et al., 2003; Dubitzky et al., 2004; Fiser et al., 2004;Lawrence and Rau-Chaplin, 2006).

170 F. Dehne, M. Lawrence and A. Rau-Chaplin
In this paper, we build on the grid OLAP model presented by Lawrence and Rau-Chaplin (2006) and propose new cooperative Caching algorithms for grid-based data warehouses. Our approach is to forgo the construction of a centralised data warehouse in favour of maintaining distributed data sources across a grid. In this context, queries must be routed to the appropriate data resources. Note that unlike transaction processing queries, OLAP queries tend to involve large amounts of data aggregation and typically return large results. Fortunately, these results can often be used to help compute the answers to future queries as users roll-up their analysis.
Our approach is to take advantage of the hierarchal structure of a typical enterprise grid, blending new and sophisticated Caching techniques and data grid scheduling to efficiently execute queries in a distributed fashion. Our aggregate-aware Cache control algorithms take advantage of the hierarchal grid organisation and the collection of local users’ Caches in order to reduce the amount of data retrieved from remote sites (see Figure 1).
Figure 1 An example OLAP enabled grid with the entities at each site and the connections between sites shown
This paper is the first to propose a cooperative Caching strategy to speed up OLAP queries in the grid. (A preliminary version of this paper appeared as Dehne et al. (2007) and implementation issues were discussed in Lawrence et al. (2007).) While cooperative Caching schemes exist, e.g. for Web Services (Narravula et al., 2006) and Peer-to-Peer (P2P) systems (Kalnis et al., 2002), ours is the first that provides the ability to combine and aggregate Cached data for future-related OLAP queries. We believe that cooperative Caching for OLAP amongst the users at a grid site is beneficial due to the likelihood that those users are interested in analysing similar perspectives. We propose an efficient localised Cache admittance scheme which uses a decay and refresh mechanism for controlling admission to and eviction from the Cache and a fast, aggregate-aware goodness metric for incoming OLAP view fragments.
We have prototyped the key components of our grid-based OLAP system in order to evaluate the effectiveness of the Cache extraction and admission algorithms in comparison with recent OLAP Caching proposals in the literature. Our experiments show that a significant reduction
in query cost is achieved by sharing and aggregating locally Cached data amongst users and that our Cache extraction method significantly outperforms previously proposed alternatives.
Our contributions can be summarised as follows: 1 a grid-based application taking advantage of the
resources across an enterprise in order to provide a scalable OLAP solution
2 two-tiered query processing algorithms making use of cooperative Caching on the local site and scheduling queries for non-Cached data to be executed over different servers
3 aggregate-aware Cache control mechanisms taking advantage of this two-tiered organisation and the collection of local user’s Caches in order to reduce the amount of data retrieved from remote sites
4 a prototype implementation in order to demonstrate the effectiveness of the Cache extraction and admission algorithms in comparison with recent OLAP Caching proposals in the literature.
The remainder of this paper is organised as follows: Section 2 describes OLAP and gives an overview of our grid-based OLAP application, also discussing related work. Section 3 outlines the architecture of the OLAP-enabled grid. Sections 4 and 5 describe the details of the query processing algorithm and Caching strategies, respectively. An experimental evaluation is presented in Section 6.
2 Background and related work
A typical data warehouse stores its information according to a StarSchema having a fact table with d feature attributes (dimensions) and some number of measure attributes. In addition to the fact table, there are dimension tables which give further details about the dimensions. These details often define a hierarchy on the values of a dimension.
A common type of query in OLAP data warehousing is the range-aggregate query, performed using the SELECT and GROUP BY clauses in the Standard Query Language (SQL). Typically the user selects a subset of the feature attributes from either the fact or dimension tables or both and at least one measure attribute from the fact table with some aggregate function applied to it. The selected dimensions are used for grouping the results and aggregation of the measure attribute(s) is applied over all records having identical values for the selected dimensions.
For example, a user of a bicycle store data warehouse may be interested to see how much each customer spent on each purchase. Such information can be obtained by an OLAP query selecting CUSTOMER, TIME and SUM (AMT), grouping the results by CUSTOMER and TIME, represented with the following SQL expression:
SELECT CUSTOMER, TIME, SUM (AMT)
FROM SALES
GROUP BY CUSTOMER, TIME
Cooperative caching for grid-enabled OLAP 171
Aggregate queries in OLAP are categorised by the dimensions they choose in the GROUP BY clause and the aggregated table. In the case that a query contains selection ranges on one or more of the dimensions, its results represent a view fragment. If a data warehouse has d dimensions, and the number of elements in dimension i’s hierarchy is Hi (where non-hierarchal dimensions D have the size 2 hierarchy D → ‘all’), then the total number of views is
1( ).d
iiH
=∏
Harinarayan et al. (1996) introduced the data cube lattice, expressing the relationship between views as a partial order. Each view is a node and there is a path from a view v to a view w in the lattice if queries on w can be answered also using v. This occurs when w groups on a subset of v’s dimensions, each at the same or lower levels of their respective hierarchies. More precisely, a view v can be represented as a tuple of d values (v1, v2…, vd), where vi is the level of dimension i’s hierarchy that v groups on. The partial order amongst views as defined by the lattice is
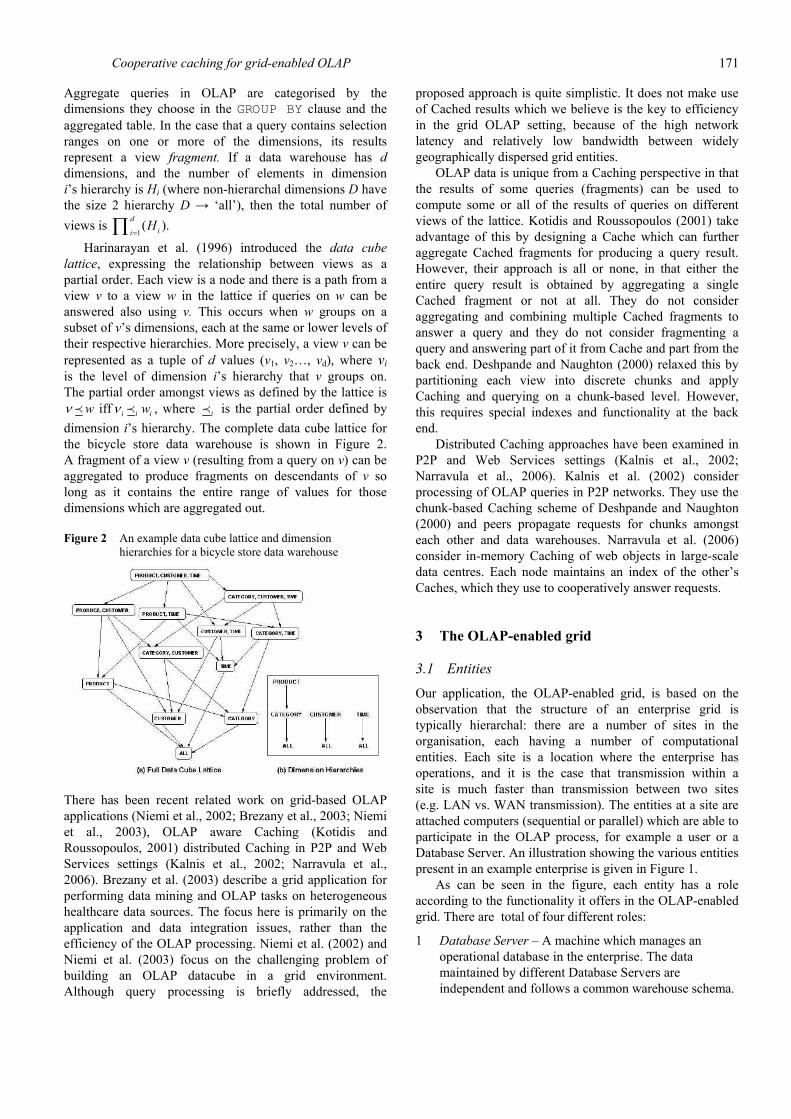
iff ii iw wν ν≺ ≺ , where i≺ is the partial order defined by dimension i’s hierarchy. The complete data cube lattice for the bicycle store data warehouse is shown in Figure 2. A fragment of a view v (resulting from a query on v) can be aggregated to produce fragments on descendants of v so long as it contains the entire range of values for those dimensions which are aggregated out.
Figure 2 An example data cube lattice and dimension hierarchies for a bicycle store data warehouse
There has been recent related work on grid-based OLAP applications (Niemi et al., 2002; Brezany et al., 2003; Niemi et al., 2003), OLAP aware Caching (Kotidis and Roussopoulos, 2001) distributed Caching in P2P and Web Services settings (Kalnis et al., 2002; Narravula et al., 2006). Brezany et al. (2003) describe a grid application for performing data mining and OLAP tasks on heterogeneous healthcare data sources. The focus here is primarily on the application and data integration issues, rather than the efficiency of the OLAP processing. Niemi et al. (2002) and Niemi et al. (2003) focus on the challenging problem of building an OLAP datacube in a grid environment. Although query processing is briefly addressed, the
proposed approach is quite simplistic. It does not make use of Cached results which we believe is the key to efficiency in the grid OLAP setting, because of the high network latency and relatively low bandwidth between widely geographically dispersed grid entities.
OLAP data is unique from a Caching perspective in that the results of some queries (fragments) can be used to compute some or all of the results of queries on different views of the lattice. Kotidis and Roussopoulos (2001) take advantage of this by designing a Cache which can further aggregate Cached fragments for producing a query result. However, their approach is all or none, in that either the entire query result is obtained by aggregating a single Cached fragment or not at all. They do not consider aggregating and combining multiple Cached fragments to answer a query and they do not consider fragmenting a query and answering part of it from Cache and part from the back end. Deshpande and Naughton (2000) relaxed this by partitioning each view into discrete chunks and apply Caching and querying on a chunk-based level. However, this requires special indexes and functionality at the back end.
Distributed Caching approaches have been examined in P2P and Web Services settings (Kalnis et al., 2002; Narravula et al., 2006). Kalnis et al. (2002) consider processing of OLAP queries in P2P networks. They use the chunk-based Caching scheme of Deshpande and Naughton (2000) and peers propagate requests for chunks amongst each other and data warehouses. Narravula et al. (2006) consider in-memory Caching of web objects in large-scale data centres. Each node maintains an index of the other’s Caches, which they use to cooperatively answer requests.
3 The OLAP-enabled grid
3.1 Entities
Our application, the OLAP-enabled grid, is based on the observation that the structure of an enterprise grid is typically hierarchal: there are a number of sites in the organisation, each having a number of computational entities. Each site is a location where the enterprise has operations, and it is the case that transmission within a site is much faster than transmission between two sites (e.g. LAN vs. WAN transmission). The entities at a site are attached computers (sequential or parallel) which are able to participate in the OLAP process, for example a user or a Database Server. An illustration showing the various entities present in an example enterprise is given in Figure 1.
As can be seen in the figure, each entity has a role according to the functionality it offers in the OLAP-enabled grid. There are total of four different roles:
1 Database Server – A machine which manages an operational database in the enterprise. The data maintained by different Database Servers are independent and follows a common warehouse schema.

172 F. Dehne, M. Lawrence and A. Rau-Chaplin
2 Computational/Storage Resource – A machine which offers storage space and processing power to the grid.
3 Site Broker – Responsible for the organization and coordination of resources within that site.
4 User Agent – The workstation of a user who is interested in performing OLAP operations on the data managed by the Database Servers. Each User Agent has an amount of Cache space on disk for storing the results of previously answered queries.
3.2 System architecture An overview of the logical components of the proposed system from the perspective of a user is shown in Figure 3. The corresponding layers of the Open Grid Services Architecture presented by Foster et al. (2001) are shown as well. In this section, we give a brief introduction to the role of each component in the system. The details of query processing are described in the sections which follow.
Figure 3 Components of the proposed grid-based OLAP solution and the corresponding Open Grid Services Architecture layers as presented in Foster et al. (2001)
The user interacts with a Front End which displays query results and translates requests into OLAP queries which are answered by the Query Service. The Query Service uses the Distributed Cache Index Service: a global index implemented on the Site Broker of all Cached fragments on the local site. Having such an index allows as much of the query as possible to be answered by local data. We could have also followed the approach of Narravula et al. (2006) and put a Cache index on each User Agent. However, given the possibility of a large number of User Agents and a high degree of query fragmentation, this would likely result in a very large number of messages between User Agents to keep the Cache indexes up to date. We could have forgone an index as in the P2P system of Kalnis et al. (2002), but this does not guarantee that the maximum amount of local data will be used.
The Query Service uses the Data Source Service to obtain both Cached fragments as well as query results from the back end, which in turn uses a Collective Cache Service for the Cached fragments and various Grid OLAP Services for obtaining the parts of the query which are not Cached. There is one Grid OLAP Service corresponding to the data of each Database Server in the grid. However, due to the presence of other computational and storage resources on a
site, there may be multiple underlying OLAP Servers which can answer an OLAP query on that data. In our implementation, the OLAP Servers store the data in a normalised multidimensional format using R-trees as indices as described by Dehne et al. (2003); Chen et al. (2004); Dehne et al. (2006). For a particular Database Server, the Site Broker at its site implements the corresponding Grid OLAP Service, whose job is to choose which of the OLAP Servers will answer a given query. Which Grid OLAP Services a particular sub-query goes to depends on the selection ranges of that sub-query. The data is partitioned across Grid OLAP Services horizontally by dimension values and a sub-query is sent to each Grid OLAP Service whose range of values intersects with that of the sub-query.
As in the Collective Cache Service, the Data Source Service immediately forwards results of sub-queries back to the Query Service as soon as they are received. This is to allow the Cache Admission Controller (described in Section 5) to make Caching decisions on each fragment while the Query Service is waiting for the remaining fragments, rather than trying to do them all at once. When all of the results of the sub-queries have been obtained by the Query Service, the overall query result is constructed and returned to the Front End for display to the user.
4 Query processing algorithms
This section describes the basic steps taken in order to execute a user’s OLAP query on the grid. Referring to Figure 3, this involves the description of the Query Service, Distributed Cache Index Service, Collective Cache Service, Data Source Service and Grid OLAP Service. Based on our sharing of local Caches, a two-tiered process for answering queries is proposed. The first tier uses the Caches on the local site in a collaborative manner to answer as much of the query as possible, and the second tier requests the missing fragments from the OLAP Servers.
Similar to Deshpande and Naughton (2000), we take advantage of the data cube lattice by further aggregating Cached data at any level above the desired result. Unlike Deshpande and Naughton (2000), we index arbitrarily sized multidimensional fragments (rather than equally sized chunks). Kotidis and Rous-sopoulos (1999) and Kotidis and Rous-sopoulos (2001) also index fragments, but they argue that it does not pay to combine multiple Cached results to answer a query. In our cgmOLAP system, Dehne et al. (2003), Chen et al. (2004), Dehne et al. (2006), we have observed aggregation of multidimensional to be an I/O-bound task whose time is directly proportional to the number of records which must be read from disk, i.e. the query’s size. Therefore, even if only half of a query can be answered from Cache, then it should take half the time to answer the remainder of the query at each of the OLAP Servers compared to the time it would have taken to answer the entire query. An additional feature of our strategy is that, since the Cached data is distributed across local User Agents, Cache requests are serviced in parallel.
Cooperative caching for grid-enabled OLAP 173
We call the Cache Search algorithm of the Distributed Cache Index component of the system the Fragment Aggregation and Recombination (FAR) strategy, since it can aggregate Cached fragments and will recombine several fragments in an attempt to answer a query. To implement FAR, the Distributed Cache Index uses the data cube lattice with an associated R-tree for view which indexes the Cached fragments at that view’s level of aggregation. When given a query, the Distributed Cache Index searches the R-tree of that query’s view and identifies all intersecting view fragments. A set of sub-queries are computed and, similar to Deshpande and Naughton (2000), a search is made for Cached fragments further up the lattice which can answer these. These sub-queries are not further broken down, rather they are attempted to be answered as a whole.
Translating a query on a view v to a query on an ancestor of v when there are no dimension hierarchies is straightforward and described by Kotidis and Roussopoulos (2001). We review the procedure here so that the extension to dimension hierarchies is more clear. Consider a query q = ((I1 h1), (I2, h2)… (Id, hd)). Ii is an interval reflecting the query’s selection of values for dimension i and hi is the level of dimension i’s hierarchy which is used. If hj =‘all’, then the value for Ii is irrelevant.
If a query q = ((I1, h1), (I2, h2) … (Id, hd)) is to be translated over a view v = (vh1, vh2… vhd), then for all i, it is either the case that hi = vhi, or that hi = all and vhi = Di, the ith dimension of the data warehouse. The translated query is q' = ((I'1, h'1), (I'2, h'2),… (I'd, h'd)), such that I'i = Ii for any i such that hi = vhi, otherwise I'i = (min (Di), max (Di)), the entire range of Di. For example, referring to Figure 2, if q = (((), all), ((10, 20), CUSTOMER), ((), all)) is to be translated over the (PRODUCT_ID, CUSTOMER, all) view, then the result would be q' = (((min (PRODUCT_ID), max (PRODUCT_ID), PRODUCT_ID), ((10, 20), CUSTOMER), ((), all)). This is necessary because each tuple in the (all, CUSTOMER, all) view represents the aggregation over purchases made by a specific customer at any time and of any product, hence the full range of each of the aggregated dimensions must be included. In case that there are dimension hierarchies, the requirement is not as restrictive. To translate a query q = ((I1, h1), {I2, h2) … (Id, hd)) over a view v = (vh1, vh2,…, vhd) there may be cases where hi ≠ all and hi ≠ vhi, i.e. hi is at some intermediate level of the hierarchy. In this case, we do not need a selection of all the values on vhi, only the ones corresponding to the range indicated in Ii. Consider, for example, the query q = (((4, 4), CATEGORY), ((), all), ((), all)). In order to compute this query from the view (PRODUCT_ID, all, all), only the IDs of those products corresponding to category 4 are needed, not all of the products. For performing a translation of this type, the Site Broker needs global knowledge about how values of a particular hierarchical level of a dimension map to values at a higher level in the hierarchy.
In order to implement the FAR Cache search as described above, we have designed an algorithm which computes a set of sub-queries Q given a query q and a set of intersecting view fragments F. Geometrically, this is the
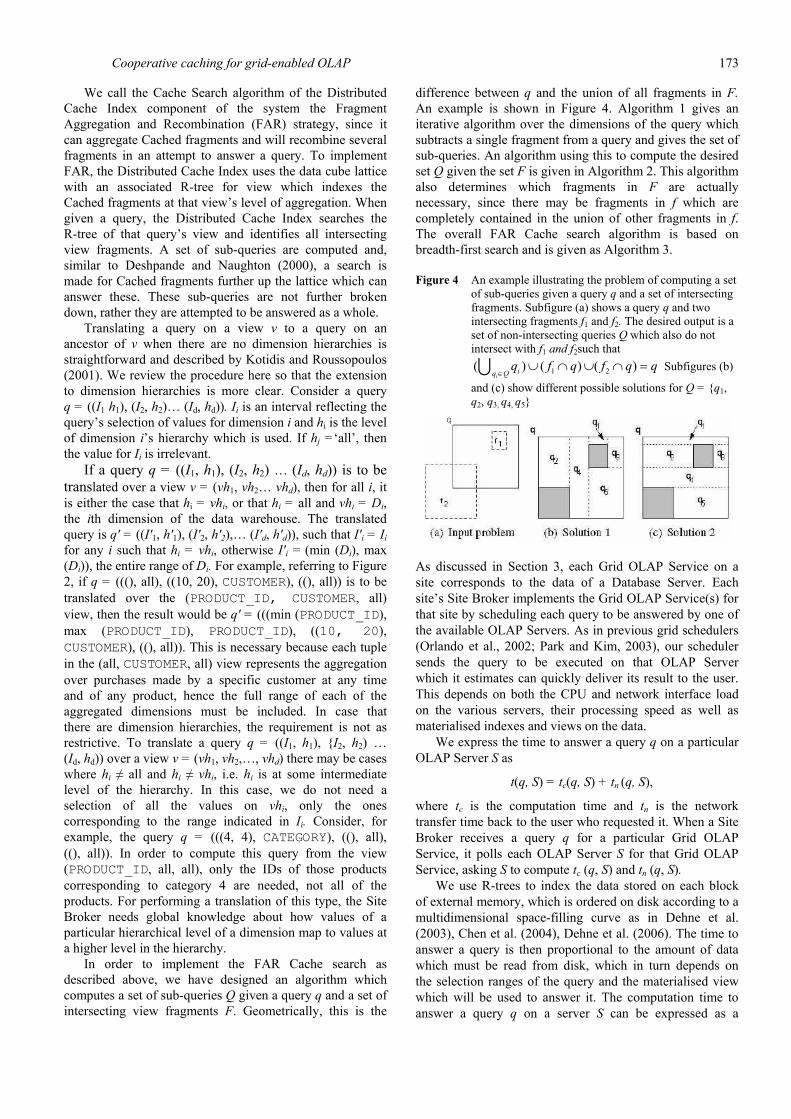
difference between q and the union of all fragments in F. An example is shown in Figure 4. Algorithm 1 gives an iterative algorithm over the dimensions of the query which subtracts a single fragment from a query and gives the set of sub-queries. An algorithm using this to compute the desired set Q given the set F is given in Algorithm 2. This algorithm also determines which fragments in F are actually necessary, since there may be fragments in f which are completely contained in the union of other fragments in f. The overall FAR Cache search algorithm is based on breadth-first search and is given as Algorithm 3.
Figure 4 An example illustrating the problem of computing a set of sub-queries given a query q and a set of intersecting fragments. Subfigure (a) shows a query q and two intersecting fragments f1 and f2. The desired output is a set of non-intersecting queries Q which also do not intersect with f1 and f2such that
1 2( ) ( ) ( )i
iq Qq f q f q q
∈∪ ∩ ∪ ∩ =∪ Subfigures (b)
and (c) show different possible solutions for Q = {q1, q2, q3, q4, q5}
As discussed in Section 3, each Grid OLAP Service on a site corresponds to the data of a Database Server. Each site’s Site Broker implements the Grid OLAP Service(s) for that site by scheduling each query to be answered by one of the available OLAP Servers. As in previous grid schedulers (Orlando et al., 2002; Park and Kim, 2003), our scheduler sends the query to be executed on that OLAP Server which it estimates can quickly deliver its result to the user. This depends on both the CPU and network interface load on the various servers, their processing speed as well as materialised indexes and views on the data.
We express the time to answer a query q on a particular OLAP Server S as
t(q, S) = tc(q, S) + tn (q, S),
where tc is the computation time and tn is the network transfer time back to the user who requested it. When a Site Broker receives a query q for a particular Grid OLAP Service, it polls each OLAP Server S for that Grid OLAP Service, asking S to compute tc (q, S) and tn (q, S).
We use R-trees to index the data stored on each block of external memory, which is ordered on disk according to a multidimensional space-filling curve as in Dehne et al. (2003), Chen et al. (2004), Dehne et al. (2006). The time to answer a query is then proportional to the amount of data which must be read from disk, which in turn depends on the selection ranges of the query and the materialised view which will be used to answer it. The computation time to answer a query q on a server S can be expressed as a

174 F. Dehne, M. Lawrence and A. Rau-Chaplin
function of the amount of data d(q, S) to be read from disk and the available bandwidth of S’s disk system as in
( , )( , ) ._ ( )c
d q St q Sdisk bandwidth S
=
The value of d(q, S) depends on the materialised view of S which q will be answered on. The server S maintains a reference a(v) to the smallest materialised ancestor of each view v, and upon receiving a query q, it translates q over a(view(q)). It can then use information about the distribution of data in a(view(q)) to approximate the amount of data to be read to answer q on a(view(q)) and estimates the time this would take by checking the current load and available bandwidth of its disk system.
The estimation of tn(q, S) is relatively straightforward. If S is on a different site from the user, it depends on both the available bandwidth of the link from S to the gateway of the site and on the available bandwidth across the link to the user’s site. Information of this nature can be obtained, for example, by using the Network Weather Service (Wolski et al., 1999). Here, tn(q, S) is the estimated size of the query result divided by the minimum of these two values. If S is on the same site as the user, then tn(q, S) is the estimated size of the query result divided by the available bandwidth from S to the user. The available bandwidth depends on various factors including the load on S’s network interface and on the load and speed of the links.
Once the Site Broker performing a Grid OLAP Service has computed t(q, S) for each of the OLAP Servers S, it schedules q to be computed on the one with minimum t(q, S) and instructs it to send the query results directly back

Cooperative caching for grid-enabled OLAP 175
to the user. A potential for improvement of the proposed strategy would be combining and aggregating together results from the various Grid OLAP Services on a site for the same query. If there are N Grid OLAP Services on a site, this could potentially reduce the amount of data to be transferred by 1/N.
5 Cooperative Caching algorithms
In this section, the operation of the Cache Admission Controller implemented on each User Agent is described. Given the potentially large amount of work that goes into computing fragments to answer a query, the key to an efficient grid-based OLAP system is an effective Caching scheme. The challenge in our case is how to assign a value representing the ‘goodness’ of a particular Cached fragment, since fragments which can be computed locally are presumably not as valuable as fragments computed on remote sites. The User Agents compute the goodness of each fragment and make a local Caching decision upon receiving it, notifying the Distributed Cache Index Service on the Site Broker of changes to its Cache contents. The disadvantage to this is that there will be many small fragments in the Cache, possibly increasing the complexity of the Distributed Cache Index Service and the number of sub-queries it returns. However, the advantage is that since there may be vast differences in the cost of obtaining the various sub-fragments and in their benefit to queries on the local site, better use of the Cache space can be made by only Caching the most valuable sub-fragments, thereby also reducing the overlap of fragments in the Cache.
When Cached data is aggregated, accurate Caching in OLAP is a difficult problem. There are many ways in which the goodness value of a fragment can be assigned, depending on the trade-off they provide between accuracy and speed. For example, fast and rough measures of computing goodness of a fragment could be the cost to retrieve it (Deshpande and Naughton, 2000). A slower and more exact measure is the benefit per unit space goodness (Kalnis and Papadias, 2001; Loukopoulos et al., 2001), whose complexity is quadratic in the number of views in the data cube lattice. There is also the added disadvantage in our scenario that it requires the User Agent to have knowledge about all of the fragments Cached by other User Agents on its site.
Our goal is to devise a goodness measure in combination with a Caching strategy which is efficient yet still takes into account the benefit of further aggregating a Cached fragment. The proposed Caching strategy maintains a priority queue of fragments in increasing order of goodness. Each time the Cache is accessed, the goodness of all items in the Cache is decreased (either by subtracting or dividing by a fixed amount), except for the one which is accessed, which has its goodness reset back to the original value and is repositioned in the priority queue. A fragment f is admitted to the Cache if space can be made for it by
evicting a set of fragments whose total goodness is less than that of f. Cache admission is described in Algorithm 4.
The purpose of this strategy, particularly with the decaying/refreshing of goodness values over time is that it adapts to the changing query demands of the users (e.g. view v is queried less, while view w begins to be queried more) but also accounts for the later Caching of descendants of a fragment. For example, if a fragment f is frequently aggregated in Cache for the purpose of computing fragments on descendant views, its goodness will frequently be refreshed to the original value and f will have a low chance of being evicted from Cache. However, if some fragments which are descendants of f become Cached and used instead, then f will be accessed less often; its goodness decaying until it is eventually evicted.
The goodness of a fragment should reflect the savings in query cost it provides at all levels of aggregation. This depends on both the quantity of savings and the relative frequency with which it is expected to occur. The quantity of savings in query cost that f provides is the relative difference between the cost it took to get f and the cost of answering future queries on f. Hence we define
savings(f) = cost(f) − query_cost(f) (1)
Since the User Agent which requested f is the one making the Caching decision, it can accurately compute cost(f) by recording the time taken to retrieve it. A User Agent will likely store the records in f on a contiguous space on disk without any specialised index, so query_cost(f) is modelled as the time it takes to read f from disk (the size of f in bytes divided by the disk bandwidth of the user storing it).
The benefit of aggregating f to other views needs to be taken into account. For example, a small fragment of one of the lower level views provides a large savings in query cost, but to only a very small proportion of all possible queries. By contrast, a large fragment of one of the higher level

176 F. Dehne, M. Lawrence and A. Rau-Chaplin
views provides a smaller savings in query cost, but can be used to compute a much larger proportion of the possible queries. We call the proportion of the data cube lattice that a fragment f covers in the feature dimension space at all levels of aggregation the volume of f. For example, if a fragment f covers half of the multidimensional area of a view v, but cannot be aggregated to produce fragments on any of v’s descendants, then f’s volume is 1/(2 × num_views). To describe how the volume of a fragment is computed, first consider the simple case of a data cube lattice with no dimension hierarchies. We use the same notation for fragments as Kotidis and Roussopoulos (2001), which is the same for that of a view (Section 2), except associated with each dimension is an interval Ii, specifying the range of values that the fragment contains for dimension i. A fragment f = ((I1, h1), (I2, h2),…,(Id, hd)) can be aggregated into a fragment on a view v = (a1, a2, …, ad) if, for each i such that hi = Di and ai = all, we have Ii; = (min(Di), max(Di)). Hence, if we let Global Dimensions, GD(f), be the set of all I, such that hi = Di and Ii = (min(Di), max(Di)), then f can be aggregated into fragments on a total of ( )2 GD f views. On each of these views, the fraction of multidimensional space that f covers is given by the product of the proportion of each dimension’s range selected by f, i.e.
all:
max( ) min( )max( ) min( )
i
i i
i h i i
I ID D
≠
−−∏
Hence, for the case with no dimension hierarchies, we have
all
( )
:
max( ) min( )2volume( )max( ) min( )2
i
GD fi i
di h i i
I If
D D≠
−=
−∏ (2)
of the total space of the data cube covered by a fragment f at all levels of aggregation.
When there are dimension hierarchies the volume calculation is slightly less straightforward, since it is not necessary to have Ii = (min(Di), max(Di)) to aggregate along a hierarchal dimension Di. For example, all products do not need to be selected to produce the aggregate for a particular subset of categories. Furthermore, the actual proportion of a dimension’s range which is selected by a fragment is slightly different at each level of the dimension’s hierarchy. The complete volume calculation for the case with dimension hierarchies requires enumerating all of the views to which f can be aggregated and examining the corresponding selection range on these levels. This increases the complexity of the volume calculation from linear in the no dimension hierarchies case, to exponential when there are hierarchies.
We approximate the true volume for the case of dimension hierarchies by using the selection range on a hierarchal dimension to approximate the corresponding selection range on all levels of the hierarchy. Hence, as in the non-hierarchal case, we multiply the number of possible aggregates of f by the product over all non-global dimensions of the fraction of the range selected of that dimension, approximating the proportion of each of the
views covered. To enumerate the number of possible views which the fragment can be further aggregated on, we count the number of levels l(hi) below the selected level hi of a dimension Di, including hi itself. For non-hierarchal dimensions Di, where either hi = Di or hi = all, we have l (Di) = 2. The number of possible aggregates of f is then
( ) ( )
( ) ( ( ) 1i ii GD f i GD f
l h l h∈ ∉
−∏ ∏
and the total volume of f is then
( ) ( )
: all
( ) ( ) 1 max( ) min( )volume( )
_ max( ) min( )i
i ii GD f i GD f i ii h
i i
l h l h I If
num views D D∈ ∉
≠
− −= ×
−∏ ∏
∏ (3)
The final goodness measure is
volume( ) savings( )goodness( )size( )f ff
f×
= (4)
Which gives a measure of the savings in query cost a fragment provides, weighted by the volume representing the probability with which these savings are expected to be applied, scaled to the storage space of the fragment.
6 Experimental evaluation
In this section we describe a prototype implementation of the proposed grid-enabled OLAP application and a careful evaluation of the performance of its Caching strategies. We focus on the tier1 query processing strategy and the FAR Cache search strategy of Algorithm 3. FAR is compared to the Cache search approach of Kotidis and Roussopoulos (1999) and Kotidis and Roussopoulos (2001), which we will refer to as Fragment Aggregation (FA). Their approach, like ours will aggregate fragments at higher levels in the lattice to produce a query result, however it differs in that a query must be answered by exactly one such Cached fragment and will not be broken further into sub-queries. Where as Kotidis argues that it does not pay to do this, our experiments aim to show that it can indeed be of substantial benefit to the users on a grid site under reasonable circumstances.
6.1 Implementation and experimental setup
We have fully implemented the Query Service, Distributed Cache Index Service, Cache Admission Controller, Collective Cache Service and Data Source Service. The Cache Services, Grid OLAP Services and OLAP Servers are simulated. The result is a working implementation of tier1 query processing and Caching on a single site, with the other sites and data being simulated by single OLAP Server entities. Our implementation is a parallel program written in the Python scripting language using MPI bindings. Although the choice of Python is inhibiting, given the computationally intensive nature of manipulating fragments and queries on a data cube lattice, it allowed the large implementation to be completed reasonably quickly without unduly affecting the explanatory power of the experiments.

Cooperative caching for grid-enabled OLAP 177
A diagram illustrating the software architecture of our implementation is shown in Figure 5. Each class is represented as a white rectangle, with classes which are programs being represented by a small grey rectangle. Entities are drawn as large grey rectangles and files as white rectangles with the corner cut-off. All of the classes to do with manipulation of the data cube and its properties are grouped into the Cube Manager. The Cube Manager acts on a single data cube lattice and schema which is constructed by the XSDParser as described below. The Cube Manager provides information about View instances and their organisation into a Lattice instance. The relevant information about views for our implementation are their size, dimensions, ranges of those dimensions and the mapping between ranges for dimensions organised into a hierarchy. Access to these properties and functions allows for manipulation of Query and Fragment instances over the lattice as required to perform the Cache search, indexing and simulation of aggregation/grouping of OLAP data.
Figure 5 The software design of our implementation of the proposed grid-based OLAP caching and query strategies
The XSDParser creates the Ranges, Dimensions, Views, Tables, HierarchyMaps, StarSchema and Lattice instances by reading the XML Schema file. Once the document has been parsed, the top-level view in the lattice is created by initialising a view with all of the feature dimensions of the fact table and creating all of the other views in a breadth-first manner from there. The number of records in each view is estimated using the technique of Shukla et al. (1996), which is based on dimension cardinalities and the number of records in the fact table.
Query and Fragment instances are defined by an associated view and a sub-range of each dimension’s overall range selected by the query or contained by the fragment. Fragments additionally have a size in bytes, calculated based on the estimated number of records in the fragment and data type of each dimension. A Query Generator program constructs streams of queries from various distributions and stores them on disk. Each stream consists
of a list of pairs (qi, ti) sorted in increasing order of ti and specifies that each query qi should be issued by the user at time ti.
The top of Figure 5 depicts the implementation of the entities in the grid. They communicate asynchronously, by posting and checking for messages inside an event loop. This allows users to serve Cache requests while waiting to receive their own query result fragments. The AggregationSim class is what simulates the actual answering of queries using views or Cached fragments. Each OLAP Server is initialised with a set of materialised views which will be used to answer incoming queries and builds an index associating each view v of the lattice to the smallest materialised parent parent(v) of that view. Incoming queries defined over v are then answered on parent(v) using the AggregationSim class to estimate how many MBs must be read from disk based on the size of the query when it is translated over parent(v). The AggregationSim instance of a User Agent simulates the time it takes to answer a query from a Cached fragment, which is proportional to the size of the fragment and the disk bandwidth of the user.
We abstract Cache contents by encapsulating fragments in the Cache Object class, which associates the goodness and size of a generic object to be Cached. The Cache class maintains the admission and eviction of Cache Objects as described in Algorithm 4, where a sorted list is used as the implementation of a priority queue.
The SiteBroker class implements the Site Broker, having a Cache Index instance which implements the FAR and FA Cache search strategies. Rather than use an R-tree implementation for indexing the fragments of a particular aggregate, we take the approach used by Kotidis et al. in their experimental evaluation and use a linked list of fragments. In our experiments the number of fragments stored in the Cache is small (less than 100 per view) and so we do not expect there to be a large performance penalty for this.
In our experiments, we use a test lattice having five feature dimensions: product, store, employee, customer and time, with the single measure dimension sales. The time dimension has a five-level hierarchy, while the product and customer dimensions have two- and three-level linear hierarchies, respectively. The total number of rows in the fact table is 10 million, resulting in a lattice with 288 views totalling 35 GB in storage size.
Two different types of query distributions are used in the experiments:
• Uniform: The queries are distributed uniformly amongst the views in the lattice, as well as the start and end of their selection ranges for each dimension. This is a difficult query load for Caching as there is no relationship between queries whatsoever.
• Hot regions: The hot region query distribution used by Kalnis et al. (2002), Lawrence (2006) represents a more realistic scenario where a subset of the aggregates are of particularly high interest to the users. 80% of the queries are (uniformly) distributed amongst a ‘hot

178 F. Dehne, M. Lawrence and A. Rau-Chaplin
region’ of 20% of the views (uniformly chosen) in the lattice. The selection ranges on queries also follow a hot region distribution, where each dimension’s overall range is divided into 100 buckets, each having a weight drawn from a hot region distribution. For each dimension of each query, two buckets are selected with probability proportional to their weights. The minimum of the selection range is the beginning of the bucket which occurs first, while the maximum of the selection range is the end of the bucket which occurs last. In order to deal with hierarchies, the weight of a bucket at a level is defined as the sum of the weights of all overlapping buckets at the level below.
A stream of n queries from either of these distributions is generated by selecting a time frame in which the queries will be posed, uniformly selecting n random times in this time frame and generating the queries for each of the selected times according to the given query distribution.
Each User is configured with a specified Cache size in bytes, a disk bandwidth in MB/s, a query stream and optionally a list of fragments with which to initially fill the Cache. Each OLAP Server is configured with a disk bandwidth in MB/s, a network bandwidth to the local site in MB/s, a fragment of the fact table which specifies the partition of the overall data maintained by that OLAP Server and a list of materialised views at that OLAP Server.
Most of our tests use the Detailed Cost Savings Ratio (DCSR) measure Kotidis and Roussopoulos (2001)
( ( ) ( ))
( )nocache cacheq
q nocache
time q time qDCSR
time q
−=
∑∑
which measures the reduction in overall query time achieved by the Cache as a percentage of query time without a Cache. In order to achieve this we implemented a version of the system with no Caching components.
6.2 DCSR vs. Cache size The first set of tests aims to determine the Cache search strategies’ ability to make effective use of increasing Cache space. The parameters for this experiment are summarised in Table 1. We execute five independent runs using five different hot region distributions. For each run, each user has a set of fragments with which to initially warm the Cache which are generated from the same hot region distribution and the size of each user’s Cache is varied from 50 MB to 500 MB in increments of 50 MB, so that the Site Broker indexes 500 MB of fragments at the minimum and 5000 MB of fragments at the maximum, or between 1.4% and 14% of the size of the entire data cube lattice. The DCSR of both FAR and FA as Cache size is increased as shown in Figure 6.
The FAR strategy allows a significant query time reduction of 50% to 60% for Caches between 50 and 250 MB in size. For larger Cache sizes the benefits of the FAR approach begin to wane due to the increased cost of
the Cache search and number of separate requests which must be made for each query, although it is still more beneficial than the FA approach up to a Cache size of 350 MB per user. This is discussed in more detail below.
Figure 6 The DCSR measure of Cache effectiveness for the FAR and FA Cache search strategies as Cache size per user is increased
Table 1 A summary of the parameters used in the first experiment measuring DCSR vs. Cache size
Parameter Value
Number of dimensions 5 (3 hierarchical) Lattice size 35GB over 288 views Duration of simulation 2 h Number of users 10 Queries per user 10 Query distribution Hot region User disk bandwidth 20 MB/s Average query result size 3.34 MB Cache size per user 50 to 500 MB Number of OLAP Servers 5 OLAP Server disk bandwidth
80 MB/s
OLAP Server materialized views
14 randomly chosen
OLAP Server network bandwidth
1 local (900 kb/s), 4 remote (100 kb/s)
Surprisingly, the FA approach makes little gain with the additional Cache space, climbing from little under 27% at 100 MB to a peak at nearly 35% at 400 MB. Thus, either the increase in Cache size does not mean substantially more queries can be answered from a Cache, or the benefit in answering a query from a Cache over answering it at the OLAP Servers is not substantial. Figure 7, which shows the percentage of all queries which are answered from local Caches as the Cache size is increased, demonstrates that the former may be the cause.

Cooperative caching for grid-enabled OLAP 179
Figure 7 The percentage of queries which are answered from a locally Cached fragment for the FA strategy as Cache size per user is increased
The percentage of queries answered from Cache increases from 3.8% to 17.8%, which is not a substantial increase as compared to the increase in Cache space. Examining the actual query times shows that for this configuration, queries answered from local Caches using the FA approach take roughly 5.5 s to complete on average, where as the queries answered from the OLAP Servers take roughly 26.5 s on average. This difference is not substantial enough for the increase of queries answered from Cache to have a significant impact on the cost savings for the FA approach. For our strategy, the increase in Cache size does not only allow a larger proportion of the queries to be answered from Cache, but also allows the local query computation to be executed more quickly since the distribution of Cache requests over the local users allows it to be performed in parallel.
In order to more precisely examine FAR’s failure for large Caches we have further broken down average query time into three components:
1 queue time: since the Site Broker might receive more queries than it can produce fragmentation plans for in a given time period, some queries may spend time waiting in the communication queue of the Site Broker
2 search time: the time it takes from when the Site Broker begins the FAR Cache search to when the fragmentation plan is received by the user
3. backend time: the length of the time period from when the user receives the fragmentation plan from the Site Broker to when it has received all of the necessary sub-fragments.
The average query time for the FAR approach broken down into these three components as Cache size is increased is shown in Figure 8. For the 50 MB Caches, the queuing time of queries is insignificant, as the Site Broker is able to keep up with the number of requests it receives.
There is a large reduction in time at the backend from the 50 MB to the 100 MB Caches, coupled with only a small increase in search time and a minor increase in
queuing time (about 1/2 s on average), causing the overall query time to be lower. As the Caches increase in size from 100 MB however, the backend time decreases more gradually than the increase in Cache search time and the resulting increase in queue time, causing the overall query time to grow. The backend time appears to increase as well, but this is due to the larger number of requests which are sent for sub-fragments of a query. There is a substantial increase in query time from 350 to 400MB, where the Cache search time makes a large jump of roughly 2.5 s causing the Site Broker to be completely overwhelmed and consequently fail to service its queue in a reasonable length of time. The dip at 450MB is due to the Cache search time being about 1 s faster than in the 400 MB case, causing a nearly 3 s reduction in average queue time. A likely reason for the reduction in Cache search time is due to the difference in warmed Cache contents at the start of the simulation. With ten users each having an additional 50 MB of Cache space, the additional 500 MB of fragments in the warmed Caches has an effect on the Cache search time. While the Cache search time is usually expected to increase, the nature of the fragments may be such that gaps are filled in, causing a larger number of Cache searches to conclude before the top of the lattice is reached.
Figure 8 The average query time of the FAR approach vs. Cache size, broken down into queue time, search time and backend time
6.3 Cache warming The previous tests were performed with the Cache pre-loaded with a set of fragments drawn from the same distribution as the queries themselves. It is also important to examine the behaviour of a system starting with a cold Cache and how this changes over time as the Cache warms up.
For the Cache warming phase, the same parameters are used as in the previous experiment, except the Cache sizes are fixed at 100 MB for each user and the simulation lasts 8 h during which time each user issues 40 queries. Ten independent runs are performed and the cost savings for each query is measured in the sequence. If qi,j,k is the ith user’s jth query during the kth independent run, then for each 1 ≤ j ≤ 40 we measure
180 F. Dehne, M. Lawrence and A. Rau-Chaplin
, , , ,,
, ,,
( ) ( )
( )nocache i j k cache i j ki k
jnocache i j ki k
time q time qDCSR
time q
−=
∑∑
The results are shown in Figure 9. For the FAR strategy, there is a general trend towards a higher cost savings for the later queries in the sequence, suggesting that they benefit from the Cached results from earlier queries.
Figure 9 The DCSR of the FAR and FA Cache search over a sequence of 40 queries
The results are quite noisy for the reason that each point on the plot is computed from the results of a set of 100 queries, all of which are different from that of each other point on the plot. In contrast, the previous tests only varied the Cache sizes while the queries remained the same. There is a large sample variance between the times of individual queries: 3404, 6240 and 6299 s on average for the FAR, FA and no Cache strategies respectively, resulting in highly variable cost savings. This plot does yield the conclusion that for the FAR strategy there is a savings and that it does increase as the Cache is filled, but we also observe that the quantity of savings appears to depend more on the specifics of the query than on the fullness of the Cache.
6.4 Uniform queries The tests in Section 6.2 used a query distribution where the users had a particular interest in a small subset of the views in the lattice and in particular values of their dimensions. This is a relatively favourable situation for Caching as there is some relationship amongst the queries. A much less favourable situation for Caching is when the queries are completely independent.
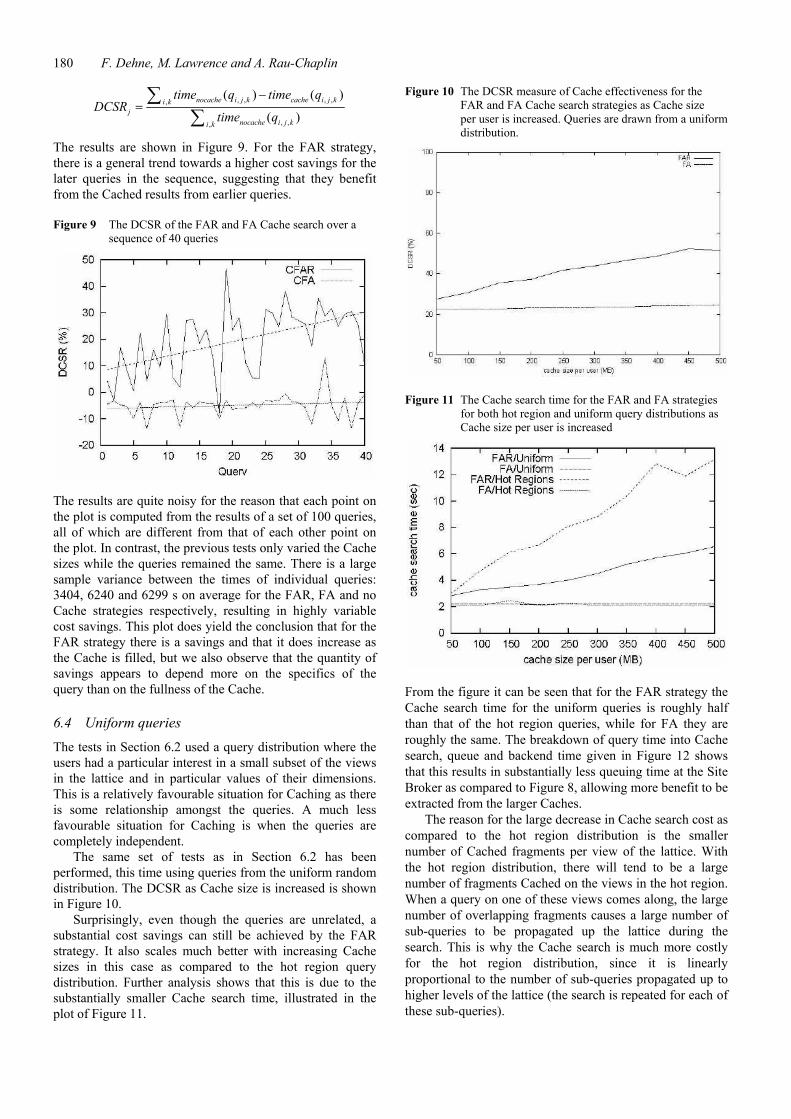
The same set of tests as in Section 6.2 has been performed, this time using queries from the uniform random distribution. The DCSR as Cache size is increased is shown in Figure 10.
Surprisingly, even though the queries are unrelated, a substantial cost savings can still be achieved by the FAR strategy. It also scales much better with increasing Cache sizes in this case as compared to the hot region query distribution. Further analysis shows that this is due to the substantially smaller Cache search time, illustrated in the plot of Figure 11.
Figure 10 The DCSR measure of Cache effectiveness for the FAR and FA Cache search strategies as Cache size per user is increased. Queries are drawn from a uniform distribution.
Figure 11 The Cache search time for the FAR and FA strategies for both hot region and uniform query distributions as Cache size per user is increased
From the figure it can be seen that for the FAR strategy the Cache search time for the uniform queries is roughly half than that of the hot region queries, while for FA they are roughly the same. The breakdown of query time into Cache search, queue and backend time given in Figure 12 shows that this results in substantially less queuing time at the Site Broker as compared to Figure 8, allowing more benefit to be extracted from the larger Caches.
The reason for the large decrease in Cache search cost as compared to the hot region distribution is the smaller number of Cached fragments per view of the lattice. With the hot region distribution, there will tend to be a large number of fragments Cached on the views in the hot region. When a query on one of these views comes along, the large number of overlapping fragments causes a large number of sub-queries to be propagated up the lattice during the search. This is why the Cache search is much more costly for the hot region distribution, since it is linearly proportional to the number of sub-queries propagated up to higher levels of the lattice (the search is repeated for each of these sub-queries).

Cooperative caching for grid-enabled OLAP 181
Figure 12 The average query time of the FAR approach vs. Cache size, broken down into queue time, search time and backend time. Queries are drawn from a uniform distribution
7 Conclusions
We have presented a cooperative Caching scheme for the OLAP-enabled grid in which the user Caches are distributed amongst the grid sites and cooperate in order to increase the efficiency of OLAP query processing. We have proposed an efficient localised Cache admittance scheme which uses a decay and refresh mechanism for controlling admission to and eviction from the Cache and a fast, aggregate-aware goodness metric for incoming fragments. We have experimentally evaluated our Caching scheme comparing it against previous methods (e.g. which do not recombine multiple fragments to answer a query) and found our strategy to produce a higher saving in query time, even when the queries are uniformly distributed. Given that our prototype implementation performs well, the natural next step is to explore the performance of our OLAP-enabled grid in a full implementation within the context of a standard grid toolkit such as Globus.
References
Brezany, P., Tjoa, A.M., Rusnak, M., Brezanyova, J. and Jan-ciak, I. (2003) ‘Knowledge grid support for treatment of traumatic brain injury victims’, Proceedings of ICCSA’03.
Chen, Y., Dehne, R., Eavis, T. and Rau-Chaplin, A. (2004) ‘Parallel ROLAP data cube construction on shared-nothing multiprocessors’, Distr. and Par. Databases, Vol. 15, pp.219–236.
Dehne, E, Eavis, T. and Rau-Chaplin, A. (2003) ‘Parallel multi-dimensional ROLAP indexing’, Proceedings of CCGrid’03,, IEEE, pp.86–93.
Dehne, R, Eavis, T. and Rau-Chaplin, A. (2006) ‘The cgm-CUBE project’, Distr. and Par. Databases, Vol. 19, No. l, pp.29–62.
Dehne, R., Lawrence, M. and Rau-Chaplin, A. (2007) ‘Cooperative caching for grid based datawarehouses’, Proceedings of IEEE/ACM Int. Symp. on Cluster Computing and the Grid (CCGrid), IEEE Comp. Soc. Dig. Library, pp.31–38.
Deshpande, P. and Naughton, J.R (2000) ‘Aggregate aware caching for multi-dimensional queries’, Proceedings of EDBT’00.
Dubitzky, W., McCourt, D., Galushka, M., Romberg, M. and Schuller, B. (2004) ‘Grid-enabled data warehousing for molecular engineering’, Par. Comp., Vol. 30, No. 9–10, pp.1019–1035.
Fiser, B., Onan, U., Elsayed, I., Brezany, P. and Tjoa, A.M. (2004) ‘On-line analytical processing on large databases managed by computational grids’, Proceedings of DEXA’04, Washington, DC, USA. IEEE Comp. Soc, pp.556–560.
Foster, I., Kesselman, C. and Tuecke, S. (2001) ‘The anatomy of the Grid: Enabling scalable virtual organizations’, J. of High Performance Comp. Applications, Vol. 15, No. 3, pp.200–222.
Harinarayan, Y., Rajaraman, A. and Ullman, J.D. (1996) ‘Implementing data cubes efficiently’, Proceedings of SIGMOD’96.
Kalnis, P., Ng, W.S., Ooi, B.C., Papadias, D. and Tan, K-L. (2002) ‘An adaptive peer-to-peer network for distributed caching of olap results’, Proceedings of. SIGMOD’02.
Kalnis, P. and Papadias, D. (2001) ‘Proxy-server architectures for olap’, Proceedings of SIGMOD’01, , New York, NY, USA, ACM, pp.367–378.
Kotidis, Y. and Roussopoulos, N. (1999) ‘Dynamat: a dynamic view management system for data warehouses’, Procedings of SIG-MOD’99,, ACM, pp.371–382.
Kotidis, Y. and Roussopoulos, N. (2001) ‘A case for dynamic view management’, ACM Trans. Database Syst., Vol. 26, No. 4, pp.388–423.
Lawrence, M. (2006) ‘Multiobjective genetic algorithms for materialized view selection in olap data warehouses’, Proceedings of GECCO’06.
Lawrence, M., Dehne, R. and Rau-Chaplin, A. (2007) ‘Implementing OLAP query fragment aggregation and recombination for the OLAP enabled grid’, Proceedings of International Parallel and Distributed Processing Symposium (IPDPS), High-Performance Grid Computing Workshop, IEEE Comp. Soc. Dig. Library, pp.1–8.
Lawrence, M. and Rau-Chaplin, A. (2006). The OLAP-enabled grid: model and query processing algorithms’, Proceedings of HPCS’06.
Loukopoulos, T., Kalnis, P., Ahmad, I. and Papadias, D. (2001) ‘Active caching of on-line-analytical-processing queries in www proxies’, Proceedings of ICPP’01, pp.419–426. IEEE.
Narravula, S., Jin, H-W., Vaidyanathan, K. and Panda, D.K. (2006) ‘Designing efficient cooperative caching schemes for multi-tier data-centers over rdma-enabled networks’, Proceedings of CCGrid’06, IEEE, Los Alamitos, CA, USA, pp.401–408..
Niemi, T., Niinimaki, M., Nummenmaa, J. and Thanisch, P. (2002) ‘Constructing an OLAP cube from distributed XML data’, Proceedings of DOLAP’02.
Niemi, T., Niinimaki, M., Nummenmaa, J. and Thanisch, P. (2003) ‘Applying grid technologies to XML based OLAP cube construction’, Proceedings of DMDW’03.
Orlando, S., Palmerini, P., Perego, R. and Silvestri, R. (2002) ‘Scheduling high performance data mining tasks on a data grid environment’, Proceedings of Euro-Par’02.
Park, S. and Kim, J. (2003) ‘Chameleon: a resource scheduler in a data grid environment’, Proceedings of CCGrid’03. IEEE.
Shukla, A., Deshpande, P., Naughton, J.R. and Ramasamy, K. (1996) ‘Storage estimation for multidimensional aggregates in the presence of hierarchies’, The VLDB Journal, pp. 522–531.
Wolski, R., Spring, N.T. and Hayes, J. (1999) ‘The network weather service: a distributed resource performance forecasting service for metacomputing’, Future Gener. Comput. Syst., Vol. 15, No. 5–6 pp.757–768.