IJES I Vol. 1 J E S
8
Improving the accuracy of fracture modeling in carbonate reservoirs X-field in SW of Iran Seyyedeh Ellieh Moafi Madani 1 , Hossein Hassani* 1 , Behzad Tokhmechi 2 1. Department of Mining and Metallurgical Engineering, Amirkabir University of Technology, Tehran, Iran 2. Department of Mining and Metallurgical Engineering, Shahroud University of Technology, Shahroud, Iran Received 9 October 2018; accepted 4 Jun 2019 Abstract Fracture modeling is one of the most important steps in the study of fractured reservoirs. Due to the high cost of imaging logs and their absence in most wells of the study area, it is often attempted to use other available data to detect fractures. This paper attempts to investigate the relationship between the lithology and fractures of rocks. For this purpose, the Image, Neutron, Density, Litho- density, and NGS logs have used to simulate the lithology. Based on this feature, the studied area was divided into six homogeneity part, and the fracture probability was determined in each section to improve the accuracy of fracture modeling. Recently, an intelligent method has been proven as an efficient tool for modeling complex and non-linear phenomena. In this paper, neural network methods has been used in fracture modeling. The results show that the division of the field based on lithological studies will improves the accuracy of fracture modeling in the studied area up to 7 percent without increasing the cost of image logging. Keywords: Fracture modeling, Lithology, Petroleum, Neural network. 1. Introduction Fractures are the most important geological features that affect the production from the most carbonate reservoirs. Large volumes of hydrocarbon resources in the world are located in fractured reservoirs which are the major supplier of energy. Fractures play an important role in reservoir property and hydrocarbon migration (McQuillan 1973; Coward et al. 1998; Parnell 1998; Haneberg et al. 1999; Atilla 2000; Nian et al. 2017). Natural fracture systems have a great influence on the permeability of most carbonate reservoirs. Some hydrocarbon reservoirs with low efficiency, have a favorable production due to the transfer of liquids into wells by natural fractures. In some reserves, fractures and faults are necessary for the initial migration of hydrocarbons from source rocks (Hunt and Tucker 1992; Javadi et al. 2016; Shafiei et al. 2018). Fractures and faults are also influential factors of hydrocarbons trapping. Although fracture detection in reservoirs is an important step, it is not easy to determine how these structures affect the fluid flow of the reservoir. Due to the complexity of the fractures and the variability of their behavior in trapping, migration, and flow of hydrocarbons, their evaluation is a very complicated task (Aydin et al. 1998; Jingsong et al. 2016; Zuo et al 2019). Each structures which are created in special geological and geomechanical conditions, have their own geometries (orientation and dimensions), distances, distributions, permeabilities and hydraulic properties that cause migration or trapping of hydrocarbons. Most joints and fractures in the upper crust are formed in --------------------- *Corresponding author. E-mail address (es): [email protected] conjunction with ground forces from the local construction (Pollard and Aydin 1988). They are usually found in categories that include a large number of approximately parallel joints in fractured rock units (Helgeson and Aydin 1991; Gross et al. 1995). Since these joints are confined to the boundaries of the layers, lithological unit contributions to the flow of hydrocarbon are different from each other. However, if the joints create a network of fractures that have an appropriate opening, length, distance, connection, and distribution, they can contribute to the permeation and production of the reservoir. For example, it has been proved that the joints found in the sandstone reservoir in the Piceance Basin of Colorado have caused the permeability of the reservoir rock to be 10 times higher (Lorenz et al. 1988; Eichhubi 2009). The complex fracture process that occurs due to the changing geological conditions will create different patterns of fracture and characteristics of the natural fractured reservoirs. Most rocks are simultaneously and continuously deformed and created complex fracture systems, which is why it is not easy to identify the features of their fractures. Therefore, for the study of the fractures, it is necessary to collect a wide range of data, including geological, geophysical, petrophysical and drilling data (Gouth et al. 2006; Berre et al. 2018). So far, many methods have been developed to study the relationship between different parameters and fractures. The equivalent fracture models based on the mimetic finite difference method yields comparable results with those based on the standard finite volume method. Whereas their accuracy is influenced by the orientations of sparsely distributed fractures. The influence of the fracture network pattern on the accuracy of equivalent IJES Iranian Journal of Earth Sciences Vol. 12, No. 2, 2020, 133-140.
Transcript of IJES I Vol. 1 J E S

Improving the accuracy of fracture modeling in carbonate
reservoirs X-field in SW of Iran
Seyyedeh Ellieh Moafi Madani1, Hossein Hassani*
1, Behzad Tokhmechi
2
1. Department of Mining and Metallurgical Engineering, Amirkabir University of Technology, Tehran, Iran 2. Department of Mining and Metallurgical Engineering, Shahroud University of Technology, Shahroud, Iran
Received 9 October 2018; accepted 4 Jun 2019
Abstract Fracture modeling is one of the most important steps in the study of fractured reservoirs. Due to the high cost of imaging logs and
their absence in most wells of the study area, it is often attempted to use other available data to detect fractures. This paper attempts to investigate the relationship between the lithology and fractures of rocks. For this purpose, the Image, Neutron, Density, Lit ho-density, and NGS logs have used to simulate the lithology. Based on this feature, the studied area was divided into six homogeneity part, and the fracture probability was determined in each section to improve the accuracy of fracture modeling. Recently, an intelligent method has been proven as an efficient tool for modeling complex and non-linear phenomena. In this paper, neural network methods has been used in fracture modeling. The results show that the division of the field based on lithological studies will
improves the accuracy of fracture modeling in the studied area up to 7 percent without increasing the cost of image logging. Keywords: Fracture modeling, Lithology, Petroleum, Neural network.
1. Introduction Fractures are the most important geological features that
affect the production from the most carbonate reservoirs. Large volumes of hydrocarbon resources in
the world are located in fractured reservoirs which are
the major supplier of energy. Fractures play an
important role in reservoir property and hydrocarbon
migration (McQuillan 1973; Coward et al. 1998; Parnell
1998; Haneberg et al. 1999; Atilla 2000; Nian et al.
2017). Natural fracture systems have a great influence
on the permeability of most carbonate reservoirs. Some
hydrocarbon reservoirs with low efficiency, have a
favorable production due to the transfer of liquids into
wells by natural fractures. In some reserves, fractures
and faults are necessary for the initial migration of hydrocarbons from source rocks (Hunt and Tucker
1992; Javadi et al. 2016; Shafiei et al. 2018). Fractures
and faults are also influential factors of hydrocarbons
trapping. Although fracture detection in reservoirs is an
important step, it is not easy to determine how these
structures affect the fluid flow of the reservoir. Due to
the complexity of the fractures and the variability of
their behavior in trapping, migration, and flow of
hydrocarbons, their evaluation is a very complicated
task (Aydin et al. 1998; Jingsong et al. 2016; Zuo et al
2019). Each structures which are created in special geological
and geomechanical conditions, have their own
geometries (orientation and dimensions), distances,
distributions, permeabilities and hydraulic properties
that cause migration or trapping of hydrocarbons. Most
joints and fractures in the upper crust are formed in
--------------------- *Corresponding author. E-mail address (es): [email protected]
conjunction with ground forces from the local
construction (Pollard and Aydin 1988). They are usually
found in categories that include a large number of
approximately parallel joints in fractured rock units
(Helgeson and Aydin 1991; Gross et al. 1995). Since these joints are confined to the boundaries of the layers,
lithological unit contributions to the flow of
hydrocarbon are different from each other. However, if
the joints create a network of fractures that have an
appropriate opening, length, distance, connection, and
distribution, they can contribute to the permeation and
production of the reservoir. For example, it has been
proved that the joints found in the sandstone reservoir in
the Piceance Basin of Colorado have caused the
permeability of the reservoir rock to be 10 times higher
(Lorenz et al. 1988; Eichhubi 2009). The complex fracture process that occurs due to the
changing geological conditions will create different
patterns of fracture and characteristics of the natural
fractured reservoirs. Most rocks are simultaneously and
continuously deformed and created complex fracture
systems, which is why it is not easy to identify the
features of their fractures. Therefore, for the study of the
fractures, it is necessary to collect a wide range of data,
including geological, geophysical, petrophysical and
drilling data (Gouth et al. 2006; Berre et al. 2018).
So far, many methods have been developed to study the
relationship between different parameters and fractures. The equivalent fracture models based on the mimetic
finite difference method yields comparable results with
those based on the standard finite volume method.
Whereas their accuracy is influenced by the orientations
of sparsely distributed fractures. The influence of the
fracture network pattern on the accuracy of equivalent
IJES
Iranian Journal of Earth Sciences Vol. 12, No. 2, 2020, 133-140.

Moafi Madani et al. / Iranian Journal of Earth Sciences, Vol. 12, No. 2, 2020, 133-140.
134
fracture models. The relative difference between the
equivalent fracture model and the discrete fracture
model is 1 % - 3 %. The equivalent fracture model with
the mimetic finite difference method yields a smaller
relative difference than that with the finite volume
method. However, based on the same grid block
dimension and the petrophysical parameters, when the
fracture pattern changes from parallel to non-parallel,
the relative difference increased to 5% - 7% (Chen et al.
2017). The use of image logs and their relationship with
other logs can help to identify the network of fractures.
The determination of linear and nonlinear regression between logs can be used to improve the accuracy of
fracture modeling. In order to find a generalized
estimator, a unique normalization method are
developed, and by using it, a non-linear regression has
been found which estimates fracture density with
correlation coefficient of higher than 80%. The resultant
regression has the capability of generalization in the
studied field (Tokhmchi et al. 2010).
The reservoir zoning approach based on lithological
units can improve fracture modeling accuracy. One of
the models used in this regard is the ARX model (Shiri et al. 2012). Another method for extracting information
from the data obtained from the logs is the Parzen and
wavelet combination method. The results of the study
showed that the wavelet transform and the Parzen
classification were the best combination techniques used
for vuggy zones detection. According to the results, the
method can be generalized with a total accuracy of 52–
99% (average 75%) (Asgari Nezhad et al. 2014).
Image logs are kind of modern loges that can be used
for detecting fractures crosscutting with the well
(Khoshbakht et al. 2012). Therefore, determining the
relationship between these logs and other available data can greatly help to improve the fracture model.
Due to the fact that lithology is one of the factors
affecting the fracture network, the study of lithology and
its relationship with fractures can improve the fracture
modeling accuracy. since, its possible to determine the
lithology in all wells using petrophysical methods, it is
possible to predict the changes in fractures due to
lithological changes in the field (Aghli et al. 2016)
based on determined relationship between lithology and
fractures. This will be valuable when the FMI and FMS
data are not available for wells. In this paper, this relationship is examined and the
results are presented. In this study, geostatistical
methods and neural network methods have been used.
The study area is located in the southwest of Iran. The
recognition of features related to basement tectonics and
realization of their implication in the control and
modification of geological processes are important
adjuncts to the search for hydrocarbon accumulations in
this region (Rahnama-Rad et al. 2009). The field is
parallel to the general folding of the region (northwest -
south east). In order to verify the field, 24 wells were
drilled in it. Image logs were provided in two of the
wells and core information is available in six of the
wells. The aim of this study is investigating the
relationship between lithology and fractures in these two
wells and to use the results in other wells.
2. Methodology 2.1. Used data
The fracture model is mainly made using static data
such as image logs and cores. Using existing data can
play an important role in improving the model accuracy
and reducing fracture modeling errors. The lithology of
studied area is mainly composed of limestone, dolomite,
anhydrite and shale. According to the above
combination and modeling simplification, it was decided to define 6 main lithological units this area
(Table 1). According to the table 1 to simplify and
prevent the increase in the number of lithologies the
Carbonate has been used for dolomite, limestone or a
combination of these two (codes 2 and 4). The lithology
of limestone-dolomite (code 5) is also composed of a
considerable amount of lime and dolomite.
Table 1: Petrology defined for study area and their code Lithology code Color
Limestone 0 Blue
Dolomite 1 Purple
shaly carbonate 2 Gray
Anhydrite 3 Green
Anhydritic carbonate 4 Yellow
Dol-limestone 5 Red
2.2. Neural network
An artificial neural network is a data processing system
that is thought of as a human brain. In this network data
processing is handled by small and large processors that
deal with each other in an interconnected and parallel
network to solve a problem. Different methods have been designed to construct problem-solving by the
neural network. Here the training method with the
supervisor is used. In this method, for each category of
input patterns, the corresponding outputs are also shown
to the network and weights are changed until the
difference between the output of the network and the
training patterns of the desired outputs is as acceptable
as the error. The goal is to design a network that first
learns using existing educational data and then by
providing a vector input to the network which may or
may not has already been acquired by the network Class is detects. Such a network is widely used for pattern
recognition tasks. The following data was used as the
network input:
- Image log
The image logs are one of the most powerful tools for
exploration, drilling and development of oil reservoirs.
- Sonic logs
One of the most important markers of fractures is the
vibration of sound waves inside and around the well.
- Neutron log
Neutron diagrams by measuring the amount of neutron
Moafi Madani et al. / Iranian Journal of Earth Sciences, Vol. 12, No. 2, 2020, 133-140.
135
capture generated from a neutron source measured the
ionic concentration of hydrogen in the formation. This
graph calculates the total porosity and in the presence of
an open fracture present an anomaly in this chart.
- Density log
In this type of diagram, the formation density which is a
function of rock type and porosity, is measured by
gamma radiation by the device and the gamma radiation
recorded from the formation is measured.
- Litho density log
This tool is known as the photoelectric diagram and can
use to identify the mineralogy of the formation. Determination of photoelectric absorption cross-section
using LDT tool can be used in wells drilled with barite
to detect mud flood and the rate of mud thinning in low
porosity zones.
- Natural Gamma Spectrometry (NGS)
In addition to measuring total radioactivity, NGS charts
measure the energy level of gamma rays emitted from
the formation. In fractured reservoirs, increase of
gamma rays or shale line without increasing shale
volume may be observed due to the deposition of
uranium salts at the fractures-due to rotation of hydrothermal waters or groundwater. Therefore,
uranium peaks can be used to diagnose fractures.
2.3. Combine data and modeling
The preparation of the 3D lithology model has many
applications in geological sciences. One of these
applications is the use of lithology and fracture
relationship in improving the fracture model. For this
purpose, this paper examines this relationship and its
application. At first, raw data was analyzed to obtain a
proper understanding of their profile and distribution.
One of the charts that provides proper information on the vertical distribution of lithology is the probability
curves which are located in the place of all wells for all
layers and zones. In this curves, the percentage of
lithology for each individual layer was calculated. As a
result, the topography has been removed and therefore it
will be suitable for stratigraphic and sedimentary
interpretation. Subsequently, according to the modeling
methods, the data were scaled up to the large reservoir
network and then analyzed. In this process, any
lithologic code which has the most repetition in a cell
was selected for the cell. The average height of each layer in this study is 3 meters and there are 6 data for
each 15 centimeters, so at scale up stage, the average of
all 18 lithology codes was converted to a code and
attributed to the corresponding cell. Using the main logs
that represents lithological changes (Neutrons, Density,
Photoelectric factor, Gamma and Sonic) and also the
definition of six classes that are equivalent to six
lithologies defined in wells, the neural network was
trained. Finally, for all the wells and intervals that the
above logs were available, lithology was determined
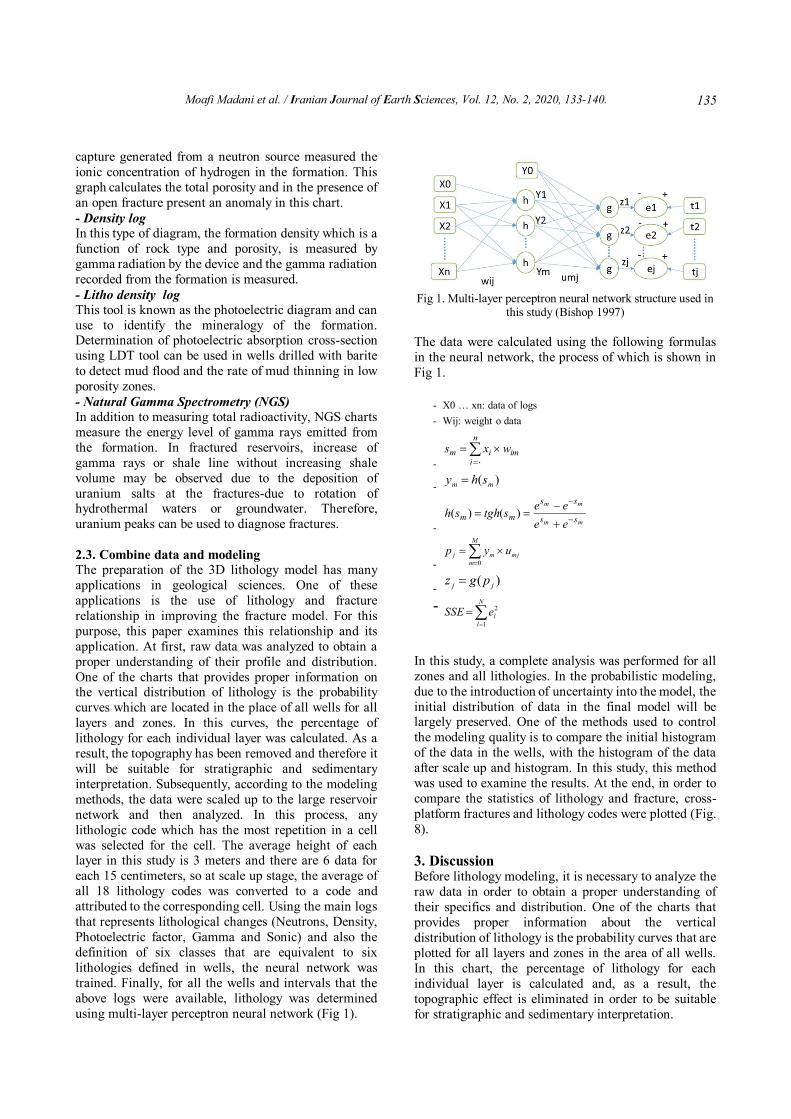
using multi-layer perceptron neural network (Fig 1).
Fig 1. Multi-layer perceptron neural network structure used in
this study (Bishop 1997)
The data were calculated using the following formulas
in the neural network, the process of which is shown in
Fig 1.
- X0 … xn: data of logs
- Wij: weight o data
-
n
iimim wxs
0
- )( mm shy
- mm
mm
ss
ss
mmee
eestghsh
)()(
-
M
m
mjmj uyp0
- )( jj pgz
-
N
l
leSSE1
2
In this study, a complete analysis was performed for all
zones and all lithologies. In the probabilistic modeling,
due to the introduction of uncertainty into the model, the
initial distribution of data in the final model will be largely preserved. One of the methods used to control
the modeling quality is to compare the initial histogram
of the data in the wells, with the histogram of the data
after scale up and histogram. In this study, this method
was used to examine the results. At the end, in order to
compare the statistics of lithology and fracture, cross-
platform fractures and lithology codes were plotted (Fig.
8).
3. Discussion Before lithology modeling, it is necessary to analyze the
raw data in order to obtain a proper understanding of
their specifics and distribution. One of the charts that
provides proper information about the vertical
distribution of lithology is the probability curves that are
plotted for all layers and zones in the area of all wells.
In this chart, the percentage of lithology for each
individual layer is calculated and, as a result, the
topographic effect is eliminated in order to be suitable
for stratigraphic and sedimentary interpretation.

Moafi Madani et al. / Iranian Journal of Earth Sciences, Vol. 12, No. 2, 2020, 133-140.
136
Fig 2. Lithology prospect diagram for different layers at the site of all wells for which lithology has been defined
Fig 3. scale up lithology in the reservoir network
On the other hand, in the 3D modeling of lithology, a
similar vertical distribution can be reconstructed. In
figure 2, the probability curve for all studied layers is
shown. It should be noted that this chart is before the modeling, and it is only related to the location of the
wells.
In modeling process, the data must be scaled up in
reservoir network and then must be thoroughly
analyzed. Figure 3 shows scale up lithologies in the
reservoir network for the study area. As shown in this
figure, good 3D modeling has been achieved due to the
high number of data and proper dispersion. In this study,
lithology was identified using available logs. For this
purpose, the Neutrons, Density, Photoelectric factor,
Gamma and Sonic logs used to characterize lithological changes. Six classes were defined for lithology. Finally
neural network was trained, for studied area where the
above logs were available. Then the lithology was
determined and acceptable results were obtained.
The lithology obtained from the neural network in the
first column from the right, the linguistics interpreted by
the interpreter in the second column and the logs in the
subsequent columns are shown in figure 4. As seen in
this figure lithology obtained from the neural network
have acceptable adaptations to the interpreted lithology.
The SIS algorithm (Sequential Indicator Simulation)
was used and the lithology probability was simulated as
shown in figure 5. In this model, the vertical distribution of data is preserved. Due to the uncertainty of the areas
with lower data they not used in geological
interpretations. Because of the characteristics of
probabilistic simulations, the resulting model is non-
homogeneous and there is severe changes in the
boundary between lithologies. However, probabilistic
modeling also has some advantages including due to the
introduction of uncertainty into the model the initial
distribution of data in the final model will be largely
preserved.
One of the methods used to control the modeling quality is to compare the histogram of the initial data, with the
histogram of the scale up data and the modeling
histogram, as shown in figure 6. In figure 5, six codes
from 0 to 5 represent the six petrography given in Table
1. As seen in this figure, there is a good similarity
between the distributions of data in these three stages. In
figure 7, which is constructed along the axis of the
structure, the heights or the old lines and the hills
around them are well defined.

Moafi Madani et al. / Iranian Journal of Earth Sciences, Vol. 12, No. 2, 2020, 133-140.
137
Fig 4. logs and lithology interpreted by the interpreter and lithology computed by the neural network
Since the amount of dolomite in the southern edge of
the anticline is greater than the northern edge and because dolomite is more brittle therefore, the degree of
fracture in the southern edge is higher. It is worth noting
that some dolomitization may be related to the fracture.
This means that the flow of fluid through fractures leads
to secondary dolomitization which occurs after folding. The next step is to compare the lithology and fracture
statistics. Cross-Plot of the severity of fractures and
lithology codes were plotted as shown in figure 8.

Moafi Madani et al. / Iranian Journal of Earth Sciences, Vol. 12, No. 2, 2020, 133-140.
138
Fig 5. 3D lithology mode prepared by simulation algorithm
Fig 6. lithology histogram at the site (red), after scale up (green) and after being modeled (blue)

Moafi Madani et al. / Iranian Journal of Earth Sciences, Vol. 12, No. 2, 2020, 133-140.
139
Fig 7. Extracted and horizontal image of the lithological model along 25(left), 10(right) degree
Fig 8. Cross-plot fractures and lithology codes
It is clear that the lithology code 1, which is related to
dolomite, has the highest and most extensive fracture
intensity values. Lithology codes 5 and 0 are related to
limestone-dolomite and limestone have intermediate
fracture. The least fractures are observed for anhydrite
(code 3), which is less than 2. Lithology of shale
carbonate and carbonate anhydrite (codes 2 and 4,
respectively) also show lower fracture severity. As a
result, it is known that lithology can be one of the
factors controlling fractures in the field. After entering the model made from lithology into the fracture
modeling process, the accuracy of the final model of the
fracture improved by seven percent. This shows that
studying individual parameters in fractures separately
and modeling them can help to improve the accuracy of
fracture modeling. The studies have shown that
increasing the accuracy in modeling is different
depending on the method and data used, and all or some
of the existing methods can be used depending on the
purpose of the studies to improve accuracy.
4. Conclusion Image logs are one of the important data in the study of
fractures. Due to the lack of image logs in most wells in
the studied area, it is necessary to study fractures using
other available information. In this paper, lithology and
its relationship with fractures in southwestern of Iran
have been investigated. For this purpose, lithology was
determined using neural network method and
information from various existing logs. The lithology
derived from the well information provided a good
connection with the lithology of the interpreters. Then,
the relationship between obtained lithology and
fractures was investigated in the wells where fracture
data were available. The results showed a good
correlation between lithology and fracture. For example,
the fracture severity in dolomite showed the highest and
in the anhydride showed the lowest value, and these
values were observed in all wells. As shown in this
paper, lithology is one of the factors that controls the fracture. Given the fact that it is possible to determine
the lithology in most wells, its use can improve the
accuracy of the model. According to the results of this
study, this accuracy can be up to 7%. The increased
accuracy of modeling in some of the proposed models is
presented in the Introduction section, which this
increase in accuracy is acceptable compared to them. It
is recommended to improve the accuracy of the model
by using these results and introducing lithology in
fracture modeling and other effective parameters that
investigated and modeled before final fracture modeling.
References Aghli G, Soleimani B, Moussavi-Harami R,
Mohammadian R (2016) Fractured zones detection
using conventional petrophysical logs by
differentiation method and its correlation with image
logs, Journal of Petroleum Science and Engineering
142:152-162.

Moafi Madani et al. / Iranian Journal of Earth Sciences, Vol. 12, No. 2, 2020, 133-140.
140
Asgari Nezhad Y, Tokhmechi B, Kamkar A, Sherkati S,
Kavousi K, Jamali A (2014) A combined Parzen-
wavelet approach for detection of vuggy zones in
fractured carbonate reservoirs using petrophysical
logs, Journal of Petroleum Science and Engineering
119:1-7.
Atilla A (2000) Fractures, faults and hydrocarbon
entrapment, migration and flow, Marine and
Petroleum Geology 17:797-814.
Aydin A, Myers R, Younes A (1998) Faults: Seal or
Migration Pathways?, Neural Networks for Pattern
Recognition, Oxford University Press, 5:508. Berre I, Doster F, Keilegavlen E (2018) Flow in
fractured porous media: A review of conceptual
models and discretization approaches, Transport in
Porous Media 130(1):215-36.
Bishop C (1997) Neural Networks for Pattern
Recognition, Oxford University Press, 508.
Chen T, Clausera C, Marquart G (2017) Efficiency and
accuracy of equivalent fracture models for predicting
fractured geothermal reservoirs: the influence of
fracture network patterns, Energy Procedia 125: 318–
326. Coward M, Sezgin Daltaban T, Johnson H (1998)
Structural geology in reservoir characterization,
Geological Society, Nature 266.
Eichhubl P, Davatz NC, Becker SP (2009) Structural
and diagenetic control of fluid migration and
cementation along the Moab fault, Utah, AAPG
Bulletin 93:653–681.
Gouth F, Toublanc, A, Mresah, M (2006)
Characterization and Modeling of a Fractured
Reservoir Using a Novel DFN Approach, Abu Dhabi
International Petroleum Exhibition and Conference
held, Abu Dhabi, U.A.E SPE 102165-MS. Gross M, Fischer M, Engelder T, Greenfield R (1995)
Factors controlling joints spacing in interbedded
sedimentary rocks, Geological Society (London) 92:
215–233
Haneberg W, Mozley P, Moore J, Goodwin L (1999)
Faults and subsurface in the shallow crust, American
Geophysical Union, Geophysical Monographs 113:7-
26.
Helgeson D, Aydin A (1991) Characteristics of joint
propagation across layer interfaces in sedimentary
rocks, Journal of Structural Geology 13:897-911. Hunt D, and Tucker M (1992) Stranded parasequences
on the forced regressivewedge systems tract
deposition during base–level fall. Sedimentary
Geology 81:1-9.
Javadi M, Sharifzadeh M, Shahriar K, Sayadi S (2016)
Migration tracing and kinematic state concept
embedded in discrete fracture network for modeling
hydrocarbon migration around unlined rock caverns,
Computers and Geosciences 91:105-118.
Jingsong P, Changgui X, Ajuan W, Yuechuan W,
Bingjie W, Yonghua G, Jiangtao Z, Xin W (2016)
Hydrocarbon migration caused by rupture of pressure
compartment in south Liaozhong sag, Bohai Bay
Basin, Offshore China. Petroleum Exploration and
Development 43:425-434
Khoshbakht F, Azizzadeh M, Memarian H, Nourozi G,
Moallemi S (2012) Comparison of electrical image log
with core in a fractured carbonate reservoir, Journal of
Petroleum Science and Engineering 87:289–296. Lorenz J (1988) Multiwell Experiment Final Report:
The coastal interval of the Mesaverde Formation,
Sandia National Laboratories Technical Report 1131.
McQuillan H (1973) Small-scale fracture density in
Asmari Formation of southwest Iran and its relation to
bed thickness and structural setting, American
Association of Petroleum Geologists Bulletin 57:
2367-2385.
Nian L, Nansheng Q, Jian C, Fangyu S, Hang W,
Xuesong L, Yuanjie W, Yaxian J, Qianqian F (2017)
Hydrocarbon migration and accumulation of the Suqiao buried-hill zone in Wen'an Slope, Jizhong
Subbasin, Bohai Bay Basin, China, Marine and
Petroleum Geology 86:512-525.
Parnell (1998) Dating and Duration of Fluid Flow and
Fluid-Rock Interaction, Geological publication 144.
Pollard D, Aydin A (1988) Progress in understanding
jointing over the past century, Geological Society of
America Bulletin 100:1181-1204.
Rahnama-Rad J, Farhoudi G, Ghorbani H, Habibi
Mood Sh, Derakhshani R (2009) Pierced salt domes in
the Persian Gulf and in the Zagros mountain ranges in
southern Iran and their relationship to hydrocarbon and basement tectonics, Iranian Journal of Earth
Sciences 1: 57-72
Shafiei A, Maurice B. Dusseault, Ehsan Kosari,
Morteza N. Taleghani (2018) Natural Fractures
Characterization and In Situ Stresses Inference in a
Carbonate Reservoir. An Integrated Approach.
Energies 11(2):312.
Shiri Y, Tokhmechi B, Zarei Z, Koneshloo M (2012)
Self-affine and ARX-models zonation of well logging
data, Physica A: Statistical Mechanics and its
Applications 391:5214-5208. Tokhmchi B, Memarian H, Rezaee M (2010) Estimation
of the fracture density in fractured zones using
petrophysical logs, Journal of Petroleum Science and
Engineering 72:206-213.
Zuo L, Tan X, Yu W, Hu X (2019) Fracture Detection
and Numerical Modeling for Fractured Reservoirs,
Energies 12:386; doi:10.3390/en12030386.