
ijeee.iust.ac.irijeee.iust.ac.ir/article-1-84-en.pdf( @$g / $ .b/b&.bb/$g .c99 3.
15
Iranian Journal of Electrical & Electronic Engineering, Vol. 4, No. 4, October 2008 176 FACTS Devices Allocation to Congestion Alleviation Incorporating Voltage Dependence of Loads M. Gitizadeh* and M. Kalantar* Abstract: This paper presents a novel optimization based methodology to allocate Flexible AC Transmission Systems (FACTS) devices in an attempt to improve the previously mentioned researches in this field. Static voltage stability enhancement, voltage profile improvement, line congestion alleviation, and FACTS devices investment cost reduction, have been considered, simultaneously, as objective functions. Therefore, multi-objective optimization without simplification has been used in this paper to find a logical solution to the allocation problem. The optimizations are carried out on the basis of location, size and type of FACTS devices. Thyristor Controlled Series Compensator (TCSC) and Static Var Compensator (SVC) are utilized to achieve the determined objectives. The problem is formulated according to Sequential Quadratic Programming (SQP) problem in the first stage. This formulation is used to accurately evaluate static security margin with congestion alleviation constraint incorporating voltage dependence of loads in the presence of FACTS devices and estimated annual load profile. The best trade-off between conflicting objectives has been obtained through Genetic Algorithm (GA) based fuzzy multi-objective optimization approach, in the next stage. The IEEE 14-bus test system is selected to validate the allocated devices for all load-voltage characteristics determined by the proposed approach. Keywords: Congestion Alleviation, FACTS, Fuzzy, Genetic Algorithm, Optimal Location, Voltage Stability. 1 Introduction 1 These days, high efficiency, maximum reliability, and security in the design and operation of power systems are more important than ever before. The difficulties in constructing new transmission lines due to limits in rights for their paths make it necessary to utilize the maximum capacity of transmission lines. Therefore, it is difficult to provide voltage stability, even in normal conditions [1] and [2]. The fact that the main duty of generation units in deregulated environment is based on the active power generation requirements rather than the reactive power compensation makes the problem more serious. Power system deregulation which is translated into a separation of generation, transmission and distribution has been developed to increase competition between suppliers. As a result, consumers can seek the Iranian Journal of Electrical & Electronic Engineering, 2008. Paper first received 16 th December 2007 and in revised form 10 th June 2008. * The Authors are with the Center of Excellence for Power System Automation and Operation, Department of Electrical Engineering, Iran University of Science and Technology, Tehran 16844, Iran E-mail: [email protected] , [email protected] . best combination of price, reliability and customer service. It should be noted that the constraints regarding the transmission security should not prevent any generator from operating at peak load demand. In doing so and also to provide fair competition of generators and secure power transfer transactions between distant regions, both the owners of transmission system and operators should properly plan and control the system. Power exchanges in deregulated systems must be under control in order to avoid line overloading, known as congestion [3], on any path and therefore the full capacity of transmission lines may not be used. So, it is significant to get rid of line congestion to be able to use the full capacity of a network in the restructured electricity environment. Removing line congestion and carrying higher power, close to lines thermal limit, over long distance in a power system without diminished stability and security margin, can be achieved through fast power flow control in a transmission system. Recently, Flexible AC Transmission Systems (FACTS) have been introduced as a well known term for higher Downloaded from ijeee.iust.ac.ir at 22:10 IRDT on Thursday June 14th 2018
Transcript of ijeee.iust.ac.irijeee.iust.ac.ir/article-1-84-en.pdf( @$g / $ .b/b&.bb/$g .c99 3.
Iranian Journal of Electrical & Electronic Engineering, Vol. 4, No. 4, October 2008 176
FACTS Devices Allocation to Congestion Alleviation
Incorporating Voltage Dependence of Loads
M. Gitizadeh* and M. Kalantar*
Abstract: This paper presents a novel optimization based methodology to allocate Flexible
AC Transmission Systems (FACTS) devices in an attempt to improve the previously
mentioned researches in this field. Static voltage stability enhancement, voltage profile
improvement, line congestion alleviation, and FACTS devices investment cost reduction,
have been considered, simultaneously, as objective functions. Therefore, multi-objective
optimization without simplification has been used in this paper to find a logical solution to
the allocation problem. The optimizations are carried out on the basis of location, size and
type of FACTS devices. Thyristor Controlled Series Compensator (TCSC) and Static Var
Compensator (SVC) are utilized to achieve the determined objectives. The problem is
formulated according to Sequential Quadratic Programming (SQP) problem in the first
stage. This formulation is used to accurately evaluate static security margin with congestion
alleviation constraint incorporating voltage dependence of loads in the presence of FACTS
devices and estimated annual load profile. The best trade-off between conflicting objectives
has been obtained through Genetic Algorithm (GA) based fuzzy multi-objective
optimization approach, in the next stage. The IEEE 14-bus test system is selected to
validate the allocated devices for all load-voltage characteristics determined by the
proposed approach.
Keywords: Congestion Alleviation, FACTS, Fuzzy, Genetic Algorithm, Optimal Location,
Voltage Stability.
1 Introduction 1
These days, high efficiency, maximum reliability, and
security in the design and operation of power systems
are more important than ever before. The difficulties in
constructing new transmission lines due to limits in
rights for their paths make it necessary to utilize the
maximum capacity of transmission lines. Therefore, it is
difficult to provide voltage stability, even in normal
conditions [1] and [2]. The fact that the main duty of
generation units in deregulated environment is based on
the active power generation requirements rather than the
reactive power compensation makes the problem more
serious. Power system deregulation which is translated
into a separation of generation, transmission and
distribution has been developed to increase competition
between suppliers. As a result, consumers can seek the
Iranian Journal of Electrical & Electronic Engineering, 2008.
Paper first received 16th December 2007 and in revised form 10th June
2008. * The Authors are with the Center of Excellence for Power System
Automation and Operation, Department of Electrical Engineering,
Iran University of Science and Technology, Tehran 16844, Iran E-mail: [email protected], [email protected].
best combination of price, reliability and customer
service.
It should be noted that the constraints regarding the
transmission security should not prevent any generator
from operating at peak load demand. In doing so and
also to provide fair competition of generators and secure
power transfer transactions between distant regions,
both the owners of transmission system and operators
should properly plan and control the system. Power
exchanges in deregulated systems must be under control
in order to avoid line overloading, known as congestion
[3], on any path and therefore the full capacity of
transmission lines may not be used. So, it is significant
to get rid of line congestion to be able to use the full
capacity of a network in the restructured electricity
environment.
Removing line congestion and carrying higher
power, close to lines thermal limit, over long distance in
a power system without diminished stability and
security margin, can be achieved through fast power
flow control in a transmission system. Recently,
Flexible AC Transmission Systems (FACTS) have been
introduced as a well known term for higher
Dow
nloa
ded
from
ijee
e.iu
st.a
c.ir
at 2
2:10
IRD
T o
n T
hurs
day
June
14t
h 20
18
Gitizadeh & Kalantar: FACTS Devices Allocation to Congestion Alleviation … 177
controllability in power systems. Fast power flow
control is the main application of FACTS devices,
which can help us to achieve the above objectives.
FACTS devices influence the system by switched or
controlled shunt compensation, series compensation or
phase shift control. These devices provide a better
adaptation to varying operational conditions and
improve the usage of existing installations. Thyristor-
Controlled Series Compensator (TCSC) and Static Var
Compensator (SVC) are two mainly emerging FACTS
devices that flexibly control line impedance and
susceptance, respectively.
It is well documented in the literature that the
effectiveness of FACTS controllers mainly depends on
their locations [4]. According to the characteristics of
FACTS devices, various criteria have been considered
in the allocation problem. Some of the reported
objectives in the literature are: static voltage stability
enhancement [5]-[8], violation diminution of the line
thermal constraints [9], network loadability
enhancement [10], power loss reduction [11], voltage
profile improvement [10], fuel cost reduction of power
plants using optimal power flow [12], dynamic stability
improvement [13], and damping power swings [14]. It
should be noted that each of the mentioned objectives
improves the power system network operation and
reaching these objectives is desirable in all power
system networks. But improvement in one objective
does not guarantee the same improvement in others. For
instance, in order to improve the voltage stability, as
considered here, voltage magnitude alone may not be a
reliable indication of how far an operating point is from
the collapse point [2]. Hence, satisfying the voltage
magnitude constraint does not guarantee the satisfaction
of the security margin requirement. By proper TCSC
and SVC allocation and setting, both the voltage
magnitude and Security Margin (SM) may be improved.
It is clear that the unlimited FACTS devices
allocation according to one or more objectives without
considering their cost and benefits, cannot be logical
[10]. Reducing the investment cost of FACTS devices
can be achieved through determination of their optimal
number.
This investigation attempts to improve the
previously mentioned researches in the field of FACTS
devices allocation in power systems. This is done by
considering static voltage stability enhancement, voltage
profile improvement, congestion alleviation, and
FACTS devices investment cost reduction,
simultaneously. Therefore, multi-objective optimization
without simplification has been used in this paper in an
attempt to find a logical solution to the allocation
problem. One of the necessities of a multi-objective
optimization problem is providing a scheme that can
simultaneously formulate all the objectives in the form
of a single optimization problem. The optimization
problem needs to have the ability to take all the
predetermined objective values by the designer. In this
paper, an approach based on fuzzy evaluation technique
combined with genetic algorithm is used to compromise
between contradictory objectives. Despite previous
works, and for approaching a practical solution,
estimated annual load profile and voltage dependence of
loads have been considered for calculation of the
objectives. In addition, Sequential Quadratic
Programming (SQP) optimization sub-problem is used
as a part of overall optimization procedure to assure all
load levels that the FACTS devices are installed
optimally (from voltage deviation point of view). The
utilized FACTS devices are TCSC and SVC.
2 Security Assessment
In order to determine whether or not the power
system meets the voltage level and security
requirements specified, it is necessary to determine both
the voltage magnitudes and the security margins for the
operating conditions anticipated. The voltage
magnitudes may be determined by solving the load flow
equations for the system. To evaluate the security
margin, SM, it is necessary to determine the system
critical condition (voltage stability limit). Some
approximate methods to determine the critical loading
condition has been proposed. A comparison of several
proposed indices is given in [15]. These indices may not
represent accurately the condition of the network close
to and at the critical point. In [16] an accurate method is
presented to determine the steady state voltage stability
limit at any bus in a multi-machine system. The method
of [16] is used in this paper with the presence of TCSC
and SVC. Formulation will be developed in such a way
that line congestion could be relieve through security
margin enhancement in a multi-machine power system.
2.1 Voltage Stability Limit
The problem of determining the voltage stability
limit of a general multi-machine power network may be
formulated as a nonlinear optimization problem:
Maximize [Total MVA Demand] subject to:
(a) Distribution constraints at load buses
(b) MVAR and MW limits on generators
(c) Generator MW participation
(d) Load-voltage characteristics at load buses
(e) Constant power factor of MVA demand (optional)
(f) Limits on controlled voltages and transformer taps
Consider a power system with N buses. Buses 1 to
M are load buses; and buses M+1 to N are generator
buses. The Nth bus is the slack bus. In the steady state,
the system is described by power flow equations:
Dow
nloa
ded
from
ijee
e.iu
st.a
c.ir
at 2
2:10
IRD
T o
n T
hurs
day
June
14t
h 20
18
Iranian Journal of Electrical & Electronic Engineering, Vol. 4, No. 4, October 2008 178
(((( ))))n
i i j ij i j ij
j 1
P V V Y cos δ δ φ====
= − −= − −= − −= − −∑∑∑∑ (1)
(((( ))))n
i i j ij i j ij
j 1
Q V V Y sin i 1,..., N 1δ δ φ====
= − − = −= − − = −= − − = −= − − = −∑∑∑∑ (2)
where Pi and Qi are the net real and reactive power
entering bus i, Vi /δi is the ith bus complex voltage,
Yij/Φij is the (i,j)th entry of the network bus admittance
matrix. The constraint in (a) describes and enforces the
pattern or direction of the increase in the MVA demand
vector ST:
[[[[ ]]]]T
1 2 MS S ,S ,...,S==== (3)
and Si is MVA demand at bus i.
In this method, it is required that the distribution
pattern of the MVA demand to be specified. A vector β has been introduced for this purpose. βi is a per unit
value representing the relative increase in the load at
bus i with respect to the corresponding system total load
increase. A load distribution constraint equation may
then be written for bus i:
L L
initial initial
i j i i j i
j J j J
S S S Sβ β∈ ∈∈ ∈∈ ∈∈ ∈
− = −− = −− = −− = −∑ ∑∑ ∑∑ ∑∑ ∑ (4)
where, JL is the set of load buses and Siinitial
is the initial
specified MVA demand at bus i.
Generator MW participation in (c) and load-voltage
characteristic in (d) can then be formulated as:
initial initial
i i D i D i i
0 min max
i i i i i
0 max
i i i i
f P P P P 0
if P P P
if P P
i M 1 , , N 1
γ γ
γ γ
γ γ
= − − + == − − + == − − + == − − + =
= ≤ ≤= ≤ ≤= ≤ ≤= ≤ ≤
≤ =≤ =≤ =≤ == + −= + −= + −= + −…………
(5)
ip
Li 0i iP P V==== (6)
iq
Li 0i iQ Q V==== (7)
where γi is vector of generator participation factors; PD
is total system demand; Pimax
and Pimin
are the maximum
and minimum MW limits of generating unit i; P0i and
Q0i are the prescribed active and reactive loads at rated
voltage; pi and qi are constant which reflect the load-
voltage characteristic at load bus i.
In mathematics, the formulation may be expressed
as a non-linearly constrained optimization problem
(NCOP). This NCOP is presented with Eqs. (8)-(17).
Minimizing the Eq. (8) by satisfying the constraints in
Eqs. (9)-(17), the total MVA demand could be
maximized.
Minimize (((( ))))L
T j
j J
S S V, , t ,δ γ∈∈∈∈
− = −− = −− = −− = −
∑∑∑∑
S/T
(8)
(((( )))) (((( ))))i T i i LS V, , t , S V, , t , C i Jβ δ γ δ γ− = ∈− = ∈− = ∈− = ∈ (9)
(((( ))))min max
i i iQ Q V, , t , Q i M 1 , . . . , N 1δ γ≤ ≤ = + −≤ ≤ = + −≤ ≤ = + −≤ ≤ = + − (10)
(((( ))))min max
i i iP P V, , t , P i M 1 , . . . , N 1δ γ≤ ≤ = + −≤ ≤ = + −≤ ≤ = + −≤ ≤ = + − (11)
(((( ))))if V , , t , 0 i M 1 , . . . , N 1δ γ = = + −= = + −= = + −= = + − (12)
0
i ii M 1 , . . . , N 1γ γ≤ = + −≤ = + −≤ = + −≤ = + − (13)
min max
i i i cV V V i J≤ ≤ ∈≤ ≤ ∈≤ ≤ ∈≤ ≤ ∈ (14)
min max
i i i tt t t i 1 , . . . , n≤ ≤ =≤ ≤ =≤ ≤ =≤ ≤ = (15)
(((( ))))i
np
i 0i i i j ij i j ij
j 1
g P V V V Y cos 0δ δ φ====
= + − − == + − − == + − − == + − − =∑∑∑∑ (16)
(((( ))))i
nq
i 0i i i j ij i j ij
j 1
L
h Q V V V Y sin 0
i J
δ δ φ====
= + − − == + − − == + − − == + − − =
∈∈∈∈
∑∑∑∑ (17)
Jc is the set of voltage controlled buses; nt is the
number of LTC transformers.
2.2 Congestion Alleviation
Line congestion can be avoided through the above
NCOP problem by considering the following additional
constraint:
(((( ))))i i i
min max
l l l i 1 kP P V, , t , P l l , . . . , lδ γ≤ ≤ =≤ ≤ =≤ ≤ =≤ ≤ = (18)
where l1,l2, …, lk are the line numbers.
Solving the NCOP problem in Eqs. (8)-(18), one can
improve the security margin whilst the load of the
power system increases according to the relative load
increase vector β without any line congestion. This
Dow
nloa
ded
from
ijee
e.iu
st.a
c.ir
at 2
2:10
IRD
T o
n T
hurs
day
June
14t
h 20
18
Gitizadeh & Kalantar: FACTS Devices Allocation to Congestion Alleviation … 179
improvement will be achieved by suitable installation of
FACTS devices. Modeling and substitution of FACTS
equations in NCOP problem will be discussed in
Section 3.
2.3 Security Margin
Having determined the system critical state, the
security margin SM is defined as:
L L
L
limit initial
j j
j J j J
limit
j
j J
S S
SMS
∈ ∈∈ ∈∈ ∈∈ ∈
∈∈∈∈
−−−−
====∑ ∑∑ ∑∑ ∑∑ ∑
∑∑∑∑ (19)
where Sjlimit
is the MVA load of bus j at critical state.
For stable initial operating conditions, SM takes the
values between 0 and 1; SM equals to zero at the
voltage stability limit and this parameter is negative
when the network is unable to supply the specified
initial MVA demand.
3 Security Equations with Presence of TCSC and
SVC
There are two possible characteristics for TCSCs,
capacitive and inductive, to increase or decrease the
transmission line reactance. These devices can cause
increasing the transmission power capacity of lines,
static voltage security margin enhancement, voltage
profile improvement, and decreasing power loss (power
division between parallel lines). SVCs have also
capacitive and inductive characteristics and are
predominantly utilized to improve and amend voltage in
static and dynamic conditions, reduce reactive network
power loss, and enhance static voltage security margin.
In order to use TCSCs and SVCs to satisfy the
mentioned allocation criteria, the injection power model
and variable susceptance model shown, respectively, in
Figs. 1 and 2 have been considered.
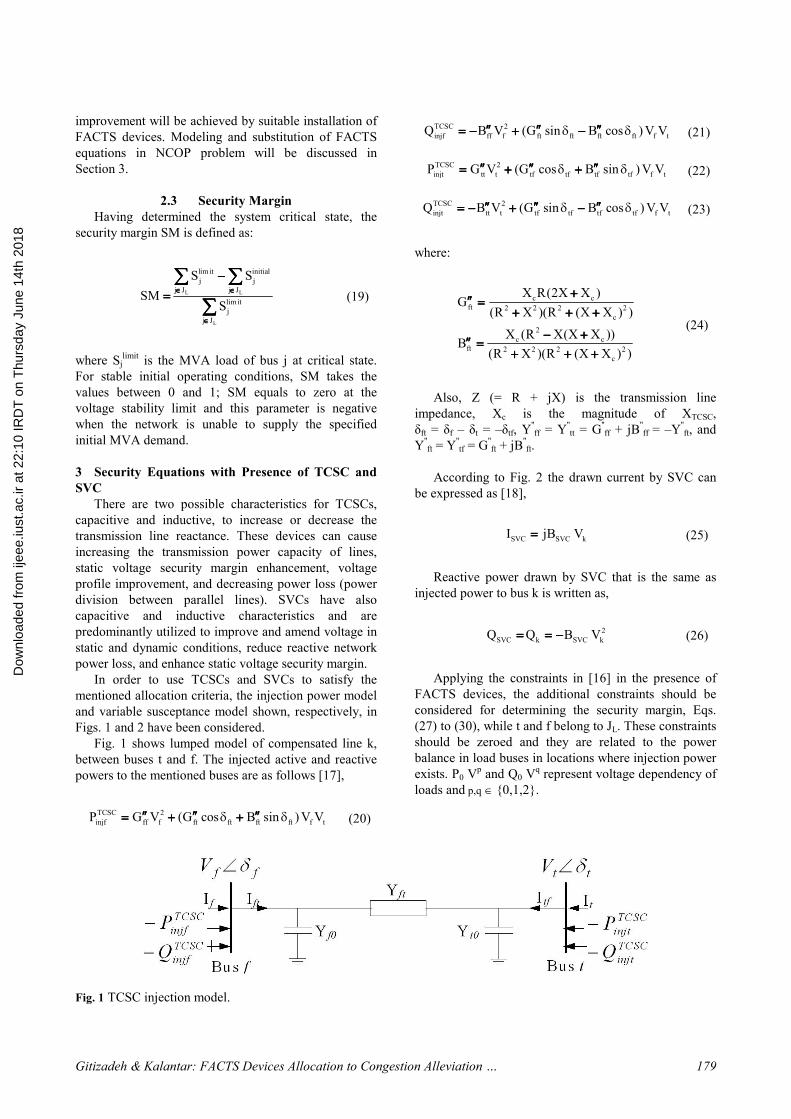
Fig. 1 shows lumped model of compensated line k,
between buses t and f. The injected active and reactive
powers to the mentioned buses are as follows [17],
TCSC 2
injf ff f ft ft ft ft f tP G V (G cos B sin )V Vδ δ′′ ′′ ′′′′ ′′ ′′′′ ′′ ′′′′ ′′ ′′= + += + += + += + + (20)
TCSC 2
injf ff f ft ft ft ft f tQ B V (G sin B cos )V Vδ δ′′ ′′ ′′′′ ′′ ′′′′ ′′ ′′′′ ′′ ′′= − + −= − + −= − + −= − + − (21)
TCSC 2
injt tt t tf tf tf tf f tP G V (G cos B sin )V Vδ δ′′ ′′ ′′′′ ′′ ′′′′ ′′ ′′′′ ′′ ′′= + += + += + += + + (22)
TCSC 2
injt tt t tf tf tf tf f tQ B V (G sin B cos )V Vδ δ′′ ′′ ′′′′ ′′ ′′′′ ′′ ′′′′ ′′ ′′= − + −= − + −= − + −= − + − (23)
where:
c c
ft 2 2 2 2
c
2
c c
ft 2 2 2 2
c
X R(2X X )G
(R X )(R (X X ) )
X (R X(X X ))B
(R X )(R (X X ) )
++++′′′′′′′′ ====
+ + ++ + ++ + ++ + +
− +− +− +− +′′′′′′′′ ====
+ + ++ + ++ + ++ + +
(24)
Also, Z (= R + jX) is the transmission line
impedance, Xc is the magnitude of XTCSC,
δft = δf – δt = –δtf, Y''ff = Y
''tt = G
''ff + jB
''ff = –Y
''ft, and
Y''ft = Y
''tf = G
''ft + jB
''ft.
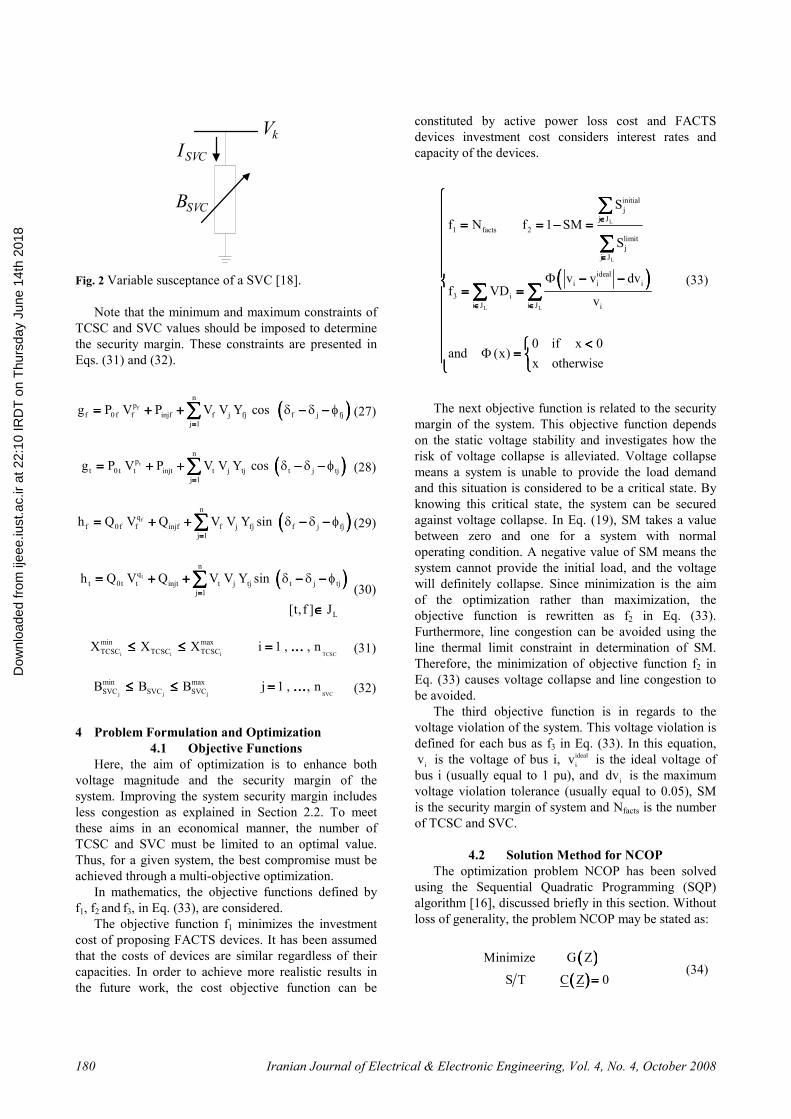
According to Fig. 2 the drawn current by SVC can
be expressed as [18],
SVC SVC kI jB V==== (25)
Reactive power drawn by SVC that is the same as
injected power to bus k is written as,
2
SVC k SVC kQ Q B V= = −= = −= = −= = − (26)
Applying the constraints in [16] in the presence of
FACTS devices, the additional constraints should be
considered for determining the security margin, Eqs.
(27) to (30), while t and f belong to JL. These constraints
should be zeroed and they are related to the power
balance in load buses in locations where injection power
exists. P0 Vp and Q0 V
q represent voltage dependency of
loads and p,q ∈ {0,1,2}.
Fig. 1 TCSC injection model.
Dow
nloa
ded
from
ijee
e.iu
st.a
c.ir
at 2
2:10
IRD
T o
n T
hurs
day
June
14t
h 20
18
Iranian Journal of Electrical & Electronic Engineering, Vol. 4, No. 4, October 2008 180
SVCB
kV
SVCI
Fig. 2 Variable susceptance of a SVC [18].
Note that the minimum and maximum constraints of
TCSC and SVC values should be imposed to determine
the security margin. These constraints are presented in
Eqs. (31) and (32).
(((( ))))f
np
f 0 f f injf f j fj f j fj
j 1
g P V P V V Y cos δ δ φ====
= + + − −= + + − −= + + − −= + + − −∑∑∑∑ (27)
(((( ))))t
np
t 0 t t injt t j tj t j tj
j 1
g P V P V V Y cos δ δ φ====
= + + − −= + + − −= + + − −= + + − −∑∑∑∑ (28)
(((( ))))f
nq
f 0f f injf f j fj f j fj
j 1
h Q V Q V V Y sin δ δ φ====
= + + − −= + + − −= + + − −= + + − −∑∑∑∑ (29)
(((( ))))t
nq
t 0t t injt t j tj t j tj
j 1
L
h Q V Q V V Y sin
[t, f ] J
δ δ φ====
= + + − −= + + − −= + + − −= + + − −
∈∈∈∈
∑∑∑∑ (30)
i i i TCSC
min max
TCSC TCSC TCSCX X X i 1 , , n≤ ≤ =≤ ≤ =≤ ≤ =≤ ≤ = ………… (31)
j j j SVC
min max
SVC SVC SVCB B B j 1 , , n≤ ≤ =≤ ≤ =≤ ≤ =≤ ≤ = ………… (32)
4 Problem Formulation and Optimization
4.1 Objective Functions
Here, the aim of optimization is to enhance both
voltage magnitude and the security margin of the
system. Improving the system security margin includes
less congestion as explained in Section 2.2. To meet
these aims in an economical manner, the number of
TCSC and SVC must be limited to an optimal value.
Thus, for a given system, the best compromise must be
achieved through a multi-objective optimization.
In mathematics, the objective functions defined by
f1, f2 and f3, in Eq. (33), are considered.
The objective function f1 minimizes the investment
cost of proposing FACTS devices. It has been assumed
that the costs of devices are similar regardless of their
capacities. In order to achieve more realistic results in
the future work, the cost objective function can be
constituted by active power loss cost and FACTS
devices investment cost considers interest rates and
capacity of the devices.
(((( ))))
L
L
L L
initial
j
j J
1 facts 2
limit
j
j J
ideal
i i i
3 i
i J i J i
S
f N f 1 SM
S
v v dvf VD
v
0 if x 0and (x)
x otherwise
Φ
Φ
∈∈∈∈
∈∈∈∈
∈ ∈∈ ∈∈ ∈∈ ∈
= = − == = − == = − == = − = − −− −− −− −
= == == == =
<<<<====
∑∑∑∑
∑∑∑∑
∑ ∑∑ ∑∑ ∑∑ ∑ (33)
The next objective function is related to the security
margin of the system. This objective function depends
on the static voltage stability and investigates how the
risk of voltage collapse is alleviated. Voltage collapse
means a system is unable to provide the load demand
and this situation is considered to be a critical state. By
knowing this critical state, the system can be secured
against voltage collapse. In Eq. (19), SM takes a value
between zero and one for a system with normal
operating condition. A negative value of SM means the
system cannot provide the initial load, and the voltage
will definitely collapse. Since minimization is the aim
of the optimization rather than maximization, the
objective function is rewritten as f2 in Eq. (33).
Furthermore, line congestion can be avoided using the
line thermal limit constraint in determination of SM.
Therefore, the minimization of objective function f2 in
Eq. (33) causes voltage collapse and line congestion to
be avoided.
The third objective function is in regards to the
voltage violation of the system. This voltage violation is
defined for each bus as f3 in Eq. (33). In this equation,
iv is the voltage of bus i, ideal
iv is the ideal voltage of
bus i (usually equal to 1 pu), and i
dv is the maximum
voltage violation tolerance (usually equal to 0.05), SM
is the security margin of system and Nfacts is the number
of TCSC and SVC.
4.2 Solution Method for NCOP
The optimization problem NCOP has been solved
using the Sequential Quadratic Programming (SQP)
algorithm [16], discussed briefly in this section. Without
loss of generality, the problem NCOP may be stated as:
(((( ))))(((( ))))
Minimize G Z
S T C Z 0==== (34)
Dow
nloa
ded
from
ijee
e.iu
st.a
c.ir
at 2
2:10
IRD
T o
n T
hurs
day
June
14t
h 20
18
Gitizadeh & Kalantar: FACTS Devices Allocation to Congestion Alleviation … 181
The algorithm to solve Eq. (34) generates a sequence
of 1
Z , 2
Z , 3
Z , … that converges to the solution *
Z .
Each previous estimate k
Z is improved upon by taking a
step kα in a direction k
Z∆ such that kkk1k
ZZZ ∆α+=+. k is the iteration number. The
direction of movement, k
Z∆ , is found by solving a
Quadratic Programming sub-problem defined as:
(((( )))) (((( )))) (((( ))))T
k 1 kk
k k1
2
k
Minimize G Z G Z G Z
Z H Z
S T J Z 0
∆ ∆
∆
++++ = +∇= +∇= +∇= +∇
++++
====
(35)
where k is the iteration number; H is a positive definite
quasi-Newton approximation to the Hessian of the
augmented Lagrangian function of the problem (34); J is
the Jacobian matrix of the constraint function with
respect to k
Z ; kλ is the Lagrange multiplier vector of
the constraint function of problem (35). Applying the
Kuhn-Tucker theorem to the problem,k
Z∆ and kλ are
found by solving Eq. (36).
(((( ))))kkT
k
G ZH A Z
A 0 0
∆
λ
∇∇∇∇ −−−− ====
(36)
where matrix A is formed from the rows of J.
4.3 Optimization Algorithm
Heuristic methods may be used to solve
combinatorial optimization problems. Global optimum
solution, the best compromise between conflicting
constraints, can be obtained using fuzzy evaluation
technique based on genetic algorithm.
4.3.1 Fuzzy Based Multi-Objective Formulation
Fuzzy evaluation technique is a suitable tool for
finding the best compromise in multi-objective
optimization problems and can be used in both convex
and non-convex problems [19]. To achieve trade-off
among three competing objectives described in Section
4.1 under different operating conditions and
uncertainties, fuzzy evaluation method has been applied
to transform the multi-objective optimization into a
single objective function (known as the fuzzy
performance index). To obtain a single objective
function, the objective functions f1, f2 and f3 must be
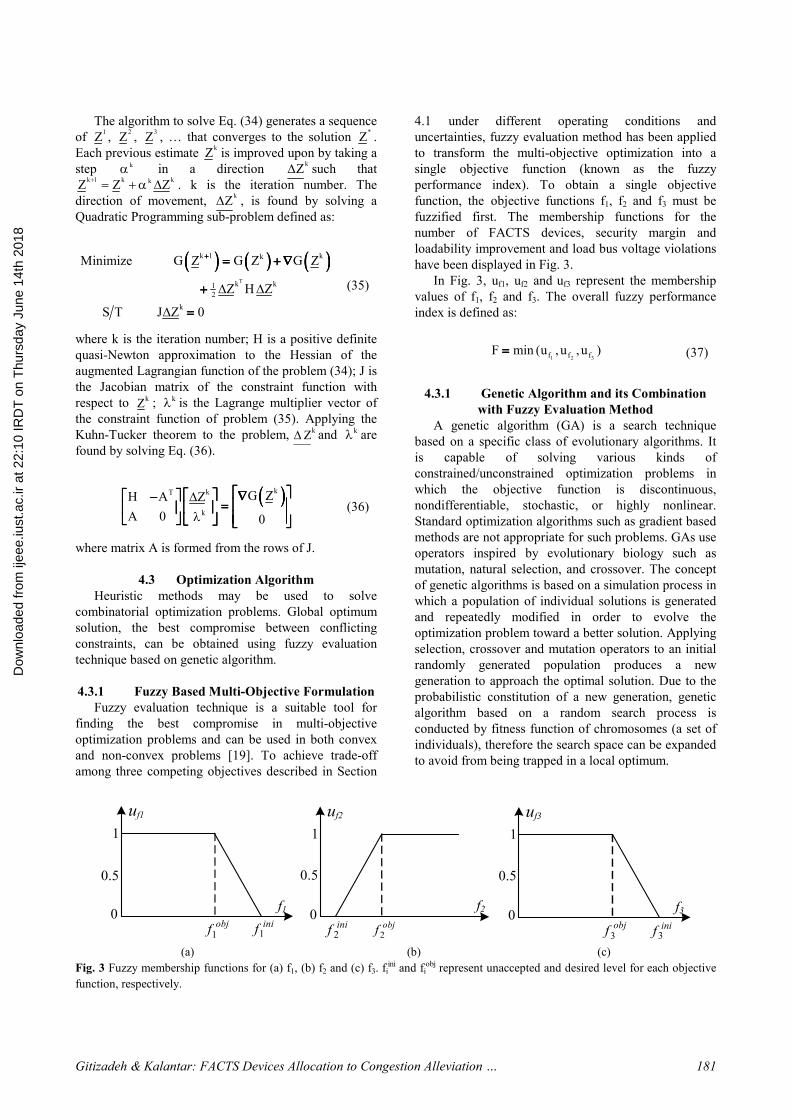
fuzzified first. The membership functions for the
number of FACTS devices, security margin and
loadability improvement and load bus voltage violations
have been displayed in Fig. 3.
In Fig. 3, uf1, uf2 and uf3 represent the membership
values of f1, f2 and f3. The overall fuzzy performance
index is defined as:
1 2 3f f fF min (u ,u ,u )==== (37)
4.3.1 Genetic Algorithm and its Combination
with Fuzzy Evaluation Method
A genetic algorithm (GA) is a search technique
based on a specific class of evolutionary algorithms. It
is capable of solving various kinds of
constrained/unconstrained optimization problems in
which the objective function is discontinuous,
nondifferentiable, stochastic, or highly nonlinear.
Standard optimization algorithms such as gradient based
methods are not appropriate for such problems. GAs use
operators inspired by evolutionary biology such as
mutation, natural selection, and crossover. The concept
of genetic algorithms is based on a simulation process in
which a population of individual solutions is generated
and repeatedly modified in order to evolve the
optimization problem toward a better solution. Applying
selection, crossover and mutation operators to an initial
randomly generated population produces a new
generation to approach the optimal solution. Due to the
probabilistic constitution of a new generation, genetic
algorithm based on a random search process is
conducted by fitness function of chromosomes (a set of
individuals), therefore the search space can be expanded
to avoid from being trapped in a local optimum.
f1
uf1
inif1obj
f1
0
1
0.5
f2
uf2
inif 2
0
1
0.5
f3
uf3
inif3obj
f3
0
1
0.5
objf 2
(a) (b) (c)
Fig. 3 Fuzzy membership functions for (a) f1, (b) f2 and (c) f3. fiini and fi
obj represent unaccepted and desired level for each objective
function, respectively.
Dow
nloa
ded
from
ijee
e.iu
st.a
c.ir
at 2
2:10
IRD
T o
n T
hurs
day
June
14t
h 20
18
Iranian Journal of Electrical & Electronic Engineering, Vol. 4, No. 4, October 2008 182
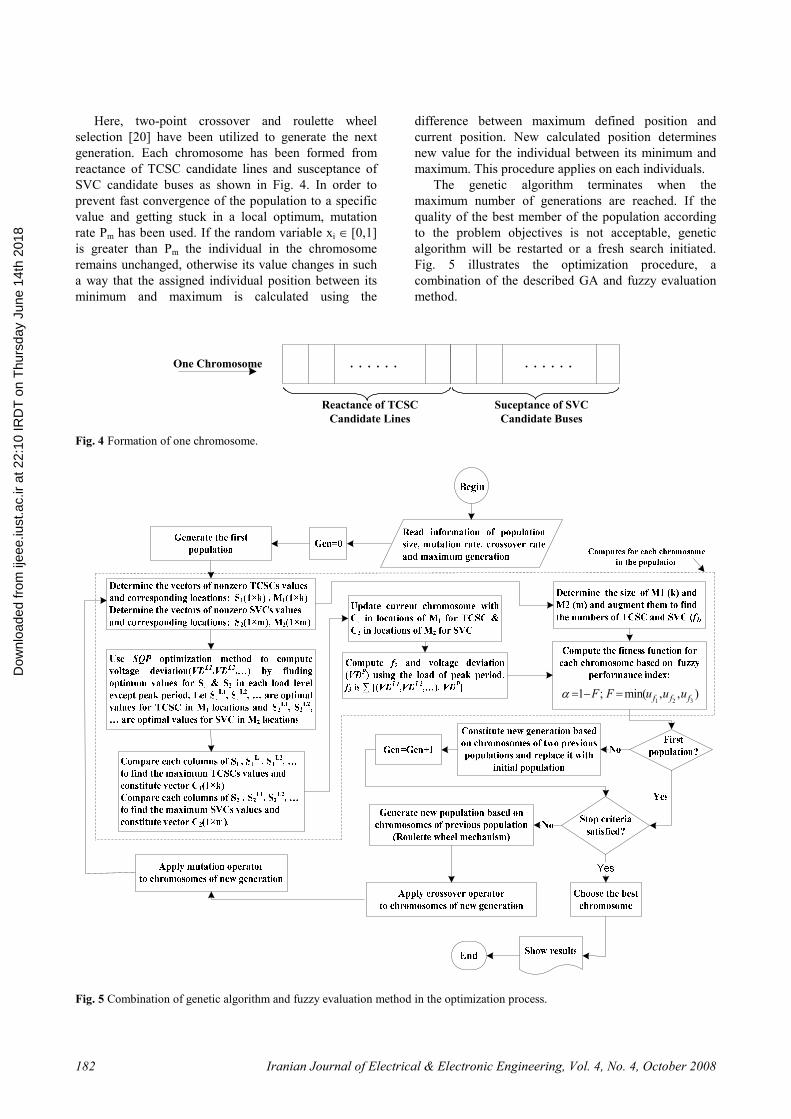
Here, two-point crossover and roulette wheel
selection [20] have been utilized to generate the next
generation. Each chromosome has been formed from
reactance of TCSC candidate lines and susceptance of
SVC candidate buses as shown in Fig. 4. In order to
prevent fast convergence of the population to a specific
value and getting stuck in a local optimum, mutation
rate Pm has been used. If the random variable xi ∈ [0,1]
is greater than Pm the individual in the chromosome
remains unchanged, otherwise its value changes in such
a way that the assigned individual position between its
minimum and maximum is calculated using the
difference between maximum defined position and
current position. New calculated position determines
new value for the individual between its minimum and
maximum. This procedure applies on each individuals.
The genetic algorithm terminates when the
maximum number of generations are reached. If the
quality of the best member of the population according
to the problem objectives is not acceptable, genetic
algorithm will be restarted or a fresh search initiated.
Fig. 5 illustrates the optimization procedure, a
combination of the described GA and fuzzy evaluation
method.
One Chromosome
Reactance of TCSC
Candidate Lines
Suceptance of SVC
Candidate Buses
. . . . . . . . . . . .
Fig. 4 Formation of one chromosome.
),,(min;1321 fff uuuFF =−=α
Fig. 5 Combination of genetic algorithm and fuzzy evaluation method in the optimization process.
Dow
nloa
ded
from
ijee
e.iu
st.a
c.ir
at 2
2:10
IRD
T o
n T
hurs
day
June
14t
h 20
18
Gitizadeh & Kalantar: FACTS Devices Allocation to Congestion Alleviation … 183
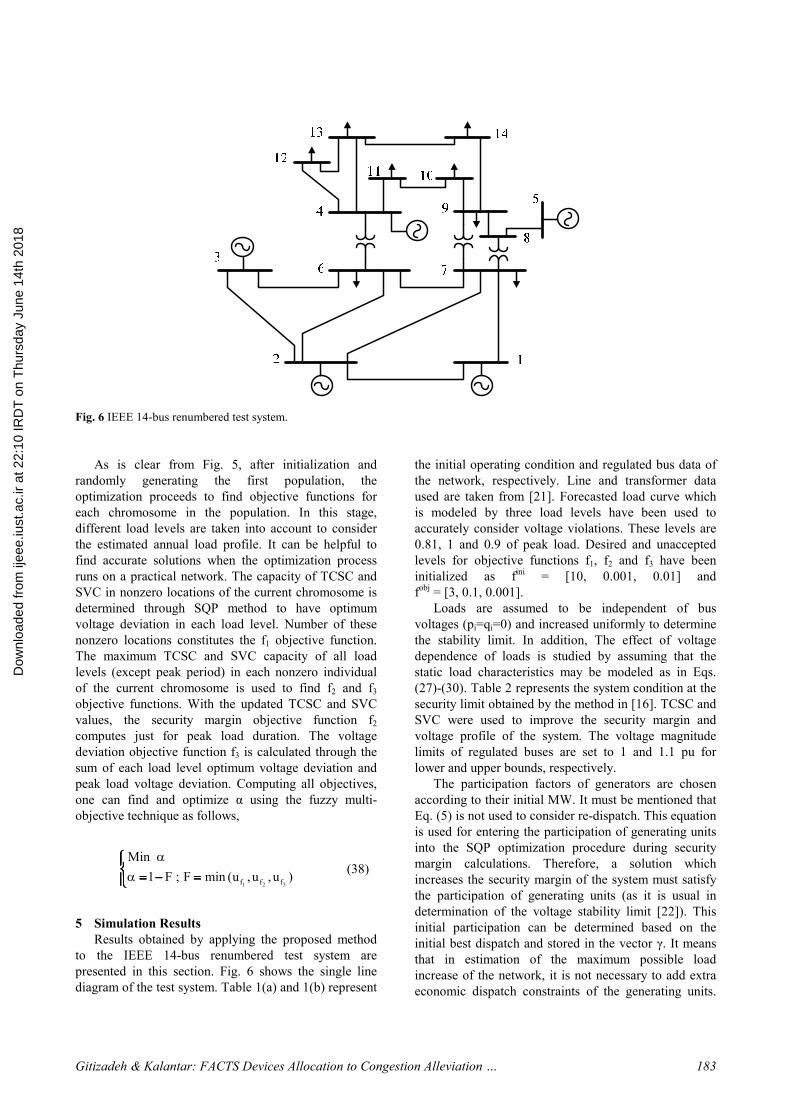
Fig. 6 IEEE 14-bus renumbered test system.
As is clear from Fig. 5, after initialization and
randomly generating the first population, the
optimization proceeds to find objective functions for
each chromosome in the population. In this stage,
different load levels are taken into account to consider
the estimated annual load profile. It can be helpful to
find accurate solutions when the optimization process
runs on a practical network. The capacity of TCSC and
SVC in nonzero locations of the current chromosome is
determined through SQP method to have optimum
voltage deviation in each load level. Number of these
nonzero locations constitutes the f1 objective function.
The maximum TCSC and SVC capacity of all load
levels (except peak period) in each nonzero individual
of the current chromosome is used to find f2 and f3
objective functions. With the updated TCSC and SVC
values, the security margin objective function f2
computes just for peak load duration. The voltage
deviation objective function f3 is calculated through the
sum of each load level optimum voltage deviation and
peak load voltage deviation. Computing all objectives,
one can find and optimize α using the fuzzy multi-
objective technique as follows,
1 2 3f f f
Min
1 F ; F min (u ,u ,u )
α
α = − == − == − == − =
(38)
5 Simulation Results
Results obtained by applying the proposed method
to the IEEE 14-bus renumbered test system are
presented in this section. Fig. 6 shows the single line
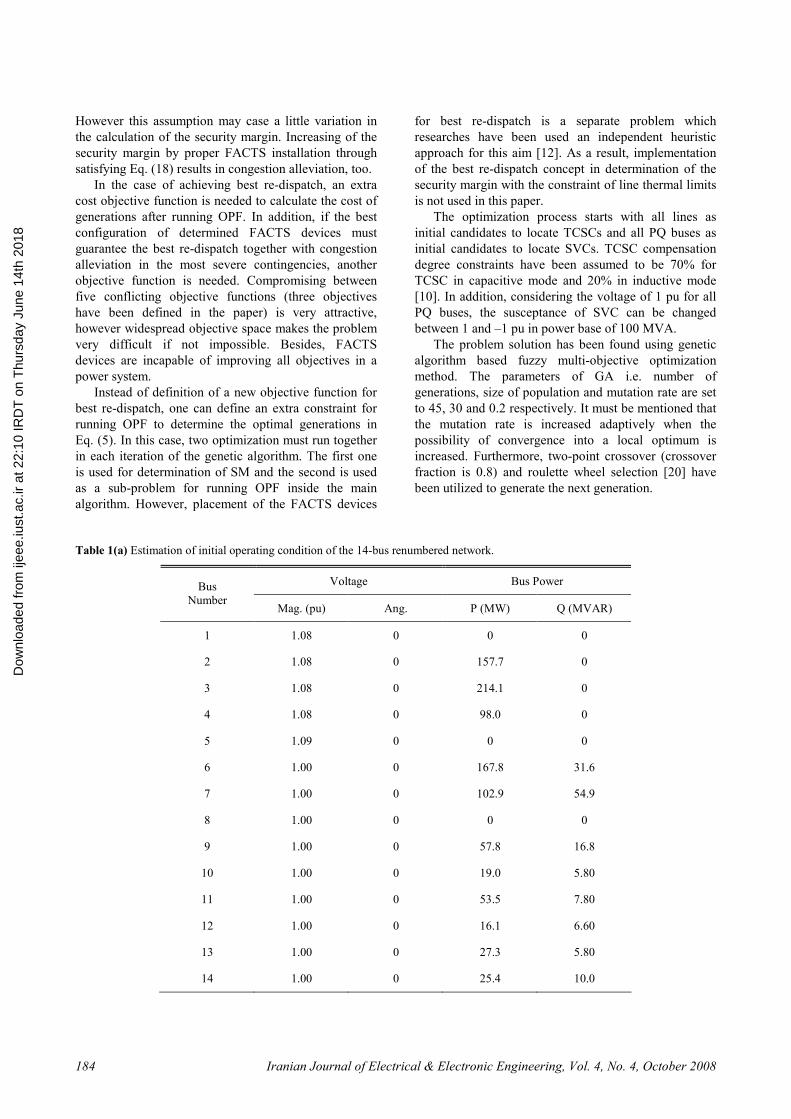
diagram of the test system. Table 1(a) and 1(b) represent
the initial operating condition and regulated bus data of
the network, respectively. Line and transformer data
used are taken from [21]. Forecasted load curve which
is modeled by three load levels have been used to
accurately consider voltage violations. These levels are
0.81, 1 and 0.9 of peak load. Desired and unaccepted
levels for objective functions f1, f2 and f3 have been
initialized as fini
= [10, 0.001, 0.01] and
fobj
= [3, 0.1, 0.001].
Loads are assumed to be independent of bus
voltages (pi=qi=0) and increased uniformly to determine
the stability limit. In addition, The effect of voltage
dependence of loads is studied by assuming that the
static load characteristics may be modeled as in Eqs.
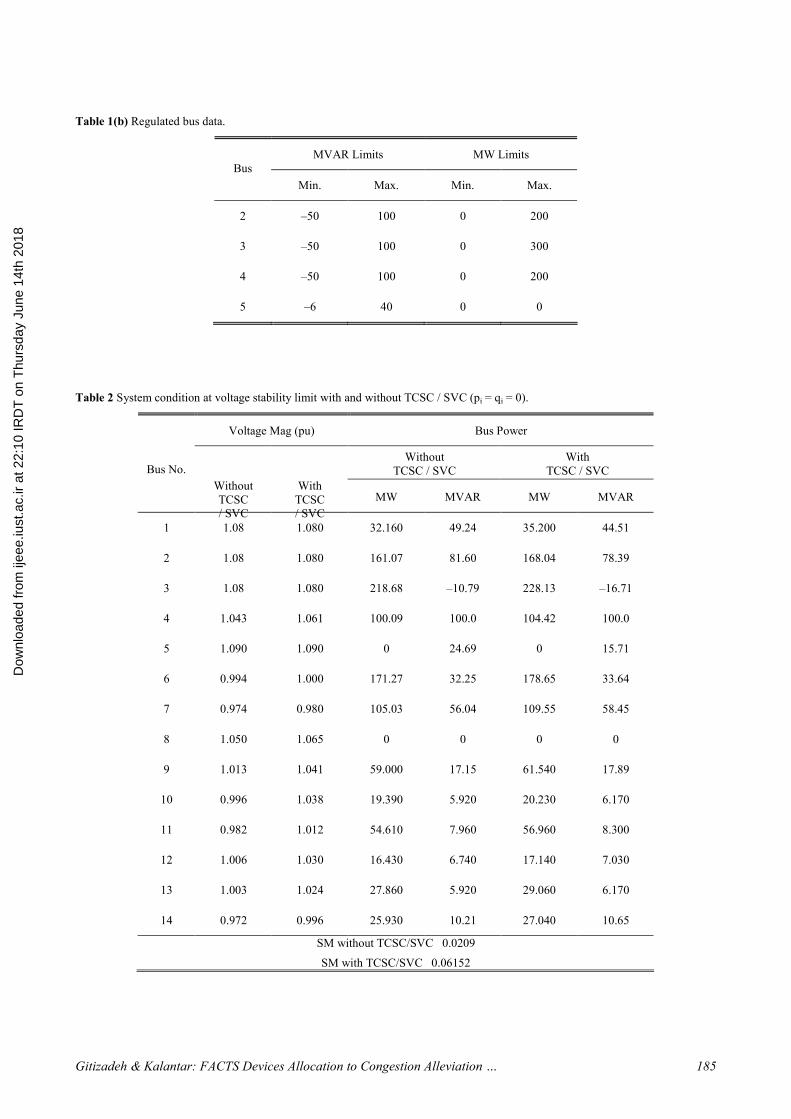
(27)-(30). Table 2 represents the system condition at the
security limit obtained by the method in [16]. TCSC and
SVC were used to improve the security margin and
voltage profile of the system. The voltage magnitude
limits of regulated buses are set to 1 and 1.1 pu for
lower and upper bounds, respectively.
The participation factors of generators are chosen
according to their initial MW. It must be mentioned that
Eq. (5) is not used to consider re-dispatch. This equation
is used for entering the participation of generating units
into the SQP optimization procedure during security
margin calculations. Therefore, a solution which
increases the security margin of the system must satisfy
the participation of generating units (as it is usual in
determination of the voltage stability limit [22]). This
initial participation can be determined based on the
initial best dispatch and stored in the vector γ. It means
that in estimation of the maximum possible load
increase of the network, it is not necessary to add extra
economic dispatch constraints of the generating units.
Dow
nloa
ded
from
ijee
e.iu
st.a
c.ir
at 2
2:10
IRD
T o
n T
hurs
day
June
14t
h 20
18
Iranian Journal of Electrical & Electronic Engineering, Vol. 4, No. 4, October 2008 184
However this assumption may case a little variation in
the calculation of the security margin. Increasing of the
security margin by proper FACTS installation through
satisfying Eq. (18) results in congestion alleviation, too.
In the case of achieving best re-dispatch, an extra
cost objective function is needed to calculate the cost of
generations after running OPF. In addition, if the best
configuration of determined FACTS devices must
guarantee the best re-dispatch together with congestion
alleviation in the most severe contingencies, another
objective function is needed. Compromising between
five conflicting objective functions (three objectives
have been defined in the paper) is very attractive,
however widespread objective space makes the problem
very difficult if not impossible. Besides, FACTS
devices are incapable of improving all objectives in a
power system.
Instead of definition of a new objective function for
best re-dispatch, one can define an extra constraint for
running OPF to determine the optimal generations in
Eq. (5). In this case, two optimization must run together
in each iteration of the genetic algorithm. The first one
is used for determination of SM and the second is used
as a sub-problem for running OPF inside the main
algorithm. However, placement of the FACTS devices
for best re-dispatch is a separate problem which
researches have been used an independent heuristic
approach for this aim [12]. As a result, implementation
of the best re-dispatch concept in determination of the
security margin with the constraint of line thermal limits
is not used in this paper.
The optimization process starts with all lines as
initial candidates to locate TCSCs and all PQ buses as
initial candidates to locate SVCs. TCSC compensation
degree constraints have been assumed to be 70% for
TCSC in capacitive mode and 20% in inductive mode
[10]. In addition, considering the voltage of 1 pu for all
PQ buses, the susceptance of SVC can be changed
between 1 and –1 pu in power base of 100 MVA.
The problem solution has been found using genetic
algorithm based fuzzy multi-objective optimization
method. The parameters of GA i.e. number of
generations, size of population and mutation rate are set
to 45, 30 and 0.2 respectively. It must be mentioned that
the mutation rate is increased adaptively when the
possibility of convergence into a local optimum is
increased. Furthermore, two-point crossover (crossover
fraction is 0.8) and roulette wheel selection [20] have
been utilized to generate the next generation.
Table 1(a) Estimation of initial operating condition of the 14-bus renumbered network.
Voltage Bus Power Bus
Number Mag. (pu) Ang. P (MW) Q (MVAR)
1 1.08 0 0 0
2 1.08 0 157.7 0
3 1.08 0 214.1 0
4 1.08 0 98.0 0
5 1.09 0 0 0
6 1.00 0 167.8 31.6
7 1.00 0 102.9 54.9
8 1.00 0 0 0
9 1.00 0 57.8 16.8
10 1.00 0 19.0 5.80
11 1.00 0 53.5 7.80
12 1.00 0 16.1 6.60
13 1.00 0 27.3 5.80
14 1.00 0 25.4 10.0
Dow
nloa
ded
from
ijee
e.iu
st.a
c.ir
at 2
2:10
IRD
T o
n T
hurs
day
June
14t
h 20
18
Gitizadeh & Kalantar: FACTS Devices Allocation to Congestion Alleviation … 185
Table 1(b) Regulated bus data.
MVAR Limits MW Limits
Bus
Min. Max. Min. Max.
2 –50 100 0 200
3 –50 100 0 300
4 –50 100 0 200
5 –6 40 0 0
Table 2 System condition at voltage stability limit with and without TCSC / SVC (pi = qi = 0).
Voltage Mag (pu) Bus Power
Without
TCSC / SVC
With
TCSC / SVC Bus No.
Without
TCSC
/ SVC
With
TCSC
/ SVC
MW MVAR MW MVAR
1 1.08 1.080 32.160 49.24 35.200 44.51
2 1.08 1.080 161.07 81.60 168.04 78.39
3 1.08 1.080 218.68 –10.79 228.13 –16.71
4 1.043 1.061 100.09 100.0 104.42 100.0
5 1.090 1.090 0 24.69 0 15.71
6 0.994 1.000 171.27 32.25 178.65 33.64
7 0.974 0.980 105.03 56.04 109.55 58.45
8 1.050 1.065 0 0 0 0
9 1.013 1.041 59.000 17.15 61.540 17.89
10 0.996 1.038 19.390 5.920 20.230 6.170
11 0.982 1.012 54.610 7.960 56.960 8.300
12 1.006 1.030 16.430 6.740 17.140 7.030
13 1.003 1.024 27.860 5.920 29.060 6.170
14 0.972 0.996 25.930 10.21 27.040 10.65
SM without TCSC/SVC 0.0209
SM with TCSC/SVC 0.06152
Dow
nloa
ded
from
ijee
e.iu
st.a
c.ir
at 2
2:10
IRD
T o
n T
hurs
day
June
14t
h 20
18
Iranian Journal of Electrical & Electronic Engineering, Vol. 4, No. 4, October 2008 186
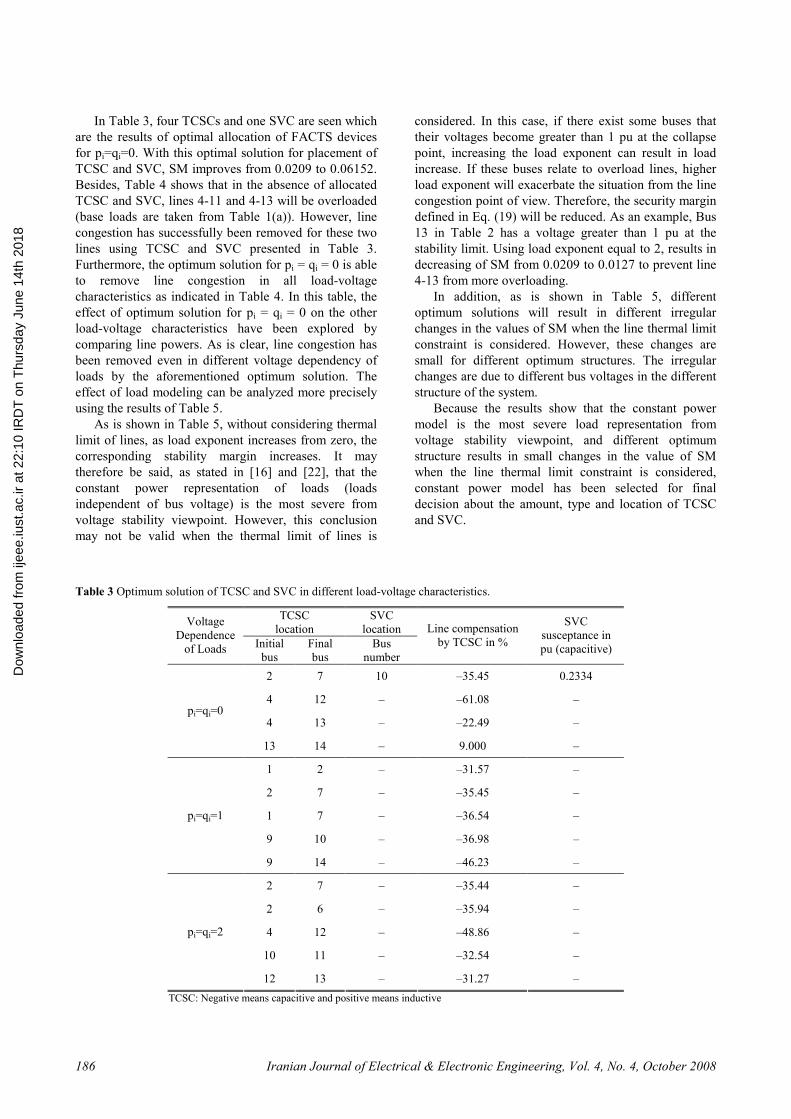
In Table 3, four TCSCs and one SVC are seen which
are the results of optimal allocation of FACTS devices
for pi=qi=0. With this optimal solution for placement of
TCSC and SVC, SM improves from 0.0209 to 0.06152.
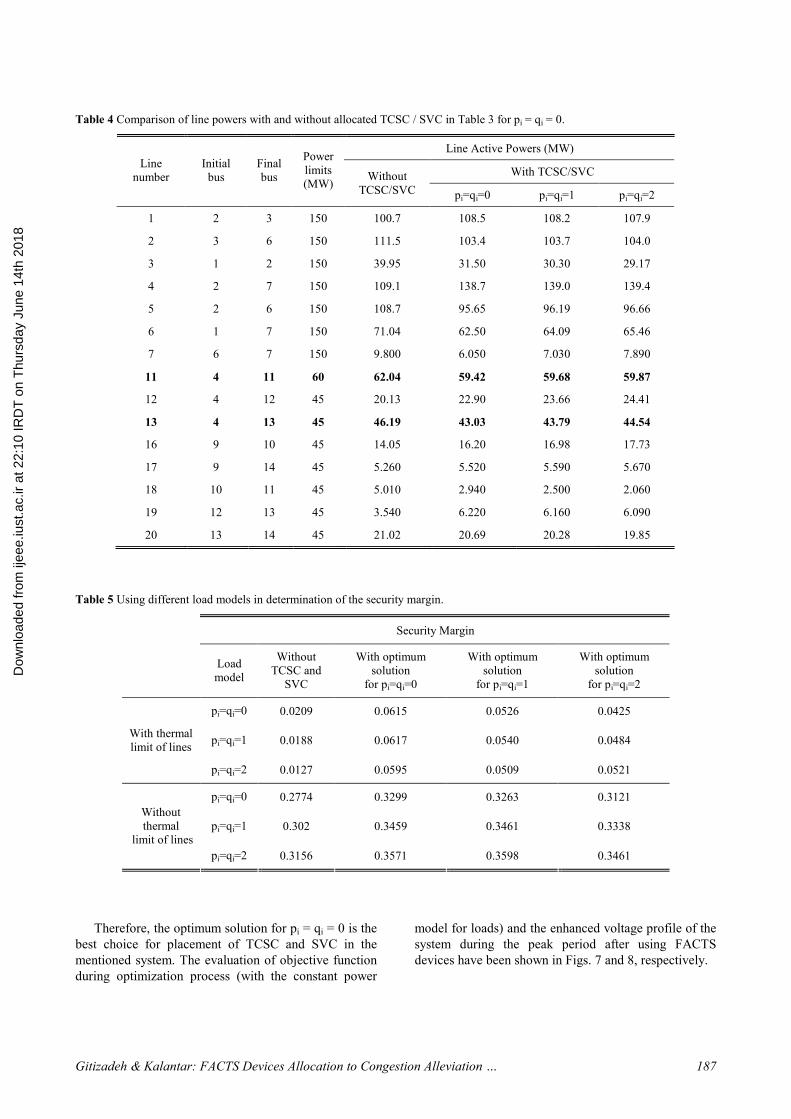
Besides, Table 4 shows that in the absence of allocated
TCSC and SVC, lines 4-11 and 4-13 will be overloaded
(base loads are taken from Table 1(a)). However, line
congestion has successfully been removed for these two
lines using TCSC and SVC presented in Table 3.
Furthermore, the optimum solution for pi = qi = 0 is able
to remove line congestion in all load-voltage
characteristics as indicated in Table 4. In this table, the
effect of optimum solution for pi = qi = 0 on the other
load-voltage characteristics have been explored by
comparing line powers. As is clear, line congestion has
been removed even in different voltage dependency of
loads by the aforementioned optimum solution. The
effect of load modeling can be analyzed more precisely
using the results of Table 5.
As is shown in Table 5, without considering thermal
limit of lines, as load exponent increases from zero, the
corresponding stability margin increases. It may
therefore be said, as stated in [16] and [22], that the
constant power representation of loads (loads
independent of bus voltage) is the most severe from
voltage stability viewpoint. However, this conclusion
may not be valid when the thermal limit of lines is
considered. In this case, if there exist some buses that
their voltages become greater than 1 pu at the collapse
point, increasing the load exponent can result in load
increase. If these buses relate to overload lines, higher
load exponent will exacerbate the situation from the line
congestion point of view. Therefore, the security margin
defined in Eq. (19) will be reduced. As an example, Bus
13 in Table 2 has a voltage greater than 1 pu at the
stability limit. Using load exponent equal to 2, results in
decreasing of SM from 0.0209 to 0.0127 to prevent line
4-13 from more overloading.
In addition, as is shown in Table 5, different
optimum solutions will result in different irregular
changes in the values of SM when the line thermal limit
constraint is considered. However, these changes are
small for different optimum structures. The irregular
changes are due to different bus voltages in the different
structure of the system.
Because the results show that the constant power
model is the most severe load representation from
voltage stability viewpoint, and different optimum
structure results in small changes in the value of SM
when the line thermal limit constraint is considered,
constant power model has been selected for final
decision about the amount, type and location of TCSC
and SVC.
Table 3 Optimum solution of TCSC and SVC in different load-voltage characteristics.
TCSC
location
SVC
location Voltage
Dependence
of Loads Initial
bus
Final
bus
Bus
number
Line compensation
by TCSC in %
SVC
susceptance in
pu (capacitive)
2 7 10 –35.45 0.2334
4 12 – –61.08 –
4 13 – –22.49 – pi=qi=0
13 14 – 9.000 –
1 2 – –31.57 –
2 7 – –35.45 –
1 7 – –36.54 –
9 10 – –36.98 –
pi=qi=1
9 14 – –46.23 –
2 7 – –35.44 –
2 6 – –35.94 –
4 12 – –48.86 –
10 11 – –32.54 –
pi=qi=2
12 13 – –31.27 –
TCSC: Negative means capacitive and positive means inductive
Dow
nloa
ded
from
ijee
e.iu
st.a
c.ir
at 2
2:10
IRD
T o
n T
hurs
day
June
14t
h 20
18
Gitizadeh & Kalantar: FACTS Devices Allocation to Congestion Alleviation … 187
Table 4 Comparison of line powers with and without allocated TCSC / SVC in Table 3 for pi = qi = 0.
Line Active Powers (MW)
With TCSC/SVC Line
number
Initial
bus
Final
bus
Power
limits
(MW) Without
TCSC/SVC pi=qi=0 pi=qi=1 pi=qi=2
1 2 3 150 100.7 108.5 108.2 107.9
2 3 6 150 111.5 103.4 103.7 104.0
3 1 2 150 39.95 31.50 30.30 29.17
4 2 7 150 109.1 138.7 139.0 139.4
5 2 6 150 108.7 95.65 96.19 96.66
6 1 7 150 71.04 62.50 64.09 65.46
7 6 7 150 9.800 6.050 7.030 7.890
11 4 11 60 62.04 59.42 59.68 59.87
12 4 12 45 20.13 22.90 23.66 24.41
13 4 13 45 46.19 43.03 43.79 44.54
16 9 10 45 14.05 16.20 16.98 17.73
17 9 14 45 5.260 5.520 5.590 5.670
18 10 11 45 5.010 2.940 2.500 2.060
19 12 13 45 3.540 6.220 6.160 6.090
20 13 14 45 21.02 20.69 20.28 19.85
Table 5 Using different load models in determination of the security margin.
Security Margin
Load
model
Without
TCSC and
SVC
With optimum
solution
for pi=qi=0
With optimum
solution
for pi=qi=1
With optimum
solution
for pi=qi=2
pi=qi=0 0.0209 0.0615 0.0526 0.0425
pi=qi=1 0.0188 0.0617 0.0540 0.0484 With thermal
limit of lines
pi=qi=2 0.0127 0.0595 0.0509 0.0521
pi=qi=0 0.2774 0.3299 0.3263 0.3121
pi=qi=1 0.302 0.3459 0.3461 0.3338
Without
thermal
limit of lines
pi=qi=2 0.3156 0.3571 0.3598 0.3461
Therefore, the optimum solution for pi = qi = 0 is the
best choice for placement of TCSC and SVC in the
mentioned system. The evaluation of objective function
during optimization process (with the constant power
model for loads) and the enhanced voltage profile of the
system during the peak period after using FACTS
devices have been shown in Figs. 7 and 8, respectively.
Dow
nloa
ded
from
ijee
e.iu
st.a
c.ir
at 2
2:10
IRD
T o
n T
hurs
day
June
14t
h 20
18

Iranian Journal of Electrical & Electronic Engineering, Vol. 4, No. 4, October 2008 188
0.3
0.4
0.5
0.6
0.7
0.8
0 5 10 15 20 25 30 35 40 45
Generation
Fitnes
s Valu
e
Fig. 7 Objective function evaluation during GA optimization.
0.96
0.98
1
1.02
1.04
1.06
1.08
1.1
1 2 3 4 5 6 7 8 9 10 11 12 13 14
Bus Number
Voltage Pro
file (pu)
Without FACTS
With FACTS
Fig. 8 Voltage profile of IEEE renumbered buses in peak load.
6 Conclusions
In this paper a novel approach has been proposed to
determine the optimum amounts, locations, type and
number of TCSCs and SVCs based on a multi-objective
function.
In this method the allocation problem is investigated
with practical considerations. One of these
considerations is using the estimated annual load curve,
which makes the allocation more accurate. Optimization
process utilizes the combination of genetic algorithm,
fuzzy method and sequential quadratic programming to
find the optimum solution. The optimum allocated
devices have been employed as power flow controllers
along system branches or buses in an attempt to enhance
both voltage profile and security margin of the system
without line congestion.
In contrast to some previous researches, an objective
function representing number of the devices is
considered along with other objectives to reach an
economical solution. However, it has been assumed that
the costs of devices are similar regardless of their
capacities. In order to achieve more realistic results in
the future work, the cost objective function can be
constituted by active power loss cost and FACTS
devices investment cost considers interest rates and
capacity of the devices.
Dow
nloa
ded
from
ijee
e.iu
st.a
c.ir
at 2
2:10
IRD
T o
n T
hurs
day
June
14t
h 20
18
Gitizadeh & Kalantar: FACTS Devices Allocation to Congestion Alleviation … 189
Renumbered IEEE 14-bus test system has been used
to validate the performance and effectiveness of the
proposed method. Numerical results confirm that the
installation of five optimally allocated TCSCs and
SVCs can remove the line congestion and improve the
security margin with a better voltage profile.
Furthermore, results show that the constant power
model is the best choice for modeling of the loads.
Therefore, optimal structure has been obtained from
optimization procedure using constant power model for
representation of the loads.
References
[1] Lee B. H. and Lee K. Y., “Dynamic and static
voltage stability enhancement of power systems,”
IEEE Transactions on Power System, Vol. 8, No.
1, pp. 231-238, Feb. 1993.
[2] Kessel P. and Glavitch H., “Estimating the
voltage stability of power systems,” IEEE
Transactions on Power Delivery, Vol. 1, No. 3,
pp. 346-354, Jul. 1986.
[3] Barkovich B. R. and Hawk D. V., “Charting a
new course in California,” IEEE Spectrum, Vol.
33, No. 7, pp. 26-31, Jul. 1996.
[4] Okamoto H., Kurita A. and Sekine Y., “A method
for identification of effective locations of variable
impedance apparatus on enhancement of steady-
state stability in large-scale power systems,”
IEEE Transactions on Power System, Vol. 10,
No. 3, pp. 1401-1407, Aug. 1995.
[5] Sharma N. K., Ghosh A. and Varma R. K., “A
novel placement strategy for FACTS controllers,”
IEEE Transactions on Power Delivery, Vol. 18,
No. 3, pp. 982-987, Jul. 2003.
[6] Yorino N., EL-Araby E. E., Sasaki H. and Harada
S. H., “A new formulation for FACTS allocation
for security enhancement against voltage
collapse,” IEEE Transactions on Power System,
Vol. 18, No. 1, pp. 3-10, Feb. 2003.
[7] Chang C. S and Huang J. S., “Optimal multi-
objective SVC planning for voltage stability
enhancement,” IEE Proceedings on Generation
Transmission and Distribution, Vol. 145, No. 2,
pp. 203-209, Mar. 1998.
[8] Song S. H., “Installation and operation of FACTS
devices for enhancing steady-state security,”
Electric Power Systems Research, Vol. 70, No. 1,
pp. 7-15, Jun. 2004.
[9] Lu Y. and Abur A., “Static security enhancement
via optimal utilization of Thyristor Controlled
Series Capacitors,” IEEE Transactions on Power
System, Vol. 17, No. 2, pp. 324-329, May 2002.
[10] Gerbex S., Cherkaoui R. and Germond A. J.,
“Optimal location of FACTS devices to enhance
power system security,” IEEE Bologna Power
Tech Conference, Bologna, Italy, Vol. 3, 23-26
June 2003.
[11] Singh S. N. and David A. K., “Congestion
management by optimizing FACTS device
location,” IEEE International Conference on
Electric Utility Deregulation, Restructuring and
Power Technologies, pp. 23-28, 4-7 Apr. 2000.
[12] Ongsakul W. and Bhasaputra P., “Optimal power
flow with FACTS devices by hybrid TS/SA
approach,” Electrical Power and Energy Systems,
Vol. 24, No. 10, pp. 851-857, Dec. 2002.
[13] Wang H. F., “Selection of robust installing
locations and feedback signals of FACTS-based
stabilizers in multi-machine power systems,”
IEEE Transactions on Power System, Vol. 14,
No. 2, pp. 569-574, May 1999.
[14] Yang N., Liu Q. and Mc Calley J. D., “TCSC
control design for damping inter-area
oscillations,” IEEE Transactions on Power
System, Vol. 13, No. 4, pp. 1304-1310, Nov.
1998.
[15] Borresmans P., Calvaer A., de Reuck J. P.,
Goosens J., Van Geert E., Van Hecke J. and Van
Ranst A., “Voltage stability – fundamental
concepts and comparison of practical criteria,”
CIGRE Report, pp. 38-11, 1985.
[16] Obadina O. O. and Berg G. J., “Determination of
voltage stability limit of multi-machine power
systems,” IEEE Transactions on Power System,
Vol. 3, No. 4, pp. 1545-1554, Nov. 1988.
[17] Narayana P. P. and Abdel Moamen M. A.,
“Power flow control and solutions with multiple
and multi-type FACTS devices,” Electric Power
Systems Research, Vol. 74, No. 3, pp. 341-351,
Jun. 2005.
[18] Ambriz-Perez H., Acha E. and Fuerte-Esquivel C.
R., “Advanced SVC model for newton-raphson
load flow and newton optimal power flow
studies,” IEEE Transactions on Power System,
Vol. 15, No. 1, pp. 129-136, Feb. 2000.
[19] Huang Y. C., “Enhanced genetic algorithm-based
fuzzy multi-objective approach to distribution
network reconfiguration,” IEE Proceedings on
Generation Transmission and Distribution, Vol.
149, No. 5, pp. 615-620, Sep. 2002.
[20] Goldberg D. E., Genetic algorithms in search,
optimization and machine learning. Addison-
Wesley, 1989.
[21] Freris L. L. and Sasson A. M., “Investigation of
the load-flow problem,” IEE Proceedings, Vol.
115, No. 10, pp. 1459-1470, Oct. 1968.
[22] Zhang X., Rehtanz Ch. and Pal B., Flexible AC
Transmission Systems: Modelling and Control.
Springer-Verlag, Berlin Heidelberg, 2006.
Dow
nloa
ded
from
ijee
e.iu
st.a
c.ir
at 2
2:10
IRD
T o
n T
hurs
day
June
14t
h 20
18
Iranian Journal of Electrical & Electronic Engineering, Vol. 4, No. 4, October 2008 190
Mohsen Gitizadeh was born in
February, 1976 in Iran. He received
his B.Sc. degree in Electrical
Engineering from Shiraz University
in 1999, and his M.Sc. degree from
Iran University of Science and
Technology, respectively. Mr.
Gitizadeh is currently Ph.D.
candidate in the Department of
Electrical Engineering at the Iran
University of Science and Technology, Tehran, Iran. His
current research interests are in the areas of Power System
Operation and Control, Voltage Stability and Optimization,
Demand Side Management, and FACTS Devices.
Mohsen Kalantar was born on 11th
September 1961 in Iran. He received
his Ph.D. from Indian Institute of
Technology, New Delhi, India in
1991. Dr. Kalantar is currently an
Associate Professor in the
Department of Electrical
Engineering at Iran University of
Science and Technology in Tehran.
He is also member of Center of
Excellence for Power System Automation and Operation. He
has above 20 Journal publications and has presented 80 papers
at International Conferences. His field of interest includes
Wind and Solar Power Generation, Power System Dynamics
and Control, System Stability and Optimization, Power
System Deregulation, and FACTS Devices.
Dow
nloa
ded
from
ijee
e.iu
st.a
c.ir
at 2
2:10
IRD
T o
n T
hurs
day
June
14t
h 20
18


![K I ? P B : E V G U ? B D H F ; B G B J H < : G G U ? F ? L H > U H ; H … · 2021. 2. 10. · I _ j _ q _ g v b \ b ^ u a Z ^ Z g b c b ] j Z n b d b o \ u i h e g _ g b y:](https://static.fdocuments.us/doc/165x107/60ec6f5790d1f23e58150d5e/k-i-p-b-e-v-g-u-b-d-h-f-b-g-b-j-h-g-g-u-f-l-h-u-h-h-2021.jpg)
![Z g b H j ] Z g b a Z p b b H [ t ^ b g g g u o G Z p b c ... · ИЮНЬ 2020 ГОДА H J = : G B A : P B Y ? > B G ? G G B C КОМПЛЕКСНОЕ РЕАГИРОВАНИЕ ОРГАНИЗАЦИИ](https://static.fdocuments.us/doc/165x107/603bd12ab6ea785af14f20f4/z-g-b-h-j-z-g-b-a-z-p-b-b-h-t-b-g-g-g-u-o-g-z-p-b-c-2020-.jpg)


![h h o j Z g g b y g Z m ] j h a m i j b f g g b y [ b h e ... · h h o j Z g g b y g Z m ] j h a m i j b f g g b y [ b h e ... ... < < ? > ? g b ?](https://static.fdocuments.us/doc/165x107/5ed4db9a37f0076b752106ca/h-h-o-j-z-g-g-b-y-g-z-m-j-h-a-m-i-j-b-f-g-g-b-y-b-h-e-h-h-o-j-z-g-g-b-y.jpg)