
Ijcsr 000085
17
Govindarajan & Prabaharan 2016 806 Volume: 2; Issue: 7; July -2016; pp. 806-822. ISSN: 2454-5422 Physico chemical analysis of Municipal Solid Waste (MSW) dumping yard soil from Tuticorin City B.Govindarajan* and V.Prabaharan 1 Assistant Professor, Department of Zoology, VHNSN College (Autonomous), Virudhunagar, India 1 Assistant Professor, Department of Zoology, Government Arts College, Melur, Madurai, India *Corresponding Author E-mail: [email protected] Abstract This research paper deals with the physico-chemical characteristics of municipal solid waste (MSW) dumping site soil in Tuticorin city. The characteristics of MSW dumped soil, i.e., pH, electrical conductivity, micronutrients (Fe, Mn, Zn, Cu) and macronutrients (N, P, K) were evaluated. The use of MSW as vermicompost offers a unique opportunity for economical disposal. Loss of biodiversity can be observed due to open dumping of solid waste. Accumulation of hazardous substances is the common phenomenon in open dumping of MSW. It affects the food chain and food web. It’s a very dangerous effect later on. The dumping site always surrounded by scavenging animals and such unwanted things along with the strong odour. The analysis of MSW dumping site soil indicates that it is good source of nutrients for the agriculture sector. On the basis of result MSW compost can be recommended to the farmers. Keywords: Municipal Solid Waste, Physico chemical analysis, Tuticorin Introduction During the present research Tuticorin city from Tamilnadu state was selected as a study area to study the physico-chemical characterizations of municipal solid waste (MSW) dumping yard soil. Tuticorin is one of the important, rapidly growing city from Tamilnadu state of India. The area of the district is 4621 Sq.k.m. and the population is 1738376 (as per 2011 census). The Tuticorin city generates solid wastes of about 110 metric tonnes per day, i.e. a per capita solid waste of about 500 grams per day. The solid waste clearance is managed both
-
Upload
drbgr-publications -
Category
Education
-
view
40 -
download
0
Transcript of Ijcsr 000085
Govindarajan & Prabaharan 2016 806
Volume: 2; Issue: 7; July -2016; pp. 806-822. ISSN: 2454-5422
Physico chemical analysis of Municipal Solid Waste (MSW) dumping yard soil
from Tuticorin City
B.Govindarajan* and V.Prabaharan
1Assistant Professor, Department of Zoology, VHNSN College (Autonomous), Virudhunagar, India1Assistant Professor, Department of Zoology, Government Arts College, Melur, Madurai, India
*Corresponding Author E-mail: [email protected]
Abstract
This research paper deals with the physico-chemical characteristics of municipal solid waste
(MSW) dumping site soil in Tuticorin city. The characteristics of MSW dumped soil, i.e., pH,
electrical conductivity, micronutrients (Fe, Mn, Zn, Cu) and macronutrients (N, P, K) were
evaluated. The use of MSW as vermicompost offers a unique opportunity for economical
disposal. Loss of biodiversity can be observed due to open dumping of solid waste.
Accumulation of hazardous substances is the common phenomenon in open dumping of
MSW. It affects the food chain and food web. It’s a very dangerous effect later on. The
dumping site always surrounded by scavenging animals and such unwanted things along with
the strong odour. The analysis of MSW dumping site soil indicates that it is good source of
nutrients for the agriculture sector. On the basis of result MSW compost can be
recommended to the farmers.
Keywords: Municipal Solid Waste, Physico chemical analysis, Tuticorin
Introduction
During the present research Tuticorin city from Tamilnadu state was selected as a study area
to study the physico-chemical characterizations of municipal solid waste (MSW) dumping
yard soil. Tuticorin is one of the important, rapidly growing city from Tamilnadu state of
India. The area of the district is 4621 Sq.k.m. and the population is 1738376 (as per 2011
census). The Tuticorin city generates solid wastes of about 110 metric tonnes per day, i.e. a
per capita solid waste of about 500 grams per day. The solid waste clearance is managed both
Volume: 2; Issue: 7; July-2016. ISSN: 2454-5422
Govindarajan & Prabaharan 2016 807
by the corporation and private contractors and is not adequately mechanized. The
performance efficiency is about 50% (www.municipalities.tn.in).
The solid waste collected is transported to a compost yard at Tharuvaikulam, about 12 km
away from the city and the yard does not have facilities for segregation of the mixed waste,
waste processing, leveling and compaction. This, therefore, creates environmental hazards.
Compliance with the Municipal Solid Waste (Management and Handling) Rules, 2000 is
inadequate in collection, storage, transportation and disposal. According to the Rules,
municipal bodies must make it mandatory for households/industries to segregate and store
waste at source till collection by the corporation. The rules also prescribe the practices to be
followed for vermicomposting of biodegradable wastes and anaerobic digestion or any other
appropriate biological processing for the stabilization of wastes.
Dumping of MSW leads to change in following characterizations of soil Odour, Ground
water pollution, Permeability, Bearing capacity, Porosity, Degree of saturation, Alkalinity,
pH, Micronutrients and Macronutrients. The above mentioned changes are adverse by
agricultural point of view. This decreases the fertility of soil. Dumping of solid waste,
destructs the habitat of beneficial microorganisms due to change in chemical environment. It
can be observed by the odour coming from the soil after water sprinkled. Loss of biodiversity
can be observed in open dumping site area. Accumulation of hazardous substances is the
common phenomenon in open dumping of MSW. It affects the food chain and food web. It’s
a very dangerous effect later on. The dumping site always surrounded by scavenging animals
and such unwanted things along with the strong odour (Dwivedi et al 2014).
Physico-chemical characterizations of micro and macro nutrients of compost soil have been
performed for MSW soil, to assess its quality for applying as soil conditioner to promote the
growth of earthworm. Earthworm was important contributor to the soil decomposer. The
present study was undertaken with the following objectives
We recommend to avoid open dumping of municipal solid waste
Assessment of municipal solid waste dumping site soil characteristics
Suggestions for cost effective better management of MSW by earthworms
We propose MSW as a bio fertilizer
Volume: 2; Issue: 7; July-2016. ISSN: 2454-5422
Govindarajan & Prabaharan 2016 808
Material and Methods
Study Area
Tuticorin Corporation has 534 acres compost yard at Tharuvaikulam 12 kms away from
Tuticorin. The solid wastes collected from 58 wards and shifted to compost yard. Soil
collection site named as S1, S2 and S3 (Table 1).
Sampling
Sampling is the important stage in physico-chemical analysis of MSW dumping site soil
analyses. The results produced are very accurate, only if the sampling stages should be
carried out in a systematic manner and as per the standard procedures for soil. The test
portion is made representative because the final result is completely dependent on the
sampling. Sampling includes site selection, sample volume, sample preservation, sampling
devices, preservation at site, transport to laboratory and preservation in laboratory before
analysis.
Soil Sampling
The aim of soil sampling is to obtain a small portion of the sample that accurately represents
the characteristics of the particular location being sampled. Less quantity of soil sample is
actually used for the laboratory analysis. That small amount of soil must represent the entire
area for which the recommendation to be made. This is referred to as taking a representative
sample and is vitally important because the conclusions derived that are ultimately drawn
from the data obtained from the analysis. For authentic report, representative soil sample is
essential for soil testing to find out the contamination and its estimation. Therefore, to take
accurate soil sample, a proper methodology with clear objective, time, depth and tools were
followed (IS:2720 (1983)).
Soil Sample collection at site
Soil sample collection site locations were fixed previously. Depending upon the soil texture
the soil sampling tools were selected. Tube auger and spade were used for soft and moist soil.
Screw auger was used for hard and dry soil. Sampling equipment was cleaned with water
initially and wiped with clean cotton cloth. Sampling site was cleaned properly by scrapping
the litter and plant parts from the soil surface. Generally the sample digging was done in such
Volume: 2; Issue: 7; July-2016. ISSN: 2454-5422
Govindarajan & Prabaharan 2016 809
a way that V-shape hole was made and cut out a uniformly thick 2.5cm slice of soil from
bottom to top of the exposed surface. Random collection of soil sample from each unit at
desired depth from 3 spots separately in a field is known as primary sample.
The seasonal variation survey of aged soil was conducted around Tuticorin Corporation solid
waste dumping site area from June-2011 to May-2012. Three samples of aged soils were
collected in each season (post-monsoon, summer, pre-monsoon and monsoon). All samples
were coded. For aged soil samples the codes are given as S1 to S3. Three aged soil samples
were collected in and around the compost site.
Aged soils were collected from three different sites in the compost yard at Tharuvaikulam.
Aged soil samples were collected from the top 15 cm layer of the sampling stations. Prior to
collection, top layer soils were hand sorted and plant materials as well as litter were carefully
removed from the soil. About 500 g of aged soil were taken in individual labeled sterile
polythene bags from three sites.
Preparation of soil sample
Soil samples were air dried in shade by spreading on plastic sheets. They were cleaned by
discarding plant residues, gravels, coarse materials, stones and other debris if present. The
cleaned soil samples were stored in a clean polythene bag. The soil samples were labeled
immediately in the form of tags to prevent sample misidentification and given a unique
sample number, sampling code, sampling time and special note if any.
Soil Sample Laboratory Analysis
The physico-chemical characteristic of the aged soil was analyzed, from Kovilpatti
agriculture soil testing laboratory. pH, such as several parameters micronutrients
(Fe,Mn,Zn,Cu), macronutrients (N,P,K), soil texture, calcium carbonate, were analyzed.
Result
In the present study the micro and macro nutrients were analysed for better management of
municipal solid waste in Tharuvaikulam of Tuticorin city. The study areas were designated as
S1, for Tharuvaikulam main gate, S2, for Tharuvaikulam second gate, S3, for Tharuvaikulam
third gate were selected (Table 1). Table 1 revealed the presence of different soil samples of
Tuticorin municipal solid waste. The physico-chemical characteristics and essential nutrient
Volume: 2; Issue: 7; July-2016. ISSN: 2454-5422
Govindarajan & Prabaharan 2016 810
sample collected from different sites and different stages such as Pre-Monsoon, Winter,
Monsoon and Post-Monsoon season were listed in Table 2.
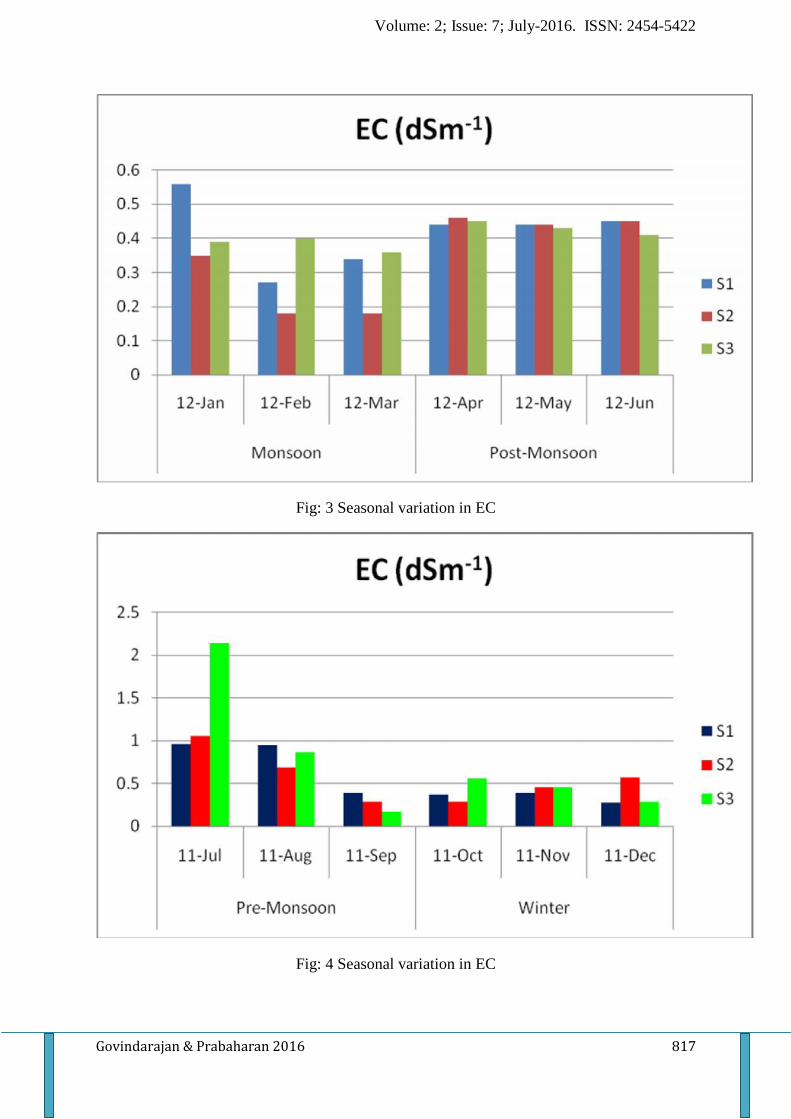
In the present study, the study area S1 was found to be moderate with salinity expressed as
dsm-1, observed during the month of July 2011 to June 2012 (12 months). Among the 3
different study area namely S1, S2 and S3. S2 exhibited a constant increase in salinity in soil
were recorded, where as S3 exhibited 0.4 observed during the month of June followed by a
constant decrease in salinity with 2.5 observed during the month of July. It is then found to
decrease in salinity gradually (Table 3 & 4).
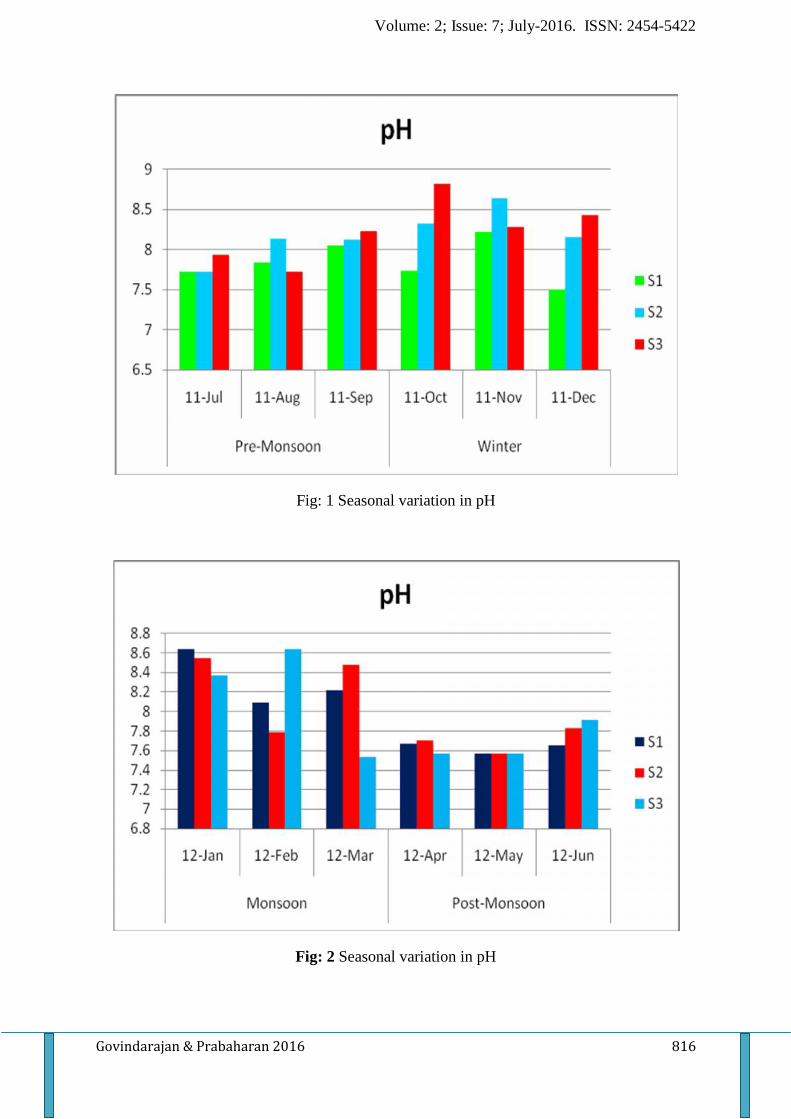
The pH of the municipal solid waste soil was found to be slightly basic in pre-monsoon
followed by an enhanced basic pH in monsoon period. It is observed that similar pattern of
pH in site 2 Tharuvaikulam was recorded but during monsoon period a basic pH was
constantly maintained. However, during the month of January, February and March pH was
found to be increased with 8.46 observed for site 2. This indicated during monsoon, due to
heavy rainfall there is a gradual change in salinity which may lead to a change in pH. In site 3
the pH was found to be slightly above the neutral during the month of June, July and August.
In monsoon period a slight increase in pH with 8.81, 8.28, 8.42 followed by pH of 7.58 was
recorded during the month of January, February and March (Table 3 & 4).
The micronutrient present in the Tuticorin corporation dumping site soil analysed for the
month of July, 2011, Fe content ranges from 6.83 ± 0.02, 12.79 ± 0.06 and 5.57 ± 0.02 mg
recorded for S1, S2, S3 respectively, where as Mn ranges from 3.75 ± 0.02 to 3.44 ± 0.04 mg,
Zn ranges from 9.97 ± 0.02 to 25.15 ± 0.04 mg and the heavy metal Cu ranges from 3.35 ±
0.05, 5.97 ± 0.02 and 4.82 ± 0.02 mg observed for S1, S2 and S3. The macronutrients recorded
for N, P, K was determined for the month of July, 2011. It was observed that nitrogen content
was found to be 171.67 ± 0.58,171.67 ± 1.53 and 172 ± 1.0 mg/kg recorded for site S1, S2 and
S3 respectively, where as the phosphorous ranges from 8.57 ± 0.21 to 9.13 ± 0.15 mg/kg in the
case of phosphorous for different sites. The level of potassium was found to be with 499.33 ±
1.15,500 ± 1.0, 499.63 ± 2.52 mg/kg recorded for site S1, S2 and S3 respectively.
Studies carried out with micronutrient analysis observed during the month August revealed
5.73 ± 0.02, 10.63 ± 0.02 and 4.74 ± 0.02 mg recorded for the presence of Fe content in
different locations such as S1, S2 and S3. However analysis of Mn during the month of
August exhibited a range of from 4.57 ± 0.03, 4.86 ± 0.03 and a decline of 4.35 ± 0.03 mg was
noted. Analysis for Zn was found in ranges from 8.17 ± 0.02, 9.36 ± 0.02 and 10.16 ± 0.02 mg,
Volume: 2; Issue: 7; July-2016. ISSN: 2454-5422
Govindarajan & Prabaharan 2016 811
Cu revealed a range of from 2.55 ± 0.04, 4.54 ± 0.02 and 8.91 ± 0.02 mg observed for S1, S2
and S3 respectively, for the month of August, 2011. The macronutrients recorded for N, P, K
was determined for the month of August, 2011. It was observed that nitrogen content was
found to be 172.33 ± 1.53 mg/kg to 173 ± 1.0 mg/kg where as the phosphorous ranges from
9.13 ± 0.15 to 7.57 ± 0.35 mg/kg in the case of phosphorus for different sites. The level of
potassium was found to be with 500.33 ± 0.58, 502.33 ± 2.08 and 498.67 ± 1.53 mg/kg
recorded for site S1, S2 and S3 respectively.
In a similar study with micronutrients analysis during the month September revealed 2.04 ±
0.03 , 6.95 ± 0.02 and 3.18 ± 0.01 mg were recorded for the presence of Fe content in different
locations such as S1, S2 and S3. The analysis for Mn during the month of September varied
with a range of from 0.94 ± 0.03, 0.18 ± 0.01 and 0.38 ± 0.01 mg. The analysis for Zn was
found to be from 13.14 ± 0.02, 24.68 ± 0.03 and 13.14 ± 0.02 mg, Cu ranges from 0.29 ± 0.01,
0.48 ± 0.02 and 0.16 ± 0.02 mg observed for S1, S2 and S3 respectively, for the month of
September, 2011. The macronutrients recorded for N, P, K was determined for the month of
September, 2011. It was observed that nitrogen content was found to be range from 90 ± 1.0
to 135.67 ± 1.53 mg/kg. However range of phosphorous exhibited from 8.5 ± 0.01 to 11.63 ±
0.15 mg/kg in the case of phosphorus for different sites. The level of potassium was found to
be range from 501 ± 1.0 to 341.67 ± 1.53 mg/kg recorded for site S1, S2 and S3 respectively.
Moreover, studies made with micronutrient analysis carried out during the month October
2011 revealed 6.77 ± 0.02, 4.54 ± 0.03 and 5.45 ± 0.03 mg were recorded for the presence of
Fe content in different locations such as S1, S2 and S3. The analysis for Mn during the month
of October range from 0.26 ± 0.02, 0.82 ± 0.02 and 1.24 ± 0.02 mg. The analysis for Zn range
from 21.84 ± 0.03, 19.45 ± 0.03 and 18.35 ± 0.04 mg, where as Cu range from 0.25 ± 0.02,
0.24 ± 0.02 and 0.26 ± 0.02 observed for S1, S2 and S3 respectively, for the month of October,
2011. The macronutrients recorded for N, P, K determined for the month of October, 2011. It
was observed that nitrogen content was found to be decreased from 172.33 ± 1.53 to 84.67 ±
1.15 mg/kg where as the phosphorous range also differ from 11.6 ± 0.2 to 9.13 ± 0.15 mg/kg in
the case of phosphorus for different sites. The level of potassium was found to be with 203 ±
2.0, 361.33 ± 1.53 and 508.67 ± 1.53 mg/kg recorded for site S1, S2 and S3 respectively.
Simultaneously, study was carried out for micronutrients analysis during the month
November 2011 revealed 2.45 ± 0.02, 2.45 ± 0.03 and 2.35 ± 0.03 mg were recorded for the
presence of Fe content in different locations such as S1, S2 and S3. Analysis for Mn during
Volume: 2; Issue: 7; July-2016. ISSN: 2454-5422
Govindarajan & Prabaharan 2016 812
the month of November ranges from 3.32 ± 0.02, 3.36 ± 0.02 and 3.37 ± 0.02 mg. The analysis
for Zn ranges from 1.19 ± 0.01, 1.16 ± 0.03 and 1.15 ± 0.03 mg, Cu ranges from 1.24 ± 0.01,
1.27 ± 0.02 and 1.27 ± 0.03 mg observed for S1, S2 and S3 respectively, for the month of
November, 2011. The macronutrients recorded for N, P, K was determined for the month of
November, 2011. It was observed that nitrogen content was found to be 116.33 ± 1.53 to 171
± 1.0 mg/kg where as the phosphorous range from 9.3 ± 0.2 to 9.13 ± 0.15 mg/kg, in the case
of phosphorus for different sites. The level of potassium was found to be 419.6 ± 1.53, 451.33
± 1.53 and 499.67 ± 1.53 mg/kg recorded for site S1, S2 and S3 respectively.
In another study with micronutrient analysis recorded during the month December 2011
revealed 5.44 ± 0.03, 5.23 ± 0.02 and 6.05 ± 0.02 mg were recorded for the presence of Fe
content in different locations such as S1, S2 and S3. The analysis for Mn during the month of
December range from 1.95 ± 0.02, 1.82 ± 0.02 and 1.82 ± 0.02 mg. The analysis for Zn range
from 10.16 ± 0.05, 12.33 ± 0.03 and 10.28 ± 0.02 mg. Moreover Cu range from 0.25 ± 0.03,
0.26 ± 0.02 and 0.26 ± 0.01 mg observed for S1, S2 and S3 respectively, for the month of
December. The macronutrients recorded for N, P, K was determined for the month of
December, 2011. It was observed that nitrogen content was found to be increased from 116 ±
2.0 to 153 ± 2.0 mg/kg where as the phosphorous ranges from 7.4 mg/kg. Similarly,
phosphorus exhibited a value of 7.37 ± 0.15, 6.87 ± 0.06 and 7.43 ± 0.15 mg for different sites.
The level of potassium was found to be 286.67 ± 1.53, 498.67 ± 1.53 and 206.33 ± 1.53 mg/kg
recorded for site S1, S2 and S3 respectively.
The analysis of micronutrient observed during the month January 2012 revealed 6.13 ± 0.02,
5.95 ± 0.02 and 5.72 ± 0.03 mg were recorded for the presence of Fe content in different
locations such as S1, S2 and S3. The analysis for Mn during the month of January range from
1.85 ± 0.02, 1.77 ± 0.02 and 1.84 ± 0.04 mg. The analysis for Zn varied from 11.74 ± 0.02,
12.53 ± 0.04 and 12.05 ± 0.03 mg, However Cu range was found to be from 0.38 ± 0.02, 0.26 ±
0.02 and 0.32 ± 0.02 mg observed for S1, S2 and S3 respectively, for the month of January,
2012. The macronutrients recorded for N, P, K was determined for the month of January,
2012. It was observed that nitrogen content was found to be 96 ± 1.0 to 142 ± 2.65 mg/kg
where as the phosphorous range from 5.77 ± 0.15 to 7.3 ± 0.1 mg/kg in the case of phosphorus
for different sites. The level of potassium was found to be with 498.67 ± 1.53,499 ± 1.0 and
498.67 ± 1.53 mg/kg recorded for site S1, S2 and S3 respectively.
Volume: 2; Issue: 7; July-2016. ISSN: 2454-5422
Govindarajan & Prabaharan 2016 813
Simultaneously, in a similar study with micronutrient analysis during the month February
revealed 6.77 ± 0.02, 7.07 ± 0.03 and 7.13 ± 0.02 mg recorded for the presence of Fe content in
different locations such as S1, S2 and S3. The analysis for Mn during the month of February
range from 1.94± 0.02, 1.63± 0.03 and 1.85± 0.02 mg. The analysis for Zn range from 12.14 ±
0.02, 11.17 ± 0.03 and 11.83 ± 0.02 mg respectively, Cu range from 0.47 ± 0.03, 0.53 ± 0.02
and 0.64 ± 0.03 mg observed for S1, S2 and S3 respectively, for the month of February, 2012.
The macronutrients recorded for N, P, K was determined for the month of February, 2012. It
was observed that nitrogen content was found with value of 136 ± 1.0,127 ± 1.0 and 136 ± 2.0
mg/kg where as the phosphorous range increase from 12.67± 0.25 to 13.17± 0.21 mg/kg in the
case of phosphorus for different sites. The level of potassium was found to have values as
498.33 ± 2.08, 498.67 ± 1.53 and 499 ± 1.0 mg/kg recorded for site S1, S2 and S3 respectively.
The micronutrient analysis studied made with micronutrients analysis during the month
March revealed 7.84 ± 0.03, 6.94 ± 0.03 and 7.12 ± 0.02 mg, recorded for the presence of Fe
content in different locations such as S1, S2 and S3. The analysis for Mn during the month of
March ranges from 1.74 ± 0.02, 1.84 ± 0.02 and 1.75 ± 0.03 mg. The analysis for Zn range
from 12.12 ± 0.03, 11.82 ± 0.02 and 12.13 ± 0.02 mg. Whereas, Cu range from 0.69 ± 0.01,
0.56 ± 0.02 and 0.84 ± 0.03 mg observed for S1, S2 and S3 respectively, for the month of
March, 2012. The macronutrients recorded for N, P, K was determined for the month of
March, 2012. It was observed that nitrogen content was found to be 132.33 ± 1.53, 122 ± 2.65
and 130 ± 1.0 mg/kg where as the phosphorus ranges from 13.4 ± 0.2 to 10.5 ± 0.2 mg/kg in
the case of phosphorus for different sites. The level of potassium was found to be range from
498.67 ± 1.53 to 450.33 ± 1.53 mg/kg recorded for site S1, S2 and S3 respectively.
The micronutrient analysis studied made with micronutrients analysis during the month April
2012 revealed 17.37 ± 0.31, 19.7 ± 0.61 and 14.53 ± 0.5 mg, recorded for the presence of Fe
content in different locations such as S1, S2 and S3. The analysis for Mn during the month of
April ranges from 5.79 ± 0.35, 6.6 ± 0.26 and 8.63 ± 0.25 mg. The analysis for Zn range from
17.56 ± 0.23, 20.71 ± 0.29 and 11.66 ± 0.27 mg. Whereas, Cu range from 17.73 ± 0.32, 15.55 ±
0.37 and 6.44 ± 0.11 mg observed for S1, S2 and S3 respectively, for the month of April,
2012. The macronutrients recorded for N, P, K was determined for the month of April, 2012.
It was observed that nitrogen content was found to be 154.2 ± 1.24, 142.2 ± 0.33 and 141.46 ±
0.44 mg/kg where as the phosphorus ranges from 5.77 ± 0.23 to 4.82 ± 0.1 mg/kg in the case
of phosphorus for different sites. The level of potassium was found to be range from 496.61 ±
0.54 to 496.15 ± 0.82 mg/kg recorded for site S1, S2 and S3 respectively.
Volume: 2; Issue: 7; July-2016. ISSN: 2454-5422
Govindarajan & Prabaharan 2016 814
Simultaneously, in a similar study with micronutrient analysis during the month May 2012
revealed 18.2 ± 0.3, 20.07 ± 0.24 and 15.69 ± 0.6 mg recorded for the presence of Fe content
in different locations such as S1, S2 and S3. The analysis for Mn during the month of May
range from 5.97± 0.21, 6.82± 0.11 and 8.84 ± 0.09 mg. The analysis for Zn range from 17.85 ±
0.08, 20.48 ± 0.18 and 12.17 ± 0.34 mg respectively, Cu range from 17.16 ± 0.71, 15.78 ± 0.35
and 6.39 ± 0.42 mg observed for S1, S2 and S3 respectively, for the month of May, 2012. The
macronutrients recorded for N, P, K was determined for the month of May, 2012. It was
observed that nitrogen content was found with value of 154.09 ± 1.02, 140.88 ± 0.82 and
139.12 ± 0.9 mg/kg where as the phosphorous range increase from 4.67± 0.42 to 3.9± 0.1
mg/kg in the case of phosphorus for different sites. The level of potassium was found to have
values as 495.2 ± 1.13, 495.77 ± 1.07 and 494.57 ± 4.0 mg/kg recorded for site S1, S2 and S3
respectively.
The physico-chemical characteristics of soil pertaining to micronutrients and macronutrient
analysis were found for different location and in different seasons. The micronutrients present
in the site S1, Iron (Fe) content varied from a range of 17.1 ± 0.3, 20.43 ± 0.21 and 14.7 ± 0.38
mg recorded for S1, S2, S3 respectively. Whereas, Mn varied from 5.47 ± 0.35 to 8.53 ± 0.31
mg, Zn ranges from 17.37 ± 0.38 to 11.27 ± 0.38 mg and the heavy metal Cu was found to be
17.37 ± 0.35, 15.3 ± 0.44 and 6.03 ± 0.38 mg observed for S1, S2 and S3. The macronutrients
are recorded for Nitrogen (N), Phosphorus (P), Potassium (K) was determined for the month
of June, 2012. It was observed that nitrogen content was found to decrease with 153.67 ± 5.51
to 141.4 ± 0.3 mg/kg where as the phosphorous ranged from 5.5 ± 0.3 to 4.5 ± 0.36 mg/kg in
the case of phosphorous for different sites. The level of potassium was found to be 419.67 ±
4.04, 451.33 ± 3.79 and 499.67 ± 3.51 mg/kg recorded for site S1, S2 and S3 respectively.
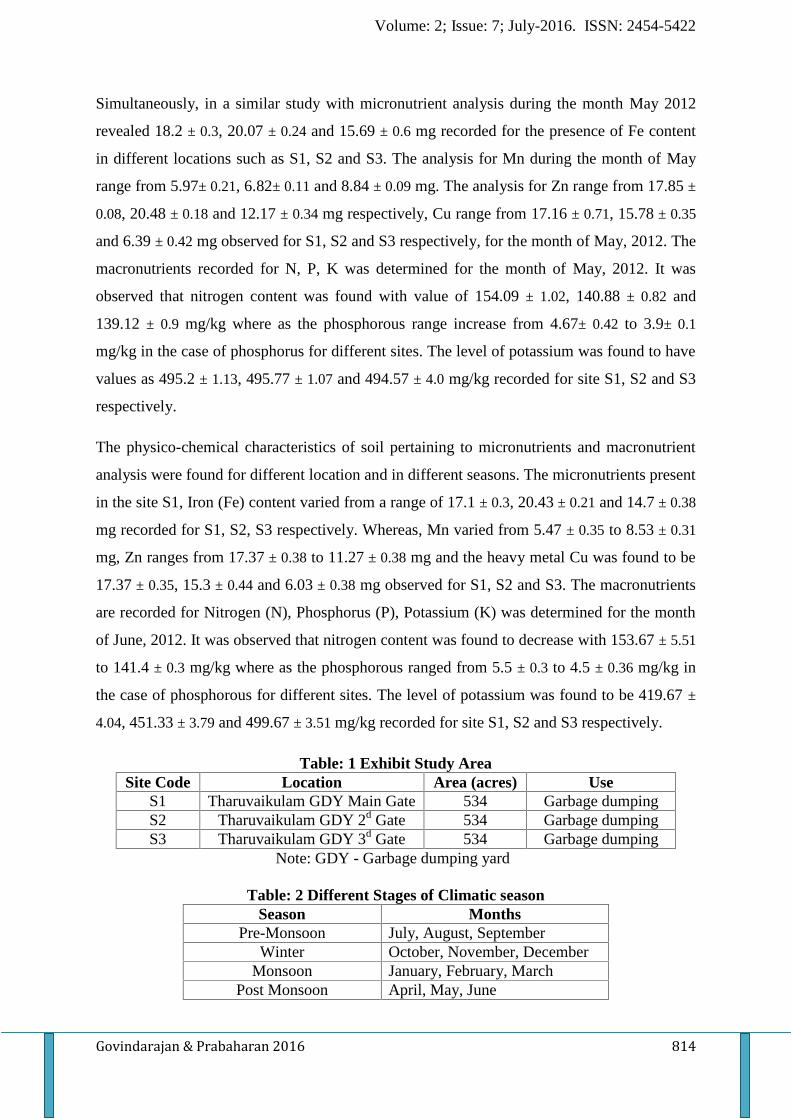
Table: 1 Exhibit Study AreaSite Code Location Area (acres) Use
S1 Tharuvaikulam GDY Main Gate 534 Garbage dumpingS2 Tharuvaikulam GDY 2d Gate 534 Garbage dumpingS3 Tharuvaikulam GDY 3d Gate 534 Garbage dumping
Note: GDY - Garbage dumping yard
Table: 2 Different Stages of Climatic seasonSeason Months
Pre-Monsoon July, August, SeptemberWinter October, November, December
Monsoon January, February, MarchPost Monsoon April, May, June
Volume: 2; Issue: 7; July-2016. ISSN: 2454-5422
Govindarajan & Prabaharan 2016 815
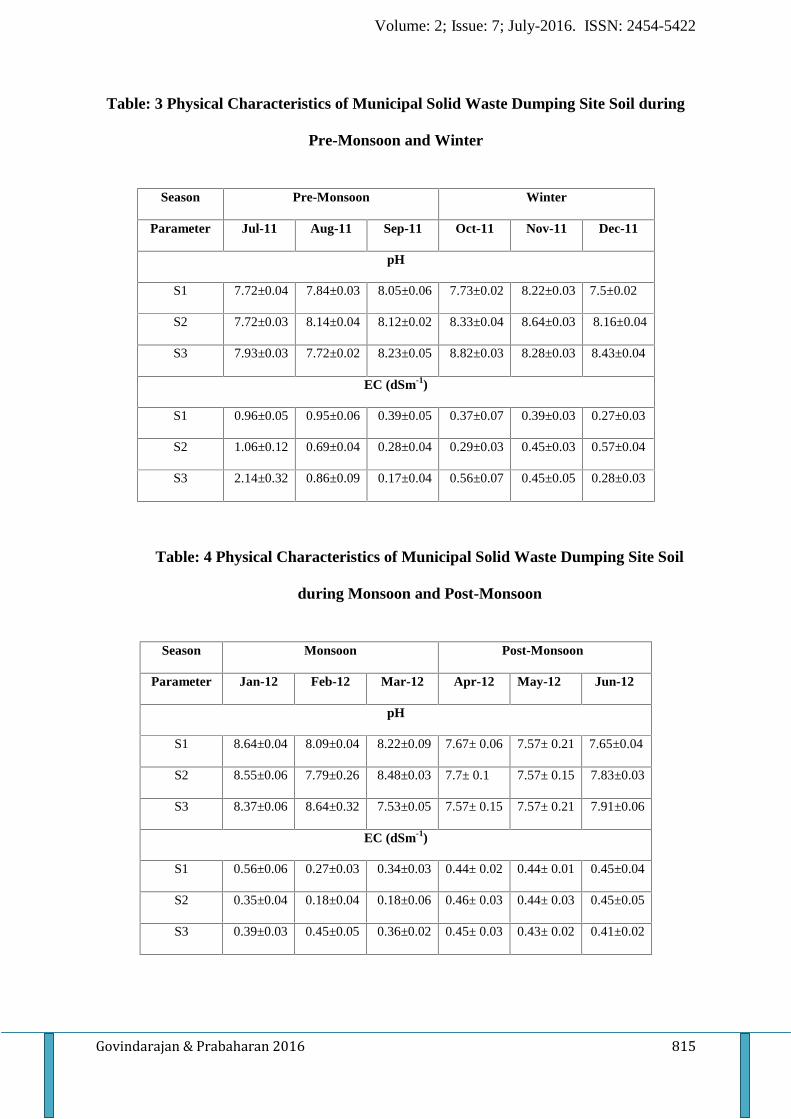
Table: 3 Physical Characteristics of Municipal Solid Waste Dumping Site Soil during
Pre-Monsoon and Winter
Table: 4 Physical Characteristics of Municipal Solid Waste Dumping Site Soil
during Monsoon and Post-Monsoon
Season Pre-Monsoon Winter
Parameter Jul-11 Aug-11 Sep-11 Oct-11 Nov-11 Dec-11
pH
S1 7.72±0.04 7.84±0.03 8.05±0.06 7.73±0.02 8.22±0.03 7.5±0.02
S2 7.72±0.03 8.14±0.04 8.12±0.02 8.33±0.04 8.64±0.03 8.16±0.04
S3 7.93±0.03 7.72±0.02 8.23±0.05 8.82±0.03 8.28±0.03 8.43±0.04
EC (dSm-1)
S1 0.96±0.05 0.95±0.06 0.39±0.05 0.37±0.07 0.39±0.03 0.27±0.03
S2 1.06±0.12 0.69±0.04 0.28±0.04 0.29±0.03 0.45±0.03 0.57±0.04
S3 2.14±0.32 0.86±0.09 0.17±0.04 0.56±0.07 0.45±0.05 0.28±0.03
Season Monsoon Post-Monsoon
Parameter Jan-12 Feb-12 Mar-12 Apr-12 May-12 Jun-12
pH
S1 8.64±0.04 8.09±0.04 8.22±0.09 7.67± 0.06 7.57± 0.21 7.65±0.04
S2 8.55±0.06 7.79±0.26 8.48±0.03 7.7± 0.1 7.57± 0.15 7.83±0.03
S3 8.37±0.06 8.64±0.32 7.53±0.05 7.57± 0.15 7.57± 0.21 7.91±0.06
EC (dSm-1)
S1 0.56±0.06 0.27±0.03 0.34±0.03 0.44± 0.02 0.44± 0.01 0.45±0.04
S2 0.35±0.04 0.18±0.04 0.18±0.06 0.46± 0.03 0.44± 0.03 0.45±0.05
S3 0.39±0.03 0.45±0.05 0.36±0.02 0.45± 0.03 0.43± 0.02 0.41±0.02
Volume: 2; Issue: 7; July-2016. ISSN: 2454-5422
Govindarajan & Prabaharan 2016 816
Fig: 1 Seasonal variation in pH
Fig: 2 Seasonal variation in pH
Volume: 2; Issue: 7; July-2016. ISSN: 2454-5422
Govindarajan & Prabaharan 2016 817
Fig: 3 Seasonal variation in EC
Fig: 4 Seasonal variation in EC
Volume: 2; Issue: 7; July-2016. ISSN: 2454-5422
Govindarajan & Prabaharan 2016 818
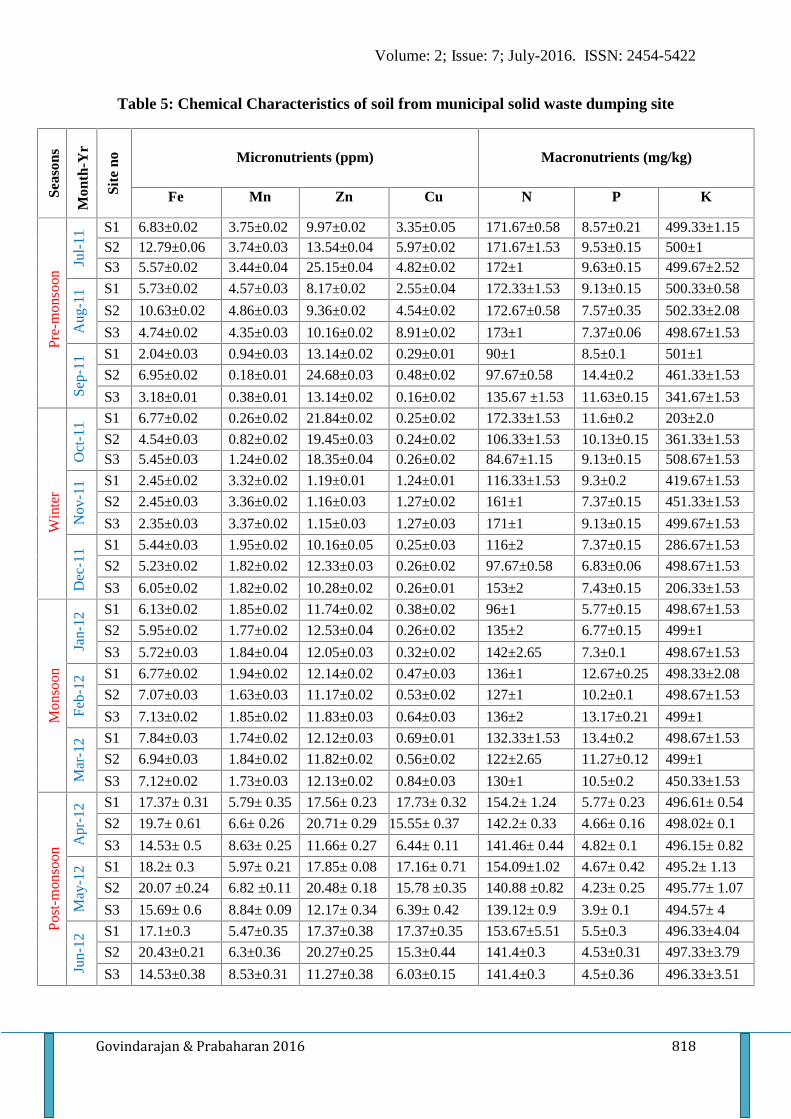
Table 5: Chemical Characteristics of soil from municipal solid waste dumping site
Seas
ons
Mon
th-Y
r
Site
no Micronutrients (ppm) Macronutrients (mg/kg)
Fe Mn Zn Cu N P K
Pre-
mon
soon
Jul-
11
S1 6.83±0.02 3.75±0.02 9.97±0.02 3.35±0.05 171.67±0.58 8.57±0.21 499.33±1.15S2 12.79±0.06 3.74±0.03 13.54±0.04 5.97±0.02 171.67±1.53 9.53±0.15 500±1S3 5.57±0.02 3.44±0.04 25.15±0.04 4.82±0.02 172±1 9.63±0.15 499.67±2.52
Aug
-11 S1 5.73±0.02 4.57±0.03 8.17±0.02 2.55±0.04 172.33±1.53 9.13±0.15 500.33±0.58
S2 10.63±0.02 4.86±0.03 9.36±0.02 4.54±0.02 172.67±0.58 7.57±0.35 502.33±2.08
S3 4.74±0.02 4.35±0.03 10.16±0.02 8.91±0.02 173±1 7.37±0.06 498.67±1.53
Sep-
11
S1 2.04±0.03 0.94±0.03 13.14±0.02 0.29±0.01 90±1 8.5±0.1 501±1
S2 6.95±0.02 0.18±0.01 24.68±0.03 0.48±0.02 97.67±0.58 14.4±0.2 461.33±1.53
S3 3.18±0.01 0.38±0.01 13.14±0.02 0.16±0.02 135.67 ±1.53 11.63±0.15 341.67±1.53
Win
ter
Oct
-11 S1 6.77±0.02 0.26±0.02 21.84±0.02 0.25±0.02 172.33±1.53 11.6±0.2 203±2.0
S2 4.54±0.03 0.82±0.02 19.45±0.03 0.24±0.02 106.33±1.53 10.13±0.15 361.33±1.53S3 5.45±0.03 1.24±0.02 18.35±0.04 0.26±0.02 84.67±1.15 9.13±0.15 508.67±1.53
Nov
-11 S1 2.45±0.02 3.32±0.02 1.19±0.01 1.24±0.01 116.33±1.53 9.3±0.2 419.67±1.53
S2 2.45±0.03 3.36±0.02 1.16±0.03 1.27±0.02 161±1 7.37±0.15 451.33±1.53
S3 2.35±0.03 3.37±0.02 1.15±0.03 1.27±0.03 171±1 9.13±0.15 499.67±1.53
Dec
-11 S1 5.44±0.03 1.95±0.02 10.16±0.05 0.25±0.03 116±2 7.37±0.15 286.67±1.53
S2 5.23±0.02 1.82±0.02 12.33±0.03 0.26±0.02 97.67±0.58 6.83±0.06 498.67±1.53
S3 6.05±0.02 1.82±0.02 10.28±0.02 0.26±0.01 153±2 7.43±0.15 206.33±1.53
Mon
soon
Jan-
12
S1 6.13±0.02 1.85±0.02 11.74±0.02 0.38±0.02 96±1 5.77±0.15 498.67±1.53
S2 5.95±0.02 1.77±0.02 12.53±0.04 0.26±0.02 135±2 6.77±0.15 499±1
S3 5.72±0.03 1.84±0.04 12.05±0.03 0.32±0.02 142±2.65 7.3±0.1 498.67±1.53
Feb-
12
S1 6.77±0.02 1.94±0.02 12.14±0.02 0.47±0.03 136±1 12.67±0.25 498.33±2.08
S2 7.07±0.03 1.63±0.03 11.17±0.02 0.53±0.02 127±1 10.2±0.1 498.67±1.53
S3 7.13±0.02 1.85±0.02 11.83±0.03 0.64±0.03 136±2 13.17±0.21 499±1
Mar
-12 S1 7.84±0.03 1.74±0.02 12.12±0.03 0.69±0.01 132.33±1.53 13.4±0.2 498.67±1.53
S2 6.94±0.03 1.84±0.02 11.82±0.02 0.56±0.02 122±2.65 11.27±0.12 499±1
S3 7.12±0.02 1.73±0.03 12.13±0.02 0.84±0.03 130±1 10.5±0.2 450.33±1.53
Post
-mon
soon
Apr
-12 S1 17.37± 0.31 5.79± 0.35 17.56± 0.23 17.73± 0.32 154.2± 1.24 5.77± 0.23 496.61± 0.54
S2 19.7± 0.61 6.6± 0.26 20.71± 0.29 15.55± 0.37 142.2± 0.33 4.66± 0.16 498.02± 0.1
S3 14.53± 0.5 8.63± 0.25 11.66± 0.27 6.44± 0.11 141.46± 0.44 4.82± 0.1 496.15± 0.82
May
-12 S1 18.2± 0.3 5.97± 0.21 17.85± 0.08 17.16± 0.71 154.09±1.02 4.67± 0.42 495.2± 1.13
S2 20.07 ±0.24 6.82 ±0.11 20.48± 0.18 15.78 ±0.35 140.88 ±0.82 4.23± 0.25 495.77± 1.07
S3 15.69± 0.6 8.84± 0.09 12.17± 0.34 6.39± 0.42 139.12± 0.9 3.9± 0.1 494.57± 4
Jun-
12
S1 17.1±0.3 5.47±0.35 17.37±0.38 17.37±0.35 153.67±5.51 5.5±0.3 496.33±4.04
S2 20.43±0.21 6.3±0.36 20.27±0.25 15.3±0.44 141.4±0.3 4.53±0.31 497.33±3.79
S3 14.53±0.38 8.53±0.31 11.27±0.38 6.03±0.15 141.4±0.3 4.5±0.36 496.33±3.51
Volume: 2; Issue: 7; July-2016. ISSN: 2454-5422
Govindarajan & Prabaharan 2016 819
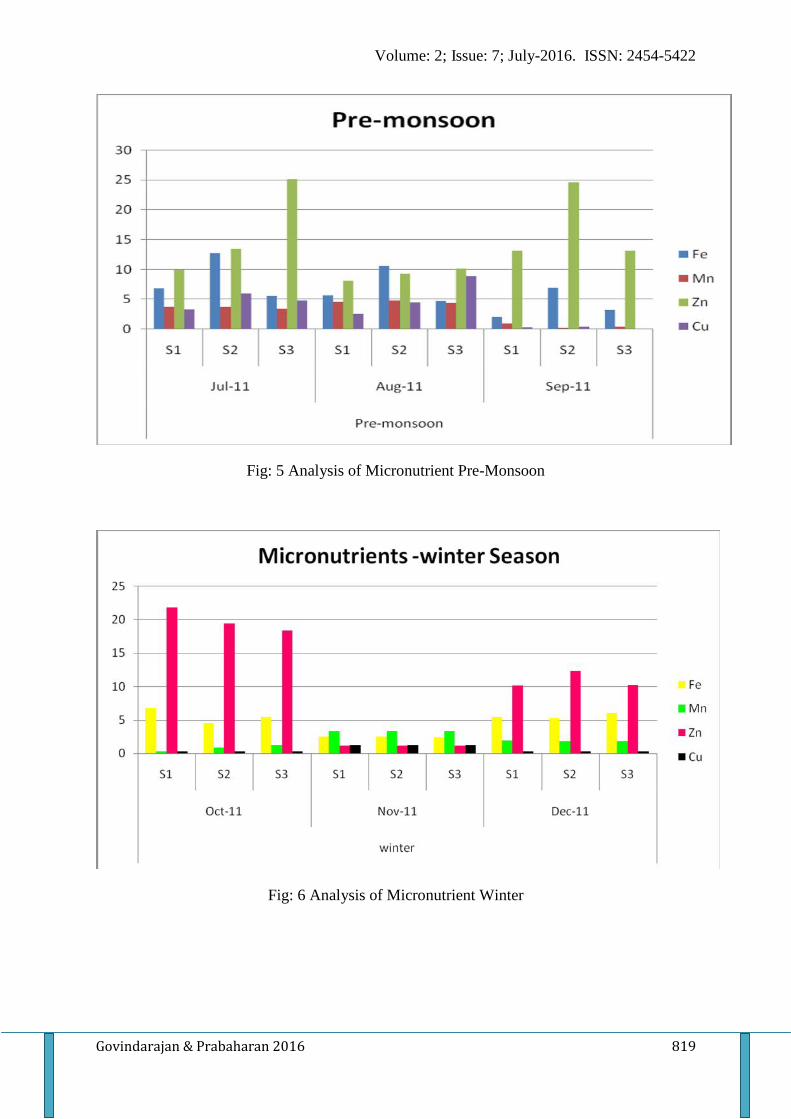
Fig: 5 Analysis of Micronutrient Pre-Monsoon
Fig: 6 Analysis of Micronutrient Winter
Volume: 2; Issue: 7; July-2016. ISSN: 2454-5422
Govindarajan & Prabaharan 2016 820
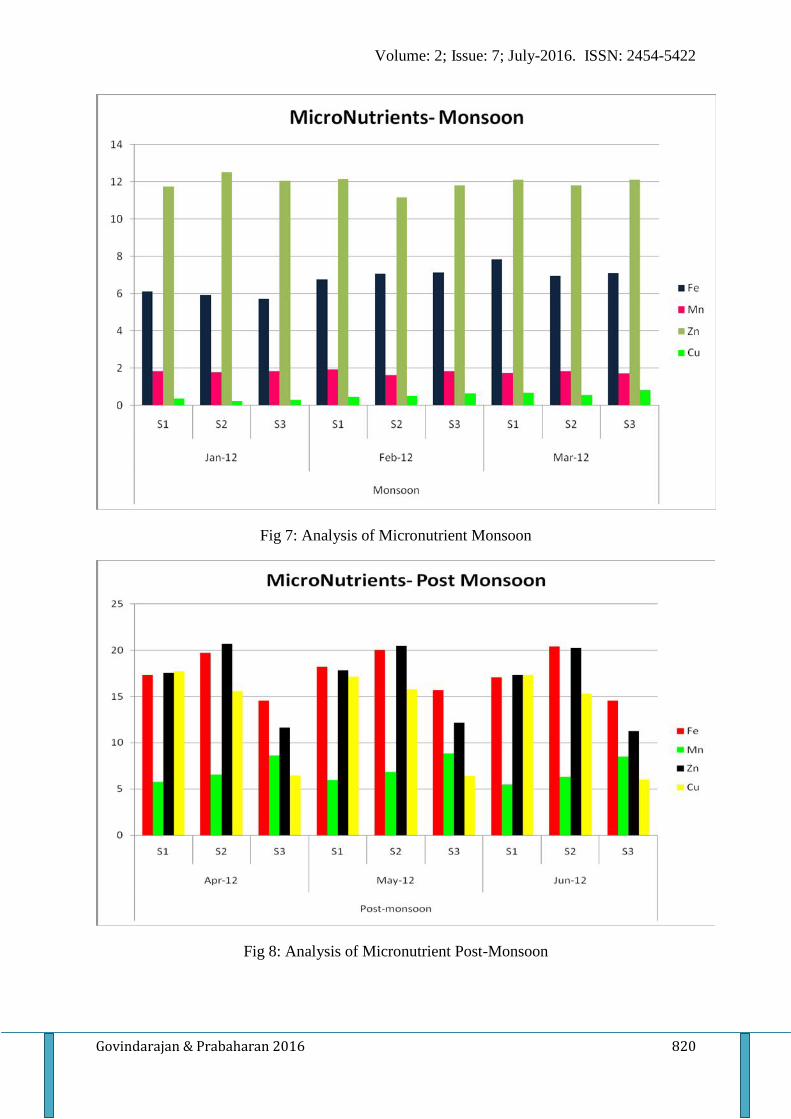
Fig 7: Analysis of Micronutrient Monsoon
Fig 8: Analysis of Micronutrient Post-Monsoon
Volume: 2; Issue: 7; July-2016. ISSN: 2454-5422
Govindarajan & Prabaharan 2016 821
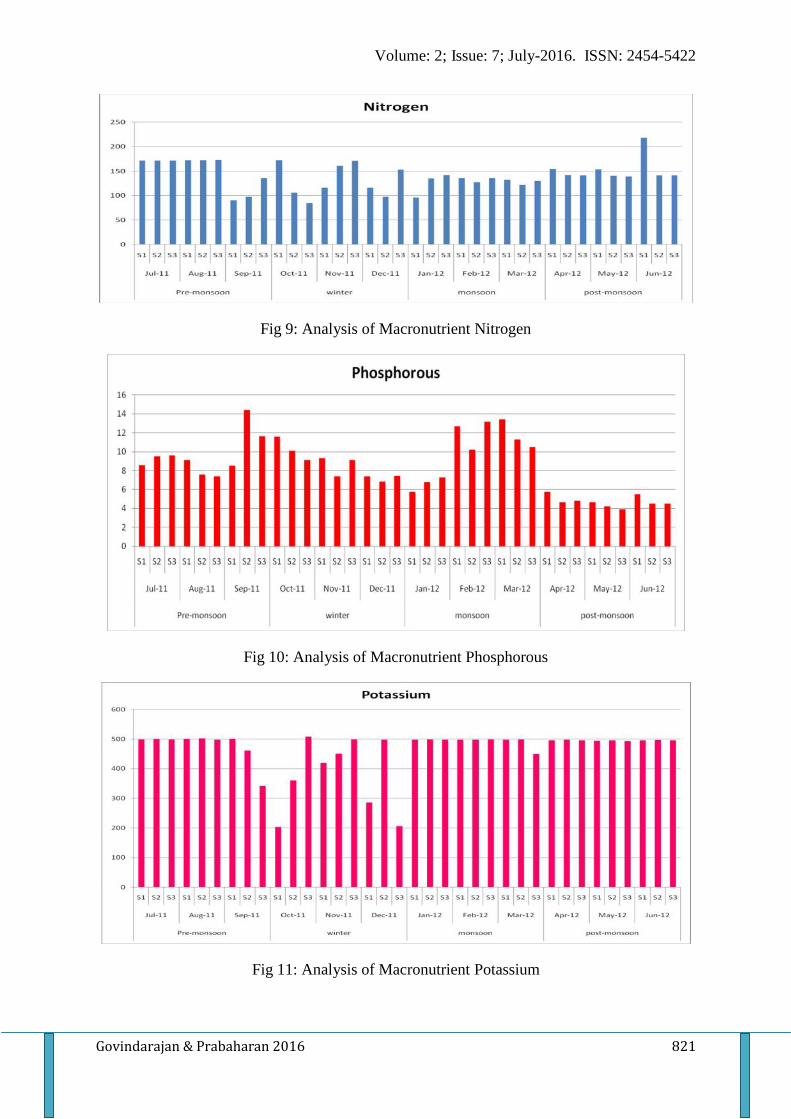
Fig 9: Analysis of Macronutrient Nitrogen
Fig 10: Analysis of Macronutrient Phosphorous
Fig 11: Analysis of Macronutrient Potassium
Volume: 2; Issue: 7; July-2016. ISSN: 2454-5422
Govindarajan & Prabaharan 2016 822
Conclusion
The use of MSW as compost / vermicompost offers a unique opportunity for economical
disposal. The analysis of MSW dumping site soil indicates that it is good source of nutrients
for the agriculture sector. On the basis of result MSW compost can be recommended to the
farmers to obtain improvement of physico-chemical properties of soil.
Acknowledgement
First author like to acknowledge and thank Mr.K.Kadarkarai, Red., Teacher, for financial
assistance to complete this research. Authors are extremely thankful to Tuticorin Corporation
for permitting soil sampling from MSW dumping site. Authors are also thankful to Kovilpatti
agriculture centre for providing laboratory facility.
Reference
Dwivedi P R; Augur M R and Anitha Agrawal 2014 A study on the effect of solid waste
dumping on geo-environment at Bilaspur. American Int. J. Res. In Formal, Applied &
Natural Sci. 86-90
www.municipalities.ti.in
Municipal Solid Waste (Management and Handling) Rules, 2000
IJCSR Specialities
$ Impact Factor – IBI – 2.9; GIF – 0.676 & SIF – 0.54
$ Indexed over 35 databases
$ Monthly Issue
http://www.drbgrpublications.in/ijcsr.php


![Home | United States Senate Committee on the Judiciary - z · 2020. 4. 16. · SENATE-FISA2020-000085 [50U,S.C. §§ 1804(,)(2) and 1823(,)(2)] [50 u.s.c. §§ 1804(,)(3) and 18W(a)(3)j](https://static.fdocuments.us/doc/165x107/5fe04f36eeedd165b53f5d40/home-united-states-senate-committee-on-the-judiciary-z-2020-4-16-senate-fisa2020-000085.jpg)


