IIIIIII HIGHLIGHTS - d231jw5ce53gcq.cloudfront.net · HIGHLIGHTS INTRODUCTION Solar PV in the ......
14
COMMUNITY-SCALE SOLAR WHY DEVELOPERS AND BUYERS SHOULD FOCUS ON THIS HIGH-POTENTIAL MARKET SEGMENT HIGHLIGHTS INTRODUCTION Solar PV in the United States has been growing impressively, driven in part by steep cost reductions. From 2005 to 2015, the average installed cost for PV systems dropped almost 70%, from $8.00/W to $2.60/W. i Over the same period, U.S. solar PV installed capacity grew an average 57% annually, from 79 MW installed in 2005 to 7,000+ MW installed in a record- breaking 2015. For the first time ever, in 2015 solar PV beat natural gas for U.S. electric generating capacity additions. ii Despite this growth, solar PV generated only 1% of U.S. electricity in 2015. iii Hence tremendous potential remains for solar PV’s future (see Figure 1, page 2). FURTHER, FAST R O C K Y M O U N T A I N I N S T I T U T E INSIGHT BRIEF March 2016 IIIIIII IIIIIII Kevin Brehm Boulder, CO Peter Bronski Boulder, CO Kieran Coleman Boulder, CO Stephen Doig Boulder, CO Joseph Goodman Basalt, CO [email protected] Thomas Koch Blank Boulder, CO [email protected] Titiaan Palazzi Basalt, CO • Despite impressive growth to date, solar PV only represents a small fraction of U.S. electricity generation and millions of households are being left out. • Community-scale solar (0.5–5 MW projects) represents a substantial untapped market of up to 30 GW by 2020. • Community-scale solar is inclusive of low- and moderate-income households. • Community-scale solar avoids constraints facing other markets and can reach utility-scale economics while leveraging distributed benefits. • Buyers and sellers together can innovate and unlock cost reductions of up to 40%. • RMI’s Shine initiative works with public utilities (rural electric cooperatives and municipal utilities), community organizations, and developers to unlock this market. ROCKY MOUNTAIN INSTITUTE * WWW.RMI.ORG * CARBON WAR ROOM * WWW.CARBONWARROOM.COM BASALT, CO * BOULDER, CO * NEW YORK, NY * WASHINGTON, D.C. * BEIJING, CHINA
Transcript of IIIIIII HIGHLIGHTS - d231jw5ce53gcq.cloudfront.net · HIGHLIGHTS INTRODUCTION Solar PV in the ......

COMMUNITY-SCALE SOLAR WHY DEVELOPERS AND BUYERS SHOULD FOCUS ON THIS HIGH-POTENTIAL MARKET SEGMENT
HIGHLIGHTS
INTRODUCTION
Solar PV in the United States has been growing impressively, driven in part by steep cost
reductions. From 2005 to 2015, the average installed cost for PV systems dropped almost
70%, from $8.00/W to $2.60/W.i Over the same period, U.S. solar PV installed capacity grew
an average 57% annually, from 79 MW installed in 2005 to 7,000+ MW installed in a record-
breaking 2015. For the first time ever, in 2015 solar PV beat natural gas for U.S. electric
generating capacity additions.ii
Despite this growth, solar PV generated only 1% of U.S. electricity in 2015.iii Hence
tremendous potential remains for solar PV’s future (see Figure 1, page 2).
FURTHER, FASTER, TOGETHER
RO
C
KY MOUNTAIN
INSTIT UTE
WA R R O O M
CARBON
INSIGHT BRIEF March 2016
IIIIIII
IIIIIII
Kevin Brehm Boulder, CO
Peter BronskiBoulder, CO
Kieran ColemanBoulder, CO
Stephen DoigBoulder, CO
Joseph GoodmanBasalt, CO
Thomas Koch BlankBoulder, CO
Titiaan PalazziBasalt, CO
• Despite impressive growth to date, solar PV only represents a small fraction of U.S.
electricity generation and millions of households are being left out.
• Community-scale solar (0.5–5 MW projects) represents a substantial untapped market
of up to 30 GW by 2020.
• Community-scale solar is inclusive of low- and moderate-income households.
• Community-scale solar avoids constraints facing other markets and can reach utility-scale
economics while leveraging distributed benefits.
• Buyers and sellers together can innovate and unlock cost reductions of up to 40%.
• RMI’s Shine initiative works with public utilities (rural electric cooperatives and municipal
utilities), community organizations, and developers to unlock this market.
ROCKY MOUNTAIN INSTITUTE * WWW.RMI.ORG * CARBON WAR ROOM * WWW.CARBONWARROOM.COM BASALT, CO * BOULDER, CO * NEW YORK, NY * WASHINGTON, D.C. * BEIJING, CHINA
COMMUNITY-SCALE SOLAR INSIGHT BRIEF 02
ROCKY MOUNTAIN INSTITUTE * WWW.RMI.ORG * CARBON WAR ROOM * WWW.CARBONWARROOM.COM BASALT, CO * BOULDER, CO * NEW YORK, NY * WASHINGTON, D.C. * BEIJING, CHINA
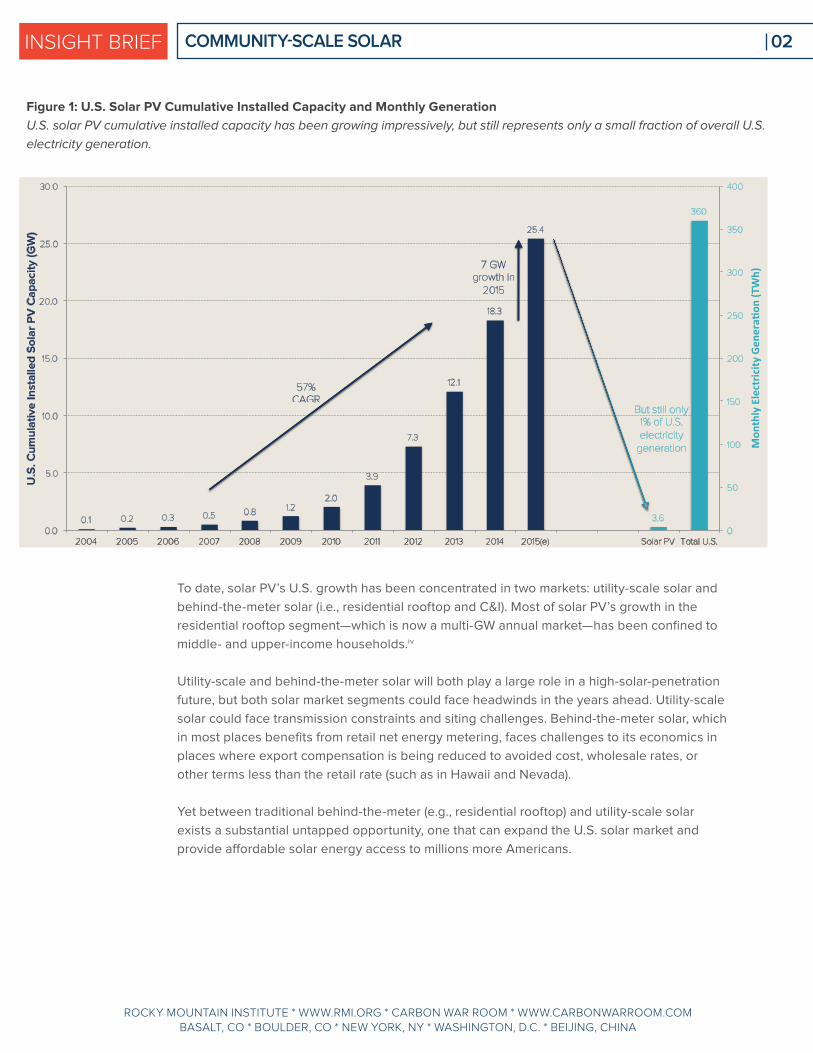
Figure 1: U.S. Solar PV Cumulative Installed Capacity and Monthly Generation
U.S. solar PV cumulative installed capacity has been growing impressively, but still represents only a small fraction of overall U.S.
electricity generation.
To date, solar PV’s U.S. growth has been concentrated in two markets: utility-scale solar and
behind-the-meter solar (i.e., residential rooftop and C&I). Most of solar PV’s growth in the
residential rooftop segment—which is now a multi-GW annual market—has been confined to
middle- and upper-income households.iv
Utility-scale and behind-the-meter solar will both play a large role in a high-solar-penetration
future, but both solar market segments could face headwinds in the years ahead. Utility-scale
solar could face transmission constraints and siting challenges. Behind-the-meter solar, which
in most places benefits from retail net energy metering, faces challenges to its economics in
places where export compensation is being reduced to avoided cost, wholesale rates, or
other terms less than the retail rate (such as in Hawaii and Nevada).
Yet between traditional behind-the-meter (e.g., residential rooftop) and utility-scale solar
exists a substantial untapped opportunity, one that can expand the U.S. solar market and
provide affordable solar energy access to millions more Americans.
0.1 0.2 0.3 0.5 0.8 1.2 2.0
3.9
7.3
12.1
18.3
25.4
3.6
360
0
50
100
150
200
250
300
350
400
0.0
5.0
10.0
15.0
20.0
25.0
30.0
2004 2005 2006 2007 2008 2009 2010 2011 2012 2013 2014 2015(e) Solar PV Total U.S.
Mon
thlyElectric
ityGen
era0
on(T
Wh)
U.S
. C
um
ula
tive
In
sta
lled
So
lar
PV
Ca
pa
city
(G
W)
57% CAGR
7 GW growth in
2015
But still only 1% of U.S. electricity
generation
COMMUNITY-SCALE SOLAR INSIGHT BRIEF 03
ROCKY MOUNTAIN INSTITUTE * WWW.RMI.ORG * CARBON WAR ROOM * WWW.CARBONWARROOM.COM BASALT, CO * BOULDER, CO * NEW YORK, NY * WASHINGTON, D.C. * BEIJING, CHINA
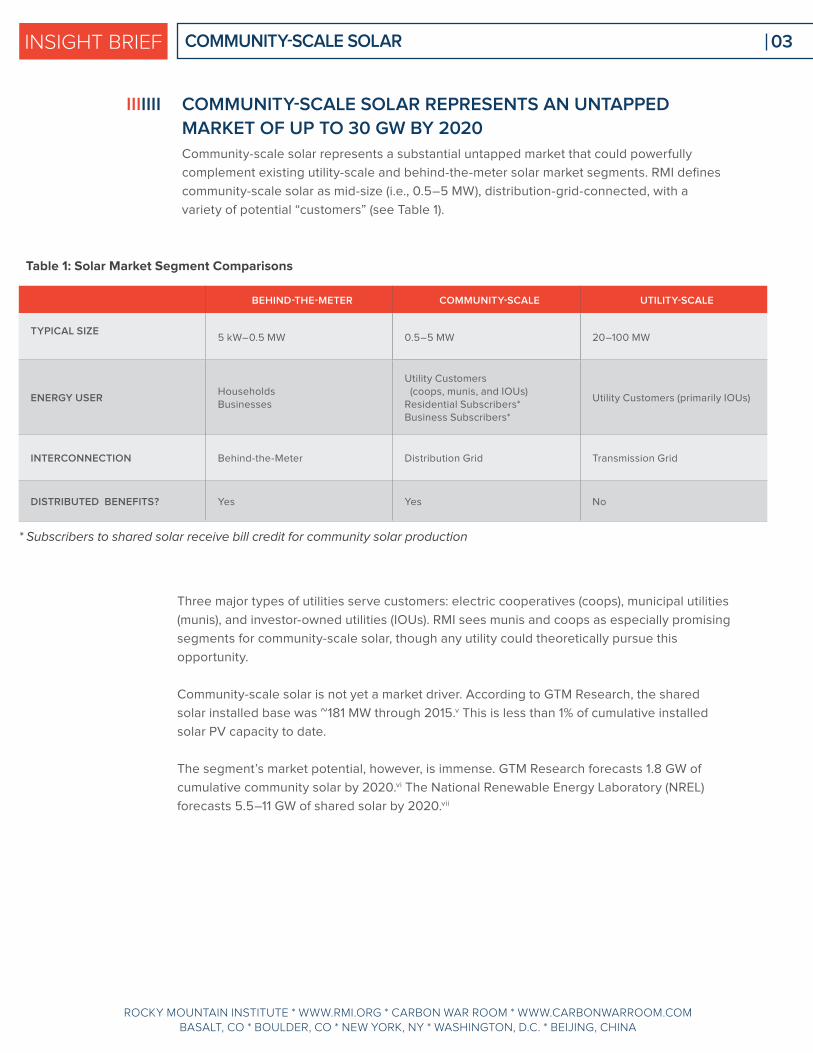
COMMUNITY-SCALE SOLAR REPRESENTS AN UNTAPPED
MARKET OF UP TO 30 GW BY 2020
Community-scale solar represents a substantial untapped market that could powerfully
complement existing utility-scale and behind-the-meter solar market segments. RMI defines
community-scale solar as mid-size (i.e., 0.5–5 MW), distribution-grid-connected, with a
variety of potential “customers” (see Table 1).
IIIIIII
Table 1: Solar Market Segment Comparisons
Three major types of utilities serve customers: electric cooperatives (coops), municipal utilities
(munis), and investor-owned utilities (IOUs). RMI sees munis and coops as especially promising
segments for community-scale solar, though any utility could theoretically pursue this
opportunity.
Community-scale solar is not yet a market driver. According to GTM Research, the shared
solar installed base was ~181 MW through 2015.v This is less than 1% of cumulative installed
solar PV capacity to date.
The segment’s market potential, however, is immense. GTM Research forecasts 1.8 GW of
cumulative community solar by 2020.vi The National Renewable Energy Laboratory (NREL)
forecasts 5.5–11 GW of shared solar by 2020.vii
BEHIND-THE-METER COMMUNITY-SCALE UTILITY-SCALE
TYPICAL SIZE5 kW–0.5 MW 0.5–5 MW 20–100 MW
ENERGY USERHouseholdsBusinesses
Utility Customers (coops, munis, and IOUs)Residential Subscribers*Business Subscribers*
Utility Customers (primarily IOUs)
INTERCONNECTION Behind-the-Meter Distribution Grid Transmission Grid
DISTRIBUTED BENEFITS? Yes Yes No
* Subscribers to shared solar receive bill credit for community solar production

COMMUNITY-SCALE SOLAR INSIGHT BRIEF 04
ROCKY MOUNTAIN INSTITUTE * WWW.RMI.ORG * CARBON WAR ROOM * WWW.CARBONWARROOM.COM BASALT, CO * BOULDER, CO * NEW YORK, NY * WASHINGTON, D.C. * BEIJING, CHINA
RMI sees an opportunity for even more—an estimated 30 GW of community-scale solar by
2020 under one possible scenario (see Figure 2, page 5). This is comparable to the total
amount of installed solar PV in the U.S. through 2015. Beyond the shared solar market
identified by GTM Research and NREL, RMI expects growth from the following:
1. Cost reductions: RMI has identified cost reduction potential through buyer-focused,
seller-focused, and shared cost reduction levers. These cost reductions will enable
shared solar to achieve a more bullish projection, comparable to NREL’s 11 GW high-
growth scenario. Cost reductions are discussed in greater detail later in this report.
2. Improved economics due to investment tax credit (ITC) extension: The NREL and
GTM Research forecasts were released prior to December 2015’s investment tax credit
extension. RMI expects shared solar installations will increase 35%1 due to improved
economics from the investment tax credit extension.viii,ix
3. More-inclusive definition of community-scale solar: Approximately 50% of the 30 GW
community-scale solar market will not be shared solar, but rather solar owned by utilities
or purchased by coops, munis, or investor-owned utilities through power purchase
agreements (PPAs). Among utilities, community-scale uptake and 2020 penetration is
expected to be highest among coops, followed by munis, then investor-owned utilities.
COMMUNITY-SCALE SOLAR VS. COMMUNITY SOLAR
Traditional community solar (also known as shared solar) commonly refers to projects in which
output from a solar array is divided among and credited to multiple subscribers or owners. GTM
Research and the National Renewable Energy Laboratory (NREL) market assessments
referenced in this report pertain to community (shared) solar.
In this report, community-scale solar describes shared solar systems AND other mid-size arrays.
This definition includes arrays that are owned by utilities and third-party-owned arrays that sell
energy to a utility.
This broader definition emphasizes the potential role of the utility in proactively pursuing
community-scale solar. When community-scale solar prices decline and become competitive to
wholesale power prices, utilities could increasingly look to community-scale solar as a clean,
low-cost power source.
1 GTM Research and NREL both predict ~35% increase in rooftop installations as a result of ITC extension.

COMMUNITY-SCALE SOLAR INSIGHT BRIEF 05
ROCKY MOUNTAIN INSTITUTE * WWW.RMI.ORG * CARBON WAR ROOM * WWW.CARBONWARROOM.COM BASALT, CO * BOULDER, CO * NEW YORK, NY * WASHINGTON, D.C. * BEIJING, CHINA
Compared to historical solar PV and especially community solar installation rates, 30 GW is
an aggressive target. Yet, the U.S. Energy Information Administration expects 9.5 GW of
utility-scale solar capacity to come online in 2016, so substantial numbers leading to 30 GW
cumulative by 2020 are certainly possible.x This is in part because community-scale solar
reaches millions of U.S. customers that so far rooftop solar has not or cannot.
Nearly half of U.S. households and businesses cannot access rooftop solar. According to
NREL, 49% of U.S. households are unable to access rooftop solar, because they rent their
home, live in dwellings such as a multi-unit apartment building or high-rise condo, or have a
roof unsuitable for solar.xi NREL also reports that 48% of commercial buildings have roofs too
small to host on-site solar PV of any meaningful size (i.e., covering at least 20% of their demand).
RMI used census, NREL, U.S. EIA, and other data to estimate the total electricity demand
shared solar could serve across several categories core to the community-scale solar market:
a) low- to moderate-income (LMI) renters, b) other renters (e.g., multi-unit apartment
buildings), c) multi-unit non-renters (e.g., high-rise condo unit owners), d) single-family homes
with unsuitable roofs for rooftop solar, and e) commercial buildings with unsuitable roofs.
Altogether, the long-term community-scale solar market potential for serving these U.S.
households and businesses that cannot access rooftop solar is more than 750 GW, according
to RMI estimates (see Figure 3, page 6).
Figure 2: Community-Scale Solar 2020 Market Potential Scenario
Three factors—system cost reductions, ITC extension, and a more-inclusive definition beyond traditional shared solar—
contribute to a potential of up to 30 GW of installed community-scale solar by 2020.

COMMUNITY-SCALE SOLAR INSIGHT BRIEF 06
ROCKY MOUNTAIN INSTITUTE * WWW.RMI.ORG * CARBON WAR ROOM * WWW.CARBONWARROOM.COM BASALT, CO * BOULDER, CO * NEW YORK, NY * WASHINGTON, D.C. * BEIJING, CHINA
COMMUNITY-SCALE SOLAR IS INCLUSIVE OF LOW- AND
MODERATE-INCOME HOUSEHOLDS
Community-scale solar is inclusive to renters, apartment dwellers, homeowners with no
suitable roof, and low- and moderate-income (LMI) households. In states such as Colorado
and New York, community solar laws include a carve-out or preference for LMI subscribers.
Rural electric cooperatives are using community solar to serve LMI members.
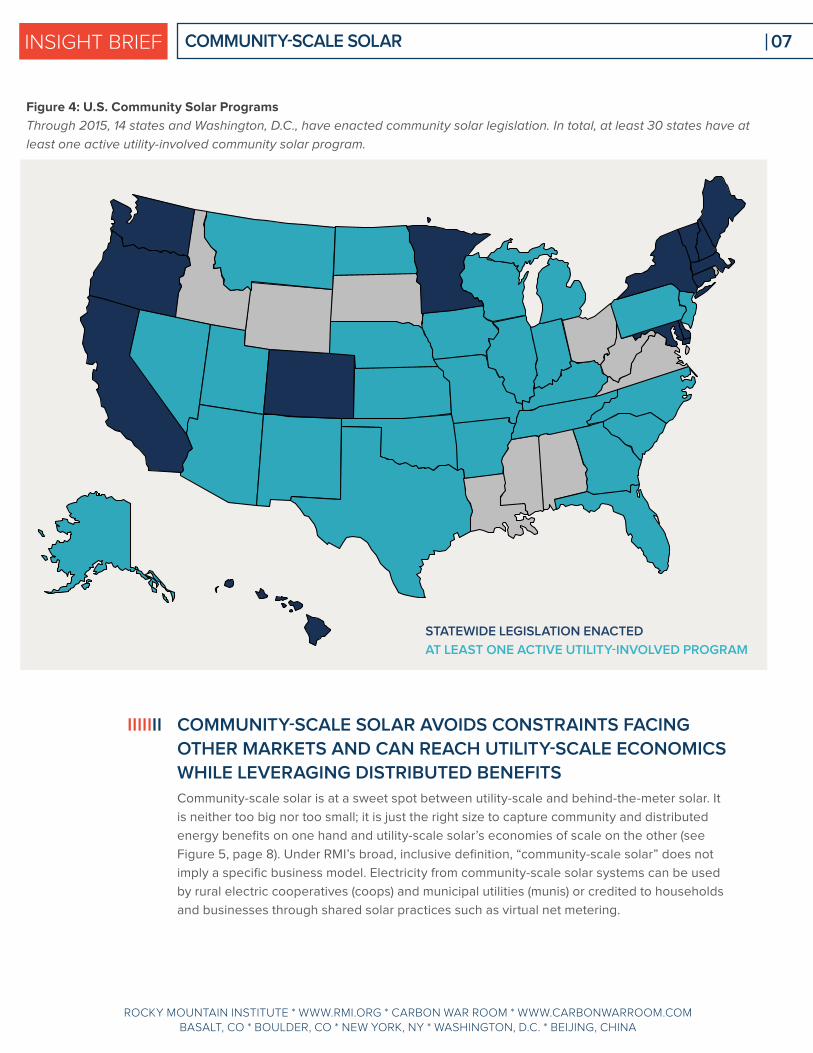
As of February 2016, 14 states and Washington, D.C., have enacted community solar
legislation. Five of these states (Connecticut, Maryland, Hawaii, New York, and Oregon)
enacted community solar legislation in 2015. In addition to state-mandated community solar
programs, utilities—particularly rural electric cooperatives—have initiated voluntary programs
(see Figure 4, page 7).
Still, most community solar projects to date have not addressed the key financial, economic,
and social barriers to LMI access. Innovative and flexible subscription models will make
community-scale solar more inclusive to LMI households.
IIIIIII
Figure 3: Community-Scale Solar Long-Term Market Potential Scenario
The long-term market potential for community-scale solar to serve rooftop-ineligible customers is 750+ GW across five
categories of customers.
0
100
200
300
400
500
600
700
800
900
LMI Renters Other Renters (e.g., Multi-Unit Apartment Buildings)
Multi-Unit Non-Renters (e.g., High-Rise Condos)
Single-Family Homes with Unsuitable Roof
Commercial Buildings with Unsuitable Roof
Total
Ca
pa
city
(G
W)
COMMUNITY-SCALE SOLAR INSIGHT BRIEF 07
ROCKY MOUNTAIN INSTITUTE * WWW.RMI.ORG * CARBON WAR ROOM * WWW.CARBONWARROOM.COM BASALT, CO * BOULDER, CO * NEW YORK, NY * WASHINGTON, D.C. * BEIJING, CHINA
COMMUNITY-SCALE SOLAR AVOIDS CONSTRAINTS FACING
OTHER MARKETS AND CAN REACH UTILITY-SCALE ECONOMICS
WHILE LEVERAGING DISTRIBUTED BENEFITS
Community-scale solar is at a sweet spot between utility-scale and behind-the-meter solar. It
is neither too big nor too small; it is just the right size to capture community and distributed
energy benefits on one hand and utility-scale solar’s economies of scale on the other (see
Figure 5, page 8). Under RMI’s broad, inclusive definition, “community-scale solar” does not
imply a specific business model. Electricity from community-scale solar systems can be used
by rural electric cooperatives (coops) and municipal utilities (munis) or credited to households
and businesses through shared solar practices such as virtual net metering.
Figure 4: U.S. Community Solar Programs
Through 2015, 14 states and Washington, D.C., have enacted community solar legislation. In total, at least 30 states have at
least one active utility-involved community solar program.
STATEWIDE LEGISLATION ENACTED
AT LEAST ONE ACTIVE UTILITY-INVOLVED PROGRAM
IIIIIII

COMMUNITY-SCALE SOLAR INSIGHT BRIEF 08
ROCKY MOUNTAIN INSTITUTE * WWW.RMI.ORG * CARBON WAR ROOM * WWW.CARBONWARROOM.COM BASALT, CO * BOULDER, CO * NEW YORK, NY * WASHINGTON, D.C. * BEIJING, CHINA
Community-scale solar can avoid siting and transmission constraints that may impede long-
term utility-scale growth. Community-scale solar can be flexibly sited on under-utilized land
near loads. For example, EPA’s RE-Powering America’s Land programxii helps communities
and utilities site projects on contaminated land, and large parking lots can now cost-
competitively host community solar. According to industry contacts, canopy systems have
decreased costs by over 40% since 2014, and parking lot canopies now cost only an
additional $0.35/W compared to similarly-sized ground-mount systems.
Behind-the-meter solar economics are highly sensitive to net energy metering policy. Without
net energy metering, most systems in most geographies are not cost-competitive. Sustained
behind-the-meter growth, therefore, is subject to policy risk and policy changes could
constrain growth (as the market has seen in places where successor tariffs to net energy
metering have substantially reduced export compensation for solar PV). Unlike most behind-
the-meter solar, community-scale solar can be cost-competitive even in the absence of net
metering. In a recent RMI workshop, a group of New Mexico rural electric cooperatives
identified community-scale solar as a means to save money compared to wholesale power
purchases. In most of the country, community-scale solar prices must decline to be cost-
competitive with wholesale power, but those price declines are achievable already with
current technologies and regulation.
Figure 5: Benefits of Solar PV by Scale
Community-scale solar is at the sweet spot between utility-scale and behind-the-meter solar. It simultaneously leverages the
economies of scale of utility-scale solar and many of the distributed benefits of behind-the-meter solar.
COMMUNITY-SCALE SOLAR INSIGHT BRIEF 09
ROCKY MOUNTAIN INSTITUTE * WWW.RMI.ORG * CARBON WAR ROOM * WWW.CARBONWARROOM.COM BASALT, CO * BOULDER, CO * NEW YORK, NY * WASHINGTON, D.C. * BEIJING, CHINA
BUYERS AND SELLERS TOGETHER CAN INNOVATE AND
UNLOCK COST REDUCTIONS OF UP TO 40%
Though community-scale solar’s market potential is highly promising, growth of community-
scale solar has so far been inhibited by cost, access, and demand:
1. Cost: The unsubsidized installed price of solar PV needs to decline further to be cost-
competitive against other supply options.
2. Access: The community-scale segment has not historically been a priority market for PV
developers. Developers must provide clear and compelling offerings that get them in
the door and expand access to more buyers.
3. Demand: In the rapidly evolving solar PV industry, many buyers in the community-
scale segment are relying on dated or incorrect view of the value propositions or don’t
understand the full array of benefits. Demand for compelling and easy-to-understand
offerings must be stimulated.
Once growth inhibitors have been addressed, community-scale solar prices can approach
utility-scale prices, and buyers and sellers can connect through attractive and easy-to-
understand offerings.
Typical community-scale solar prices are currently higher than utility-scale prices (though still
well below behind-the-meter prices). Community solar sellers (EPCs and developers) and
buyers (utilities and project sponsors) each have access to cost-reduction levers to
significantly decrease community solar prices. A further $20/MW cost reduction is available
through shared levers owned jointly by buyers and sellers. Together, leveraging buyer-owned,
seller-owned (i.e., developer-owned), and shared cost-reduction levers can reduce costs 40%
using current technologies (see Figure 6, page 10). Business-as-usual module price and
balance-of-system cost reductions are not included in the cost-reduction model.2
IIIIIII
2 Cost-reduction model is based on RMI analysis and developer responses to a request for information.

COMMUNITY-SCALE SOLAR INSIGHT BRIEF 10
ROCKY MOUNTAIN INSTITUTE * WWW.RMI.ORG * CARBON WAR ROOM * WWW.CARBONWARROOM.COM BASALT, CO * BOULDER, CO * NEW YORK, NY * WASHINGTON, D.C. * BEIJING, CHINA
BUYER-OWNED LEVERS
In some cases, utilities directly develop community-scale projects, but frequently, third parties
develop systems and subscribe buyers. Community-scale solar buyers—whether utilities or
community-based organizations (CBOs)—can reduce total costs by supporting the
development process. Throughout the country, utilities and community-based organizations
are decreasing total project costs by supporting the development process.
Buyer-supported siting: Buyers can reduce project cost by providing land or connecting
developers to local landowners. For example, coops and munis often own land adjacent to
substations, or are closely connected to municipal authorities that own ideal sites in their
service territories.
Buyer-supported interconnection: Utility buyers can decrease development cost and risk
through efficient interconnection. Lengthy interconnection backlogs delay project timelines and
increase costs. This has happened in Minnesota, where a slow community solar interconnection
process has frustrated community solar developers and customers.xiii
In addition to streamlining the interconnection process, utilities can reduce total costs by
identifying regions of the grid that can easily integrate community solar. Utilities can also ensure
lowest total cost by covering all tie-in costs on the utility side of the point of interconnection.3
Figure 6: Community-Scale Solar at Utility-Scale Prices
A combination of developer-owned, buyer-owned, and shared levers can reduce community-scale solar costs up to 40%.
3 Utility will recover increased tie-in expenditure through lower total project cost or through lower PPA price.
COMMUNITY-SCALE SOLAR INSIGHT BRIEF 11
ROCKY MOUNTAIN INSTITUTE * WWW.RMI.ORG * CARBON WAR ROOM * WWW.CARBONWARROOM.COM BASALT, CO * BOULDER, CO * NEW YORK, NY * WASHINGTON, D.C. * BEIJING, CHINA
SHARED LEVERS
The greatest cost-reduction opportunities are associated with levers shared by buyers and
sellers. These levers include efficient contract structures, volume aggregation, solution
adaption, and margin cost reduction.
CONTRACT STRUCTURE: Low-cost community-scale solar depends on contract structures
that effectively utilize tax credits, capture lifetime project value, and reduce cost of capital.
• Tax Credits: According to a 2015 National Rural Electric Cooperative Association (NRECA)
survey, 47% of coop community solar projects failed to utilize the investment tax credit.xiv
Costs will decline if nonprofit and community buyers enter contracts that directly or
indirectly capture tax benefits.
• Tenure: Since community solar projects are distribution-grid-connected, third-party owners
cannot access a competitive market for power after a PPA has expired. Full project value
can be captured through long-term contracts (e.g., 25 or 30 years) or through ownership
flips to the power user.
• Cost of Capital: Nonprofit coops, munis, and community organizations often have access
to low-cost capital, but are unable to directly capture tax credits. Efficient contracts may
use third-party ownership to capture tax credits before transferring ownership to local
communities. Communities around the country are also exploring low-cost accredited
or crowd-sourced equity financing, community development financial institution (CDFI)
participation, and other low-cost financing options. Finally, business models are evolving
to control default risk on community solar by allowing a new subscriber to be brought in
after the initial subscriber defaults.
VOLUME AGGREGATION: Costs will also decline when volume is aggregated across
portfolios of projects. Volume aggregation can increase equipment and personnel utilization,
decreasing costs. Developers also incur significant costs responding to multiple requests for
proposal (RFPs) for small projects. Similarly, buyers expend resources creating and administering
SUBSCRIPTION COSTS
Billing, marketing, and other subscription-related costs contribute approximately 10% to shared
solar costs. Community organizations can tap into their existing networks to greatly reduce the
costs of customer subscription. Collaborating with specialized subscription service providers,
community organizations can engage and activate community members to enroll their
neighbors and peers. Utilities can also leverage their customer relationships to reduce total
billing and subscription costs.
Buyer-supported permitting and zoning: Community-scale solar buyers often have
relationships with the host community including relationships with permitting and zoning
officials. Buyers can complete permitting and zoning, or they can leverage community
relationships to facilitate permitting and zoning.

COMMUNITY-SCALE SOLAR INSIGHT BRIEF 12
ROCKY MOUNTAIN INSTITUTE * WWW.RMI.ORG * CARBON WAR ROOM * WWW.CARBONWARROOM.COM BASALT, CO * BOULDER, CO * NEW YORK, NY * WASHINGTON, D.C. * BEIJING, CHINA
those procurement processes. Costs will decline when buyers and sellers connect around
portfolios of projects aligned around standard terms and conditions.
SYSTEM DESIGN: Costs will decline as solar solutions are adapted to the community-scale
segment. Those solutions will be designed to meet customer needs, remove unnecessary
features, and add features that reduce LCOE. This is arguably within scope for the suppliers’
business development process, but buyers can drive and accelerate the process through
procurement processes that provide guidance to the developers.
For example, in an effort to make apples to apples comparisons, buyers are often highly
prescriptive in project technical requirements. The buyer may specify module tilt, tracking, or
module spacing, but those specifications may limit the developer’s ability to offer the system
with the best value. Buyers must manage procurement processes in such a way that high-
value projects emerge. Sellers must be ready to respond to procurement processes with solar
arrays that maximize total value.
EPCs and developers can further reduce costs if they conduct a whole-system redesign of
community-scale systems. Developers and EPCs often treat community-scale projects like
small utility-scale projects, but opportunities exist to reduce costs through community-solar-
focused, whole-system redesign.
MARGIN REDUCTION: Buyers and sellers both play a role in reducing cost by decreasing
margins. Buyers can manage competitive and efficient procurement processes that help manage
risk to the seller and result in the selection of reliably low-cost and high-quality vendors.
PROCUREMENT-RELATED PRICE REDUCTIONS
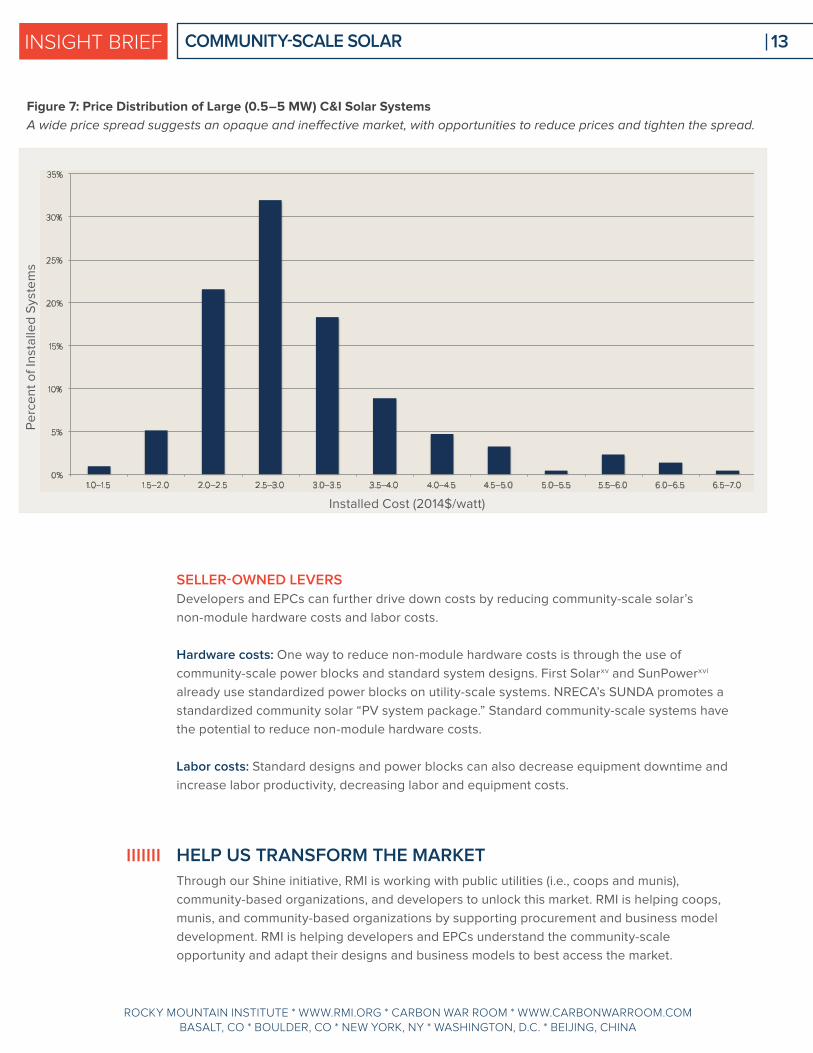
According to Lawrence Berkeley National Laboratory (LBNL) data on large C&I projects, the
most expensive quintile of projects cost almost 60% more than the least expensive quintile of
projects (see Figure 7, page 13). The wide spread goes far beyond what can be expected from
site-specific conditions, indicating an opaque market and ineffective buying processes, as well
as a procurement opportunity. Effective procurement will result in buyers accessing desired solar
solutions at risk-appropriate margins.
COMMUNITY-SCALE SOLAR INSIGHT BRIEF 13
ROCKY MOUNTAIN INSTITUTE * WWW.RMI.ORG * CARBON WAR ROOM * WWW.CARBONWARROOM.COM BASALT, CO * BOULDER, CO * NEW YORK, NY * WASHINGTON, D.C. * BEIJING, CHINA
SELLER-OWNED LEVERS
Developers and EPCs can further drive down costs by reducing community-scale solar’s
non-module hardware costs and labor costs.
Hardware costs: One way to reduce non-module hardware costs is through the use of
community-scale power blocks and standard system designs. First Solarxv and SunPowerxvi
already use standardized power blocks on utility-scale systems. NRECA’s SUNDA promotes a
standardized community solar “PV system package.” Standard community-scale systems have
the potential to reduce non-module hardware costs.
Labor costs: Standard designs and power blocks can also decrease equipment downtime and
increase labor productivity, decreasing labor and equipment costs.
HELP US TRANSFORM THE MARKET
Through our Shine initiative, RMI is working with public utilities (i.e., coops and munis),
community-based organizations, and developers to unlock this market. RMI is helping coops,
munis, and community-based organizations by supporting procurement and business model
development. RMI is helping developers and EPCs understand the community-scale
opportunity and adapt their designs and business models to best access the market.
Figure 7: Price Distribution of Large (0.5–5 MW) C&I Solar Systems
A wide price spread suggests an opaque and ineffective market, with opportunities to reduce prices and tighten the spread.
IIIIIII
0%
5%
10%
15%
20%
25%
30%
35%
1.0–1.5 1.5–2.0 2.0–2.5 2.5–3.0 3.0–3.5 3.5–4.0 4.0–4.5 4.5–5.0 5.0–5.5 5.5–6.0 6.0–6.5 6.5–7.0
Installed Cost (2014$/watt)
Pe
rce
nt
of
Inst
alle
d S
yst
em
s

COMMUNITY-SCALE SOLAR INSIGHT BRIEF 14
ROCKY MOUNTAIN INSTITUTE * WWW.RMI.ORG * CARBON WAR ROOM * WWW.CARBONWARROOM.COM BASALT, CO * BOULDER, CO * NEW YORK, NY * WASHINGTON, D.C. * BEIJING, CHINA
ABOUT ROCKY MOUNTAIN INSTITUTE
Rocky Mountain Institute (RMI)—an independent nonprofit founded in 1982—transforms global energy use to create a
clean, prosperous, and secure low-carbon future. It engages businesses, communities, institutions, and entrepreneurs to
accelerate the adoption of market-based solutions that cost-effectively shift from fossil fuels to efficiency and renewables. In
2014, RMI merged with Carbon War Room (CWR), whose business-led market interventions advance a low-carbon economy.
The combined organization has offices in Basalt and Boulder, Colorado; New York City; Washington, D.C.; and Beijing.
CONTACT
To learn more about RMI’s Shine initiative for community-scale solar, or to engage with us,
please contact [email protected].
ENDNOTESi “Solar Energy Facts: Q2 2015.” Solar Energy Industries Association. <<http://www.seia.org/sites/default/files/Q2%202015%20SMI%20Fact%20Sheet.pdf>>
ii Munsell, Mike. “US Solar Market Sets New Record, Installing 7.3GW of Solar PV in 2015.” Greentech Media. February 22, 2016. <<https://www.greentechmedia.com/articles/read/us-solar-market-sets-new-record-installing-7.3-gw-of-solar-pv-in-2015>> iii “Electricity Data Now Include Estimated Small-Scale Solar PV Capacity and Generation.” Energy Information Agency. December 2, 2015. <<https://www.eia.gov/todayinenergy/detail.cfm?id=23972>> iv Hernandez, Mari. Rooftop Solar Adoption in Emerging Residential Markets. Center for American Progress. May 29, 2014. <<https://www.americanprogress.org/issues/green/report/2014/05/29/90551/rooftop-solar-adoption-in-emerging-residential-markets/>> v Honeyman, Cory. U.S. Community Solar Market Outlook 2015–2020. GTM Research. 2015. <<https://www.greentechmedia.com/research/report/us-community-solar-market-outlook-2015-2020>> vi Honeyman, Cory. U.S. Community Solar Market Outlook 2015–2020. GTM Research. 2015. <<https://www.greentechmedia.com/research/report/us-community-solar-market-outlook-2015-2020>>
vii Feldman, David, et al. Shared Solar: Current Landscape, Market Potential, and the Impact of Federal Securities Regulation. National Renewable Energy Laboratory. 2015. <<http://www.nrel.gov/docs/fy15osti/63892.pdf>>
viii Munsell, Mike. "Investment Tax Credit Extenson Would Increase US Solar Installations 54% Through 2020." Greentech Media. December 16, 2015. <<http://www.greentechmedia.com/articles/read/investment-tax-credit-extension-will-increase-solar-installations-54-throug>>
ix Mai, Trieu, et al. Impacts of Federal Tax Credit Extensions on Renewable Deployment and Power Sector Emissions. National Renewable Energy Laboratory. 2016. <<http://www.nrel.gov/docs/fy16osti/65571.pdf>> x “Solar, natural gas, wind make up most 2016 generation additions.” U.S. Energy Information Administration. March 1, 2016. <<http://www.eia.gov/todayinenergy/detail.cfm?id=25172>>
xi Feldman, David, et al. Shared Solar: Current Landscape, Market Potential, and the Impact of Federal Securities Regulation. National Renewable Energy Laboratory. 2015. <<http://www.nrel.gov/docs/fy15osti/63892.pdf>>
xii“RE-Powering America’s Land.” U.S. Environmental Protection Agency. <<http://www.epa.gov/re-powering>>
xiii Gleckner, Allen. “Lessons from the First Year of Xcel Energy’s Community Solar Program.” Greentech Media. December 15, 2015. <<http://www.greentechmedia.com/articles/read/xcels-community-solar-turns-1-year-old>>
xiv Cotter, Andrew, and Dean Moretton. How Electric Cooperatives are Integrating Solar. NRECA. 2015. <<http://eo2.commpartners.com/users/nreca_jb/downloads/How_Electric_Coops_are_Integrating_Solar.pdf>>
xv “AC Power Block.” First Solar. <<http://www.firstsolar.com/en/Products/AC-Power-Block.aspx>>
xvi “Oasis Power Plant.” SunPower. <<http://us.sunpower.com/utility-scale-solar-power-plants/oasis-power-plant/>>