(III YEAR I SEM) (2017-18) - mrcet.com Manuals/AE/III-I/AERODYNAMICS AND PROPULSION... ·...
74
AERODYNAMICS AND PROPULSION LABORATORY MANUAL B. TECH (III YEAR – I SEM) (2017-18) Prepared by Dr. SREENADH CHEVULA, Professor. Mr. Ravi, Professor. Mr. YUGENDER MALOTHU, Assistant Prof. Department of Aeronautical Engineering MALLA REDDY COLLEGE OF ENGINEERING & TECHNOLOGY (Autonomous Institution – UGC, Govt. Of India) Recognized under 2 (f) and 12 (B) of UGC ACT 1956 Affiliated to JNTUH, Hyderabad, Approved by AICTE - Accredited by NBA & NAAC – A Grade - ISO 9001:2008 Certified) Maisammaguda, Dhulapally (Post Via. Hakimpet), Secunderabad – 500100, Telangana State, India
Transcript of (III YEAR I SEM) (2017-18) - mrcet.com Manuals/AE/III-I/AERODYNAMICS AND PROPULSION... ·...

AERODYNAMICS AND PROPULSION
LABORATORY MANUAL
B. TECH
(III YEAR – I SEM) (2017-18)
Prepared by
Dr. SREENADH CHEVULA, Professor. Mr. Ravi, Professor.
Mr. YUGENDER MALOTHU, Assistant Prof.
Department of Aeronautical Engineering
MALLA REDDY COLLEGE
OF ENGINEERING & TECHNOLOGY
(Autonomous Institution – UGC, Govt. Of India) Recognized under 2 (f) and 12 (B) of UGC ACT 1956
Affiliated to JNTUH, Hyderabad, Approved by AICTE - Accredited by NBA & NAAC – A Grade - ISO 9001:2008 Certified)
Maisammaguda, Dhulapally (Post Via. Hakimpet), Secunderabad – 500100, Telangana State, India


DEPT OF ANE ADP LAB MANUAL
1 | P a g e
INSTRUCTIONS FOR THE STUDENTS
Experimental work, in most situations you will encounter, and a quick and fast compared
systems you will find in the ADP Laboratory.
Computer data acquisition is used only where the volumes of data exceed a human’s ability
to record it. Data acquisition systems will invariably write the data to a proprietary file format
on an isolated computer system requiring extensive effort to get data to an analysis program
on a workstations.
The laboratory incorporates two types of equipment’s and instrumental setups ; 1 for the
experiments related to the studies in the area of Aerodynamics, and other for the
experiments related to the studies in the area of Propulsion.
Preparations must be handed in on the hour at the start of the laboratory. Formal reports
must be handed in one week after the experiment is performed. The laboratory notebook
entry for each laboratory experiment will be marked after the report is handed in and before
the end of the term.
Your report preparation answers must be submitted at the beginning of the class before
starting the experiment. Prepare your answers on loose leaf paper, these will not be returned.
A mark of zero will be assigned if a preparation is not submitted promptly at the beginning of
the lab period.
Reports must be handed in to the instructor in the prescribed format given by the instructor
not later than one week after completing the experiment.
Recommended Guidelines in the Preparation of Experiment Reports
The text portion of a report (from Introduction to Conclusion) must not exceed 10 double
spaced typed pages but a good report will be shorter. Marks will be deducted for oversized texts.
There is no restriction on the number of Figures, Tables, Computer printouts and Programs. Marks
will NOT be deducted for a handwritten report. If using a word processor, you may use it to format
equations and symbols only if it does them properly, otherwise it is preferable and more expedient
to write them in neatly by hand.
After years of marking reports, it has become clear the people who produce the longest text
sections in their reports usually have less of an idea of what they wish to convey and invariably end
up conveying less. In producing monster reports students do not increase their mark, they waste
tremendous amounts of time, usually in front of a computer, and then complain the reports require
an undue amount of work.
DEPT OF ANE ADP LAB MANUAL
2 | P a g e
Since the reports are general worth more than problem sets in other courses, students are
tempted to spend every hour between doing the experiment and handing in the report working on
the report to the detriment of their other courses. It is strongly recommended that you do not spend
more than 8 to 10 hours preparing any of these lab reports.
The suggestions provided here serve merely as pointers for the production of a good report.
There is no absolutely correct methodology for report preparation - a critical reviewer can always
find a few i’s to dot or t’s to cross. Style manuals which set the standard for scientific journals change
with time, and this is good; nothing should be cast in stone, unless it really is the last word. Most
students will be submitting papers for publication in the near future and reports are an excellent
vehicle for honing formatting and literary skills.
Please include a table of contents – it provides a useful guide, and only the page numbers
change from report to report. Here is an example table of contents with estimated page lengths for
each section. Reports will not be marked on how well their sections conform to these estimations.
Simple format of a report:
Pages
1. Introduction 1/2 2. Notation 1 3. Experimental Procedures 1 line
and Results 1 page 4. Error analysis 2 5. Discussion 2 - 4 6. Suggestions 1/2 7. Conclusions 1/2 8. References and Bibliography
Tables: these are your results Figures: these are your results Appendices

DEPT OF ANE ADP LAB MANUAL
3 | P a g e
IMPORTANT DEFINITIONS AND SYMBOLS TO BE KNOWN
1) Aerodynamics: Aerodynamics is the branch of fluid mechanics dealing with air motion and reaction of a body moving within that of air.
2) Aerodynamic centre: The point in the chord line about which pitching moment is constant. It
will not vary with angle of attack. 3) Airfoil: The cross section of any surface which can produce aerodynamic lift from the
atmosphere. 4) Angle of attack: Angle between the free stream wind direction and chord line. 5) Angle of incidence: Angle between the chord line and longitudinal axis of the airplane. 6) Centre of pressure: The point at which the total resultant pressure force acts. 7) Chord: It is the straight line joining the leading and trailing edge of an airfoil section. 8) Drag: It is an aerodynamic force opposing the direction of motion. Drag is inevitable to minimize
completely but its effect can be reduced to some extents. It can be due to surface viscosity (friction drag), pressure differences due to shape of an object (form drag), lift acting on a finite wing (induced drag) and other energy loss mechanism in the flow such as wave drag to shockwaves and in efficiencies in engines.
9) Drag coefficient (CD): It is defined as drag divided by dynamic pressure multiplied by reference
area. CD = Drag / (Dynamic pressure x Reference area) 10) Dynamic pressure: It is product of density and square of velocity divided by two. 11) Lift: It is force acting perpendicular to the direction of flight. Force generated by an airfoil section
acting at right angles to airstream flowing past it. In level flights lift should be equal to the weight of aircraft.
12) Lift coefficient: CL = Lift/Dynamic pressure x Reference Area 13) NACA Airfoil: These airfoils are wing cross sections designs invented by NACA organization. 14) Pressure Coefficient: It is a non-dimensional form of pressure.
DEPT OF ANE ADP LAB MANUAL
4 | P a g e
15) Stall: Normally the lift increases with the increase in angle of attack. When angle of attack is reached to a certain value, the flow over the upper surface of the wings separates from the body and the lift starts decreasing even with increase in the angle of attack and this condition (decrease in lift with increase in angle of attack) is called stall.
16) Streamline: The imaginary line along which the tangent at every point will give velocity at that
direction. 17) Wing loading: The ratio of the total weights of aircraft, and the span area of wing. 18) Wing span: It is the total length of the wing (measured from wing tip to wing tip) 19) Aspect ratio: Ratio of span to chord of an airfoil. Hence a high aspect ratio wing has great span
and narrow chord and vice – versa.
20) Boundary layer: A boundary layer is a thin layer of viscous fluid close to the solid surface of a wall in contact with a moving stream in which (within its thickness δ) the flow velocity varies from zero at the wall (where the flow “sticks” to the wall because of its viscosity) up to Ue at the boundary, which approximately (within 1% error) corresponds to the free stream velocity.
DEPT OF ANE ADP LAB MANUAL
5 | P a g e
CONTENTS
AERODYNAMICS LAB
S.No EXPERIMENT Page No
1 CALIBRATION OF A WIND TUNNEL 7
2 FLOW VISUALIZATION OVER A SYMMETRIC AEROFOIL (NACA-0012) 11
3 PRESSURE DISTRIBUTION OVER A SYMMETRIC AEROFOIL (NACA-0012) 13
4 PRESSURE DISTRIBUTION OVER A CIRCULAR CYLYNDERICAL BODY 17
5 PRESSURE DISTRIBUTION OVER A SPHERE 22
6 ESTIMATION AERODYNAMIC CHARACTER STICKS OF NACA-2312 AEROFOIL 28
7 EFFICIENCY OF VANES IN CENTRIFIGURAL BLOWER 32
PROPULSION LAB
S.No EXPERIMENT Page No 08 PERFORMANCE ESTIMATION OF SINGLE CYLINDER FOUR STROKE PETROL 36
09 PERFORMANCE AND HEAT BLANCE TEST FOR SINGLE CYLINDER FOUR STROKE DISEL ENGINE.
44
10 DETERMINATION OF PORT TIMING AND SKETCHING FOR TWO STROKE PETROL ENGINE
51
11 DETERMINATION OF VALVE TIMING AND SKETCHING OF FOUR
STROKE DIESEL ENGINE
53
12 ESTIMATING THE EFFICIENCY OF CENTRIFUGAL COMPRESSOR 57 13 ESTIMATING PROPERTIES OF FUEL 60
14 ESTIMATING THE EFFICIENCY OF AXIAL FLOW COMPRESSOR 69

DEPT OF ANE ADP LAB MANUAL
6 | P a g e
AERODYNAMICS LAB

DEPT OF ANE ADP LAB MANUAL
7 | P a g e
Experiment – 1
CALIBRATION OF A WIND TUNNEL
AIM: To find the maximum velocity of the wind tunnel.
APPARTUS: Wind Tunnel Test Rig.
DESCRIPTION:
Wind tunnel is a facility for creating a uniform wind of known value in a test section where fluid flow phenomena can be investigated, models, of Aircrafts etc., can be tested from their performance, and also students training/teaching in fluid mechanics/aerodynamics. The facility can also be used for industrial aerodynamics testing and simulation studies on many of fluid problems.
THE FACILITY:
The line fetch of facility is given in the lab. The main part of the tunnel are Honey comb section, screens, contraction cone, test section, diffuser, safety screens, fan section, fan, motor and speed control drivers. The dimension and specification of the facility is given below.
SPECIFICATION:
Type of tunnel : Low speed, open circuit-suction type.
Test section size : Cross section -300mmx300mm and Length – 1000mm
Maximum speed : 70m/sec
Fan : Axial flow fan, Maximum rpm 1500, Number of blades 6,
Spinner is provided
Contraction Ratio : 9:1
Settling Chamber : 1mx1m
Honey Comb Size : 65mmx65mm
Screens : Two sections 8mesh and 16mesh
MAIN PARTS AND FUNCTION:
The subsonic wind tunnel consists of mainly honey comb, inlet mesh screen, diffuser, axial flow fan, and motor with speed control unit.
INLET DUCT:
Inlet duct (effuser) is aerodynamically contoured section with contraction area ratio 9:1. The inlet starts dimension of 900mmx900mm contoured to 300mmx300mm. The axial and lateral turbulence are reduced and smooth flow of air entering the test section is achieved by installing the honeycomb and screens for most efficiency and efficiencies of the air inlet.
The ratio of length to wall size of the honey comb is maintained as per the recommended standards. The wire mesh is also fixed to smoother the flow further. This is particularly, useful for obtaining laminar flow. The duct is secured to the test section by flange. The provision is also made for easy removal of diffuser and diffuser for possible separation from the test section, when required. It is also highly smothered and painted

DEPT OF ANE ADP LAB MANUAL
8 | P a g e
TEST SECTION:
The central portion in the tunnel is the test section sandwiched between the inlet duct and the diffuser using the flange. It has square 300mmx300mm cross sectional inside, and length 1000mm. This test section has been designed to provide the space for setting up of experimentation and visualization, and ready access to the experiments region. The test section is also printed with 4 Perspex windows two on each side. One wooden window is also provided for mode mounting. A hole, a plug is provided on the wooden window, the plug can be rotated and the rotation angle read out from an angular scale, around the plug. This plug can there be used to rotate the model in the pitch direction.
DIFFUSER:
The downstream portion of the tunnel is diffuser. To the end of this is attached on axial flow fan. The diffuser starts with 300mmx300mm square section at the test section end and enlarges to 420mm diameter round at the fan drives end. It is flanged and bolted to the test section.
AXIAL FLOW UNIT:
Axial flow unit consist AC Motor and variable speed AC drive. The 6 bladed propellers are connected to the motor through keyways. AC motor is connected to the variable drive which is used to vary the speed of the propellers from 100 rpm to 1500 rpm.
PROPELLERS:
The propeller should ideally be situated as for as possible from both ends of the working section, so as not to cause more turbulence than necessary. It is usually placed in a section whose area of cross section is some 1.5 to 2 times that of working or test section. The propeller must be of variable speed and sometimes the blades of variable pitch, to give good speed control in the tunnel.
BELL MOUTHED ENTRY:
A bell mouthed entry with honeycomb network and screens with smooth settling length provided before the test section. Air flow is generated by a suitably designed axial flow fan, by a D.C motor of 5H.P, 2800 RPM and a thyristor drive for speed control. The approx. Volume flow rate 10,000 cm h with static pressure of 50 mm of W.C, under free running condition. The sturdy angular stand is provided for vibration free running.
ATTACHMENTS:
SMOKE GENERATOR:
This unit is meant for creating the streamlined dense white smoke in the direction of air flow and across the model. All accessories are provided for completion of this unit.
A smoke rake can be inserted in the contraction CMC for visualizing flow pattern on the blocks. For flow visualization it is advised to keep one side block to see the smoke with contrast of the black background. The user of the tunnel may keep a black paper or a black painted plywood sheet of appropriate size which fits exactly the side wall. The block color must let be shining. This would enhance line flow visualization which would enable to take good pictures.
MULTI TUBE MANOMETERS: This Manometer is used for studying the pressure distribution across the various models.

DEPT OF ANE ADP LAB MANUAL
9 | P a g e
PITOT TUBE: A Prandtl pitot tube is provided to measure the velocity of
air flow.
AIRFOIL:
The airfoil is two dimensional body, which is streamlined so
that the separation occurs only in the extreme range of the
body. The airfoil model conforms to NACA 0018 axial chord
16 cm and spam 29 cm with 12 parametric tapping for
pressure distribution studies. The separation point is near
the trailing edge and the width of the resulting work is small
so as to provide low drag.
DRAG COEFFICIENT:
The drag coefficient is small at low angles because of the appearance of the wake behind the body
and the separation of flow from the upper surface. The airfoil is made out of seasoned teakwood
to provide long lasting usage.
A suitable stand provided with precision 2 components force transmitter to mount the airfoil model.
A digital force indicator to measure lift force of 5-kgf and drag force of 5kgf is provided. The indicator
is calibrated to read in grams. EXPERIMENTAL PROCEDURE:
Switch on the motor and set up motor RPM. Note the manometer reading h1 and h2. By using the relation between h1, h2 and density of water and air calculate velocity. Calculate the Mach number and velocity
Velocity Head of Air 2( ) 2
, and t s w a
t s w a
a a
P P gHV P P gH V
Dynamic Pressure 2
1 2
2 100
w w
a
a a
h hVP H
g
ρw is the Density of water = 1000 kg/m3 and ρa is the Density of air =1.16 kg/m3 at room temperature.
Acceleration due to Gravity g = 9.81 m/s and Mach number M = V
a
Where a is the speed of the sound =340 m/s.
Figure 2.1- Prandtl Pitot tube.

DEPT OF ANE ADP LAB MANUAL
10 | P a g e
Sl.No RPM
Manometer Reading mm of water
1 2h h = Ha
t s w aP P gH
2w a
a
gHV
Mach Number
1.
2.
3.
4.
Result:
Viva Questions
1. What is an Incompressible Flow? 2. Explain Speed of Sound? 3. Define Mach number? 4. What is a Potential Flow? 5. Define Stream Function, Velocity Potential?
DEPT OF ANE ADP LAB MANUAL
11 | P a g e
Experiment – 2
FLOW VISUALIZATION OVER A SYMMETRIC AEROFOIL (NACA-0012)
Aim: To visualize the flow separation over Aerofoil (NACA 0012) at different angles of attacks
Apparatus: Wind tunnel, Testing model and Smoke Generator.
Description:
Flow visualization is the study of methods to display dynamic behavior in liquids and gases. The
field dates back at least to the mid-1400, where sketched images of fine particles of sand and wood
shavings which had been dropped into flowing liquids. Since then, laboratory flow visualization has
become more and more exact, with careful control of the particulate size and distribution. An advance
in photography has also helped extend our understanding of how fluids flow under various
circumstances. More recently, computational fluid dynamics (CFD) have extended the abilities of
scientists to study flow by creating simulations of dynamic behavior of fluids under a wide range of
conditions.
The result of this analysis is usually a 2-D or a 3-D grid of velocity vectors, which may be uniformly or
non-uniformly spaced. The goal is then to analyze this vector field to identify features such as
turbulence, vortices, and other forms of structure.
Procedure:
1. Mount the test model at various angles (0o, 5 o, 10 o, 15 o, 20 o, and 25 o) on the stand provided in the test section of the wind tunnel. The trailing edge should be faced towards the fan.
2. On the Smoke Generator and wait for a few minutes to generate smoke.
3. Visualize the flow over test model and the streamlines separating from the surface.
4. Take the pictures of flow separations at various velocities of the air.
Precautions:
1. Do not stand behind the wind tunnel while operating it.
2. Wait for a few minutes to generate the smoke after switching on Smoke generator.
Result: Note: Draw or capture the flow patterns and boundary layer formations at various angle of attacks (0o, 5 o, 10 o, 15 o, 20 o, and 25 o).

DEPT OF ANE ADP LAB MANUAL
12 | P a g e
DEPT OF ANE ADP LAB MANUAL
13 | P a g e
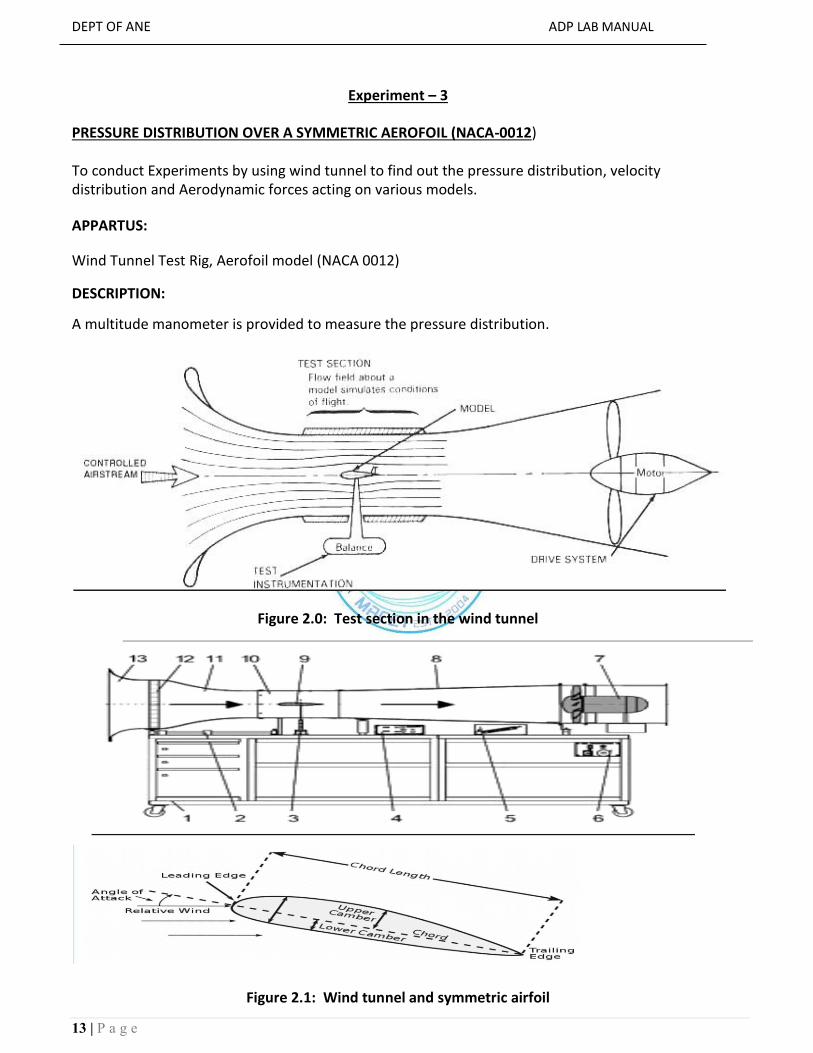
Experiment – 3
PRESSURE DISTRIBUTION OVER A SYMMETRIC AEROFOIL (NACA-0012)
To conduct Experiments by using wind tunnel to find out the pressure distribution, velocity distribution and Aerodynamic forces acting on various models.
APPARTUS:
Wind Tunnel Test Rig, Aerofoil model (NACA 0012)
DESCRIPTION:
A multitude manometer is provided to measure the pressure distribution.
Figure 2.0: Test section in the wind tunnel
Figure 2.1: Wind tunnel and symmetric airfoil
DEPT OF ANE ADP LAB MANUAL
14 | P a g e
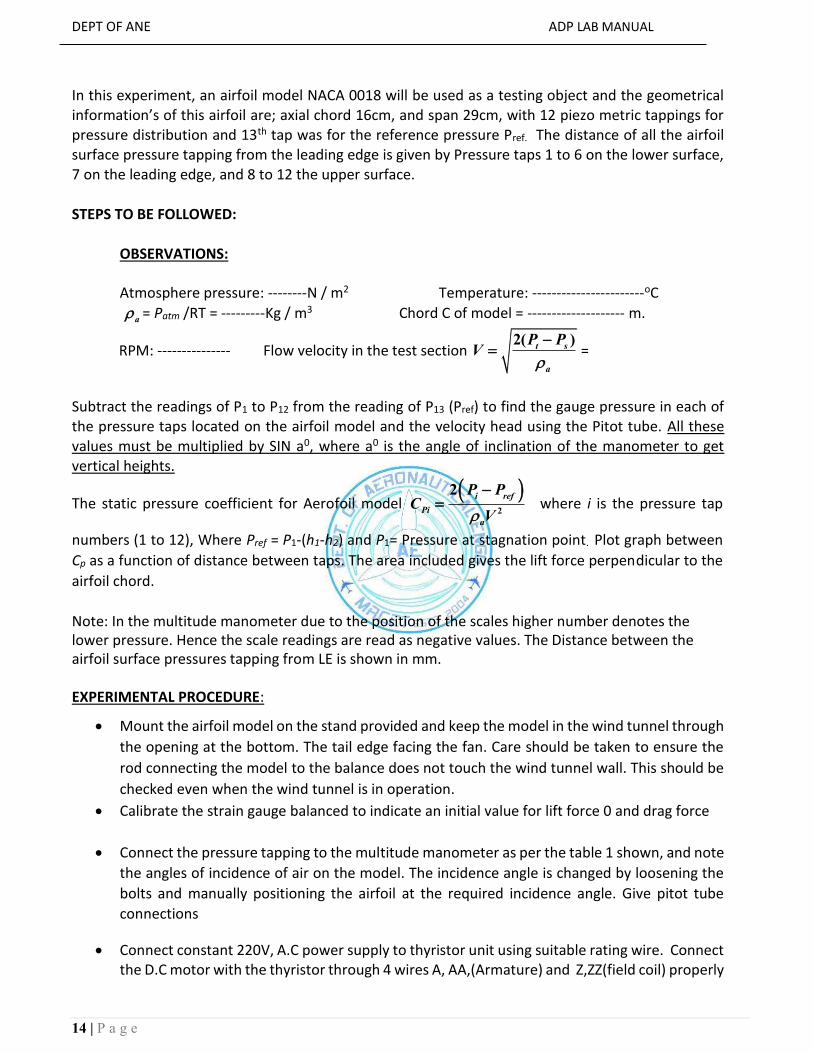
In this experiment, an airfoil model NACA 0018 will be used as a testing object and the geometrical information’s of this airfoil are; axial chord 16cm, and span 29cm, with 12 piezo metric tappings for pressure distribution and 13th tap was for the reference pressure Pref. The distance of all the airfoil surface pressure tapping from the leading edge is given by Pressure taps 1 to 6 on the lower surface, 7 on the leading edge, and 8 to 12 the upper surface.
STEPS TO BE FOLLOWED:
OBSERVATIONS: Atmosphere pressure: --------N / m2 Temperature: -----------------------oC
a
= Patm /RT = ---------Kg / m3 Chord C of model = -------------------- m.
RPM: --------------- Flow velocity in the test section 2( )
t s
a
P PV
=
Subtract the readings of P1 to P12 from the reading of P13 (Pref) to find the gauge pressure in each of the pressure taps located on the airfoil model and the velocity head using the Pitot tube. All these values must be multiplied by SIN a0, where a0 is the angle of inclination of the manometer to get vertical heights.
The static pressure coefficient for Aerofoil model
2
2i ref
Pi
a
P PC
V
where i is the pressure tap
numbers (1 to 12), Where Pref = P1-(h1-h2) and P1= Pressure at stagnation point. Plot graph between
Cp as a function of distance between taps. The area included gives the lift force perpendicular to the
airfoil chord.
Note: In the multitude manometer due to the position of the scales higher number denotes the lower pressure. Hence the scale readings are read as negative values. The Distance between the airfoil surface pressures tapping from LE is shown in mm. EXPERIMENTAL PROCEDURE:
Mount the airfoil model on the stand provided and keep the model in the wind tunnel through
the opening at the bottom. The tail edge facing the fan. Care should be taken to ensure the
rod connecting the model to the balance does not touch the wind tunnel wall. This should be
checked even when the wind tunnel is in operation.
Calibrate the strain gauge balanced to indicate an initial value for lift force 0 and drag force
Connect the pressure tapping to the multitude manometer as per the table 1 shown, and note
the angles of incidence of air on the model. The incidence angle is changed by loosening the
bolts and manually positioning the airfoil at the required incidence angle. Give pitot tube
connections
Connect constant 220V, A.C power supply to thyristor unit using suitable rating wire. Connect the D.C motor with the thyristor through 4 wires A, AA,(Armature) and Z,ZZ(field coil) properly

DEPT OF ANE ADP LAB MANUAL
15 | P a g e
If the direction of rotation of the fan to be changed , interchanged the field coil wire Z,ZZ in the thyristor unit
Ensure that the speed control knob is in minimum position and turn on the main switch.
Operate the push button switch and turn the speed control knob slowly to obtain the require
test section velocity.
Note the reading on differential pressure water manometer connected to the Pitot tube.
Note the readings on the multitude manometer P1 to P12, and P13 corresponding to the atmospheric pressure.
Note the angles of inclination of the manometer. From the different angle of incidence of aerosol model and for different airflow
rate the experiment may be repeated.
CALCULATIONS
TABLE -1: PRESSURE TAPPING POINTS:
Tap Points 1 2 3 4 5 6 7 8 9 10 11 12
Distance 160 120 80 50 30 10 0 10 30 50 80 120 in mm
TABLE -2: Multi tube manometer /Pitot tube U-tube Manometer reading.
Sl no Deg Pref P1 P2 P3 P4 P5 P6 P7 P8 P9 P10 P11 P12 h1 h2
1
2
3
Velocity Head of Air 2( ) 2
, and t s w a
t s w a
a a
P P gHV P P gH V
Dynamic Pressure 2
1 2
2 100
w w
a
a a
h hVq H
g
ρw is the Density of water = 1000 kg/m3 and ρa is the Density of air =1.16 kg/m3 at room temperature. The pressure distribution is expressed in dimensionless form by the pressure coefficient
21
and dynamic pressure ,2
i ref
Pi a
P PC q V
q
i = 1 to 12
DEPT OF ANE ADP LAB MANUAL
16 | P a g e
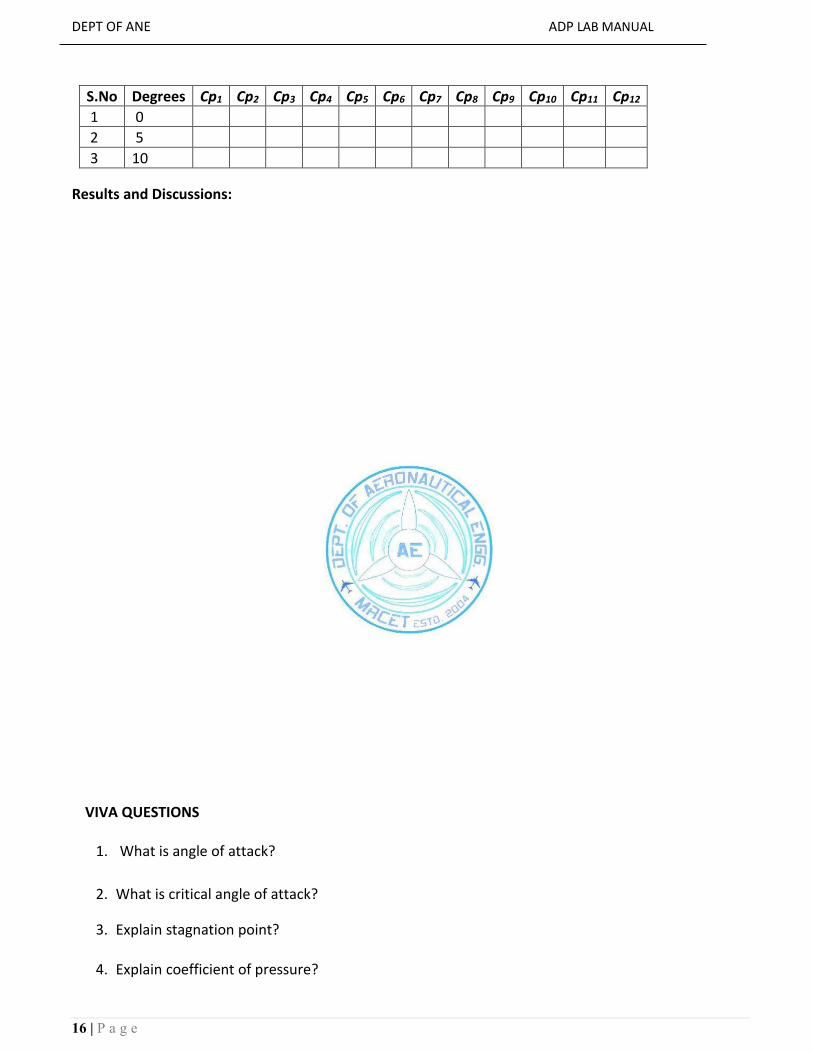
S.No Degrees Cp1 Cp2 Cp3 Cp4 Cp5 Cp6 Cp7 Cp8 Cp9 Cp10 Cp11 Cp12
1 0
2 5
3 10 Results and Discussions:
VIVA QUESTIONS
1. What is angle of attack?
2. What is critical angle of attack?
3. Explain stagnation point?
4. Explain coefficient of pressure?

DEPT OF ANE ADP LAB MANUAL
17 | P a g e
Experiment – 4
PRESSURE DISTRIBUTION OVER A CIRCULAR CYLYNDERICAL BODY
AIM: To determine the Drag over circular cylinder with various angle of attacks (180o, 270 o, 0 o, 90 o and, 180 o)
APPARTUS: Wind Tunnel Set-up, and testing bodies (circular cylindrical body)
4.1. DESCRIPTION:
The flow past a two-dimensional cylinder is one of the most studied of aerodynamics. It is
relevant to many engineering applications.
The flow pattern and the drag on a cylinder are functions of the Reynolds number ReD = V
D / ν, where D is the cylinder diameter, ν is the kinematic viscosity of the fluid (m2/s), and
V is the undisturbed free-stream velocity.
The drag is usually expressed as a coefficient C d =
21
2d V D where d is the drag
force per unit span.
Figure 4.1: Basic features of the flow past a circular cylinder
DEPT OF ANE ADP LAB MANUAL
18 | P a g e
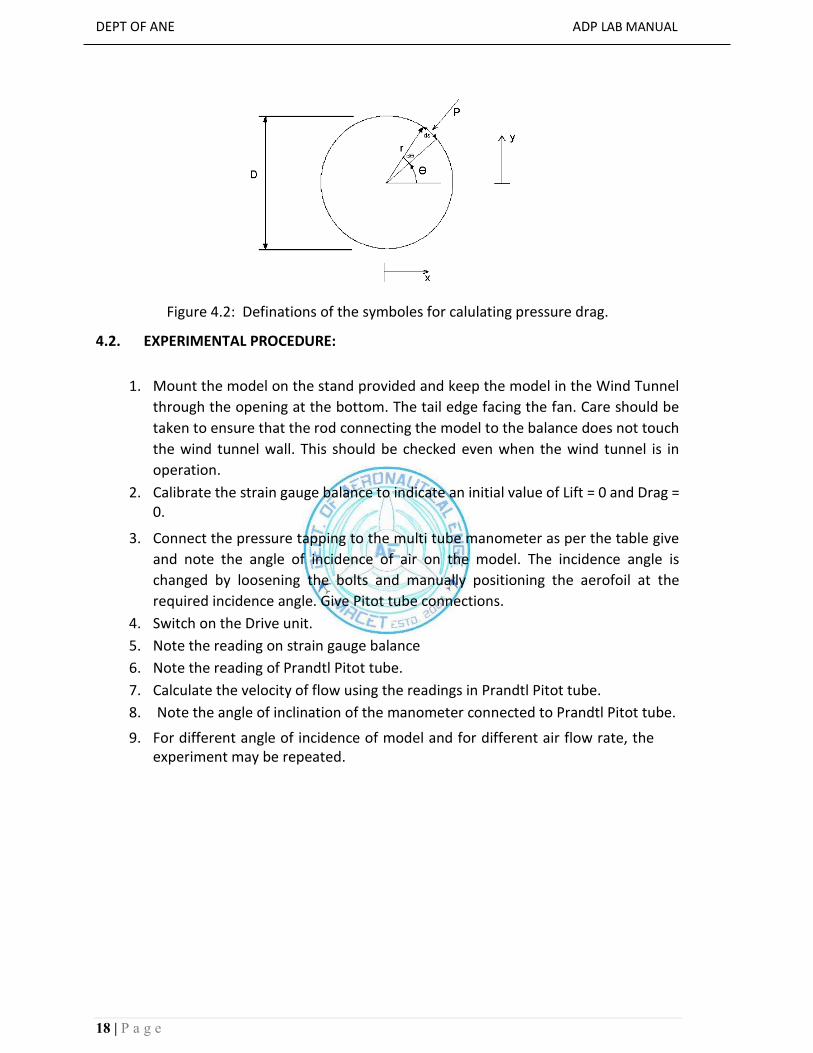
Figure 4.2: Definations of the symboles for calulating pressure drag.
4.2. EXPERIMENTAL PROCEDURE:
1. Mount the model on the stand provided and keep the model in the Wind Tunnel
through the opening at the bottom. The tail edge facing the fan. Care should be
taken to ensure that the rod connecting the model to the balance does not touch
the wind tunnel wall. This should be checked even when the wind tunnel is in
operation. 2. Calibrate the strain gauge balance to indicate an initial value of Lift = 0 and Drag =
0.
3. Connect the pressure tapping to the multi tube manometer as per the table give
and note the angle of incidence of air on the model. The incidence angle is
changed by loosening the bolts and manually positioning the aerofoil at the
required incidence angle. Give Pitot tube connections. 4. Switch on the Drive unit. 5. Note the reading on strain gauge balance 6. Note the reading of Prandtl Pitot tube. 7. Calculate the velocity of flow using the readings in Prandtl Pitot tube. 8. Note the angle of inclination of the manometer connected to Prandtl Pitot tube.
9. For different angle of incidence of model and for different air flow rate, the
experiment may be repeated.
DEPT OF ANE ADP LAB MANUAL
19 | P a g e
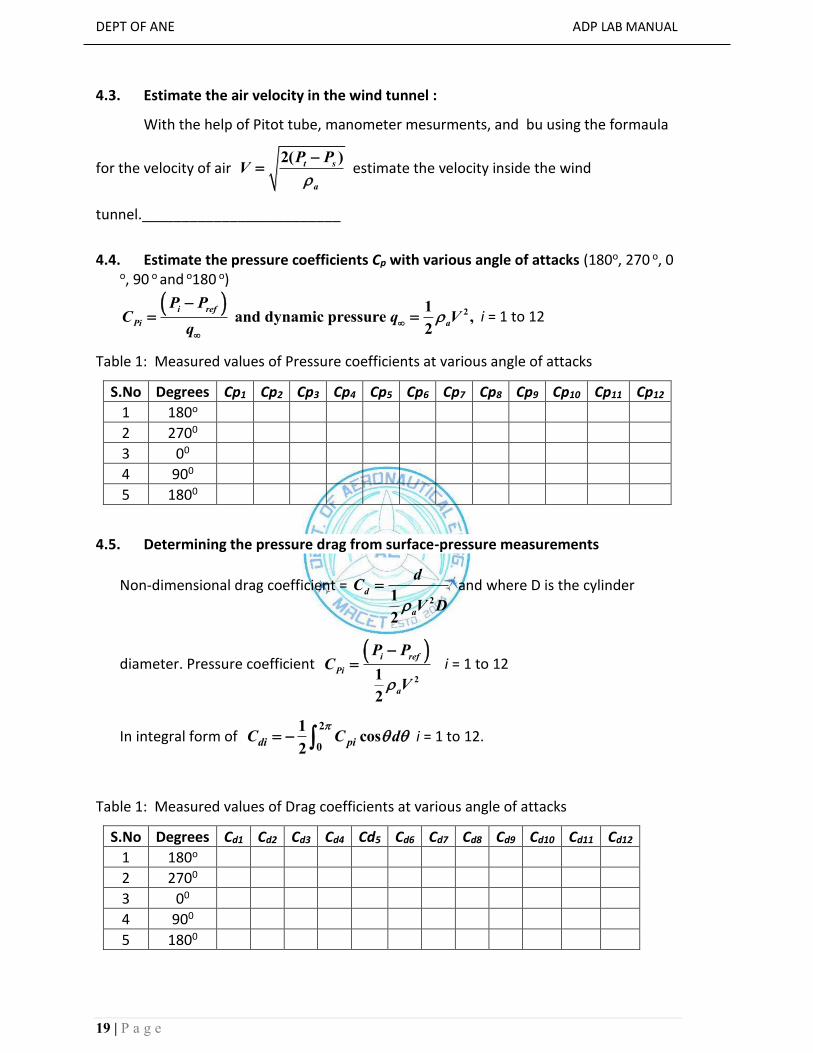
4.3. Estimate the air velocity in the wind tunnel :
With the help of Pitot tube, manometer mesurments, and bu using the formaula
for the velocity of air 2( )
t s
a
P PV
estimate the velocity inside the wind
tunnel._________________________
4.4. Estimate the pressure coefficients Cp with various angle of attacks (180o, 270 o, 0
o, 90 o and o180 o)
21
and dynamic pressure ,2
i ref
Pi a
P PC q V
q
i = 1 to 12
Table 1: Measured values of Pressure coefficients at various angle of attacks
S.No Degrees Cp1 Cp2 Cp3 Cp4 Cp5 Cp6 Cp7 Cp8 Cp9 Cp10 Cp11 Cp12
1 180o
2 2700
3 00
4 900
5 1800
4.5. Determining the pressure drag from surface-pressure measurements
Non-dimensional drag coefficient = 21
2
d
a
dC
V D
and where D is the cylinder
diameter. Pressure coefficient
2
1
2
i ref
Pi
a
P PC
V
i = 1 to 12
In integral form of 2
0
1cos
2di piC C d
i = 1 to 12.
Table 1: Measured values of Drag coefficients at various angle of attacks
S.No Degrees Cd1 Cd2 Cd3 Cd4 Cd5 Cd6 Cd7 Cd8 Cd9 Cd10 Cd11 Cd12
1 180o
2 2700
3 00
4 900
5 1800

DEPT OF ANE ADP LAB MANUAL
20 | P a g e
Notes:
This integration can be done numerically using Simpson's or the trapezium rule or
by plotting Cpcosθ vs. θ
The above estimate of Cd takes account only of the pressure drag on the cylinder.
In calculating this, however, it is fairly accurate, the main source of error probably
being the numerical integration.
4.6. Works to be done:
Conduct the same experiments with various speeds of the velocities V = 20, 30,
35, 40 m/s.
Estimate the Reynolds number (ReD).
At Angle of attack 180o
S.No V m/s ReD Cd1 Cd2 Cd3 Cd4 Cd5 Cd6 Cd7 Cd8 Cd9 Cd10 Cd11 Cd12
1 20
2 30
3 35
4 40
At Angle of attack 90o
S.No V m/s ReD Cd1 Cd2 Cd3 Cd4 Cd5 Cd6 Cd7 Cd8 Cd9 Cd10 Cd11 Cd12
1 20
2 30
3 35
4 40
Draw plots for the following
Measured values of Pressure coefficients VS various angle of attacks.
Measured values of any 3 of the Drag coefficients Vs Reynolds number (ReD)

DEPT OF ANE ADP LAB MANUAL
21 | P a g e
4.7. Results and Discussions
Viva Questions
1. What is Drag? 2. What is the significance of Coefficient of Drag? 3. Explain different types of Drag? 4. What is Reynolds Number and explain its significance wrt Drag? 5. What is Wake? 6. Explain Laminar and Turbulent Flow

DEPT OF ANE ADP LAB MANUAL
22 | P a g e
Experiment – 5
PRESSURE DISTRIBUTION OVER A SPHERE
AIM: To determine the Drag over a sphere with various angle of attacks (180o, 270 o, 0 o, 90 o and 180 o)
APPARTUS: Wind Tunnel Set-up, and testing bodies (Sphere)
5.1. DESCRIPTION: In this experiment, you will make a start on the flow patterns and fluid forces associated
with flow of a viscous fluid past a sphere by restricting consideration to low Reynolds
numbers ReD = V D / ν (where, V is the uniform approach velocity and D is the diameter of
the sphere).
At very low Reynolds numbers, Re << 1, the flow lines relative to the sphere are
about as shown in Figure 5.1. The first thing to note is that for these very small
Reynolds numbers the flow pattern is symmetrical front to back.
The flow lines are straight and uniform in the free stream far in front of the sphere,
but they are deflected as they pass around the sphere. For a large distance away
from the sphere the flow lines become somewhat more widely spaced, indicating
that the fluid velocity is less than the free-stream velocity.
The velocity of the fluid is everywhere zero at the sphere surface (remember the
no-slip condition) and increases only slowly away from the sphere, even in the
vicinity of the midsection: at low Reynolds numbers, the retarding effect of the
sphere is felt for great distances out into the fluid.
Figure 5-1. Steady flow of a viscous fluid at very low Reynolds numbers (“creeping flow”)
past a sphere. The flow lines are shown in a planar section parallel to the flow direction
and passing through the center of the sphere.

DEPT OF ANE ADP LAB MANUAL
23 | P a g e
Figure 5.2. Coordinates for description of the theoretical distribution of velocity in flow
past a sphere at very low Reynolds numbers (creeping flow).
Figure 5.3. Flow of an inviscid fluid past a sphere. The flow lines are shown in a planar
section parallel to the flow direction and passing through the center of the sphere.
The drag is usually expressed as a coefficient C d =
21
2d V D where d is the drag
force per unit span.
Figure 5.4: Definations of the symboles for calulating pressure drag.
DEPT OF ANE ADP LAB MANUAL
24 | P a g e
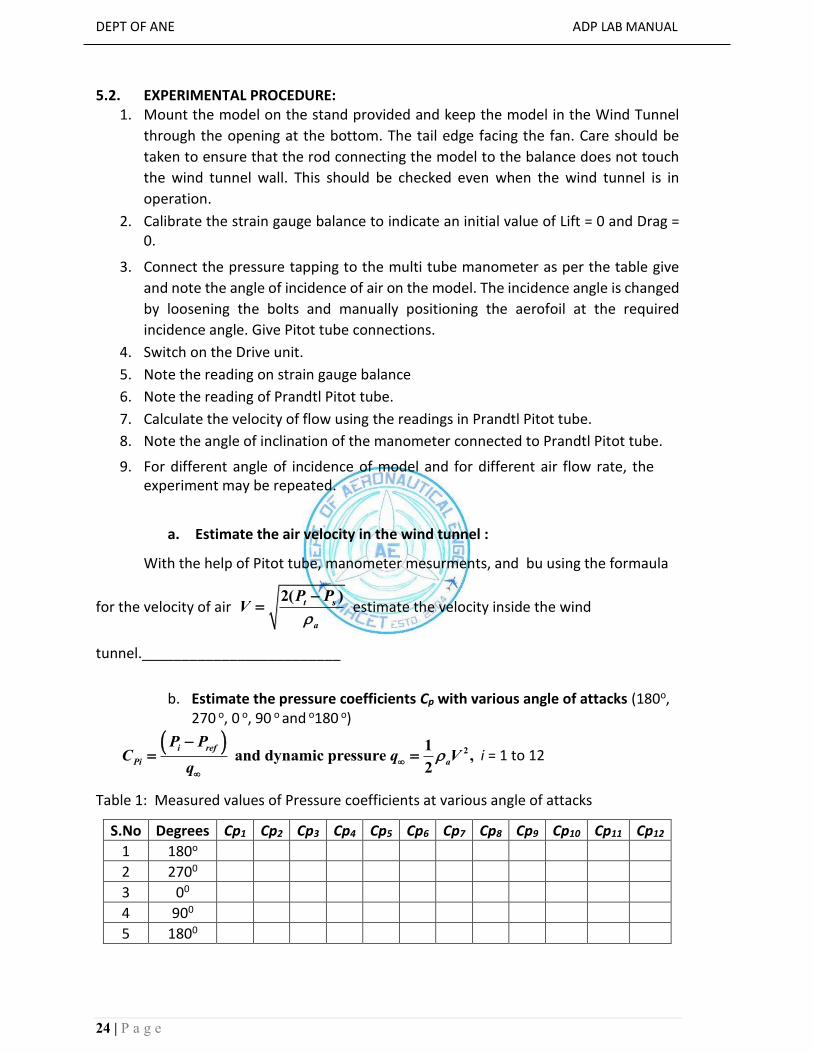
5.2. EXPERIMENTAL PROCEDURE: 1. Mount the model on the stand provided and keep the model in the Wind Tunnel
through the opening at the bottom. The tail edge facing the fan. Care should be
taken to ensure that the rod connecting the model to the balance does not touch
the wind tunnel wall. This should be checked even when the wind tunnel is in
operation. 2. Calibrate the strain gauge balance to indicate an initial value of Lift = 0 and Drag =
0.
3. Connect the pressure tapping to the multi tube manometer as per the table give
and note the angle of incidence of air on the model. The incidence angle is changed
by loosening the bolts and manually positioning the aerofoil at the required
incidence angle. Give Pitot tube connections. 4. Switch on the Drive unit. 5. Note the reading on strain gauge balance 6. Note the reading of Prandtl Pitot tube. 7. Calculate the velocity of flow using the readings in Prandtl Pitot tube. 8. Note the angle of inclination of the manometer connected to Prandtl Pitot tube.
9. For different angle of incidence of model and for different air flow rate, the
experiment may be repeated.
a. Estimate the air velocity in the wind tunnel :
With the help of Pitot tube, manometer mesurments, and bu using the formaula
for the velocity of air 2( )
t s
a
P PV
estimate the velocity inside the wind
tunnel._________________________
b. Estimate the pressure coefficients Cp with various angle of attacks (180o, 270 o, 0 o, 90 o and o180 o)
21
and dynamic pressure ,2
i ref
Pi a
P PC q V
q
i = 1 to 12
Table 1: Measured values of Pressure coefficients at various angle of attacks
S.No Degrees Cp1 Cp2 Cp3 Cp4 Cp5 Cp6 Cp7 Cp8 Cp9 Cp10 Cp11 Cp12
1 180o
2 2700
3 00
4 900
5 1800

DEPT OF ANE ADP LAB MANUAL
25 | P a g e
c. Determining the pressure drag from surface-pressure measurements
Non-dimensional drag coefficient = 21
2
d
a
dC
V D
and where D is the cylinder
diameter. Pressure coefficient
2
1
2
i ref
Pi
a
P PC
V
i = 1 to 12
In integral form of 2
0
1cos
2di piC C d
i = 1 to 12.
Table 1: Measured values of Drag coefficients at various angle of attacks
S.No Degrees Cd1 Cd2 Cd3 Cd4 Cd5 Cd6 Cd7 Cd8 Cd9 Cd10 Cd11 Cd12
1 180o
2 2700
3 00
4 900
5 1800
Notes:
This integration can be done numerically using Simpson's or the trapezium rule or
by plotting Cpcosθ vs. θ
The above estimate of Cd takes account only of the pressure drag on the cylinder.
In calculating this, however, it is fairly accurate, the main source of error probably
being the numerical integration.
Works to be done:
Conduct the same experiments with various speeds of the velocities V = 20, 30,
35, and 40 m/s.
Estimate the Reynolds number (ReD).
At Angle of attack 180o
S.No V m/s ReD Cd1 Cd2 Cd3 Cd4 Cd5 Cd6 Cd7 Cd8 Cd9 Cd10 Cd11 Cd12
1 20
2 30
3 35
4 40
DEPT OF ANE ADP LAB MANUAL
26 | P a g e
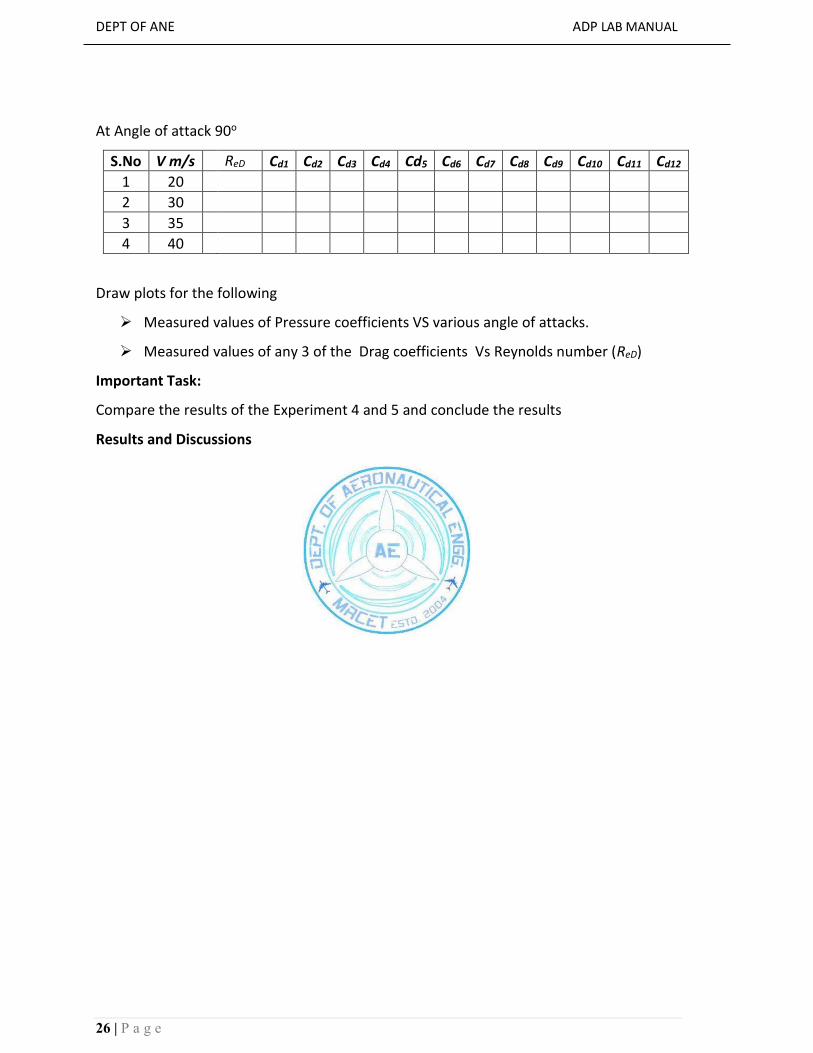
At Angle of attack 90o
S.No V m/s ReD Cd1 Cd2 Cd3 Cd4 Cd5 Cd6 Cd7 Cd8 Cd9 Cd10 Cd11 Cd12
1 20
2 30
3 35
4 40
Draw plots for the following
Measured values of Pressure coefficients VS various angle of attacks.
Measured values of any 3 of the Drag coefficients Vs Reynolds number (ReD)
Important Task:
Compare the results of the Experiment 4 and 5 and conclude the results
Results and Discussions

DEPT OF ANE ADP LAB MANUAL
27 | P a g e
DEPT OF ANE ADP LAB MANUAL
28 | P a g e
Experiment – 6
ESTIMATION AERODYNAMIC CHARACTER STICKS OF NACA-2312 AEROFOIL
AIM: To calculate the drag coefficient (Cd) and lift coefficient (CL) of NACA-2312 Airfoil. APPARTUS:
1 Low Speed Wind Tunnel Set-up 2 NACA-2312 Airfoil
DESCRIPTION: Distribution of pressure over an airfoil section may be a source of an aerodynamic twisting
force as well as lift. A typical example is illustrated by the pressure distribution pattern
developed by this cambered (nonsymmetrical) airfoil:
The upper surface has pressures distributed which produce the upper surface lift. The lower surface has pressures distributed which produce the lower surface force .
The net lift produced by the airfoil is the difference between left on the upper surface and the force on the lower surface. Net lift is effectively concentrated at a point on the chord called the Center Of Pressure.
When the angle of attack is increased:
Upper surface lift increases relative to the lower surface force. Since the two
vectors are not located at the same point along the chord line, a twisting force is
exerted about the center of pressure.
Center of pressure also moves along the chord line when angle of attack changes,
because the two vectors are separated. This characteristic of nonsymmetrical
airfoils results in undesirable control forces that must be compensated for if the
airfoil is used in rotary wing applications.
When the angle of attack is increased to develop positive lift, the vectors remain
essentially opposite each other and the twisting force is not exerted. Center of
pressure remains relatively constant even when the angle of attack is changed.
This is a desirable characteristic for a rotor blade, because it changes the angle of
attack constantly during each revolution.
DEPT OF ANE ADP LAB MANUAL
29 | P a g e
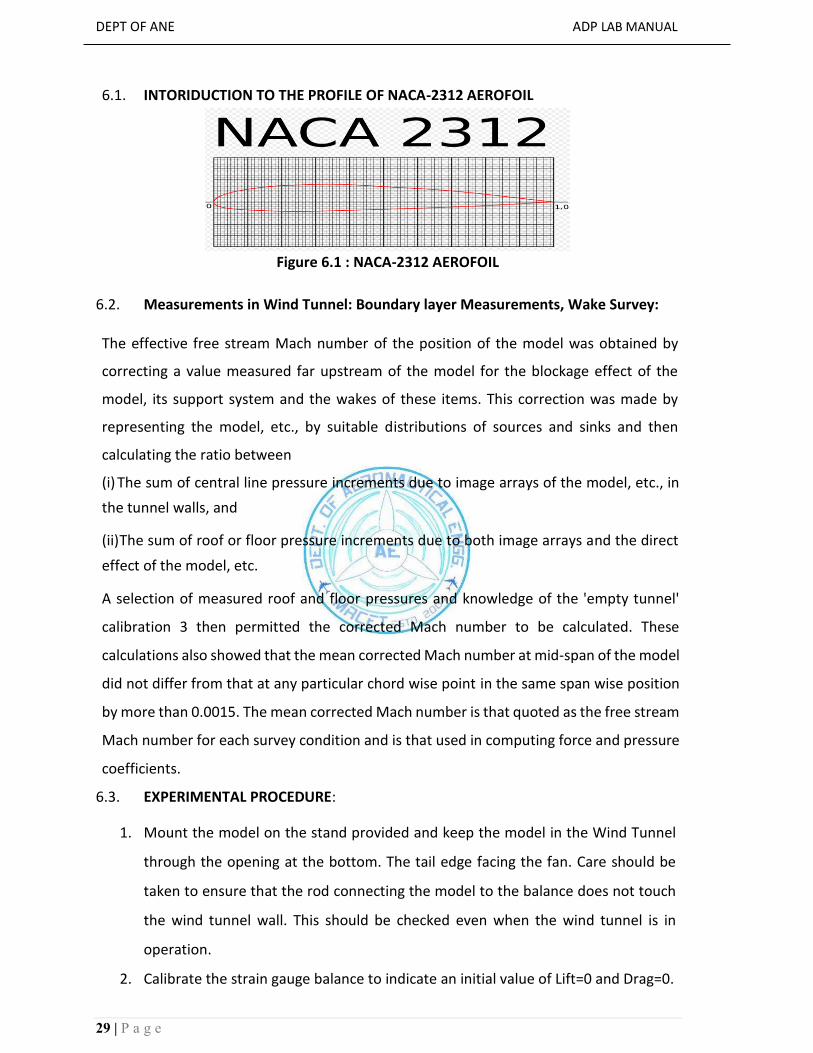
6.1. INTORIDUCTION TO THE PROFILE OF NACA-2312 AEROFOIL
Figure 6.1 : NACA-2312 AEROFOIL
6.2. Measurements in Wind Tunnel: Boundary layer Measurements, Wake Survey:
The effective free stream Mach number of the position of the model was obtained by
correcting a value measured far upstream of the model for the blockage effect of the
model, its support system and the wakes of these items. This correction was made by
representing the model, etc., by suitable distributions of sources and sinks and then
calculating the ratio between
(i) The sum of central line pressure increments due to image arrays of the model, etc., in
the tunnel walls, and (ii) The sum of roof or floor pressure increments due to both image arrays and the direct
effect of the model, etc. A selection of measured roof and floor pressures and knowledge of the 'empty tunnel'
calibration 3 then permitted the corrected Mach number to be calculated. These
calculations also showed that the mean corrected Mach number at mid-span of the model
did not differ from that at any particular chord wise point in the same span wise position
by more than 0.0015. The mean corrected Mach number is that quoted as the free stream
Mach number for each survey condition and is that used in computing force and pressure
coefficients.
6.3. EXPERIMENTAL PROCEDURE:
1. Mount the model on the stand provided and keep the model in the Wind Tunnel
through the opening at the bottom. The tail edge facing the fan. Care should be
taken to ensure that the rod connecting the model to the balance does not touch
the wind tunnel wall. This should be checked even when the wind tunnel is in
operation.
2. Calibrate the strain gauge balance to indicate an initial value of Lift=0 and Drag=0.

DEPT OF ANE ADP LAB MANUAL
30 | P a g e
3. Connect the pressure tapping to the multi tube manometer as per the table give
and note the angle of incidence of air about the model. The incidence angle is
changed by loosening the bolts and manually positioning the airfoil at the
required incidence angle. Give Pitot tube connections.
4. Switch on the Drive unit.
5. Note the reading on strain gauge balance
6. Note the reading of the Prandtl Pitot tube.
7. Calculate the velocity of the flow using the readings in a Prandtl Pitot tube.
8. Note the angle of inclination of the manometer connected to the Prandtl Pitot
tube.
9. For a different angle of incidence of model and for different air flow rate, the
experiment may be repeated.
10. Take the Readings of Drag from the strain gauge balance.
CALCULATIONS:
Velocity Head of Air 2( ) 2
, and t s w a
t s w a
a a
P P gHV P P gH V
Dynamic Pressure 2
1 2
2 100
w w
a
a a
h hVP H
g
ρw is the Density of water = 1000 kg/m3 and ρa is the Density of air =1.16 kg/m3 at room temperature.
Acceleration due to Gravity g = 9.81 m/s and Mach number M = V
a
Where a is the speed of the sound =340 m/s.
Coefficient of drag (CD) = Actual Drag (Kg/f) / (dynamic pressure*area)
coefficient of drag (CL) = Actual Lift (Kg/f) / (dynamic pressure*area) *
Platform area of aerosol A = 0.046m2
Actual lift force measured on the digital indicator or by using the following formulas we
can estimate
21
2L LF C V A
and
21
2D DF C V A
where CL = lifting coefficient, ρ = density of fluid (kg/m3), V = flow velocity (m/s), A = body area (m2) and CD = Coefficient of drag.
TABLE -1

DEPT OF ANE ADP LAB MANUAL
31 | P a g e
Angle of attack
S.No Degrees Lift Kg/f Lift Kg/f CL CD L
D
C
C
1 15
2 25
3 35
4 45 Viva Questions
1. What is NACA? 2. Explain NACA 4 Digit Series Airfoil? 3. What is Cambered Airfoil?
4. What is Lift and Drag and Explain significance of Lift and Drag coefficient? 5. What is a Center of Pressure and Aerodynamic Center?
Experiment -7

DEPT OF ANE ADP LAB MANUAL
32 | P a g e
EFFICIENCY OF VANES IN CENTRIFIGURAL BLOWER
AIM: To conduct tests on the given blower and to determine the overall efficiency using various Vanes provided. APPARATUS: Blower DESCRIPTION:
The given blower is a single stage centrifugal type. Air is sucked from atmosphere in the
suction side and the slightly compressed air passes through the spiral case before it comes
out through the outlet.
The given blower is provided with three interchangeable impellers namely straight curved,
forward curved and backward curved vanes. The vanes are pressed out of sheet metal and
riveted to the shrouds. This volute contour helps in reducing eddy current losses along the
path. The casing is designed such that it can separated to facilitate easy interchanging of
impellers.
The blower is directly coupled to a swinging field induction motor of 5HP, 2880rpm. The
outlet of the blower is connected to a pipeline of 3 meters length. A Venturimeter, a flow
control valve and pressure tappings are provided along the pipe. Pitot tube for measuring
the head is also provided on the suction and delivery of the blower.
A Panel mounted on sturdy iron stands, with switch starter for the blower motor, the 3-phase
energy meter to measure the input energy for the blower, and a manometer to measure the
flow, static and total head.
Experimental Procedure:
1. Fill mercury in the Manometer provided for Venturimeter, the levels must equal, if not remove air blocks.
2. Fill water in the manometer provided for Paddle Pitot tubes, provided on the suction
and delivery side, Close the cock connected to the inner pipe of the Pitot tube, and
leave this column of the manometer open to the atmosphere. Open the cock
connecting the statics pressure end Pitot tube.
3. Close the delivery control valve, and start the unit.
4. Open the delivery valve to ¼th level.
5. Note the time taken for 10 revolutions of energy meter reading.
DEPT OF ANE ADP LAB MANUAL
33 | P a g e
6. Note spring balance reading connected to the torque arm to the swinging field motor; Note the speed of the motor.
7. Note the manometer readings.
8. Repeat the experiment for different openings of the delivery valve and for different
impeller vanes.
Calculation:
To find the blower discharge Qt = K h m3 / sec
Where K = 1 2
1 2
2*
ga a
a h a h
. Where g = 9.81 m / sec2, h = (h1 – h2) (S1/ S2-1) m of air
column and S1 and S2 are densities of manometric fluid and air respectively, h1 – h2 is manometer readings in m of mercury column, a1 = area of Venturimeter inlet, diameter of inlet , a2 area of Venturimeter throat, diameter of throat. Specific gravity of mercury, air and water are 13.633 kg/m3, 1.205 kg/m3, 1 kg/m3v respectively.
To find the total head H= HD + HS of the blower, HD + HS = (h1 – h2) (S1/ S2-1) m of air column Where S1 and S2 are densities of manometer fluid
and air respectively. h1 – h2 is manometer readings in m of the water column Blower Output P = *Q*9.81* H
a Watts. Where
a is the density of the air.
The Input to the Blower Pi = (3600/E)*(10/t) Watts.
Where, E = (80 Rev / Kw) energy meter constant, and ‘t’ is the time taken (Seconds) for 10
revolutions of energy meter disc. Hence the efficiency (%) of the Blower = (Po/Pi) *100.
In the case of blower provided with swinging field motor the Input power may also be calculated as follows: Input power Pi =2π NT/60 watts. Where T is the torque arm length * spring balance reading in Kg*g and N is the speed of the motor.

DEPT OF ANE ADP LAB MANUAL
34 | P a g e
S.No Venturi Head Delivery Head Suction Head Time for 2 Rev Spring Blower
h1 m h2 m h1 m h2 m h1 m h2 m Energy m/sec Balance Kg efficiency %
1
2
3
4
RESULT:

DEPT OF ANE ADP LAB MANUAL
35 | P a g e
PROPULSION LAB

DEPT OF ANE ADP LAB MANUAL
36 | P a g e
Experiment-8
PERFORMANCE ESTIMATION OF SINGLE CYLINDER FOUR STROKE PETROL
ENGINE
Aim: To conduct a performance test on four stoke single cylinder petrol engine.
Instrumentation:
1. Digital RPM Indicator to measure the speed of the engine.
2. Digital temperature indicator to measure various temperatures.
3. Differential manometer to measure quantity of air sucked into cylinder.
4. Burette with manifold to measure the rate consumed during test. Engine Specifications:
Engine : Birla Power Bhp : 3 Hp Rpm : 3000 Rpm Fuel : Petrol No. Of Cylinders : Single Bore : 61.9 Mm Storoke Length : 60 Mm Starting : Rope & Pulley Starting Working Cycle : Four Stroke Method Of Cooling : Air Cooled Method Of Ignition : Spark Ignition Orifice Dia : 20 Mm Compression Ratio : 4.67 Spark Plug : Mico W 160z2 Carburator : Birla Power Governor System : Mechanical Governor Type : Self-Excited Dc Shunt Generator POWER : 1.5 Kw SPEED : 3000 RPM RATED VOLTAGE : 220v DC
(Max. speed to run as dc motor: 2600 RPM)

DEPT OF ANE ADP LAB MANUAL
37 | P a g e
Resistance Load Bank Specification: RATING : 2.5 Kw, 1Φ (single phase) VARIATION : In 10 steps, by dc switches. COOLING : Air cooled
bservations: Indicated power : IP Brake power : BP Specification fuel consumption : Sfc
Loading System The engine shaft is directly coupled to the DC Generator which can be loaded by resistive load bank. The load can be varied by switching on the load bank switches for various loads.
Procedure:
1. Connect the instrumentation power input plug to a 230v, 50 Hz single phase AC supply. Now, all the digital meters namely, RPM indicator, temperature indicator display the respective readings.
2. Fill up the petrol to the fuel tank mounted behind the panel. 3. Check the lubricating oil level in the oil sump with the dipstick provided. 4. Start the engine with the help of rope and pulley arrangement. 5. Allow the engine to stabilize the speed i.e. 2800 RPM by adjusting the accelerator knob. 6. Keep the change over switch in the generator direction. 7. Apply 1/4 Load (1.9 Amps). 8. Note down all the required parameters mentioned below.
a. Speed of the engine in RPM. b. Load from ammeter in amps. c. Burette readings in cc. d. Manometer readings in mm. e. Time taken for consumption of X cc petrol. f. Exhaust gas temperature in degree C.
9. Load the engine step by step with the use of dc switches provided on the load bank such as,
a. ½ load = b. ¾ load = c. Full load =
10. Note down all required readings.

DEPT OF ANE ADP LAB MANUAL
38 | P a g e
ENGINE PERFORMANCE: 1. Brake Power
V I Watts or Vi/1000 K.W. Where, V = DC voltage in volts.
I = DC current in amps.
2. Mass Of Fuel Consumed:
Actual volume : Brake thermal efficiency : Indicated thermal efficiency :
Va
bth
ith
Swept volume : Vs
Mechanical efficiency :
Volumetric efficiency : :
mech
v

DEPT OF ANE ADP LAB MANUAL
39 | P a g e
Frictional power : FP
Description:
The engine is a four stroke single cylinder, air-cooled, spark ignition engine. The output is coupled
to DC GENERATOR. The load is given to engine by DC Generator having a resistive load bank which
will take load with the help of dc switches and also providing motoring test facility to find out
power of engine.
Fuel measurement:
The fuel is supplied to the engine from the main feel tank through a graduated measuring fuel
gauge (Burette) with 3-way clock. To measure the fuel consumption of the engine, fill the burette
by opening the cock. By starting a stop clock, measure the time taken to consume Xcc of fuel by
the engine.
Air Intake Measurement:
The suction side of the engine is connected to an Air tank. The atmospheric air is drawn into the
engine cylinder through the air tank. The manometer is provided to measure drop across and
orifice provided in the intake pipe of the Air tank. This pressure drop is used to calculate the
volume of air drawn into the cylinder (orifice diameter is 20 mm.)
Lubrication:
The engine is lubricated by mechanical lubrication.
Lubricating oil recommended is SAE-40 OR Equivalent.
Temperature Measurement A digital temperature indicator with selector is provided on the panel to read temperature in degree centigrade, directly sensed by respective thermocouples located at different places on the test rig.
Thermocouple details:
T1 = inlet water temperature to calorimeter
T2 = outlet water temperature to calorimeter
T3 = exhaust gas inlet to calorimeter

DEPT OF ANE ADP LAB MANUAL
40 | P a g e
2gH 3
T4 = exhaust gas outlet to calorimeter
T5 = ambient temperature
Mfc =
X * 0.72 *3600 ……………………kg/hr
1000 *T
Where, X = burette reading in cc
0.72 = density of petrol in gram/cc
T = time taken in seconds.
3. Specific Fuel Consumption:
BSfc = Mfc
………………kg/K w hr
BP
4. Actual Volume Of Air Sucked In To The Cylinder
Va = Cd *A* * 3600 …………………..m / hr
Where H=(H/1000)X𝑤
𝑎
…………………….Meter
of water

DEPT OF ANE ADP LAB MANUAL
41 | P a g e
A = area of orifice =
H = manometer readings in mm
w (Density of water) = 1000kg/m3 a
Cd
5. Swept Volume
(Density of air) = 1.193 kg/ m3
(Coefficient of discharge) = 0.62.
Vs = = mm3/hr
Where, d = dia of bore = 61.9 mm == 0.07
L = length of stroke = 60 mm = 66.7 mm = 0.0667
N=Speed of the engine in RPM.
6. Volumetric Efficiency
V = 𝑉
𝑉
7. Brake Thermal Or Over All Efficiency
V =𝐵𝑃∗3600∗100
𝑀𝑓𝑐∗𝐶𝐼
Where, CV = calorific value of patrol = 45000 kJ/kg.
BP = Brake Power in KW.
8. Mechanical Efficiency:
ith =𝐼𝑃∗3600∗100
𝑀𝑓𝑐∗𝐶𝑉
DEPT OF ANE ADP LAB MANUAL
42 | P a g e
mech
9. Mechanical Efficiency:
=𝐵𝑃
𝐼𝑃*100
Where, BP = Brake Power in Kw.
IP = Indicated power in KW.
Motoring Test:
Aim: To measure the Frictional Power (FP) of the given four stroke single cylinder petrol engine by Motoring Test.
Procedure:
1. To conduct the motoring test, first connect the rectifier to the panel board.
2. Remove the spark plug connection from the engine & switch off the ignition switch.
3. Keep the change – over switch in the motoring direction.
4. Now slowly increase the power using Varies provided in the rectifier circuit.
5. Increase the speed up to 2800 RPM and note down the armature current and voltage.
6. Now slowly decrease the power and turn the change- over switch to OFF condition.
Frictional Power Of The Engine:
FP (Engine) = FP (Total) – FP (Motor) Where,
FP (Motor) = No load generator losses.
FP (Total) = Total frictional Power.
FP= 𝑉∗𝐼
1000∗ KW
Therefore, FP = …………KW.
Indicated Power
……………………..KW
IP =BP + FP (Engine)
Heat input = Mfc xCV
60
……………KJ/min

DEPT OF ANE ADP LAB MANUAL
43 | P a g e
g
Heat equivalent to BP = BP X 60 ………..KJ/min Heat
carried away by cooling water (calorimeter)
= mw * Cpw *T2 * T1
Where, mw = mass of water = VW * w
VW =volume of water flow in to calorimeter through rotameter R2
w = density of water in kg/m3
Heat carried away by exhaust gas
= mg * Cpg *T3 * T5
Where, mg = mass of gas = Vg g
Vg = volume of gas
g = density of gas =1.193 kg/m3
Cpg= specific heat of burnt gas = 0.24 KJ/Kg K
E. Unaccounted Heat
= A-(B+D+E)…………….KJ/min
DEPT OF ANE ADP LAB MANUAL
44 | P a g e
Experiment-9
Performance Estimation and heat balance test for single cylinder four stroke diesel engines
Aim: To study the variations of total fuel consumption, specific fuel consumption, brake thermal
efficiency &mechanical efficiency with brake power at constant speed, by conducting the
performance test on the engine & to draw the following characteristics curves.
i. B.P. (vs.) T.F.C
ii. B.P(vs.) S.F.C
iii. B.P.(vs.) brake thermal efficiency
iv. B.P.(vs.) indicated thermal efficiency
v. B.P(vs.)mechanical efficiency
Apparatus Required:
1. Stopwatch
2. Hand Tachometer
Specifications:
Name Of The Manufacturer : Kirloskar Rated
Speed : 1500rpm
Bhp : 5hp
Fuel : Diesel
No Of Cylinder : Single
Bore Dia : 80mm
Stroke Length : 110mm
Starting : Cranking
Method Of Cooling : Water Cooled
Method Of Ignition : Compression Ignition
Sfc : 0.272kg/Kw-Hr
Orifice Diameter : 20mm
DEPT OF ANE ADP LAB MANUAL
45 | P a g e
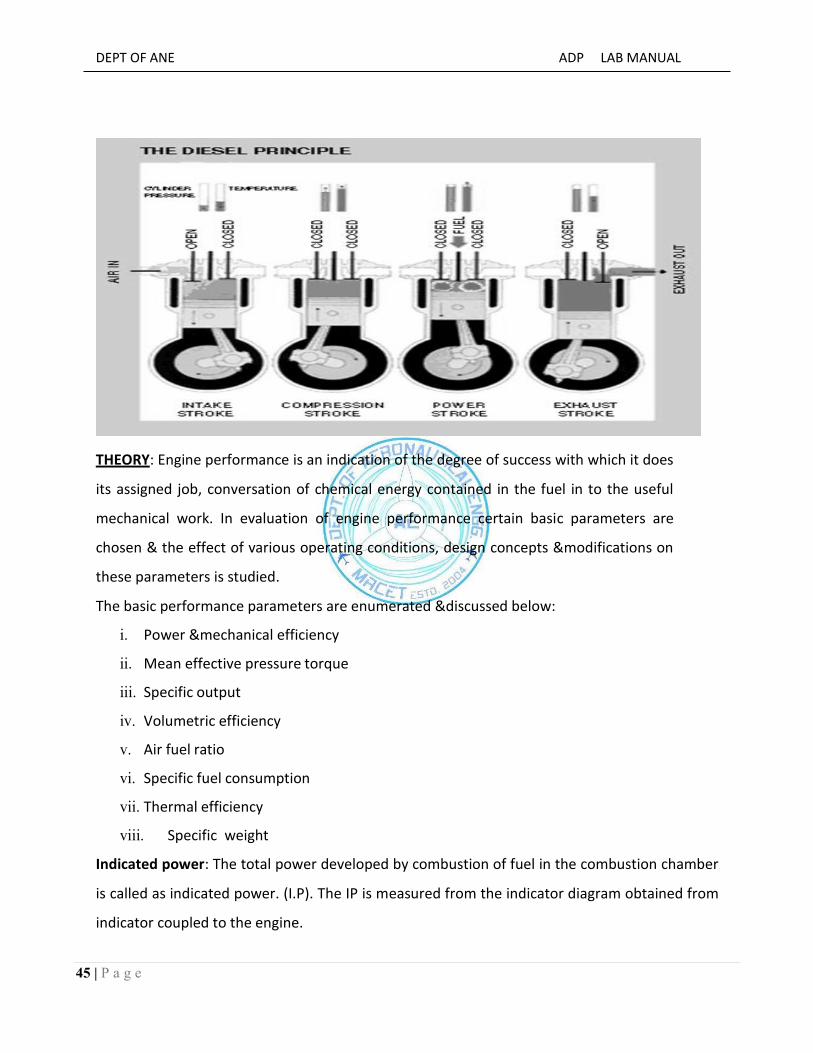
THEORY: Engine performance is an indication of the degree of success with which it does
its assigned job, conversation of chemical energy contained in the fuel in to the useful
mechanical work. In evaluation of engine performance certain basic parameters are
chosen & the effect of various operating conditions, design concepts &modifications on
these parameters is studied.
The basic performance parameters are enumerated &discussed below:
i. Power &mechanical efficiency
ii. Mean effective pressure torque
iii. Specific output
iv. Volumetric efficiency
v. Air fuel ratio
vi. Specific fuel consumption
vii. Thermal efficiency
viii. Specific weight
Indicated power: The total power developed by combustion of fuel in the combustion chamber
is called as indicated power. (I.P). The IP is measured from the indicator diagram obtained from
indicator coupled to the engine.

DEPT OF ANE ADP LAB MANUAL
46 | P a g e
Brake power: The brake power is the useful power available at the crank shaft (or) clutch shaft.
The brake power obtained by applying the load at brake drum .the brake power is less than the
Indicated power since it takes into account of the following
i. Pump losses due to indication &exhaust
ii. Mechanical losses in the bearings
iii. Resistance of air on flywheel rotation
Frictional power: The difference between IP& BP is called frictional power.
Specific fuel consumption: It is the mass of fuel consumed per kilowatt power developed per
hour & is a criterion of economical power production.
Indicated thermal efficiency: Indicated thermal efficiency of IC engine is the ratio of heat
converted into indicated work to the heat energy in the fuel supplied to the engine.
Procedure: After taking all the precautions, engine is started with no load on it. Time taken for
consumption of 10cc fuel & water manometer reading are noted. Now the load is applied in the
steps of 2, 4, 6, 8, 10&12kgs.
The corresponding time taken for 10cc of fuel consumption, water consumption &water
manometer reading are noted.
Precautions:
1. Parallax error should be avoided while taking readings. 2. Before starting the engine check the cooling water supply and lubrication system.
Result: Hence the performance test is conducted on 5 h.p kirlosker engine
s.no load Time taken for 10cc
of fuel consumption
‘t’sec
X(kgf) X 9.81 (N)
1.
2
3

DEPT OF ANE ADP LAB MANUAL
47 | P a g e
ith TFC CV
4
Maximum Load:
BP = ( 2NT )
60
T = W * Reff
Reff = Rdrum + Rbeltthickness
2R =9705
R =0.15517mm
Reff=0.15517m
Sample Calculations:
Brake Power: BP = 2NT
60
Total Fuel Consumption:
Total fuel consumption TFC = (𝑚𝑓 ∗ 10 ∗ 3600 ∗ 𝑠𝑝)/(𝑡 ∗ 1000) Heat input:
Heat input=TFC x calorific value of diesel KJ/hr
Break Thermal Efficiency:
bth=𝐵𝑃(𝐾𝑊)∗3600
ℎ𝑒𝑎𝑡 𝑖𝑛𝑝𝑢𝑡(𝐾𝐽
ℎ𝑟)*100
Specific fuel consumption:
sfc = TFC
BP (KW )
Indicated thermal efficiency:
=( IP * 3600 )
x100
DEPT OF ANE ADP LAB MANUAL
48 | P a g e
Description Of Test Rig:
Air intake measurement: Inlet end of the engine is connected to the intake air of the tank
fitted with orifice plate.
Fuel intake measurement: The engine fuel inlet is connected to the fuel tank through 3 locks
for running down the fuel.
a. Directly from tank to engine
b. To fill the burette from the fuel tank
Maximum Load Calculations:
Brake power rating and rated speed are noted from name plate details. The max load is calculated
using the formula supplied by the manufacturer itself.
Bhp=WN/2000
Procedure: Before starting the check the fuel supply, cooling water supply and lubrication
system. See that no-load should act on the hydraulic device. Engage the decompression lever.
Crank the engine with the help of cranking handle .Since the lever is engaged with the
decompression lever disengagement mechanism, the engine starts as soon as the lever
disengages. Keeping the load at zero, adjust the fuel supply so that the engine attains its rated
speed or the desired speed. Run the engine till the steady state conditions are attained. Note
down the inlet and outlet temperatures of the cooling water. Note down the exhaust gas temp
and manometer readings.
Set the hydraulic dynamometer to 20% of the full load and adjust the fuel supply so that the
engine attains the desired speed. After the steady state is reached, note down the hydraulic
dynamometer reading, fuel consumption rate, cooling water flow rate, manometer reading and
temperatures of cooling water and exhaust gases.
Repeat the experiment at 40%, 60%, 80%&100% of the full load at constant speed. Stop the
engine after removing load on hydraulic dynamometer. Calculate the heat energy supplied in the
fuel, heat energy equivalent to output power, heat energy carried away by cooling water, exhaust
gases & miscellaneous heat energy loss as per calculations shown.

DEPT OF ANE ADP LAB MANUAL
49 | P a g e
Precautions:
1. Parallax error should be avoided while taking readings
2. Before starting the engine check the cooling water supply lubrication system
3. All loads on the engine should be removed while starting and stopping of the engine.
Result: Various heat transfers in the cycle are noted &the values are tabulated in heat balance
sheet.

DEPT OF ANE ADP LAB MANUAL
50 | P a g e

DEPT OF ANE ADP LAB MANUAL
51 | P a g e
Experiment-10
Determination Of Port Timing And Sketching For Two Stroke Petrol Engine
Aim: To find out the timing of the inlet port and exhaust port operation of the given petrol engine
and to represent the result through a port timing diagram.
Theory: The timing sequence of the two stroke petrol engine is represented graphically. The
events such as opening and closing of inlet ports, transfer ports and exhaust ports are shown
graphically with respect to crank angles from dead center positions. This is known as port timing
diagram.
Port Timing Diagram of Single Cylinder Two Stroke Petrol Engine
The inlet port is uncovered by the piston 45o to 55o before the top dead center position .The
inlet port is covered 45o -550 after the top dead position. The exhaust port is uncovered and
covered 65o and 75o before and after bottom dead center respectively. The transfer port is
uncovered and covered 55o and 65o before top dead centre.
Precautions:
1. Lubricate all the parts for smooth operation before doing the experiment.
DEPT OF ANE ADP LAB MANUAL
52 | P a g e
2. Note the correct the direction of the crank shaft and mark the direction of rotation of fly wheel.
3. Rotate the crank shaft always in the correct direction.
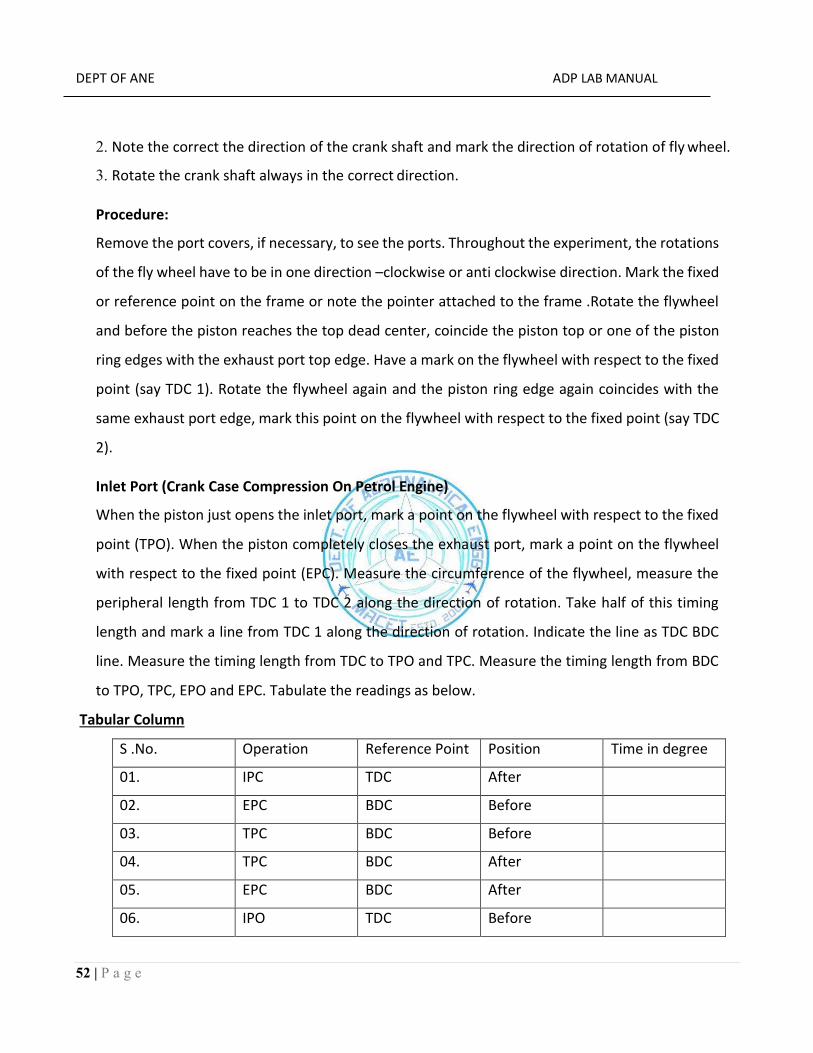
Procedure:
Remove the port covers, if necessary, to see the ports. Throughout the experiment, the rotations
of the fly wheel have to be in one direction –clockwise or anti clockwise direction. Mark the fixed
or reference point on the frame or note the pointer attached to the frame .Rotate the flywheel
and before the piston reaches the top dead center, coincide the piston top or one of the piston
ring edges with the exhaust port top edge. Have a mark on the flywheel with respect to the fixed
point (say TDC 1). Rotate the flywheel again and the piston ring edge again coincides with the
same exhaust port edge, mark this point on the flywheel with respect to the fixed point (say TDC
2).
Inlet Port (Crank Case Compression On Petrol Engine)
When the piston just opens the inlet port, mark a point on the flywheel with respect to the fixed
point (TPO). When the piston completely closes the exhaust port, mark a point on the flywheel
with respect to the fixed point (EPC). Measure the circumference of the flywheel, measure the
peripheral length from TDC 1 to TDC 2 along the direction of rotation. Take half of this timing
length and mark a line from TDC 1 along the direction of rotation. Indicate the line as TDC BDC
line. Measure the timing length from TDC to TPO and TPC. Measure the timing length from BDC
to TPO, TPC, EPO and EPC. Tabulate the readings as below.
Tabular Column
S .No. Operation Reference Point Position Time in degree
01. IPC TDC After
02. EPC BDC Before
03. TPC BDC Before
04. TPC BDC After
05. EPC BDC After
06. IPO TDC Before

DEPT OF ANE ADP LAB MANUAL
53 | P a g e
Experiment-11
Determination And Sketching Of Valve Timing For Four Stroke Diesel Engine
Aim: To find out the timing of the inlet port and exhaust VALVE operation of the Engine and to
represent the result through a valve timing diagram.
Theory:
The valve open and close at the dead centre positions of the piston but in actual practices they do
not open and close instantaneously at dead centers. They operate at some angular position before
or after the dead center. The ignition is timed to occur a little before top dead center. The tinning of
tins sequence of events such as inlet value closing, ignition, exhaust value opening and closing to
be shown graphically in terms of crank angles from dead centre positions.
Valve Timing Diagram of Single Cylinder Four Stroke Diesel Engine:
DEPT OF ANE ADP LAB MANUAL
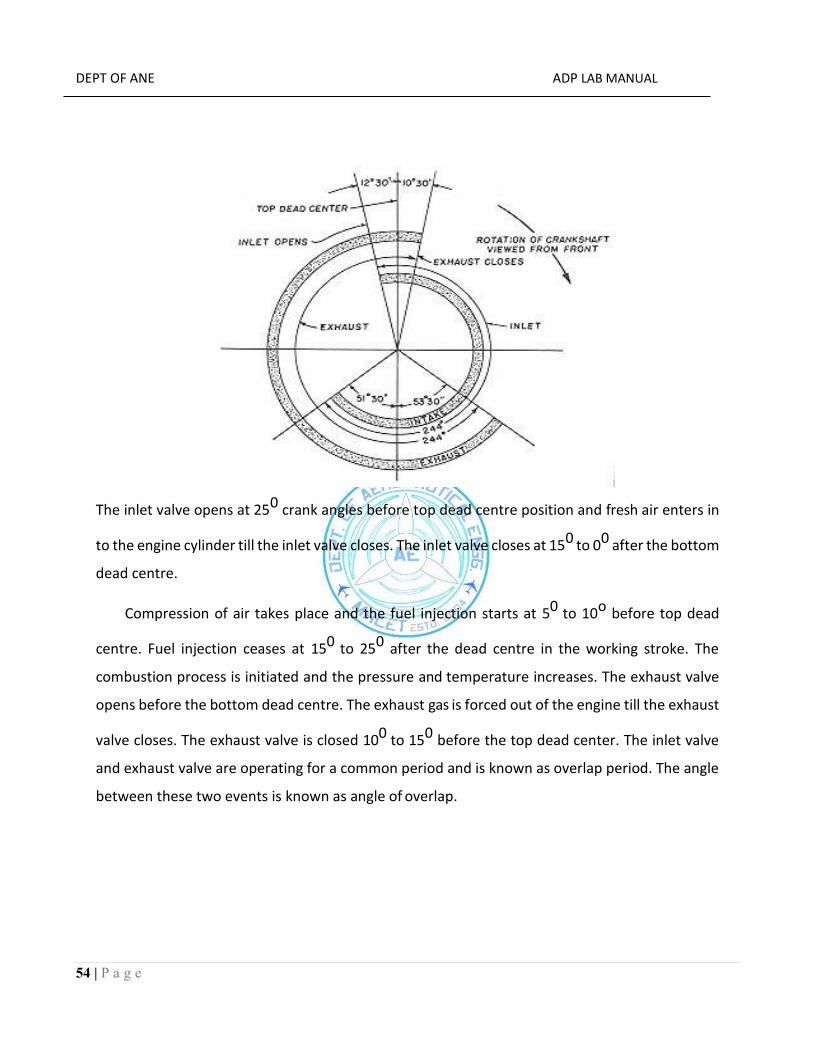
54 | P a g e
The inlet valve opens at 250 crank angles before top dead centre position and fresh air enters in
to the engine cylinder till the inlet valve closes. The inlet valve closes at 150 to 00 after the bottom
dead centre.
Compression of air takes place and the fuel injection starts at 50 to 10o before top dead
centre. Fuel injection ceases at 150 to 250 after the dead centre in the working stroke. The
combustion process is initiated and the pressure and temperature increases. The exhaust valve
opens before the bottom dead centre. The exhaust gas is forced out of the engine till the exhaust
valve closes. The exhaust valve is closed 100 to 150 before the top dead center. The inlet valve
and exhaust valve are operating for a common period and is known as overlap period. The angle
between these two events is known as angle of overlap.

DEPT OF ANE ADP LAB MANUAL
55 | P a g e
Figure: Valve timing diagram
Precautions:
1. Check the engine for its smooth operation of crank shaft, cam shaft and rocker arms. Apply
some oil for smooth operation.
2. Find out the proper direction of the rotation of the crank shaft with the help of starting
handle and mark it on the flywheel.
3. Identify the inlet and exhaust valves.
4. Rotate the flywheel in the correct direction.
Procedure:
2. The flywheel should be rotated in the proper direction and mark the BDC on the flywheel by
adjusting the position mark out the half the circumference of the flywheel this point indicates the
TDC.
3. The connecting rod should be perpendicular to the crank shaft.
4. Insert a paper strip in the clearance of the inlet valve and the push rod.
5. Slowly rotate the flywheel in the correct direction of the rotation; stop the flywheel when the
paper is just gripped.
DEPT OF ANE ADP LAB MANUAL
56 | P a g e
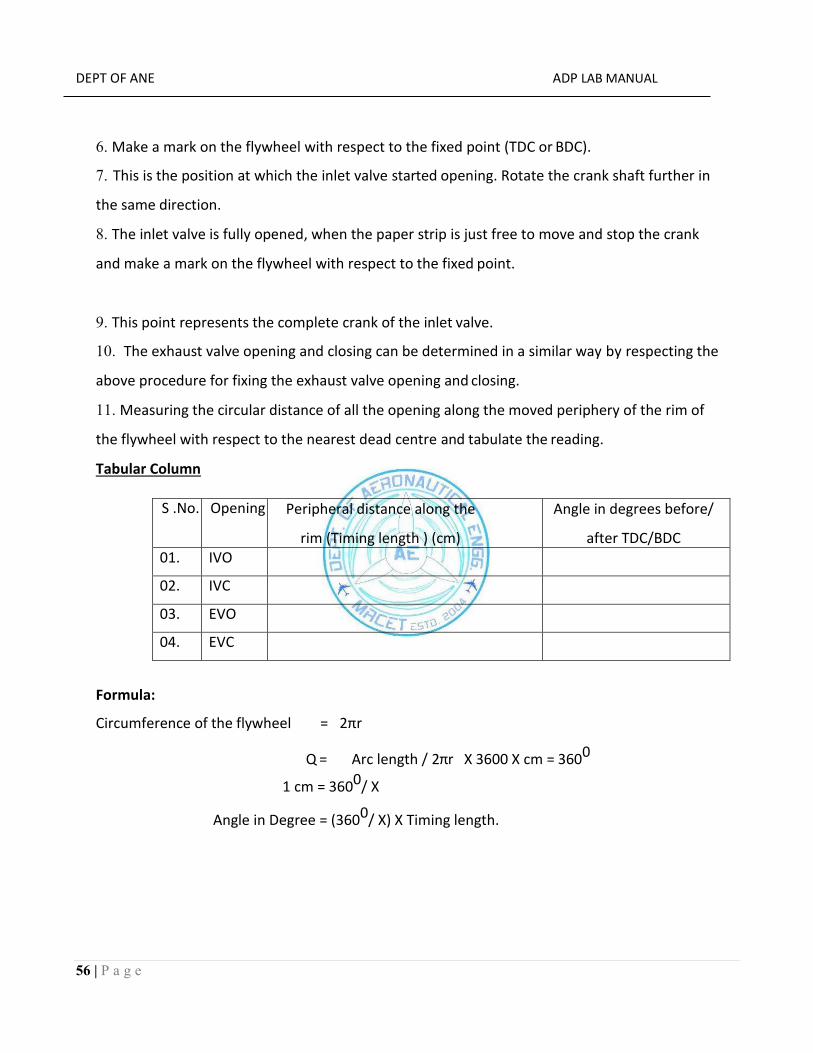
6. Make a mark on the flywheel with respect to the fixed point (TDC or BDC).
7. This is the position at which the inlet valve started opening. Rotate the crank shaft further in
the same direction.
8. The inlet valve is fully opened, when the paper strip is just free to move and stop the crank
and make a mark on the flywheel with respect to the fixed point.
9. This point represents the complete crank of the inlet valve.
10. The exhaust valve opening and closing can be determined in a similar way by respecting the
above procedure for fixing the exhaust valve opening and closing.
11. Measuring the circular distance of all the opening along the moved periphery of the rim of
the flywheel with respect to the nearest dead centre and tabulate the reading.
Tabular Column
S .No. Opening Peripheral distance along the
rim (Timing length ) (cm)
Angle in degrees before/
after TDC/BDC 01. IVO
02. IVC
03. EVO
04. EVC
Formula:
Circumference of the flywheel = 2πr
Q = Arc length / 2πr X 3600 X cm = 3600
1 cm = 3600/ X
Angle in Degree = (3600/ X) X Timing length.

DEPT OF ANE ADP LAB MANUAL
57 | P a g e
Experiment -12
Estimating the Efficiency of the Centrifugal Compressor
Aim: To conduct test on rotary (centrifugal) air compressor and to determine volumetric
efficiency at various delivery pressures.
Description: Rotary air compressor is a rotary type driven by primary mover AC motor through belt. The test rig consists of a base on which the tank (air reservoir) is mounted. The outlet pressure of the air is indicated by the pressure gauge. The suction is connected to the air tank with a calibrated orifice plate through water manometer. Specification:
1. Displacement : 300 ltr/ min at 1440 RPM.
2. Standard speed : 1440 RPM.
3. Working temperature : 850C
4. Power : 1 HP
Centrifugal compressors, sometimes referred to as radial compressors, are a sub-class of
dynamic axi-symmetric work-absorbing turbo-machinery
The idealized compressive dynamic turbo-machine achieves a pressure rise by adding
kinetic energy/velocity to a continuous flow of fluid through the rotor or impeller. This kinetic
energy is then converted to an increase in potential energy/static pressure by slowing the flow
through a diffuser.
Imagine a simple case where flow passes through a straight pipe to enter centrifugal
compressor. The simple flow is straight, uniform and has no swirl. As the flow continues to pass
into and through the centrifugal impeller, the impeller forces the flow to spin faster and faster.
According to Euler's fluid dynamics equation, known as pump and turbine equation," the energy
input to the fluid is proportional to the flow's local spinning velocity multiplied times the local
impeller tangential velocity. In many cases the flow leaving centrifugal impeller is near or above
1000 ft./s or approximately 300 m/s. It is at this point, in the simple case according to Bernoulli's
DEPT OF ANE ADP LAB MANUAL
58 | P a g e
principle, where the flow passes into the stationary diffuser for the purpose of converting this
velocity energy into pressure energy.
Procedure:
1. Provide the necessary electrical connections to the panel.
2. Check for the direction of the motor.
3. Close the ball valves of pressure tappings.
4. Switch on the starter.
5. Allow the system to attain the steady state.
6. Now, open the valves of the respective pressure tapings and note down the values from the manometer.
7. Repeat the experiment and calculate average values.
Note: The experiment is designed for one particular speed only. Calculations:
1. HNTP = hm = h X 𝜌𝑤
ρa
ρW= density of water = 100 kg/m3
ρa= density of air = 1.193 kg/m3
2. Density of air at R.T.P.=
3. Actual volume of air drawn at R.T.P conditions
VA= Cd X A X 2gh 𝜌𝑤
ρa m3/ sec
Where Cd, coefficient of discharge of orifice= 0.62.
Area of cross-section of orifice = π (d) 2/ 4 m2
D= Dia of the orifice = 10 mm

DEPT OF ANE ADP LAB MANUAL
59 | P a g e
h= (ha ) m
ρa= 1.193 kg/m3 (density of air)
ρw= 1000 kg/m3 (density of water)
ha= manometer reading in m.
4. Theoretical discharge Qt= 𝐴𝑙𝑛
60m3/ sec
5. A= area between the two vanes (38 X
10mm) l = length of the vane (80mm)
n= speed in RPM.
6. Volumetric efficiency = 𝐴𝑐𝑡𝑢𝑎𝑙 𝑑𝑖𝑠𝑐ℎ𝑎𝑟𝑔𝑒
𝑇ℎ𝑒𝑜𝑟𝑖𝑡𝑖𝑐𝑎𝑙 𝑑𝑖𝑠𝑐ℎ𝑎𝑟𝑔𝑒
PRECAUTIONS:
Do not run the motor if supply voltage is less than 380V
Do not forget to give electrical earth and neutral connections correctly.
Frequently, at least once in three months, grease all visual moving parts.
At least once in week, operate the unit for five minutes to prevent any clogging of
moving parts.
It is recommended to run the compressor at less than 1500rpm.
RESULT:
DEPT OF ANE ADP LAB MANUAL
60 | P a g e
Experiment-13
ESTIMATION OF PROPERTIES OF FUEL Aim: To estimate the properties of fuel Apparatus: Bomb Calorimeter A Bomb Calorimeter will measure the amount of heat generated when matter is burnt in a sealed chamber (Bomb) in an atmosphere of pure oxygen gas. The Advance Isothermal Bomb Calorimeter provides a simple inexpensive yet accurate method for determination of heat of combustion, calorific value and the Sulphur content of solid and liquid fuels. The outfit supplied is complete for analysis as per methods recommended by the Indian Standards Institution (IS: 1359-1959), British Standards Institution (BS 1016: Part 5 :1967) and the Institute of Petroleum (IP 12/63 T).Each part of the outfit has been finished and tested according to the specifications laid down by these Institutions. Temperature inside this jacket. OFFSET STIRRER:
It consists of a stirrer with fan driven at a constant speed of 800 R.P.M. by a motor through a heat insulator rubber belt. The motor unit is kept at sufficient distance from the vessel to eliminate radiative heating and a heat insulator Bakelite divides the two parts of the stirrer rod. This arrangement does not raise the temperature of water by even .01°C in ten minutes, thus easily meeting the specific requirements laid down by the British Standards Institution and the Institute of Petroleum and accepted by the Indian Standards Institution. The electric supply for the stirrer motor is obtained through the terminals provided on firing unit. CALORIMETER VESSEL: is made of copper and is brightly polished outside. BOMB FIRING UNIT, VIBRATOR, TIMER AND ILLUMINATOR WITH MAGNIFIER:
The Firing Unit is operated by A. C. Mains (230 Volts, 50 Hz); and is provided with terminals for the Stirrer Unit. Vibrator-Timer-Illuminator Unit and for the Bomb Fuse Wire. The Firing Unit is provided with terminals for the Stirrer unit, the Vibrator-Timer-Illuminator Unit and for the Bomb Fuse Wire. PRESSURE GAUGE ON STAND
An accurate pressure gauge is supplied for measurement of pressure of oxygen in the Bomb. The dial is graduated from 0 to 70 kg/cm2 (0 to about 1000 lb./in2). Normally the oxygen is filled in the Bomb at a pressure of 25 kg/cm2.
DEPT OF ANE ADP LAB MANUAL
61 | P a g e
PELLET PRESS:
The pellet press has approximately 12 mm diameter punch and die. Coal or other powdered samples are compressed into pellets before weighing and burning. This retards the burning rate and tends to retain the particles in the capsule, thereby reducing chances for incomplete combustion. The pellets are easier to handle than loose samples. The pellets should not be made very hard as excessive hardness leads to bursting, upon ignition with consequent with incomplete combustion. CRUCIBLE:
Stainless Steel crucibles are offered as standard with instrument. Nickel crucibles are being offered as accessories. IGNITION WIRE:
Nichrome wire is supplied with the instrument; but as an alternative, quartz and platinum wire is also being offered. PRINCIPLE OF OPERATION:
A known amount of the sample is burnt in a sealed chamber (Hereafter we shall refer to this chamber as Bomb'). The air is replaced by pure oxygen. The sample is ignited electrically. As the sample burns, heat is produced. The rise in temperature is determined. Since, barring loss of heat, the amount of heat produced by burning the sample must be equal to the amount of heat absorbed by the calorimeter assembly, acknowledge of the water equivalent of the calorimeter assembly and of the rise in temperature enables one to calculate the heat of combustion of the sample. If W = Water equivalent of the calorimeter assembly in calories per degree centigrade;
T = Rise in temperature (registered by a sensitive thermometer) in degrees centigrade, H = Heat of combustion of material in calories per gram: and M = Mass of sample burnt in grams. Then WT = HM
H is calculated easily since W, T and M are known. CHARACTERISTIC REQUIREMENTS: BOMB; When the sample burns, the pressure of gases increases rapidly, The Bomb walls, lid and joints should be strong enough to withstand the maximum working pressures, and there should be no leaks. Normal working pressures are about 30 atmospheres and overload pressures peak upto 100 atmospheres. The capacity of Bomb should be large enough to store enough oxygen to ensure complete burning of the sample. During burning the nitrogen and Sulphur contents are oxidized to gases and then to nitric acid and sulphuric acid. The Bomb lining must therefore be resistant to acidic or basic ash and should be
DEPT OF ANE ADP LAB MANUAL
62 | P a g e
corrosion proof. The stirrer unit should not generate excessive amount of heat due to stirring. Further, motor heat should not reach the colorimeter; otherwise the calculations will lead to erroneous results. All surfaces should have high reflectance to minimize losses. Water equivalent of the calorimeter assembly should be small to ensure maximum rise in temperature of water following ignition. REAGENTS, SAMPLES AND SAMPLE HOLDERS, STANDARD SAMPLES: BENZOIC ACID is most commonly used as a calorific standard. It burns easily and completely and can be compressed into pellets. NAPHTHALENE: is sometimes used as a combustion standard. It is not hygroscopic but due to its volatility it is necessary to use care to avoid errors from sublimation. SUCROSE OR CANE SUGAR: is also used as a standard sample and as a combustion aid. This material is neither volatile nor strongly hygroscopic but it is rather difficult to ignite and sometimes does not burn completely. The crystalline material should be ground to a powder before using. STANDARD ALKALI SOLUTION The washing from an oxygen Bomb test must be titrated against a standard alkali solution to determine the acid correction. A0.1 N Sodium carbonate solution is recommended. This is prepared by dissolving 5.2996 grams CO3 in water and diluting to one liter. Sodium hydroxide or potassium hydroxide solutions of the same normality are acceptable.If Sulphur is present in the sample other reagents as described in article 11 are required. METHYL ORANGE OR METHYL RED INDICATORS: These are the usual indicators used for acid-alkali titrations. ALLOWABLE SAMPLE SIZE: Care should be taken to avoid overcharging the Bomb. The mass of combustible charge (sample plus combustion aid) should not be more than 1,100 grams. When starting tests with new or unfamiliar materials, it is, always best to use samples of less than one gram. Not more than 10, 000 calories should liberated in any tests and it is advisable to work with mass liberating less than 7000 calories. SELECTION AND PREPARATION OF SOLID SAMPLES: It is necessary that solid samples be air-dry and ground until all particles will pass through a 60 mesh screen. The particle size is important because the combustion reaction proceeds to completion within a few seconds, and if any of the individual particles are too large they will not burn completely. A sample that is too finely divided may also be difficult to burn, because extremely small particles can be swept out of the combustion capsule by the turbulent gases, and if they fall to the bottom of the Bomb without being ignited the test will give erroneous results.

DEPT OF ANE ADP LAB MANUAL
63 | P a g e
“Toshniwal” pellet press offers a possible solution to the problem of incomplete combustion in the case of finally divided samples. ANTHRACITES AND COKE: While testing anthracites coals, coke or other material of slow burning characteristics, it may be difficult to secure ignition and complete combustion of the entire sample. In these cases, the sample is ground fine enough to pass through IS sieve 20 (211 microns).A small weighed amount of a standard combustible material such as powdered benzoic acid, should be mixed with such samples to facilitate combustion. FOOD STUFFS AND CELLULOSIC MATERIALS: The moisture content of most food stuffs will usually require that they be dried before making calorific tests. The operator will have to select a method for preparing the sample that will not destroy or remove any of the combustible constituents. It may be necessary to make several preliminary tests to determine the approximate maximum allowable moisture content at which the sample can be ignited in the Bomb without difficulty. GELATINE CAPSULES: Volatile liquid samples to be burnt in an oxygen Bomb can be weighed and handled in gelatin capsules. The capsules consist of two cups which telescope together with a friction fit adequate to retain most liquids, correction must be made for the heat of combustion of the gelatin when used in calorimetry. HEAVY OILS: Oils and other liquids which are not volatile at room temperature can be weighed directly into crucibles. The loop of the fuse should be positioned just above the surface of the sample. Nonvolatile liquids also can be weighed and handled in gelatin capsules. EXPLOSIVES AND HIGH ENERGY FUELS:
Special precautions must be observed when testing materials which release large volumes of gas upon ignition, or which detonate with explosive force. It is possible to test many slow burning gun powders and rocket propellants in conventional bombs, but the user must understand that these bombs are not designed to withstand the shock pressure produced by certain primers and other mixtures which detonate with explosive force. It is much safer to test these in a special high pressure oxygen bomb.
Each new explosive sample or high energy fuel introduces special problems which can be solved only by careful experimentation. Usually it will be welt to observe the burning of a small amount of sample over an open frame to determine the explosive behavior and then to proceed to bomb combustions using only one tenth or one fifth of the usual amount of sample. Further increases up to the 10,000 calorie maximum permissible should be made gradually, and only after all evidence indicates the absence of violent behavior. Setting Up and Assembly:

DEPT OF ANE ADP LAB MANUAL
64 | P a g e
General Arrangement: The laboratory in which the calorimeter is to operate should be equipped with many of the facilities commonly used for chemical analysis. These include desk space, running water, an analytical balance, apparatus for making volumetric titrations, and miscellaneous items of laboratory ware. The calorimeter should be used in a room where fluctuations in temperature can be avoided. In particular, the instrument should not be taken from one chamber to another chamber maintained at a different temperature immediately before use. Sufficient time must be allowed for equalization of temperature throughout the jacket before starting to use the calorimeter. All parts of the calorimeter should be kept clean and dry, and the inside of the jacket should be wiped clean to remove any moisture which may have condensed on the walls. Before starting to use a new calorimeter it is advisable to assemble all parts of the apparatus without a charge in the bomb and without water in the bucket, to be sure that everything is in perfect working order. ASSEMBLY OF CALORIMETER PARTS: Place the star supporter at the bottom of the jacket and set it so that the two pins provided inside the jacket do not allow it to be displaced. Place the bucket on the star supporter fitting the bucket pin into the supporter groove. Lift the bomb on its stand by hook and place it inside the bucket. Attach the supply connections to the electrodes provided on the lid of the Bomb. Place the combined lid of bucket and outer jacket in such a way that a pin provided on the cover plate of jacket fits into the smaller groove provided in the lid. Screw the support rod into the Supporting plate on the cover. Attach the vibrator timer magnifier unit clamp and the thermometer bracket and screws to the rod. The thermometer support bracket and the vibrator clamp must be raised to its top position before opening the calorimeter and it should be allowed to remain 'UP' at all times while the cover is off. Unpack the Beckman thermometer with great care, check for mercury separations and reunite the mercury, if necessary. Hold the Beckman thermometer into the clamp by passing it through the hold in the magnifier unit. The bulb of Backman thermometer should extend about halfway to the bottom of the water jacket. This requires that approximately 15 centimeters of the thermometer be below the top of the cover. Mount the stirrer assembly on the stirrer rod provided on the cover plate of the calorimeter jacket passing the stirrer pipe through the opening provided in the combined lid of bucket and the outer jacket. The connecting leads attached with terminals provided on the bomb lid are now connected to the two terminals provided on cover of the calorimeter jacket. The connections are then further taken to the firing unit box terminals marked 'BOMB'. Similarly the vibrator and the stirrer connections are made to respective terminals on the firing unit box. The firing unit box is connected to the A.C. Mains (230 Volt to 50 Hz). ATTACHING THE FUSE : All manipulations prior to closing the Bomb can be performed by holding the Bomb lid in the support stand- Cut a single length of fuse wire 10 cms long and attach it to the electrodes. It is not necessary to submerge the wire in a powder sample. In fact, better combustion will usually be obtained if the loop of the fuse is set slightly above the surface. When using pelleted samples, bend the wire so that the loop bears against the edge of the pellet firmly enough to hold it against the side of the capsule. In case of liquid fuels, the capsule should be held as a loop of this wire. It is also a good

DEPT OF ANE ADP LAB MANUAL
65 | P a g e
practice to tilt the capsule slightly to one side so that the flame emerging from it will not impinge directly on the top of the straight electrode. PLATINUM FUSE ARRANGEMENT: Platinum fuse wire can be attached to the electrodes in the manner described above but most platinum wire ignition procedures require cotton or nylon thread to carry on ignition flame to the sample. A coil is formed by winding out five turns of wire around a 2 mm diameter rod and removing the rod. The resulting coil is then connected between the electrodes and arranged to one side of the cup, with the axis of the coils pointing toward the sample. A short length of thread is than inserted through the coil and into the crucible. WATER IN THE BOMB: Place 2.0 mt. of distilled water in the Bomb from a pipette. FILLING THE BOMB WITH OXYGEN : While closing the Bomb always make certain that the head gasket or sealing ring is in good condition and care must be taken not to disturb the sample. Commercial oxygen produced by rectification of liquid air can be used directly from the supply cylinder. To attach the filling connection place the Bomb on its stand. Put the high pressure valve in oxygen cylinder's outlet and connect copper tube to valve outlet. Draw up the union nut tightly. Connect copper tube to pressure gauge, pressure gauge to filling tube and filling tube to Bomb valve and make the connections perfectly tight. Open the filling connection control valve of cylinder slowly. Observe the gauge and allow the pressure to rise until the desired point is reached (about 25 atmospheres), then close the collection of gases control valve. To decrease pressure of Bomb the gas release valve can be used. By rotating the gas release valve in clockwise direction the pressure can be reduced to the desired extent. FILLING WATER IN THE BUCKET: On an accurate balance determine the weight of the completely dry bucket, then add 2000 (± 0.5) grams of distilled water. Prior to weighing, the water should be brought to a temperature above 2°C below that of the calorimeter jacket. This initial adjustment generally will ensure a final temperature slightly above that of the jacket. The calorimeter water should be cooled or heated in an auxiliary container and not in the calorimeter bucket. The operator must also make sure that there is no moisture on the outside surface of the bucket when it is placed in the jacket. OPERATING THE ISOTHERMAL BOMB CALORIMETER:
Accurately weigh in the crucible of the calorimeter about one gram of the air-dried material ground to pass through IS Sieve 20 (211 microns).
If considered desirable, the sample may be compressed into a cylindrical pellet before weighing. Stretch a piece of the firing wire across the electrodes within the Bomb. Tie about 10 cm length of sewing cotton around the wire; place the crucible in position and arrange the loose ends of the thread so that they are in contact with the material; use the same amount of thread in each determination. Introduce into the body of the bomb to milliliters of distilled water. Reassemble the Bomb, screw home with the fingers, finally tightening it as necessary, avoiding excessive pressure. Charge the bomb slowly with oxygen from a cylinder to a pressure of 25

DEPT OF ANE ADP LAB MANUAL
66 | P a g e
atmospheres without displacing its original air content. Close the valve effectively, using as little pressure as possible and disconnect the bomb from the oxygen supply.
Weigh into the calorimeter vessel a quantity of the water sufficient to submerge the nut of the bomb to a depth of at least two millimeter leaving the terminals projecting. Using the same weight of water in all tests, transfer the calorimeter vessel water jacket, lower the bomb carefully into the calorimeter vessel, and having ascertained to be gas-tight, connect it to the ignition circuit through a switch for subsequent firing of the charge. Adjust the stirrer; place the thermometer and covers in position and start the stirring mechanism, which must be kept in continuous operation at a constant speed during the experiment. After an interval of not less than ten minutes, read the temperature to 0.001'C and continue the readings for five minutes, at equal intervals of not more than one minutes, tapping the thermometer lightly during 10 seconds prior to each reading. If, over a period of five minutes, the average deviation of the individual values of the rate of change of temperature is less than 0.00072°C per minute, close the circuit momentarily to fire the charge and continue the observations of the temperature at intervals of similar duration to those of the preliminary period.
If the rate of change of temperature is not constant within this limit, extend the preliminary period until it is constant. In the chief period which extends from the instant of firing until the time after which the rate of change of temperature again becomes constant, take the earlier readings to the nearest 0.01°C since it will not be possible to take the earlier readings to 0.001°C. Resume the readings to this precision as soon as possible.
Determine the rate of change of temperature in the after period (which follows the chief period by taking readings at 1 minute intervals for at least five preferably ten minutes).
Note: It is desirable to keep the jacket temperature and the room temperature as close to the calorimeter temperature as possible. The jacket and room temperature should therefore be recorded. Remove the bomb from the calorimeter and after a lapse of about half an hour from the time of firing allowing the acid mist to settle, release the pressure by opening the valve. Verify that the combustion has been completed by noting the absence of any sooty deposit within the bomb. The presence of any trace of sooty deposit indicates incomplete combustion and invalidates the test.
Wash out the contents of the bomb with hot distilled water into a hard glass beaker washing the bomb cap and the crucible. Add a measured excess, say 25 ml. of 0.1 N sodium carbonate solution and boil down to 16 ml. to convert any metallic sulphates or nitrates to the less soluble carbonate or hydroxide; the consumption of alkali carbonate is equivalent to the sulphates or nitrates together with the free sulphuric and nitric acids. Filter, wash and make up to 100 ml. To determine the Sulphur content take 50 ml. portion of this solution and follow the method as given in Section 11. Determine the total acidity by titrating a 50 ml. portion with 0.1 N hydrochloric acid using methyl orange as indicator, the titer representing the excess alkali in one half of the quantity of sodium carbonate solution added to the washings. Standardizing the Calorimeter: Definition:The water equivalent is the weight of water which is equivalent in effective heat capacity to the entire system (Calorimeter vessel containing a specified weight of water; calorimeter bomb charged with oxygen; fuel and water; thermometer and stirrer). Since the specific heat of water
DEPT OF ANE ADP LAB MANUAL
67 | P a g e
is 1.00010.002 Cal /VC in the range 10° to 40`C, the water equivalent is approximately equal to the effective heat capacity (cal/°C), the factor that is determined experimentally. Since the true water equivalent is not required and is never evaluated, it is the effective heat capacity which should be considered. The effective heat capacity is the heat required to effect unit temperature rise in the system under the conditions of a calorimetric determination. The effect heat capacity has a temperature dependence since the specific heats of the constituent parts of the system vary with temperature. 25°C has been chosen as the reference temperature because of its use in thermochemical calculations and because the specific heat of water in the range 25° to 40`C is constant within ± 0.002cal/g° C. Calculations: The effective heat capacity of the system is determined by burning pure and dry benzoic acid weighing not less than 0.9 and more than 1.1 gram. Determine the corrected temperature rise T, from the observed test data, also titrate the bomb washings to determine the nitric acid correction, and measure the unburnt fuse wire, compute the energy equivalent by substitution in the following equation :-
W=(HM+E1+E2)/T Where W energy equivalent of calorimeter in calories per degree centigrade; Heat of combustion of standard benzoic acid in calories per gram; M mass of standard benzoic acid sample in grams; T — corrected temperature rise in degrees centigrade; E1 correction for heat of formation of nitric acid in calories; and Ez correction for heat of combustion of firing wire, in calories DISCUSSION
In determination of calorific value, principle observation is that of temperature-rise which when corrected and multiplied by the effective heat capacity at the mean temperature of the chief period gives the heat release. The thermometer readings at the beginning and end of the chief period are corrected, using the certificate, obtainable from NPL, New Delhi upon request to allow for the inaccuracy of the thermometer.
Further allowance is necessary for three sources of variable heat change (the cooling loss, the Sulphur correction and the nitrogen correction) and under certain circumstances for a source of constant heat gain (the heat of firing due to cotton and wire). The variable sources of heat change must be allowed for in each test, but the source of constant heat gain can be treated as one correction and under specified conditions neglected. It is convenient to calculate the cooling loss as a temperature rise. The correction is multiplied by the appropriate effective heat capacity to get the total heat release. To the heat release so calculated, the corrections for Sulphur, nitrogen and, if necessary, for the source of constant heat gain, are applied to give the true heat release. Precautions:

DEPT OF ANE ADP LAB MANUAL
68 | P a g e
The Operator must follow the following basic point in order to operate this oxygen bomb safely. Do not use too much sample. The bomb cannot be expected to withstand the effects of combustible charges which liberate more than 10,000 calories. This generally limits the total weight of combustible material (sample plus gelatin, firing oil or any combustion aid) to not more than 1.10 gram. Do not charge with more oxygen then is necessary and do not fire the bomb if an overcharge of oxygen should accidentally be admitted. Keep all parts of the bomb especially the insulated electrode assembly - in good repair at all times. Do not fire the bomb if gas bubbles are leaking from the bomb when it is submerged in water. Stand back from the calorimeter for at least 15 seconds after firing and above all, keep clear of the top of the calorimeter. If the bomb should explode, it is most likely that the force of explosion will be directed upward. Proceed with caution and use only a fraction of the allowable maximum sample when testing new materials which burn rapidly, or have explosive characteristics.
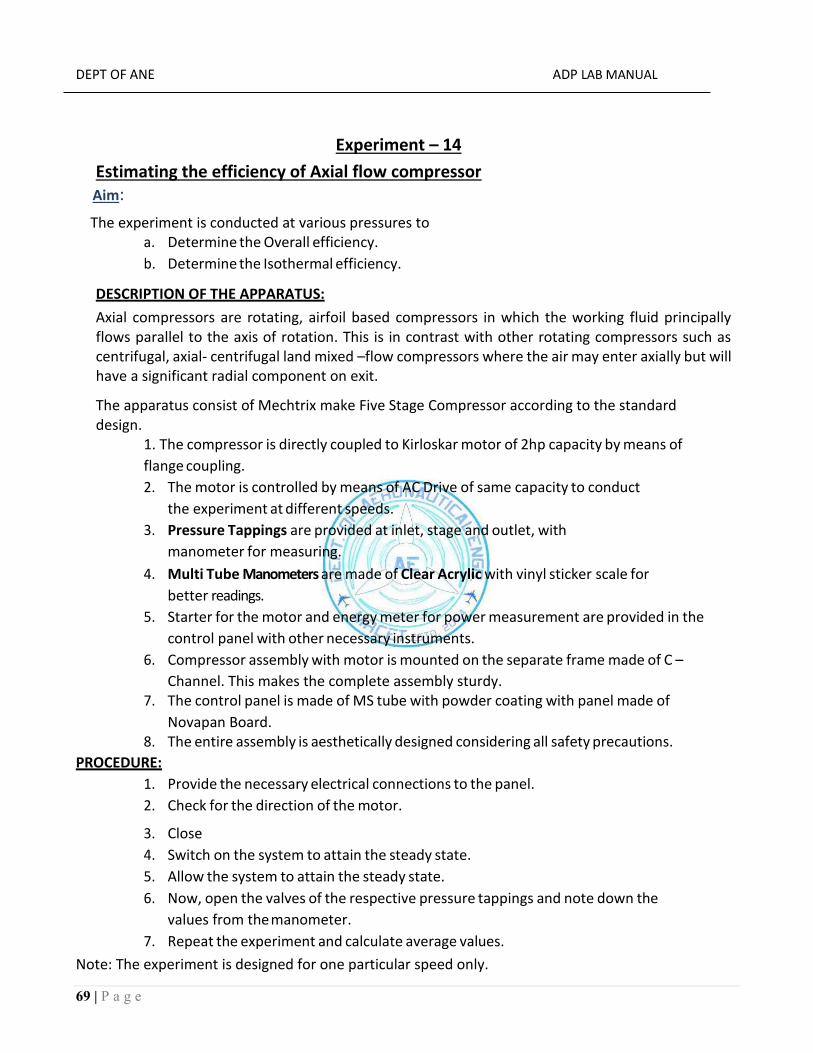
DEPT OF ANE ADP LAB MANUAL
69 | P a g e
Experiment – 14
Estimating the efficiency of Axial flow compressor Aim:
The experiment is conducted at various pressures to a. Determine the Overall efficiency.
b. Determine the Isothermal efficiency.
DESCRIPTION OF THE APPARATUS:
Axial compressors are rotating, airfoil based compressors in which the working fluid principally flows parallel to the axis of rotation. This is in contrast with other rotating compressors such as centrifugal, axial- centrifugal land mixed –flow compressors where the air may enter axially but will have a significant radial component on exit.
The apparatus consist of Mechtrix make Five Stage Compressor according to the standard design.
1. The compressor is directly coupled to Kirloskar motor of 2hp capacity by means of
flange coupling.
2. The motor is controlled by means of AC Drive of same capacity to conduct
the experiment at different speeds.
3. Pressure Tappings are provided at inlet, stage and outlet, with
manometer for measuring.
4. Multi Tube Manometers are made of Clear Acrylic with vinyl sticker scale for
better readings.
5. Starter for the motor and energy meter for power measurement are provided in the
control panel with other necessary instruments.
6. Compressor assembly with motor is mounted on the separate frame made of C –
Channel. This makes the complete assembly sturdy. 7. The control panel is made of MS tube with powder coating with panel made of
Novapan Board. 8. The entire assembly is aesthetically designed considering all safety precautions.
PROCEDURE:
1. Provide the necessary electrical connections to the panel.
2. Check for the direction of the motor.
3. Close
4. Switch on the system to attain the steady state.
5. Allow the system to attain the steady state.
6. Now, open the valves of the respective pressure tappings and note down the
values from the manometer.
7. Repeat the experiment and calculate average values.
Note: The experiment is designed for one particular speed only.

DEPT OF ANE ADP LAB MANUAL
70 | P a g e
TABULAR COLUMNS AND OBSERVATIONS:
SLNO FLOW MEASURMENT, mm OF WATER COLUMN
inlet
1 stage
2
stage
3 stage
4
stage
5 stage
outlet
hi h1 h2 h3 h4 h5 h0
1
2
3
DEPT OF ANE ADP LAB MANUAL
71 | P a g e
Input power, ip = 𝑁∗3600
𝐾∗𝑇
Where
N=no of blinks of energy meter=105 K=energy meter constant=1600revs/kw-hr T=time for n rev.of
energy meter in seconds
4. Isothermal efficiency, ηiso %:
ηiso = Wiso
ip

DEPT OF ANE ADP LAB MANUAL
72 | P a g e
RESULT: