iii - Food and Agriculture Organization · iv FAO. Guidelines for the routine collection of capture...
122
Transcript of iii - Food and Agriculture Organization · iv FAO. Guidelines for the routine collection of capture...


iii
PREPARATION OF THIS DOCUMENT
The FAO/DANIDA Project "Training in Fish Stock Assessment and Fishery Research Planning" has organized training courses on fish stock assessment and workshops dealing with the assessments of specific resources in many countries. The general experience has been that in many cases proper assessments were difficult to achieve due to restrictions in the available data, both in quality and quantity.
In August 1997 at its first session, the APFIC Joint Working Party on Fishery Statistics and Economics recommended that APFIC and FAO should prepare "draft guidelines on methodologies and standards for the collection of production and structural statistics for capture fisheries".
On this basis it was decided to form an informal inter-departmental working group to organize an Expert Consultation on Routine Data Collection and a Regional Workshop to allow experts from Asia to review the draft guidelines on the collection of data from marine and inland fisheries. Chapters of the guidelines were written prior to the Expert Consultation, but during the meeting most of these manuscripts were re-arranged and simplified.
This document was designed and written from 18 to 30 May 1998 in Bangkok, Thailand by a group of experts with a variety of skills in anthropology, biology, economics, data processing and statistics:
Patricia Clay, Ian Cowx, David Evans, Felimon Gayanilo Jr., Richard Grainger, Angel Gumy, Veravat Hongskul, Tony Jarrett, Paul Medley, Peter Miyake, Sean Pascoe, Christian Riise, Per Sparre, Constantine Stamatopoulos, Siebren Venema, Morten Vinther, Teo Siong Wan, Paul van Zwieten.
The guidelines were reviewed by participants at the Regional Workshop, in Bangkok, from 25 to 29 May 1998.
Further refinement of the document through editing or additional material was provided by the following people:
Patricia Clay, Adele Crispoldi, Peter Flewwelling, Serge Garcia, Luca Garibaldi, Richard Grainger, Paul Medley, Sean Pascoe, Siebren Venema and Rolf Willmann.
Both meetings and several consultants were funded by the FAO/DANIDA Project, while ICCAT, ICLARM, the Mekong River Commission and NOAA/NMFS provided staff free of charge.
Cover picture: Sampling in Viet Nam by Per Sparre

iv
FAO. Guidelines for the routine collection of capture fishery data. Prepared at the FAO/DANIDA Expert Consultation. Bangkok, Thailand, 18-30 May 1998. FAO Fisheries Technical Paper. No. 382. Rome, FAO. 1999. 113p.
ABSTRACT
These guidelines aim to help those who design routine data collection programmes, focusing on the relationship between typical questions asked by policy-makers and managers, and the data required for providing reliable answers. Fisheries policy and management objectives, particularly under the precautionary approach, need to be based upon analyses of reliable data. Data are needed to make rational decisions, evaluate the fisheries performance in relation to management activities and fulfil regional requirements. These objectives are achieved using fishery performance indicators. Indicators are used to measure the state of the resource, the performance of fishing controls, economic efficiency, socio-economic performance and social continuity. The primary factor in choosing what data to collect is the link between the necessary operational, biological, economic and socio-cultural indicators and their associated variables. The way in which different data variables are collected needs to be tailored to the structure of the fishery. The strategy will be strongly influenced by the budget and personnel available, and the degree to which fishers and others co-operate. The programme must identify which variables should be collected through complete enumeration and which can be sampled. Collection methods are influenced by the variable itself, the strategy, collection point and the skill of the enumerator. Once collected, fishery data must be stored securely, but made easily available for analysis, which is achieved through a computer-based data management system, following the basic data processing principles. The implementation of a data collection programme should follow a normal project cycle, developing a new legal and institutional framework as appropriate.
Distribution:
All FAO Members and Associate Members DANIDA Participants (Expert Consultation and Regional Workshop) All FAO Offices FAO Fisheries Projects FAO Fisheries Department Other interested Nations, International Organizations and NGOs

v
USING THE GUIDELINES The evaluation of fisheries management performance requires the establishment and monitoring of a variety of indicators related to specific questions (and objectives) such as: • Are the fisheries at, above or below sustainable yields? • Are the fisheries moving towards domestic development at the rate required for employment and
economic development? • Are the returns obtained from foreign access licence fees at a level commensurate with the
resource rent? • Will fish production meet food security requirements in the medium term? in the long term? • Are fishing incomes falling behind comparable sectors? for what reason? • Are there conflicts between fishery sub-sectors? Fishery performance indicators require continuous information for their determination as the fishery, its parameters, as well as management objectives vary over time. This information is derived from data that need to be collected and analysed.
This document offers guidelines to fishery managers and practitioners, at all levels, on the development or improvement of routine data collection programmes in capture fisheries. These guidelines meet a number of management needs.
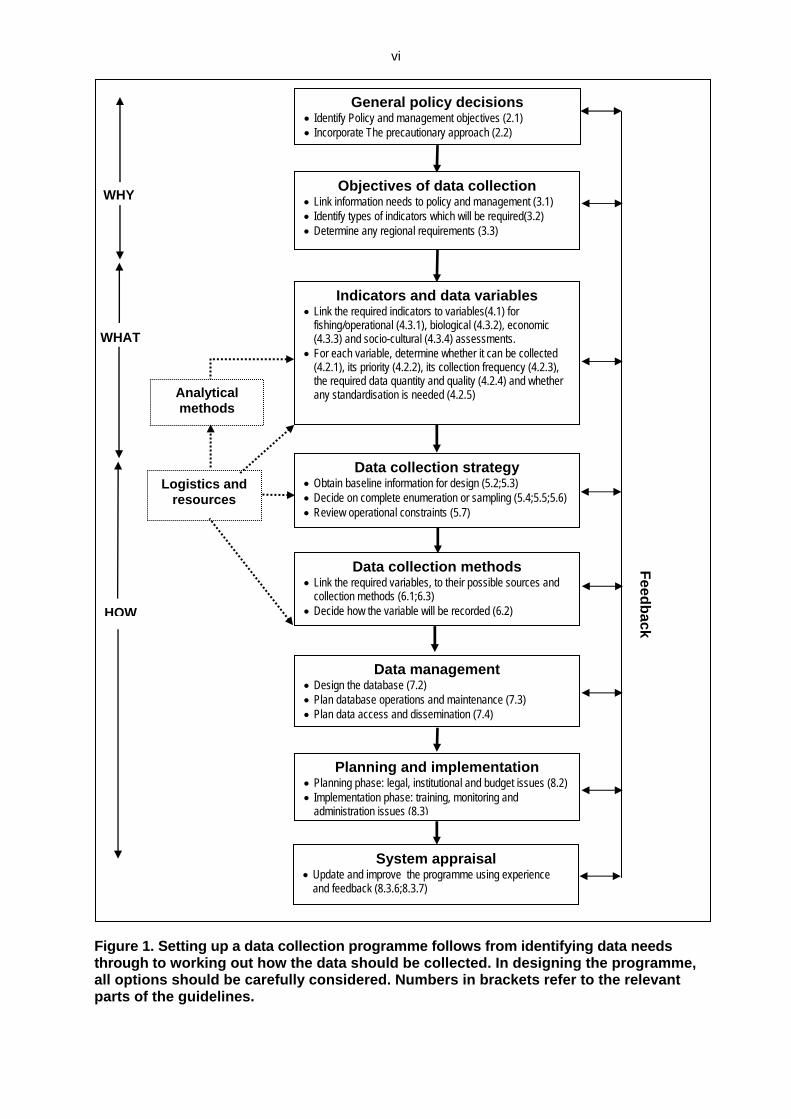
Firstly, they provide a structured approach through a sequential pathway (see Figure 1), from the understanding of why data are needed, through what data need to be collected, to how data should be collected.
Secondly, this document is a guide to the processes that need to be addressed at all management levels to provide appropriate data collection procedures. Tasks can be allocated to senior, middle and technical management levels. Within this hierarchy, there will be large areas of overlap, and it will always be desirable for all levels of management to communicate to others their requirements and constraints. As far as possible, all persons involved in a data collection programme should understand all issues associated with establishing or maintaining a data collection programme. However, different levels of management will have different responsibilities.
Senior managers need to understand WHY the data is collected. They will need to consider: • the link between fisheries policy and the practical applications of fisheries management (Chapter 2); • the uses of information in meeting management objectives (Chapter 3); • the fishery performance indicators that best meet their information needs (Chapter 4); • the proper allocation and management of financial, human and institutional resources (Chapter 8). Middle managers need to understand WHAT information is needed: • to calculate the chosen fishery performance indicators (Chapter 4); • to decide on the data variables required for the appropriate analyses (Chapter 4); • to enable administration of the systems needed for data collection, analysis and dissemination
(Chapters 7 and 8). Technical managers need to understand HOW data are collected and managed. They will be required: • to decide on the strategy and methods for collecting the data (Chapters 5); • to implement systems for the management and dissemination of the data collected (Chapters 7); • to undertake or manage the actual data collection process. The guidelines are structured so that managers at all levels can use them directly for developing a data collection programme. • Senior managers will be able to draw on these guidelines to offer and explain the appropriate
fishery performance indicators to policy-makers; and to instruct middle managers to estimate them; • Middle managers will be able to draw on these guidelines to inform senior managers of their data
needs and the required programmes for the preparation of fishery performance indicators; and to instruct technical managers on what to collect;
• Technical managers will be able to draw on these guidelines to inform middle managers on the resources (personnel and expenditure) they require to undertake their tasks; and to instruct data collectors on what to do.
The guidelines are not a manual of data collection methods, nor do they address analytical procedures that link data compilation and the preparation of fishery performance indicators, e.g. stock assessment.
vi
Figure 1. Setting up a data collection programme follows from identifying data needs through to working out how the data should be collected. In designing the programme, all options should be carefully considered. Numbers in brackets refer to the relevant parts of the guidelines.
General policy decisions • Identify Policy and management objectives (2.1) • Incorporate The precautionary approach (2.2)
Objectives of data collection • Link information needs to policy and management (3.1) • Identify types of indicators which will be required(3.2) • Determine any regional requirements (3.3)
Indicators and data variables • Link the required indicators to variables(4.1) for
fishing/operational (4.3.1), biological (4.3.2), economic (4.3.3) and socio-cultural (4.3.4) assessments.
• For each variable, determine whether it can be collected (4.2.1), its priority (4.2.2), its collection frequency (4.2.3), the required data quantity and quality (4.2.4) and whether any standardisation is needed (4.2.5)
Data collection methods • Link the required variables, to their possible sources and
collection methods (6.1;6.3) • Decide how the variable will be recorded (6.2)
Analytical methods
Logistics and resources
System appraisal • Update and improve the programme using experience
and feedback (8.3.6;8.3.7)
Data collection strategy • Obtain baseline information for design (5.2;5.3) • Decide on complete enumeration or sampling (5.4;5.5;5.6) • Review operational constraints (5.7)
Data management • Design the database (7.2) • Plan database operations and maintenance (7.3) • Plan data access and dissemination (7.4)
WHY
WHAT
HOW
Planning and implementation • Planning phase: legal, institutional and budget issues (8.2) • Implementation phase: training, monitoring and
administration issues (8.3)
Feedback
vii
TABLE OF CONTENTS
1. INTRODUCTION ..............................................................................................................1 1.1 THE OBJECTIVES OF THE GUIDELINES.............................................................................1 1.2 SCOPE..........................................................................................................................1 1.3 RATIONALE ...................................................................................................................2
2. THE USES OF INFORMATION .......................................................................................3 2.1 POLICY AND MANAGEMENT OBJECTIVES .........................................................................3
2.1.1 Fisheries contribution to food supply ....................................................................3 2.1.2 Fisheries contribution to the economy ..................................................................3 2.1.3 Fisheries impact on the ecosystem ......................................................................3
2.2 THE PRECAUTIONARY APPROACH ..................................................................................4
3. OBJECTIVES OF DATA COLLECTION..........................................................................6 3.1 DATA NEEDS FOR MANAGEMENT ISSUES ........................................................................6 3.2 MANAGEMENT-RELATED INDICATORS.............................................................................7
3.2.1 Status of resources...............................................................................................7 3.2.2 Yield......................................................................................................................8 3.2.3 Fishing controls.....................................................................................................8 3.2.4 Economic efficiency ..............................................................................................8 3.2.5 Social performance...............................................................................................9
3.3 REGIONAL NEEDS..........................................................................................................9
4. INDICATORS, DATA TYPES AND VARIABLES ..........................................................11 4.1 INDICATORS AND VARIABLES........................................................................................11 4.2 SPECIFICATIONS FOR SELECTION OF VARIABLES AND DATA ...........................................12
4.2.1 Evaluation of the operating characteristics of a fishery ......................................12 4.2.2 Data type priority.................................................................................................12 4.2.3 Frequency of data collection...............................................................................13 4.2.4 Data quantity and quality ....................................................................................14 4.2.5 Standardisation...................................................................................................14
4.3 INDICATORS AND ASSOCIATED DATA TYPES AND VARIABLES ..........................................16 4.3.1 Fishing and operational indicators ......................................................................16 4.3.2 Biological indicators ............................................................................................23 4.3.3 Economic indicators............................................................................................28 4.3.4 Socio-cultural indicators......................................................................................36
5. DATA COLLECTION STRATEGY.................................................................................42 5.1 INTRODUCTION............................................................................................................42 5.2 INFORMATION REQUIREMENTS FOR SYSTEM DESIGN .....................................................42 5.3 CO-MANAGEMENT AND SYSTEM DESIGN .......................................................................43 5.4 COMPLETE ENUMERATION AND SAMPLING ....................................................................44
5.4.1 Definitions ...........................................................................................................44 5.4.2 Deciding between complete enumeration and sampling ....................................44
5.5 COMPLETE ENUMERATION APPROACHES......................................................................45 5.6 SAMPLE-BASED APPROACHES .....................................................................................45
5.6.1 Stratification in data collection ............................................................................46 5.6.2 The effect of stratification....................................................................................46
5.7 OPERATIONAL CONSIDERATIONS..................................................................................49
6. DATA COLLECTION METHODS ..................................................................................51 6.1 VARIABLES, SOURCES AND METHODS...........................................................................51
6.1.1 Data sources.......................................................................................................52

viii
6.1.2 Linkage among variables, sources and methods ...............................................52 6.2 RECORDING A VARIABLE..............................................................................................55 6.3 DATA COLLECTION METHODS.......................................................................................55
6.3.1 Registration.........................................................................................................55 6.3.2 Questionnaires....................................................................................................56 6.3.3 Interviews............................................................................................................56 6.3.4 Direct observations .............................................................................................58 6.3.5 Reporting ............................................................................................................60
7. DATA MANAGEMENT...................................................................................................63 7.1 NEED FOR DATA MANAGEMENT ....................................................................................63 7.2 DATABASE DESIGN ......................................................................................................63
7.2.1 Methodology .......................................................................................................63 7.2.2 Human-computer interface .................................................................................65 7.2.3 Computerised documentation.............................................................................65 7.2.4 Data entry ...........................................................................................................65 7.2.5 Data processing..................................................................................................65 7.2.6 Data reporting .....................................................................................................66 7.2.7 Geographic Information Systems (GIS)..............................................................66
7.3 DATA MANAGEMENT OPERATIONS AND MAINTENANCE...................................................66 7.3.1 Commitment .......................................................................................................66 7.3.2 Archives ..............................................................................................................66 7.3.3 Design re-evaluation...........................................................................................66
7.4 DATA ACCESS AND DISSEMINATION..............................................................................67 7.4.1 Data ownership and control ................................................................................67 7.4.2 Communication networks ...................................................................................67 7.4.3 Computerised publication ...................................................................................67
8. PLANNING AND IMPLEMENTATION...........................................................................68 8.1 THE NEED FOR PLANNING.............................................................................................68 8.2 PLANNING PHASE (PRE-IMPLEMENTATION) ...................................................................69
8.2.1 Legal framework .................................................................................................69 8.2.2 Institutional framework........................................................................................69 8.2.3 Working practices ...............................................................................................69 8.2.4 Budgets...............................................................................................................70
8.3 IMPLEMENTATION PHASE .............................................................................................70 8.3.1 Incentives............................................................................................................70 8.3.2 Training...............................................................................................................71 8.3.3 Exchange of experiences with other countries ...................................................72 8.3.4 Technical committees .........................................................................................72 8.3.5 Data verification ..................................................................................................73 8.3.6 Feedback............................................................................................................73 8.3.7 System appraisal ................................................................................................74
9. REFERENCES AND FURTHER READING...................................................................75
ANNEX 1. DATA REQUIREMENTS SPECIFIED IN THE UNITED NATIONS FISH STOCKS AGREEMENT .......................................................................................................................80
ANNEX 2. FISHING EFFORT MEASURES BY GEAR CATEGORIES ...............................83
ANNEX 3. DATA SHEET DESIGN, USE AND PROCESSING............................................86
ANNEX 4. EXAMPLE OF USE OF KEY TERMS ...............................................................104
ANNEX 5 GLOSSARY........................................................................................................105

1
1. INTRODUCTION
These guidelines aim to help those who design routine data collection programmes. Previous guides are updated in the light of: • recent international initiatives to promote responsible fisheries; • increasing consideration of economic and socio-cultural issues in fisheries policy-making
and management; • technological developments which can enhance data collection and processing. The guidelines focus on the relationship between typical questions asked by policy-makers and managers and the data required for providing reliable answers.
1.1 THE OBJECTIVES OF THE GUIDELINES The objectives of these Guidelines are: • to facilitate Governments and fisheries management authorities to undertake routine
data collection and processing necessary for effective monitoring and management of capture fisheries and, in particular, for implementing the relevant articles of the FAO Code of Conduct for Responsible Fisheries1 (CCRF), the UN Fish Stocks Agreement2 (FSA) and the FAO Compliance Agreement3 (CA) (see UN/FAO, 1998);
• to provide a summary of links between typical policy and management questions and the data necessary to provide the answers;
• to provide a guide for organising an effective and sustainable data collection programme.
1.2 SCOPE Intention: The Guidelines are intended to help individuals and institutions go through a logical design cycle, not to provide a manual of data collection methods. The document focuses on the pathway from decisions on the policy and management plan for a fishery, through collection of data types required to support the plan, how these data should be collected and associated database needs, to the overall implementation process. Examples of performance indicators, data variables and collection methods are provided, but the document primarily highlights the linkages between these components. Hence, the guidelines provide a framework, which can be used to develop and assess data collection programmes.
Included: The document only deals with routine data collection for capture fisheries. The most important sources of data are long-term regular information gathering on fishing fleet statistics, fishing effort and associated catches, landings in weight and value, biological sampling of the catches, variable trip costs, and crew data. The guidelines also cover irregular data collection or data collection less frequent than trip-level, such as fishery censuses, cost and earnings studies, resource surveys and food surveys.
Excluded: Data collection for aquaculture is excluded. The other types of data not covered are those used to formulate new methods or models in self-contained programmes, which cannot be considered routine. These include experimental or research data such as growth and mortality data from tagging experiments, stock unit information, growth parameters and other scientific data. 1 FAO. Code of Conduct for Responsible Fisheries. Rome, FAO. 1995. 41p. 2 Agreement for the Implementation of the Provisions of the United Nations Convention on the Law of the Sea of 10 December 1982 Relating to the Conservation and Management of Straddling Fish Stocks and Highly Migratory Fish Stocks (see Annex 1). As of May 1998, this had not yet come into force. 3 Agreement to Promote Compliance with International Conservation and Management Measures by Fishing Vessels on the High Seas.

2
1.3 RATIONALE Much has been written on the collection of fishery data. However, since these texts were produced there have been several important developments. • Experiences of successes and failures with data collection schemes have led to a
renewed emphasis on sustainability of systems through cost-effective, rather than ambitious, data gathering methodologies.
• Computers with powerful data handling tools have become widely available, thus increasing the level of detail that can be collected, stored and processed cheaply.
• Communications have improved and become cheaper. Detailed monitoring of fishing activity [e.g. using a Vessel Monitoring System (VMS)] can be used to improve data quality. Cheaper and faster exchange of fishery data (e.g. national collation of locally collected data) can provide more up-to-date information.
• There is increasing emphasis on economic and socio-cultural data collection necessary to answer many management questions which biological data alone cannot address.
• In many artisanal fisheries, top-down national management structures have proved inadequate, and participatory management is increasingly seen as a way to improve data collection within limited budgets.
• The transboundary nature of many fish stocks requires regional research and management that can only be effectively addressed through the analysis of complementary data sets to ensure complete coverage (CCRF 7.3.1 & 7.3.2). Likewise, the need to address some fisheries through ecosystem research (e.g. Large Marine Ecosystems) requires data sets covering the entire system.
• There are increasing needs to meet international requirements in terms of variable definitions, classifications, statistical stratification and standards. These require careful consideration of data collection programmes.
The guidelines update advice given previously on data collection procedures. While data collection has the same theoretical basis, the practical methodologies and procedures have changed in the light of experience and technological developments. The present guidelines are intended to cover the full spectrum of data types addressed in previous publications as well as address the need for integrating other types of information (i.e. economic and socio-cultural).
It should be noted that there are other Technical Guidelines for Responsible Fisheries, including those issued on Fishing Operations (1), Precautionary Approach to Capture Fisheries and Species Introductions (2), Integration of Fisheries with Coastal Area Management (3), Fisheries Management (4) and Inland Fisheries (6) with relevant sections on capture fisheries data collection. Many of the issues raised there are discussed in this document in greater detail, as well as being placed in the context of the practical implementation of a collection system.
3
2. THE USES OF INFORMATION
Fisheries policy and management objectives need to be based upon analyses of reliable data. Policy and management issues can be broadly divided into food security, socio-economic and environmental concerns, each of which need certain types of information for decision-making. While the precautionary approach could be used when information is insufficient, management in general should be based on the “best scientific information available” and this has important implications in terms of type, quantity and quality of data to be collected.
2.1 POLICY AND MANAGEMENT OBJECTIVES “In order to ensure sustainable management of fisheries and to enable social and economic objectives to be achieved, sufficient knowledge of social, economic and institutional factors should be developed through data gathering, analysis and research.” (CCRF 7.4.5)
It is essential to have adequate data to formulate a useful policy for the whole fisheries sector and effective management plans for particular fisheries. Fishery policies and management plans should address the fishery sector as a contributor to the food supply and economy at local and national levels, and as a critical component of the ecosystem. Hence, data collection should cover all aspects of a fishery, from the natural resources, via exploitation to the local consumers, industry and trade.
The formulation of detailed policies and management plans for fisheries are outside the scope of this document. However, some examples of common areas of concern for policy setting and management are given.
2.1.1 Fisheries contribution to food supply Food security is an over-riding concern for natural living resources policy-makers, planners and administrators, especially in many developing countries. Fish may be the major source of animal protein for many communities. Small island developing states are often particularly dependent on fish as a food source. It is essential to be able to quantify the dependence on fish as a food source, so that policies and management ensure sustainable use and sufficient access for dependent communities.
2.1.2 Fisheries contribution to the economy For national and local policy-making and planning, it is essential to describe the contribution of fisheries to the economy. If managed effectively, fisheries are able to generate substantial economic benefits to the national and local economies. Assessments of the economic contribution of fisheries need to take into account the generation of income in the local community, of returns to the broader community and of foreign exchange from export earnings. Various countries also obtain revenue from charging fees to non-national fishing boats for access to the resource within their Exclusive Economic Zone (EEZ). This is a significant source of national income for many small island economies. In addition, assessments should include a measure of economic and social dependence. This requires estimates of the numbers of people employed in the harvest, processing and other sectors, and the total numbers dependent on fisheries for their livelihood (workers plus dependants).
2.1.3 Fisheries impact on the ecosystem Fisheries reduce wild fish populations, decreasing the population sizes below that of the unexploited stock. This may not only affect the exploited population but also the interrelated
4
species, which are predators, preys or species in competition with the target species for food resources. It is therefore important to monitor changes in the fish community as well as the exploited stock, to ensure the ecosystem is not damaged by the fishery. Catch, effort, discards and biological data are required to monitor the direct effects of exploitation, and fisheries-independent and environmental monitoring may also be necessary to track all ecological changes.
For inland fisheries, the creation and loss of habitat is often a determining factor in production. Seasonal and long term changes in the area of flooding need to be monitored alongside fishery activities to account for different factors influencing fish stocks. In some cases, special environmental monitoring may be necessary where an inland or marine fishery may cause significant changes to the underlying habitat. This is of special concern for conservation as habitat change is the primary cause of species extinction. Gears that have a physical impact on benthic habitats, such as bottom trawling and dredges, may require special monitoring.
2.2 THE PRECAUTIONARY APPROACH The Code of Conduct for Responsible Fisheries emphasises the obligation on States to conserve stocks and avoid over-exploitation.
“The right to fish carries with it the obligation to do so in a responsible manner so as to ensure effective conservation and management of living aquatic resources.” (CCRF 6.1)
To achieve this they are required to collect data so that decisions are based on the best scientific evidence available.
“Conservation and management decisions for fisheries should be based on the best scientific evidence available, also taking into account traditional knowledge of the resources and their habitat, as well as environmental, economic and social factors… States should assign priority to undertake research and data collection to improve knowledge of the fisheries…" (CCRF 6.4).
Fisheries management has so far generally failed to prevent overfishing and rehabilitate depleted resources. This has led to a reappraisal of the fisheries management process, including the basis for all management, the gathering and analysis of information.
One manifestation of this reappraisal is the requirement to adopt the precautionary approach to fisheries management. The precautionary approach requires fisheries managers to be cautious when the state of a resource is uncertain, such as when fishery data are insufficient or unreliable. The past practice in fisheries management has generally been that restrictive measures had to be justified by sound data, analysis and interpretation. Under the precautionary approach, the burden of evidence is reversed so that it is necessary to justify that it is safe for a fishery to proceed. In the absence of such evidence, the fishery is restricted to a minimum level. The precautionary approach is, therefore, a powerful incentive for the collection of reliable and relevant fisheries data.
The precautionary approach has been embodied in two important international initiatives: the UN Fish Stocks Agreement and the FAO Code of Conduct for Responsible Fisheries (Article 7.5).
"States should apply the precautionary approach widely .... The absence of adequate scientific information should not be used as a reason for postponing or failing to take conservation and management measures." (CCRF 7.51)
5
When data are insufficient, as in the case of new or exploratory fisheries, the Code provides that
"States should adopt, as soon as possible, cautious conservation and management measures .... Such measures should remain in force until there are sufficient data to allow assessment of the impact of the fisheries on the long-term sustainability of the stocks." (CCRF 7.53)
The 1995 UN Fish Stocks Agreement is a binding instrument, which applies the precautionary approach both on the high seas and within EEZs for straddling and highly migratory fish stocks. It specifies the roles and responsibilities for regional fisheries agencies and Flag States in the collection and exchange of data necessary to meet stock assessment requirements, and support management objectives for straddling and highly migratory fish stocks. Annex I of the Agreement, titled Standard Requirements for the Collection and Sharing of Data (see Annex 1), specifies the minimum data requirements for the conservation of fish stocks. Article 48 of the Agreement specifies that the Annexes to the Agreement may be revised from time to time based on scientific and technical considerations or may be elaborated by regional fishery organisations or arrangements. Importantly, Flag States are charged with ensuring that vessels flying their flag report the necessary fishery data, irrespective of where the vessels are fishing, and are required to verify those data.
Furthermore, the FAO Compliance Agreement, which is part of the Code of Conduct, states that all parties will provide information to assist in identifying those fishing vessels engaged in undermining international conservation and management measures.

6
3. OBJECTIVES OF DATA COLLECTION
Data are needed to make rational decisions, evaluate the fisheries performance in relation to management objectives and fulfil regional requirements. The extent to which objectives are achieved is assessed using indicators, which are generated from data. There is no standard set of indicators, but all must be tailored to each fishery dependent on which social, economic or environmental concerns are important. Appropriate indicators can be developed which measure the state of the resource, the performance of fishing controls, economic efficiency, socio-economic performance and social continuity. A fishery authority may also be obliged to supply information to regional and international organisations and other states with respect to straddling or highly migratory stocks.
3.1 DATA NEEDS FOR MANAGEMENT ISSUES
“The collection of data is not an end in itself, but is essential for informed decision-making.” (FAO Technical Guidelines for Responsible Fisheries 4: Fisheries Management: Article 2, FAO 1997a).
“States should ensure that timely, complete and reliable statistics on catch and fishing effort are collected and maintained in accordance with applicable international standards and practices and in sufficient detail to allow sound statistical analysis. Such data should be updated regularly and verified through an appropriate system….” (CCRF 7.4.4)
Planners and managers need to understand the dynamics of the fish stocks, fishery operations, infrastructure, communities and individuals involved in the fisheries sector in order to set policy and manage fisheries. Data collection and analysis, for example, can provide information on how fishers are likely to respond to different policies. Constraints on production and development of new fisheries can be identified. Prices and cost changes in the fisheries can be assessed. Stocks likely to receive increased levels of exploitation may be identified before resource levels drop to a crisis point.
Answers to fisheries policy and management questions can be obtained from bio-socio-economic analyses. These are powerful tools that can be used to assess: • the local resource management regimes already present; • the options that restrict access to each fishery and the social and economic disruption to
the associated fishing community which may occur; • the different impact management measures have on each sector of the fishing
community and the perceived fairness of those impacts. These analyses require certain types of data to produce indicators, which are used to guide decision-making. Although the analytical method has some influence, the types of data needed are largely decided by the indicators that the management authority requires to make its decisions.
Information in this context has great economic value. As investment in fisheries increases, harvesting rate and the risk of overexploitation rise. Overexploitation results in decreasing catch per fishing unit, and may result in economic loss and hardship. Data collection is necessary to increase or sustain welfare and earn revenue, because it decreases the risk of overexploitation, and leads to improvements in exploitation patterns.
Fisheries management requires consideration of a variety of issues, all of which need to be addressed using information collected from biological, economic and socio-cultural sources. A fishery is a complex system of interacting factors incorporating the state of the biological resource, social and institutional constraints, economic conditions and cultural beliefs.

7
Integrated analysis, using a variety of data, is necessary for predictive assessments of future conditions and the outcomes of alternative management measures.
Over time, many different management issues will emerge in every fishery. Many of these issues, particularly those related to the environment, can only be identified using information derived from a data collection programme. For this reason, it is wise to develop a programme that covers a wider range of variables than that required only for current policy.
As ecosystems world-wide have become subject to increasing stress, it has become more important to develop, maintain and improve harvesting regimes which minimise negative impacts on habitats and fish communities. Specific data on fishing operations, fishers, fishing communities, and the environment are required to achieve this objective.
Fisheries in certain near-shore marine habitats and many river-driven systems, such as mangroves, coral reefs, floodplains, marshes and rivers, are especially sensitive to environmental stress. The greatest threats to these fisheries are often not over-exploitation of resources, but rather loss and degradation of the aquatic habitat and poor land-use practices that lead to sedimentation and pollution. Under these circumstances, the management of fish habitats and related environments is often a priority, so the collection of environmental and ecological data in relation to fishing patterns is essential.
For management to work, the economic and socio-cultural aspects of fisheries must always be assessed. In all fisheries it is, after all, people who utilise the resource and affect it in a variety of ways, and people whose behaviour must be influenced to implement effective management measures. Integrating data collection with the fishing community is not only cost-effective, but also a useful way for the community to influence management through indicating its own needs and concerns.
Policy makers and managers require information on compliance for two main reasons. First, to test the degree to which fishery operations comply with the limits and regulations laid down to achieve management targets. Second, to reduce the risk of conflicts through the control of competing sub-sectors, including illegal fishing activities. Relating socio-cultural and economic data on motivations and incentives to compliance data should improve understanding of critical issues for enforcement and education.
3.2 MANAGEMENT-RELATED INDICATORS Effective management of fisheries requires indicators derived from time series of data. Indicators of fishery status are usually constructed from a series of data types and variables and interpreted in relation to agreed reference points corresponding to objectives adopted for production and conservation. In some cases indicators may be interpreted simply by comparisons with historical values, such as interpretations of rising or falling revenue or employment. In other cases, the interpretation requires comparing indicators with reference points derived from complex analyses or from development policy objectives. For example, simply knowing the current catch is of limited use unless some target level or limit (such as maximum sustainable yield) is available against which it can be interpreted. Targets may also require data from other sources. For example, the target might be to reduce the proportion of fishers with incomes 50% below the national average over a specified period, which requires information on average national incomes, not just fishers' earnings.
The information domains for which indicators are needed for implementing and assessing management strategies include the biological resources, production, control system, economic and social domains.
3.2.1 Status of resources The aim of many data collection programmes is to monitor and assess the status of the stocks that are being exploited. Typically, the status of a stock is interpreted in relation to one or more reference points, which are targets or limits for the fishery. Using analytical models,
8
these targets can be used to derive controls, such as catch quotas or effort controls, which are designed to move the stock towards the desired state.
Increasing overexploitation of resources may often be detected by a combination of falling catch per unit effort, falling total landings, decreasing mean weight of fish or changes in the fish population age structure or species composition. By maintaining a time series of catch per unit effort and total landings by fleets (e.g. gear or boat category), by commercial species group, fishing area and fishing season, overfishing should be detectable. Without these data, there is often significant disagreement between interested parties because assessments have to be based on subjective judgement and anecdotal information.
Sophisticated methods, such as cohort analysis, based on more detailed biological data may also be used. Data for these methods usually comprise size, age, sex and maturity of fish sampled from the catch. These data, routinely collected over a long period, together with other scientific information on fish growth and mortality, can produce accurate estimates of the current state of the stock. Results from such stock assessments should form the scientific foundation for advice on conservation measures.
In addition to concerns over individual stocks, the overall status of exploited ecosystems is becoming an important issue in management. Monitoring species, age and size composition, mean lengths of species caught, habitat, by-catches (in particular discards) allows management to assess the wider impacts of fishing on the ecosystem.
3.2.2 Yield Yield is an important indicator of fisheries performance, often judged in relation to potential yield. Potential yield is a forecast of the sustainable landings that good management should be able to achieve. Estimates of potential yield can be obtained from a variety of methods, some of which require very little data. Methods requiring few data are often highly uncertain in predicting standing stocks and potential yields. Simplified models may be used at the start of exploitation of a new resource when few data are available, but as exploitation progresses, and investment in the fishery increases, more sophisticated and data demanding models should be applied.
3.2.3 Fishing controls There are many methods available for the management of fisheries, including the use of closed seasons, closed areas, limitations of catches or fishing effort, property rights, taxation, catch quotas or mesh size regulation. Usually a management regime is some mixture of these. Evaluation of the effect of these management measures is only possible if specific data are available. For instance, to measure the effect of changes in net mesh size requires fish size and species composition data from before and after a new regulation is imposed. Without monitoring, substantial resources can be wasted enforcing controls that have little benefit for the stock and great cost to those fishing. Monitoring of socio-cultural and economic trends in the fisheries on a regular basis is therefore also critical to determining whether fisheries policies are achieving their objectives.
Enforcement may be assisted by using data collected as an audit trail, from harvesting through processing to export or consumption. Compliance itself should also be monitored to assess the effectiveness of management. An indicator of compliance could be, for instance, the number of recorded infringements against some control variable (such as the area covered by surveillance flights or number of vessels observed, etc.).
3.2.4 Economic efficiency The economic objectives of fisheries management include improving the economic benefits to participants in the fishery, the appropriate allocation of resources between competing uses (i.e. fishing and other sectors of the economy) and the generation of economic benefits to the broader community. These three objectives are complementary. Ensuring an appropriate allocation of resources between competing groups within and outside the fisheries sector will
9
result in an improvement in the economic situation of fishers and the generation of economic benefits to the local community. How well the fishery is doing in this regard can be monitored using an micro-economic performance indicator, which describes the economic performance of those involved in fishing. The indicator can be used to determine how well existing management plans are achieving the desired economic goal and to identify which segments of the sector require the greatest attention. In addition, macro-economic indicators are important in determining how the sector is performing relative to other sectors of the economy, and provides useful guidance to government policy and planning.
3.2.5 Social performance The main objective of individual vessel4 owners is to organise their fishing in the most economically efficient manner therefore ensuring the greatest level of returns. However, measures designed to create an overall economically efficient fishery may conflict with broader objectives of the fishing community. Many fishing fleets are dominated by a large number of small boats. In many cases, however, an economically efficient fleet is characterised by a much smaller number of boats. This may adversely affect community stability, particularly in areas where few alternative employment opportunities exist. Linking biological, socio-cultural and economic data collected on a routine basis will allow these concerns to be evaluated.
An important aspect of social performance is the sustainability of the fishing communities. There are two aspects related to continuity of fishing among successive generations. One is continued access to the lifestyle for future generations. Will a particular management measure make it more difficult for young people to enter the fishery than would otherwise have been the case? The other may be the concern with maintaining certain critical features of the fishing lifestyle, which may form the core that differentiates it from other lifestyles. To address these issues, there is a need for socio-cultural and economic data, which are in turn related to the biological status of the resources.
3.3 REGIONAL NEEDS “States should compile fishery-related and other supporting scientific data relating to fish stocks covered by sub-regional and regional fisheries management organisations or arrangements in an internationally agreed format and provide them in a timely manner….” (CCRF 7.4.6.).
“Where a subregional or regional fisheries management organization or arrangement has the competence to establish conservation and management measures for particular straddling fish stocks or highly migratory fish stocks, States fishing for the stocks on the high seas and relevant coastal States shall give effect to their duty to co-operate by becoming members of such organization or participants in such arrangement, or by agreeing to apply the conservation and management measures established by such organization or arrangement." (FSA 8.3).
Many fish resources, whether marine or freshwater, are highly migratory or straddle boundaries of national jurisdiction and/or the high seas. Their management requires regional co-ordination and data sharing. Fisheries management of internationally-shared stocks implies international obligations (e.g. to regional fishery organisations) for collecting and exchanging fishery data, as specified in the UN Fish Stocks Agreement and the FAO Code of Conduct for Responsible Fisheries.
In order to accomplish the mandate of fish stock management on freshwater and marine straddling stocks and on the high seas, regional agencies may establish their own criteria on collection of statistics. These may be special variables to be collected in specific levels of detail or by specific strata (see Chapter 5). In most cases, data collected at national level can be used as the source for such data compilation, and simple extraction and aggregation of 4 “Vessel” is used in this document to refer to all fishing crafts.

10
national data at an international level will be sufficient. However, in some cases the resolution requested internationally is finer than that normally used at the national level. Should that be the case, regional agencies must make every effort to ensure that their data requirements are well understood. In return, those in charge of collecting statistics at the national level should be well aware of the obligation to provide these data in the form required by regional agencies.
11
4. INDICATORS, DATA TYPES AND VARIABLES
Once policy and management objectives are defined with their relative reference points, appropriate performance indicators can be identified, and so can the variables which are needed for their estimation. However, there is feedback between choice of indicator and data variables, since it is at this stage that logistics and costs have a significant influence on the data collection programme. Besides the demands of an indicator, choice of variable is influenced by: • the operational characteristics of the fishery which dictates what can feasibly be
collected; • the total number of variables which can realistically be collected; • the number of indicators which a variable can be used for; • how often the data needs to be collected; (or the variable needs to be sampled) • the expected data quality and quantity that can be obtained; • issues of standardisation. However, the primary factor is the link between the necessary operational, biological, economic and socio-cultural indicators and their associated variables. Any designer of a data collection programme should identify the appropriate variables that are both feasible to collect, and that can provide the relevant indicators for management. The data variables discussed below are neither exhaustive nor are they all required in any particular fishery. It is up to the programme designer to decide upon the variables needed, based on the objectives and indicators that have been chosen.
4.1 INDICATORS AND VARIABLES Performance indicators measure the effectiveness of fishery management actions implemented to meet policy objectives. They broadly lead to three categories of representation : • simple trends in absolute values such as of catch or employment; • qualitative and quantitative changes in infrastructure / institutional arrangements which
affect management outcomes, such as changes in access right system or degree of participation by fishers;
• trends in relative values [not between the absolute value and its related reference points such as Maximum Sustainable Yield (MSY) or Maximum Economic Yield (MEY)].
The elaboration of many indicators requires the combination of multiple variables, and certain variables such as catch, effort and value are vital to a wide variety of indicators or may, themselves, be used as indicators. Thus, the lists of variables for the various indicators will overlap.
Biological indicators can be used to monitor the state of exploitation of the fishery, but are inadequate to assess the performance of the fisheries sector as a whole. Economic indicators can measure the relative importance of the fishery to the nation or region at the macro- or micro-economic level. Socio-cultural indicators take into account the diversity of needs and practices of different groups of people within the fisheries sector. Compliance indicators are needed to monitor the effectiveness of management measures and reduce conflict. In practice, fisheries assessments should always combine biological, economic, socio-cultural and compliance indicators to guide management decisions.
The identification of policy priorities and management issues are largely dependent on the identification of problems in the fishery. A number of performance indicators exist which can help to identify these problems, suggest courses of action and monitor the results.

12
Variations in indicators alone (such as CPUE) are of limited use. These variations can be interpreted most usefully for decision making when they are related to reference points as either targets (e.g. maximum economic yield or MEY, or fishing effort at MEY) or limits (e.g. minimum biologically acceptable level of spawning stock biomass - MBAL)5. The indicators themselves are often easy to calculate from routinely collected data on their component variables, but the reference points are generally estimated using stock assessment methods. Together they provide information on the status of the fishery and on the performance of the management system.
Careful thought should be given to the data variables to be collected. The main questions being asked, the models to be used, and logistics should dictate what variables are considered necessary and how the related data should be collected. Where possible, fishery researchers and statisticians should be involved in discussions at the planning stage. Not only will this help in choosing measurements in terms of their usefulness, but also may help reduce costs by developing methods which are able to use those variables that are the easiest to collect. The additional involvement of industry and fishers can take advantage of their expertise in the day-to-day realities of fishing operations. Their participation also creates a form of co-management, which has various other benefits (see section 5.2).
A critical concern for any data collection is consistency. In many cases, it is imperative to have long time series of data collected consistently and routinely in order to evaluate trends in the behaviour of a variable. This has long been accepted practice with biological data, but has often been ignored for economic and socio-cultural data.
4.2 SPECIFICATIONS FOR SELECTION OF VARIABLES AND DATA
4.2.1 Evaluation of the operating characteristics of a fishery Prior to the data type selection and survey design, it is essential to evaluate the operating characteristics of each fishery. It will also be important to update this information when fleets or vessels change (e.g. from foreign to domestic, artisanal to semi-industrial, or freezer to wetfish trawlers). There is no single method for such evaluation since it depends on the type of the fishery. Nevertheless, a direct and full appreciation of daily fishing operations is fundamental to the data collection design. For example, an examination of fish handling practices is necessary to decide what level of species detail should be feasible for reporting in fishing logbooks. This is one of a number of points in the management process where involvement of fishers and other industry representatives can be helpful.
4.2.2 Data type priority The collection of information from the fishing industry may be an onerous task, particularly where poor relations exist between the industry and the authorities. Compliance with data supply and willingness to assist in data collection are the two biggest administrative problems for management. The industry often sees the provision of data as time-consuming, pointless and/or a release of information that would be beneficial to others. It is clear from experience that two attributes of a fishery enhance the ability to collect accurate and timely data: • the general trust between those fishing and the authorities (including data
confidentiality); • the ease with which data can be collected, compiled and distributed.
It is important, therefore, to select indicators and variables that are directly related to the objectives, in order to limit the task both for fishers and landings enumerators. However, in some cases more information than that strictly required for the analyses may be necessary to validate data.
5 A Target Reference Point (TRP) indicates a state of a resource and/or the fishery which is considered to be desirable and at which management, whether during development or stock rebuilding, should aim. A Limit Reference Point (LRP) indicates a threshold in the state of a resource and/or a fishery, which management should ensure the fishery never falls below.
13
In developing the data collection system, the implications for fisheries management of not collecting certain types of data will also need to be considered. For example, production data with detailed species, product and size grade information may be needed for the dynamic bioeconomic models necessary to set optimal quotas. However, if such types of data are found too expensive to collect, management may need to reconsider the use of quotas as a control for the fishery.
Following some decisions on what data are possible to collect, it is then necessary to decide on what data are essential, and what are only desirable. Catch and effort data are critical to construct the most important indicators in most fisheries. Other data types relating to details of vessel activity, may not be considered necessary in particular cases.
When beginning data collection systems, initial emphasis should be on the harvesting sector for all data domains (operational, biological, economic and socio-cultural), with processing and other secondary and tertiary sectors being constructed subsequently according to available resources and management goals.
Each data type may be used for a variety of indicators. Catch, for instance, may be used both in calculations of revenue for economic purposes, and as a rough measure of resource depletion. Using various models, effort can be linked both to fishing costs and to fishing mortality. This is useful because it is not possible to measure these variables like costs and mortality directly all the time, if at all.
Because different indicators may make different uses of the same types of data, attention should be given to recording data in a manner that allows their use for different purposes. For example, data on effort, an economic variable, should ideally be recorded in a form proportional to variable costs of fishing, such as travel distance and number of fishing days. Alternatively, for compliance control purposes, the fishing position may also be needed. For biological purposes, effort data may be needed by set or haul and in a form proportional to fishing mortality.
The selection of a data type also depends on the available analyses. Many fish populations dynamics models require catch in weight and number by species, as well as other data on the biology of each species (e.g. age). A bioeconomic model may require data not only on the specific fishery production and prices, but also on other economic sectors for comparative purposes.
For socio-cultural data, the essential starting point is data on individuals fishing. Fish dealers and processors are the next most critical group. Data collection on other interested parties (such as consumers, environmental organisations, coastal developers, etc.) can be added as funding becomes available. However, the level of detail both required and available will vary. Some data may be acquired from existing routine data collections, such as fishing licences or permits and census records. Other data may need to be collected through new programmes.
4.2.3 Frequency of data collection The frequency at which variables should be measured and data should be collected depends on their rates of change and the costs of measurement. Most variables require a natural data collection frequency, which often becomes apparent when the dynamics of the fishery are understood. The following are some broad categories of data collection frequencies: • Very frequent: usually collected by automatic recorders (e.g. VMS), such as time,
position and sea temperature. The volumes of data can become inordinately large, and some pre-processing is necessary before the data is stored. Depending on the use of the data, the frequency may be reduced to a single daily record.
• Daily: usually provided from industry records (e.g. logbooks, processing records) covering catch, effort and processing rates.
• Trip: the majority of harvest related data can be reported at the end of each trip, including landings, a trip summary of effort, fishing grounds, prices, trip costs, and other operational and micro-economic data. Although many variables are naturally collected
14
by trip, not all trips need to be covered, but a sampling strategy can be used (see section 5.6) to reduce costs.
• Monthly: measurements based on months are appropriate for variables that change slowly and those that have a seasonal pattern. This does not include average monthly values, such as prices or catches, which are derived from more frequently collected data, but could include data obtained from an external source, such as retail price index, or monthly rainfall.
• Annual: this is used for slow moving variables, such as investment in gear and vessels. Commonly, registers and licences, which can be updated annually, are used for this purpose.
• Infrequently collected data: other types of data can be collected at periods greater than a year. These include household and demographic information as well as habitat degradation, which may be updated every 3-5 years. If necessary, inter-survey periods can be estimated using interpolation, which is adequate for most purposes.
4.2.4 Data quantity and quality Assessing the state of resources, their potential for exploitation, and preparing options and advice for fisheries management requires reliable fishery data. The extent to which this can be conducted effectively is almost always limited by the quantity and quality of the data. Whereas simple analyses based on minimal information can provide useful indications for management, sophisticated analyses which consider options for exploitation (e.g. gear type, foreign or national) whilst taking account of technical and biological interactions between resources, are immensely data demanding. The move towards more sophisticated analytical methods, which provide better management advice, is necessary to improve fisheries management. The foundation of improvements in fisheries management is an accurate data set collected using efficient methods.
Computer simulations can be used to determine the quantity and quality of data required for each indicator in which the variable is used. The accuracy of variables and cost of collection can be estimated for each of a number of scenarios. The data collection programme can then be designed to limit the statistical error and, hence risk, to an acceptable level.
4.2.5 Standardisation The initial set-up of system standards and classifications has to take into account not only immediate data collection needs, but also the evolution of the data collection system and data needs over time.
The primary objective of standardisation is to facilitate integration between different data collection systems. A data collection system serving one purpose may have to be integrated with others having different aims and scope. All these systems may share, to a varying degree, a number of common statistical components such as species and boat/gear classifications.
Requirements for variables and the strata in which the related data are collected are different at different levels (e.g. local community, local government, central government or international). These different requirements should be examined in order to avoid duplication. The data should always be collected at the level of the most detailed stratum, as it is always possible to aggregate, but impossible to disaggregate data. For example, if fish length-frequency data were collected aggregated over each landing day instead of trip, it may turn out later that on different trips vessels were exploiting different stocks. As the length frequency cannot be linked to particular trips, it would no longer be possible to know from which stock they originate and stock assessment work using these data would be unreliable.
When setting-up species, boat/gear or other classifications it is good practice to take into consideration other statistical systems that may be using similar categories. Logical linkages and cross-references can then be established between different classifications, making direct comparisons possible.

15
Structural changes to the classifications in the middle of a processing cycle should be avoided because it might create confusion, duplication of data or allocation of data to the wrong categories.
4.2.5.1 National and regional data standards Where possible and appropriate, it is desirable to apply internationally recognised definitions, classifications and codes. Most inter-governmental fisheries organisations with a statistical remit participate in the Co-ordinating Working Party on Fishery Statistics (CWP), which has recommended standard classifications for vessel and gear types and species. The International Standard Statistical Classification of Fishery Vessels (ISSCFV) is provided in Definition and classification of fishery vessel types (FAO Fisheries Technical Paper No. 267). The International Standard Statistical Classification of Fishing Gear (ISSCFG) is provided in Definition and classification of fishing gear categories (FAO Fisheries Technical Paper No. 222). The Harmonised Commodity Description and Coding System (Customs Co-operation Council, 1992) used for classifying traded fishery commodities is maintained by the World Customs Organisation. Many regional fishery organisations and national authorities utilise the 3-alpha species codes, as provided in the FAO Standard Common Names and Scientific Names of Commercial Species (FAO-FIDI) which is updated annually. When codes are not available, the scientific names should be used. The FAO species identification guides and the FishBase database can be consulted as reference for the correct scientific names of aquatic species of interest to fisheries. Coding of latitudinal-longitudinal grid is standardised world-wide (ICCAT Field Manual for Statistics and Sampling, 1990). There are also various manuals and Internet web pages available from FAO6 and various regional agencies, which should be consulted in developing the data collection system. The United Nations, the World Health Organisation, the International Monetary Fund and other international and regional bodies have standards for census categories, nutritional and health values, and industrial categories.
The specific classifications and codes used will also depend on the nature and structure of the fishery. Collection of primary data on catch and fishing effort is conditional on the nature of fishing operations. Fishers sort and sell their catch by commercial categories, which often contain a mixture of species, but may also be arranged by market grades within species. Correct identification of taxonomic species within commercial categories requires well-trained field operators and supervisors, as well as careful review of source documents before they are processed.
4.2.5.2 Requirements for creating subregional and regional databases There are instances when it is essential to bring together fishery data collected by means of different national programmes for the purpose of conducting research on the state of shared stocks. Such integration is feasible under the following conditions: • all contributing national standards and classifications share a common regional or inter-
regional set of statistical standards (usually at a high level of aggregation), and that each national database is equipped with the necessary logical linkages for reporting data at that commonly used level;
• all estimated data (such as totals on catch and fishing effort) are recorded in compatible computer media and utilise the same exchange formats;
• automated procedures are in place to speed up the integration process and generate (with minimum or no manual intervention) a regional or inter-regional statistical database capable of performing typical reporting functions;
• national data are compiled from the raw data so that the national statistics can be further aggregated to international requirements in terms of variables, data stratification, and standards.
6 FAO Fisheries Department web site at: http://WWW.FAO.ORG/FI

16
4.3 INDICATORS AND ASSOCIATED DATA TYPES AND VARIABLES When choosing the data to be collected, it is necessary to establish explicitly the link between objectives and goals, performance indicators and the data types and variables necessary to generate them. These links have implications not only for data collection, but also policy. If a policy requires increasing employment, but the responsible agency is unable to collect the necessary data to assess employment, the policy performance cannot be reliably assessed. There is no prescription for selecting data types and variables but this must be based on needs and local circumstances.
There are many possible data types beyond those discussed here. However, the examples given should cover the most important ones. It is not suggested to collect data on all the types mentioned. Choice of data should be clearly justified based on their use. Data are collected to generate indicators necessary for policy and management, therefore the expense of data collection, as part of management costs, needs to be justified.
Many of the variables can be used for more than one type of indicator (e.g. catch and effort). This contributes to determining their importance and priority in data collection. In some cases, important data types are used in a number of different assessments as they measure a commonly used factor. For instance, catch is both a measure of the benefit to society and "cost" to the resource, and hence occurs in both economic and biological indicators. In others, increasing the available data often allows existing indicators to be refined. For example, gross value of production can be converted to gross value added and then to resource rent as more detailed cost information becomes available.
4.3.1 Fishing and operational indicators
4.3.1.1 Total catch: landings and discards Catch in numbers or weight represents the removal of biomass and individuals from the ecosystem, and is the fundamental impact fishing has on fish populations. Catch data are necessary for most stock assessment techniques. Catches should be broken down into categories with as much detail as possible. The priority classification of catches should be by species. Assessment of combined species yields have to rely on methods based on general ecosystem production, which by themselves are unreliable. If catches can be further broken down into categories based on size, maturity, location and date of the catch, it may be possible to develop a wide range of assessment methods leading to more reliable results. A detailed breakdown can also improve economic and socio-cultural analyses.
The interpretation of changes in catch is very difficult without additional information on the status of the stock. High catches may be unsustainable, and low catches can result from exploitation rates both above and below the optimum. Additional information on the stock status, such as an index of abundance or size composition of landings, is required to obtain a true assessment of the fishery. Invariably a long time series of comparable catch data is required for any reliable interpretation.
Where discarding takes place, catches will not be the same as the live weight equivalent of the landings. Discarding has significant biological implications and should always be recorded or estimated. Total catch consists of total landings and discards.
Transshipping at sea must not be neglected in monitoring catches, otherwise a considerable proportion of the overall catch may be unaccounted for. Every effort should be made to identify where transshipping is taking place and to monitor it with on-board observers. If this is not possible, contact should be made with the authorities of the receiving vessel Flag State to seek their assistance in obtaining the transshipment data. Similarly in inland fisheries, transshipping from fishing boats to transport vessels must also be considered.

17
Variables and sources
In most cases, it is useful to obtain catch both in weight and numbers. Conversion from numbers to weight (or vice versa) can be obtained through an estimate of the mean weight of individual fish caught. Length measurements may also be converted to total weight of the catch, if a reliable length-weight relationship has been established beforehand. Similarly landed weights for products resulting from primary processing at sea (gutting etc.) can be converted to live weight equivalent (also called nominal catch, whole weight or round weight) once a reliable relationship is established.
In general, catch data should be detailed enough in terms of time-area strata to allow them to be aggregated to stock units. It is not always possible to group landings and discards by stock as often stocks cannot be well defined, although they can sometimes be delineated by season and area. Categories in practice may be based on species (or species group), fleet, season and fishing area.
It is important to know what the target species is as this can help in understanding vessel activities. Often catches of target species (or major species) are recorded accurately, but by-catch species are either neglected or reported aggregated as groups, particularly when those by-catches are discarded. In the light of increasing concern about the effect of fisheries on ecosystems, recording by-catches (whether retained or discarded) at the lowest possible level of aggregation is important. Table 4.1 Examples of catch and discard variables Data Type Variables
Target species/species group species (or species group)
Total catch weight; number; number of baskets/bins/boxes; holds (volume)
Species composition sampled fish species; number of baskets/bins/boxes/ holds by species
Average size sampled fish species, length, weight; catch weight by size gradings
Discards species; weight; number of baskets/bins/boxes; whole/macerated
Table 4.2 Examples of production variables Data Type Variables
Product types whole round/green; gutted; boned; headed; fins off; fillet; skin on/off; loin; mince; surimi; fish meal (from whole fish/discards/broken or sour/ offal etc.); consumer packs
Conversion factors standard conversion factors from processed to whole weight by product type (above)
Product storage whole frozen; IQF; hold frozen; storage temperatures; dry; brine; salted; fresh
Product packaging individually marked and packed (e.g. tunas); carton (type and weight); bag (type and weight); basket (type and weight); barrel
Package contents non-fish weight (ice, glaze, salt, packing material, coatings, liquids, sauces etc.); fish number; package weight; product type; size grade
Processing machines machine type; production rate
Catch weight estimation during fishing operations may be dependent on the experience of the fisher. Catch weight by species in a cod-end, in the collection bin, across baskets or pumped into holds will always be a subjective estimate and can vary widely in accuracy between fishers. It is often possible to refine measurement for the landed part of the catch (e.g. counting of boxes). Refining such estimates can be undertaken either at landing or following on-board processing. In the latter case, it may be useful to record actual production on the daily log. In industrial fisheries, many fishers maintain these records for their own or

18
company purposes anyway. Thus, processing methods, product types and their methods of storage and packaging will also be useful to audit catch and landing records.
Total landings can be obtained from logbooks, sales slips or interviews with fishers or intermediaries. Discard estimates can sometimes also be obtained from fishers. Data from on-board observers during fishing trips may be valuable where detailed trip information on discards and fishing locations are not usually available. Information recorded by observers should be largely the same as that at landing sites, but in more detail with additional relevant information on the vessel operations.
4.3.1.2 Effort Effort in biological assessments is used to estimate fishing mortality. Fishing mortality is a fundamental variable in stock assessment, representing the proportion of the stock that is removed by fishing. Effort is used in setting most fishing controls. In economic and socio-cultural analyses, effort can be related to fishing activity, vessel and fleet profitability and economic efficiency. Changes in total fishing effort may be an indication of stock status or fishing profitability but, like changes in catch, are difficult to interpret without additional information from other biological, economic and socio-cultural indicators.
To record fishing effort requires careful thought on how effort will be used and how it may be collected practically. To relate effort to fishing mortality for use in biological models, it is necessary to relate it very closely to specific gear use, such as trap soak time or time trawling. On the other hand, to relate effort to profitability requires data at the trip level, including time spent at sea, time fishing, and labour and capital inputs.
Variables and sources
Annex 2 provides a more detailed list of measures of effort, in order of priority.
Usually not all effort is of the same type on a trip. Time spent fishing, searching for fish or travelling to fishing grounds for fish should be distinguishable. Search-related information should be noted, such as the number and type of tuna schools/aggregations encountered and what they were associated with. Fishing effort could also have a ‘success’ attribute, particularly in trawl and net fisheries, to enable complete or relative discounting of any one ‘set’ when analyses are done.
For active gears, like trawls, the size, number and times of operation may be required. For passive gears, like traps, the soak time for each gear should be recorded. If these data are not available, an average case will have to be assumed. For instance, if only trap boat days are recorded, it would have to be assumed that on average boats have pulled a fixed number of traps with the same soak time throughout the time series. If this assumption is untrue, the resulting analyses could be incorrect.
To relate costs to effort, effort needs to be categorised by types of capital inputs (e.g. gear types, wheelhouse electronics, processing equipment) and types of labour (e.g. fishers, processors, cooks, mechanics). Many of these data are available from vessel and operations data (Table 4.6). Here too an average case may have to be assumed for all effort (i.e. a fixed cost per unit effort) if appropriate information is not available. Where available, sightings of fishing vessels form an important source of information on vessel activities. It can be used to verify effort data from other sources, or estimate effort directly. The use of sightings data depends on extent of the coverage and the level of detail in the accompanying information (e.g. precision of location or the extent to which activities were recorded).

19
Table 4.3 Examples of fishing gear variables for identifying gear types and characteristics Data Type Variables
Gear gear type (bottom trawl, dredge, mid-water trawl, purse seine, gillnet, longline, pole and line, jiggers, traps, beach seine)
Construction mesh(s); material; hook size; doors; TED; grids; burst panels; escape doors; diversions
Size length; depth; headline; foot rope; hook spacing; total line length
Deployment bottom; midwater; surface; fixed; anchored; free floating; association (log/school/FAD/birds/seamount/convergence)
Subsidiary vessels dinghies; scout; net boat
Electronics beacons; netsonde; mass sensors
Markings gear number; vessel identification
Bait type of bait used in association with the gear (in traps, on longline hooks, etc)
Table 4.4 Examples of fishing effort variables Gear Type Variables
All gears time steaming; time fishing; number of labour by type; types of gear; electronics; other capital inputs
Trawl and dredge date, times, speed, positions (lat/long, location id, grid id, depth) for gear "set", "on bottom", "at school", "closed", "off bottom", "haul start", "on surface"
Purse seine date, times, positions (lat/long, location id, grid id) of start set, end set, pursed, pumped/brailed, on board.
Longline number of hooks set; date, times, positions of start set, end set, start haul, finish haul
Trap number of traps set; date, times, positions of start set, end set, start haul, finish haul
Vertical nets number and length of strings set; date, times, positions of start set, end set, start haul, finish haul
Pole and line and jiggers
number and type of poles; number and type of jigging machines; date, start time, end time, position (lat/long/depth) of operation
Beach seine length of net, date, start time, end time
Table 4.5 Examples of sightings variables Data Type Variables
Identifiers vessel; permit or licence number as displayed on the hull of the vessel
Location latitude and longitude; fishing ground; statistical area; management area
Activities steaming; fishing; setting gear; hauling gear
Offences fishing without licence; fishing in a closed area; fishing out of season; lack of proper vessel identifiers; gear type, mesh size and fish size infractions; misreporting catch
4.3.1.3 Catch per Unit Effort (CPUE) CPUE or catch rate is frequently the single most useful index for long term monitoring of the fishery. It is often used as an index of stock abundance, where some relationship is assumed between the index and the stock size. It can also be used in monitoring economic efficiency.
It may be dangerous to rely on CPUE alone as a stock size index, particularly in pelagic fisheries. It is commonly assumed that the index is proportional to stock size and that the

20
stock size changes according to a particular population model. Verification of these assumptions requires additional data.
Another problem arises with changes over time of fishing efficiencies or operational patterns, which will require that the index be adjusted. Routine surveys of gears, such as those obtained from frequent frame surveys, should help to cope with this problem.
CPUE alone cannot determine economic efficiency or vessel profitability. Additional data are needed on costs and earnings.
Variables and sources
CPUE should be separate for each stock unit and gear type. In practice, separate CPUE indices may only be possible for each species (or species group), fleet, season and fishing area. In general, as large a number of variables that affect the catch rate should be recorded alongside catch and effort. These variables can then be included in analyses, so CPUE can be adjusted to reflect only those effects that are of interest.
CPUE can be calculated directly from vessel landings, when catch is recorded by unit of effort. However, generally both catch (Table 4.1) and fishing effort (Table 4.4 ) are recorded separately and CPUE is derived from these data. It is important to recognise that there may be many different measures of fishing effort that can be collected, so a number of alternative measures should be available from the variables recorded. This ensures the most appropriate unit of effort can be used in each analysis.
4.3.1.4 Fishing operations Fishing operations indicators describe the composition of fishing fleets and fishing patterns and are the basis of most management decisions. They are important for monitoring compliance and in analyses involving fishing effort. For instance, mapping fleet activities by gear use allows management to detect infringements of zone allocations or potential conflicts in gear use (e.g. trawling versus gill net) which require zoning.
Linking fishing operations to socio-cultural, infrastructure and other economic data improve analyses of fleet activities. Such analyses produce a better understanding of motivations in the behaviour of different fleets, so more accurate predictions can be made of the fleets response to changes in the fishery.
Variables and sources
Fishery operation variables refer to information on types and number of gears, fishing location, vessel speed and direction. Fishing gear requires careful monitoring because fishers will continuously improve their gear. Their objective is primarily to increase their catch rate or decrease their operation costs, and hence decrease their costs of production. Fishers secondarily aim to comply with regulatory mechanisms that may be imposed, in particular to minimise catch of illegal size classes and species. Most fishing vessels whose activities are the target of complete enumeration will operate under a licensing regime or vessel register. Many of the necessary data for monitoring fishing vessel activities come directly from fishing vessels, for example through logsheets, observer reports, inspectors, landing enumerators or Vessel Monitoring Systems. Data on operations can be linked to vessel characteristics by unique identifiers, such as call sign or licence number. Registers generally are the primary sources of data, but problems with coverage and updates can mean that this information needs to be collected through direct measurement for crosschecking or filling in gaps in the data. Logbooks, questionnaires and interviews can also provide additional information beyond the basic operating variables, such as cost or crew demographic data.

21
Table 4.6 Examples of fishing vessel variables Data Type Variables
Identifiers vessel name; ship registration number; international radio call sign (often used as the unique primary key); vessel fishing licence or permit number; captain’s name; fisher licence number
Type vessel type (e.g. trawler, purse seiner, longliner, pole & liner, canoe)
Power inboard/outboard; sail; engine(s) horse power; generator
Size GT; NRT; load capacity; length; breadth
Crew number by grade or job description
Gear the identification of the nature of the fishing gear used (sometimes several types within one fishing day) can be difficult, but will be essential if accurate estimation of fishing effort is to be undertaken
Operations trip number; trip start/end date and time; operations (in port, steaming, fishing, broken down)
Support craft helicopter; scout; dinghies; associated fishing vessel (pair trawling)
Storage type (e.g. dry hold, brine tank, freezer); capacity; temperature
Freezing method brine, plate, blast
Communications type (e.g. radio, telephone, internet); contact information (number, address)
Other electronics type (e.g. GPS systems, sonar, echosounders)
For some vessels, data on fishery operations can be recorded by a computer directly from bridge instrumentation. Electronically gathered operations data can also be transmitted automatically to databases through satellite or ground communications.
4.3.1.5 Offences and prosecutions Changes in the number and types of offences could indicate a change in the patterns of compliance, offering insights into the effectiveness of management measures or changes in fishing patterns due to stock/market conditions. The various laws and regulations are designed to put policy and management decisions into practical management measures. Preventive enforcement activities encourage fishers to comply with these measures, benefiting the community as a whole. A lack of compliance, for whatever reason, may suggest that the policy or management decision needs to be reconsidered or adjusted.
Cross-references with socio-cultural and economic data will assist in identifying the fisheries where particular economic or cultural incentives are creating more significant compliance problems. Analyses may also suggest ways to address these problems.
Variables and sources
Data are needed to identify vessels, gears and fishers and associate them with specific types of illegal behaviour and with patterns of non-compliance. Although the number and type of recorded offences is a first indication of the level of compliance, the results of judicial activities provide a guide to the effectiveness of surveillance and enforcement. Thus, measures of the number and types of warnings, prosecutions and convictions and the nature and scale of penalties should be recorded, including warnings, summary convictions (admission of guilt), licence or fishing activity suspensions, fines, confiscations and imprisonment.
For interpreting statistics on offences, logistical data, such as the number of patrols, numbers of vessels examined and area searched, are also necessary. Declines in offences, for example, may be due more to decreasing resources for enforcement than increased compliance by fishers.
22
Table 4.7 Examples of offences and prosecution variables Data Type Variables
Identifiers vessel name; registration number; international radio call sign (often used as the unique primary key); vessel fishing licence or permit number; captain name; crew member names; fisher licence number; flag state
Prosecutions number by type of offence and level of judicial proceeding
Convictions number by type
Type of action taken warning; fine; jail term; revocation of licence; confiscation of vessels/gear/fish catch
Departure and destination dates; ports
Reason for passage request travelling to fishing ground; ferrying passengers
Enforcement logistics data number of vessels searched; number of vessels fishing; number of vessels observed on patrol; date, time and area searched
Data on illegal vessels and fishing operations can be collected at sea from sightings (Table 4.5). Data on catch, such as infringements of minimum size or quota controls, can be obtained at landing sites. Data on judicial proceedings can be obtained from court records.
Normally sightings data are collected by air surveillance, although this can occasionally be done by sea patrols. Aircraft are flown at regular intervals over designated zones to spot illegal intrusions and illegal fishing, or even to spot domestic vessels to verify their reported positions.
Another source of data is the transit or innocent passage request. As a fishing vessel crosses into a coastal state’s EEZ on the way to or coming back from its fishing ground, it is normal practice for the captain to report to the authority of the coastal state. Changes in the number and type of requests for innocent passage will enable surveillance and enforcement activities to be altered in response. This information may also be very useful for the country where the vessel is ultimately going to fish. Data will be needed to identify the vessel, its point of departure and planned destination, and the time spent in the waters of the state that is granting transit or innocent passage.
4.3.1.6 Dissemination of compliance information Without knowledge of the limits to allowable behaviour, fishers may inadvertently act in ways that are damaging to the rest of the fishing community. The timing of information transfer to stakeholders (fishers, processors, regulatory agencies etc.) will vary according to the particular fisheries management requirements. Static rules defined by laws may require infrequent communication compared to the annual distribution of quotas or effort limits. Indicators of the effectiveness of information transfer will include changes in the level and type of information disseminated, measured through the number and type of communications, directly through extension/information services, or indirectly through the newspapers, magazines, radio and television.
These levels should be compared with those for offences and prosecutions. Cross-referencing with socio-cultural and economic data may identify fisheries where current methods of information dissemination are inadequate and assist in finding the most effective modes of communication for those fisheries.
Variables and sources
The types of data to be monitored will include numbers, types, and locations of information bulletins distributed, and to whom they were targeted. Any feedback from the target audience should also be recorded. The agency broadcasting the information should be the main source for monitoring dissemination. Periodic surveys with fishers and the public will measure the effectiveness of information transfer.

23
Table 4.8 Examples of compliance information dissemination variables Data type Variables
Dissemination format circulars; radio messages; visits by fishery officials
Numbers disseminated numbers by format, location, and target audience
Locations disseminated vessels; processing facilities; fisheries offices; local fishers co-operatives
Audiences covered fishers; processors; market dealers
Feedback numbers of replies by type; current knowledge of fisher households and the general public on management issues
4.3.1.7 Stock enhancement
Capture fisheries, particularly of inland waters, are increasingly being subjected to practices designed to increase the stock size and productivity of the fishery. Such practices include releasing juvenile stages produced in hatcheries into the wild, the introduction of fertiliser to lakes and reservoirs, the culling of predator species and the construction of artificial reefs to provide habitat for certain exploited species.
Variables and sources
Data variables in the initial stage of the enhancement project include the number of individuals at each specified life stage released to the wild, and quantity and type of fertiliser applied to a lake. At later stages, data variables required would include levels of lake production and numbers of individuals re-captured alive; these data are needed to judge the biological effectiveness of the enhancement efforts. Data on costs and benefits will also be needed to judge the cost-effectiveness of these programmes.
Data sources include stocking agencies such as fishery authorities, hydroelectric power companies and sport fishing clubs.
Table 4.9 Examples of stock enhancement variables
Data Type Variables
Fish production level number of fish by species and age, at introduction and subsequently
Nutrient level number of fish at and post-introduction of fertilisers
Costs finance for research and development, implementation, monitoring
4.3.2 Biological indicators Biological performance indicators of an exploited stock are often based on results from fish stock assessment. A good stock assessment should separate the different factors that lead to changes in catches and catch rates, such as gear or equipment used, crew size and skills, location, stock size or other changes in the fishery or environment. Stock assessments can provide estimates of stock size, fishing mortalities, yield-per-recruit7, spawners per recruit and other indicators. These indicators require reference points for their interpretation, also obtained from stock assessment methods.
The basic indicators of stock status relate to the total weight or number of fish, but do not take into account effects resulting from differences in age, sex or size. These basic indicators can be enhanced by considering the internal structure of the stock, separating juveniles from mature fish, males from females and explicitly modelling growth. Furthermore, individual stocks do not live in isolation, but interact with other species through predation and competition. Indicators based on catch data on the status of the whole fish community
7 Recruits: Fish entering the fishery for the first time, i.e. they are recruiting to the fishery at a certain size or age.

24
remain crude, but data are still required both for ecosystem monitoring and for the development of multi-species methods. Finally, stocks are also affected by their physical environment. In many fisheries, there are key environmental variables which will need to be recorded alongside fisheries variables to understand the current stock status.
Fishers often possess very detailed knowledge on species lifecycles, abundance and distribution in time and space. This indigenous knowledge is frequently reflected in local management practices. While these fishery-specific data must be integrated with data available from fisheries science, they should not be dismissed simply because they are derived from outside the scientific establishment. When such local ecological knowledge is dismissed, not only are important data lost, but it encourages confrontation, inhibiting effective management.
4.3.2.1 Stock size Stock assessment generally aims to estimate the current stock size and its potential for increase in size. These results can be used to predict future stock sizes based on a range of possible management measures (quota, effort limitation). In the simplest case, all the fish in the stock are assumed to be the same, so sex, size, maturity and other species are ignored.
The number of fish in an ocean, sea, lake or river at any time depends upon the previous number of fish together with those factors that cause it to change. The changes can be attributed to natural and fishing mortality, recruitment, immigration and emigration. A stock is so defined as to exclude immigration and emigration (i.e. a self-contained fish population). Models of recruitment and natural mortality need to be assumed, while fishing mortality can be estimated using catch data.
A number of the indicators on stock size are used to define the state of a stock and the controls necessary to conserve it. For example, replacement yield is the estimated current population growth, such that if that quantity of fish is caught there will be no overall change in the population size; it can be used to set overall quotas. Current fishing mortality can be estimated relative to that which would obtain the maximum sustainable yield, which could be used to set a limit to fleet expansion. Similar combinations of indices and reference points can be used to set limits on effort, numbers of licences and other controls relevant to management objectives.
Variables and sources
To estimate stock size requires a time series of the total catches (including discards) and an index of stock size. The time series should ideally be complete since the start of the fishery. Even if data are incomplete, the total catches will have to be present or estimated for the entire period as these are used in the population model and provide proxy estimates for resource potential and variability. They are a measure of the impact the fishery has had on the stock.
CPUE is often used as the main indicator of stock size. The catch and effort series need not be complete over the life of the fishery, but the more catch and effort data there are, the better the assessment will be. This is because CPUE is used as an index to link observations to the underlying fish population model, rather than an integral part of the population model itself.
An alternative indicator of stock size is obtained from scientific surveys of biomass (e.g. trawls or acoustic surveys). Scientific surveys are independent of the fishery, and so avoid many of the problems of bias which occur with CPUE indices. However, they tend to be expensive and therefore little data may be available. Combining results of scientific surveys and CPUE of the commercial fishery is often the best course.
As stock size is strongly affected by annual recruitment, recruitment indices, provided by regular egg, larvae or juvenile surveys or an environmental index (such as rainfall or upwelling strength), may be necessary. Stock can be estimated either as numbers of fish or as biomass (the numbers of fish multiplied by their mean weight). If catches are only

25
measured as weight, assessment methods based on numbers of fish will require the mean fish weight.
In many cases it will be necessary to identify individual stocks (self-contained fish populations) for stock assessments. While this can be done using special research projects, routinely collected biological data including samples of meristic characters, parasites, blood samples, number of vertebrae or spawning season will help separate one stock from another.
Catch and effort variables are available from vessel activity and landings data. Recruitment indices may be collected through fishing surveys, larval collectors or be obtained from outside sources. Other scientific data would be collected on sample surveys undertaken by the responsible scientific institute or agency. Table 4.10 Examples of stock size variables Data Type Variables
CPUE catch (Table 4.1); effort (Table 4.4 )
Scientific survey data location; volume of water fished; volume or area searched; biomass detected
Catch total catch in numbers and biomass by species (i.e. total removals from the ecosystem)
Recruitment indices environmental variables; direct surveys of larvae
Stock identification morphometric variables; measures of difference from mDNA and electrophoresis
4.3.2.2 Stock Structure While overall stock size is of greatest importance, the stock status can be more accurately assessed if some account is made of the stock structure, such as age, sex and maturity. Even if the overall stock size is large, there should be some concern if the sub-population of mature females were more heavily depleted, as this may have a future impact on recruitment. The methodologies used are similar to those for determining stock size, except additional variables are now needed to break down the catch into categories.
Indicators can use variables related to stock structure to assess the status of the population. In general, as the rate of exploitation increases, the mean size of the fish in the population and in the landings becomes smaller. This may have two consequences. Firstly, fish may be caught before they reach their optimum market size, so potential economic gains from fish growth are lost (growth overfishing), particularly if larger fish have higher prices per kilogram. Secondly, fewer fish recruited to the stock have a chance to reach maturity and spawn. This can lead to recruitment failure in later years (recruitment overfishing).
Common indicators, such as yield-per-recruit or spawners-per-recruit, attempt to indicate the current rate of stock production in terms of growth and recruitment. This can guide managers in whether the fishing pressure is too great to be sustained. More simple analyses provide information on spawning season, spawning grounds and nursery areas.
Analyses combining both stock structure and stock size, such as tuned Virtual Population Analyses (VPA), provide particularly powerful indicators on the status of the stock. However, the data demands for these methods are high, requiring all catches to be broken down accurately into age and/or size categories.
Variables and sources
Size and/or age structure provides the critical information on stock structure. Age can be either observed directly through counting growth rings or derived from size using a growth model. Conversions from size to age frequencies are best accomplished using an age-length key, which is derived from aged sub-samples of the full size frequency. Because of inter-

26
annual changes in growth and reproduction, it is recommended to establish length-weight relationships and age-length keys for each year, if possible.
The stock sub-populations that may need to be particularly monitored are those of recruits and pre-recruits, mature stock, breeding females. Maturity measures should always be accompanied with length measurements to be able to detect the size-at-first-maturity. However, obtaining the sex and maturity of a fish is not always easy. Some species may even change sex as they grow, and many species may change their size of first maturity downwards as fishing pressure increases.
Size composition data are relatively easy to collect by sampling vessel catches. Most often a standardised length measure is recorded. Large length frequency samples are needed for a good stock assessment. A sub-sample of individual body weights is often considered useful as it allows routinely gathered lengths to be converted to catch weight, necessary for yield-per-recruit and other growth based analyses. In some cases fish may be graded by size for commercial reasons, so landings and market records may prove a useful source of these data. Where fish are landed by size categories, it is necessary to sample all categories and to apply raising procedures that lead to accurate estimates of the total length composition in the catch. For the application of VPA and similar methods, all length or age data must be raised to the total landings. Table 4.11 Examples of stock structure variables Data Type Variables
Age otolith rings; scale rings
Size fish weight; fish length
Sex and maturity sex (based on internal or external characteristics); gonad state
4.3.2.3 Species community structure While no widely accepted multispecies stock assessment techniques exist, resource assessment analyses sometimes include some provision for biological interactions (predation and competition between species) and technical interactions (differential species selection by the gear).
A change in species composition of the exploited community is an indicator of overall health of the ecosystem. Such changes may be interpreted, inter alia, through changes in abundance of ecologically important species (keystone species), overall species diversity and changing mean trophic level.
Information on incidental catches, including those of aquatic birds, reptiles and mammals, which are not retained by the fishers, provides an indication of mortality inflicted on these species not represented in the landings. These data are important for assessing the impact of fishing on the ecosystem as a whole.
Variables and sources
Catches should be recorded separately for each species, or as fine a taxonomic grouping as is practicable. This may be achieved through species composition sampling or complete enumeration where species are separated for the market.
Market grades can still be used, but present some problems in interpretation, depending on how species have been grouped. Where groups represent higher taxonomic units, such as genus or family, some interpretation can be placed on changing relative species frequencies. If grades are limited to groups such as ‘trash fish’, they have very little value in this regard.
Stomach contents may be sampled from fish to obtain indications of interactions between species, but this is not usually done as part of a regular sampling programme. However,

27
observers on fishing vessels are sometimes required to collect information on stomach contents.
Landings and market records will reflect commercial groups, which usually follow taxonomic categories, although maybe not to species level. Observers, logbooks, interviews, and research surveys may be used to provide species composition data. Table 4.12 Examples of species community structure variables Data Type Variables
Species taxonomic groups species names; species in commercial groupings
Species composition catch in numbers and weight by species
Species interactions stomach contents
4.3.2.4 Environment Environmental information to be used in relation to other information on the stock (such as catch and effort) will be important in a number of studies, particularly where there is a direct link with environmental effects and landings, such as with the main upwelling fisheries or inland floodplain fisheries. Important limnological, oceanographic and meteorological data may be used in a range of analyses, including ground-truthing of remotely sensed data.
Although fishing is often a major factor in determining fish abundance, populations will fluctuate whether exploited or not. Natural fluctuations of ecosystems are not fully understood by researchers and therefore fluctuations in stocks cannot be predicted as accurately as desired. To separate the different effects, a long time series of data is needed covering periods of significant change in the variables for both stock size and environmental effects. Depending on the analysis used, at least 15 years data may be required for reliable results.
Variables and sources
A large number of variables could be listed that would give information on the various habitats or ecosystems. General variables include: water level, area flooded and topographical information in riverine and floodplain fisheries; salinity gradients in mangroves and coastal areas; seasonality and gradients in temperature.
Logbooks may contain information on some environmental variables. Many environmental variables are routinely collected by various governmental institutions: topographical maps, satellite images, automatic-recording buoys at sea, etc. Much information on the environment is available through scientific research.
A Vessel Monitoring System (VMS) can be useful for collecting certain environmental data that relate directly to fishing operations. With modern, reliable interfaces between sensors and computers, it will be feasible to collect a variety of environmental data with minimum cost and error. Such data can be collected and stored at smaller time intervals between measurements than crews have time for, and can provide a major source, perhaps partially replacing expensive research platforms.
Many types of environmental information, such as meteorological data, should be collected by other institutions or agencies.
28
Table 4.13 Examples of environmental variables Data Type Variables
Oceanographic / limnological
water temperature profile (at surface/on bottom/at gear); currents (speed and direction); sea state (wave height); sea colour; nitrate concentration; oxygen concentration; PH; salinity
Meteorological rainfall; air temperature; wind (speed and direction); ice formation
4.3.3 Economic indicators A number of measures exist that have been used by various agencies to measure the economic significance of fisheries to the national and local economies and assess performance of fisheries management in achieving economic objectives. The key macro-economic indicators include the gross value of production, the gross value added, the level of subsidies, the level of employment, the balance of trade and foreign exchange earnings. The first four indicators can also be applied at the regional or fishery level. Key microeconomic indicators include the level of resource rent, the economic performance of fishers and changes in the level of investment. These indicators are evaluated at the level of the fishery or the individual fleet segments within a fishery.
Policy-makers also need to be aware of changes in the level of consumer demand in the economy. Changes in demand will affect the prices received by fishers (although the final consumer does not generally purchase from the fisher), having an impact on their performance and the value of the fishery to the broader community.
The economic performance of the fish processing sector may also be important in some countries. The continued existence of some fisheries may depend on a viable processing industry. Measures similar to those used for assessing the harvesting sector may also be applied to the processing sector.
4.3.3.1 Market prices Market prices at the various market levels are short and medium term indicators of the demand for fish products. They signal changes in markets and, if properly interpreted, provide hints to the future commercial operations of the sector. Prices are also necessary for the calculation of many other economic indicators.
Analyses of factors affecting prices are important when formulating fisheries policies. For many fish species, their price is a function of a number of factors, including landings, and the landings of other species that may be close substitutes in the market. Management policies that change the mix of landings [such as Total Allowable Catch (TAC) for particular species] will change prices, and therefore the total revenue and profitability of the sector.
The responsiveness of price to changes in quantity landed is a useful measure when looking at the implications of management controls that affect landings. The price response to supply can be estimated from prices received and quantity landed for the domestic and/or export markets. However, this relationship may be dependent on additional factors, such as prices of competing food items and the level of imports. All market variables may also be affected by other macroeconomic variables, such as inflation or the exchange rate, so use of price data in this way may require a good understanding of the economy as a whole.
Prices based on market structures can be useful in policy formulation. Significant differences in prices between regional markets could indicate barriers to entry (e.g. lack of transport facilities). Similarly, large differences between prices paid to fishers and prices paid by consumers could indicate market imperfections (e.g. collusion by buyers). Once identified, these problems may be addressed through changes in policy.

29
Variables and sources
Local, national and regional market prices should be collected by the appropriate government agencies. Information at the level of international markets may be collected through the various FAO services concentrated in Globefish and on the Internet. Table 4.14 Examples of market price variables Data Type Variables
Price of products price by species (or species group), market grade, market level (harvest, processor, wholesale, retail; local, national, regional, international)
4.3.3.2 Gross value of production (GVP) and of processed products The gross value of production (GVP) is determined by multiplying total production by the price received. GVP provides an indication of the potential economic importance of a fishery relative to other fisheries or other industries in a nation or province. However, increasing GVP could represent either a worsening or improving long-term state of the fishery. To account for this, the change in the value of the remaining biomass of the stock could be deducted (or added in the case of a stock increase) from the calculated GVP.
Gross value of production can be broken down into the gross value of processed products. This provides information on the level of economic activity of the fisheries processing sub-sector with respect to the other fisheries subsectors and the rest of the food processing sector. It is the result of multiplying the value of each respective type of product by the volume produced in a given time.
Variables and sources
For the harvest sector, information on volume and value of production can be obtained from landing sites (e.g. landing sales slips, logbooks). The volume of final production of the industry can be obtained from sales and production records. Other data may be obtained from diverse sources depending on each particular situation, including post-harvest facilities, national statistical authorities and customs records. Table 4.15 Examples of GVP variables Data Type Variables
Production landed weight by product type; processed weight by product type
Prices and unit values value of output by product type
4.3.3.3 Costs and earnings Profitability is a vital micro-economic indicator of fishery performance. Improving the incomes of fishers is often an important fisheries objective. Information on boat profitability provides a measure of performance in achieving this objective, as well as providing an indication of economic sustainability. The same indicator can be derived for the processing sector. However, with harvesting and processing becoming more integrated, it may not always be possible to fully separate these sectors. To remain viable in the short-term, fishers, processors and others must be able to cover all of their cash costs. Hence, a measure of financial profitability of different vessels and facilities provides an indication of short-term sustainability. To stay in the fishery in the longer term, operators need to meet all costs and therefore economic profitability is the more appropriate measure. This includes the non-cash costs such as the value of their own labour, and the depreciation of capital. In addition, they must achieve a return on the investment, which is at least as much as that which could be earned elsewhere in the economy. Otherwise, new investment will tend to be diverted to other sectors, which are expected to yield a higher return. In the short term, however, the
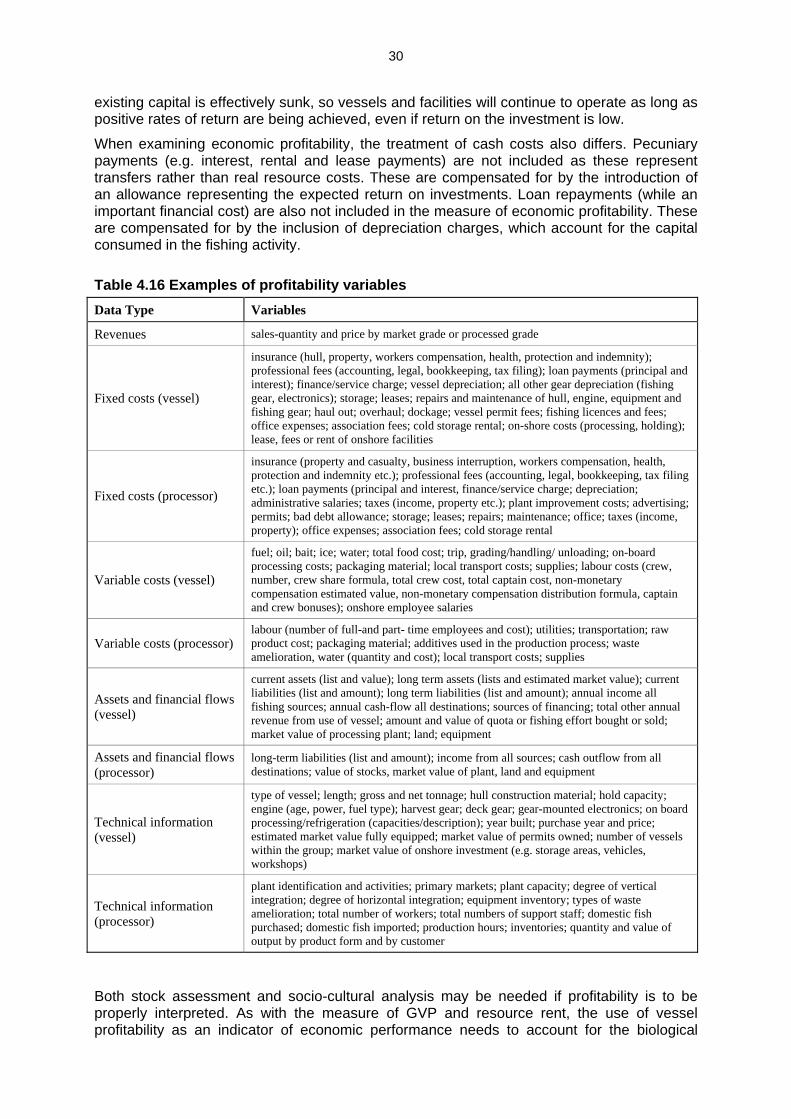
30
existing capital is effectively sunk, so vessels and facilities will continue to operate as long as positive rates of return are being achieved, even if return on the investment is low.
When examining economic profitability, the treatment of cash costs also differs. Pecuniary payments (e.g. interest, rental and lease payments) are not included as these represent transfers rather than real resource costs. These are compensated for by the introduction of an allowance representing the expected return on investments. Loan repayments (while an important financial cost) are also not included in the measure of economic profitability. These are compensated for by the inclusion of depreciation charges, which account for the capital consumed in the fishing activity. Table 4.16 Examples of profitability variables Data Type Variables
Revenues sales-quantity and price by market grade or processed grade
Fixed costs (vessel)
insurance (hull, property, workers compensation, health, protection and indemnity); professional fees (accounting, legal, bookkeeping, tax filing); loan payments (principal and interest); finance/service charge; vessel depreciation; all other gear depreciation (fishing gear, electronics); storage; leases; repairs and maintenance of hull, engine, equipment and fishing gear; haul out; overhaul; dockage; vessel permit fees; fishing licences and fees; office expenses; association fees; cold storage rental; on-shore costs (processing, holding); lease, fees or rent of onshore facilities
Fixed costs (processor)
insurance (property and casualty, business interruption, workers compensation, health, protection and indemnity etc.); professional fees (accounting, legal, bookkeeping, tax filing etc.); loan payments (principal and interest, finance/service charge; depreciation; administrative salaries; taxes (income, property etc.); plant improvement costs; advertising; permits; bad debt allowance; storage; leases; repairs; maintenance; office; taxes (income, property); office expenses; association fees; cold storage rental
Variable costs (vessel)
fuel; oil; bait; ice; water; total food cost; trip, grading/handling/ unloading; on-board processing costs; packaging material; local transport costs; supplies; labour costs (crew, number, crew share formula, total crew cost, total captain cost, non-monetary compensation estimated value, non-monetary compensation distribution formula, captain and crew bonuses); onshore employee salaries
Variable costs (processor) labour (number of full-and part- time employees and cost); utilities; transportation; raw product cost; packaging material; additives used in the production process; waste amelioration, water (quantity and cost); local transport costs; supplies
Assets and financial flows (vessel)
current assets (list and value); long term assets (lists and estimated market value); current liabilities (list and amount); long term liabilities (list and amount); annual income all fishing sources; annual cash-flow all destinations; sources of financing; total other annual revenue from use of vessel; amount and value of quota or fishing effort bought or sold; market value of processing plant; land; equipment
Assets and financial flows (processor)
long-term liabilities (list and amount); income from all sources; cash outflow from all destinations; value of stocks, market value of plant, land and equipment
Technical information (vessel)
type of vessel; length; gross and net tonnage; hull construction material; hold capacity; engine (age, power, fuel type); harvest gear; deck gear; gear-mounted electronics; on board processing/refrigeration (capacities/description); year built; purchase year and price; estimated market value fully equipped; market value of permits owned; number of vessels within the group; market value of onshore investment (e.g. storage areas, vehicles, workshops)
Technical information (processor)
plant identification and activities; primary markets; plant capacity; degree of vertical integration; degree of horizontal integration; equipment inventory; types of waste amelioration; total number of workers; total numbers of support staff; domestic fish purchased; domestic fish imported; production hours; inventories; quantity and value of output by product form and by customer
Both stock assessment and socio-cultural analysis may be needed if profitability is to be properly interpreted. As with the measure of GVP and resource rent, the use of vessel profitability as an indicator of economic performance needs to account for the biological

31
status of the stock. Similarly, monetary profits may be distorted by socio-cultural factors. For example, in fisheries where crew and captain are kin, some cash costs may be deferred longer than would usually be expected.
Variables and sources
The main information sources are the harvesting (individual fishers) and processing sectors. However, support industries, such as fuel and fishing gear suppliers, may provide useful cost data. Many of these variables are also necessary for calculating other indicators that use costs of production (see 4.3.3.6 gross value added (GVA) and 4.3.3.8 resource rent and economic profits).
4.3.3.4 Investment The amount of investment is one of the best indicators of changes in fishing and processing capacity. Investment can involve upgrades of existing operational capacity or acquisition of new capacity, in the harvesting, processing or marketing sectors. Each type of investment has different implications for fisheries management. Given the state of exploitation of world resources and the need for sustainability, investment in fishing fleets is of special concern to government.
Variables and sources
Official registration of investments in the Ministry of Finance (or similar authorities) should be the main source of data. Secondary sources include secondary support sectors, such as fishing gear suppliers and manufacturers, and the vessel registration system. Table 4.17 Examples of investment variables Data Type Variables
Financial investment investment by sector, type of economic unit, origin and destination
Existing incentives financial return/profitability by fishery and fleet segment
4.3.3.5 Management costs Management costs are government and industry expenses related to the administration and monitoring of the fishery. Different types of policies and management plans imply different needs for staff, material, and other funding for research, implementation, monitoring, enforcement, etc. As more costly policies and regulations are implemented, the benefits to be gained through use of those policies or regulations are dissipated. Thus it is important to track management costs being incurred. As well as being evaluated using their own trends, management costs are necessary for other indicators, such as economic rent.
Variables and sources
The primary data source is the fisheries administration, with other costs being inferred from industry data, such as employment. Table 4.18 Examples of management cost variables Data Type Variables
Costs to government surveillance costs; enforcement costs; training costs; administration costs; scientific research cost
Costs to industry administration costs

32
4.3.3.6 Gross value added Gross value added (GVA) is the total amount paid as returns or rent to labour and capital (and theoretically to the resource base as well, although this rarely occurs without property rights). GVA provides a measure of the increase in income after the costs of intermediate inputs into the production have been deducted except capital depreciation. It builds on gross value of production (GVP) by including all costs except labour and capital. It represents the contribution or value added to the economy by the fisheries sector.
GVA provides a measure of the economic importance of the sector in the national economy in relative terms. Depending on the coverage and the methodology used, it indicates the wealth generated by the sector in comparison with other sectors, as well as the wealth distribution among factors of production.
In many countries, the GVA is estimated by central specialised government agencies as a part of the Agricultural Gross Product (AGP), which is incorporated in Gross Domestic Product (GDP). Where GVA is measured separately, it is generally only identified for the harvesting sector. The value added by the processing and marketing sector, while also incorporated in the national GDP, is usually not readily identifiable as a separate measure. Many countries are attempting to improve estimation of GVA, as it is one of the best indicators of performance. It is very much in the interest of the fisheries sector as a whole to participate in its preparation.
Variables and sources
At present in many countries, the GVA and many of its component rents have to be extracted from raw data used to calculate agricultural GDP or estimated on an exclusive basis from cost and earnings data. Other data, such as licensing and fee information, will be available from the fisheries administration. Data on subsidies may be available in the economic government ministries and/or in the fisheries administration. Table 4.19 Examples of value added variables (also see Table 4.16) Data Type Variables
Harvesting / processing revenue value of output, prices, quantities of product, landings weight
Costs of harvesting fuel, ice, salt, bait, repairs, maintenance, insurance
Costs of processing cost of raw product, fuel, electricity, power and water, packaging, shipment
4.3.3.7 Subsidies Subsidies have been used in many countries to assist in the development of the fisheries sector. However, they have also resulted in negative effects such as over-capitalisation and overexploitation of fishery resources. Identification and evaluation of the various types of subsidies in use in a nation’s fisheries should support the policy formulation process.
The costs of fisheries management, if not borne by the fishing industry, may also be considered a subsidy to the sector. To evaluate this, both management costs and government revenue raised from the fishing sector need to be estimated. Table 4.20 Examples of subsidy variables Data Type Variables
Subsidies fuel rebates; financial reimbursements; vessel buyback programmes; import tariffs; export subsidies; low credit rates
Government revenue income tax on fishers; import duty on fishing gear; tax on fish products; licence fees
Government costs see Table 4.18

33
Variables and sources
These data should be available from the government economic ministries and/or the fisheries administration.
4.3.3.8 Resource rent and economic profits Of particular interest to economists is resource rent, which is measured at the level of the individual fishery. Resource rent is the returns to the capital inputs provided by the resource itself. If the resource is not owned, these returns tend to be dissipated as a result of overexploitation. Fisheries management generates resource rent by restricting the level of fishing activity. The generation of resource rent is the main economic objective of management and represents the revenue that could be extracted from the fishery in return for the use of a community resource. However, the amount of rent extracted is a policy issue for individual governments to decide.
Therefore, rent-related indicators provide sound information for fisheries planning, policy formulation and management. The level of rent generated in a fishery relative to the maximum long-run level of rent that could be achieved is an appropriate indicator of the economic performance of fisheries management.
The potential level of resource rent in a fishery can be estimated using bio-economic models (based on stock assessments, cost and earnings data). Although initial set-up of cost and earnings studies may be expensive, subsequent updates are much less costly.
Economic profits, often used as an alternative to rent in measuring economic performance, are the difference between revenues and all costs (including opportunity costs) involved in the fishery operation. However, economic profits include both resource rent and producer surplus (effectively the returns to the skill and management of the individual fishers). Separating out these two components is generally difficult. However, it is generally accepted that changes in economic profits are indicative of changes in resource rent in a fishery. Estimates of gross economic profits can be derived from deducting subsidies, management, labour and capital costs (including opportunity costs) from the Gross Value Added.
An alternative, inexpensive indication of the level of resource rent in a fishery is the licence or quota value. These can only exist where there are a limited number of licences or quotas, which can be freely sold. While the relationship between licence or quota value and the level of rent in a fishery is not certain, these values can be expected to vary with expectations of future levels of profitability. Consequently a change in the fishery that is expected to result in increased or decreased future profits will cause these values also to change, reflecting this expectation. Licence and quota values may be affected by factors other than resource rent, such as subsidies and taxes and imperfections in the licence or quota market. Where this applies, their usefulness as indicators of economic performance can be limited.
Variables and sources
Economic rent combines the same variables as a number of other indicators, namely vessel/processor profitability, subsidies, management costs, prices and GVP. It therefore uses the same variables and sources. Where it has been decided to use licence or quota values, the fisheries administration should register transactions, and therefore be able to provide prices.
To assess the opportunity cost of labour, it may be necessary to collect information on wages and employment opportunities outside the fishing industry and the level of unemployment in the region. In countries and regions where unemployment is relatively low (e.g. unemployment rate of 5% or lower), crew payments may be an adequate reflection of the opportunity cost of labour. Average crew incomes are often higher than wages of workers in other industries having comparable levels of education and skill because of the usual risks and hardships of the fishing occupation.

34
Where relatively high rates of unemployment exist, the opportunities for productive employment of fishermen in other occupations might be very limited, especially in developing countries. Consequently, in these situations the opportunity cost of labour is likely to be very low but always greater than zero. A zero opportunity wage would imply that time is valueless; this assumption is usually not appropriate because many unemployed persons are in fact engaged in some productive activity such child care, home improvements and others; even where there is no productive activity, the assumption of a zero opportunity wage might be inappropriate because leisure itself is a valued activity. The cost of capital includes economic depreciation and the opportunity cost of capital. Depreciation is a non-cash cost representing the wear and tear associated with using the capital asset, and is based on the decline in value of the asset over time. The opportunity cost of capital is the return that the investment could have earned if it had been invested in the next best industry of equivalent risk elsewhere in the economy. A low risk measure may be the return on government bonds while a range of return rates for different levels of risk may be derived from the stock market. For the fish harvesting sector, an appropriate comparison may be the rates of return from equivalent investment in agriculture. Table 4.21 Examples of economic rent variables (also see Table 4.16) Data Type Variables
Production landed weight by product type; processed weight by product type
Prices and unit values value of output by product type
Harvesting costs fuel; ice; salt; bait; repair; maintenance; insurance
Processing costs unprocessed product; power; water; packaging; shipment
Opportunity costs interest rates; rates of return on capital in other sectors; wage rates in alternative employment; unemployment rates
Subsidy and management costs subsidies; administration; MCS (see Tables 4.18 and 4.20)
Licence or quota values licence prices; quota prices; number of licences by type; number and size of quotas by type; number and price of processing licences by type; income from auctions of fishing rights; income from special fishing agreements (supply contracts and leasing to foreign countries)
4.3.3.9 Domestic food supply and fish consumption Fish supply to the country and trends in average per capita consumption give an assessment of consumer dependence on fish as a food source at different national, regional and demographic levels. This is very useful in the formulation of policies on fish trade and ensuring food security. Table 4.22 Examples of per capita food supply variables Data Type Variables
Landings quantity by use (food, non-food)
Fishery imports & exports quantity by use (food, non-food)
Conversion factors ratio of weight of fish product to weight of protein by product and species
National population numbers of people; fish consumption; average food consumption by food type
Variables and sources
Data originate from the harvesting, processing and marketing sectors. At the national level, fisheries administrations and ministries of the economy should participate in the collection

35
and compilation of these data. At the international level data are received, compiled and published by FAO.
4.3.3.10 Employment level in the fisheries sector It is useful in setting policy to know the relative importance of the fishery sector as a source of employment. The number of people employed in fishing, processing and marketing can provide information on the importance of these sectors to the regional and national economy. The indicator needs to take into account a range of factors affecting employment in the fishery sector. An overexploited fishery may well have a higher level of employment than a well-managed fishery. Similarly, falls in employment may be due to falling catches as a result of overexploitation in previous years, management policies designed to reduce effort to improve the longer-term status of the fishery, or improvements in the regional economy attracting labour away from fishing into other enterprises.
Variables and sources
Information on employment may be obtained through census, surveys and in some cases by sampling from the harvesting, processing and marketing sectors. These data are often collected by central government offices and fisheries administrations. Table 4.23 Examples of employment variables Data Type Variables
Number of persons employed in fishery
employees by primary, secondary and tertiary sectors, and by age, sex and job category (fishers, crew, plant workers, intermediaries, transport, services etc), time spent in occupation
Employment in non-fisheries industries employees in primary, secondary and tertiary sectors, and by job category, age and sex
Unemployment unemployment nationally by region, and within the fishing community
4.3.3.11 Balance of trade of fish and fishery products Balance of trade reflects the difference between the value of imports and the value of exports of fish and fish products. It shows foreign currency earnings and losses as a result of international fish trade. In addition, the participation, structure and current trends of the national fisheries sector in relation to the international trade position can be analysed. The identification of relevant information in the preliminary analysis of this indicator could lead to a detailed study of the fish trade and eventually to the formulation of trade policies.
Variables and sources
Information on fish imports and exports value and volume may be obtained from the responsible national financial authority monitoring international trade. Information on foreign trade of fisheries products is also compiled by FAO and OECD based on statistics provided by individual countries, and by the UN Statistical Office. Table 4.24 Examples of balance of trade variables Data Type Variables
Volume of trade quantity exported by product type; quantity imported by product type
Value of trade value exported by product type; value imported by product type
4.3.3.12 Net foreign currency position of the fisheries sector The net change in foreign currency reserves as the result of fishing sector activities can be compared with other sectors to determine the importance of fishing in maintaining foreign

36
currency reserves and exchange rates. The indicator includes the gain (if any) of foreign currency from exports of fisheries products less the loss in foreign currency from the imports used in fisheries production.
Additional related indicators are the proportion of GVP that is exported and the proportion of total costs in the harvesting and processing sectors that result from the use of imports. These are used to provide an indication of the sensitivity of overall profitability to exchange rates.
Variables and sources
Import and export data are usually obtained from the responsible national financial authority monitoring international trade. Cost data can be obtained from the harvesting and processing sectors. Table 4.25 Examples of foreign currency position variables Data Type Variables
Export values value by fish product
Costs costs of inputs imported by sector; total sector costs
4.3.4 Socio-cultural indicators Socio-cultural indicators are critical for evaluating policies and management activities, as they measure the value of fisheries beyond their simple economic worth. However, routine data collection for socio-cultural indicators has often been neglected, reliance being placed on ad hoc political procedures which aim to represent socio-cultural views. In practice, these will not replace objective assessments of performance, and socio-cultural data should be collected routinely alongside biological and economic information.
Many socio-cultural issues may be assessed using performance indicators. These indicators tend to concentrate on issues of equity and social value, where fishing contributes to society in ways that otherwise are difficult to assess. However, in contrast with biological and economic indicators, targets and limits are not necessarily well defined (e.g. through mathematical formulations) or widely accepted, so appropriate targets and limits will depend on local fishery policies and traditions.
4.3.4.1 Distribution of fishing income The distribution of income is a measure of equity within fishing communities, and between fishing communities and the wider society. Using economic data on fishing income broken down by socio-cultural categories can tell managers if one sub-group is advantaged over another and whether particular management measures have greater impact on any one part of the community. In conjunction with measures of overall income, income distribution can also address dependency on fishing compared to other activities and indicate how well fishers may be doing relative to average national incomes. Table 4.26 Examples of income distribution variables Data Type Variables
Earnings earnings for each crew member (e.g. catch value added, share system or wage rates); earnings for each fishing household (through fishing, fishing-related and other jobs);
Demographic data number of members in each household; age; sex; ethnicity; target fishery or fisheries; community of residence

37
Variables and sources
Data are usually obtained from interviews with workers and industry records in the harvest and market sectors, and interviews in the fishing communities. Government agencies should also have relevant demographic data from national surveys.
4.3.4.2 Distribution of fish consumption Distribution of fish consumption is a measure of food security and of social stability within fishing communities. In combination with national average per capita measures, this indicator enables policy makers to assess food security with respect to fish supply, not only of the nation as a whole, but also of vulnerable sub-groups such as mothers, children, the elderly and the poor. In combination with catch and species composition data, it can indicate which species and sizes are of critical importance to those vulnerable groups.
Variables and sources
To measure per capita consumption as distributed across important sub-groups, critical variables are landings and consumption by species, as distributed by demographic variables and geographic region. Other more general household data, such as household budgets and food consumption, may be required for the elaboration of appropriate reference points. In addition, in many cultures it is important to share and distribute the fruits of one’s fishing or farming labours amongst kin or neighbours. This distribution of food or income from harvested products is a vital underpinning of the social structure as well as a traditional way of assuring food for those unable to acquire it themselves due to age or infirmity. There may also be ritual or religious requirements for eating particular fish species on certain occasions.
Household and community data from the harvest sector and (for non-fishing households) from government agencies. Table 4.27 Examples of distribution of fish consumption variables Data Type Variables
Landings quantity by use (food, non-food).
Fishery imports and exports quantity by use (food, non-food)
Nutrient conversion factors weight of fish product to grams of protein, by product type and species
National population numbers of people by region, community, fleet, and demographic variables (age, ethnicity etc.)
Food sharing patterns cultural rules for food distribution in general; specific foods required for ritual use
4.3.4.3 Nature of access to the fishery To assess fisheries governance, the nature of access to the fishery and degree of local involvement in management must be addressed by fishery management plans. An indicator of the nature of access can be used to measure the degree of co-management and the level of trust between fishers and managers. Combined with indicators of effort, stock status and capitalisation, such information may be used to assess changes in catch and effort, and to estimate the likelihood of compliance with alternative controls.
A new fishery management plan will need to consider the current management system. To do this, data are needed to document and assess current systems, identifying strengths and weaknesses and proposing practical solutions to problems.
Variables and sources
Critical variables fall into four types:

38
• details of the institutional arrangements, both formal and informal, which govern access to and use of the resource;
• rules for membership in particular institutions based on demographic characteristics or community of residence;
• conflicts between competing systems (e.g. a formal and an informal system in place at the same location) or caused by the nature of the access (e.g. gear conflicts due to a proliferation of vessels under open access);
• degree of incorporation of local knowledge. Institutions covered include government fisheries departments, fishers’ co-operatives and councils. The nature of the access may range from open access through to individual property rights in shares of the resource.
Data are needed on the institutions and procedures (both formal and informal) for fisheries management, links between local and national management and types and extent of local involvement. For example, some measure is needed of the strength of local institutions (e.g. co-operatives, tribal councils or fishers’ associations) involvement in resource management, or in dealing with the market and negotiating with other stakeholders. Similarly assessments may be required of the role of customary local management regimes in determining management plans, what local self-monitoring organisations exist and the degree to which fishers’ biological and ecological knowledge have been incorporated into scientific assessments.
The full procedure for making management decisions should be documented. Decisions may be influenced, for example, by current legislation and Ministers with different policy objectives, as well as by technical advice. In general, whatever organisations and people are involved, and the stages at which they have input into the decision-making process, need to be recorded. It is also important to assess logistical factors which may affect decision-making, such as the location of fisheries offices and the distance an average fisher has to travel to visit the office or attend meetings.
Data sources are mainly from harvest and community sectors, as well as the government fisheries agency itself. Table 4.28 Examples of nature of access variables Data Type Variables
Institutions controlling access type; jurisdiction; location; nature of access granted
Rules for membership rules for each institution
Conflicts and co-operation relations between institutions; relations within institutions
Incorporation of local knowledge procedures for incorporation local beliefs; types of data incorporated
4.3.4.4 Demographics and fishing patterns in the harvesting sector Fisher demographics and fishing pattern indicators can be used in assessing equity, dependence on fishing and fisher responses to changes in the fishery. Data, such as household size, income, experience and sources of financing, suggest the extent of dependency on the resource. Demographic data help to place fishers in relation to the rest of the population, and to indicate whether fishers could acquire non-fishing employment should that become necessary or desirable. With information on stock status and the nature of access, these indicators can assist managers in predicting future entry or exit and increases or decreases in effort in particular fisheries. Together with data on institutions and their membership rules, patterns of ownership or access can be tracked, which may be useful where management is particularly concerned with the viability of small-scale owner-operators and the development of property rights. Fishers' preferences for, or experience of, different kinds of fishing will influence their response to policies and regulations.

39
Variables and sources
Variables have to be measured separately for each fishery. Data are usually obtained from the harvest sector and fishing communities. Table 4.29 Examples of fisher demographic and fishing pattern variables Data Type Variables
Fishing practices fisheries engaged in by season, gear type, target species, fishing area (also see Table 4.6)
Fishers demographic data age; ethnicity; community of residence; years of fishing experience; crew status
Vessel characteristics length; gross tonnage; horsepower; on-board electronics (also see Table 4.6)
Crew composition numbers of crew; job descriptions; basis for crew selection; other job skills besides fishing
Decision-making crew selection; market choice; fishing behaviour; payment systems
4.3.4.5 Demographics and employment patterns in the processing and marketing sectors
Processor, marketing and support industry demographics and employment patterns can be used as an additional measure of the community dependence on fisheries. In conjunction with balance of trade indicators, the impacts of changes in domestic harvest on the processing sector at the community level can be assessed.
Market characteristics also provide an indicator of potential market reactions to changes in the fishery. Critical variables concern the behaviour of intermediaries in the distribution chain between harvesting and consumption (excluding processing), as well as the economic contribution of the market sector. Of particular concern is the freedom with which markets operate. This depends upon how decisions are made regarding transactions. For example, transactions may be based on kin relationships or agreements providing credit to fishers, which may affect prices (see section 4.3.3.1).
Variables and sources
Data sources include the harvest, processing and market sectors, as well as government agencies. Table 4.30 Examples of processor, marketing and support industry demographic and employment patterns variables Data Type Variables
Employment patterns number of employees hired by season and job category
Employee demographic data age; ethnicity; community of residence; migrant or local resident
Facility characteristics market or plant location; products processed by volume and value
Decision-making employee hiring; choice of vessels to buy from; choice of other marketers or processors to sell to
4.3.4.6 Community dependence Community dependence on fisheries is an indicator of economic and socio-cultural connections and constraints in the fishery. It may include food security considerations. This indicator can be used with other operational and economic indicators to explain economic migration into and out of the fishery. Socio-cultural dependence on fishing (i.e. the way fishing is incorporated in songs, festivals etc.) gives some measure of its non-financial value to the community.

40
As community dependence considers links between the components of a fishery, it is often complex and may require consideration of a wide number of variables. For example, impacts on fishing, its dependent industries or infrastructure, may constrain development of the whole sector. So, if roads are poor or local distributors lack transport to take their catch to market, then other incentives for increasing catch will not translate into more food for other regions or more money to local communities.
Variables and sources Table 4.31 Examples of community dependence variables Data Type Variables
Employment number of community members engaged in fishing and related industries
Fishery components
numbers of fishers, households dependent on fishing for food and/or income, boats, processing plants, wholesalers, retailers, and fishery dependent industries (e.g. marinas, bait/tackle shops, chandlers, fuel suppliers); infrastructure components (e.g. transport, communications); government and non-government institutions influencing the fishery
Income and fish consumption percentage dependence on fish for food; percentage dependence on fishing and fishing-related industries for income by household and fleet
Historic and cultural capital length of association of the community with fishing activities; festivals; statues; community organisations associated with fishing; other forms of fishing symbolism
Cosmology cultural requirements for particular fish products; taboos for closed areas, periods or species; other specific beliefs and/or taboos related to fishing in general or specific types of fishing
It is particularly important to develop a good understanding of cultural and religious beliefs that may affect fishing behaviour. Certain days, seasons or moon phases may impose periods of rest, creating automatic closures. Holidays may involve the preparation of specific fish or other marine resources as a central item of a feast, thus creating strong market demand for those species at those times. Taboos may inhibit the local development of a particular fishery, despite high global market demand. Regulations that contradict or attempt to circumvent these local beliefs and practices are likely to meet with significant resistance. On the other hand, regulations that seek to build on and extend these practices are much more likely to be successful. It is critical, therefore, to research these beliefs and find those which have the potential to move the fishery in a desired direction.
Government institutions specifically devoted to fishing should be documented, along with any other organisations, which have an influence on the fishery. For example, there may be government credit associations that give loans for farming and fishing equipment. The town council or council of elders or other such body may have authority to open and close fallow agricultural areas and marine reserves. A local agency may require boat licences. Church or school groups may become the nexus for organising lobbying activities related to fishery regulations, or they may be vital networks for supporting wives of fishers who make long trips. Access to certain fisheries or gears may be governed by tribal affiliation or community membership.
Data are usually obtained from fishing communities, fishers, fisheries agencies and relevant government agencies.
4.3.4.7 Social status of fishing The social status of fishers and perceptions of fishing as an occupation influences the likelihood of entry into and exit from the fishery. It is usually coupled with vessel, fleet, and post-harvest facility profitability.

41
Variables and sources
Critical variables can be grouped as those tied to the level of financial remuneration available from the fishery and those tied to cultural values. For the former, critical variables are fishing sector incomes and incomes from other sectors. For the latter, the important variables are more numerous. For example, the level of prestige associated with fishing as an occupation, influences whether fisheries attract new employment. Fishers may believe their way of life retains core values and have strong views on how the fisheries management system affects their ability to continue in their way of life. The level of fisher household involvement in community institutions and organisations as opposed to fisher-dominated institutions and organisations (the degree to which fishers are embedded within the larger culture) gives an indication of how isolated the fishing community is.
The views of the society as a whole regarding fishing are an important element to examine. Fishing may be considered the employment of last resort or traditionally involve activities or materials that are considered taboo or impure by many in the larger population. It may have suffered from global campaigns against overfishing, some of which depict fishers as pillagers of the ocean, or may be seen as a noble and courageous activity, pitting humans against nature in a fight to wrest food from the sea. The general image of fishers, coupled with the average wage from fishing versus other common jobs, will have a strong impact on efforts to either increase or decrease fishing activities.
Data are usually obtained from fishers, fishing communities, government agencies, fisheries agencies. Table 4.32 Examples of fisher social status variables Data Type Variables
Financial remuneration fishing sector incomes; other sector incomes; likelihood of fishers acquiring other sector jobs given their education and skills
Cultural values relative prestige of fishing versus other occupations; degree to which fishing retains a desired lifestyle (e.g., independence, risk); whether fishers would encourage their children into the fishing industry; whether young people seriously consider employment in fishing; institutions and organisations to which fishers belong
42
5. DATA COLLECTION STRATEGY
Before looking at the details of the data collection methods, an overall strategy is required. The way in which different data variables are collected needs to be tailored to the structure of the fishery. A key element in design is the degree to which fishers and others co-operate, an issue which is most effectively addressed by using a co-management approach. Designers must choose which variables need to be collected through complete enumeration and which should be sampled. Complete enumeration is expensive for many variables, but must be carried out for some if totals (e.g. total catch) are to be estimated for the fishery. Sampling is more cost effective, but care is required in designing the distribution of sampling effort in time and space. Finally, the strategy will be strongly influenced by the budget and personnel available.
5.1 INTRODUCTION Strategies for the design of data collection programmes will vary between fisheries. Within a state or region, there almost always will be a mixture of industrial, small scale commercial, artisanal, subsistence and recreational fisheries. Each will have its own characteristics, its own relative importance and its own potential for the supply of data. In addition, some information must be obtained from external sources, such as international market data, or catch data from foreign fishing vessels that never visit state ports.
Each fishery will require its own strategy with elements of complete enumeration and sampling. Over time some aspects of a data collection strategy may move from complete enumeration to sampling (or vice versa), particularly as knowledge is developed and requirements or resources change. Sampling strategies are often punctuated by complete enumeration from time to time in order to re-evaluate baseline data.
It is not feasible to construct a perfect strategy for any one fishery or subsector that will meet all requirements for all time. Flexibility and the adoption of alternative approaches must form a key component of any strategy, whether it is designed for assessment of fish stocks, the evaluation of markets or the assessment of community dependence on fisheries.
In general, however, any strategy will require the following steps: • evaluate existing data sets in relation to the objectives of the programme, including
accessibility of the data (i.e. computerised, on paper); • describe the operating characteristics of the sector or subsector (e.g. fishery, market,
fleet, community, institutional environment), also known as the census or frame survey; • decide on the approach to be taken: complete enumeration or sampling, including cost-
benefit and cost effectiveness analysis and an evaluation of operational considerations (institutional, financial and human resources);
• design methods according to the approach adopted, including the form of stratification to be used in sampling;
• implement a test phase to validate the method, including participation by other stakeholders;
• establish a continuing feedback mechanism between data sources and data users to ensure that data types, quantity, quality and origin are consistent with the requirements for determination of the performance indicator in question.
5.2 INFORMATION REQUIREMENTS FOR SYSTEM DESIGN Infrastructure information is essential for constructing frames for a data collection programme. The first step is to define the water bodies and areas that will be included, and prepare a description of the fishing industry operating within them (ports and landing places,

43
fishing fleets, fishers, markets and transportation routes etc.). Such information serves to provide a detailed classification and description of the structure of the primary fishery sector, and is essential for establishing a proper collection scheme for all fishery data. Many of these institutional data are also required for socio-cultural analyses.
Essential infrastructure and personnel information required for this purpose include: • existing ports and landing places, their locations, patterns of distribution and
accessibility; • numbers of fishing units and information on their composition such as fishing gears,
fishers, fishing craft, and their geographical distributions in relation to home ports and landing places;
• fishing activity and landing patterns including their geographical, seasonal and diurnal distributions, and some information on the extent to which different units and vessels switch between fisheries. In order to do this, some working definition of a fishery needs to be adopted (see below);
• supply centres for capital goods, essential material and services (e.g. fishing gears and their components, fuel oil, engine parts, vessel repairs, navigation equipment, ice);
• fish distribution routes, fish utilisation, fish processing and marketing practices, fish trade, local consumption, number of processors and marketing units.
The description of the fisheries infrastructure and personnel in terms of its main units is sometimes called a frame survey. Where possible, the survey should draw upon information available from scattered sources including vessel registers, harbour radio logs, ports, market sales, transport and other administrative records, fishing population censuses, maps, fishing charts and other information.
A routine data collection programme should be preceded by a pilot programme. This is limited in time and space, with the main purpose of familiarising the designers with fishery conditions. It can be used to test alternative procedures and different sources for data collection, although collection of data is not the purpose of a pilot programme. Generally, a pilot survey is of much wider scope than the final frame survey and can contain a large variety of data types related to other important indicators of the fishing industry. For example, as well as infrastructure and fleet characteristics, surveys might record normal vessel activity data by season or fishers opinions on what are the critical factors in the fishery. Some of these data can be very useful for survey planning purposes. At the same time, these parameters can provide indications as to which of these schemes would seem more suitable from both methodological and operational standpoints.
5.3 CO-MANAGEMENT AND SYSTEM DESIGN Management measures are more likely to be compatible with community values and to create a greater commitment to the system if the users and managers are both involved in the formulation of policy and fishing regulations. This, in turn, should result in greater compliance and lower enforcement costs. Social science studies of local common property management systems, for example, have shown that local fishing communities are more willing to engage in self and mutual monitoring where they have helped to formulate and support regulations. This reduces the need for expensive government supervision. This type of participatory management is often referred to as “co-management”.
There are many types of co-management, which may integrate data collection. Fishers and scientists may conduct joint experiments, or meet in joint councils where information can be used to co-operatively plan management actions. Public meetings may be held to inform local community members of proposed management measures and solicit input and opinions. The possible arrangements are endless; the exact format must depend on the particular situation, including the current political organisation.

44
5.4 COMPLETE ENUMERATION AND SAMPLING
5.4.1 Definitions Data collection is the recording of one or more data variables (length, duration, etc.) from members of a population of “data-units” (the population of fishing vessels, fishing trips, etc.). Two basic data collection approaches are possible: • by complete enumeration, where all members of the whole population are measured; • by sampling, where only a proportion of members of the whole population are
measured. Fisheries data usually collected by complete enumeration include vessel registers and infrastructure data. Data sometimes collected by complete enumeration and sometimes by sample surveys include catch per unit effort, price per kilogram and costs and earnings of fishing units. Data usually collected by the sample-based approach include species composition and biological data (e.g. size frequency data). A complete enumeration may well refer to a sub-set, for example, one may make a complete enumeration of all vessels longer than 10 metres.
5.4.2 Deciding between complete enumeration and sampling Both complete enumeration and sample-based approaches have as their objective the collection of data for a specified period, often over a calendar month, to determine some statistic of interest. For example, a total enumeration approach could be used to calculate the total catch where all landings were monitored. An example sample-based approach to estimate total catch would use the mean catch per fishing day from a landings sample and the mean number of fishing days per vessel from a vessel sample, which multiplied together give the mean catch per vessel. The total catch can then be obtained by multiplying this by the total number of vessels (a raising factor) obtained from a frame survey or vessel register. The applicability of either sampling or complete enumeration is determined by various criteria related to the type of data and to existing financial and human constraints.
Most data collection methods can be utilised under either complete enumeration or sampling approaches. For instance, logbook catch and effort information may be monitored by means of a complete reporting of landings. Catch and effort data from small-scale and subsistence fisheries generally are sampled. Biological and socio-cultural data are usually collected through a sample-based system, though demographics are collected by complete enumeration. Very large populations, like fish stocks, can be sampled only.
A complete enumeration-based survey is often preferred for certain types of data, solely because it is expected that it will provide complete statistical coverage over space and time. However, a well-designed sample-based survey can often provide good estimates of important parameters at a fraction of the cost. Complete enumeration of some variables (e.g. through a frame survey) is always needed to obtain raising factors when totals of variables like catch or effort are required. Which approach is used will depend on local circumstances.
Complete enumeration sometimes may be seen as desirable, but not attainable for operational reasons. An existing sampling programme can be progressively expanded to provide more reliable and robust estimates, if human and logistics resources allow such expansion in a sustainable manner. Usually such progressive expansion is done in distinct phases. For estimating total catch and effort this would involve: • Phase 1: Use of frame surveys to obtain a raising factor, while sampling in space and in
time for effort and CPUE. This is the most common scenario, whereby one sample survey is used for the CPUE, and three surveys for estimating total fishing effort (frame survey, vessel/gear activity survey and survey for active fishing days).
• Phase 2: Sampling in space and time for CPUE, sampling in time, but complete enumeration in space for effort (no need for frame surveys). This improves significantly the reliability of effort estimates since it does not involve frame survey data, which are

45
usually the weakest component in estimating total effort (they are static and therefore often outdated).
• Phase 3: Sampling in space and time for CPUE, but complete enumeration in both space and time for effort (no need for frame surveys or surveys on active fishing days). This is the most accurate of the three sampling scenarios because it involves only one sample survey related to CPUE and species composition.
The passage from one sampling scenario to another of higher accuracy requires large increases in operational and logistical support, and is not always feasible or desirable.
5.5 COMPLETE ENUMERATION APPROACHES Frame surveys and fishery censuses are a common category of data collection for which the complete enumeration approach is required. These surveys are designed to collect data necessary to describe the basic structure of the capture fishery production sector and activities directly dependent upon it, including infrastructure, employment, and community dependence. Such information is a pre-requisite for conducting on-going collection schemes using either complete enumeration or a sample survey approach.
Complete enumeration may be preferred in cases where data sources can be legally obliged to report, thus reducing the cost of this approach. Complete enumeration may be required as a statutory obligation, often for regulatory purposes. Examples include fishing vessel registers, exports (for custom tariff purposes), variables related to catch quota management (e.g. using fishing logbooks) and variables related to fishing effort limitations (e.g. days at sea).
Complete enumeration may also be preferred in cases where little effort is saved by sampling, such as if the data population is small or the variable to be measured cannot be time-sampled realistically. This might occur with small fishing fleets, where the CPUE is very erratic.
An important consideration concerning the complete enumeration approach is the risk of negative bias due to incomplete coverage. In practice, there is always a proportion of the population, which is not captured by a data collection scheme intended to have complete coverage. The reasons for these information gaps are most commonly associated with operational difficulties. When the proportion of missing data is known to be relatively small, the results can be adjusted to reflect the actual situation. However, there are cases where a proportion of population is never captured by the system and the level of under-reporting is unknown, and so the census results contain a systematic negative bias which will be very difficult to correct.
Another common source of bias occurs when the data collected are used for control of fisheries regulations (for example catch quotas). In this case, deliberate misreporting may occur to cover illegal fishing.
Developments in data collection technologies, such as vessel monitoring systems, electronic logbooks and automatic logging of market information are providing an opportunity for complete enumeration in situations, which before were ignored or could only be covered by sampling.
5.6 SAMPLE-BASED APPROACHES Sample surveys operate on selected subsets of the target population and, using a number of assumptions regarding the distribution of the population, provide estimates of the parameters under study. As well as the sample error, sample-based surveys involve uncertainties as to the correctness of the various assumptions used. However, a well-designed sampling survey can often produce accurate and reliable estimates at a cost much lower than that of complete enumeration.

46
The nature of many variables (for example, fish size frequencies) dictates the application of the sample-based approach. It is necessary to consider carefully how individuals are selected for measurement, whether it is selecting fish from a catch, vessels landing their catch from all those landing at a particular port, or fishers for interview. Therefore, to draw out the relationship between the whole population and the sample, the sampling methodology needs to be based on sound statistical methods and fully documented.
One of the main issues is to reduce sample bias in estimates. Bias, in this case, is the tendency for estimates to centre on a value different from the true value as data accumulate. This can occur if, for example, data collectors tend to choose larger fish or vessels when sampling. The simplest theoretical way to avoid bias is to use random sampling. Under this scheme it is ensured that all individuals (fish, vessels etc.) within a stratum have an equal chance of being selected. In practice, this is often difficult to achieve, and a systematic sampling scheme (every third vessel, or tenth box of fish etc.) is used, which guards against the worst forms of bias. However, it should be borne in mind that most analytical methods assume random sampling, and therefore the possible effects of other sampling methodologies need to be considered in interpreting results.
5.6.1 Stratification in data collection Stratification reduces the error in sample estimates by systematically removing as much as possible of the data variability through the sampling design. This is achieved by dividing the sample population into groups or strata, where as much as possible of the variability in the population is represented in differences between the groups. For instance, industrial vessels would probably be treated as a separate stratum to artisanal vessels, since across the fleet, this division marks a clear divide in many variables. There may also be clear logistical criteria supporting the choice of strata.
There are two major types of stratification in a data collection programme. • Subdivisions based on administrative, geographical or temporal criteria, that are
imposed on the data collection programme for reporting purposes, and are therefore not under the control of the survey designer. Conventionally, in this document, this type of subdivision is referred to as a major stratum. Major strata are for example: provinces of a country, the months of the year, fishing seasons, subdivisions based on specific research needs etc. Major strata may be based on any combination of such criteria, for instance administrative, regional and seasonal.
• Within a major stratum there are usually subdivisions based on criteria, which are chosen by the designer for the sole purpose of increasing the accuracy of the derived estimates. These subdivisions are chosen in such way as to partition the population into homogeneous subsets. In this document they are conventionally called minor strata. Examples of minor strata include fishing grounds, lunar versus dark periods, and small scale versus semi-industrial fisheries.
Estimates of population parameters are always calculated at minor stratum level. Totals at major stratum level are simply aggregations of estimates and counts from the minor strata involved. Table 5.1 gives further examples of major and minor strata.
5.6.2 The effect of stratification Stratification sometimes may be complicated by the need to reconcile two conflicting objectives: • To select strata with the maximum degree of homogeneity; • To minimise the number of strata (usually in view of operational constraints).
However, by systematically varying the stratification in a pilot phase, the appropriate balance can often be found using a variety of methods, as illustrated in Box 5.1.

47
Table 5.1 Some examples of stratifications for fisheries data collection Strata group Stratification
Spatial Province of country or major city
Districts (islands, villages)
Home port (place of registration)
Base port of fishing
Community of residence
Landing place
Fishing grounds
Time Fishing season
Basic time period (week, month, year)
Day/night
Enterprises Companies/co-operatives
Processing plants
Type of support industry
Trade Markets/auctions
Intermediaries/companies
Exporters/importers
Vessel/gear group Fishing fleet
Gear
Vessel group (small scale, semi-industrial, industrial, joint venture, foreign)
Fishery (métier) (defined by fleet/target species/gear)
Experimental fishery Geographical areas/depth zones/bottom types/habitats
or research vessels Time period/day-night
Gear/fishing operation
Landings Commercial species group (catch/effort, value)
Commercial size/treatment group (catch/effort, value)
Ecological species groups
Landings agent
People or households Demographic sub-groups
Fishing community
Vessel group
Economic sector (harvest, post-harvest, market, support industry)
Status (captain, crew, vessel owner)
Environment Habitats (floodplain, lake, mudflats, mangroves, upwelling areas)
Season
Physical oceanographic / limnological criteria

48
Box 5.1 Examples of the use of stratification
Combining two gears into one A boat/gear classification contains two different gear types (e.g. tangle nets of different mesh size), but repeated tests for species composition, average size of fish and CPUE have revealed that there are no statistically significant differences between the two types. It would thus seem reasonable to combine the two gears into one, thereby simplifying data collection operations in frame and catch/effort surveys.
Reduction of sampling effort Fishing effort for line fishing is collected 16 times a month and the variation for the Boat Activity Coefficient (BAC) is only 3% (an indication of high homogeneity in the level of fishing activity). Using the collected samples and simulating a reduction in the sampling days using a computer, it has been found that the new variation is 6% and the resulting estimates are close to the old ones. This suggests that data collection of fishing effort for this gear may be reduced from 16 to 8 days without seriously degrading the accuracy of estimates.
Stratification in time For all boat/gear types of an inshore fishery there have been consistent and highly significant differences in catch rates and species composition during the lunar and dark periods. This indicates that the reference period (a calendar month) should be further stratified in time (lunar period and dark period).
Stratification in space A large homeport contains most of the boats for a trap fishery and they all use a fishing ground that is inaccessible to other boats with traps. Catch rates are significantly different from the rest of the fleet that operate from other sites. This indicates that this particular homeport should become a minor stratum.
Stratification on size of landing places
Stratification of landing places and/or homeports with respect to size is a simple arithmetic process involving an initial list of sites (rows) to which a variable number of indicators (columns) is associated. These indicators may refer to number of fishing units and/or gears by boat/gear type and may be supplemented with other quantitative criteria. The arithmetic process involves normalisation of each column (for instance by converting all values into dimensionless values between 0 and 1), and formulation of totals by site using the normalised values. The stratification criteria are then based on ranking the sites (rows) by their individual percentage of the grand total in descending order and formulating cumulative percentages that will range between the maximum percentage (first row) and 100% (last row). This percentage list can be used to determine partitioning schemes where sampling effort is proportional to the stratum size.
For instance, out of 600 sites the first 10 with up to 50% cumulative percentage will be “primary” and the remaining 590 “secondary”. This, in turn, means that 50% of data collection effort must be allocated to only 10 primary sites and the other 50% to all 590 secondary sites. In this manner, data collection effort is allocated proportionally to the size/importance of sampling sites.
Once a stratification scheme has been decided upon, the next problem is the allocation of sampling effort to the strata. The basic three rules (known as “Von Neumann allocation”) for optimisation are to allocate larger sampling effort to strata with i) greater size, ii) greater variation and iii) lower sampling cost.
The cost of a sample-based approach is mainly a function of its statistical coverage or sample size. When the sample size increases the survey cost also increases and the
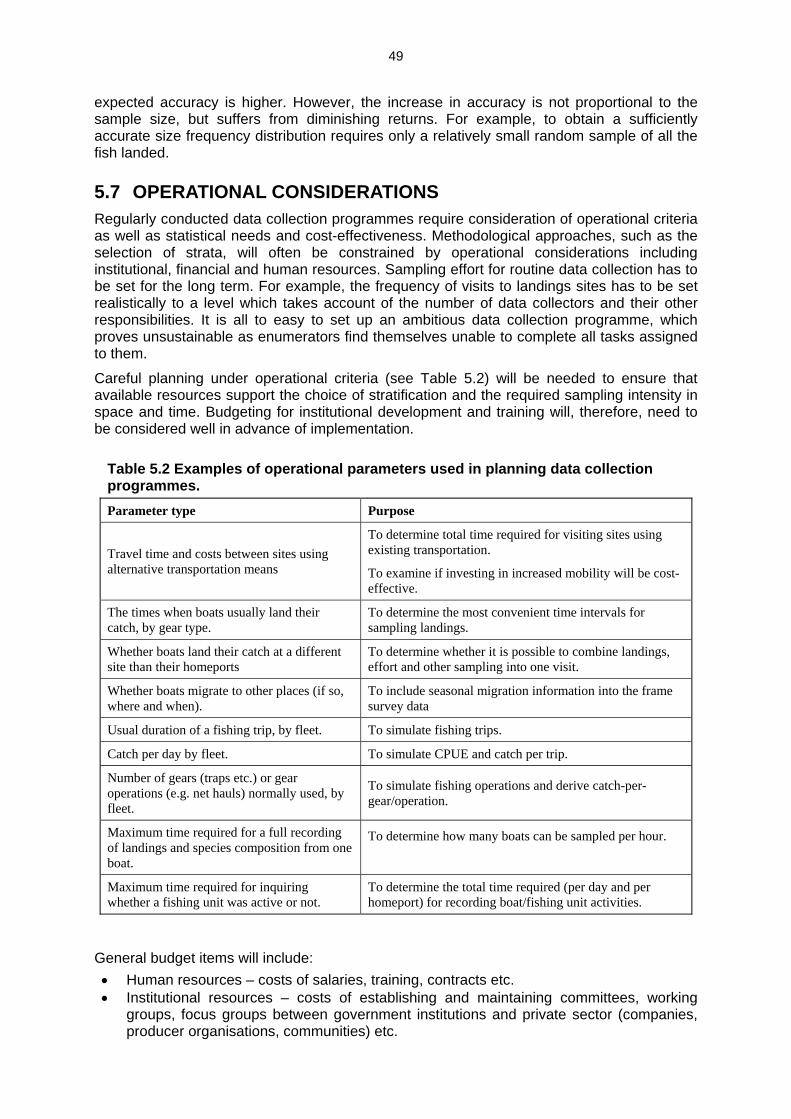
49
expected accuracy is higher. However, the increase in accuracy is not proportional to the sample size, but suffers from diminishing returns. For example, to obtain a sufficiently accurate size frequency distribution requires only a relatively small random sample of all the fish landed.
5.7 OPERATIONAL CONSIDERATIONS Regularly conducted data collection programmes require consideration of operational criteria as well as statistical needs and cost-effectiveness. Methodological approaches, such as the selection of strata, will often be constrained by operational considerations including institutional, financial and human resources. Sampling effort for routine data collection has to be set for the long term. For example, the frequency of visits to landings sites has to be set realistically to a level which takes account of the number of data collectors and their other responsibilities. It is all to easy to set up an ambitious data collection programme, which proves unsustainable as enumerators find themselves unable to complete all tasks assigned to them.
Careful planning under operational criteria (see Table 5.2) will be needed to ensure that available resources support the choice of stratification and the required sampling intensity in space and time. Budgeting for institutional development and training will, therefore, need to be considered well in advance of implementation.
Table 5.2 Examples of operational parameters used in planning data collection programmes. Parameter type Purpose
Travel time and costs between sites using alternative transportation means
To determine total time required for visiting sites using existing transportation.
To examine if investing in increased mobility will be cost-effective.
The times when boats usually land their catch, by gear type.
To determine the most convenient time intervals for sampling landings.
Whether boats land their catch at a different site than their homeports
To determine whether it is possible to combine landings, effort and other sampling into one visit.
Whether boats migrate to other places (if so, where and when).
To include seasonal migration information into the frame survey data
Usual duration of a fishing trip, by fleet. To simulate fishing trips.
Catch per day by fleet. To simulate CPUE and catch per trip.
Number of gears (traps etc.) or gear operations (e.g. net hauls) normally used, by fleet.
To simulate fishing operations and derive catch-per-gear/operation.
Maximum time required for a full recording of landings and species composition from one boat.
To determine how many boats can be sampled per hour.
Maximum time required for inquiring whether a fishing unit was active or not.
To determine the total time required (per day and per homeport) for recording boat/fishing unit activities.
General budget items will include: • Human resources – costs of salaries, training, contracts etc. • Institutional resources – costs of establishing and maintaining committees, working
groups, focus groups between government institutions and private sector (companies, producer organisations, communities) etc.

50
• Capital expenditure – costs of transport (including vessels), computers, offices, equipment etc.
• Recurrent expenditure – costs of communications, travel, office, publications, utilities etc.
In developing countries, it may be possible to establish projects supported by other development partners. In the conduct of such projects, careful attention should be paid to sustainability after the project’s end. This involves: • Training • Establishing appropriate enumeration or sampling methods in the expectation of
declines in resources • Development of analytical methods and tools (models, software) • Seeking the establishment of positions within government and the finance for their
management • Preparing for alternative sources of funding (industry or local government; additional
taxes or levies; etc.)
51
6. DATA COLLECTION METHODS
The choice of method is influenced by the data collection strategy, the type of variable, the accuracy required, the collection point and the skill of the enumerator. Links between a variable, its source and practical methods for its collection (Table 6.1, Table 6.2 and Table 6.3) can help in choosing appropriate methods. The main data collection methods are: • Registration: registers and licences are particularly valuable for complete enumeration,
but are limited to variables that change slowly, such as numbers of fishing vessels and their characteristics.
• Questionnaires: forms which are completed and returned by respondents. An inexpensive method that is useful where literacy rates are high and respondents are co-operative.
• Interviews: forms which are completed through an interview with the respondent. More expensive than questionnaires, but they are better for more complex questions, low literacy or less co-operation.
• Direct observations: making direct measurements is the most accurate method for many variables, such as catch, but is often expensive. Many methods, such as observer programmes, are limited to industrial fisheries.
• Reporting: the main alternative to making direct measurements is to require fishers and others to report their activities. Reporting requires literacy and co-operation, but can be backed up by a legal requirement and direct measurements.
6.1 VARIABLES, SOURCES AND METHODS The choice of the many methods for collecting fishery data will depend on the variables to be measured, the source and the resources available. In many cases, there is a natural way to collect particular variables. For example, relatively static variables, like vessel length or engine size, are often best collected through a registration system. Highly dynamic variables, like catch or effort, may often be best obtained through daily records, such as logsheets.
For the same variable, the methods can be different depending on the type of fishery. For example, for a large-scale fishery, catch data would be best collected from logbooks, whilst in a small-scale fishery interviews and/or questionnaires would often be the best method. The sources (fishers, processors etc.) are also an important factor for the choice and design of methods. Buyers, processors and other intermediaries are likely to keep their own sales records, which should be used as the basis of data forms. Small-scale fishers often do not keep any records, and data acquisition in this case would be restricted to one-to-one interviews, but the interview structure could be more flexible.
Data collection should be conducted at intervals sufficiently frequent for the management purpose. For example, data for stock monitoring have to be collected constantly, while household data can be at much longer time intervals. In general, frequently collected data will probably have to rely on fishers or industry personnel providing the data. Less frequent data can use enumerators since the costs of collection are much lower.
There are cases when fishery data collection programmes cannot be operated on a regular basis because of operational limits. These cases include small scale fishing operations in many inland or remote marine areas, where fishing operations are spread over a large area with part-time fishers using a large array of fishing gears and techniques, sometimes in many different habitats. Under these circumstances, a number of alternative approaches can be taken to assess the fisheries, including: • limited scope census or sample-based pilot surveys; • household surveys or surveys for fish consumption

52
• trade patterns; • logbook systems.
All of these can be used for cross-checking landings data as well as providing production and socio-cultural information.
Many variables can be collected by more than one method and at different points from fishers to consumers. Where possible, data should be collected from several sources to crosscheck for errors. For example, catch data collected through logbooks can be cross-checked against reported landings based on sales slips, data collected by interview at landing sites and even consumer or trade data.
In almost all cases, many different variables can be collected simultaneously. For example, length frequency, species composition, average weight and first sale price can all be obtained when vessels land their catch. Collecting of data for different purposes reduces costs and thus due account should be made of this aspect when planning the data collection programme.
There are strong links between types of data, where they can be obtained and the methods, which are available for their collection. This section provides a guide for selecting data collection methods in relation to the data type and source, and gives some indication of what types of data can be collected simultaneously.
6.1.1 Data sources Harvest: at the level where fish are caught. The most direct approach to the fishery data (e.g. catch, effort).
Post harvest: levels through which fish are prepared for market. This may include middle person, fish auction, cold storage, processing farms and transport of products.
Market: all situations where fish are commercially transferred. It may include the fish market at landing port, transaction (secondary market) of products among brokers, processing farms and consumers’ market.
Consumers: at the level where the products are finally consumed.
Government-related agencies: any agencies or institutes forming part of government (including the inter-governmental level). It would include various agencies outside of fisheries (e.g. custom, coast guard and meteorology department).
Support industry: industries which provide materials and services for fisheries, but are not directly involved in fisheries business (e.g. ship building industry, fishing gear suppliers).
6.1.2 Linkage among variables, sources and methods The linkage between variables, sources and methods are shown in three tables. These tables intend to give some guidance for selecting collecting methods and sources, and design a data collection system. The tables also would give ideas about what types of data can be collected simultaneously at the same source with the same method.


55
6.2 RECORDING A VARIABLE It is important to assess the degree of precision required for the measurement of each variable. This will affect the method of collection, the design of the recording form and later analyses. For example, catch can be recorded in 1, 10, 100, 1000kg or other units. Total estimated catch can be disaggregated into species by relative proportions or each species mass can be estimated separately. Fishers’ age can be recorded by year categories or locally derived groups such as "apprentice", "active" or "semi-retired". However, there is little point in requesting a captain to report and record the catch from a haul to the nearest kilogram, when his estimates are only accurate to the nearest tonne. If more precise measurements are required, the catch will have to be weighed on landing.
Sometimes decisions on the units of measure are complicated by the type of data to be collected. Data values may need to be represented by codes (e.g. sea state, degree of job satisfaction), which should be standardised.
6.3 DATA COLLECTION METHODS
6.3.1 Registration A register is a depository of information on fishing vessels, companies, gear, licenses or individual fishers. It can be used to obtain complete enumeration through a legal requirement. Registers are implemented when there is a need for accurate knowledge of the size and type of the fishing fleet and for closer monitoring of fishing activities to ensure compliance with fishery regulations. They may also incorporate information related to fiscal purposes (e.g. issuance or renewal of fishing licenses). Although registers are usually implemented for purposes other than to collect data, they can be very useful in the design and implementation of a statistical system, provided that the data they contain are reliable, timely and complete
6.3.1.1 Registration data types In most countries, vessels, especially commercial fishing vessels, and chartered or contract fishing vessels are registered with the fisheries authorities. Data on vessel type, size, gear type, country of origin, fish holding capacity, number of fishers and engine horsepower should be made available for the registry.
Companies dealing with fisheries agencies are registered for various purposes. These companies may not only include fishing companies, but also other type of companies involved in processing and marketing fishery products. Data, such as the number of vessels, gear type and vessel size of registered fishing companies, should be recorded during such registration. Processing companies should provide basic data on the type of processing, type of raw material, capacity of processing, and even the source of material.
Fishing vessels and fishing gears may often be required to hold a valid fishing licence. Unlike vessel registers, licences tend to be issued for access to specific fisheries over a set period of time. Because licences may have to be periodically renewed, they can be a useful way to update information on vessel and gear characteristics.
6.3.1.2 Registry design A registry must not only capture new records, but be able to indicate that a particular record is inactive (e.g. a company has ceased operations) or record changes in operations (e.g. a company's processing capacity has increased). If licences must be renewed each year, data collected from licensing is particularly useful, as records are updated on an annual basis.
Registry data also contain criteria for the classification of fishing units into strata. These classifications are usually based on assumptions and a priori knowledge regarding differences on catch rates, species composition and species selectively.

56
In general, vessel registers are complex systems requiring well-established administrative procedures supported by effective data communications, data storage and processing components. As such, they predominantly deal with only certain types and size of fishing units, most often belonging to industrial and semi-industrial fleets. Small-scale and subsistence fisheries involving large numbers of fishing units are often not part of a register system or, if registered, are not easily traced so as to allow validation or updating.
6.3.2 Questionnaires In contrast with interviews, where an enumerator poses questions directly, questionnaires refer to forms filled in by respondents alone. Questionnaires can be handed out or sent by mail and later collected or returned by stamped addressed envelope. This method can be adopted for the entire population or sampled sectors.
Questionnaires may be used to collect regular or infrequent routine data, and data for specialised studies. While the information in this section applies to questionnaires for all these uses, examples will concern only routine data, whether regular or infrequent. Some of the data often obtained through questionnaires include demographic characteristics, fishing practices, opinions of stakeholders on fisheries issues or management, general information on fishers and household food budgets.
A questionnaire requires respondents to fill out the form themselves, and so requires a high level of literacy. Where multiple languages are common, questionnaires should be prepared using the major languages of the target group. Special care needs to be taken in these cases to ensure accurate translations.
In order to maximise return rates, questionnaires should be designed to be as simple and clear as possible, with targeted sections and questions. Most importantly, questionnaires should also be as short as possible. If the questionnaire is being given to a sample population, then it may be preferable to prepare several smaller, more targeted questionnaires, each provided to a sub-sample. If the questionnaire is used for a complete enumeration, then special care needs to be taken to avoid overburdening the respondent. If, for instance, several agencies require the same data, attempts should be made to co-ordinate its collection to avoid duplication.
The information that can be obtained through questionnaires consists of almost any data variable. For example, catch or landing information can be collected through questionnaire from fishers, market middle-persons, market sellers and buyers, processors etc. Likewise, socio-economic data can also be obtained through questionnaires from a variety of sources. However, in all cases variables obtained are an opinion and not a direct measurement, and so may be subject to serious errors. Using direct observations (6.3.4) or reporting systems (6.3.5) for these sorts of data is more reliable.
Questionnaires, like interviews, can contain either structured questions with blanks to be filled in, multiple choice questions, or they can contain open-ended questions where the respondent is encouraged to reply at length and choose their own focus to some extent.
To facilitate filling out forms and data entry in a structured format, the form should ideally be machine-readable, or at least laid out with data fields clearly identifiable and responses pre-coded. In general, writing should be reduced to a minimum (e.g. tick boxes, multiple choices), preferably being limited to numerals. In an open-ended format, keywords and other structuring procedures should be imposed later to facilitate database entry and analysis, if necessary.
6.3.3 Interviews In interviews information is obtained through inquiry and recorded by enumerators. Structured interviews are performed by using survey forms, whereas open interviews are notes taken while talking with respondents. The notes are subsequently structured (interpreted) for further analysis. Open-ended interviews, which need to be interpreted and

57
analysed even during the interview, have to be carried out by well-trained observers and/or enumerators.
As in preparing a questionnaire, it is important to pilot test forms designed for the interviews. The best attempt to clarify and focus by the designer cannot anticipate all possible respondent interpretations. A small-scale test prior to actual use for data collection will assure better data and avoid wasting time and money.
Although structured interviews can be used to obtain almost any information, as with questionnaires, information is based on personal opinion. Data on variables such as catch or effort are potentially subject to large errors, due to poor estimates or intentional errors of sensitive information.
6.3.3.1 Open-ended interviews Open-ended interviews cover a variety of data-gathering activities, including a number of social science research methods.
Focus groups are small (5-15 individuals) and composed of representative members of a group whose beliefs, practises or opinions are sought. By asking initial questions and structuring the subsequent discussion, the facilitator/interviewer can obtain, for example, information on common gear use practices, responses to management regulations or opinions about fishing.
Panel surveys involve the random selection of a small number of representative individuals from a group, who agree to be available over an extended period – often one to three years. During that period, they serve as a stratified random sample of people from whom data can be elicited on a variety of topics.
6.3.3.2 Structured interview Generally, structured interviews are conducted with a well-designed form already established. Forms are filled in by researchers, instead of respondents, and in that it differs from questionnaires. While this approach is more expensive, more complicated questions can be asked and data can be validated as it is collected, improving data quality. Interviews can be undertaken with variety of data sources (fishers to consumers), and through alternative media, such as by telephone or in person.
Structured interviews form the basis for much of the data collection in small-scale fisheries.
In an interview approach for sample catch, effort and prices, the enumerators work according to a schedule of landing site visits to record data. Enumerators can be mobile (that is sites are visited on a rotational basis) or resident at a specific sampling site. Their job is to sample vessels, obtaining data on landings, effort and prices from all boat/gear types that are expected to operate during the sampling day. The sample should be as representative as possible of fleet activities. Some additional data related to fishing operations may be required for certain types of fishing units, such as beach seines or boats making multiple fishing trips in one day. For these, the interview may cover planned activities as well as activities already completed.
In an interview approach for boat/gear activities, the enumerators work according to a schedule of homeport visits to record data on boat/gear activities. Enumerators can be mobile (that is homeports are visited on a rotational basis) or resident at a specific sampling site. In either case, their job is to determine the total number of fishing units (and if feasible, fishing gears) for all boat/gear types based at that homeport and number of those that have been fishing during the sampling day.
There are several ways of recording boat/gear activities. In many cases, they combine the interview method with direct observations. Direct observations can be used to identify inactive fishing units by observing those that are moored or beached, and the total number of vessels based at the homeport are already known, perhaps from a frame survey or register.

58
Often enumerators will still have to verify that vessels are fishing as opposed to other activities by using interviews during the visit.
The pure interview approach can be used in those cases where a pre-determined sub-set of the fishing units has been selected. The enumerator’s job is to trace all fishers on the list and, by means of interviewing, find out those that had been active during the sampling day. For sites involving a workable number of fishing units (e.g. not larger than 20), the interview may involve all fishing units.
Sometimes it is possible to ask questions on fishing activity which refer to the previous day or even to two days back. This extra information increases the sample size significantly with little extra cost, ultimately resulting in better estimates of total fishing effort. Experience has shown that most of the variability in boat/gear activity is in time rather than space.
6.3.4 Direct observations
6.3.4.1 Observers Observers can make direct measurements on the fishing vessels, at landing sites, processing plants, or in markets. The variables that enumerators can collect include catch (landing and discards), effort, vessel/gears, operations, environmental variables (e.g. sea state, temperature), biological variables (e.g. length, weight, age), the values and quantities of landings and sales.
In practice, observers do not only make direct measurements (observations), but also conduct interviews and surveys using questionnaires. They might also be involved in data processing and analysis. The tasks of an observer are difficult and adequate training and supervision are therefore essential.
Clear decisions need to be made on the nature and extent of data collected during any one trip. Often, the amount of data and frequency of collection can be established analytically with preliminary data.
Preferably, observers should only collect data, not carry out other activities, such as enforcement, licensing or tax collection. This should help to minimise bias by reducing the incentives to lie. Problems in terms of conflicts between data collection and law enforcement, for example, can be reduced by clear demarcation, separating activities by location or time. This becomes a necessity for at-sea observers. Their positions on fishing vessels and the tasks that they perform depend significantly on a good working relationship with the captain and crew, which can be lost if they are perceived as enforcement personnel.
The major data obtained through at-sea observers are catch and effort data, which are often used for cross checking fishing logs. At the same time, the at-sea observers can collect extra biological (fish size, maturity, and sex), by-catch and environmental data, as well as other information on the gears, fishing operations etc. Frequently, discards data can only be collected by at-sea observers.
The main data obtained from observers at landing sites, processing plants and markets include landing (amount, quality, value and price), biological (size, maturity), and effort (how many hauls, hours fishing) data. For the large-scale fishery where a logbook system is used, data collected at landing sites could be used to crosscheck data recorded in logbooks. Data collected from processing plants include quantities by species and, especially in modern factory practices, the batch number of raw materials, which can sometimes be traced back to fishing vessels. These data if collected can be used to validate landing data.
Collecting data to estimate raising factors for converting landed processed fish weight to the whole weight equivalent may be necessary. By sampling fish before and after processing, conversion factors may be improved. Potential seasonal, life history stage and other variations in body/gut weight ratios suggest date, species, sex and size should be recorded in samples.

59
Economic and demographic data at each level (e.g. input and output of various products to and from market and processors) are usually obtained by interview and questionnaire. However, the data directly collected by enumerators can also be the major source as well as supporting data for those collected through other methods.
While product data in processing plants can be collected through questionnaire (6.3.2) or interview (6.3.3), enumerators can directly collect many physical variables (weight, number, size etc.) more accurately. Automatic scales, through which a continuous stream of fish passes, can record the weight of fish mechanically or through computerised sensors. Similarly, mechanical or automatic weighing bins for whole frozen or defrosted fish, prior to entry to a processing line or cold store, can be used to record weights for each batch. Otherwise, boxes need to be counted and sub-sampled to ensure their fish contents are correctly identified and weighed.
Fish is often landed in bulk together with non-fish materials (e.g. ice, brine slurry, packing material and pallets). It can be very difficult to estimate the total fish weight, let alone weight by species, product and size grade. Methods need to be established to record whether non-fish material is included in any weighing process (e.g. are scales set to automatically subtract pallet weight?). In the case of processed fish in sealed boxes, it may be that sampling to determine an average weight and then box or pallet counting is sufficient. Alternatively, each box or pallet is weighed and a note taken whether box and pallet weight should be subtracted at a later data when processing the data.
Complete landings of all catch in relation to a vessel’s trip (i.e. emptying of holds) is preferred since records can then be matched against logsheets. However, in some circumstances off-loading in harbours, at the dock or at sea may only be partial, some being retained on board until the next off-loading. In this case, records should be maintained of both catch landed and retained on board.
6.3.4.2 Inspectors Inspectors are a kind of enumerator involved in law enforcement and surveillance (for fishing regulations, sanitary inspections, labour control, etc.). They may work at sea on surveillance vessels, at landing sites on shore, at processing factories and at markets. In general, scientific data are better collected by enumerators who are not directly involved in law enforcement. Nevertheless, many variables collected by the inspectors are very useful, and include landings, operational information, effort, landing price, processing procedure and values of product to the market and processors. Inspectors are also useful in collecting employment data.
Inspectors may play an important role in verification. In many cases, reports can be physically checked with observations. For example, random samples of boxes can be taken to check box contents (species, product type and size grade) against box identification marks. Inspectors need to be skilled in such sampling strategies.
As with enumerators/observers, inspector data should be treated with caution because of the high chance of sampling bias. This potential bias of data collected by law-enforcement officers should be considered in analyses.
6.3.4.3 Scientific research Ecological research methods can be undertaken independent of commercial fishing operations to measure variables related to fish populations or the environment. Such research can be carried out by institutional research vessels or by industry or institutions using commercial fishing vessels. The objective is to obtain observations on biological (e.g. stock abundance or spatial distribution and fish size, maturity and spawning activities) and environmental (e.g. salinity and temperature) variables. It is important that this type of research is carried out periodically in order to obtain time sequential data.

60
Similarly, socio-cultural research methods can be used to obtain specific information useful to management. Although these methods may not often be considered routine, they provide important data and should be considered for infrequent data collection where possible.
Key informants are individuals with specialised knowledge on a particular topic. They may include academic specialists, community leaders, or especially skilled fishers. Interviews are usually begun with a set of baseline questions, but the interviewer expects to elicit new and perhaps unexpected information by requesting that the key informant expand on his or her answers to these initial questions. This method is ideal for obtaining in-depth descriptive data on beliefs and practices, including historical practices.
Participant-observation is a technique whereby the researcher spends an extended period of time (from weeks to years, depending on the objective and the context) living with a target community, both observing their behaviour and participating in their practices. During this time, the researcher will be conducting formal and informal open-ended interviewing on a variety of topics. This is a good method for learning about the actual processes of decision-making, as opposed to the formal procedures. Cultural and institutional rules are rarely followed to the letter, and there are usually informal standards for an acceptable leeway. However, information on these standards can often only be obtained through participant-observation.
6.3.4.4 Data logging Automatic Location Communicators (ALC) automatically log data through positioning and communications technology. They allow remote observation through recording of fishing activities at sea, and could replace logbooks and observers/inspectors on the bridges of fishing vessels. However, ALCs will be deficient in one simple respect: entry of data on the catch remains the responsibility of the captain.
Many data on fishing operations can be automatically recorded from bridge instrumentation. Position, speed, heading, deployment of gear through links to electronic instruments are likely to become more common in future. Once gathered, such data may be automatically transmitted to databases through satellite or ground communications.
The technology that combines vessel position and a catch assessment for management authorities through remote means is generally known as a Vessel Monitoring System (VMS). Confidentiality is the key to the widespread acceptance of VMS, as information on current fishing grounds, and therefore security of position information, is a major concern.
However, vessel positions, activities and catch reporting through these systems, directly to databases and thence to reports that either aggregate data or remove vessel identifiers are becoming possible. Since it will be relatively simple to check remotely sensed position against recorded position, logsheet records should become more representative of real vessel activities at sea.
6.3.5 Reporting In most complete enumeration approaches, fisheries staff do not directly undertake data collection, but use external data sources. Most commonly, these sources are data forms completed by the fishing companies themselves, middle persons, market operators, processors and even trading companies and custom offices. Such methods are almost exclusively used for semi-industrial and industrial fisheries and institutions.
Fishing companies are often a good source of information regarding basic data on catches and fishing effort. Regular submission of basic data is a part of the fishing licensing process. Data submitted by companies are often in the form of logbooks or landings declarations. Logbooks should contain detailed information on individual fishing operations, including fishing grounds, type and duration of operation, catch by species and other types of data relating to weather and sea conditions. Landings declarations usually deal with grouped data presented as summaries of fishing trips and catch by species.

61
The advantage of using reports is that data are compiled by agents other than fisheries staff and sometimes can be made available in pre-processed computerised format directly from the company’s records, thereby reducing administration costs. Confidentiality of information (such as fishing grounds and catch rates) should be part of the agreement for data submission, and statistical outputs of the survey should not contain information related to individual fishing vessels or companies. However, there are also risks of under-reporting or of deliberate distortion of data, especially fishing ground, catch and revenue related information.
6.3.5.1 Harvest The collection of data from all vessels within a fishery sector is sometimes needed usually from large-scale fisheries. Normally each vessel will be required to record their catch and effort data for every trip on a specially designed logbook. Because it is a painstaking task, usually only essential data are required. For various reasons, the data collected by this method could be inaccurate and thus validation from time to time by inspectors is important.
6.3.5.2 Post harvest Data from post harvest operations are often used for obtaining information on landings, biology, markets, costs and earnings. Where logsheets, landings records and market reports are not available, reliable information can often only be obtained from processing factories. Reports by the processors generally include quantities and value of fish received and the resulting products. Additional information may include the origin of catch (fishing and transport vessels) and size categories of fish.
Monitoring off-loading catch in processed or whole round form requires considerable attention to detail and much depends on the relationship between the fishery authority and vessel captains or companies. It may be that sufficient trust has been developed to allow vessel or company off-loading records to be used directly, perhaps with random spot checks.
In some circumstances, off-loading may proceed directly to a processing factory or cold store (particularly by conveyor of bulk fish such as small pelagics, tuna etc.). Detailed landings can still be recorded as long as each batch is marked with its source (vessel name and trip identifier).
Most factories will maintain records of fish (by species, product type and size grade) that enter processing directly or cold store. They will also maintain information on their output and sales, including destination and price, although such data may be much more difficult or impossible to obtain unless legally required. Data forms will need to be customised to the type of processing and the factory management system.
6.3.5.3 Sale Market transaction records may form a feasible way of collecting landings with complete enumeration, particularly in large fleets of small-scale vessels that land in central locations. All invoices, sales slips or sales tallies should be designed with care as to content, style and availability to ensure completeness of coverage. Given the potential volume of paper work, simplicity and brevity will often be the most important criteria.
The primary identifier on records should be the name of the vessel (including all carrier vessels unloading from more distant fleets) that sold the catch, and the date or trip number, since vessels may make more than one sale from one landing. Total weight by species or commercial group, and price should be collected. Ideally, further data should be obtained on fishing ground and level of fishing effort, although often this is not possible.
In similar fashion to logsheets and landings sheets, sales records should be prepared in appropriately identified forms in multiple copies as required. Copies are likely to be required for the market administration (if necessary), the seller, the buyer and the fishery authority.
General sales records, such as volume of sales and prices by product type, provide useful information for bio-economic analyses and a source of data on catch and landings when all

62
other avenues for data collection are unavailable. Three information sources on general sales are usually available: market, processing factory and export data. However, these data must always be treated with care. The further away the data sources are from the primary source, the more errors will be introduced, and the more details (e.g. fishing ground, fishing effort) will be lost. In addition to these, direct surveys of fishing companies may provide vital details upon which overall fisheries management and administration can be based. Annual fisheries statistical surveys can be voluntary or compulsory. If voluntary, responses will depend on the level of co-operation between the private sector and the authorities. If compulsory, legislation is required and can be drafted in various forms, such as Companies or Statistics Acts.
6.3.5.4 Trade Trade data refers to information from customs or similar sources on trade. These data are used in socio-economic indicators and, in some exceptional cases, support landings data.
Information on exports and imports is published in most countries. It is particularly important where export or import taxes are payable, or export incentives given. Of course, export and import data is of limited use in estimating the total production of fish unless there are also means to establish the proportion of catch that is used in domestic consumption. However, in some particular cases, the trade data are the main source for estimating landings (e.g. shark, tunas). If trade data are used for validating or estimating landings, the quantities will usually need converting to whole weight.
The lack of detail in export data can be a problem simply because of the form in which they are collected. Export categories recorded by the authorities (not usually in co-operation with fishery authorities) can mask much of the information required. Canned fish, frozen fish, fresh fish, dried fish and fishmeal may be the only relevant categories for export authorities. Together with accurate raising factors, these data can be used for total fish production. This method of estimation is fairly accurate when there is a small local market. However, unless they are broken down by species and linked back directly to sources of data closer to the harvest sector, they provide little value for fishery management purposes.

63
7. DATA MANAGEMENT
Fishery data must be stored securely, but made easily available for analysis. The design of a data management system should follow the basic data processing principles. The database should store the original raw data. The data management system should be integrated with the data collection system as far as possible. Database design and software development can vary in approach from adapting an existing system to designing a new system from scratch. In all cases, the system should be well documented. The human-computer interface needs to guide the user in getting the best out of the system, including help and local language facilities. Data entry should integrate import functions and validation controls, processing should use embedded functions for common procedures, and reporting should be flexible and include an export facility. The responsible authority must commit adequate financial and personnel resources for maintenance, make regular archives to protect the data, and periodically re-evaluate the design to be sure the system is meeting its objectives. Access should be controlled to ensure database integrity and confidentiality, but interfere as little as possible with legitimate access.
7.1 NEED FOR DATA MANAGEMENT Decision making for fisheries policy-making, planning and management relies largely on processed information, not raw data. Data have to be interpreted before they can be utilised. The volume of raw primary data is often very large, and so can only be used effectively if held in a Data Base Management System (DBMS). The functions of a DBMS are: • to ensure data conform to standard classifications; • to ensure validity of the data; • to ensure data integrity and internal consistency; • to secure and maintain primary data; • to allow easy access to primary data; • to process the data efficiently as required; • to allow different data sets to be integrated, thereby increasing their overall utility.
A fundamental principle is to hold all data as they were collected, in their primary form. This allows flexibility in the way data can be processed (e.g. filtered, aggregated, transformed), and ensures all calculations are reproduced from source data incorporating all revisions. Considering the considerable investment in data collection and low costs storage and processing, there is little reason for not holding complete data in its primary form.
7.2 DATABASE DESIGN
7.2.1 Methodology Information technology is diverse and changing rapidly, so it is important to seek the most up-to-date advice before selecting a system or developing an application.
Ideally, database developers should be involved in not just the data management, but also the sampling system. Although fisheries experts may be aware of computer technology, they should not be concerned with actual implementation of the database system. Likewise, computer professionals should not be concerned with developing a fishery sampling system. However, when the two activities occur at the same time, each can complement the other to mutual benefit, increasing the probability of a project’s success.
A decentralised database design should be considered to make database management and data validation easier. In a distributed system, data are entered and validated locally, but linked with other databases for analysis. Data can be made accessible for analysis through a centralised database, preferably housed at a national institution.
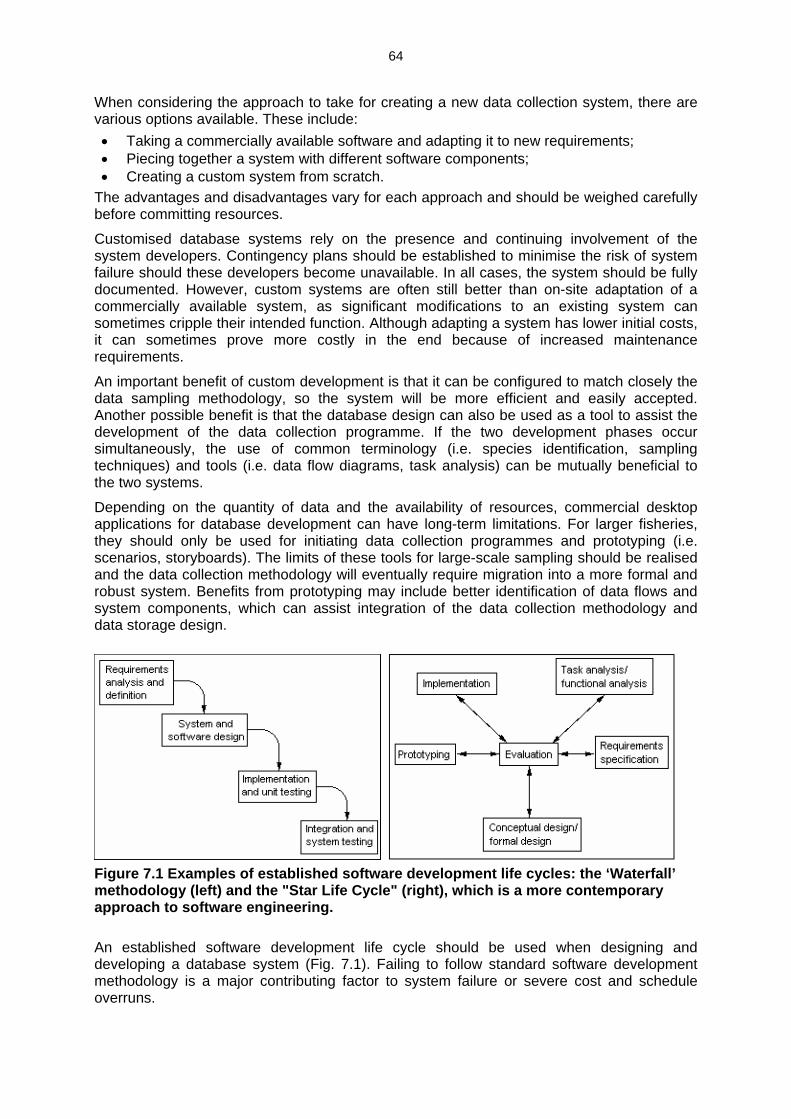
64
When considering the approach to take for creating a new data collection system, there are various options available. These include: • Taking a commercially available software and adapting it to new requirements; • Piecing together a system with different software components; • Creating a custom system from scratch.
The advantages and disadvantages vary for each approach and should be weighed carefully before committing resources.
Customised database systems rely on the presence and continuing involvement of the system developers. Contingency plans should be established to minimise the risk of system failure should these developers become unavailable. In all cases, the system should be fully documented. However, custom systems are often still better than on-site adaptation of a commercially available system, as significant modifications to an existing system can sometimes cripple their intended function. Although adapting a system has lower initial costs, it can sometimes prove more costly in the end because of increased maintenance requirements.
An important benefit of custom development is that it can be configured to match closely the data sampling methodology, so the system will be more efficient and easily accepted. Another possible benefit is that the database design can also be used as a tool to assist the development of the data collection programme. If the two development phases occur simultaneously, the use of common terminology (i.e. species identification, sampling techniques) and tools (i.e. data flow diagrams, task analysis) can be mutually beneficial to the two systems.
Depending on the quantity of data and the availability of resources, commercial desktop applications for database development can have long-term limitations. For larger fisheries, they should only be used for initiating data collection programmes and prototyping (i.e. scenarios, storyboards). The limits of these tools for large-scale sampling should be realised and the data collection methodology will eventually require migration into a more formal and robust system. Benefits from prototyping may include better identification of data flows and system components, which can assist integration of the data collection methodology and data storage design.
Figure 7.1 Examples of established software development life cycles: the ‘Waterfall’ methodology (left) and the "Star Life Cycle" (right), which is a more contemporary approach to software engineering. An established software development life cycle should be used when designing and developing a database system (Fig. 7.1). Failing to follow standard software development methodology is a major contributing factor to system failure or severe cost and schedule overruns.

65
7.2.2 Human-computer interface Important to the overall acceptability of DBMS is the Human-Computer Interface (HCI). Users of the DBMS (i.e. data encoders, scientists, decision-makers and policy planners) should be involved in the development of the HCI. The following are some basic principles that may be employed to develop effective HCI interfaces: • Automated procedures to guide users on how to proceed when using the system; • Use of graphical structures such as command-buttons in the HCI, preferably with
commonly applied icons, to facilitate access to frequently used functions; • Use of menus to list commands; • Readily accessible “Help” keys or a command-button to access on-line help messages.
Whenever possible, efforts should be extended to provide HCI interfaces in the local language. This makes the system easier to understand for local users, increasing operator learning rates and overall data quality.
7.2.3 Computerised documentation On-line help, documentation, tutorials and training are contributing factors to the sustainability of a database. Special consideration should be placed on the development of these components within the system. Preferably, the development of these components should proceed in parallel with the development of the software/user-interfaces. However, this does not eliminate the need for hard copies of the documentation.
7.2.4 Data entry When creating or modifying a data entry system, it is often necessary to incorporate historical data that has been stored on non-computer media. In such cases, all possible methods of bulk data conversion (scanning, inexpensive local labour, etc.) should be considered for conversion to computer-compatible form. This allows for data integration, which is necessary for proper analysis.
Additionally, an 'Import' function should be available to incorporate data commonly held in alternative formats (e.g. word processor or spreadsheet). This function should ensure data integrity and quality is maintained.
When applicable, special structures or software links should be developed to facilitate retrieval of data from other computer sources such as electronic logbooks. Again, care should be taken that data integrity is maintained and data are properly validated.
Data validation can be implemented at various levels including data collection, compilation, data entry to a DBMS, data processing and analysis. Data entry user-interfaces should be structured to enforce sets of rules applied to validate inputs.
7.2.5 Data processing A feature of DBMS technology, which should be exploited when developing or modifying a data collection system, is the capability of imbedding control and processing within the database using stored procedures and queries. This approach has the advantages of: • reducing the amount of exterior processing necessary; • providing more immediate data validation; • increasing flexibility for future system modifications.
An important consideration when processing data is the need for maintaining an audit trail of all actions performed on data to allow subsequent review of information quality.
Whenever possible, parameters should be used to make the system more flexible. Parameters are easilychanged values that alter the structure and function of the system. Often, requirements change over the life of a system, and allowing expansion and modification without major configuration changes can preserve the viability of the data collection system.

66
7.2.6 Data reporting Flexibility when producing reports from data is important. Often, the potential uses of data are not fully recognised before a system is operational. To allow ease of retrieval/reporting helps prevent unnecessary secondary modifications to a system.
To facilitate report flexibility, a general-purpose 'export' function should be provided. Features that this function should have are: • identifying name-tags for all exported data attributes; • a summary of data types and formats; • variable length records with user selected field delimiters (i.e. ASCII files with commas
or tabs).
7.2.7 Geographic Information Systems (GIS) It is useful to present spatial data in graphical form. Presenting geo-referenced data graphically offers the advantage of allowing the view of the data relative to other geographical data like positions of rivers, mangroves, reefs or other features that are known to have an effect to fisheries production. Commercially available systems should be able to access geo-referenced data within the DBMS, however data management remains the responsibility of the DBMS.
7.3 DATA MANAGEMENT OPERATIONS AND MAINTENANCE
7.3.1 Commitment In order to sustain the use of the database, there is the need for a long-term commitment to support the data management application. Adequate personnel should be available not only for routine operation, but also to modify the system as the need arises. Failure to provide such support is very likely to result in a gradual loss of system capabilities and ultimately may contribute to a collapse of the system.
7.3.2 Archives The database should be backed up regularly. The system should always be prepared for major hardware or software failures and data loss. Procedures should be made as simple as possible to ensure that backups are regularly made.
As the database evolves with time and changes in information technology occur, data archiving is essential to allow retrieval of historical data stored in former structure or design. Archiving of data should be done using a non-volatile media (e.g. CD-ROM) and system independent data format.
7.3.3 Design re-evaluation As a result of established feedback mechanisms and in order to ensure that the data management system is meeting its objectives (i.e. complying with the needs of clients) periodic evaluations should be undertaken. Representatives of those using the system should be present.
A continuing programme of design evaluation is recommended to ensure that the system takes advantage of recent developments in information technology. Special attention should be given to establish procedures for upgrading archived data so that data in the old format will continue to be accessible.

67
7.4 DATA ACCESS AND DISSEMINATION
7.4.1 Data ownership and control The state or agency where the data originated is the main owner of the data. Recognising that data are a resource and hence have values, economic or otherwise, the Government should exercise its right to maintain, secure and control access.
Control is the limit placed on the ability of an individual, a group of individuals, organisations or another state to have partial or full access to the data contained on a database. Partial data access is the inability to do any of the following: (i) view all of the data entered and stored by the system, (ii) append data, (iii) edit data, (iv) copy data, or (v) distribute/share the data by any means. Controls should be used to limit access in a manner consistent with any confidentiality requirements and protect the data from unauthorised changes. Of greatest importance is the protection of primary data from accidental corruption. The master copy of data must always be 'write protected'. However, although control and security are important, they should not hinder legitimate access. In particular, the security and control features of the DBMS should never hinder state-recognised scientific institutions from accessing data for resource management research.
Special provisions should be made in the DBMS to facilitate sharing of the data with other states and regional organisations as appropriate. The UN Fish Stocks Agreement requires states to exchange information for managing straddling and highly migratory fish stocks. Data exchange is facilitated if national standards and classifications share a common regional or inter-regional set of statistical standards, most specially at higher aggregating levels.
7.4.2 Communication networks Developments in communications technology open a new arena of possibilities with regard to the distribution of data. Whenever possible and appropriate, the DBMS design should consider structures that will facilitate distribution, or allow direct access of the data from remote locations.
7.4.3 Computerised publication Development of software for tutorials, demonstrations and related documents (e.g. on-line help text, computer-based user guide) is essential to long-term viability of the database. These documents may reside locally or, preferably, nationally in a form allowing network access.
The use of digital media should also be considered for disseminating statistics. For example, the Internet offers an inexpensive method to share information, allowing secure access to data and analytical results.

68
8. PLANNING AND IMPLEMENTATION
The implementation of a data collection programme should follow a normal project cycle. During the planning phase, a legal and institutional framework needs to be put in place, and the current working practices and budget will need to be reviewed, so that appropriate resources can be secured for a sustainable programme. During the implementation phase, the following must be addressed: • Adequate incentives must be provided to ensure members of the fishing community will
fully participate. • All fisheries staff and others in the programme will need training and supervision. • Exchange of common experience should be shared between countries. • Technical committees can be set up to guide the programme. • Data will need verification using methods integrated into the programme. • Feedback should be obtained from all those involved to provide information on system
performance. • Finally, the whole system must periodically be appraised to guide adjustments as needs
and resources change.
8.1 THE NEED FOR PLANNING The establishment or improvement of systems for data collection require careful planning to ensure that the implementation proceeds in comprehensive, cost-effective and timely ways. This involves a range of tasks that can be encompassed within a project cycle framework from identification and analysis of needs, through project formulation and budgeting, to system design, implementation, monitoring and appraisal.
Identification and analysis of needs is a crucial phase of the project cycle. Infrastructure requirements, mainly policy, legal and institutional frameworks, are often not given enough emphasis. These issues are sometimes more important for sustaining a Fisheries Information System than more obvious requirements such as assessment of the required information technology.
The most important considerations are: • The information system policy must be formulated at a high government level, as it will
eventually have to provide support for the fisheries policy at this level. • A legal framework ensuring the active participation of fishermen in providing information
must be available in an early stage of development. • The institutional framework needs to be analysed and then altered to facilitate the active
involvement of all fisheries stakeholders and institutions. • In designing a functional Fisheries Information system, budgeting must consider the
current and future personnel and capital assets for a sustainable system. • In the implementation phase, considerable attention and resources must be directed
towards continuous training of all staff involved. Often, this is only superficially considered.
• It is always advisable to start with a pilot system and then expand when the core system has been appraised and proved stable.
The system should be reviewed continuously to ensure it supports fisheries policy and management objectives. The review should include a continuous process of data verification. An iterative appraisal of the design and function will give a higher probability of system adequacy and stability.

69
Continuous feedback to all stakeholders (e.g. fishers, industry, institutions and enumerators) is essential in sustaining a viable system. Feedback requirements will naturally be different at all levels, and these requirements will have to be specified.
8.2 PLANNING PHASE (PRE-IMPLEMENTATION)
8.2.1 Legal framework The appropriate legal framework and policy instruments need to be placed before the initiation of the operational phase. In particular, legal instruments that oblige the fishing sector to provide the appropriate information on essential variables (e.g. catch and effort) should be enacted.
Legal instruments that govern national, regional and international industrial fishery regimes should always contain a general stipulation that the captains of fishing vessels shall:
“Maintain on board a fishing log which shall be completed on a daily basis as a true record of all fishing activities and related matters in a manner as shall be determined from time to time by….(the Minister/Director/this organisation/this agreement).”
Furthermore, such laws may also allow for the presence of observers who are empowered to:
“Observe fishing operations, evaluate fishing logs, inspect fish storage holds and processing areas, take fish and biological samples and measurements and undertake any other action in the performance of their duties as shall be determined from time to time by….(etc.)”.
These records of operations of single vessels at sea may be supplemented by visits of Inspectors at sea or during landings of fish to shore or to other ships. Inspectors are similarly empowered, but will often also have enforcement powers and, where the requirements of the law with regard to information are not fulfilled, can demand immediate compliance under threat or actual sanction.
Log sheets, thus defined in law, are legal documents to which a Captain or senior crew member should add their signature, attesting that they are correct. Unfortunately, all too often, the legal nature of these documents is sometimes overlooked and non-compliance is treated as an administrative failure. In many fisheries, catch logs are the only data source and they therefore may also be used for compliance control. Consequently, non-compliance with log completion and delivery should be treated as a serious breach of licence or fishing conditions.
8.2.2 Institutional framework Fishery data collection programmes concern not only the agencies responsible for their implementation, but also various other major parties that, directly or indirectly, are involved in its operation or affected by its results and conclusions. Such parties may be the national statistical bureau, other national institutions, functional Non-Governmental Organisations, universities or the different private sectors of the fishing industry. The active participation of all possible stakeholders in the preparation and implementation phases of a data collection programme is fundamental. It provides opportunities for important aspects of data collection to be discussed by all stakeholders, and not just fishery administrators and managers. This will produce a better data collection system, which is integrated with the industry as opposed to an onerous system imposed by government.
8.2.3 Working practices Current data collection systems will often need to be modified to meet new or revised objectives. The working practices of participants in the chain of data supply and processing (e.g. from enumerators to information technologists), some of which may have become established over many years, are likely to need changes. It is important, therefore, to
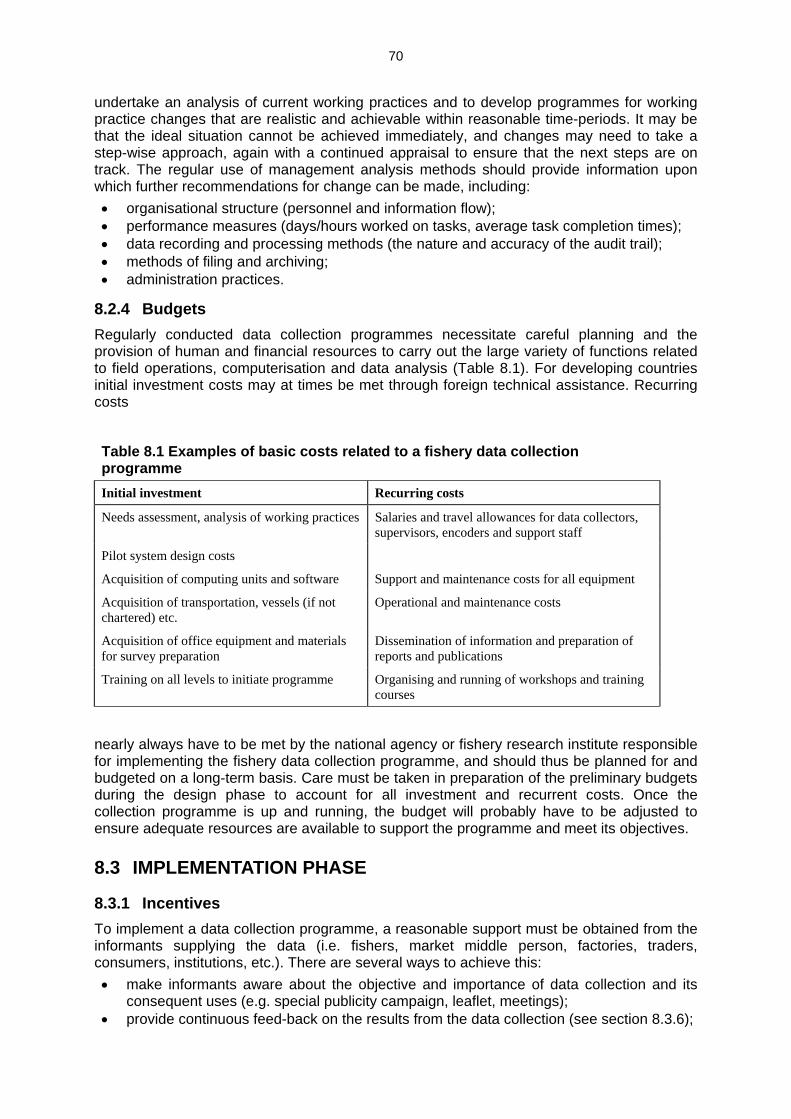
70
undertake an analysis of current working practices and to develop programmes for working practice changes that are realistic and achievable within reasonable time-periods. It may be that the ideal situation cannot be achieved immediately, and changes may need to take a step-wise approach, again with a continued appraisal to ensure that the next steps are on track. The regular use of management analysis methods should provide information upon which further recommendations for change can be made, including: • organisational structure (personnel and information flow); • performance measures (days/hours worked on tasks, average task completion times); • data recording and processing methods (the nature and accuracy of the audit trail); • methods of filing and archiving; • administration practices.
8.2.4 Budgets Regularly conducted data collection programmes necessitate careful planning and the provision of human and financial resources to carry out the large variety of functions related to field operations, computerisation and data analysis (Table 8.1). For developing countries initial investment costs may at times be met through foreign technical assistance. Recurring costs
Table 8.1 Examples of basic costs related to a fishery data collection programme Initial investment Recurring costs
Needs assessment, analysis of working practices Salaries and travel allowances for data collectors, supervisors, encoders and support staff
Pilot system design costs
Acquisition of computing units and software Support and maintenance costs for all equipment
Acquisition of transportation, vessels (if not chartered) etc.
Operational and maintenance costs
Acquisition of office equipment and materials for survey preparation
Dissemination of information and preparation of reports and publications
Training on all levels to initiate programme Organising and running of workshops and training courses
nearly always have to be met by the national agency or fishery research institute responsible for implementing the fishery data collection programme, and should thus be planned for and budgeted on a long-term basis. Care must be taken in preparation of the preliminary budgets during the design phase to account for all investment and recurrent costs. Once the collection programme is up and running, the budget will probably have to be adjusted to ensure adequate resources are available to support the programme and meet its objectives.
8.3 IMPLEMENTATION PHASE
8.3.1 Incentives To implement a data collection programme, a reasonable support must be obtained from the informants supplying the data (i.e. fishers, market middle person, factories, traders, consumers, institutions, etc.). There are several ways to achieve this: • make informants aware about the objective and importance of data collection and its
consequent uses (e.g. special publicity campaign, leaflet, meetings); • provide continuous feed-back on the results from the data collection (see section 8.3.6);

71
• establish good relationships between enumerators and informants; • give incentives for co-operation (e.g. free licenses, rewards); • impose a penalty on those that do not co-operate (e.g. lower quota, suspension of
licence, fines). In general, data collection for scientific purposes should be separated from data collection for enforcement. The reason for this is to remove the incentive for fishers to bias sampling. Enforcement officers will tend to get less co-operation when trying to obtain data since fishers may feel threatened, or may have broken regulations which they will try to hide. For instance, size frequency sampling, where fishers hide fish below the minimum size, will bias the data. Such biased data may result in management decisions that damage the fishery much more than simply catching undersized fish. Data collection needs to concentrate on what is really happening in the fishery, not what is supposed to be happening.
8.3.2 Training Training is one of the most crucial components in the preparation and successful implementation of data collection programmes, and must always be given high priority.
Adequate training and supervision of staff involved in monitoring are essential if the data collected are to be valid. Data collectors are frequently junior in organisational hierarchies and are rewarded accordingly. However, they are also expected to work in remote areas or as the sole observers aboard ships, often with no contact with their supervisors or colleagues for lengthy periods. It is important that care is taken in identifying appropriate staff that are prepared with adequate training. Every effort should be made to maintain morale and an awareness of the role of their task in the broader fisheries context. Supervisory staff should make regular site visits to maintain data quality, and regular in-service training sessions should be held.
In general, training courses and workshops should target a representative number of national staff involved in the preparatory and operational phases of a programme, and should thus be an on-going activity. Participants should include fishers, data collectors, supervisors, researchers, computer operators, other decision-makers, data sources and users.
National workshops are a good means for addressing methodological and operational problems encountered during the implementation phase. They provide the opportunity for bringing together staff with different responsibilities and activities, such as data collectors and supervisors, information system operators, statisticians and researchers. In addition, periodic dialogue meetings should be arranged with all those participating in or contributing to a data collection programme. This way, adequate transfer and dispersal of information will be assured and the problems that may have occurred in the interim period will be addressed.
Data collectors and supervisors are the backbone of a data collection system since they are in direct contact with the fishers and have first-hand experience regarding field operations. Their participation will make them feel they are part of the entire survey programme and will greatly assist in the identification of problem areas related to data collection operations.
Participation of information system operators is also important since their observations regarding inputting and data storage operations may bring out suggestions for improving the format of source forms and their compilation by the data collectors.
Statisticians and researchers can explain basic statistical aspects, train junior staff in data collection and sampling approaches, verify the utility of the statistics and discuss improvements in data dissemination and analysis.
National workshops of this nature ideally take place over a period of 20-25 days, and should be organised at the end of a full year cycle. An example of a workshop schedule, contents and participation is given in Table 8.2.

72
Table 8.2 Example of a schedule for a National Workshop. Period Activity Participants
Day 1 – Day 3 Basic sampling theory, statistical concepts and exercises.
Statisticians, researchers and other users
Day 4 – Day 13
Compilation of data to be used as case studies. Editing of collected information. Guidelines for general format and structure of data collection forms. Discussions on field activities and data collection problems.
Data collectors, researchers and statisticians
Day 14 – Day 19 Using a computer system operating with databases of reference tables, frame survey data and samples of landings and boat/gear activities. Computation of estimates and variances. Exercises and case studies with actual data from pilot or full-scale surveys.
Statisticians, information system operators and researchers
Day 20 – Day 25 Reporting techniques. Exercises and case studies with actual data from pilot surveys.
Statisticians, researchers, other users and information system operators
8.3.3 Exchange of experiences with other countries Irrespective of differences in type and size of fishing industries, fishery data collection programmes are generally based on certain basic and commonly accepted methodological and operational foundation. They often utilise standardised data collection schemes and computer software. It may thus be of interest for a country in the process of initiating or enhancing a fishery data collection programme, to benefit from the experience and knowledge of other countries that have already made good progress.
Such exchange of expertise can be facilitated by: • regional workshops and expert consultations; • study tours; • continuous exchange of information; • documentation, including annual reports, manuals, forms etc.
8.3.4 Technical committees Standing committees on fishery statistics (e.g. for stock assessment or statistical standardisation) can play a key role in the co-ordination of data collection programmes. They are particularly useful where different agencies or institutions are involved in various components of an overall survey system. Their terms of reference may include: • set-up priorities and provide advice related to statistical development activities; • provide a forum for consultations and co-ordination regarding progress evaluation,
performance and diagnostics; • use feedback information from National Workshops for the preparation of reports with
findings, conclusions and recommendations; • advise on corrective actions if and when needed; • provide recommendations on staff and other resource needs.
Technical Committees should meet on a regular basis and their composition and level of authority should allow submission of their recommendations to higher government authorities for consideration and action.
Additional permanent working groups can be established: • to discuss the relevance of the output in relation to objectives; • to standardise the way measurements are made; • to set up utilities.
73
8.3.5 Data verification8 The verification of data is essential to ensure that data are accurate, complete and give a true indication of the state or value of the factors under consideration. The problems associated with the collection of fisheries data mean that the risks of collecting erroneous or inappropriate data are very high without careful and statistically valid design and monitoring.
Different types of data will need to be verified in different ways. Some examples of methods to verify data include: • checking logbooks against landings data (e.g. sales notes); • sampling catches for species or grade composition; • comparing landings statistics with certificates of origin, trade and commodity production
statistics (e.g. processed fish) and similar sources of information; • inspecting data collection methods by statistical staff; • interviews with fishers; • observer schemes or inspections; • reporting from sea on retained catch on entering and leaving the fishing zones; • using vessel monitoring systems, such as transponders, to monitor the position, catch
and activities of vessels; • instituting airborne and shipboard surveillance, together with the boarding of vessels.
In cases where fishery-independent data, such as stock abundance indices from research surveys, are available, it is possible to use these as an independent check on CPUE indices based on commercial fishery catch and effort data. In cases of suspected serious misreporting of catches, it is even possible to use such fishery-independent data to obtain estimates of the commercial catches.9
At the macro-level (typically national), food balance sheets can be used as an overall check of the consistency between production, utilisation, trade and consumption statistics. For such an exercise, it is necessary to convert all figures into live-weight equivalent units using appropriate conversion factors. Total fish production from capture fisheries and aquaculture, less quantities used for non-food purposes (e.g. fishmeal production) plus imports minus exports should correspond to the domestic food fish supply. It is usually expressed in per capita terms by dividing by the population size. The average per capita fish supply can then be compared with fish consumption estimates derived from food surveys. Large deviations from food survey results or large fluctuations from year to year suggest that there are problems with some of the statistics used in the calculations.
8.3.6 Feedback Since data collection is a co-operative effort, all parties involved should receive some benefit from the data gathering, analysis and dissemination programme. This is to ensure the continuing co-operation between primary data sources (informants) and data collectors. Providing valuable feedback to fishers on changes and trends in their performance should promote this co-operation. On the other hand, disregarding the importance of feedback would severely constrain the co-operation with informants becoming suspicious about the outcome of the analysis and the dissemination of the information.
In general, feedback from informants and data users should always be encouraged in order to ensure that the information system responds to the needs of all parties, as effectively as possible.
If the feedback mechanism recognises inadequacies in the data collection system, these should be addressed immediately and monitored. Consequently, the system should always 8 Extracted from section 2.1.2 of FAO Technical Guidelines for Responsible Fisheries. No. 4. Fisheries Management. Rome, FAO. 1997. 82pp. 9 Such a procedure has been used in some analyses undertaken by the International Council for the Exploration of the Sea (ICES) and an account was presented to the Co-ordinating Working Party on Fishery Statistics at its Seventeenth Session (FAO Fisheries Report No. 555, paragraph 91).

74
be sufficiently flexible to allow for periodic adjustments, in particular, when the target fishery is dynamic and subject to change.
8.3.7 System appraisal The establishment or development of a data collection system should be the subject of continuous appraisal to ensure that it is meeting its desired objectives. This is critical if the system is to function efficiently and be sustainable on a long-term basis. The system needs to be continuously scrutinised by the operators and users to resolve any problems that may occur in the data trail. Consequently, resources should be allocated in the annual budget to resolve the problems that are inevitably going to occur. No system is perfect and it is not until the programme has been up and running for some time that all the major obstacles will be overcome.
Particular attention should be given to reviewing whether the system provides the necessary output to meet the management objectives and support for the fisheries policy. The links between the management objectives, the indicators chosen and the data collected should be clarified and established (if missing), following the rational process described in these guidelines.

75
9. REFERENCES AND FURTHER READING
Acheson, J. M. (1981). Anthropology of Fishing. Annual Review of Anthropology 10:275-316.
Anderson, J.E. (1987). Quotas as options: optimality and quota licence pricing under uncertainty. Journal of International Economics, 23(1/2):21-39.
Arnason, R. (1993). Ocean fisheries management: recent international developments. Marine Policy, 17(5):334-339.
Arte, S. (1988). Data Base: Structured techniques for design, performance, and management: New York, John Wiley & Sons, Inc. 430p.
Asia-Pacific Fishery Commission (1997). Status of fishery statistics in Asia. Report of the first session of the joint Working Party on fishery statistics and economics, Bangkok, Thailand, 19 to 23 August 1997. RAP Publication 1997/43. Bangkok, FAO Regional Office for Asia and the Pacific, 24p.
Barg, U.C. (1992). Guidelines for the promotion of environmental management of coastal aquaculture development. FAO Fish. Tech. Pap. No. 328. Rome, FAO, 122p.
Brainerd, T., Clay, P.M., Haksever, D., Hall-Arber, M., Kellog, C., Kitts, A. and McCarron, D. (1993). Report to ASMFC Committee on Economics and Social Sciences: Commercial Sector Reference Document on identification and prioritization of economic and sociocultural data elements. Available from the Atlantic States Marine Fisheries Commission (ASMFC), 1444 "I" Street NW, 6th floor, Washington, DC 20005.
Caddy, J. (1998). A short review of precautionary reference points and some proposals for their use in data-poor situations. FAO Fish. Tech. Pap. No. 379. Rome, FAO, 30p.
Caddy, J. and Bazigos, G. (1985) Practical guidelines for statistical monitoring of fisheries in manpower limited situations. FAO Fish. Tech. Pap. No. 257. Rome, FAO, 86p. (Also issued in Arabic, French and Spanish).
Caddy, J. and Mahon, R. (1995). Reference points for fisheries management. FAO Fish. Tech. Pap. No. 347. Rome, FAO, 83p.
Calow, P.and Petts, G.E. (1992). The river handbook Parts I and II. Blackwell.
Campbell, D. and Haynes, J. (1990). Resource rent in fisheries, ABARE Discussion Paper 90.10, Canberra.
Charles, A. (1989). Bio-socio-economic Fishery Models: Labour Dynamics and Multiobjective Management. Can. J. Fish. Aquat. Sci. 46(8):1313-1322
Cochran, W.G. (1977). Sampling techniques. 3rd ed., London, John Wiley & Sons, Inc., 428p.
Concerted Action (1995). Assessing the economic status of fisheries-methodology and data needs. Concerted action on co-ordination of research in fisheries economics. The Hague, Agricultural Economic Research Institute (LEI-DLO).
Cunningham, S., Dunn, M.R. and Whitmarsh, D. (1985). Fisheries Economics: An Introduction. London, Mansell Publishing, 372p.
Danielsson, A. (1994). Productivity growth in the Icelandic fisheries and natural resource. Paper presented at the VIth Conference of the European Association of Fisheries Economics, Crete, 28-30 March 1994.
Date, C. J. (1995). Introduction to Database Systems - Sixth Edition. Addison-Wesley. 839p.
76
Davidse, W.P., Cormack, K., Oakeshott, E., Frost, H., Jensen, C., Rey, H.S., Foucault, F. and Taal, C. (1993). Costs and earnings of fishing fleets in four EC countries calculated on a uniform basis for the development of sectoral fleet models. The Hague, Agricultural Economic Research Institute (LEI-DLO).
Doulman, D.J. (1995). Structure and process of the 1993-1995 United Nations conference on straddling fish stocks and highly migratory fish stocks. FAO Fish. Circ. No. 898, 81p.
Elliott, J.M. (1983). Some methods for the statistical analysis of samples of benthic invertebrates. Ambleside, UK. Freshwater Biological Association Scientific Publication No. 25. 159p.
Emmerson, D. (1980). Rethinking artisanal fisheries development: Western concepts, Asian experiences. World Bank Staff Working Report No. 423, 97p.
English, S., Wilkinson, C. and Baker, V. (eds) (1994). Survey manual for tropical marine resources. Townsville, Australia. Australian Institute of Marine Science. 368p.
Eurostat (1997). New techniques and technologies for Statistics II- Proceedings of the Second Bonn Seminar. IOS Press. 288p.
FAO, (1995a). Code of conduct for responsible fisheries. Rome, FAO, 41p.
FAO, (1995b). Programme for the World Census of Agriculture 2000 (WCA 2000). FAO Statistical Development Series No 5, Rome, FAO, 79 p.
FAO, (1995c). Precautionary approach to fisheries. Part 1: Guidelines on the precautionary approach to capture fisheries and species introductions. FAO Fish. Tech. Pap. No. 350/1. Rome, FAO, 52p.
FAO, (1996a). Precautionary approach to fisheries. Part 2: Scientific papers. FAO Fish. Tech. Pap. No. 350/2. Rome, FAO, 210p.
FAO, (1996b). Precautionary approach to capture fisheries and species introductions. Elaborated by the Technical Consultation on the precautionary approach to capture fisheries (Including species introductions). Lysekil, Sweden, 6-13 June 1995. FAO Technical Guidelines for Responsible Fisheries No.2. Rome, FAO, 54p.
FAO, (1996c) Fishing operations. FAO Technical Guidelines for Responsible Fisheries No. 1. Rome, FAO, 26p. 6 annexes.
FAO, (1996d). Integration of fisheries into coastal area management. FAO Technical Guidelines for Responsible Fisheries No. 3. Rome, FAO, 17p.
FAO, (1996e). Multiple frame agricultural surveys. Volume 1: Current surveys based on area and list sampling methods. FAO Statistical Development Series No. 7, Rome, FAO, 119p. (see also for more references).
FAO, (1997a). Fisheries management. FAO Technical Guidelines for Responsible Fisheries No. 4. Rome, FAO, 82p.
FAO, (1997b). Aquaculture development. FAO Technical Guidelines for Responsible Fisheries. No. 5. Rome, FAO, 40p.
FAO, (1997c). Inland fisheries. FAO Technical Guidelines for Responsible Fisheries. No. 6. Rome, FAO, 36p.
FAO, (1998a). Responsible fish utilization. FAO Technical Guidelines for Responsible Fisheries. No. 7. Rome, FAO, 33p.
FAO, (1998b). Fishing operations. 1. Vessel monitoring systems. FAO Technical Guidelines for Responsible Fisheries, No. 1, Suppl. 1, Rome, FAO, 58p.

77
FAO, (in press). Development and use of indicators for sustainable development of marine capture fisheries. Prepared by the Australian-FAO Technical Consultation on sustainability indicators in marine capture fisheries (Sydney, Australia, 18-22 January 1999). FAO Technical Guidelines for Responsible Fisheries. No. to be assigned. Rome, FAO.
Flewwelling, P. (1994). An introduction to monitoring, control and surveillance systems for capture fisheries. FAO Fish. Tech. Pap. No. 338. Rome, FAO, 217p.
Fowler, J. and Cohen, L. (1995). Statistics for ornithologists. 2nd ed. British Trust for Ornithology Guide No. 22.150p.
Gallucci V.F., Saila, S.B., Gustafson, D.J. and Rothschild, B.J. (eds) (1996). Stock assessment: Quantitative methods and application for small-scale fisheries. Boca Ratton, New York, CRC. Lewis Publishers, 527p.
Granger Morgan, M. and Henrion, M. (1992). Uncertainty. A guide to dealing with uncertainty in quantitative risk and policy analysis. Cambridge University Press.
Green, R.H. (1979). Sampling design and methods for environmental biologists. New York, John Wiley & Sons, Inc. 257p.
Gunderson, D.R. (1993). Surveys of fisheries resources. New York, John Wiley & Sons, Inc., 248p.
Hannesson, R. (1993). Bioeconomic analysis of fisheries. UK, Fishing News Books
Hilborn, R. and Walters, C.J. (1992). Quantitative fisheries stock assessment: Choice, dynamics and uncertainty. New York, Chapman and Hall, 570p.
Indo-Pacific Fishery Commission (1994). Proceedings of the Symposium on Socio-economic Issues in Coastal Fisheries Management, Bangkok, Thailand, 23-26 November 1993. RAPA Publication 8, 442 p.
ICGPSIA (Interorganizational Committeee on Guidelines and Principles for Social Impact Assessment) (1993). Guidelines and principles for social impact assessment. Available from IAIA (International Association for Impact Assessment), P.O. Box., Belhaven, NC 27819, USA.
Kitts, A.W. and Steinback, S.R. (draft). Data needs for economic analysis of fishery managament regulations. NOAA/NMFS, Washington, USA.
Kohli, K.N. (1993). Economic analysis of investment projects: A practical approach. Hong Kong, Oxford University Press.
Leveque, C. (1997). Biodiversity, dynamics and conservation. The freshwater fish of tropical Africa. ORSTOM. Cambridge University Press.
Mardle, S. and Pascoe, S. (1997). A review of applications to fisheries using multi-objective programming techniques. CEMARE Research Paper 117, Porthsmouth, University of Porthmouth.
MacInnes, D. Jentoft, S. and Davis, A. (eds) (1991). Social Research and Public Policy: Norwegian and Canadian Experiences. Halifax, Nova Scotia, Oceans Institute of Canada.
Maiolo, J.R. and Orbach, M.K. (ed.) (1982). Modernization and Marine Fisheries Policy. Ann Arbor, MI., Ann Arbor Science Publishers, 330p.
McGoodwin, J.R. (1990). Crisis in the world's fisheries: people, problems, and policies. Stanford, Stanford University Press.
Medley, P.A., Gaudian, G. and Wells, S. (1993). Coral reef fisheries stock assessment. Reviews in Fish Biology and Fisheries.
Megrey, B. and Moksness, E. (1996). Computers in Fisheries Research: 254 p.

78
Miyake, M. (1990). Field manual for the statistics and sampling Atlantic tunas and tuna-like fishes. Madrid, Spain, International Commission for the Conservation of Atlantic tunas, 184 p.
Namibia, Ministry of Fisheries and Marine Resources, (1996). Fisheries Information Management System. User's Guide. Version 1.0. 161p.
ODA (Overseas Development Administration) (1988). Appraisal of Projects in Developing Countries: A guide for economists. HMSO, London.
Pascoe, S. and Stephens, M. (1994). Making sense of ABARE survey results. Australian Fisheries 53(4): 33-36.
Pido, M.D., Pomeroy, R.S., Carlos, M.B. and Garces, L.R. (1996). A handbook for rapid appraisal of fisheries management systems (Version I). ICLARM Education Series 16, 85p.
Pinkerton, E.W. (ed.) (1989). Co-operative management of local fisheries: New directions for improved management and community development. Vancouver, British Columbia, Univ. of British Columbia Press, 312p.
Poggie, J.J. and Pollnac, R.B. (eds) (1991). Small-scale fishery development: sociocultural perspectives. ICMRD (International Center for Marine Resource Development), 126 Woodward Hall, University of Rhode Island, Kingston R.I., 02881 USA.
Pollnac, R.B. and Littlefield, S.J. (1983). Sociocultural Aspects of Fisheries Management. Ocean Development & International Law 12(3-4): 209-246.
Preece, J. (1994). Human-computer interaction: Addison-Wesley 775 p.
Rana, K.J. (1997). Guidelines on the collection of structural aquaculture statistics. Supplement to the programme for the World Census of Agriculture 2000. FAO Statistical Development Series No 5b, Rome, FAO, 56 p.
Ruddle, K. and Johannes, R.E. (eds) (1985). The traditional knowledge and management of coastal systems in Asia and the Pacific. Jakarta, UNESCO.
Sakagawa, G. (1995). Assessment methodologies and management-Proceedings of the World Fisheries Congress, Theme 5: 195p.
Sparre, P. and Venema, S.C. (1998). Introduction to tropical fish stock assessment. Part 1 Manual FAO Fish. Tech. Pap. 306/1 Rev.2., Rome,FAO, 407p.
Sulit, V.T., Gayamat, E.S., Bhatiyasevi, U. Grainger, R. and Hongskul, V. (1997a). Fishery and aquaculture statistics in Asia. Proceedings of the FAO/SEAFDEC Regional Workshop on Fishery Statistics, Bangkok, Thailand, 19-21 August 1997 Volume I. Report of the Workshop. Bangkok, The Secretariat Southeast Asian Fisheries Development Center, 57p.
Sulit, V.T., Gayamat, E.S., Bhatiyasevi, U. Grainger, R. and Hongskul, V. (1997). Fishery and aquaculture statistics in Asia. Proceedings of the FAO/SEAFDEC Regional Workshop on Fishery Statistics, Bangkok, Thailand, 19-21 August 1997 Volume II. Fishery and aquaculture statistical systems and programs. (Papers presented at the workshop). Bangkok, The Secretariat Southeast Asian Fisheries Development Center, 331p.
Thomas, S.J., Maril, L., Durrenberger, E.P. (eds) (1989). Marine Resource Utilization: A Conference on Social Science Issues. Mobile, Alabama, Univ. of South Alabama Publication Services.
Thompson, S.K. (1992). Sampling. New York, J. Wiley-Interscience.
Thompson, S.K. and Seber, G.A.F. (1996). Adaptive sampling. New York, J.Wiley-Interscience.

79
UN/FAO, (1998). International fisheries instruments with index. Agreement for the implementation of the provisions of the United Nations Conference on the Law of the Sea of 10 December 1982 relating to the conservation and management of straddling fish stocks and highly migratory fish stocks. Agreement to promote compliance with international conservation and management measures by fishing vessels at high seas. Code of conduct for responsible fisheries. New York, United Nations, Division for Ocean Affairs and the Law of the Sea. 110p.
Visser, T.A.M. (1997). Status of fishery statistics in the South Pacific. RAP Publication, 1997/30. Bangkok, FAO Regional Office for Asia and the Pacific, 78p.
Willmann, R. (1983). Economic data needs for small-scale fisheries management. In FAO (ed.) Report of the ACMRR (Advisory Committee on Marine Resources Research) Working Party on the Management of Living Resources in Tropical Waters. FAO Fish. Rep. No. 284. Rome, FAO.

80
ANNEX 1. Data Requirements Specified in the United Nations Fish Stocks Agreement
AGREEMENT FOR THE IMPLEMENTATION OF THE PROVISIONS OF THE UNITED NATIONS CONVENTION ON THE LAW OF THE SEA OF 10 DECEMBER 1982
RELATING TO THE CONSERVATION AND MANAGEMENT OF STRADDLING FISH STOCKS AND HIGHLY MIGRATORY FISH STOCKS
ANNEX I STANDARD REQUIREMENTS FOR THE COLLECTION AND SHARING OF DATA
Article 1
General principles
1. The timely collection, compilation and analysis of data are fundamental to the effective conservation and management of straddling fish stocks and highly migratory fish stocks. To this end, data from fisheries for these stocks on the high seas and those in areas under national jurisdiction are required and should be collected and compiled in such a way as to enable statistically meaningful analysis for the purposes of fishery resource conservation and management. These data include catch and fishing effort statistics and other fishery-related information, such as vessel-related and other data for standardizing fishing effort. Data collected should also include information on non-target and associated or dependent species. All data should be verified to ensure accuracy. Confidentiality of non-aggregated data shall be maintained. The dissemination of such data shall be subject to the terms on which they have been provided. 2. Assistance, including training as well as financial and technical assistance, shall be provided to developing States in order to build capacity in the field of conservation and management of living marine resources. Assistance should focus on enhancing capacity to implement data collection and verification, observer programmes, data analysis and research projects supporting stock assessments. The fullest possible involvement of developing State scientists and managers in conservation and management of straddling fish stocks and highly migratory fish stocks should be promoted. Article 2 Principles of data collection, compilation and exchange The following general principles should be considered in defining the parameters for collection, compilation and exchange of data from fishing operations for straddling fish stocks and highly migratory fish stocks: (a) States should ensure that data are collected from vessels flying their flag on fishing activities according to the operational characteristics of each fishing method (e.g., each individual tow for trawl, each set for long-line and purse-seine, each school fished for pole-and-line and each day fished for troll) and in sufficient detail to facilitate effective stock assessment; (b) States should ensure that fishery data are verified through an appropriate system; (c) States should compile fishery-related and other supporting scientific data and provide them in an agreed format and in a timely manner to the relevant subregional or regional fisheries management organization or arrangement where one exists. Otherwise, States should cooperate to exchange data either directly or through such other cooperative mechanisms as may be agreed among them; (d) States should agree, within the framework of subregional or regional fisheries management organizations or arrangements, or otherwise, on the specification of data and the format in which they are to be provided, in accordance with this Annex and taking into account the nature of the stocks and the fisheries for those

81
stocks in the region. Such organizations or arrangements should request non-members or non-participants to provide data concerning relevant fishing activities by vessels flying their flag; (e) such organizations or arrangements shall compile data and make them available in a timely manner and in an agreed format to all interested States under the terms and conditions established by the organization or arrangement; and (f) scientists of the flag State and from the relevant subregional or regional fisheries management organization or arrangement should analyse the data separately or jointly, as appropriate. Article 3 Basic fishery data 1. States shall collect and make available to the relevant subregional or regional fisheries management organization or arrangement the following types of data in sufficient detail to facilitate effective stock assessment in accordance with agreed procedures: (a) time series of catch and effort statistics by fishery and fleet; (b) total catch in number, nominal weight, or both, by species (both target and non-target) as is appropriate to each fishery. [Nominal weight is defined by the Food and Agriculture Organization of the United Nations as the live-weight equivalent of the landings]; (c) discard statistics, including estimates where necessary, reported as number or nominal weight by species, as is appropriate to each fishery; (d) effort statistics appropriate to each fishing method; and (e) fishing location, date and time fished and other statistics on fishing operations as appropriate. 2. States shall also collect where appropriate and provide to the relevant subregional or regional fisheries management organization or arrangement information to support stock assessment, including: (a) composition of the catch according to length, weight and sex; (b) other biological information supporting stock assessments, such as information on age, growth, recruitment, distribution and stock identity; and (c) other relevant research, including surveys of abundance, biomass surveys, hydro-acoustic surveys, research on environmental factors affecting stock abundance, and oceanographic and ecological studies. Article 4 Vessel data and information 1. States should collect the following types of vessel-related data for standardizing fleet composition and vessel fishing power and for converting between different measures of effort in the analysis of catch and effort data: (a) vessel identification, flag and port of registry; (b) vessel type; (c) vessel specifications (e.g., material of construction, date built, registered length, gross registered tonnage, power of main engines, hold capacity and catch storage methods); and (d) fishing gear description (e.g., types, gear specifications and quantity). 2. The flag State will collect the following information: (a) navigation and position fixing aids; (b) communication equipment and international radio call sign; and (c) crew size.

82
Article 5 Reporting A State shall ensure that vessels flying its flag send to its national fisheries administration and, where agreed, to the relevant subregional or regional fisheries management organization or arrangement, logbook data on catch and effort, including data on fishing operations on the high seas, at sufficiently frequent intervals to meet national requirements and regional and international obligations. Such data shall be transmitted, where necessary, by radio, telex, facsimile or satellite transmission or by other means. Article 6 Data verification States or, as appropriate, subregional or regional fisheries management organizations or arrangements should establish mechanisms for verifying fishery data, such as: (a) position verification through vessel monitoring systems; (b) scientific observer programmes to monitor catch, effort, catch composition (target and non-target) and other details of fishing operations; (c) vessel trip, landing and transshipment reports; and (d) port sampling. Article 7 Data exchange 1. Data collected by flag States must be shared with other flag States and relevant coastal States through appropriate subregional or regional fisheries management organizations or arrangements. Such organizations or arrangements shall compile data and make them available in a timely manner and in an agreed format to all interested States under the terms and conditions established by the organization or arrangement, while maintaining confidentiality of non-aggregated data, and should, to the extent feasible, develop database systems which provide efficient access to data. 2. At the global level, collection and dissemination of data should be effected through the Food and Agriculture Organization of the United Nations. Where a subregional or regional fisheries management organization or arrangement does not exist, that organization may also do the same at the subregional or regional level by arrangement with the States concerned.
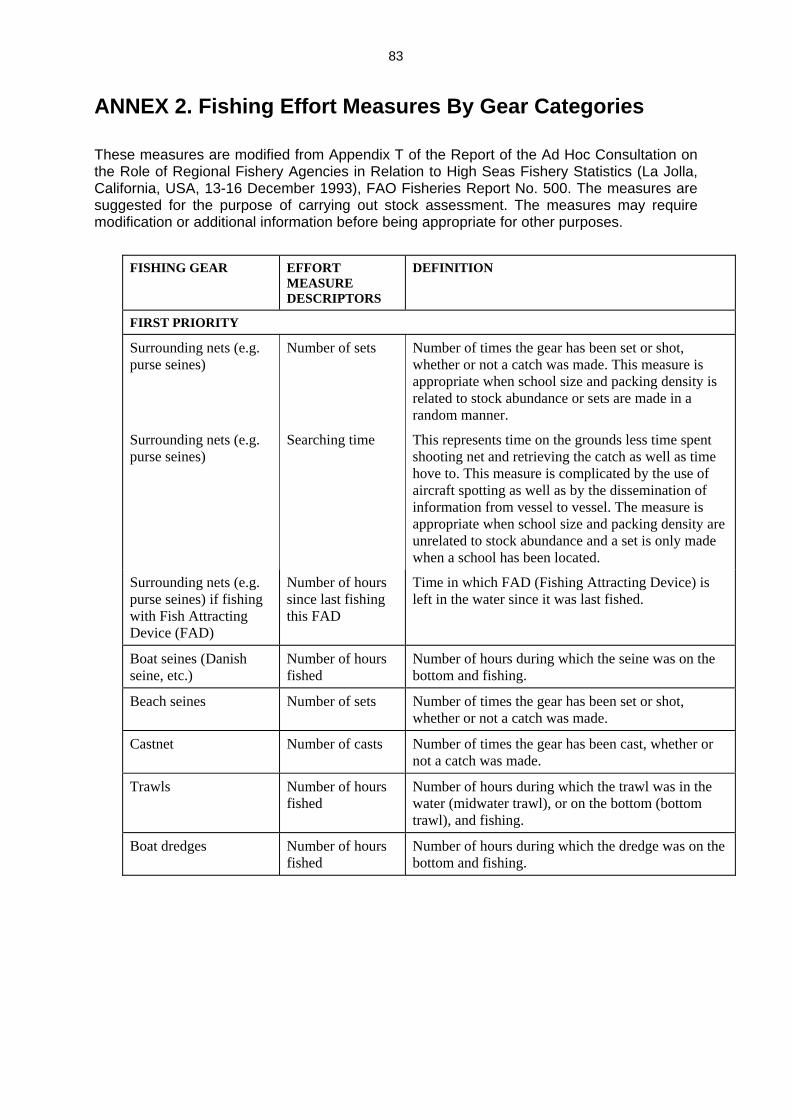
83
ANNEX 2. Fishing Effort Measures By Gear Categories
These measures are modified from Appendix T of the Report of the Ad Hoc Consultation on the Role of Regional Fishery Agencies in Relation to High Seas Fishery Statistics (La Jolla, California, USA, 13-16 December 1993), FAO Fisheries Report No. 500. The measures are suggested for the purpose of carrying out stock assessment. The measures may require modification or additional information before being appropriate for other purposes.
FISHING GEAR EFFORT MEASURE DESCRIPTORS
DEFINITION
FIRST PRIORITY
Surrounding nets (e.g. purse seines)
Number of sets Number of times the gear has been set or shot, whether or not a catch was made. This measure is appropriate when school size and packing density is related to stock abundance or sets are made in a random manner.
Surrounding nets (e.g. purse seines)
Searching time This represents time on the grounds less time spent shooting net and retrieving the catch as well as time hove to. This measure is complicated by the use of aircraft spotting as well as by the dissemination of information from vessel to vessel. The measure is appropriate when school size and packing density are unrelated to stock abundance and a set is only made when a school has been located.
Surrounding nets (e.g. purse seines) if fishing with Fish Attracting Device (FAD)
Number of hours since last fishing this FAD
Time in which FAD (Fishing Attracting Device) is left in the water since it was last fished.
Boat seines (Danish seine, etc.)
Number of hours fished
Number of hours during which the seine was on the bottom and fishing.
Beach seines Number of sets Number of times the gear has been set or shot, whether or not a catch was made.
Castnet Number of casts Number of times the gear has been cast, whether or not a catch was made.
Trawls Number of hours fished
Number of hours during which the trawl was in the water (midwater trawl), or on the bottom (bottom trawl), and fishing.
Boat dredges Number of hours fished
Number of hours during which the dredge was on the bottom and fishing.

84
FISHING GEAR EFFORT
MEASURE DESCRIPTORS
DEFINITION
Gillnets (set or drift) Number of effort units
Length of nets expressed in 100-metre units multiplied by the number of sets made (= accumulated total length in metres of nets used in a given time period divided by 100).
Gillnets (fixed) Number of effort units
Length of net expressed in 100-metre units multiplied by the number of times the net was cleared.
Lift net Number of hours fished
Number of hours during which the net was in the water, whether or not a catch was made.
Traps (uncovered pound nets)
Number of effort units
Number of days fished times the number of units hauled.
Covered pots and fyke nets
Number of effort units
Number of lifts times the number of units (= total number of units fished in a given time period).
Longlines (set or drift) Numbers of hooks Number of hooks fished in a given time period.
Pole-and-line Number of days fished
The number of days (24-hour periods, reckoned from midnight to midnight), on which any fishing took place, including days during which searching took place without fishing.
Rod-and-reel (recreational)
Number of line-hours
Number of hours during which the lines were in the water times number of lines used.
Troll Number of line-days
Total number of line days in the given time period.
Jigs (hand and mechanical)
Number of line-days
Total number of line days in the given time period.
Other small scale net gears
Number of operations
Those small scale gears including push net, scoop net, drive-in net etc. Number of fishing operation, whether or not a catch was made.
Other small scale stationary gears
Number of hours fished
Those gears include guiding barriers, bag net, stow net, portable net, etc. Number of hours during which the gears were in the water for fishing, whether or not a catch was made.
Harpoons, spears etc. Number of days fished
The number of days (24-hour periods, reckoned from midnight to midnight), on which any fishing took place, including days during which searching took place without fishing.

85
FISHING GEAR EFFORT
MEASURE DESCRIPTORS
DEFINITION
SECOND PRIORITY Boat seines (Danish seine, etc.)
Number of sets made
Number of times the gear has been set or shot, whether or not a catch was made.
Trawls Number of sets made
Number of times the gear has been set or shot (either in mid-water or to the bottom), whether or not a catch was made.
Lift net Number of hours fished
Number of times the net was set or shot in the water, whether or not a catch was made.
All gears Number of days fished
The number of days (24-hour period, reckoned from midnight to midnight) on which any fishing took place. For those fisheries in which searching is a substantial part of the fishing operation, days in which searching but no fishing took place should be included in "days fished" data.
THIRD PRIORITY All gears Number of days
on ground The number of days (24-hour periods, reckoned from midnight to midnight, in which the vessel was on the fishing ground, and includes in addition to the days fishing and searching also all the other days while the vessel was on the ground.
FOURTH PRIORITY All gears Number of days
absent from port The number of days absent from port on any one trip should include the day the fishing craft sailed but not the day of landing. Where it is known that fishing took place on each day of the trip the number of "days absent from port" should include not only the day of departure but also the day of arrival back in port. Where on any trip a fishing craft visits more than one "fishing area" (as defined for statistical purposes) an appropriate fraction of the total number of days absent from port should be allocated to each "fising area" in proportion to the number of days spent in each, so that the total number of days absent on the trip will be the sum of the number of days allocated to all of the different "fishing areas" visited.
FIFTH PRIORITY All gears Number of trips
made Any voyage during which fishing took place in only one "fishing area" is to be counted as one trip. When in a single trip a craft visits more than one "fishing area" an appropriate fraction of the trips should be apportioned to each "fishing area" in proportion to the number of days spent fishing in each, so that the total number of trips for the Statistical Area as a whole will be the same as the sum of trips to each "fishing area".

86
ANNEX 3. Data Sheet Design, Use and Processing
This annex gives details on the design and use data sheets. It provides a general table on decision-making in design, together with a narrative on each design issue. This is followed by a table on decision-making in the data sheet use and management, with an explanatory narrative. Two types of data sheet are discussed, logsheets (reporting) and socio-cultural datasheets (interviewing). Similar principles apply to developing data forms for other types of data. Most fishery authorities throughout the world process at least some of the data collected into computerised databases for two purposes: fisheries administration and management, and scientific, operational and economic research. In general, the former requirement is for the immediate purposes of daily administration of licences, quota and effort control and the statutory elements of fisheries law. The latter purpose is much less urgent, but the entry of data to databases for research purposes is no less essential. What is most important is the speed of processing and this entirely depends on the use of the information? Is it for quota/effort management in which case speed is of major concern? Or is it for analytical and general statistical research? In the latter case the addition of logsheet data to catch and effort time series is of less urgency, but even so, in the time between receiving data and processing it into useful information should rarely be delayed beyond 3 months to avoid backlogs, misplaced logsheets etc.
LOGBOOKS/LOGSHEETS
DESIGN
DECISION-MAKING IN DESIGN DATA TYPES
ESSENTIAL • Identifiers: logsheet, vessel and gear in use; date. • Retained catch and discards: total weight for all species, for target
species and others, or for each species; or numbers and average weights.
• Effort: location; total number of gear, amount of time used, distance; details by day or by set/haul, etc.
DESIRABLE • Production: processed product by species, product type, size grades; by weight or box numbers, plus box average.
• Environment: wind (speed, direction, Beaufort scale); water temperature (surface, at-gear, and bottom); sea state, sky cover; water depth.
DATA PRECISION
• Weight/mass: 1, 10, 100 or 1000 kg units or metric tonnes; pounds/tons; other measure. Indicator whether weight is estimated or calculated using conversion factors from processing production.
• Species or species group weight: actual weight or proportion of total weight.
• Temperature: degree or decimal degree; centigrade or Fahrenheit. • Depth: metres, fathoms, or feet; to the nearest unit or decimal unit.
DATA CHECKING
• Effort: double recording through time and position of start and end, and through distance.
• Weight/Mass: double recording through catch estimation and through production records with conversion factors.
STANDARDISATION
• Form choice: Choose from • Common form for all fisheries, or • Fishery specific form; and • Common headers on forms: identifiers, operations, catch, production,
environment, confirmation, boxes for office use only

87
DECISION-MAKING IN DESIGN FORMAT
• Codes: use international standards or create codes for species, environment, operations, fishing gear, products, size grades, etc.
• Language: use national/regional/foreign or combination. • Check Boxes: use as alternatives to codes or information
descriptions where choices are limited. COPIES AND NUMBERING
• Copies: how many and for whom – usually 3 copies for vessel, company, fishery authority, plus optional for research, municipality, etc.
• Numbering: Logbook identifier on front cover, with sheets in numbered sequence. Logsheet identifier, including type, batch, sequential sheet number (use as primary key in logsheet data processing).
• Batch: identifier for new year, new design, new print run. • Distribution: decide who keeps which copy; if whole book is to be
submitted or appropriate logsheets. Estimate number of pages per logbook sufficient for trip/season and take into account processing speed requirements.
DATA PROCESSING DESIGN TO ASSIST DATA PROCESSING
• Information grouping: Information common to all fishery specific logsheets placed in similar boxes (position, size and shape) to correspond to data entry screens.
• Identifiers: sheet, vessel, date and other key fields placed in same place on all logsheets. (If logsheet issue is registered sheet identifier can be used as primary key and can retrieve vessel details directly, for checking and less data entry.)
ADDITIONAL INFORMATION
• Radio Reports: transmission details • Associations: FADs, buoys, sharks, marine mammals, birds, etc. • Seabed: rough ground, wrecks, cables, etc. • Sketches: school shape, ground shape, etc. • Blank space: space to allow fishers to make own notes on crew,
gear, vessel, supplies, etc. ERGONOMICS
• Layout: ensure logical layout according to sequence of fishing operations or events. (get professional form designer, if possible)
• Space: ensure sufficient overall size and space for each data item entry.
• Identification of Space: ensure proper identification (words, codes or graphics) and delineation of data space, e.g. for check boxes, column heads, event numbers, etc.
• Logbook: decide on external markings (vessel identifier, etc) and correct place for printing of instructions for completion and submission.
EASE OF USE AND DURABILITY
• Use: Ensure some form of completed form fold-away method. • Supply pre-addressed submission envelopes, or logsheet pre-printed
on reverse for folding into an envelope. • Different copy logsheets should be readily identifiable by text or
coloured papers. • Durability: Paper quality; should be carbon-less copy; might need to
be water/grease resistance. • Supply sealable, reusable folders, or in hard cover logbooks.
88
Decision-making on data types
Following some decisions on what data is possible to collect from a fishing operation, it is then necessary to decide on what data is required, and what is only desirable. It is clear that the fundamental estimation of catch (or production) and effort for research and compliance control purposes is always likely to be essential, but it is still necessary to determine exactly how these data need to be collected. Should the position and depth of fishing activities and the time of gear use be collected on a haul-by-haul basis in trawl fisheries? Should catch estimation be aggregated as a total amount or dis-aggregated by species groups or species? Or separated only for target species, others and discards? Much of this decision-making depends on the type of down-stream processing that will occur and the objectives of that processing. For example, with highly detailed haul-by-haul catch and effort information in demersal trawl fisheries it is possible to analyse census data for swept area/volume estimates of direct use in biomass assessment. Highly detailed species composition data also directly obtained from on-board records may offer support to studies of population dynamics and environmental and fisheries change. Production data that reveals detailed species, product and size grade information, together with other information, can reveal patterns of population structure also useful to stock dynamics and assessment. Thus, the characteristics of census data sets will also vary according to their use; the forms of analysis that are essential or desirable for fisheries research and management. Degree of precision required
Once the type and extent of data have been decided it is also very important to assess the degree of accuracy required. This will have multiple effects; at the stages of 1) designing the recording form, 2) compiling and processing the data, and 3) carrying out later analyses. Should catch weight be measured in 1 kg, 10 kg, 100 kg or 1000 kg units? Should position be accurate to the nearest second of arc; should it be recorded in decimal minutes? Should a total estimated catch be qualified by estimation of relative proportions of the species/group composition; or should each species mass be estimated separately? Should production data be recorded for every species, product type and size grade; should ‘box’ weight be recorded as gross or net of packaging/non-fish material? For environmental data, the measures may also be complicated by the type of data to be collected and the fact that codes may need to be used or developed to represent the data e.g. sea state, sea colour. Should water temperature be to the nearest degree or decimal degree? Design
Although the extent of data types may be large for any one fishery, the key to successful logsheet/logbook system design is primarily the relative simplicity of their completion by fishers and enumerators. Secondarily, it is useful if the methods of data processing are reflected in the design and layout of the form. Lastly, the methods used for the management of the paper should be explicit in the forms themselves. Details of logsheet design in relation to databases are addressed in a later section. In this section general attributes of logsheets are reviewed including their design, use and submission. Standardisation and use of common formats
Within a national or regional fisheries sector, efforts should be made to maintain single standards for data types and forms. The use of one standard form for all fisheries has often been attempted but, in so doing and given the demand for increasingly complex and extensive data coverage, it is often the case that for some fisheries the data on a standardised form is too simplistic for requirements. For other fisheries, the form may have data requirements that are too complex and may not be useful. Nevertheless, certain aspects of forms may be amenable to standardisation and the use of some common formats, and this can be taken into account when designing a logsheet form.

89
Fishery specific logsheets
While common formats for some groups of data on logsheets can be defined (see common headers and identifiers below), logsheets for specific fisheries should limit their data entry requirement to that required for the fishery. Thus, there is no reason to issue a logbook containing areas for production records if the vessels only land whole round fresh fish; similarly, if records are amenable to completion line by line on a daily basis (say for one week or one month on a single form), then a single logsheet for every day is not required. Registration and copies
The demand that fishers maintain a fishing vessel log in a statutory form places a responsibility on fishery authorities to administer its reception and processing in ways that assure both the authorities and the fisher or company that he has completed his responsibility. In complex fisheries, where several types of logsheet are maintained and fleet numbers are high, the administration of daily and monthly logs can be very great. There is therefore no real alternative but to issue logbooks/logsheets against a vessel and to register their return to the fishery authority. This can be done in a number of ways. Individual logbook numbers can be pre-printed on books together with a hand completion of the vessel details. In addition, individual logsheets can also be pre-printed with numbers running in consecutive order, so that a batch of sheets within one book can be registered with a start and end number. The return of the whole logbook or individual sheets can then be controlled. Decisions will also need to be made on the number of copies of each sheet, depending on the particular needs of the authority, the company and the fisher. Also, the retention of a completed book once all sheets are submitted needs to be decided. Will the logbook remain on board the vessel, or should the fisher retain only the copy of each sheet. In the former, the management of the paper on board is simpler in book form and inspection procedures can demand a whole book for review, rather than just the copies currently on board. However, this makes the management of the paper by the authority more difficult with the danger that single sheets may be lost before processing. Nevertheless, the submission of individual sheets in this case can provide the authority with immediate access to the information at first landing or on first inspection without waiting for the logbook to be completed before submission. Thus, the management of the individual logsheets and logbooks needs to be carefully addressed prior to printing. If logbooks are to be retained by the vessel then individual sheets should be numbered; if logbooks are submitted complete to the authority then it may only be necessary to number the whole book. It is often the case that additional information is required or that general design of logbook changes. To maintain the continuity of databases when data types and quantities vary in this way it will be necessary to identify the batch of a particular logsheet form for a fishery. For example, the identification sequence for a particular logsheet might be TLA00050 which identifies TL (Tuna Longline), A (first batch number), 00050 (sheet number). Similarly, a logbook serial number might be DWB00100-150, identifying DW (demersal wetfish), B (second batch number), 100-150 (consecutive sheet numbers in logbook). The additional advantage of such a scheme is that registered issue of logbooks/sheets against a vessel can be indexed through the database so that at data entry from a logsheet the primary logsheet identifier can be used to access vessel data (name, call sign, company etc.). The computerised vessel data can then be verified against the logsheet data and the data can be retrieved directly so that identification data need not be entered for each sheet. Common headers and identifiers
It is desirable to develop logsheet designs (and hence databases) that reflect the particular information requirements from specific fisheries. However, there are many common features of logsheets that can be designed and used between different logsheets. In particular, common headers and identifiers that will work for all fisheries might include the following data. Identifiers: Vessel name, company name, international radio, and call sign, licence number, trip number, etc.

90
Operational Headers: • Fishing gear - description (through codes) • Environment - water conditions (temperature, wave height, colour etc.) or climate
conditions (air temperature, wind speed and direction etc.) • Operations - activities and target species, fishing success (all identified by predetermined
codes or descriptions). • Production - species identification, product format with data based on pre-determined
codes etc. As pointed out in the previous section, the use of common identifiers (e.g. logsheet number or trip number) can be used in a number of ways, including: • access to the correct data entry program for a particular fishery; • allow for validity and completeness checking; and • provide a means for data entry operators to process similar data from a wide variety of
forms in familiar ways, thus assisting in accuracy and efficiency. Ergonomics, durability and ease of use
The key features of ergonomics, durability and ease of use of logsheet/logbook designs are often overlooked. The layout of a logsheet design needs to take into account the working practices of the fisher and vessel. The space available for each data entry item needs to be adequate at the appropriate level of data precision; it also needs to be positioned in the appropriate place for the sequence of events during fishing to allow a logical continuity of data entry. Logsheets need to be durable for the period they cover; daily, weekly, monthly or continuous (from sheet to sheet). Thus, paper quality can be important, in some circumstances perhaps water or grease resistant. They should also be easy to use both in terms of clarity about what is required (a detailed set of completion instructions should accompany the sheets) and, where multiple copies are required, the use of carbon-less copy paper and top/middle/bottom copies identified directly e.g. Copy 1 to Fishery Authority, Copy 2 to Company, Copy 3 to Fisher or by different coloured papers. Ideally, durable and re-usable folders containing the logbook, instructions for completion, place for other stationary (notes, pre-addressed submission envelopes, pencil, calculator, calendar, diary, etc.) would provide a useful ‘kit’ which would assist fishers in managing the way logbooks are used and kept in good condition. Language
In fisheries where there may be foreign operators/fishers from distant water fishing nations, in joint ventures or simply contracted foreign employees, it is desirable to offer some forms of assistance in language through logsheet design. This may be undertaken in a number of ways, including: • minimization of required written descriptions through the use of codes; • instructions for completion (with examples) in the foreign language; • header and column/row identifiers in dual language; and • the fisher’s sheet, as copy 1, in the foreign language and copies 2 and 3 in the national
language, so that top copy completion is easy for the fisher. The objective of this is to ensure that there are no errors of translation or interpretation.

91
LOGBOOKS – DECISION-MAKING IN THEIR USE REGISTRATION AND ISSUE
Purpose: To monitor logsheet returns against other sources of information on vessel activity e.g. trip management records, landings, port movement records. Method: • Register logbook/logsheet numbers in a paper register
or preferably database by entering the identifier, including start and end sequence number.
• Mark the outer cover of the logbook with the vessel identifiers, issuing authority or person and date issued.
• Issue sufficient logbooks/logsheets in advance to cover fishing trip, fishing season or other period to be decided.
INSTRUCTION FOR COMPLETION
Purpose: To ensure vessel fishers (or others) know how to complete logsheets. Method: • Summary instructions for completion printed on the
inside or back cover of the logbook and or insertions to provide a primary guide, in particular in relation to the specific codes used in the particular logsheet.
• Detailed instructions for completion should be made available to fishers, fleet managers/shore fishers, company managers, observers and inspectors to provide all concerned with the precise manner in which they are to be completed.
TRAINING FISHERS AND USE AS FISHER’S LOG
Purpose: To satisfy fishers, companies and fishery authorities that all has been done to assist fishers in logsheet completion and submission. Method: • There are likely to be many methods depending on the
fishery (formal, ad hoc, video/demo; through observers, inspectors or researchers.)
• Train fleet managers who then train fishers. • Encourage fisher to use logsheet as primary vessel
record to prevent transcription errors (see: provision of blank space for fishers notes in logsheet design).
DECLARATION BY FISHERS, OBSERVERS AND INSPECTORS
Purpose: Logsheets to be signed since they are (often) legal documents, which must be completed and submitted as a true representation of fishing activities. Method: • fishers to sign logsheet (all copies). • observers to check contents against independent
observations (catch, effort, location, etc) and sign. • inspectors to sign, if inspected at sea or received on
land.

92
LOGBOOKS – DECISION-MAKING IN THEIR USE SUBMISSION
Purpose: To return logsheets according to legal/administrative requirements. Method: • Distribution of copies: Decide on who gets which copy
of the logsheet; does the logbook stay with the vessel, or is it submitted to the fishery authority as the complete logbook, and vessel keeps removable sheets, etc.
• Timeliness: Decide appropriate time interval between return to port and logbook/logsheet submission, taking into account the method of submission and distance from reception centre i.e. to inspector/observer or office, or by post.
LOGSHEET RETURN REGISTRATION
Purpose: To maintain an audit trail of the paper between issuance and submission to ensure the legal/administrative requirement is satisfied; to ensure full data coverage. Method: Register logbook/logsheet identifier, return date/time and receiving person in paper register or preferably in licence database against the vessel.
LOGSHEET PROCESSING
Purpose: To update the database at appropriate time. Method: Enter data to database at appropriate time; decide whether data is needed for quota or other immediate management purposes (process quickly) or for research (short delay to processing allowable).
LOGBOOK USE
Registration and issue
Logbooks should be registered and issued to allow the fishery authority to monitor their rate of return. This offers a method for estimating data coverage, particularly where census data is needed for production statistics and forms the source information for analytical stock assessment methods. The ‘paper chase’ is often overlooked in administrative practices, but forms an essential part of fishery authority tasks. Although this can be relatively simple in small fisheries, in large fisheries when hundreds, perhaps thousands, of fishing vessels are involved, a daily mechanism to follow up outstanding logsheets becomes essential. Non-submission when logsheets are compulsory should lead to legal or administrative penalties and thus record keeping on their registration, issuance and submission will provide primary evidence for any legal action. Instructions for completion and training of Fishers
Although simplicity is desirable on data types and daily data coverage, it may not always be possible and thus high quantities of data in complex forms may be required; codings may often be necessary as a way of capturing descriptions. Thus, detailed instruction to fishers on how to complete logsheet forms will always be required. This should be printed on cover pages of logbooks in separately issued instructions (and in appropriate languages). Ideally fishers should undergo some training in their completion both at initial introduction and when a new logsheet batch with altered contents or layout replace an original. Maintenance of information and mechanisms to ensure active completion
Regulations usually require that logsheets are completed on a daily basis and submitted within a certain number of days following return to port. Procedures to ensure this revolve largely around active compliance control through reports by observers, inspectors and through a registration system. A register will enable identification of logsheets not returned after a certain period and prompt any follow up, including legal action.
93
Use as fisher’s log
In large industrial fisheries most fishers will also keep their own log but in smaller scale operations this may not be done or even be feasible. Therefore, logsheets might offer an alternative to other forms of fishers logs, perhaps by including areas on the form in which special notes can be made only of relevance to his use e.g. crew, supplies, maintenance etc. Catch and Production data
Catch data is usually based on the experienced estimate of the fisher at the time of landing the fish and will always only form an approximate guide to the true tonnage landed. It can be recorded by trap, by haul or other measure of effort but can also be estimated through production data, usually on a daily or processing shift basis. Data on processed fish will usually be in the form of boxes/weight by species, product type and size grade. (See later section for methods of recording these). Effort verification
There are many ways to design logsheets to record and thus verify the fishing effort applied. In most cases, this relates to recording the amount of time that the gear has been actively fishing or the area/volume of water through which the gear fished. Both time and distance measures for the same operation should be recorded where this is possible.
SUBMISSION AND REGISTRATION
Checking by observers and inspectors
When observers are on board they will usually be tasked to make their own determinations of the data on logsheets, from area fished to effort applied, total catch and species composition. At regular intervals (daily, weekly or at landing) these officials should compare their information to the fisher’s and reach agreement on the accurate completion of the logsheet to which they attach their signature. Declaration by Fishers
When logsheets are legally required (in fisheries acts and regulations), it is important to ensure that fishers attest the accuracy of their completion by a signed declaration. Timeliness of submission
Fishery authorities generally would wish to receive and process logsheet data at the earliest opportunity. The timing of this is dependent on a number of factors including: • the operating characteristics of the fishery (trip length, remoteness of landing site and
means of communication); • the fishery authority requirements (individual logsheet submission at landing or return to
port, or whole logbook submission when it has been completed), which in turn depends on the processing and analytical requirements: is the data used for quota/effort management or research?
If the legal requirement is for daily completion, then there is no reason to delay submission following return to port. Although immediate submission can be insisted upon in places where fishery authorities are represented, due consideration should be given to transmission times from remote sites. Logsheet return registration
As part of the ‘audit trial’ that keeps control of the paper logsheets, registration that the logsheets have been received should be made. In this way, issued logsheets are immediately checked against returns, as part of the process to ensure complete fleet data coverage.

94
LOGSHEET DESIGN AND DATABASES
The processing of increasingly complex logsheet data sets can be a difficult task. Not only are large quantities of data being generated by fleets, but also these are submitted almost daily. Keeping a track on these records requires serious administrative effort, attention to detail and careful follow up if the census data that is received is not to accumulate into unprocessed piles or failure to submit is over-looked and the coverage of data is incomplete. Design in relation to data entry screens
Data entry to processing systems, whether manual or computerised, should be made as simple and as accurate as possible. One way of doing this is to ensure that logsheet design in some ways mirrors the processing methods. A logical flow of data on the logsheet should be reflected in an equivalent ‘view’ in data processing. Data entry screens can be developed to capture the different areas of a logsheet, as follows; Header information: the name, licence and IRCS of the vessel; fisher’s name; trip number or trip start date, logsheet number, date (if daily catch log). Fishing Gear and General Fishing Operations: identification of fishing gear used (that day), environment information, general fishing area if not identified as precise location for each fishing activity (haul, line or trap set). Operations and Catch: for each fishing activity, the target species, date (if weekly, monthly or continuous catch log), start time and position, end time and position (latitude/longitude or grid square code or area code), gear and bottom depth, success, catch and discard weight or number (total, species group or species). Production: for each day or shift and for each species, product type and size grade, the total box weight or number of standard boxes. Coding and Measures
Standard codes and measures should be used wherever practicable. This enables simplified recording on logsheets but is also very useful in database design. They can be alphanumeric or simple numeric, and they can act as keys to data retrieval and verification. In some cases, there may be international standard codes that can be used; otherwise codes can be simply developed and used as long as their description and purpose are made clear in instructions to fishers. Species: the 3-alpha species code used in many international species lists is the most useful since it can be set up in the database against scientific and local names in a number of languages. Fishing Gear: There is no accepted standard coding perhaps because there are so many variations used, but it should be possible to develop a code list once fishery characteristics are known. These can be added to as new gears are introduced and perhaps should be alpha-numeric to enable variations on one type of gear to be identified e.g. DL01, where DL = demersal longline, 01 = hook spacing type 1, etc. Gear Deployment: code to identify the way in which the gear has been set, the success of the set (hang-up, lost, etc.), type of bait used, escape panels/doors set, grids/TEDs, etc. Product: code to identify the product type e.g. WR (whole round or green weight), GU (gutted), GG (gilled and gutted), HG (headed and gutted), HT (headed and tailed), FU (fillet untrimmed), FT (fillet trimmed), FM (fish meal), FO (fish oil), etc.; code to identify size grade - these may be industry or company standards, and in the latter databases can contain look-up tables to translate these as required. Environment: international code for sea state; sky cover; wind direction, etc. Standard measures should also be adopted for weight (kilograms or metric tonnes, pounds or tons), temperature (0F or 0C), depth (fathoms or metres), vessel and wind speed (knots or kilometres), latitude and longitude (degrees, minutes and seconds or degrees and decimal minutes), etc.

95
Check boxes and their use
For some data types, it is possible to use check boxes or graphics that can be marked rather than descriptions or codes being entered. This simplifies recording but also simplifies data entry procedures e.g. for environment information such as sea state, wind direction, sky cover; or gear type and operation (in port, transhipping, steaming, fishing, broken down etc). Serial numbers and their registration
If logsheets have serial numbers and their issue is registered against a vessel, then entering only the logsheet number should enable the system to index it against all the vessel details and so fill in much of the header information automatically. Data entry operators can then check these against the recorded details as a first level of error trapping. Verification of activities against licence type and conditions
In addition to accepting data, a logsheet processing system can also provide for a range of preliminary analyses, in particular checking that the vessels activities as recorded in the logsheet are in accordance with its licence and general fishing conditions. The vessel identifier and date can be used immediately to assess if, in fact, fishing was allowed on that day, say in the case of limited effort fisheries with tie-up periods, or season open and closure dates. The vessel and fishing area will check whether the allowable area was fished. Fishing gear, target species, permissible by-catch, etc. can all be checked against licence conditions. Either the data entry for that logsheet could be terminated if anomalies are found, or be allowed to proceed but with a specific report generated after completion. Error trapping and use of raising factors
Computer systems not only offer the ability to assess whether the fishing registered on the logsheet was allowable but also the scale and type of data entered. Data range checking should be implemented for all critical data to prevent such things as unlikely positions (latitude/longitude within the range of the fishery) or unlikely masses (tonnes instead of kilograms for example). Raising factors applying to fish mass recorded can be applied at the time of data entry, or more usually at the time of analysis. The raw data should be stored as this is the record as agreed to by the fisher and could form the basis of argument if paper and database records are different because of the use of raising factors. Electronic logbooks
Electronic logbooks can be used in a number of ways. They are still being developed. Essentially they can provide a simplified way of processing data that can be passed on to fishery authorities directly, thus avoiding errors and costs in transcription and data entry. They can also be used to simplify the data capture process in the first place. For example, during a whole fishing trip on a particular vessel there would be no need to enter the vessel identifiers, this would simply be added to the whole data file for that trip. The logbook could automatically move to the next day, or date and time stamp each data entry by the fisher, thus assisting in proper identification of fishing effort when it occurs over midnight. Electronic logbooks also allow for greater use of automatic data capture through attachment to sensors, such as GPS, further simplifying data entry (see section on VMS). Coding and measures
The same codes would be used as for logsheets and landings sheets. However, the data entry screen could easily be adapted to use specific front ends (user interfaces) that use greater descriptions while only entering the codes to the database. The measures used would be fixed within that system.
96
Interfaces to equipment sensors
Ideally, electronic logbooks would be integrated with other onboard systems including GPS, navigation software and equipment, and environmental and engineering sensors. Through a specific interface, for example, pressing one key (or clicking on the appropriate fishing position box on the screen) would automatically check and input the latitude and longitude directly from a GPS unit. To that event position, such as gear on bottom/gear being hauled, would be added the date and time, and it might be possible also to add surface water temperature, temperature at the gear, bottom and gear depth, or other environmental data. Data storage and communications
Clearly, the harsh environment of a vessel’s bridge is not the place for non-ruggedised computer equipment and care would need to be taken in storage of data through tape or disk backup procedures, although these of course can be automated. Even immediate printout and paper file storage would be a likely additional level of data security. Both printouts and data files could be supplied to fishery authorities immediately the vessel returns to port. However, modern communications methods, such as access to the Internet for electronic messaging may be a method for the future. Summary outputs
One of the most attractive features of electronic logbooks would be their ability to prepare summary outputs directly for the vessel’s records, the fisher’s records and for the company or fishery authority, in addition to the detail offered in each logsheet. These might include fishing maps and environmental summaries and, of course, fishers may analyse their databases over time to assess/recall their favourite fishing ground.
SOCIO-CULTURAL QUESTIONNAIRES/INTERVIEWS The three fundamental goals of socio-cultural research on fisheries are:
To understand the social and cultural value of the resource to harvesters and their communities. This involves describing and enumerating ways in which the resource and its harvesting and processing are perceived of and valued as a way of life. The fishery, its activities and products, may be intertwined with many details of daily life, such as how individuals spend their time, make a living, form families, friends, and/or a community, in what institutions they participate (e.g., schools, churches, clubs, government, etc.). Comparisons between and among different groups helps identify potential sources of conflict and compromise. To describe the multiple communities (both discrete and overlapping) of which stakeholders consider themselves to be members. In addition to individual behaviour, it is important to understand the culture or society as a whole. This involves mapping the networks and institutions of stakeholders, assessing the degree of overlapping membership and goals both among harvester and/or processor dominated communities and between such communities and those less directly tied to harvesting and/or processing. It is also critical to evaluate the fishery management institutions, since their beliefs and perceptions are as critical to understanding the fishery and its behaviour as are those of the fishing industry and fishing communities. We need to understand these different spheres individually, but also how these spheres interact and influence one another. To enhance the effectiveness of fisheries management. This involves identifying such cases as a) where resource access needs to be restricted in order to provide for future sustainability, the option or options that provide the least social and economic disruption and dislocation to the associated fishing population or community, b) in any circumstances, cases of differential impact or potential conflict and the perceived fairness of those impacts and c) promising local resource management regimes.

97
This section gives details on the design and use of three basic socio-cultural data forms: a owner/fisher/crew member questionnaire, a fishing household questionnaire, and a fishing community questionnaire. Each section is designed so it can be used alone. It provides background and use for each form and its data elements, and a general table on decision-making in design for each form. Additional social scientific research may need to be carried out by social scientists, but the forms below offer examples of data that can be collected by any trained enumerator. Socio-culture cannot be examined in isolation from economic and biological data and issues. Cultural beliefs interact with the state of the biological resource, social institutional constraints, and economic conditions. Thus, it is imperative that all socio-cultural forms include variables that allow linking to other data sets of biological, economic, and operational data. These data are used primarily for policy analysis, to measure management indicators and for research. As such, they are generally gathered at most annually and sometimes at longer intervals (e.g. 3, 5, or 10 years). Once gathered, however, the data should be entered as quickly as possible into databases to facilitate data verification and validation. If long periods are allowed to pass before the data are computerised and initial analyses made, then it may be impossible to ascertain the source of or reason for any anomalous data.
OWNER/FISHER/CREW QUESTIONNAIRE/INTERVIEW
This questionnaire is administered to each vessel owner, vessel fisher and vessel crew member. It gathers several types of data, used for different purposes: • Identifiers are of two types: 1) those which will allow these data to be linked to other
datasets such as vessel registers, fisher licences, trip interview data (e.g. catch, effort, variable costs, value), and the household questionnaire; 2) those which allow the individual questionnaire to be followed through the data audit system, e.g. sample number, enumerator, encoder.
• Demographic data on the individual, which will 1) allow for general descriptions of the fishing population for country fishery profiles, 2) provide the base data for analysing patterns in the distribution of fishing income, dependence on fish for food, etc. by fishery, and 3) allow for analysis of changes in fishing pattern that may be linked to location of residence, ethnic background, age of the fisher, level of education, etc.
• Household data to serve as a cross-check for data in the household questionnaire. Adding these questions here also provides some very minimal household data in the event that Household Questionnaires are unavailable.
• Social data are one measure of the degree of social organisation within the fishing community and also the degree to which fishers are embedded within the larger society. These provide more detailed individual level data specifically on fishers than those requested on the household questionnaire, which are for the household as a whole.
• Employment data are important for analysing dependence on the fishery by both the individual and the household. They can also be used in assessing opportunity costs, since they provide data on the individual’s experience in non-fishing employment and their likely choice of alternate occupation should that become necessary or desirable. They are a check against household questionnaire data and also provide a minimum set of data when household questionnaires are not available.
• Fishery data serve as a cross-check for data from trip interviews. And in the absence of a vessel register, these data may be the only way to link individuals to vessel types and fisheries. If this link to fishery types/fleets cannot be made then the data from this questionnaire are of limited use.
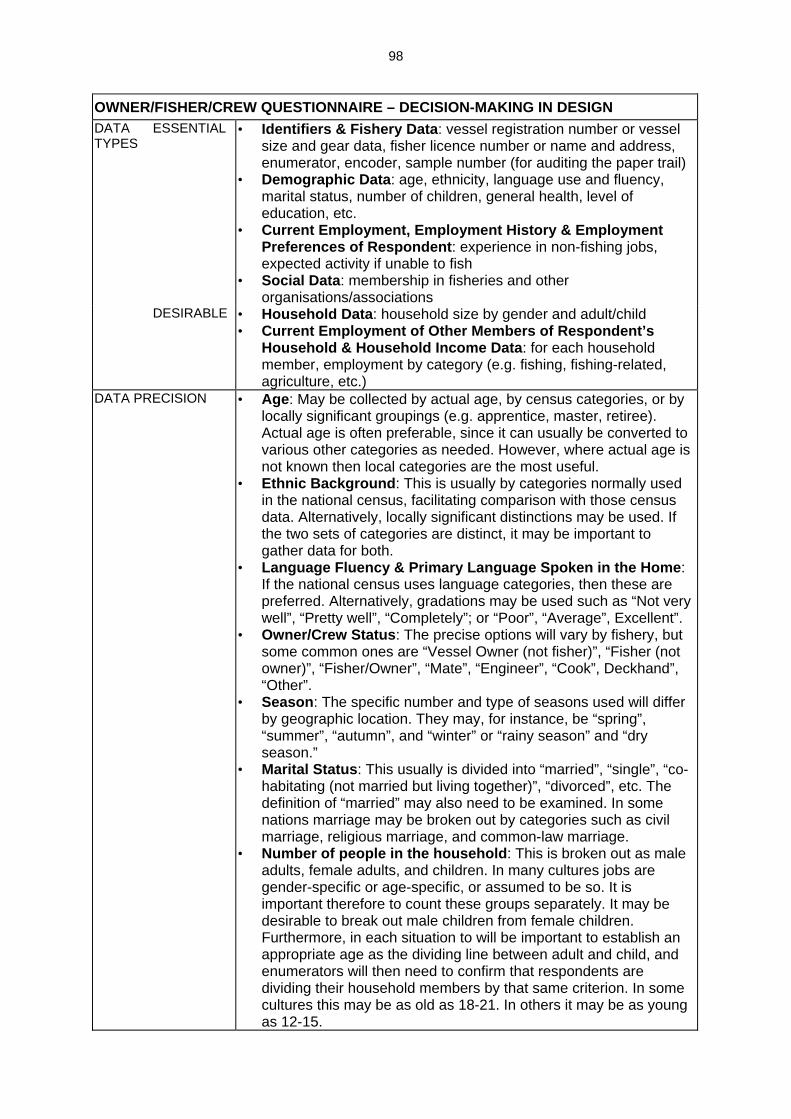
98
OWNER/FISHER/CREW QUESTIONNAIRE – DECISION-MAKING IN DESIGN
DATA TYPES
ESSENTIAL • Identifiers & Fishery Data: vessel registration number or vessel size and gear data, fisher licence number or name and address, enumerator, encoder, sample number (for auditing the paper trail)
• Demographic Data: age, ethnicity, language use and fluency, marital status, number of children, general health, level of education, etc.
• Current Employment, Employment History & Employment Preferences of Respondent: experience in non-fishing jobs, expected activity if unable to fish
• Social Data: membership in fisheries and other organisations/associations
DESIRABLE • Household Data: household size by gender and adult/child • Current Employment of Other Members of Respondent’s
Household & Household Income Data: for each household member, employment by category (e.g. fishing, fishing-related, agriculture, etc.)
DATA PRECISION • Age: May be collected by actual age, by census categories, or by locally significant groupings (e.g. apprentice, master, retiree). Actual age is often preferable, since it can usually be converted to various other categories as needed. However, where actual age is not known then local categories are the most useful.
• Ethnic Background: This is usually by categories normally used in the national census, facilitating comparison with those census data. Alternatively, locally significant distinctions may be used. If the two sets of categories are distinct, it may be important to gather data for both.
• Language Fluency & Primary Language Spoken in the Home: If the national census uses language categories, then these are preferred. Alternatively, gradations may be used such as “Not very well”, “Pretty well”, “Completely”; or “Poor”, “Average”, Excellent”.
• Owner/Crew Status: The precise options will vary by fishery, but some common ones are “Vessel Owner (not fisher)”, “Fisher (not owner)”, “Fisher/Owner”, “Mate”, “Engineer”, “Cook”, Deckhand”, “Other”.
• Season: The specific number and type of seasons used will differ by geographic location. They may, for instance, be “spring”, “summer”, “autumn”, and “winter” or “rainy season” and “dry season.”
• Marital Status: This usually is divided into “married”, “single”, “co-habitating (not married but living together)”, “divorced”, etc. The definition of “married” may also need to be examined. In some nations marriage may be broken out by categories such as civil marriage, religious marriage, and common-law marriage.
• Number of people in the household: This is broken out as male adults, female adults, and children. In many cultures jobs are gender-specific or age-specific, or assumed to be so. It is important therefore to count these groups separately. It may be desirable to break out male children from female children. Furthermore, in each situation to will be important to establish an appropriate age as the dividing line between adult and child, and enumerators will then need to confirm that respondents are dividing their household members by that same criterion. In some cultures this may be as old as 18-21. In others it may be as young as 12-15.

99
OWNER/FISHER/CREW QUESTIONNAIRE – DECISION-MAKING IN DESIGN
DATA PRECISION • Employment categories: “Fishing” may be commercial-fishing only, or it may include recreational-fishing. “Fishing-related” will definitely vary from situation to situation in its specifics, but generally will include anyone involved in post-harvest processing (whether as owner or employee of a large processing plant, or as a very small operator such as a shrimp peeler), wholesale and retail fish sellers, and those employed in direct support industries (e.g. marine fuel dealers, ice suppliers, chandlers, ship or boat yards). Other common categories are “agriculture”, “aquaculture”, “full-time student”, and “other”. In some locations it may be desirable to use other specific categories such as “mining”, “electronics industry,” etc. – based on the common industrial and employment profile of the region or nation.
• Household: It is important to define who constitutes a member of a household. Members of a household include both 1) those living at the same place of residence and 2) those who have been away for less than a year (as for example a student away at school or a person engaged in seasonal migratory labour). Members of a household may be kin (relatives) or non-kin, as long as they reside together and share income and expenses.
DATA CHECKING Form choice: Always include: • Common headers on forms: identifiers, vessel data links,
household data links, boxes for office use only Choose from • Common form for all fisheries or fishery specific form • Common form for owners versus non-owners
STANDARDISATION
• Codes: use international or national standards or create codes for target species, fishing gear, ethnicity, language
• Language: use national/regional/foreign or combination • Check Boxes: use as alternatives to codes or information
descriptions where choices are limited FORMAT • Copies: how many, for whom – e.g. respondent, fishery authority,
plus optional for research, municipality, etc. • Numbering: Questionnaire identifier on front page, plus sheets in
numbered sequence, or on each sheet including type, batch, sequential sheet number (use as primary key in questionnaire data processing)
• Batch: identifier, for new year, new design, new print run METHOD Method choice:
• Form used as a questionnaire, i.e. provided to the respondent who fills it out and later returns it to the fisheries authority
• Form used as an interview, i.e. filled out by an enumerator who poses the questions to the respondent and records them him or herself
COPIES AND NUMBERING
• Information grouping: Information common to all fishery or ownership specific questionnaire forms placed in similar boxes (position, size and shape) to correspond to data entry screens.
• Identifiers: form, vessel, respondent identifiers, date and other key fields placed in same place on all forms.
ADDITIONAL INFORMATION
• Blank space: space to allow enumerator to note additional comments made by respondents or observations made by the enumerator

100
OWNER/FISHER/CREW QUESTIONNAIRE – DECISION-MAKING IN DESIGN
DATA PROCESSING DESIGN TO ASSIST DATA PROCESSING
• Layout: ensure logical layout with related information grouped together (get professional form designer, if possible)
• Space: ensure sufficient overall size and space for each data item entry.
• Identification of Space: ensure proper identification (words, codes or graphics) and delineation of data space, e.g. for check boxes, column heads, event numbers, etc.
• Form: decide on external markings (respondent name, etc) and correct place for printing of instructions for completion and submission.
ERGONOMICS • Use: For questionnaires, supply pre-addressed submission envelopes, or questionnaire pre-printed on reverse for folding into an envelope.
FISHING HOUSEHOLD QUESTIONNAIRE/INTERVIEW
This questionnaire is administered in a fishing community to each household, which has at least one fisher as a member. The respondent should be an adult. It gathers several types of data, used for different purposes: • Identifiers are of two types: 1) those which will allow these data to be linked to other data
sets such as vessel registers, fisher licences, trip interview data, and the fisher/owner/crew questionnaire; 2) those which allow the individual questionnaire to be followed through the data audit system, e.g. sample number, enumerator, encoder.
• Demographic data on the household, which will 1) allow for general descriptions of the fishing communities for country fishery profiles, and 2) provide the base data for analysing patterns in the distribution of and dependence on fishing income, dependence on fish for food, etc. at the household and community level for impact analysis.
• Social data are one measure of the degree of social organisation within the fishing community and also the degree to which fishers are embedded within the larger society.
• Employment data are important for analysing household dependence on the fishery. These data also cross-check those gathered at the individual level in the owner/fisher/crew questionnaire.
• Food dependence data are used in assessing the relative dependence of different fishing households, fleets and communities on fish as a food source.
• Fishery data Vessel descriptive data are needed in the absence of a vessel register, in order to link individuals to vessel types and fisheries. If this link to fishery types/fleets cannot be made then the data from this questionnaire are of limited use. If vessel registers exist, then only the vessel registration number of the vessel each fisher is associated with need be collected.
• Infrastructure data enable evaluation of the quality of life of fishing households relative to the general state of infrastructure in the community as described by data from the fishing community infrastructure and institution questionnaire.

101
FISHING HOUSEHOLD QUESTIONNAIRE – DECISION-MAKING IN DESIGN
DATA TYPES
ESSENTIAL
• Identifiers & Fishery Data: vessel registration number or vessel size and gear data, fisher licence number or name and address, enumerator, encoder, sample number (for auditing the paper trail)
• Social Data: membership in fisheries and other organisations/associations
• Household Demographic Data: household size by gender and adult/child
• Current Employment of Other Members of Respondent’s Household & Household Income Data: for each household member, employment by category (e.g. fishing, fishing-related, agriculture, etc.)
• Infrastructure Data: plumbing, electricity, communications, etc. DATA PRECISION • Ethnic Background: This is usually by categories normally used in
the national census, facilitating comparison with those census data. Alternatively, locally significant distinctions may be used. If the two sets of categories are distinct, it may be important to gather data for both.
• Language Fluency & Primary Language Spoken in the Home: If the national census uses language categories, then these are preferred. Alternatively, gradations may be used such as “Not very”, “Pretty well”, “Completely”; or “Poor”, “Average”, Excellent”.
• Owner/Crew Status: The precise options will vary by fishery, but some common ones are “Vessel Owner (not fisher)”, “Fisher (not owner)”, “Fisher/Owner”, “Mate”, “Engineer”, “Cook”, Deckhand”, “Other”.
• DATA PRECISION • Number of people in the household: This is broken out as male
adults, female adults, and children. In many cultures jobs are gender-specific or age-specific – or assumed to be so. It is important therefore to count these groups separately. Further, in each situation to will be important to establish an appropriate age as the dividing line between adult and child, and enumerators will then need to confirm that respondents are dividing their household members by that same criterion. In some cultures this may be as old as 18-21. In others it may be as young as 12-15.
• Employment categories: Fishing may be commercial-fishing only, or it may include recreational-fishing. “Fishing-related,” for instance, will vary from situation to situation in its specifics, but generally will include anyone involved in post-harvest processing (whether as owner or employee of a large processing plant or as a very small operator such as a shrimp peeler), wholesale and retail fish sellers, and those employed in direct support industries (e.g. marine fuel dealers, ice suppliers, chandleries, shipyards). Other common categories are “agriculture”, “aquaculture”, “full-time student”, and “other”. In some locations it may be desirable to use other specific categories such as “mining”, “electronics industry,” etc. – based on the common industrial and employment profile of the region or nation.
• Household: It is important to define who constitutes a member of a household. Members of a household include both 1) those living at the same place of residence and 2) those who have been away for less than a year (as for example a student away at school or a person engaged in seasonal migratory labour). Members of a household may be kin (relatives) or non-kin, as long as they reside together and share income and expenses.
DATA CHECKING • Common headers: Always include on forms - identifiers, vessel data links, household data links, boxes for office use only

102
FISHING HOUSEHOLD QUESTIONNAIRE – DECISION-MAKING IN DESIGN
STANDARDISATION
• Codes: use international or national standards or create codes for target species, fishing gear, ethnicity, language
• Language: use national/regional/foreign or combination • Check Boxes: use as alternatives to codes or information
descriptions where choices are limited FORMAT • Copies: how many, for whom – e.g. respondent, fishery authority, plus
optional for research, municipality, etc. • Numbering: Questionnaire identifier on front page, plus sheets in
numbered sequence • Questionnaire identifier, including type, batch, sequential sheet
number (use as primary key in questionnaire data processing) • Batch: identifier, for new year, new design, new print run
METHOD Method choice: • Form used as a questionnaire, i.e. provided to the respondent who fills
it out and later returns it to the fisheries authority • Form used as an interview, i.e. filled out by an enumerator who poses
the questions to the respondent and records them him or herself COPIES AND NUMBERING
• Information grouping: Information common to all questionnaire forms placed in similar boxes (position, size and shape) to correspond to data entry screens.
• Identifiers: form, vessel, respondent identifiers, town, date and other key fields placed in same place on all forms.
ADDITIONAL INFORMATION
• Blank space: space to allow enumerator to note additional comments made by respondents or observations made by the enumerator
DATA PROCESSING DESIGN TO ASSIST DATA PROCESSING
• Layout: ensure logical layout with related information grouped together (get professional form designer, if possible)
• Space: ensure sufficient overall size and space for each data item entry.
• Identification of Space: ensure proper identification (words, codes or graphics) and delineation of data space, e.g. for check boxes, column heads, event numbers, etc.
• Form: decide on external markings (town name, etc) and correct place for printing of instructions for completion and submission.
ERGONOMICS • Use: For questionnaires, supply pre-addressed submission envelopes, or questionnaire pre-printed on reverse for folding into an envelope.
FISHING COMMUNITY INFRASTRUCTURE & INSTITUTION QUESTIONNAIRE
This questionnaire is conducted in each fishing community. The enumerator/observer will obtain some of the data by observation of infrastructure elements, and other data by visiting local vital statistics and fisheries offices. The questionnaire gathers several types of data, used for different purposes: • Identifiers are of two types: 1) those which will allow these data to be linked to the
fishing household questionnaire; 2) those which allow the individual questionnaire to be followed through the data audit system, e.g. sample number, enumerator, encoder.
• Demographic data noted here are summary vital statistics available from other agencies.
• Fishing and Fishing-Related Infrastructure & Institution data indicate the relative dependence of the community on fishing and are also useful for assessing the opportunities and potential need for investment in new infrastructure. The data on fishing and fishing-related institutions, such as fisher associations and co-operatives, will be important for analysing the management structure and potential interfaces for co-management.

103
• Educational Infrastructure & Institution data are needed for comparison with education data from the owner/fisher/crew questionnaire and the fishing household questionnaire in order to assess the status of fishers and fishing households in relation to the community as a whole.
• Transportation and Communications Infrastructure & Institution data are needed for comparison with data from the fishing household questionnaire in order to assess the status of fishers and fishing households in relation to the community as a whole.
• General Community Infrastructure & Institution data are needed for comparison with data from the fishing household questionnaire in order to assess the status of fishers and fishing households in relation to the community as a whole.
FISHING COMMUNITY INFRASTRUCTURE & INSTITUTION QUESTIONNAIRE – DECISION-MAKING IN DESIGN DATA TYPES
ESSENTIAL • Identifiers & Fishery Data: vessel registration number or vessel size and gear data, fisher licence number or name and address, enumerator, encoder, sample number (for auditing the paper trail)
• Infrastructure & Institution data: These should include data under the categories of fishing and fishing-related, educational, transportation and communications, and general community.
DESIRABLE • Demographic Data: total population, broken out by male and female; vital statistics such as birth rate, death rate, immigration/emigration data; crime rate.
DATA PRECISION • These data are mostly actual counts or simple yes/no responses DATA CHECKING • Always include common headers on forms: identifiers, vessel
data links, household data links, boxes for office use only STANDARDISATION
• Language: use national/regional/foreign or combination • Check Boxes: use as alternatives to codes or information
descriptions where choices are limited FORMAT • Copies: how many, for whom – usually 2: fishery authority, plus
optional for research, municipality, etc. • Numbering: Questionnaire identifier on front page, plus sheets
in numbered sequence • Questionnaire identifier, including type, batch, sequential
sheet number (use as primary key in questionnaire data processing)
• Batch: identifier, for new year, new design, new print run METHOD • Form must be used as an interview, i.e. filled out by an
enumerator/observer who poses the questions or records observations
COPIES AND NUMBERING
• Information grouping: Information common to all questionnaire forms placed in similar boxes (position, size and shape) to correspond to data entry screens
• Identifiers: form, identifiers, date and other key fields placed in same place on all forms.
ADDITIONAL INFORMATION
• Blank space: space to allow enumerator to note additional observations
DATA PROCESSING DESIGN TO ASSIST DATA PROCESSING
• Layout: ensure logical layout with related information grouped together (get professional form designer, if possible)
• Space: ensure sufficient overall size and space for each data item entry.
• Identification of Space: ensure proper identification (words, codes or graphics) and delineation of data space, e.g. for check boxes, column heads, event numbers, etc.
• Form: decide on external markings (town name, etc) and correct place for printing of instructions for completion and submission.
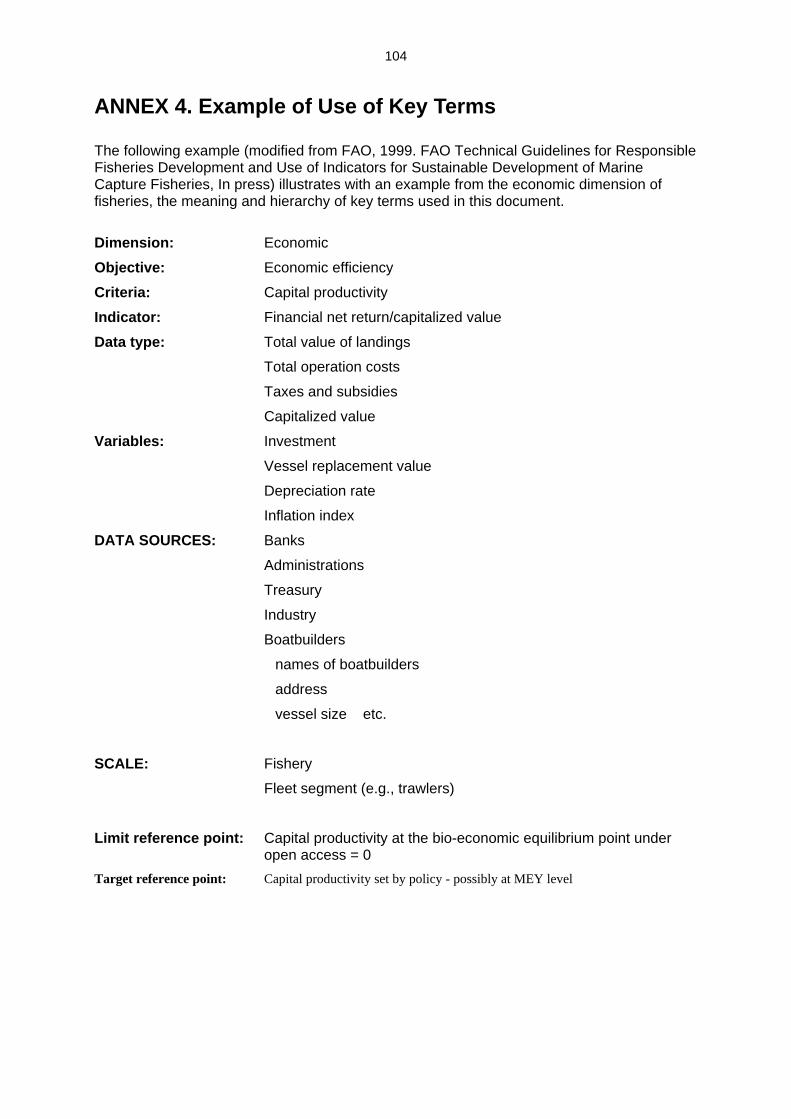
104
ANNEX 4. Example of Use of Key Terms
The following example (modified from FAO, 1999. FAO Technical Guidelines for Responsible Fisheries Development and Use of Indicators for Sustainable Development of Marine Capture Fisheries, In press) illustrates with an example from the economic dimension of fisheries, the meaning and hierarchy of key terms used in this document. Dimension: Economic
Objective: Economic efficiency Criteria: Capital productivity Indicator: Financial net return/capitalized value Data type: Total value of landings Total operation costs
Taxes and subsidies
Capitalized value Variables: Investment Vessel replacement value
Depreciation rate
Inflation index
DATA SOURCES: Banks Administrations
Treasury Industry
Boatbuilders
names of boatbuilders
address
vessel size etc.
SCALE: Fishery
Fleet segment (e.g., trawlers)
Limit reference point: Capital productivity at the bio-economic equilibrium point under
open access = 0 Target reference point: Capital productivity set by policy - possibly at MEY level
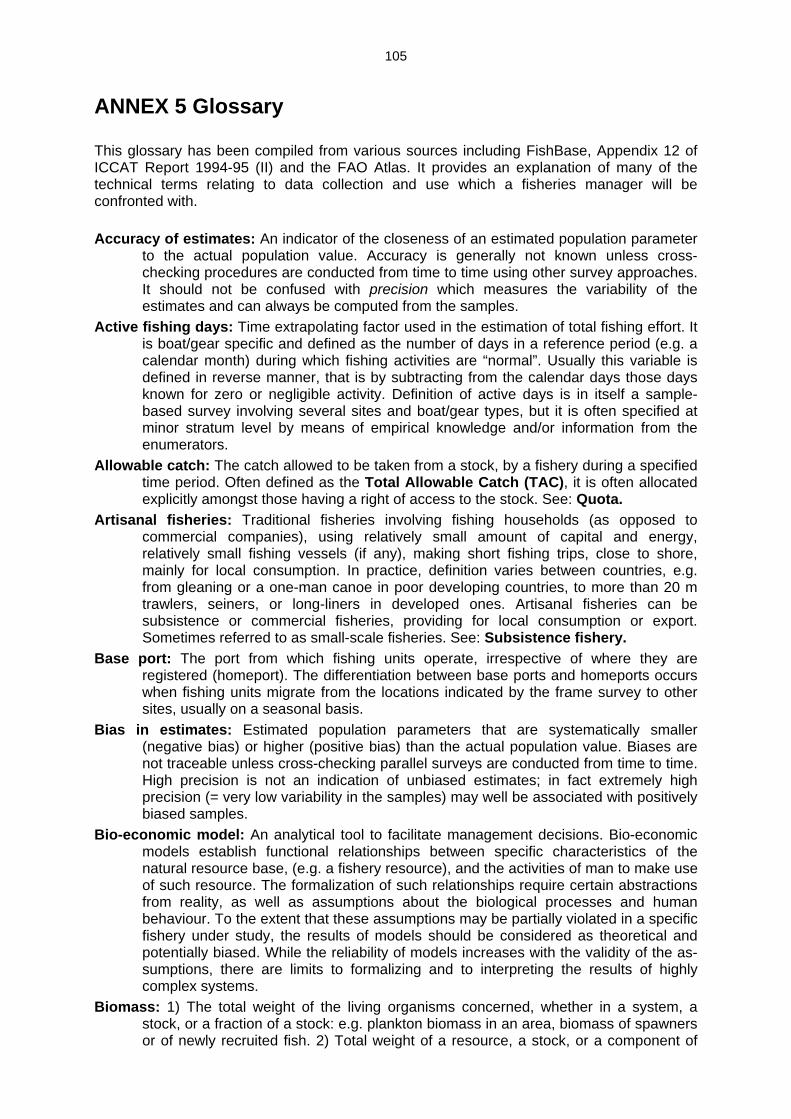
105
ANNEX 5 Glossary
This glossary has been compiled from various sources including FishBase, Appendix 12 of ICCAT Report 1994-95 (II) and the FAO Atlas. It provides an explanation of many of the technical terms relating to data collection and use which a fisheries manager will be confronted with. Accuracy of estimates: An indicator of the closeness of an estimated population parameter
to the actual population value. Accuracy is generally not known unless cross-checking procedures are conducted from time to time using other survey approaches. It should not be confused with precision which measures the variability of the estimates and can always be computed from the samples.
Active fishing days: Time extrapolating factor used in the estimation of total fishing effort. It is boat/gear specific and defined as the number of days in a reference period (e.g. a calendar month) during which fishing activities are “normal”. Usually this variable is defined in reverse manner, that is by subtracting from the calendar days those days known for zero or negligible activity. Definition of active days is in itself a sample-based survey involving several sites and boat/gear types, but it is often specified at minor stratum level by means of empirical knowledge and/or information from the enumerators.
Allowable catch: The catch allowed to be taken from a stock, by a fishery during a specified time period. Often defined as the Total Allowable Catch (TAC), it is often allocated explicitly amongst those having a right of access to the stock. See: Quota.
Artisanal fisheries: Traditional fisheries involving fishing households (as opposed to commercial companies), using relatively small amount of capital and energy, relatively small fishing vessels (if any), making short fishing trips, close to shore, mainly for local consumption. In practice, definition varies between countries, e.g. from gleaning or a one-man canoe in poor developing countries, to more than 20 m trawlers, seiners, or long-liners in developed ones. Artisanal fisheries can be subsistence or commercial fisheries, providing for local consumption or export. Sometimes referred to as small-scale fisheries. See: Subsistence fishery.
Base port: The port from which fishing units operate, irrespective of where they are registered (homeport). The differentiation between base ports and homeports occurs when fishing units migrate from the locations indicated by the frame survey to other sites, usually on a seasonal basis.
Bias in estimates: Estimated population parameters that are systematically smaller (negative bias) or higher (positive bias) than the actual population value. Biases are not traceable unless cross-checking parallel surveys are conducted from time to time. High precision is not an indication of unbiased estimates; in fact extremely high precision (= very low variability in the samples) may well be associated with positively biased samples.
Bio-economic model: An analytical tool to facilitate management decisions. Bio-economic models establish functional relationships between specific characteristics of the natural resource base, (e.g. a fishery resource), and the activities of man to make use of such resource. The formalization of such relationships require certain abstractions from reality, as well as assumptions about the biological processes and human behaviour. To the extent that these assumptions may be partially violated in a specific fishery under study, the results of models should be considered as theoretical and potentially biased. While the reliability of models increases with the validity of the as-sumptions, there are limits to formalizing and to interpreting the results of highly complex systems.
Biomass: 1) The total weight of the living organisms concerned, whether in a system, a stock, or a fraction of a stock: e.g. plankton biomass in an area, biomass of spawners or of newly recruited fish. 2) Total weight of a resource, a stock, or a component of

106
such stock. Examples: the biomass of all demersal fish on the Georges Bank; the biomass of the cod stock; the spawning biomass (i.e. the weight of mature females) (also standing stock).
Boat Activity Coefficient (BAC): The proportion of fishing units that are expected to be fishing during any given day of the survey period. It is a sample effort parameter and usually expressed in percentage form.
Boat day: A measure of fishing effort; e.g. 10 vessels in a fishery, each fishing for 50 days, would have expended 500 boat-days of effort.
By-catch: Part of a catch of a fishing unit taken incidentally in addition to the target species towards which fishing effort is directed. Some or all of it may be returned to the sea as discards.
Catch: 1) Any activity that results in killing any fish or bringing any live fish on board a vessel. 2) The component of fish encountering fishing gear which is retained by the gear.
Catch per unit effort (CPUE): The amount of catch that is taken per unit of fishing gear, e.g. number of fish per longline hook-months is one way to express CPUE. CPUE can be used as a measure of the economic efficiency of a type of gear, but normally it is used as an index of abundance, i.e. a proportional change in CPUE is hoped to represent the same proportional change in abundance. Nominal CPUE is simply the measure of CPUE from the fishery. However, it is known that there are many factors (including economics, geographical distributions) which may affect CPUE but do not represent changes in abundance. Therefore, CPUEs are often "standardized" using a variety of statistical techniques to remove the effect of those factors which are known not to be related to abundance. Thus, using the standardized CPUE will be more appropriate for an index of abundance. Most assessment analyses (production models, virtual population analyses) use the index of abundance data to fit to calibrate (tune) the models.
Census: A fisheries census is a survey in which the value of each variable for the survey area is obtained from the values of the variable in all reporting units, that are usually fishing households. The primary objective of fisheries censuses is to provide a detailed classification of the fisheries structure of the country. It provides estimates for each household, and therefore, aggregate data for the smallest administrative, political or statistical subdivisions of the country and for classifications of households by size or other subgroups of interest.
Data: Facts that result from measurements or observations. Data base: A logically structured and consistent set of data that can be used for analysis. Data Base Management System (DBMS): Application software that stores, maintains,
locates and retrieves data for a database. Data flow: A representational tool that shows how information moves in an organization or
process. Special symbols represent different types of data flow. Data set: A collection of data and accompanying documentation which relate to a specific
theme (usually consisting of one or more computer readable files on the same system).
Data validation: Confirmation of the reliability of data through a checking process, usually involving information from an alternative source.
Discard: 1) To release or return fish to the sea, whether or not such fish are brought fully on board a fishing vessel. 2) Part of the catch, which is not retained and is returned to the sea. Discard typically consists of "non-target" species or undersized specimens. While some species (clams, sea stars, etc.) might survive the process, most fish will die. See: By-catch.
Exclusive Economic Zone (EEZ): 1) A zone under national jurisdiction (up to 200-nautical miles wide) declared in line with the provisions of 1982 United Nations Convention of the Law of the Sea, within which the coastal State has the right to explore and exploit,

107
and the responsibility to conserve and manage, the living and non-living resources. 2) The area adjacent to a coastal state which encompasses all waters between: (a) the seaward boundary of that state, (b) a line on which each point is 200 nautical miles (370.40 km) from the baseline from which the territorial sea of the coastal state is measured (except when other international boundaries need to be accommodated), and (c) the maritime boundaries agreed between that state and the neighbouring states.
Fillet: A slice of meat without bones, cut out for human consumption. Fisher: A person (male or female) participating in a fishery (in preference to the previously
used term 'fisherman'). An individual who takes part in fishing conducted from a fishing vessel, platform (whether fixed or floating) or from the shore.
Fishery: 1) The sum (or range) of all fishing activities on a given resource (e.g. a hake fishery or shrimp fishery). It may also refer to the activities of a single type or style of fishing (e.g. beach seine fishery or trawl fishery). The fishery can be artisanal, or/and industrial, commercial, subsistence, and recreational, and can be annual or seasonal. 2) Activity of catching fish, from one or more stocks of fish, that can be treated as a unit for purposes of conservation and management and that is identified on the basis of geographic, scientific, technical, recreational, social or economic characteristics, and/or method of catch. See: Fishing.
Fishery-independent: Characteristic of information (e.g. stock abundance index) or an activity (e.g. research vessels survey) obtained or undertaken independently of the activity of the fishing sector. Intended to avoid the biases inherent to fishery-related data.
Fish stock: The living resources in the community or population from which catches are taken in a fishery. Use of the term fish stock usually implies that the particular population is more or less isolated from other stocks of the same species and hence self-sustaining. See: Fishery resource
Fishery management: The integrated process of information gathering, analysis, planning, decision-making, allocation of resources and formulation and enforcement of fishery regulations by which the fishery management authority controls the present and future behaviour of interested parties in the fisheries, in order to ensure the continued productivity of the living resources.
Fishery resource: Any stock of aquatic living animals (except those specifically prohibited by law) which can be caught by fishing, and their habitat.
Fishing: Any activity, other than scientific research conducted by a scientific research vessel, that involves the catching, taking, or harvesting of fish; or any attempt to do so; or any activity that can reasonably be expected to result in the catching, taking, or harvesting of fish and any operations at sea in support of it (Modified from US Department of Commerce, 1996).
Fishing effort: 1) The amount of fishing gear of a specific type used on the fishing grounds over a given unit of time e.g. hours trawled per day, number of hooks set per day or number of hauls of a beach seine per day. 2) The overall amount of fishing (usually per unit of time) expressed in units such as: boat days on the fishing ground, number of traps, or trawl hauls, or (gillnet length x soaking time), etc. The effort may be nominal, reflecting the simple total of effort units exerted on a stock in a given time period). It may also be standard or effective when corrected to take account of differences in fishing power and efficiency and ensure direct proportionality with fishing mortality). Relates usually to a specific fishery and gear. If more than one gear is considered, standardization in relation to one of them is necessary. For biologists, a good measure of fishing effort should be proportional to fishing mortality. For economists it should be proportional to the cost of fishing.
Fishing industry: Includes both recreational, subsistence and commercial fishing, and the harvesting, processing, and marketing sectors.
Fishing intensity: Effective fishing effort per unit area. It is proportional to fishing mortality

108
Fishing mortality: A mathematical expression of the rate of deaths of fish due to fishing. See: Natural mortality, Total mortality rate.
Fishing vessel: Any vessel, boat, ship, or other craft that is used for, equipped to be used for, or of a type that is normally used for the exploitation of living aquatic resources or in support of such activity. This definition may include any vessel aiding or assisting one or more vessels at sea in the performance of any activity relating to fishing, including, but not limited to, preparation, supply, storage, refrigeration, transportation, or processing (e.g. mother ships).
Flag State: State having registered a vessel under the national flag. Fleet: The aggregation of units of any discrete type of fishing activity utilising a specific
resource. Hence, for example, a fleet may be all the purse seine vessels in a specific sardine fishery, or all the fishers setting nets from the shore in a tropical multispecies fishery.
Frame survey: A complete description of the structure of the primary fishery sector including an inventory of ports, landing places, number and type of fishing units (boats and gears), and a description of fishing and landing activity patterns, fish distribution routes, processing and marketing patterns, supply centres for goods and services, etc.
Gear: Any tools used to catch fish, such as hook and line, trawls, gill nets, traps, spears, etc. Geographic Information System (GIS): An information system that stores and manipulates
data which is referenced to locations on the earth's surface, such as digital maps and sample locations.
Geo-referenced data: Data which is connected to a specific location on the earth's surface. Home port: Refer to base port described above. Boat and gear activities are sampled from
homeports or base ports, in contrast to catches and species composition, prices, etc. that are sampled at landing sites.
Household: A basic unit for socio-cultural and economic analysis. It includes all persons, kin and non-kin, who live in the same dwelling and share income, expenses and daily subsistence tasks. The concept of household is based on the arrangements made by persons, individually or in groups, for providing themselves with food or other essentials for living. A household may be either (a) a one-person household, that is, a person who makes provision for his or her own food or essentials for living without combining with any other person to form part of a multiperson household, or (b) a multiperson household, that is, a group of two or more persons living together who make common provision for food or other essentials of living. The persons in the group may pool their incomes and have a common budget to a greater or lesser extent; they may be related or unrelated persons or a combination of both. Households usually occupy the whole, part of, or more than one housing unit but they may also be found living in camps, boarding houses or hotels or as administrative personnel in institutions, or they may be homeless. Households consisting of extended families that make common provision for food or of potentially separate households with a common head, resulting from polygamous unions, or households with vacation or second homes may occupy more than one housing unit. Homeless households are defined as those households without a shelter that would fall within the scope of living quarters. A household also includes those persons who normally reside with the other members of the household but are away temporarily (for less than one year), e.g. full-time students or those engaged in seasonal migratory labour.
Incidental Catch: See: By-catch. Index of abundance: A relative measure of the abundance of a stock; e.g. a time series of
catch per unit of effort data. Indicator: A variable, pointer, or index. Its fluctuation reveals the variations in key elements
of a system. The position and trend of the indicator in relation to reference points or values indicate the present state and dynamics of the system. Indicators provide a bridge between objectives and action (FAO, 1999. FAO Technical Guidelines for

109
Responsible Fisheries Development and Use of Indicators for Sustainable Development of Marine Capture Fisheries, in press).
Information system: A structured set of processes, people and equipment for converting data into information.
Landing price: Price for a product at the landing point, not taking account of any transportation or handling costs. Equivalent to the “farm gate” price for aquaculture.
Landing site: Location at which boats land their catch. A landing site may be the same as the homeport or base port but it can also be different. Boat and gear activities are sampled from homeports or base ports, in contrast to catches and species composition, prices, etc. that are sampled at landing sites.
Landings: Weight of the catch landed at a wharf or beach. Limit Reference Point (LRP): Indicates the limit beyond which the state of a fishery and/or a
resource is not considered desirable. Fishery development should be stopped before reaching it. If an LRP is inadvertently reached, management action should severely curtail or stop fishery development, as appropriate, and corrective action should be taken. Stock rehabilitation programmes should consider an LRP as a very minimum rebuilding target to be reached before the rebuilding measures are relaxed or the fishery is re-opened. See: Reference point, Target Reference Point.
Logbook: A record of the fishing activity registered sistematically by the fisher, including catch and its species composition, the corresponding effort, and location. In many fisheries completion of logbooks is a compulsory requirement of a fishing licence.
Major stratum: Conventional name describing various types of population groupings that are already in place and imposed on a data collection programme. They constitute standard aggregating levels of derived estimates for reporting purposes. Estimates are always produced at minor stratum and not at major stratum level.
Management authority: The legal entity which has been assigned by a State or States with a mandate to perform certain specified management functions in relation to a fishery, or an area (e.g. a coastal zone). Generally used to refer to a state authority, the term may also refer to an international management organisation.
Management objective: A formally established, more or less quantitative target that is actively sought and provides a direction for management action. For example, achieving a 40% reduction in fleet capacity, or ensuring a competitive income for individual fishers.
Minor stratum: Conventional name describing various types of logical population partitioning into homogeneous population sub-sets defined by the survey planner with the purpose of increasing the precision of estimated population parameters. Estimates are always produced at minor stratum level.
Monitoring: The collection of information for the purpose of assessment of the progress and success of a land use (or fishery management) plan. Monitoring is used for the purpose of enforcement and of revising the original plan, or to gather information for future plans.
Nationality of catch: The flag of the vessel performing the essential part of the operation catching the fish, should be considered the paramount indication of the nationality assigned to the catch data and this indication overridden only when one of the following arrangements between a foreign flag vessel and the host country exists: (a) the vessel is chartered by the host country to augment its fishing fleet; or (b) the vessel fishes for the country by joint venture contract or similar agreements (as opposed to the ad hoc practice of a vessel selling catches to a foreign vessel or landing catches at a foreign port) and the operation of such vessel is an integral part of the economy of the host country. When governments negotiate joint ventures or other contracts in which vessels of one country land their catches at ports of another country or unload their catches to vessels of another country and the one of the above-mentioned criteria is applicable, the assignment of nationality to such catches and landings data should be specified in the agreement.

110
Natural mortality: Deaths of fish from all causes except fishing (e.g. ageing, predation and disease). It is often expressed as an annual rate that indicates the percentage of fish dying in a year; e.g. a natural mortality rate of 0.2 implies that approximately 20% of the population will die in a year from causes other than fishing. Scientists use the instantaneous natural mortality rate, M, which may also be split into one part due to predation and the other due to all other natural causes (disease, ageing). See: Fishing mortality, Total mortality rate.
Nominal catch: The sum of the catches that are landed (expressed as live weight equivalent). Nominal catches do not include unreported discards and may differ considerably from the actual catch.
Observer: Any certified person serving in the capacity of an observer employed by the Management Authority, either directly or under contract. Usually embarked on large fishing vessels (principally but not exclusively foreign vessels), observers are responsible for monitoring fishing operations (e.g. areas fished, fishing effort deployed, gear characteristics, catches and species caught, discards, etc.). They may or may not be part of the enforcement system.
Observer data: Fisheries information collected on-board fishing vessels by independent observers.
Performance: Accomplishment; fulfilment; functioning, usually with regard to effectiveness. Indicators of performance will be interpreted in relation to reference points and objectives.
Policy: The course of action for an undertaking adopted by a government, a person or another party. Instruments that exist to support policy and tools used to achieve policy objectives comprise some or all of the following: societal instruments, economic and command and control instruments, direct government involvement and institutional and organisational arrangements. It is to be mentioned that although law may be used as a policy instrument, there are cases where law may impose constraints on what policies may be adopted. For example, if the Constitution states that the shore is the patrimony of the nation or requires the payment of compensation for the expropriation of the land, this would restrict the policies which could be adopted for Integrated Coastal Area Management (ICAM).
Precautionary approach: 1) Set of measures taken to implement the precautionary principle. 2) A set of agreed cost-effective measures and actions, including future courses of action, which ensures prudent foresight, reduces or avoids risk to the resource, the environment, and the people, to the extent possible, taking explicitly into account existing uncertainties and the potential consequences of being wrong.
Quota: A share of the Total Allowable Catch (TAC) allocated to an operating unit such as a country, a vessel, a company or an individual fisherman (individual quota) depending on the system of allocation. Quotas may or may not be transferable, inheritable, and tradable. While generally used to allocate total allowable catch, quotas could be used also to allocate fishing effort or biomass.
Recreational fishing: Any fishing for which the primary motive is leisure rather than profit, the provision of food or the conduct of scientific research. and which may not involve the sale, barter, or trade of part or all of the catch.
Reference point: 1) An estimated value derived from an agreed scientific procedure and/or model, which corresponds to a specific state of the resource and of the fishery, and that can be used as a guide for fisheries management. Reference points may be general (applicable to many stocks) or stock-specific. 2) A reference point indicates a particular state of a fishery indicator corresponding to a situation considered as desirable (Target Reference Point) or undesirable and requiring immediate action (Limit Reference Point).
Resources: Biological resources include genetic resources, organisms or parts thereof, populations or any other biotic component of ecosystems with actual or potential use of value for humanity. fishery resources are those resources of value to fisheries.

111
Responsible fisheries: The concept “encompasses the sustainable utilisation of fishery resources in harmony with the environment; the use of capture and aquaculture practices which are not harmful to ecosystems, resources and their quality; the incorporation of added value to such products through transformation processes meeting the required sanitary standards; the conduct of commercial practices so as to provide consumers access to good quality products” (International Conference on Responsible Fishing, Cancun, Mexico, 1992).
Round weight: The weight of the whole fish before processing or removal of any part. Sample design: The sample design of a sample survey refers to the techniques for selecting a
probability sample and the methods to obtain estimates of the survey variables from the selected sample.
Spawning stock: Mature part of a stock responsible for the reproduction. Spawning Stock Biomass (SSB): The total weight of all sexually mature fish in the population
(both males and females). This quantity depends on the abundance of year classes, the exploitation pattern, the rate of growth, both fishing and natural mortality rates, the onset of sexual maturity, and environmental conditions.
Species group: Group of species considered together, often because they are difficult to differentiate without detailed examination (very similar species) or because data for the separate species are not available (e.g. in fishery statistics or commercial categories).
Stakeholders: A large group of individuals and groups of individuals (including governmental and non-governmental institutions, traditional communities, universities, research institutions, development agencies and banks, donors, etc.) with an interest or claim (whether stated or implied) which has the potential of being impacted by or having an impact on a given project and its objectives. Stakeholder groups that have a direct or indirect stake can be at the household, community, local, regional, national, or international levels.
State of the stock: An appreciation of the situation of a stock, usually expressed as: protected, under-exploited, intensively exploited, fully exploited, over-exploited, depleted, extinct or commercially extinct.
Stock: 1) In theory, a unit stock comprises all the individuals of fish in an area, which are part of the same reproductive process. It is self-contained, with no emigration or immigration of individuals from or to the stock. On practical grounds, however, a fraction of the unit stock is considered a “stock” for management purposes (or a management unit), as long as the results of the assessments and management remain close enough to what they would be on the unit stock. 2) A group of indi-viduals in a species occupying a well defined spatial range independent of other stocks of the same species. Random dispersal and directed migrations due to seasonal or reproductive activity can occur. Such a group can be regarded as an entity for management or assessment purposes. Some species form a single stock (e.g. southern bluefin tuna) while others are composed of several stocks (e.g. albacore tuna in the Pacific Ocean comprises separate Northern and Southern stocks). The impact of fishing on a species cannot be determined without knowledge of this stock structure.
Stock assessment: The process of collecting and analyzing biological and statistical information to determine the changes in the abundance of fishery stocks in response to fishing, and, to the extent possible, to predict future trends of stock abundance. Stock assessments are based on resource surveys; knowledge of the habitat requirements, life history, and behaviour of the species; the use of environmental indices to determine impacts on stocks; and catch statistics. Stock assessments are used as a basis to assess and specify the present and probable future condition of a fishery.
Straddling stock: Stock which occurs both within the EEZ and in an area beyond and adjacent to EEZ (Article 63(2) of UNCLOS).

112
Subsistence fishery: A fishery where the fish caught are consumed directly by the families of the fishers rather than being bought by middle-(wo)men and sold at the next larger market.
Survey design: The overall survey design of a probability survey refers to the definitions and the established methods and procedures concerning all phases needed for conducting the survey: the sample design, the selection and training of personnel, the logistics involved in the management of the field force and the distribution and receipt of survey questionnaires and forms, and the procedures for data collection, processing and analysis.
Sustainable development: 1) “Development that meets the needs of the present generation without compromising the ability of future generations to meet their own needs” (World Commission on Environment and Development, 1987). 2) “Management and conservation of the natural resource base, and the orientation of technological and institutional change in such a manner as to ensure the attainment of continued satisfaction of human needs for present and future generations. Such sustainable development conserves (land) water, plants and (animal) genetic resources, is environmentally non-degrading, technologically appropriate, economically viable and socially acceptable” (FAO Council in 1991).
Sustainable use: The use of components of biological diversity in a way and at a rate that does not lead to the long-term decline of biological diversity, thereby maintaining its potential to meet the needs and aspirations of present and future generations.
Sustainable yield: The number or weight of fish in a stock that can be taken by fishing while maintaining the stock’s biomass at a steady level from year to year, assuming that environmental conditions remain the same. Sustainable yields can take all sorts of values from very low in underexploited or overexploited fisheries to very high in properly exploited ones. Difficult to achieve in practice due to environmental fluctuations.
Target Reference Point (TRP): Corresponds to a state of a fishery and/or a resource which is considered desirable. Management action, whether during a fishery development or a stock rebuilding process should aim at bringing and maintaining the fishery system at this level. In most cases a TRP will be expressed in a desired level of output for the fishery (e.g. in terms of catch) or of fishing effort or capacity and will be reflected as an explicit management objective for the fishery. See: Limit Reference Point, Reference point.
Target species: Those species that are primarily sought by the fishermen in a particular fishery. The subject of directed fishing effort in a fishery. There may be primary as well as secondary target species.
Total Allowable Catch (TAC): Total catch allowed to be taken from a resource in a specified period (usually a year), as defined in the management plan. The TAC may be allocated to the stakeholders in the form of quotas as specific quantities or proportions.
Total mortality rate (Z): The combined effect of all sources of mortality acting on a fish population. This is conveniently expressed in terms of instantaneous mortality rates because the total instantaneous mortality rate is simply the sum of the instantaneous fishing and natural mortality rates. For example, the total instantaneous mortality rate that is occurring when the instantaneous fishing mortality rate is 0.3 and the instantaneous natural mortality rate is 0.2 would be 0.5. See: Fishing mortality, Natural mortality.
Transshipment: Act of transferring the catch from one fishing vessel to either another fishing vessel or to a vessel used solely for the carriage of cargo.
Trash fish: Fish with little or no commercial value and not sorted by species before landing. Usually part of the trawlers’ by-catch. It can be used for aquaculture, fishmeal production and in many developing countries, for human consumption.

113
Variable: Anything changeable. A quantity that varies or may vary. Part of a mathematical expression that may assume any value (Compton's Encyclopaedia, 1995)
Vessel Monitoring System (VMS): VMS provides monitoring agencies with accurate locations of fishing vessels that are participating in the VMS. It tells the monitoring agency see new guidelines.
Yield: Catch in weight. Catch and yield are often used interchangeably.