II-SDV 2015, 20 - 21 April, in Nice
14
-
Upload
dr-haxel-cem-gmbh -
Category
Internet
-
view
385 -
download
0
Transcript of II-SDV 2015, 20 - 21 April, in Nice
M A N I S H S I N H AC H I E F T E C H N O L O G Y O F F I C E R
M A N I S H @ G R I D L O G I C S . C O M
. I I - S D V N I C E 2 0 1 5 .
10 years of experience in Intellectual Property Solutions
Launched Patent iNSIGHT Pro in Jan 2006 and gained quick market acceptance to achieve more than 400 users across 100+organisations globally
PatSeer Global Patent Database crossed 500 users in 2014 with more than 200 Professional Searchers
Strong Focus on R&D and continuous product enhancements that solve greater challenges and needs of IP professionals
Track record for successful custom IP Software development and delivery
About Us
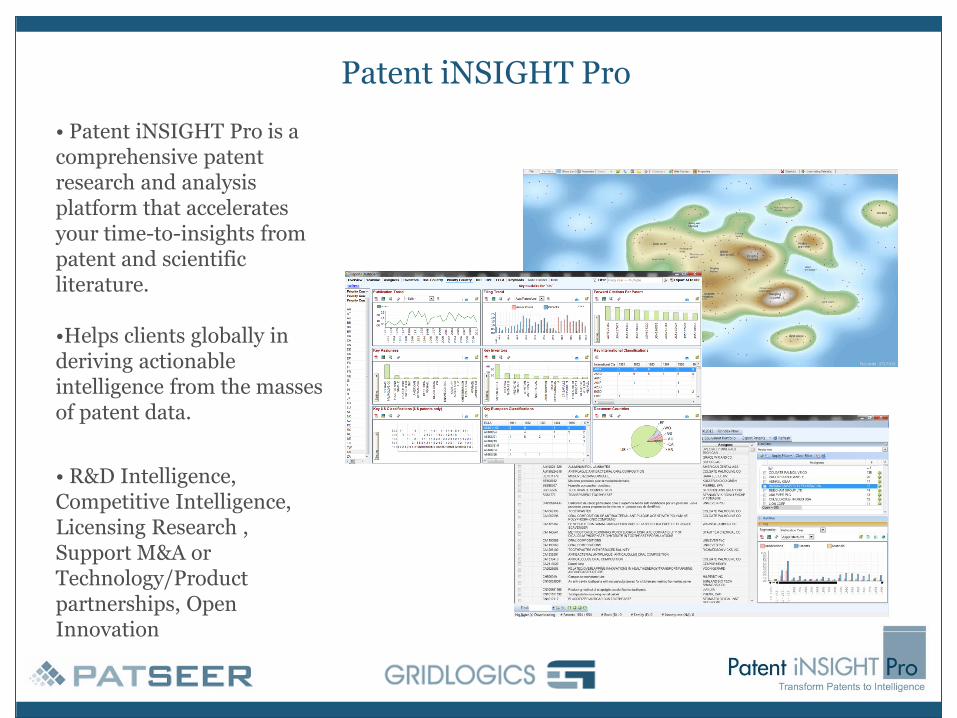
• Patent iNSIGHT Pro is a comprehensive patent research and analysis platform that accelerates your time-to-insights from patent and scientific literature.
•Helps clients globally in deriving actionable intelligence from the masses of patent data.
• R&D Intelligence, Competitive Intelligence, Licensing Research , Support M&A or Technology/Product partnerships, Open Innovation
Patent iNSIGHT Pro
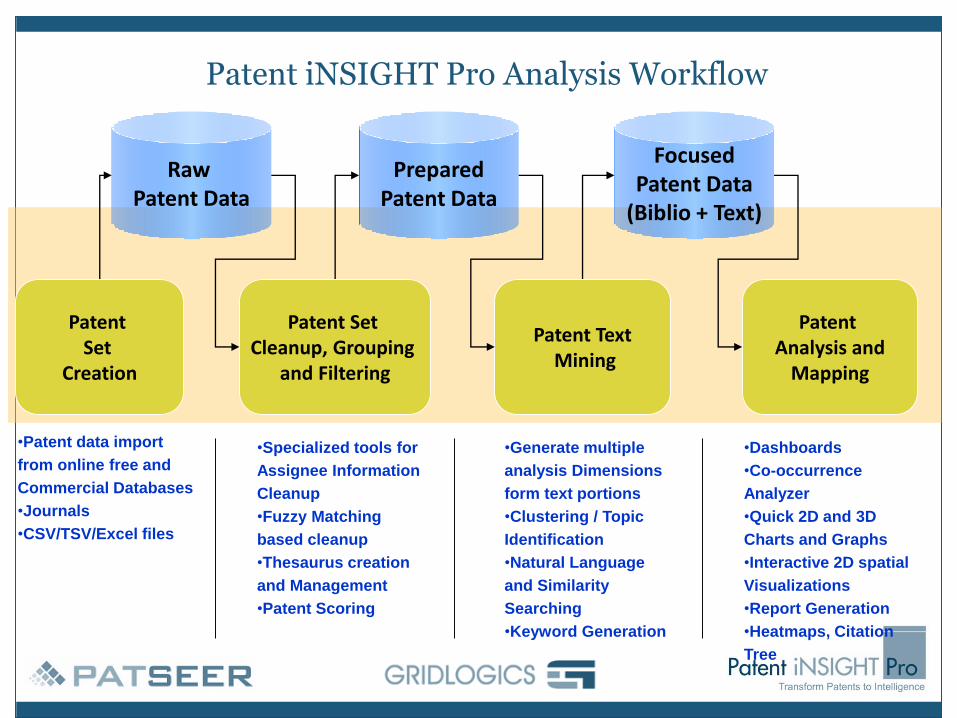
Raw Patent Data
Patent Set
Creation
•Patent data import
from online free and
Commercial Databases
•Journals
•CSV/TSV/Excel files
PreparedPatent Data
Patent Set Cleanup, Grouping
and Filtering
•Specialized tools for
Assignee Information
Cleanup
•Fuzzy Matching
based cleanup
•Thesaurus creation
and Management
•Patent Scoring
FocusedPatent Data
(Biblio + Text)
Patent TextMining
•Generate multiple
analysis Dimensions
form text portions
•Clustering / Topic
Identification
•Natural Language
and Similarity
Searching
•Keyword Generation
Patent Analysis and
Mapping
•Dashboards
•Co-occurrence
Analyzer
•Quick 2D and 3D
Charts and Graphs
•Interactive 2D spatial
Visualizations
•Report Generation
•Heatmaps, Citation
Tree
Patent iNSIGHT Pro Analysis Workflow
Patent Analysis Techniques Used
• Text Mining Techniques• Tokenization/ Term Extraction• Clustering
• Manual Categorization with tools to speed up process• Combining Bibliometric and Text based fields for 2D
Matrix/HeatMaps• Visualizations
• Bubble Matrix Charts• Network Analysis (Self Organizing Maps)• Clustering Maps with contours
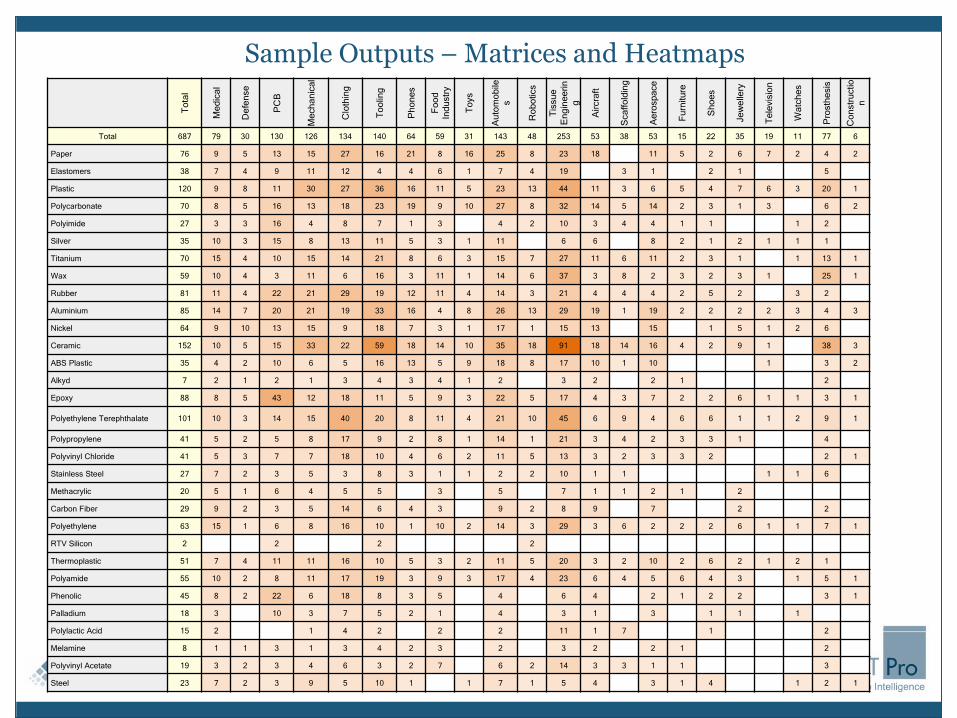
Sample Outputs – Matrices and Heatmaps
To
tal
Me
dic
al
De
fen
se
PC
B
Me
ch
an
ica
l
Clo
thin
g
To
olin
g
Ph
on
es
Fo
od
Ind
ustr
y
To
ys
Au
tom
ob
ile
s
Ro
bo
tics
Tis
su
e
En
gin
ee
rin
g
Air
cra
ft
Sca
ffo
ldin
g
Ae
rosp
ace
Fu
rnitu
re
Sh
oe
s
Je
we
llery
Te
levis
ion
Wa
tch
es
Pro
sth
esis
Co
nstr
uctio
n
Total 687 79 30 130 126 134 140 64 59 31 143 48 253 53 38 53 15 22 35 19 11 77 6
Paper 76 9 5 13 15 27 16 21 8 16 25 8 23 18 11 5 2 6 7 2 4 2
Elastomers 38 7 4 9 11 12 4 4 6 1 7 4 19 3 1 2 1 5
Plastic 120 9 8 11 30 27 36 16 11 5 23 13 44 11 3 6 5 4 7 6 3 20 1
Polycarbonate 70 8 5 16 13 18 23 19 9 10 27 8 32 14 5 14 2 3 1 3 6 2
Polyimide 27 3 3 16 4 8 7 1 3 4 2 10 3 4 4 1 1 1 2
Silver 35 10 3 15 8 13 11 5 3 1 11 6 6 8 2 1 2 1 1 1
Titanium 70 15 4 10 15 14 21 8 6 3 15 7 27 11 6 11 2 3 1 1 13 1
Wax 59 10 4 3 11 6 16 3 11 1 14 6 37 3 8 2 3 2 3 1 25 1
Rubber 81 11 4 22 21 29 19 12 11 4 14 3 21 4 4 4 2 5 2 3 2
Aluminium 85 14 7 20 21 19 33 16 4 8 26 13 29 19 1 19 2 2 2 2 3 4 3
Nickel 64 9 10 13 15 9 18 7 3 1 17 1 15 13 15 1 5 1 2 6
Ceramic 152 10 5 15 33 22 59 18 14 10 35 18 91 18 14 16 4 2 9 1 38 3
ABS Plastic 35 4 2 10 6 5 16 13 5 9 18 8 17 10 1 10 1 3 2
Alkyd 7 2 1 2 1 3 4 3 4 1 2 3 2 2 1 2
Epoxy 88 8 5 43 12 18 11 5 9 3 22 5 17 4 3 7 2 2 6 1 1 3 1
Polyethylene Terephthalate 101 10 3 14 15 40 20 8 11 4 21 10 45 6 9 4 6 6 1 1 2 9 1
Polypropylene 41 5 2 5 8 17 9 2 8 1 14 1 21 3 4 2 3 3 1 4
Polyvinyl Chloride 41 5 3 7 7 18 10 4 6 2 11 5 13 3 2 3 3 2 2 1
Stainless Steel 27 7 2 3 5 3 8 3 1 1 2 2 10 1 1 1 1 6
Methacrylic 20 5 1 6 4 5 5 3 5 7 1 1 2 1 2
Carbon Fiber 29 9 2 3 5 14 6 4 3 9 2 8 9 7 2 2
Polyethylene 63 15 1 6 8 16 10 1 10 2 14 3 29 3 6 2 2 2 6 1 1 7 1
RTV Silicon 2 2 2 2
Thermoplastic 51 7 4 11 11 16 10 5 3 2 11 5 20 3 2 10 2 6 2 1 2 1
Polyamide 55 10 2 8 11 17 19 3 9 3 17 4 23 6 4 5 6 4 3 1 5 1
Phenolic 45 8 2 22 6 18 8 3 5 4 6 4 2 1 2 2 3 1
Palladium 18 3 10 3 7 5 2 1 4 3 1 3 1 1 1
Polylactic Acid 15 2 1 4 2 2 2 11 1 7 1 2
Melamine 8 1 1 3 1 3 4 2 3 2 3 2 2 1 2
Polyvinyl Acetate 19 3 2 3 4 6 3 2 7 6 2 14 3 3 1 1 3
Steel 23 7 2 3 9 5 10 1 1 7 1 5 4 3 1 4 1 2 1
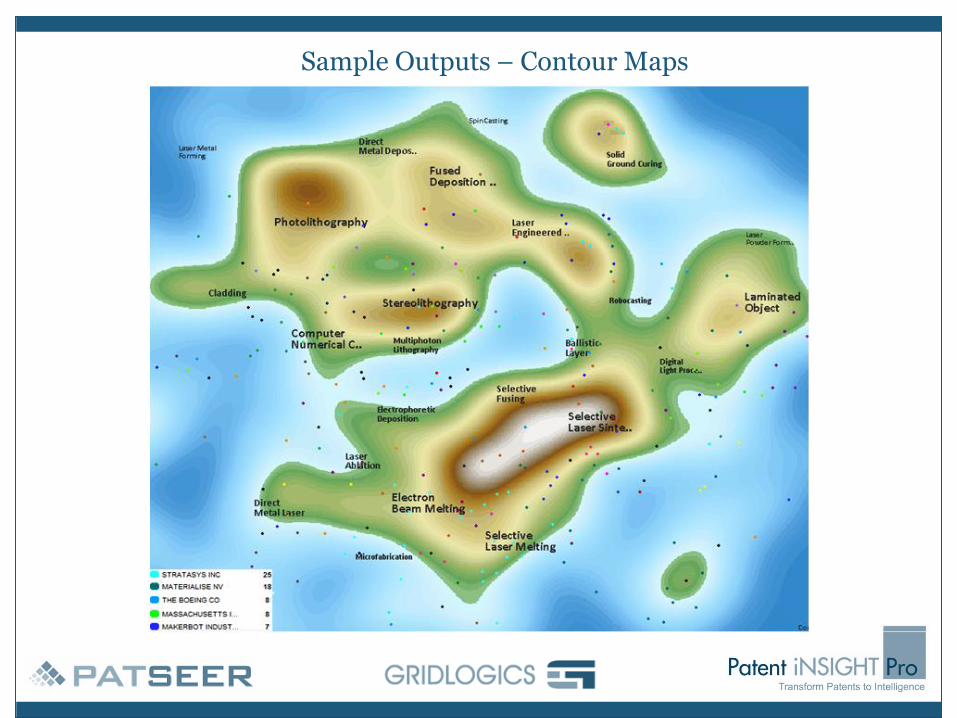
Sample Outputs – Contour Maps
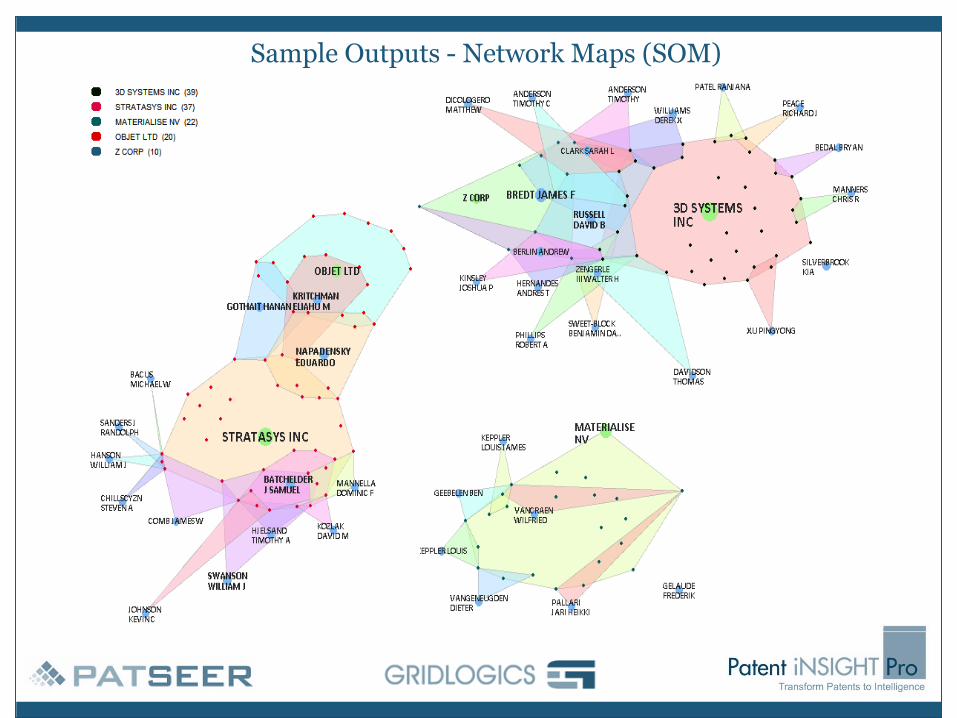
Sample Outputs - Network Maps (SOM)
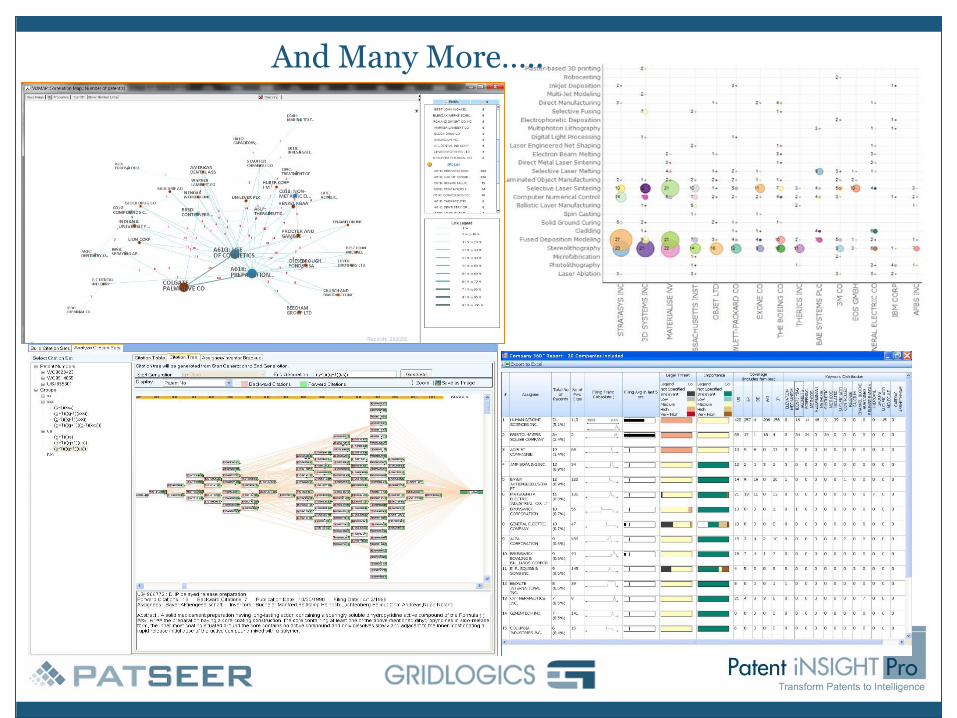
And Many More…..
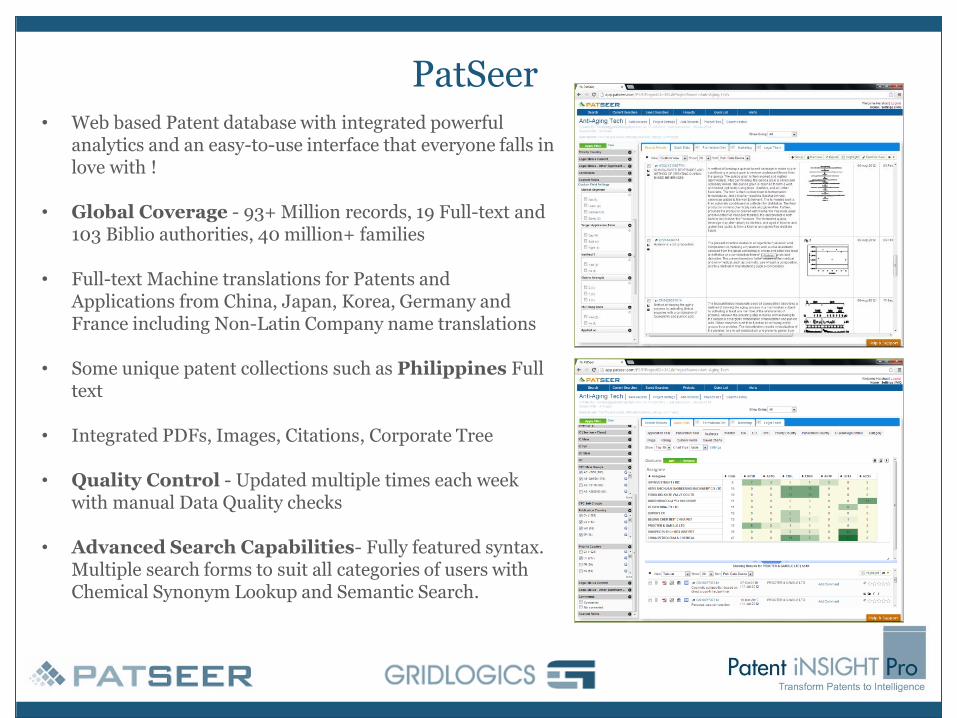
PatSeer• Web based Patent database with integrated powerful
analytics and an easy-to-use interface that everyone falls in love with !
• Global Coverage - 93+ Million records, 19 Full-text and 103 Biblio authorities, 40 million+ families
• Full-text Machine translations for Patents and Applications from China, Japan, Korea, Germany and France including Non-Latin Company name translations
• Some unique patent collections such as Philippines Full text
• Integrated PDFs, Images, Citations, Corporate Tree
• Quality Control - Updated multiple times each week with manual Data Quality checks
• Advanced Search Capabilities- Fully featured syntax. Multiple search forms to suit all categories of users with Chemical Synonym Lookup and Semantic Search.
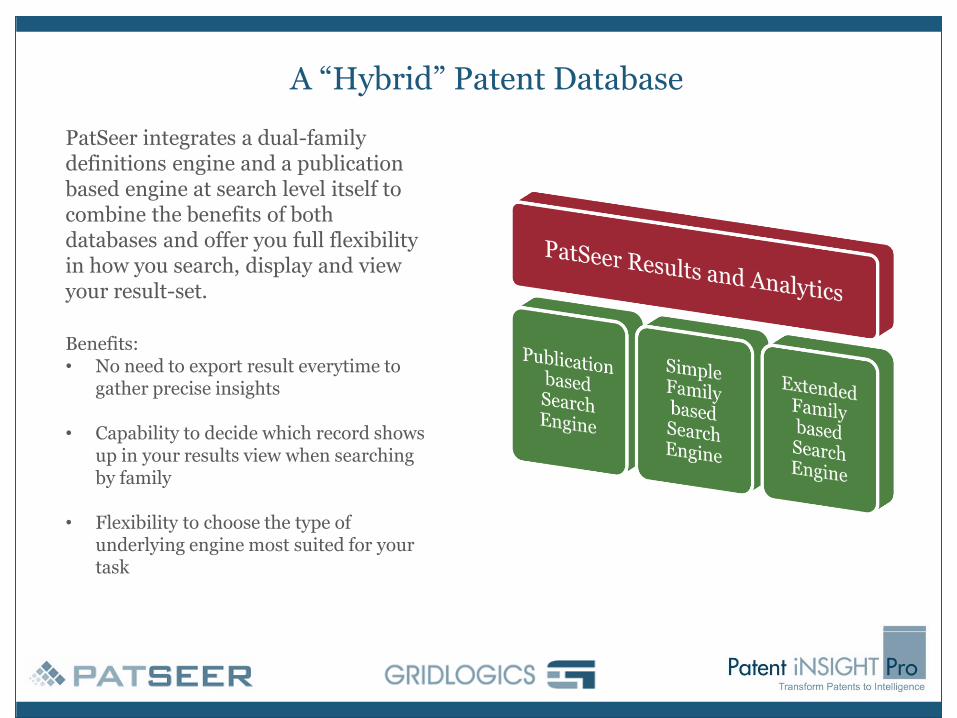
A “Hybrid” Patent Database
PatSeer integrates a dual-family definitions engine and a publication based engine at search level itself to combine the benefits of both databases and offer you full flexibility in how you search, display and view your result-set.
Benefits:• No need to export result everytime to
gather precise insights
• Capability to decide which record shows up in your results view when searching by family
• Flexibility to choose the type of underlying engine most suited for your task
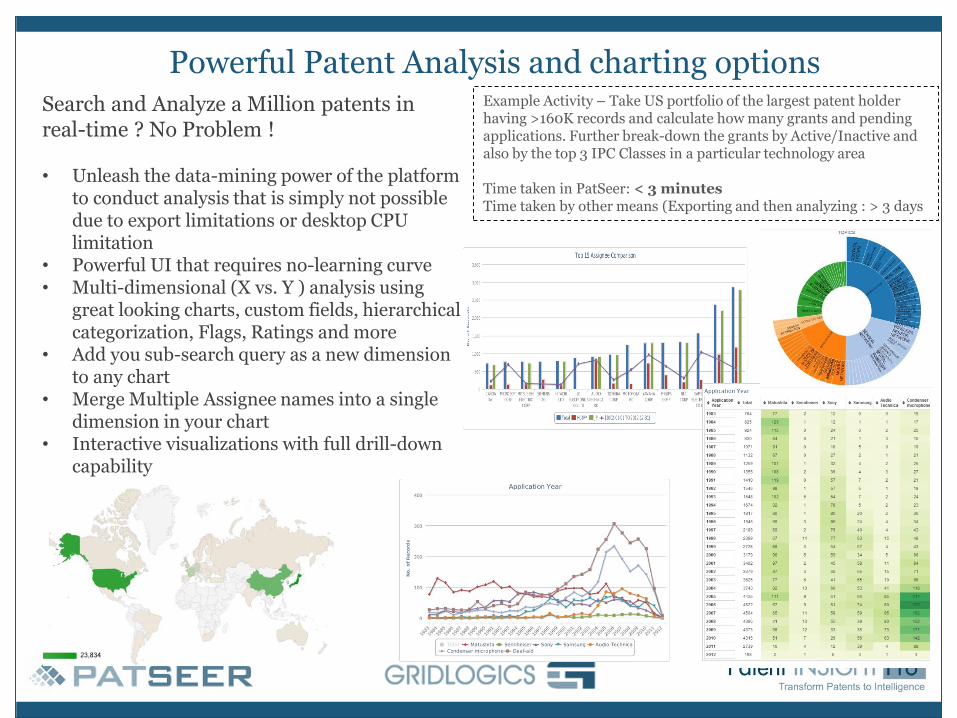
Powerful Patent Analysis and charting optionsSearch and Analyze a Million patents in real-time ? No Problem !
• Unleash the data-mining power of the platform to conduct analysis that is simply not possible due to export limitations or desktop CPU limitation
• Powerful UI that requires no-learning curve• Multi-dimensional (X vs. Y ) analysis using
great looking charts, custom fields, hierarchical categorization, Flags, Ratings and more
• Add you sub-search query as a new dimension to any chart
• Merge Multiple Assignee names into a single dimension in your chart
• Interactive visualizations with full drill-down capability
Example Activity – Take US portfolio of the largest patent holder having >160K records and calculate how many grants and pending applications. Further break-down the grants by Active/Inactive and also by the top 3 IPC Classes in a particular technology area
Time taken in PatSeer: < 3 minutesTime taken by other means (Exporting and then analyzing : > 3 days
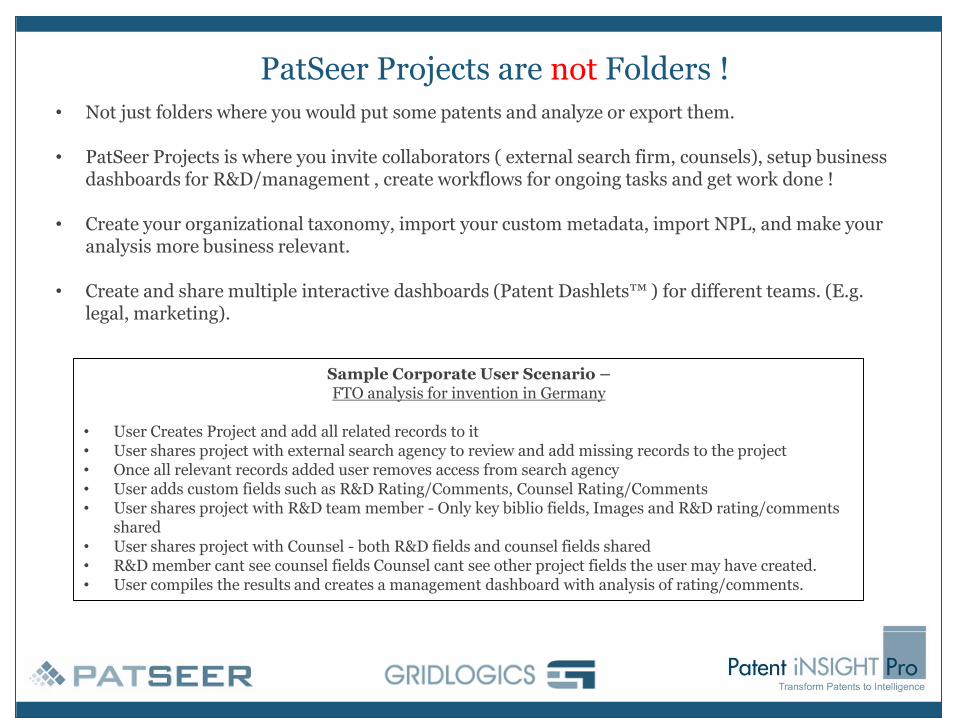
PatSeer Projects are not Folders !
• Not just folders where you would put some patents and analyze or export them.
• PatSeer Projects is where you invite collaborators ( external search firm, counsels), setup business dashboards for R&D/management , create workflows for ongoing tasks and get work done !
• Create your organizational taxonomy, import your custom metadata, import NPL, and make your analysis more business relevant.
• Create and share multiple interactive dashboards (Patent Dashlets™ ) for different teams. (E.g. legal, marketing).
Sample Corporate User Scenario –FTO analysis for invention in Germany
• User Creates Project and add all related records to it• User shares project with external search agency to review and add missing records to the project• Once all relevant records added user removes access from search agency• User adds custom fields such as R&D Rating/Comments, Counsel Rating/Comments• User shares project with R&D team member - Only key biblio fields, Images and R&D rating/comments
shared• User shares project with Counsel - both R&D fields and counsel fields shared• R&D member cant see counsel fields Counsel cant see other project fields the user may have created.• User compiles the results and creates a management dashboard with analysis of rating/comments.
Recently Published ….. and free
Available at www.patseer.com > Resources > Ebook