II I II IIIIII IIII II IIII IIIIII IIII IIII IIII II ... · fractions by distillation and ......
26
II I II IIIIII IIII II IIII IIIIII IIII IIII IIII II II1III III I1III 1II1 II I II 3 1176 00156 0201 NASA Technical Memorandum 79203 USE OF REFINERY COMPUTER MODEL TO PREDICT JET FUEL PRODUCTION Francisco J. Flores Lewis Research Center Cleveland, Ohio June 1979 NASA-TM-79203 19790020178 llBllnR'I I:OPV UtiGLEY RESEARCH LlDRARY, NASA •'JI"r-IeI.Oli.l YlB.<I.IIilll . -111111111111111111111111111111111111111111111 NF00508 https://ntrs.nasa.gov/search.jsp?R=19790020178 2018-06-28T18:53:31+00:00Z
Transcript of II I II IIIIII IIII II IIII IIIIII IIII IIII IIII II ... · fractions by distillation and ......
II I II IIIIII IIII II IIII IIIIII IIII IIII IIII II II1III III I1III 1II1 II I II 3 1176 00156 0201
NASA Technical Memorandum 79203
USE OF REFINERY COMPUTER MODEL
TO PREDICT JET FUEL PRODUCTION
Francisco J. Flores
Lewis Research Center
Cleveland, Ohio
June 1979
NASA-TM-79203 19790020178
llBllnR'I I:OPV
UtiGLEY RESEARCH cEl'n~R LlDRARY, NASA
• 'JI"r-IeI.Oli.l YlB.<I.IIilll
. -111111111111111111111111111111111111111111111 NF00508
https://ntrs.nasa.gov/search.jsp?R=19790020178 2018-06-28T18:53:31+00:00Z
00 CO o
I ril
SUMMARY
ThIS report IS a parametriC study of several factors that affect yields and properties of broad-specificatiOn jet fuel. The Refinery Simulation Model, developed under contract by Gordian Associates, Inc. and modified at NASA LeRC is used to make the calculations. This computer program can simulate different types of refineries and emphasizes Jet fuel production.
Two refinery configurations are used, each one processing a different crude mix. Results obtained from the Refinery Simulation Model are used to correlate jet fuel YIeld as a function of final boiling point, hydrogen content and freezing point. A set of calculations was performed specifying only boiling range for jet fuel (maximum YIeld blends). Yield of jet fuel increases linearly with increasing final boiling point (at a fixed initial boiling point). For the second set of calculations a minimum hydrogen content for Jet fuel was also specified. In this case yield increases with final boiling point only to some extent. If the specified hydro-gen content is greater than the hydrogen content of the maximum yield blend on a certain boiling range, yield decreases with increasing final boiling point (and a fixed mitial boilmg pomt). A third set of calculations was performed by specifying both boiling range and a maximum freezing point for Jet fuel. The results (yield as a functIOn of final boiling point) obtained in this set of calculations were SImilar to thE' results obtamed by specifying boiling range and minimum hydrogen content. If the specified freezing point is smaller than the freezing point of the ma.,"{imum yield blend on a certain boiling range, yield decreases with increasing final boilmg point (and a fixed initial boiling pomt). These trends are similar for both refmeries.
Refinery performances are also compared in terms of energy consumption.
INTRODUCTION
Current specification Jet fuel is produced from mid-distillate pertroleum fractions by distillation and mild hydrogenation. Recent prICe mcreases and shortages of petroleum crudes have brought into consideration possible future changes to mcrease Jet fuel production by (ref. 1):
(1) Conversion of high-boiling-point petroleum fractions to Jet fuel boiling range by eracking and hydroprocessing
(2) Use of nonpetroleum sources such as shale oil, coal liquids and tar sands as refinery feedstocks
(3) Relaxation of fuel specificatiOns Implemen1.ation of the first two alternatives will require high energy and
hydrogen consumption and will result in higher operatmg costs in the refinery (ref. 2). Relaxing Jet fuel speCIfICatiOns will make it easier for refineries to supply fuel but performance of combustor and fuel system WIll be affected. The optImum fuel productiOn process WIll have to take into account the three alternatives (ref. 3).
2
Key specifIcations to be broadened in future jet fuels include boiling range and aromatics content. Boiling range is the most important property in determining yield of fuel from cnlde oil. It is also used to maintain a minimum flash point, related to initial boilmg point, and a maximum freezing point, related to final boiling point. Ii is generally agreed that hydrogen content is a better measure of combustion properties than the currently specified aromatics content (refs. 3 and 4). Aromatics content is related to hydrogen although the relationship is very approximate. RaiSing the ma."imum aromatics content specification will make it possible to produce jet fuel from low grade petroleum-derived process streams and nonpetroleum crudes. Relaxing these speCIfications will mean hIgher fuel yields, but also, higher freezing points and poorer combustion characteristIcs.
This report is a parametric study of several factors that affect jet fuel yield. The Refmery SImulation Model, developed under contract by Gordian Associates, Inc. and modified at NASA LeRC was used to make the calculations. This computer program can simulate different types of refineries. It can handle the processing of petroleum, shale oil and coal derived crudes. It calculates material and energy balances, costs, profit-ability; and the production of Jet fuel of specifIed boiling range and hydrogen content, and other refinery products.
The purpose of this report is to show the use of the Refinery Simulation Model to predICt Jet fuel YIelds as influenced by broadenmg boiling range, hydrogen content and freezing point specifications. Two existing refinery configurations are used, each one processing a different crude mIX. One of these refineries is supplIed with a light crude petroleum blend with a relatively high fraction in the jet fuel boiling range. <let fuel production in this refinery is further increased by molecular conversion in cracking units. This combination of crude and refinery represents a maxImum m Jet fuel YIelds for thIS study. The other refinery IS supplied with a heavier crude blend that has a lower fraction m the Jet fuel boiling range. This refinery does not have the capability of including cracked streams in Jet fuel production. The operatIOn of this refinery represents a mmimum in Jet fuel yields for thIS Stlldy. To run the parametrIC calculatIOns, a fixed initial bOIling point of 1770 C is used. Final boiling point of Jet fuel is varied from 2740 to 343 0 C. Results are presented m terms of Jet fuel YIeld as a functIon of final bOIling pomt, hydrogen content and freezmg point. Values of other jet fuel propertIes (smoke point, sulfur content, aromatics content, etc.) are also reported. An estimate of the energy efficiency of the two refineries is shown.
GENERAL DESCRIPTION OF COMPUTER PROGRAM
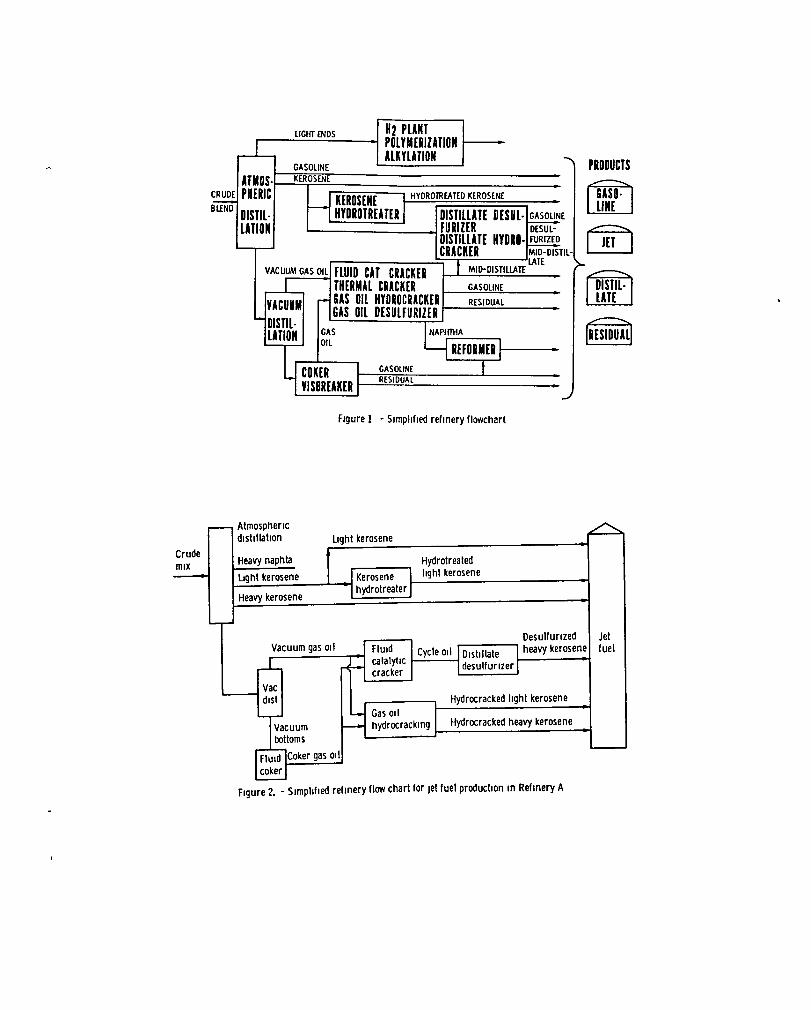
The Refinery SimulatlOn Model (ref. 5) is a Fortran computer program that can SImulate different types of refineries. (See fig. 1 for refinery flowchart.) Processing units mcluded in the model are:
3
1. Atmospheric dIstillation 2. Vacuum distillation 3. FlUid catalytIC cracking -!. Thermal crackmg 5. Mid-dIstillate desulfurizer 6. Kerosene hydrotreater 7. Fluid coker 8. Vlsbreaker 9. Mld-dlstillate hydrocracker
10. Gas oil hydrocracker 11. CatalytlC reforming 12. AlkylatlOn 13. PolymerizatlOn 14. Butane isomerization 15. Hydrogen productlOn
The user sets the refinery confIguration by specifying the sizes of process units. The feed to atmospheric dlstillatlOn can be any petroleum, shale or coal derived crude. Presently, there are 21 petroleum, 3 shale oil, 1 coal crude assays stored m a crude assay subroutme. For crudes not stored in this subroutine, the assays can be input by the user.
The program calculates overall and unit material and energy balances. The material balances include stream flowrate, density and composition (sulfur, nitrogen and hydrogen wt %). The energy balances include steam, fuel, power and hydrogen consumption.
Refmery products reported by the program are mid-distillate, residual, jet fuel and gasolme. For Jet fuel, the user specifies boiling range and hydrogen content. Flowrates and key properties are reported for these fuel blends. Octane numbers are reported for gasoline and viscosity, density, sulfur, nitrogen and hydrogen content are reported for mid-distillate and residual fuels. For Jet fuel the followmg properties are reported: sulfur, nitrogen, hydrogen and PNA (paraffms, naphthenes and aromatics) contents, along with freezing point, smoke pomt and heat of combustion. (Paraffins include branch and straIght-chain saturated hydrocarbons; naphtenes mclude cyclic saturated hydrocarbons.)
For a detailed description of the computer program, see reference 5. For this study the computer program was modIfIed to allow the user to spec
dy InItial boilmg point of Jet fuel. Origmally the Jet fuel blend was made of kerosene streams and had a fixed illltial boihng pomt of 2050 C. The modificatlOn _ ; was done by blending naptha (boIlmg range 1200 -2050 C) in the Jet fuel pool and addmg the necessary naptha properties to the crude assays.
ANALYSIS
Two refmery configuratIOns are established, each one processing a different crude mix. Refinery configuratIOn data for both refinel'les were obtained from reference 6. In each case, the refinery confIguration is kept constant for the entire runnmg sequence.
Refinery A is an existing East Coast refinery. In this study, it processes a 50/50 mix of Murban and LOUlsiana Delta Crudes. Murban is a light paraffinic crude from the Middle East. Table 1 shows crude assay data used by the computer program. Properties are given for the whole crude and six partial bOIling range fractions representing cuts from the atmospheric and vacuum distillation units. Properties that are not required for some of the cuts are not shown. Louisiana Delta is a light naphthenic crude. Table 2 shows crude assay data for Louisiana Delta Crude. The resultant crude miX is light (34.40 API), paraffmic (42% paraffins for the kerosene fraction) and low in sulfur and nitrogen (0.5% S and 0.1% N). Unit sizes are specified m barrels per day (BPD) except for the hydrogen plant which IS specified in mIllions of standard cubic meters per day (MMSCMD). Refinery A has the followmg configuration:
Atmosphel'lc DIstillation 150 000 BPD Vacuum DistillatIOn 90 700 BPD Fluid Coker 44 000 BPD FlUId Catalytic Cracker Gas 011 Hydrocracker Kerosene Hydrotreater Catalytic Reformer DIstillate Desulfurizer
62 000 BPD 20 000 BPD 10 000 BPD 42 000 BPD 10 000 BPD
Alkylation 8 000 BPD Hydrogen Plant 2 MMSCMD
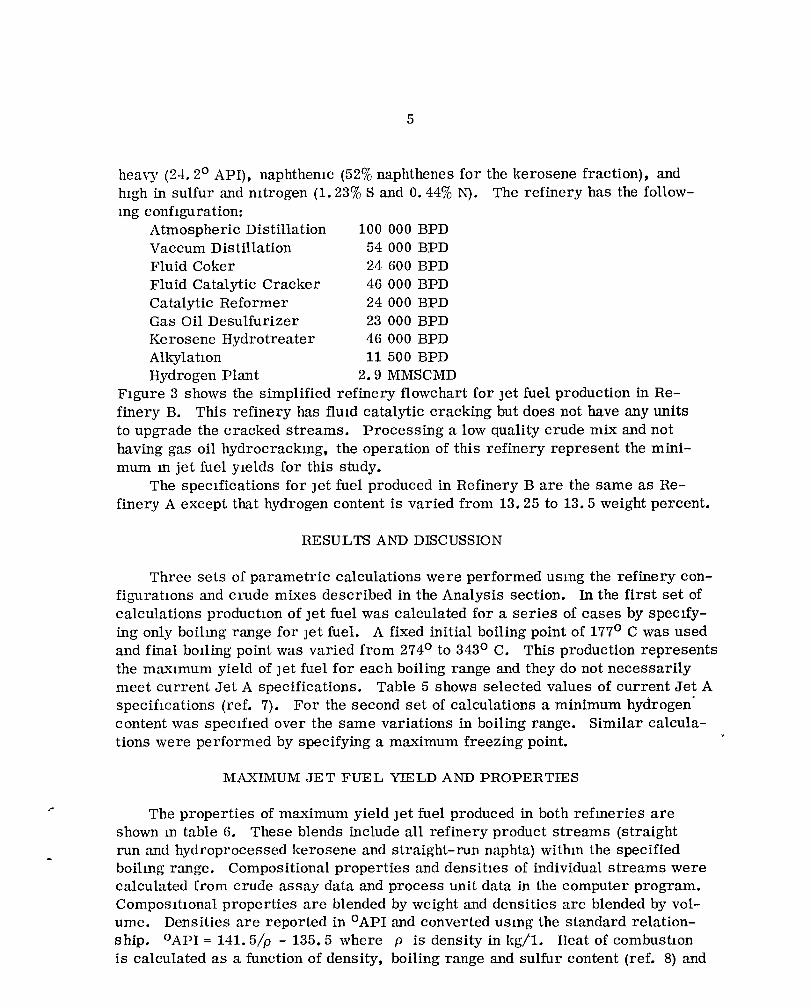
FIgure 2 shows a simplIfied refinery flowchart that includes only umts and streams involved in Jet fuel productIOn. This refinery has gas oil hydrocracking and catalytic crackmg which convert a sigmficant portion of gas 011 (boiling point over 5660 C) to Jet fuel bOIling range, and mId-distillate desulfurizer to upgrade the cracked streams. (The computer program yields a complete slate of refinery products, but in fIgure 2 only units and streams assocIated WIth Jet fuel are shown.) The operation of this refinery represents the ma."'i:imum in jet fuel yields for this study.
Fmal boilmg pomt for Jet fuel produced in Refmery A is varied from 247 0 to 3430 C (5250 to 6500 F). The average of these two values is slightly below the 3000 C (5720 F) maxImum end point current speCIfIcation for Jet A. Specified hydrogen content is varied from 13.75 to 14.5 weIght percent. The mitIal bOIling point is kept at 1770 C (3500 F).
Refinery B is on eXIstmg West Coast refinery. In this study, It processes a 50/50 mIX of Alaska North Slope and Wilmington crudes. Alaska North Slope IS a heavy crude with high aromatics content. Table 3 shows the crude assay data for the Alaska North Slope Crude. Wilmington is a heavy naphthenic crude. Table 4 shows the crude assay data for WIlmington Crude. The resultant crude mix IS
5
heavy (2-1. 20 API), naphthemc (52% naphthenes for the kerosene fraction), and hIgh in sulfur and mtrogen (1. 23% S and 0.44% N). The refinery has the followmg configuration:
Atmospheric Distillation Vaccum Distillation Fluid Coker Fluid Catalytic Cracker Catalytic Reformer Gas Oil Desulfurizer
100 000 BPD 54 000 BPD 24 600 BPD 46000 BPD 24000 BPD 23 000 BPD
Kerosene Hydrotreater 46 000 BPD AlkylatlOn 11 500 BPD Hydrogen Plant 2. 9 MMSCMD
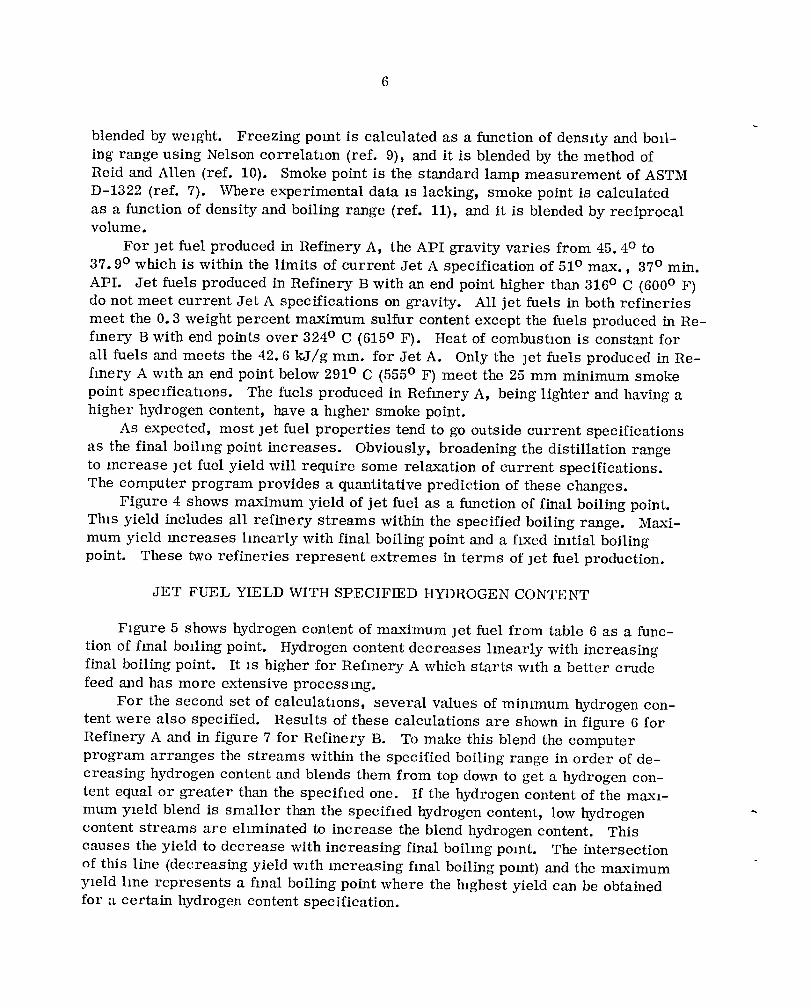
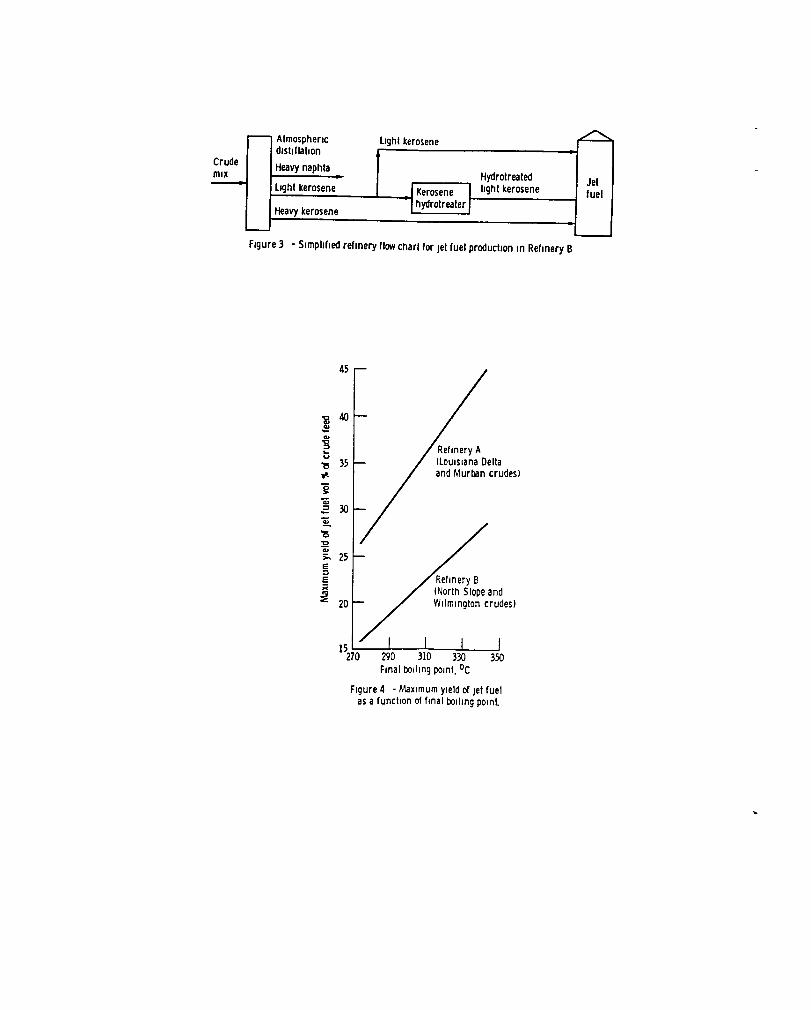
Flgure 3 shows the simplified refinery flowchart for Jet fuel production in Refinery B. This refinery has flUld catalytic cracking but does not have any units to upgrade the cracked streams. Processing a low quality crude mix and not having gas oil hydrocrackmg, the operation of this refinery represent the minimum m jet fuel Yields for this study.
The speclfications for Jet fuel produced in Refinery B are the same as Refinery A except that hydrogen content is varied from 13.25 to 13.5 weight percent.
RESULTS AND DISCUSSION
Three sets of parametric calculations were performed usmg the refinery configuratlOns and crude mixes described in the Analysis section. In the first set of calculations productlOn of Jet fuel was calculated for a series of cases by specIfying only boilmg range for Jet fuel. A fixed initial boiling point of 1770 C was used and final bOIling point was varied from 2740 to 3430 C. This production represents the maxImum yield of Jet fuel for each boiling range and they do not necessarily meet current Jet A specifications. Table 5 shows selected values of current Jet A specifICations (ref. 7). For the second set of calculations a minimum hydrogen" content was specifIed over the same variations in boiling range. Similar calculations were performed by specifying a maximum freezing point.
MAXIMUM JET FUEL YIELD AND PROPERTIES
The properties of maximum yield Jet fuel produced in both refmeries are shown m table G. These blends include all refinery product streams (straight run and hydroprocessed kerosene and straight-run naphta) withm the specified boilmg range. Compositional properties and densities of individual streams were calculated from crude assay data and process unit data in the computer program. ComposltlOnal properties are blended by weight and densities are blended by volume. Densities are reported in 0 API and converted usmg the standard relationship. °API = 141. 51p - 135.5 where p is density in kg/I. Heat of combustlOn is calculated as a function of density, boiling range and sulfur content (ref. 8) and
6
blended by welght. Freezing pomt is calculated as a function of density and bOIling range using Nelson correlatIOn (ref. 9), and it is blended by the method of Reid and Allen (ref. 10). Smoke point is the standard lamp measurement of ASTM D-1322 (ref. 7). Where experimental data IS lacking, smoke point is calculated as a function of density and boiling range (ref. 11), and it is blended by reciprocal volume.
For Jet fuel produced in Refinery A, the API gravity varies from 45.40 to 37.90 which is within the limits of current Jet A specification of 510 max., 370 min. API. Jet fuels produced in Refinery B with an end point higher than 3160 C (6000 F) do not meet current Jet A specifications on gravity. All jet fuels in both refineries meet the 0.3 weight percent maximum sulfur content except the fuels produced in Refmery B with end points over 3240 C (6150 F). Heat of combustIOn is constant for all fuels and meets the 42.6 kJ/g mm. for Jet A. Only the Jet fuels produced in Refmery A wIth an end point below 2910 C (5550 F) meet the 25 mm minimum smoke point speCIficatIOns. The fuels produced in Refmery A, being lighter and having a higher hydrogen content, have a hIgher smoke point.
As expected, most Jet fuel properties tend to go outside current specifications as the final boilmg point increases. Obviously, broadening the distillation range to mcrease Jet fuel yield will require some relaxation of current specifications. The computer program provides a quantitative prediction of these changes.
Figure 4 shows maximum yield of jet fuel as a function of final boiling point. ThIS yield includes all refinery streams within the specified boiling range. Maximum yield mcreases lmearly with final boiling point and a fIxed imtial boiling point. These two refineries represent extremes in terms of Jet fuel production.
JET FUEL YIELD WITH SPECIFIED HYDROGEN CONTENT
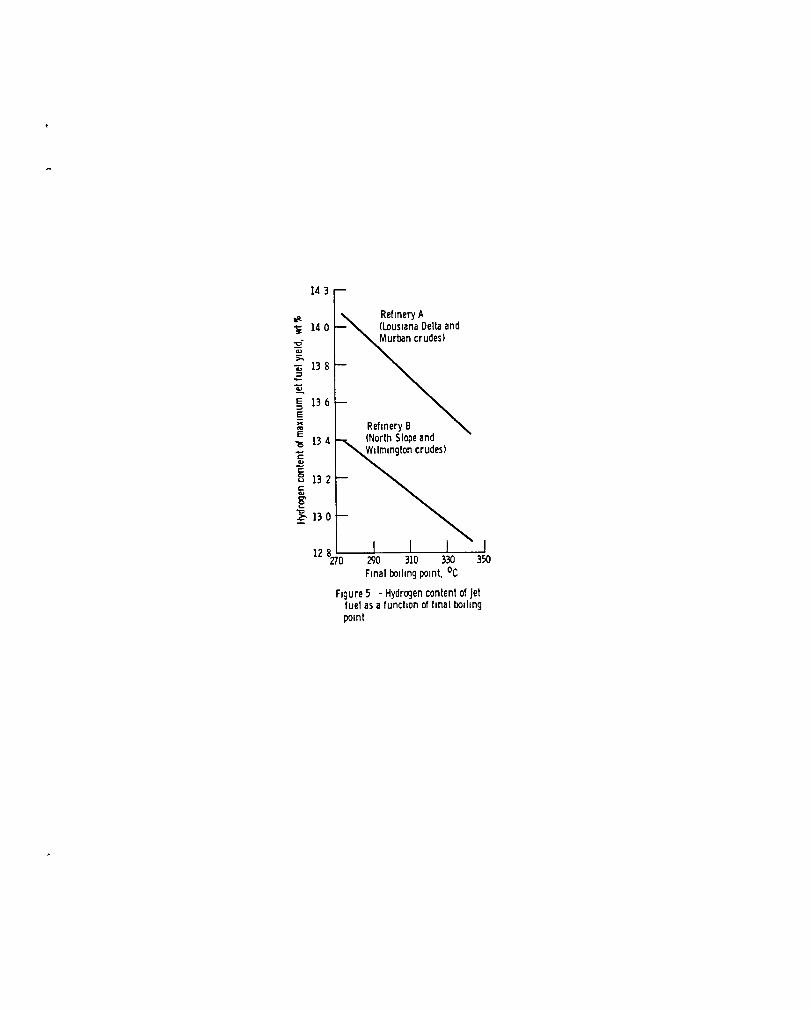
Figure 5 shows hydrogen content of maximum Jet fuel from table 6 as a function of fmal bOIling point. Hydrogen content decreases lmearly with increasing final boiling point. It IS higher for Refmery A which starts WIth a better crude feed and has more extensive process mg.
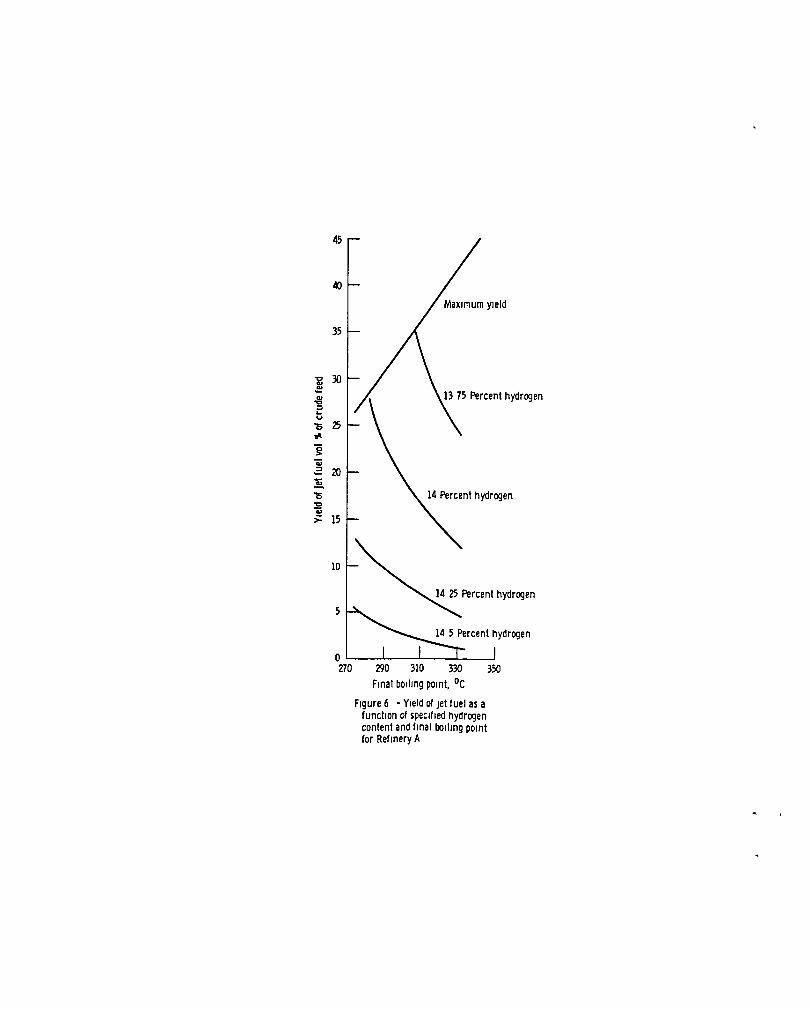
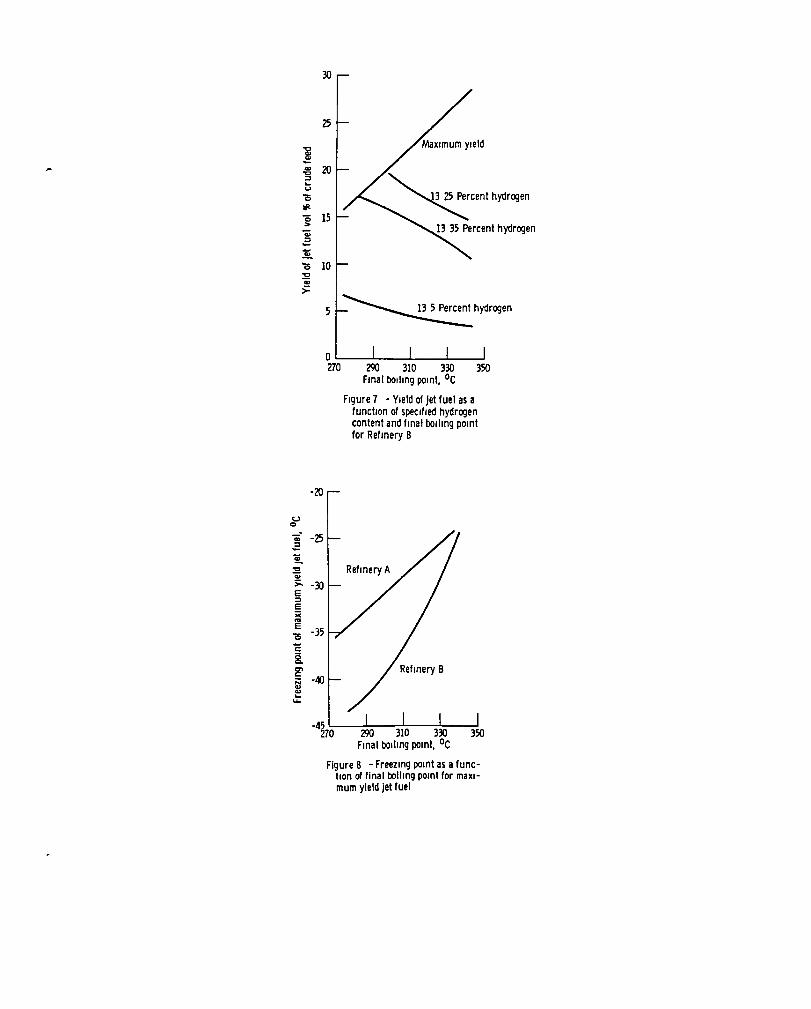
For the second set of calculatIOns, several values of minImum hydrogen content were also specified. Results of these calculations are shown in figure 6 for Refinery A and in figure 7 for Refinery B. To make this blend the computer program arranges the streams within the specified boiling range in order of decreasing hydrogen content and blends them from top down to get a hydrogen content equal or greater than the specifIed one. If the hydrogen content of the mruomum YIeld blend is smaller than the specifIed hydrogen content, low hydrogen content streams are elIminated to increase the blend hydrogen content. This causes the yield to decrease with increasing final boilmg pomt. The intersection of this line (decreasing yield with mcreasing fmal boiling pomt) and the maximum YIeld hne represents a fmal boiling point where the hIghest yield can be obtained for a certain hydrogen content speCification.
7
JET FUEL YIELD WITH SPECIFIED FREEZING POINT
Freezing point as a function of fmal boiling point from table 6 is shown in figure 8. Accordmg to Nelson correlation (ref. 9), freezing point increases with increasing mid-boiling point and decreasing specific gravity. Freezing pomt is also affected by fuel composition. Straight chain or symmetrical hydrocarbons crystalize more readily so that paraffinic fuels usually have higher freezmg points than naphthemc fuels. All Jet fuels produced in Refinery A, being lighter and more paraffinic than those produced in Refinery B in similar boiling ranges, have higher freezing points. As final boiling pomt increases, compositional dIfferences become less significant; at the highest final boiling point both values of freezing point are almost identical.
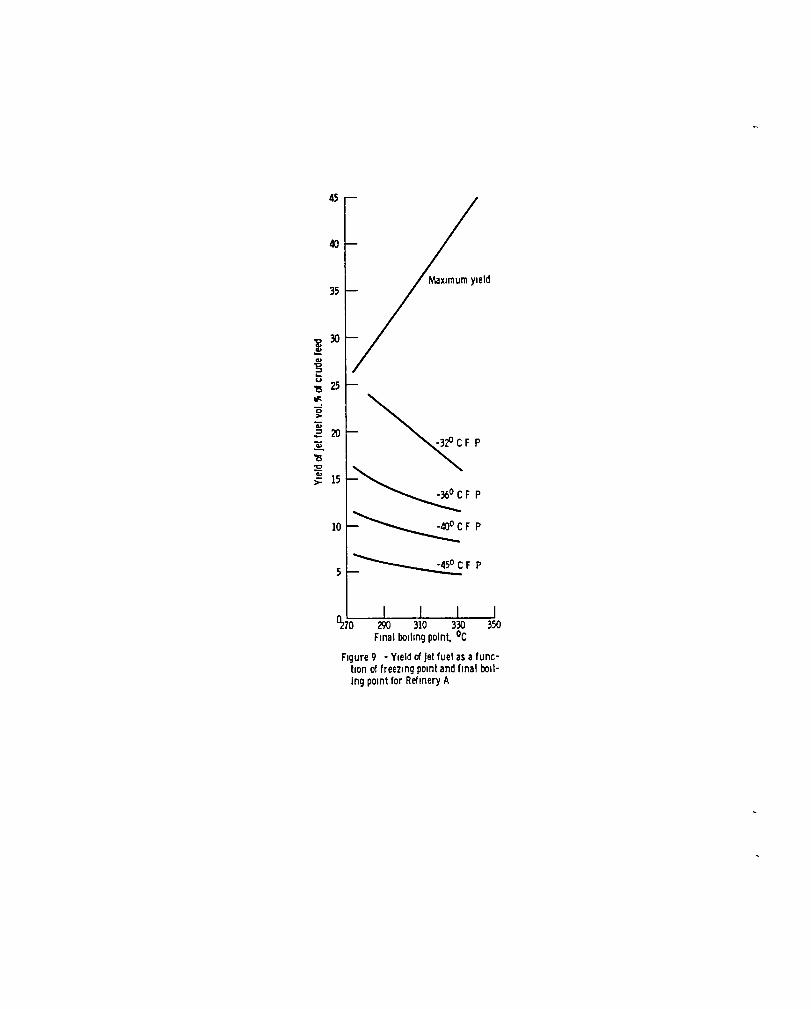
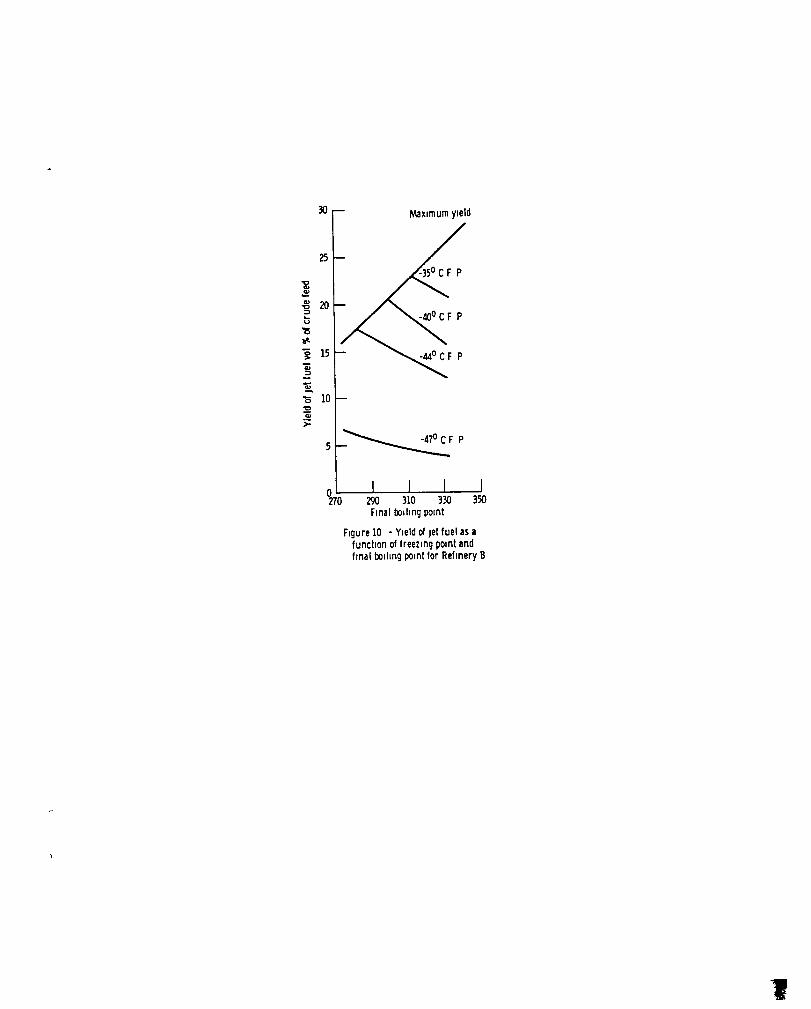
In the third set of calculations, both freezing point and boiling range of jet fuel were specified. Results of this calculation are shown in figure 9 for Refinery A and in figure 10 for Refmery B. These plots were obtained by plotting yield of Jet fuel vs. freezing point at specified final bOllmg points and then obtammg lines of constant freezing point. To meet a certain freezing point specification, selective blending of streams should be done. If the product blend freezing pomt IS higher than the specified one, high freezing point streams are eliminated to lower the blend freezing point. At this point yield starts to decrease with increasmg final boiling point. The intersection of this line (decreasing yield with mcreasing final bOIling point) and the maximum yield line represents a final boilmg point where a maximum yield is obtained for a certain freezing point.
Yields of Jet fuel obtained by specifying only boiling range are much higher than the average present yield of 6.5% (ref. 12). When constraints are placed on key properties like freezing point or hydrogen content, yields decrease significantly. Besides there are other uses for the mid-distillate portion of the crude barrel like heating oil and engine diesel.
REFINERY PERFORMANCE
Jet fuels produced in Refinery A have higher hydrogen content and better smoke point characteristics. On the other hand, Jet fuels produced in Refinery B have lower freezing points. An optimization of both cases would be required to obtain a reasonable yield of Jet fuel that meet all current speCIfications.
Table 7 shows an energy report for both refmeries. Refinery A, having more extensive processing, has a slightly higher fuel consumption and a much higher hydrogen consumptlOn. The computer program also calculates economic parameters like cost, investment and profitability. A detaIled economic analysis cannot be made because the computer program does not optimize economic opera-
... tion.
8
DISCUSSION
The results presented in this report should be interpreted considering the assumptions involved in formulating the computer program. The crude assay data shown in tables 1 to 4 was compiled by Gordian Associates from authoritative petroleum industry sources. This crude assay data represents average properties. Also some of the properties like smoke point, heat of combustion and freezing point were estimated. Correlations for heat of combustion and smoke point are accurate and consistent with other commonly used correlations (ref. 12). There are no accurate correlations for calculating freezing pomts of indivIdual streams and blends. The correlations used in this computer program are very approXImate, but they are the best available. Processing unit data was also obtamed from industry sources and is based on refinery or pilot plant experience. Ho" e\"er, the relative trends in yields and properties presented m this report can be regarded as accurate.
CONCLUDING REMARKS
The purpose of this report IS to show a correlation of Jet fuel yield as a function of final boiling point, hydrogen content and freezing point using results obtamed from the Refinery Simulation Model. This computer program predicts refinery performance and fuel properties in given refinery configurations, each one processmg a different crude mix. The refmery confIguratIOns and crudes are chosen to represent extreme situations in fuel production.
Results indicate that mcreasing final boiling point (with a fIxed initial boiling pomt) mcreases YIeld and decreases hydrogen content of Jet fuel. SpeCIfying a mmimum hydrogen content in addition to boilmg range changes the relationshIp between YIeld and final boiling point. After the specified hydrogen content is hIgher than the hydrogen content of the maximum YIeld blend on a certain boiling range, yield decreases with increasing final boiling pomt.
Increasing final boiling point also increases freezing point of Jet fuel. If a maxImum freezing point is specified in additIOn to boiling range, YIeld increases with mcreasing final boiling point only to some extent. After the specified freezing pomt is smaller than the freezing point of the maximum yield blend on a certam bOIling range, YIeld decreases WIth increasing fmal bOIling point (which is SImilar to the results obtained by specifying a minimum hydrogen content). Increasing fmal bOiling point also makes other Jet tuel properties (graVIty, smoke pomt, sulfur content, etc.) go outside current specificatIOns. This mterdependency will make It necessary to relax some speCificatIOns to mcrease yield for future Jet fuels.
Comparison of refinery performance are made in terms of product yields and properties and energy consumption. The first refinery has gas oil hydrocracking and processes a lighter, more paraffinic crude. This refinery produces higher yields of Jet fuel with higher hydrogen contents and better smoke pomt characteristics. It also has higher energy and hydrogen consumption. The second refinery
9
processes a heavIer crude and does not have a means of converting high boiling point fractions to Jet fuel boilmg range. However, Jet fuels produced in this refinery have lower freezing points. An optimization between both cases and combinations of specifications is required to obtain reasonable yields of jet fuel with controlled relaxation of current specifications.
REFERENCES
1. Longwell, J. P.; Grobman, J.: Alternative Aircraft Fuels. J. Eng. Power, vol. 101, no. 1, Jan. 1979, pp. 155-161.
2. Taylor, W. F., et al.: Evaluation of Methods to Produce Aviation Turbine Fuels from Synthetic Crude OIls - Phase 3, Vol. 3. EXXON/GRU. 3PEA. 77-Vol-3, Exxon Research and Engineering Co., 1977. (AFAPL-TR-75-10-Vol-3, AD-A053106.)
3. Longwell, J. P., ed.: Jet Aircraft Hydrocarbon Fuels Technology. NASA CP-2033, 1977.
4. Butze, H. F.; and Ehlers, R. C.: Effect of Fuel Properties on Performance of a Smgle Aircraft TurboJet Combustor. NASA TM X-71789, 1975.
5. Dunbar, D. N.; and Tunnah, B. G.: Computer Model for Refinery Operations with Emphasis on Jet Fuel Production. Vol. 1: Program Description. (Rept-1099-1-Vol-1, Gordian Associates, Inc.; NASA Contract NAS3-20620.) NASA CR-135333, 1978.
6. Cantrell, A.: Annual Refinmg Survey. Oil Gas J., vol. 78, Mar. 26, 1979, pp. 122-156.
7. Aviation Turbine Fuels, Am. Soc. Test. Mater. Stand. D-1655, Part 23, 1977.
8. Technical Data Book - Petroleum Refinery. Vol. II. Third ed. American Petroleum Institute, 1977, Chapt. 14, Figure 14A-1, p. 14-3.
9. Nelson, W. L.: Petroleum Refinery Engineering. Fourth ed. McGraw-Hill Book Co., Inc., 1958, Figure 4-41, p. 139.
10. Reid, Eugene B. ; and Allen, Howard I.: Estimating Pour Points of Petroleum Distillate Blends. Petroleum Refinery, vol. 30, no. 5, May 1951, pp. 93-95.
11. Nelson, W. L.: Op. Cit. Table 4-1, pp. 82-83.
12. Dukek, W. G.; and Longwell, J. P.: Alternative Hydrocarbon Fuels for Aviation. Exxon Air World, vol. 29, no. 4, 1977, pp. 92-96.
13. Siemssen, J. 0.: Jet Fuel Property Correlations. Am. Chem. Soc., Div. Petrol. Chem., Prepr., vol. 18, no. 1, Feb. 1973, pp. 87-98.
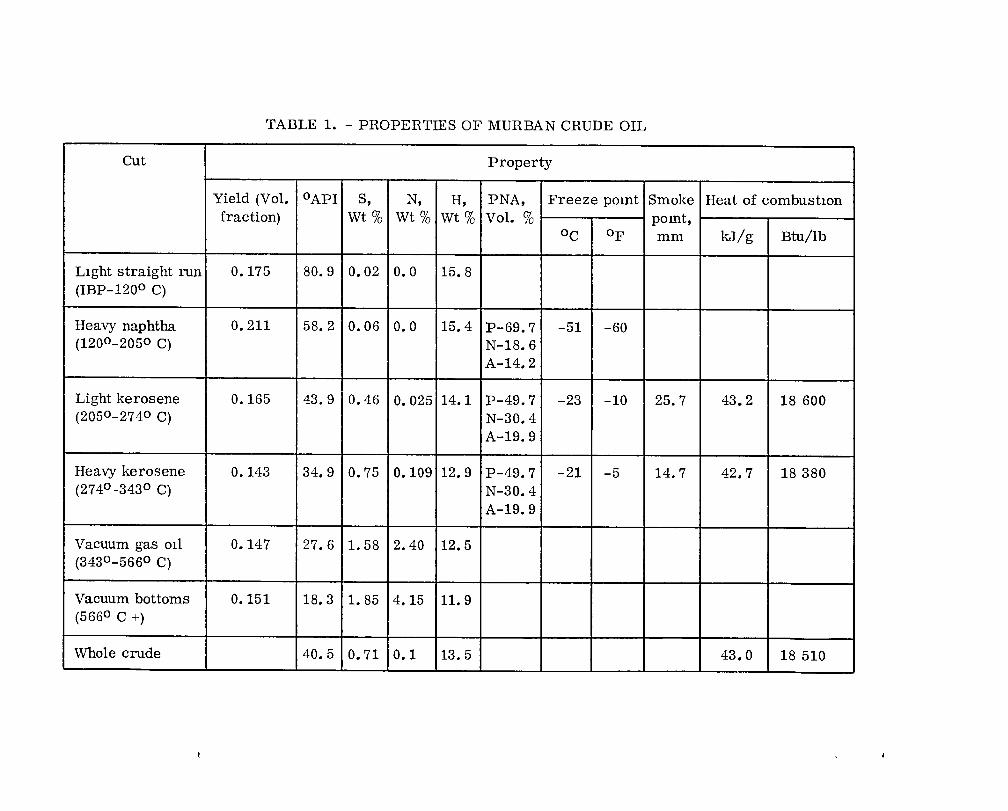
TABLE 1. - PROPERTIES OF MURBAN CRUDE OIL
Cut Property
Yield (Vol. °API S, N, H, PNA, Freeze pomt Smoke Heat of combustIOn fraction) Wt% Wt% Wt% Vol. % pomt,
°C of mm kJ/g Btu/lb
LIght straight run 0.175 80.9 0.02 0.0 15.8 (IBP-1200 C)
Heavy naphtha 0.211 58.2 0.06 0.0 15.4 P-69.7 -51 -60 (1200 -2050 C) N-18.6
A-14.2
Light kerosene 0.165 43.9 0.46 0.025 14.1 P-49.7 -23 -10 25.7 43.2 18 600 (2050 -2740 C) N-30.4
A-19.9
Heavy kerosene 0.143 34.9 0.75 0.109 12.9 P-49.7 -21 -5 14.7 42.7 18380 (2740 -343 0 C) N-30.4
A-19.9
Vacuum gas 011 0.147 27.6 1. 58 2.40 12.5 (3430 -5660 C)
Vacuum bottoms 0.151 18.3 1. 85 4.15 11. 9 (5660 C +)
Whole crude 40.5 0.71 0.1 13.5 43.0 18 510
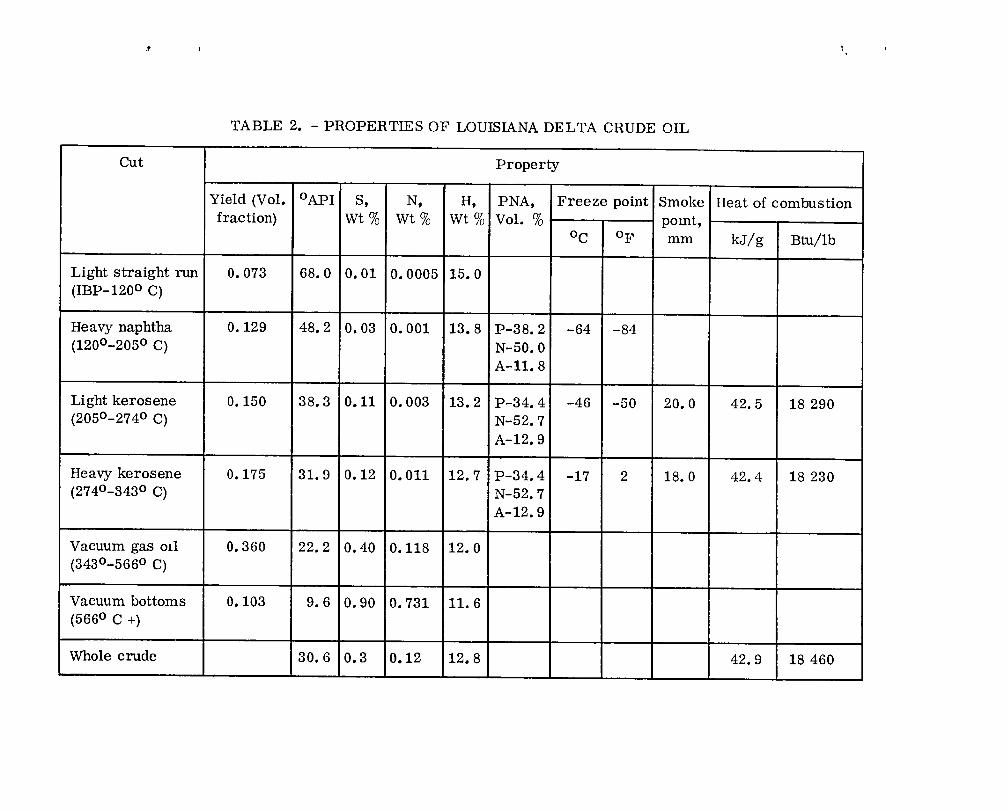
TABLE 2. - PROPERTIES OF LOUISIANA DELTA CRUDE OIL
Cut Property
Yield (Vol. °API S, N, H, PNA, Freeze point Smoke IIeat of combustion fraction) wt% Wt% Wt% Vol. % pomt,
°c of mm kJ/g Btu/lb
Light straight run 0.073 68.0 0.01 0.0005 15.0 (IBP-1200 C)
Heavy naphtha 0.129 48.2 0.03 0.001 13.8 P-38.2 -64 -84 (120°-205° C) N-50.0
A-11.8
Light kerosene 0.150 38.3 0.11 0.003 13.2 P-34.4 -46 -50 20.0 42.5 18 290 (205°-274° C) N-52.7
A-12.9
Heavy kerosene 0.175 31. 9 0.12 0.011 12.7 P-34.4 -17 2 18.0 42.4 18 230 (274°-343° C) N-52.7
A-12.9
Vacuum gas 011 0.360 22.2 0.40 0.118 12.0 (3430 -566° C)
Vacuum bottoms 0.103 9.6 0.90 0.731 11. 6 (5660 C +)
Whole crude 30.6 0.3 0.12 12.8 42.9 18460
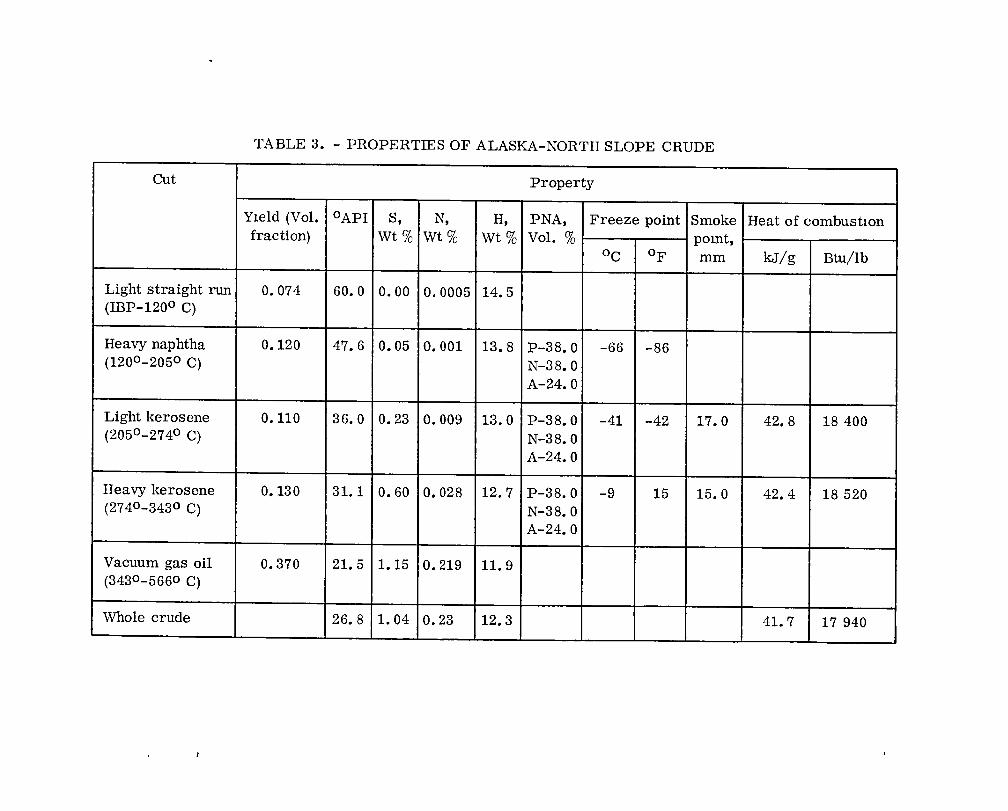
TABLE 3. - PROPERTIES OF ALASKA-NORTH SLOPE CRUDE
Cut Property
YIeld (Vol. °AP! S, N, H, PNA, Freeze point Smoke Heat of combustIOn fraction) Wt% Wt% Wt% Vol. % pomt,
°c of mm kJ/g Btu/lb
Light straight run 0.074 60.0 0.00 0.0005 14.5 (IBP-1200 C)
Heavy naphtha 0.120 47.6 0.05 0.001 13.8 P-38.0 -66 -86 (120°-205° C) N-38.0
A-24.0
Light kerosene 0.110 36.0 0.23 0.009 13.0 P-38.0 -41 -42 17.0 42.8 18400 (205°-274° C) N-38.0
A-24.0
Heavy kerosene 0.130 31.1 0.60 0.028 12.7 P-38.0 -9 15 15.0 42.4 18520 (274°-343° C) N-38.0
A-24.0
Vacuum gas oil 0.370 21. 5 1.15 0.219 11.9 (3430_5660 C)
Whole crude 26.8 1. 04 0.23 12.3 41. 7 17 940
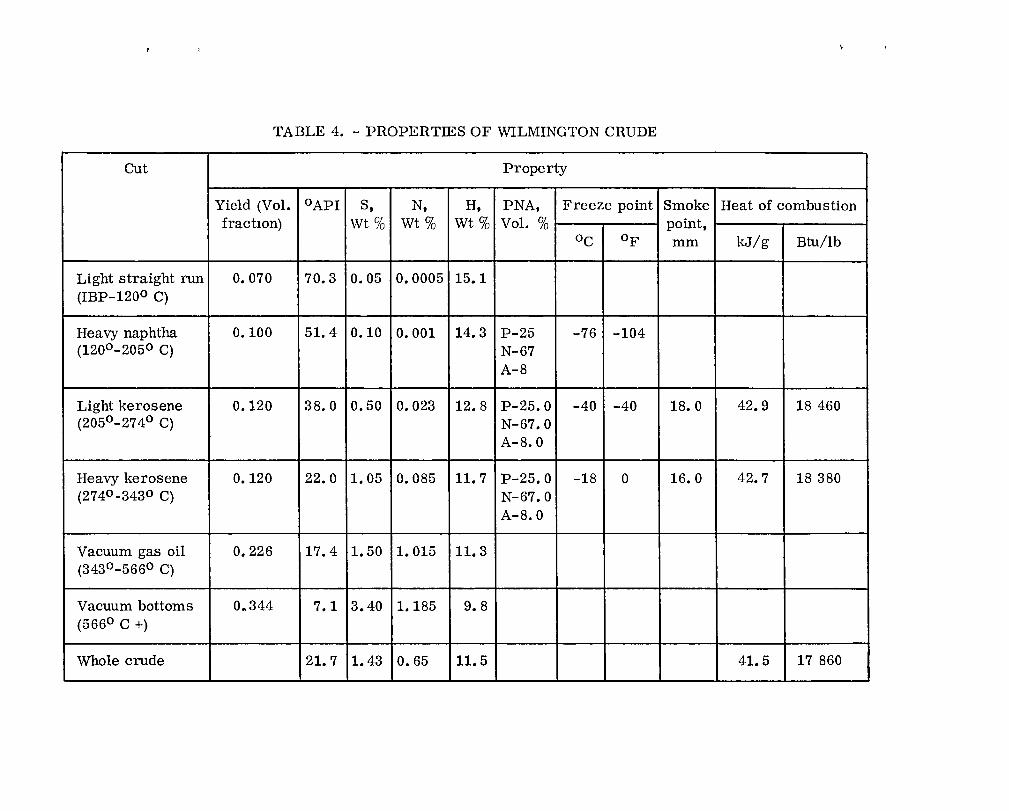
TABLE 4. - PROPERTIES OF WILMINGTON CRUDE
Cut Property
Yield (Vol. °API S, N, H, PNA, Freeze point Smoke Heat of combustion fractIOn) wt% Wt% Wt% Vol. % point,
°c of mm kJ/g Btu/lb
Light straight run 0.070 70.3 0.05 0.0005 15.1 (IBP-1200 C)
Heavy naphtha 0.100 51. 4 0.10 0.001 14.3 P-25 -76 -104 (1200 -2050 C) N-67
A-8
Light kerosene 0.120 38.0 0.50 0.023 12.8 P-25.0 -40 -40 18.0 42.9 18 460 (2050 -2740 C) N-67.0
A-8.0
Heavy kerosene 0.120 22.0 1. 05 0.085 11.7 P-25.0 -18 0 16.0 42.7 18380 (2740 -3430 C) N-67.0
A-B.O
Vacuum gas oil 0.226 17.4 1. 50 1. 015 11. 3 (343 0 -5660 C)
Vacuum bottoms 0~344 7.1 3.40 1.185 9.8 (5660 C +)
Whole crude 21. 7 1. 43 0.65 11.5 41. 5 17 860
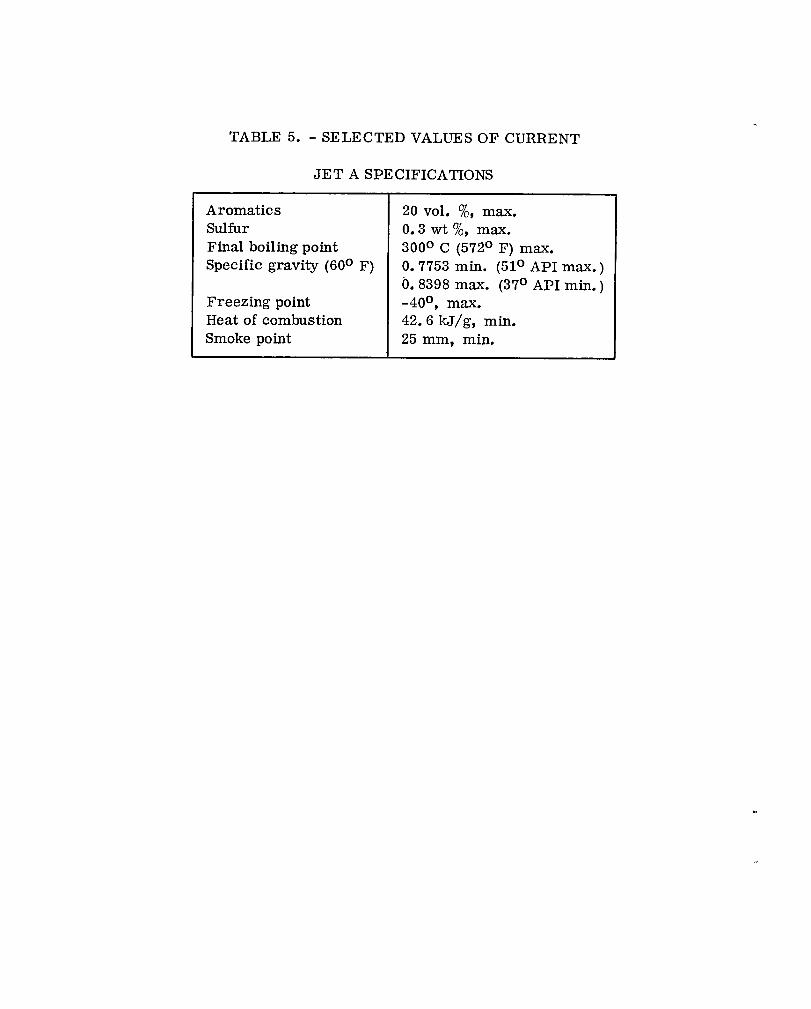
TABLE 5. - SELECTED VALUES OF CURRENT
JET A SPECIFICATIONS
Aromatics Sulfur Final boiling point Specific gravity (600 F)
Freezing point Heat of combustion Smoke point
20 vol. %, max. 0.3 wt %, max. 3000 C (5720 F) max. 0.7753 min. (510 API max. ) 0.8398 max. (370 API min.) -400 , max. 42.6 kJ/g, min. 25 mm, min.
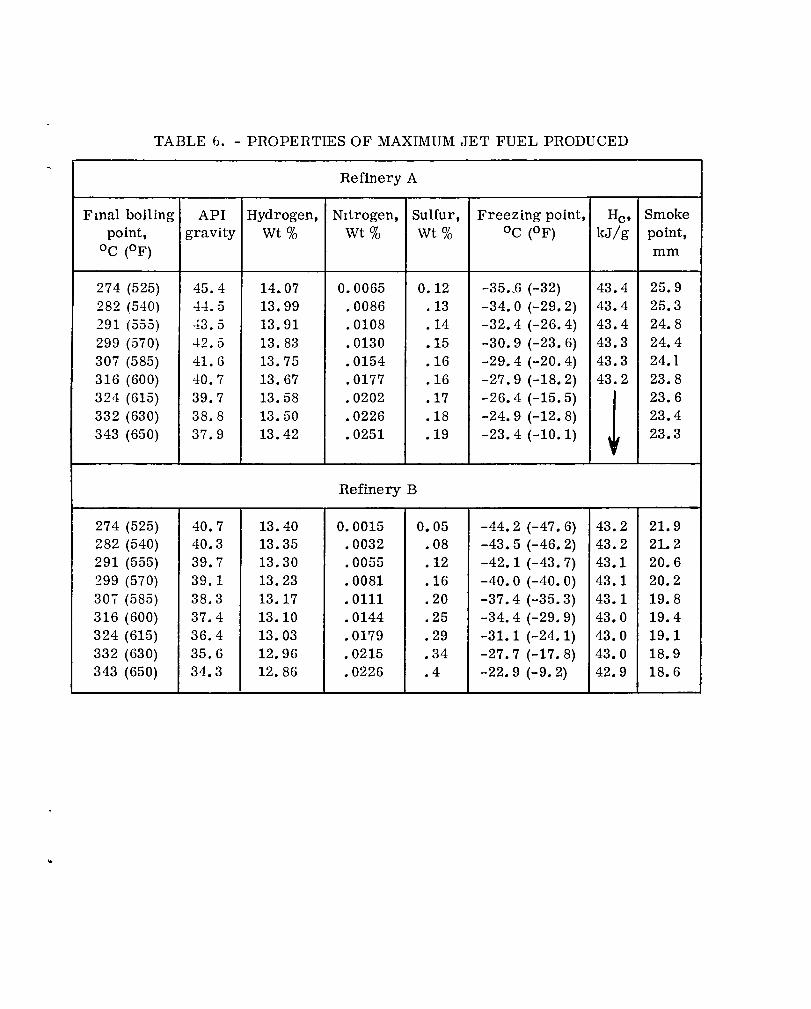
TABLE 6. - PROPEHTIES OF MAXIMUM JET FUEL PRODUCED
Refinery A
Fmal boiling API Hydrogen, NItrogen, Sulfur, Freezing point, He' Smoke point, gravity wt% wt% wt% 0c (OF) kJ/g point,
0c (OF) mm
274 (525) 45.4 14 .. 07 0.0065 0.12 -35 •. 6 (-32) 43.4 25.9 282 (540) 4-1.5 13.99 .0086 .13 -34.0 (-29.2) 43.4 25.3 291 (555) 43.5 13.91 .0108 .14 -32.4 (-26.4) 43.4 24.8 299 (570) 42.5 13.83 .0130 .15 -30.9 (-23.6) 43.3 24.4 307 (585) 41. 6 13.75 .0154 .16 -29.4 (-20.4) 43.3 24.1 316 (600) 40.7 13.67 .0177 .16 -27.9 (-18.2) 43.2 23.8 324 (615) 39.7 13.58 .0202 .17 -26.4 (-15.5)
J 23.6
332 (630) 38.8 13.50 .0226 .18 -24.9 (-12.8) 23.4 343 (650) 37.9 13.42 .0251 .19 -23.4 (-10.1) 23.3
Refinery B
274 (525) 40.7 13.40 0.0015 0.05 -44.2 (-47.6) 43.2 21. 9 282 (540) 40.3 13.35 .0032 .08 -43.5 (-46.2) 43.2 21.2 291 (555) 39.7 13.30 .0055 .12 -42.1 (-43.7) 43.1 20.6 299 (570) 39.1 13.23 .0081 .16 -40.0 (-40.0) 43.1 20.2 307 (585) 38.3 13.17 .0111 .20 -37.4 (-35.3) 43.1 19.8 316 (600) 37.4 13.10 .0144 .25 -34.4 (-29.9) 43.0 19.4 324 (615) 36.4 13.03 .0179 .29 -31.1 (-24.1) 43.0 19.1 332 (630) 35.6 12.96 .0215 .34 -27.7 (-17.8) 43.0 18.9 343 (650) 34.3 12.86 .0226 .4 -22.9 (-9.2) 42.9 18.6
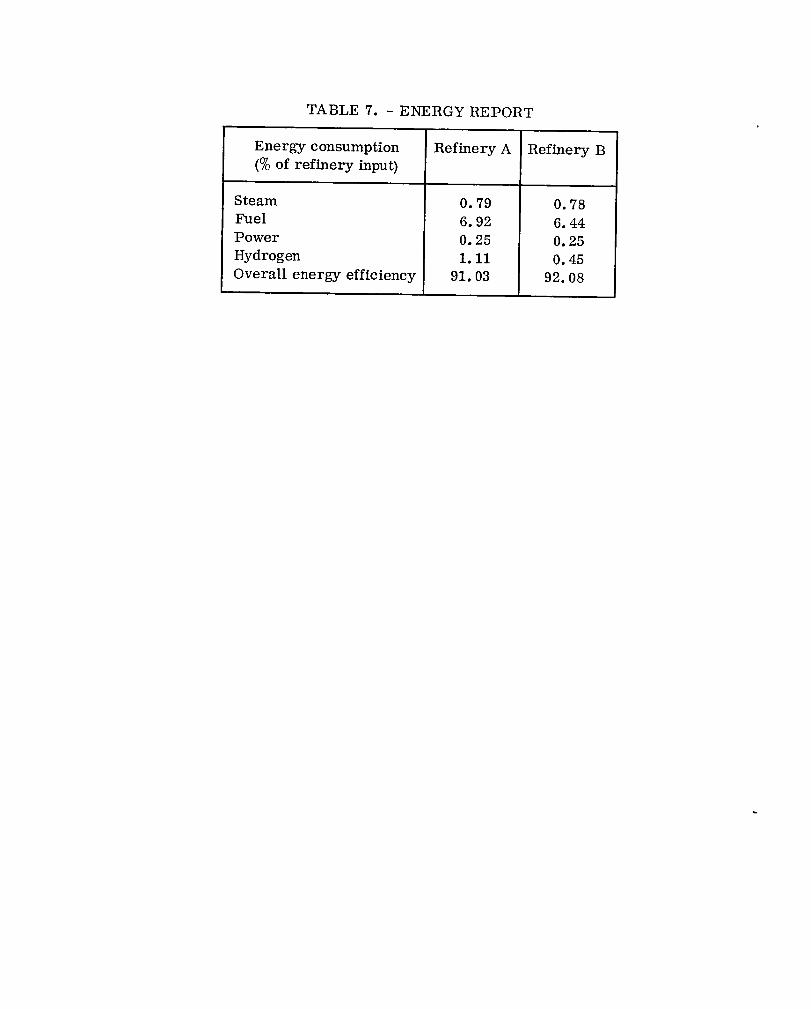
TABLE 7. - ENERGY REPORT
Energy consumption Refinery A Refinery B (% of refinery input)
Steam 0.79 0.78 Fuel 6.92 6.44 Power 0.25 0.25 Hydrogen 1.11 0.45 Overall energy efficiency 91. 03 92.08
Crude mix
~ Bl£ND
LIGHT ENDS H2 PLANT POLYMERIZATION
~ ALKYLATION GASOLINE
ATMOS· KEROSENE
PHERIC H KEROSENE HYDROTREATED KEROSENE
DISTIL· HYOROTRUTER I DISTILLATE DESUL· LATIOM rURlZER '--r-
DISTILLATE HYDRI· CRACKER
VACUUM GAS OIL FLUID CAT CRACKER t MID-DISTILLATE
I THERMAL CRACKER GASOLINE
VACUUM r'" GAS OIL HYDROCRACKER RESIDUAL GAS OIL DESUUURIZER
L.o. DISTIL. LATIOM GAS
qflHA OIL REFORMER l 4 COKER 1 GASOLINE t
YISBRUKER I RESIDUAL
Figure I - Simplified refinery flowchart
AtmospherIC dlslliiallon
Heavy naphta
light kerosene
Heavy kerosene
light kerosene
Hydrotrealed light kerosene
.....
~E DESUL-
~. MID-DISTIL-LATE
PRODUCTS
riiirl lli!LJ
00
Desulfumed Jet Vacuum gas 011 ,....---...., heavy kerosene fuel
Hydrocracked light kerosene
Hydrocracked heavy kerosene
Figure 2. - Simplified refinery flow chart for Jet fuel produchon In Refinery A
Crude mix
A tmosphenc dlsllilation
Heavy naphta
light kerosene
Heavy kerosene
light kerosene
Hydrotreated light kerosene
Figure 3 - Simplified refinery flow chart for Jet fuel producllon In Refinery B
! '" "" ;: u ~ ... ] Q;
.: ~ '5 :E '" ;;., E ::J E >< ~
45
40
35
30
25
20
Refinery A (lOUISiana Delta and Murban crudes)
Figure 4 - Maximum Yield of Jet fuel as a functIOn of final boiling pOint
Jet fuel
143
"'- Refinery A 'i 140 lLouslana Delta and 00- Murban crudes) c;; >.
-.:; 138 .2 ]t E 136 :::> E ;:c
"' E 134 'e
c: '" c: 0 132 u c: '" go ... l13 0
12 8270 290 310 330 350
Final boiling POint, °c Figure 5 - Hydrogen content of Jet
fuel as a funclion of final boiling pomt
al ~ CI> 'C :::> ... u '5 ... ~ Q;
E :!t 'IS 'C Q;
>=
35
30
25
20
15
10
5
Final bOiling pOint, °c Figure 6 - Yield of Jet fuel as a
function of specified hydrogen content and final boiling pOint for Refinery A
30
25
u o
-20
Q; -25 .: .",
Q;
>. -30 e '" e iC ... e -35
'25 C 8.
5 ~hydrogen
o~--~--~----~--~ 270 290 310 330 350
Final boiling POint, °c Figure 7 - Yield of jet fuel as a
functIOn of specified hydrogen content and final boiling pOint for Refinery B
g' ;:::; -«)
'" '" ... u.
-45 .L-_~_~_---=-==-----:-:! 270
Figure 8 - FreeZing POint as a function of final boiling POint for maxImum yield jet fuel
'5 "0 Q; >- 15
10
5~FP
~70
Figure 9 - Yield of Jet fuel as a funclion of freezing POint and final boilIng pOint for Refinery A
30
25
~ 20 :::I .... u
'IS ... ~ 15 c;; .E ~ '5 10
Maximum Yield
5~P
~7~0----~~--~---3~30--~
Final ooll'"g POint
Figure 10 - Yield of Jet fuel as a function of freezing pOint and final ooiling polnl for Refinery B
1
1 Report No 2 Government Accession No 3 RecIpient's Catalog No
NASA TM-79203 4 Title and Subtitle 5 Report Date
USE OF REFINERY COMPUTER MODEL TO PREDICT JET FUEL PRODUCTION 6 Performing Organization Codt
7 Author(s) 8 Performing Organization Report No
FrancIsco J. Flores E-088 10 Work Unit No
9 Performing Organization Name and Address
Nahonal Aeronautics and Space Administration 11 Contract or Grant No
LewIs Research Center Cleveland, OhlO 44135
13 Type of Report and Perood Covered
12 Sponsorong Agency Name and Address Techrucal Memorandum NatlOnal Aeronautics and Space Administration
14 Sponsorong Agency Code Washmgton, D. C. 20546
15 Supplementary Notes
16 Abstract
ThiS report IS a parametnc study of several factors (crudes, refinery operahon and specuica-hons) that affect Yields and properties of broad speciflcation let fuel. The Refmery Simulahon Model, developed under contract by Gordian ASSOCiates, Inc. and moduied at NASA LeRC was used to make the calculations. This computer program can simulate duferent types of refmer-les. Results obtained from the program are used to correlate yield as a funchon of fmal bOlhng pomt, hydrogen content and freezing point for jet fuels produced in two refmery configurations, each one processing a different crude mix. Refinery performances are also compared m terms of energy consumption.
17 Key Words (Suggested by Author(s)) 18 D,strobut'on Statement
Refmery; Jet fuel, Computer program; Unclassuled - unlimited Petroleum crudes; Boilmg range STAR Category 28
19 S.,,;.uro·y Classlf (of thiS report) 20 Securoty Class,f (of thiS page) 21 No of Pages 22 Proce .
Unclassified Unclassified
• For sale by the National Technical Information Service Springfield Virginia 22161

End of Document


![cEIIREcAivLFi-D]I - pdfs. fileIIII1_ I|1 Hill I.I IIII III II IIIIII HI,I III Amicrocomputerautomated recording spectropolarimeter VictorC. Zadnik,JamesL. Scott, RobertMegargle,Julius](https://static.fdocuments.us/doc/165x107/5a7b949b7f8b9a49588c0480/ceiirecaivlfi-di-pdfs-iiii1-i1-hill-ii-iiii-iii-ii-iiiiii-hii-iii-amicrocomputerautomated.jpg)