Igor Levi January 5, 2009 [email protected] Oil … · Equipment Improving Oil...
32
January 5, 2009 Oil Services, Drilling & Equipment Improving Oil Fundamentals and “Over Sold” Equities Increase in US oil demand, coupled with a decline in westbound sailings out of the Middle East, provides a favorable backdrop for an “over sold” OSX as we enter 2009. Over the past few weeks, we have seen a seasonal rebound in US oil demand from 18.5 mbpd to 20.0 mbpd while global supply continues to struggle. Not only is OPEC implementing cuts, but non-OPEC declines are becoming increasingly evident. Daily crude production in Mexico in 2008 through November was down ~9% from 2007 and ~14% from 2006. Russian oil production fell 1% last year, while output at China’s largest oilfield Daqing declined 3.6%. Furthermore, last week’s tanker data has shown a substantial drop in westbound sailings (page 22), suggesting an Atlantic Basin inventory draw underway. Despite a recent pop in the OSX, oil service and drilling stocks continue to trade on very cheap P/S and P/B valuations (page 13) coupled with historic low earnings multiples. The OSX corrected 60% in 2008, compared to a 50% run in 2007, with seismic, E&C, and the leveraged names underperforming (page 3). The E&C group should face downstream cost cutting initiatives by NOCs, while exploration oriented names are likely to come under broad based pressure (although this could reverse later in 2009). Names with above average debt levels underperformed irrespective of debt structure given the bearish sentiment, causing RIG, WFT and ATW to underperform despite substantial backlogs with reliable customers. The “winners” in 2008 were the gas-levered names, which underperformed in the prior two years. However, while outperforming in 2008, they dropped the most from mid-year highs. Although we expect a very broad based rally, RIG, WFT, NOV, HERO and Subsea 7 appear well positioned as potential relative winners for 2009, given very low valuations and the benefits of leverage in a more constructive tape. Table of Contents Investment Perspective Page 2 Review of 2008 Page 3 Contract Drilling Markets Pgs 4-5 Jackup Dayrates: Historical and Forecast Page 6 Floater Dayrates: Historical and Forecast Page 7 Morgan Stanley Offshore Drilling Dayrates by Company Page 8 Expected Deliveries: Jackups and Floaters Page 9 US and International Rig Counts Page 10 Trading and Valuation Summary: Contract Drillers Page 11 Global Valuation and Ratings Summary Page 12 Trading and Valuation Summary: Oil Services and Drillers Page 13 Consensus Earnings Revisions and Short Interest Ratios Page 14 Morgan Stanley EPS Estimates vs. Consensus Page 15 Morgan Stanley Revenue Growth Projections by Area Page 16 Morgan Stanley EBIT Margins Projections by Area Page 17 Morgan Stanley Oil Services Estimates vs. Consensus Page 18 Morgan Stanley Equipment Estimates vs. Consensus Page 19 Consensus Outlook Page 20 Commodity data and Global Economic Forecast Pgs 21-22 Newbuild Orderbook: Jackups and Floaters Pgs 23-24 Stocks Performance Review Pgs 25-26 Valuation Methodologies and Investment Risks Pgs 27-28 Morgan Stanley does and seeks to do business with companies covered in Morgan Stanley Research. As a result, investors should be aware that the firm may have a conflict of interest that could affect the objectivity of Morgan Stanley Research. Investors should consider Morgan Stanley Research as only a single factor in making their investment decision. Customers of Morgan Stanley in the US can receive independent, third-party research on companies covered in Morgan Stanley Research, at no cost to them, where such research is available. Customers can access this independent research at www.morganstanley.com/equityresearch or can call 1-800-624-2063 to request a copy of this research. For analyst certification and other important disclosures, refer to the Disclosure Section, located at the end of this report. += Analysts employed by non-U.S. affiliates are not registered with FINRA, may not be associated persons of the member and may not be subject to NASD/NYSE restrictions on communications with a subject company, public appearances and trading securities held by a research analyst account. Morgan Stanley & Co. Incorporated Ole Slorer [email protected] +1 (1)212 761 6198 Paulo Loureiro [email protected] +1 (1)212 761 6875 Igor Levi [email protected] +1 (1)212 761 3232 Morgan Stanley & Co. International plc+ Martijn Rats, CFA [email protected] +44 (0)20 7425 6618 MORGAN STANLEY RESEARCH NORTH AMERICA Industry View Attractive
Transcript of Igor Levi January 5, 2009 [email protected] Oil … · Equipment Improving Oil...

January 5, 2009
Oil Services, Drilling & Equipment Improving Oil Fundamentals and “Over Sold” Equities
Increase in US oil demand, coupled with a decline in westbound sailings out of the Middle East, provides a favorable backdrop for an “over sold” OSX as we enter 2009. Over the past few weeks, we have seen a seasonal rebound in US oil demand from 18.5 mbpd to 20.0 mbpd while global supply continues to struggle. Not only is OPEC implementing cuts, but non-OPEC declines are becoming increasingly evident. Daily crude production in Mexico in 2008 through November was down ~9% from 2007 and ~14% from 2006. Russian oil production fell 1% last year, while output at China’s largest oilfield Daqing declined 3.6%. Furthermore, last week’s tanker data has shown a substantial drop in westbound sailings (page 22), suggesting an Atlantic Basin inventory draw underway. Despite a recent pop in the OSX, oil service and drilling stocks continue to trade on very cheap P/S and P/B valuations (page 13) coupled with historic low earnings multiples.
The OSX corrected 60% in 2008, compared to a 50% run in 2007, with seismic, E&C, and the leveraged names underperforming (page 3). The E&C group should face downstream cost cutting initiatives by NOCs, while exploration oriented names are likely to come under broad based pressure (although this could reverse later in 2009). Names with above average debt levels underperformed irrespective of debt structure given the bearish sentiment, causing RIG, WFT and ATW to underperform despite substantial backlogs with reliable customers. The “winners” in 2008 were the gas-levered names, which underperformed in the prior two years. However, while outperforming in 2008, they dropped the most from mid-year highs. Although we expect a very broad based rally, RIG, WFT, NOV, HERO and Subsea 7 appear well positioned as potential relative winners for 2009, given very low valuations and the benefits of leverage in a more constructive tape.
Table of Contents Investment Perspective Page 2 Review of 2008 Page 3 Contract Drilling Markets Pgs 4-5 Jackup Dayrates: Historical and Forecast Page 6 Floater Dayrates: Historical and Forecast Page 7 Morgan Stanley Offshore Drilling Dayrates by Company Page 8 Expected Deliveries: Jackups and Floaters Page 9 US and International Rig Counts Page 10 Trading and Valuation Summary: Contract Drillers Page 11 Global Valuation and Ratings Summary Page 12 Trading and Valuation Summary: Oil Services and Drillers Page 13 Consensus Earnings Revisions and Short Interest Ratios Page 14 Morgan Stanley EPS Estimates vs. Consensus Page 15 Morgan Stanley Revenue Growth Projections by Area Page 16 Morgan Stanley EBIT Margins Projections by Area Page 17 Morgan Stanley Oil Services Estimates vs. Consensus Page 18 Morgan Stanley Equipment Estimates vs. Consensus Page 19 Consensus Outlook Page 20 Commodity data and Global Economic Forecast Pgs 21-22 Newbuild Orderbook: Jackups and Floaters Pgs 23-24 Stocks Performance Review Pgs 25-26 Valuation Methodologies and Investment Risks Pgs 27-28
Morgan Stanley does and seeks to do business with companies covered in Morgan Stanley Research. As a result, investors should be aware that the firm may have a conflict of interest that could affect the objectivity of Morgan Stanley Research. Investors should consider Morgan Stanley Research as only a single factor in making their investment decision. Customers of Morgan Stanley in the US can receive independent, third-party research on companies covered in Morgan Stanley Research, at no cost to them, where such research is available. Customers can access this independent research at www.morganstanley.com/equityresearch or can call 1-800-624-2063 to request a copy of this research. For analyst certification and other important disclosures, refer to the Disclosure Section, located at the end of this report. += Analysts employed by non-U.S. affiliates are not registered with FINRA, may not be associated persons of the member and may not be subject to NASD/NYSE restrictions on communications with a subject company, public appearances and trading securities held by a research analyst account.
Morgan Stanley & Co. Incorporated Ole Slorer
[email protected] +1 (1)212 761 6198
Paulo Loureiro [email protected] +1 (1)212 761 6875
Igor Levi [email protected] +1 (1)212 761 3232
Morgan Stanley & Co. International plc+
Martijn Rats, CFA [email protected] +44 (0)20 7425 6618
M O R G A N S T A N L E Y R E S E A R C H N O R T H A M E R I C A
Industry View Attractive

2
M O R G A N S T A N L E Y R E S E A R C H
January 5, 2009 Oil Services, Drilling & Equipment
Investment Perspective Exhibit 1 Weekly Stock Performance
SEVAN-OSLGTLS
NASDAQSPM-MIL
WG-LONS&P 500
TSDOHEROVK-PAROIIESVSBMO-AMSNE
FTIHALCAMRDC
OSXDRCSIIGA-PARSLBNOVBHIBJSPTEN
SUB-OSLACY-OSLPDERIGTEC-PAR
PGS-OSLDRQWFTSDRL-OSL
ATWIO
HLXNBR
-5% 0% 5% 10% 15% 20% 25% 30%
Source: FactSet; Morgan Stanley Research. Note: Graph is for total return for period.
ION gets a breather from its lenders and implements a shareholder rights plan. As we anticipated in Nov, ION was unable to place a $175m unsecured note in the public markets. Instead, ION used all of its available cash to pay down $72m in revolver and negotiated with its current lenders a refinancing plan at 25% interest rate. We believe this plan leaves ION with no short term financial cushion for what appears to be a difficult 2009. Simultaneously, ION amended its shareholder rights plan to deter a predatory takeover.
Oilexco said on 12/31/08 that its North Sea operating unit intends to file for bankruptcy protection, which may affect DO and to a lesser degree RIG. Both companies have one semi contracted with Oilexco, but we expect DO to be more impacted, as it has fewer rigs and greater exposure to small E&Ps. Based on this filing, we have assumed that the two rigs will be released this quarter and re-contracted around $250 kpd. Therefore, we’ve lowered RIG’s 2010e EPS from $14.15 to $14.10 and DO’s 2009e EPS from $9.85 to $9.75 and 2010e EPS from $10.70 to $10.50.
Morgan Stanley & Co. Limited is acting as strategic and financial advisor to Oilexco Incorporated, as announced on 20th November 2008. In accordance with its general policy, Morgan Stanley currently expresses no rating or price target on Oilexco Incorporated. This report was prepared solely upon information generally available to the public. No representation is made that it is accurate and complete. This report is not a recommendation or an offer to buy or sell the securities mentioned. Please refer to the notes at the end of this report.
No new rig orders in 4Q08 for two major shipyards: Keppel and Sembcorp. We expect orders for both jackups and floaters to drop significantly in 2009 due to difficulty securing financing for spec-builds, as well as more attractive opportunities in acquiring rigs from distressed drillers. This is supported by two data points this week: Global Geo Services’ decision to put on hold its newbuild tender project, as well as NIOC’s (Iranian NOC) decision to purchase 20 offshore units.
Rig Count up in 2008, but set to Decline during 2009 Last year, the NAm and int’l rig counts increased ~7%, buoyed by surging commodity prices through mid-year. But over the past few months the NAm rig count has taken a 25% drop from 2460 to ~1850, exacerbated by a ~50% drop in Canada, despite 1Q usually being the strongest quarter for Canada. Going forward, we are forecasting a 20% y/y decline in NAm rig count, similar to the previous two down cycles, and no improvement in 2010. We are forecasting a more modest decline in int’l land rig count of 5%, similar to 2002. While we see a decline in the int’l land rig count, we expect total int’l rig count to increase in 2009 and 2010, as we see the incoming fleet of newbuild jackups and floaters (page 9), many of which have multi-year contracts, offsetting the decline in int’l land.
Exhibit 2 Y/Y change in Rig Count: Historical and MS Forecast
-40%
-30%
-20%
-10%
0%
10%
20%
30%
1998 1999 2000 2001 2002 2003 2004 2005 2006 2007 2008 2009e 2010e
North America Int'l Land Int'l Offshore Source: Baker Hughes, Morgan Stanley Research; note: 2008 int’l land rig count includes average rig count through November 2008.

3
M O R G A N S T A N L E Y R E S E A R C H
January 5, 2009 Oil Services, Drilling & Equipment
Review of 2008: US Gas Names Finally Outperformed following two years of Disappointment, while Seismic, E&C, and companies with significant debt levels Underperformed Exhibit 3 Stock Performance in 2008…. ….and Stock Performance in 2007
SEVAN-OSLPGS-OSL
HLXHERO
IOACY-OSL
GA-PARSUB-OSL
ATWSII
WFTWG-LON
RIGNOVGTLS
SDRL-OSLDRQ
TKTEC-PAR
NEBHI
OSXRDC
SPM-MILSBMO-AMS
CAMVK-PAR
OIISLBNBR
DODRC
FTIPDEESV
TSHALBJS
OSGNASDAQ
PTENS&P 500
GMRFRO
NAT
-100% -80% -60% -40% -20% 0% 20% 40%
HERO.OBJS.N
PTEN.OINTEq.L
TS.NNBR.N
SBMO.ASVK-PAR
S&P 500NAT.NBHI.NNASDAQGMR.NPDE.NWHQ.NIO.NACY.OLESV.NRDC.NSUB.OLTECF.PAHAL.NTK.N
PGS.OLGEPH.PAOSG.N
GRP.NDRQ.NSDRL.OL
NE.NOSX
SPMI.MISLB.NDRC.N
WFT.NRIG.NWG.L
SII.NCAM.NFTI.N
DO.NGTLS.O
NOV.N
-50% 0% 50% 100% 150%
Source: FactSet, Morgan Stanley Research

4
M O R G A N S T A N L E Y R E S E A R C H
January 5, 2009 Oil Services, Drilling & Equipment
Exhibit 4 Floater Contract Status: Less than 2,000 Feet
0 180 360 540 720 900 1,080
Songa VenusBideford Dolphin
GSF Grand BanksSagar Bhushan
Noble Ton van LangeveldStena Don
Ocean VanguardGSF Arctic IV
Transocean ProspectFrontier Duchess
GSF Arctic IIIOcean Epoch
Ocean NomadDoo Sung
PetroliaBredford Dolphin
Stena SpeySedneth 701
Sedco 712Pride Venezuela
J.W. McLeanHakuryu-5
Scarabeo 4Ocean New EraOcean Princess
Zagreb 1Pride South Seas
ActiniaTransocean John Shaw
Kan Tan IIISonga Mercur
Borgsten DolphinIstiglal
Dada GorgudNanhai II
GSF Arctic IINanhai VAbsheron
Days from TodayNewbuild/UpgradeContract TermNewbuild/Upgrade (w/ contract)Option
Source: ODS-Petrodata, Company data, Morgan Stanley Research Exhibit 5 Floater Contract Status: 2,000-4,000 Feet
0 180 360 540 720 900 1,080
Olinda StarIran Alborz
Transocean DrillerPetrobras XVII
Noble Therald MartinNeptune Explorer
Ocean WinnerOcean Worker
Ocean YatzyCOSLPioneer
Ocean YorktownPride Mexico
Falcon 100Ocean LexingtonOcean Concord
Paul B. Loyd, Jr.Pride South America
Aban IceOcean Quest
Kan Tan IVNoble Lorris Bouzigard
Transocean AmiranteSagar Vijay
GSF Arctic IOcean Patriot
Scarabeo 6Island Innovator
Songa SaturnOcean Saratoga
GSF Rig 135Energy Searcher
Transocean LegendOcean Voyager
C. Kirk Rhein, Jr.GSF Aleutian Key
Sedco 700Sedco 703
GSF Rig 140Maersk Explorer
Atwood Southern
Days from TodayNewbuild/UpgradeContract TermNewbuild/Upgrade (w/ contract)Option
Source Company data, ODS-Petrodata, Morgan Stanley Research
Exhibit 6 Floater Contract Status: 4,001-7,500 Feet
0 180 360 540 720 900 1,080
Sedco ExpressNoble Homer Ferrington
Transocean LeaderFrontier Driller
Noble Paul RomanoTransocean Marianas
Stena DrillMAXBlackford Dolphin
Pride AfricaM.G. Hulme, Jr.
Deepwater FrontierAtwood FalconWest Venture
Tanker Pacific Drsh Tbn4Discoverer Seven Seas
Noble Max SmithAtwood Eagle
Aban AbrahamTanker Pacific Drsh Tbn3Tanker Pacific Drsh Tbn2
Ocean RoverNoble Jim Thompson
Scarabeo 5Deep Venture
GSF Celtic SeaJack Bates
Pride North AmericaOcean Clipper
Jim CunninghamTanker Pacific Drsh Tbn1
Henry GoodrichOcean AmericaDiscoverer 534
Transocean RichardsonSovereign Explorer
Ocean BaronessPride South Pacific
Ocean VictoryTransocean Rather
SC LancerSedco 709
Leiv EirikssonOcean Star
Days from Today
Newbuild/UpgradeContract TermNewbuild/Upgrade (w/ contract)Option
Source: Company data, ODS-Petrodata, Morgan Stanley Research Exhibit 7 Floater Contract Status: 7,500+ Feet
0 180 360 540 720 900 1,080
Belford DolphinOcean Monarch
Maersk DeveloperGSF ExplorerWest Polaris
Maersk Semi Tbn2ENSCO 8506
Saipem 10000Atwood Semi Tbn2
ENSCO 8502Ocean Confidence
ENSCO 8505Deepwater Nautilus
ENSCO 7500TMT/Mandarin Drsh Tbn3
Pride Drsh Tbn4Stena DrillMAX ICE
West CapricornDeepsea Metro II
West HerculesNoble Drsh Tbn1
Grupo R Semi Tbn1DryShips Drsh Tbn2
ENSCO 8504Alpha Star
DryShips Drsh Tbn1Ocean Endeavor
TMT/Mandarin Drsh Tbn2Deepsea Metro I
PetroRig IVCardiff Marine Drsh Tbn2
Noble Amos RunnerStena Tay
Discoverer Deep SeasDiscoverer Enterprise
Cardiff Marine Drsh Tbn1Maersk Semi Tbn3
SDO IIDeepwater Horizon
Deepsea StavangerWest Gemini
Cajun ExpressNoble Clyde Boudreaux
Days from TodayNewbuild/UpgradeContract TermNewbuild/Upgrade (w/ contract)Option
Source: Company data, ODS-Petrodata, Morgan Stanley Research
5
M O R G A N S T A N L E Y R E S E A R C H
January 5, 2009 Oil Services, Drilling & Equipment
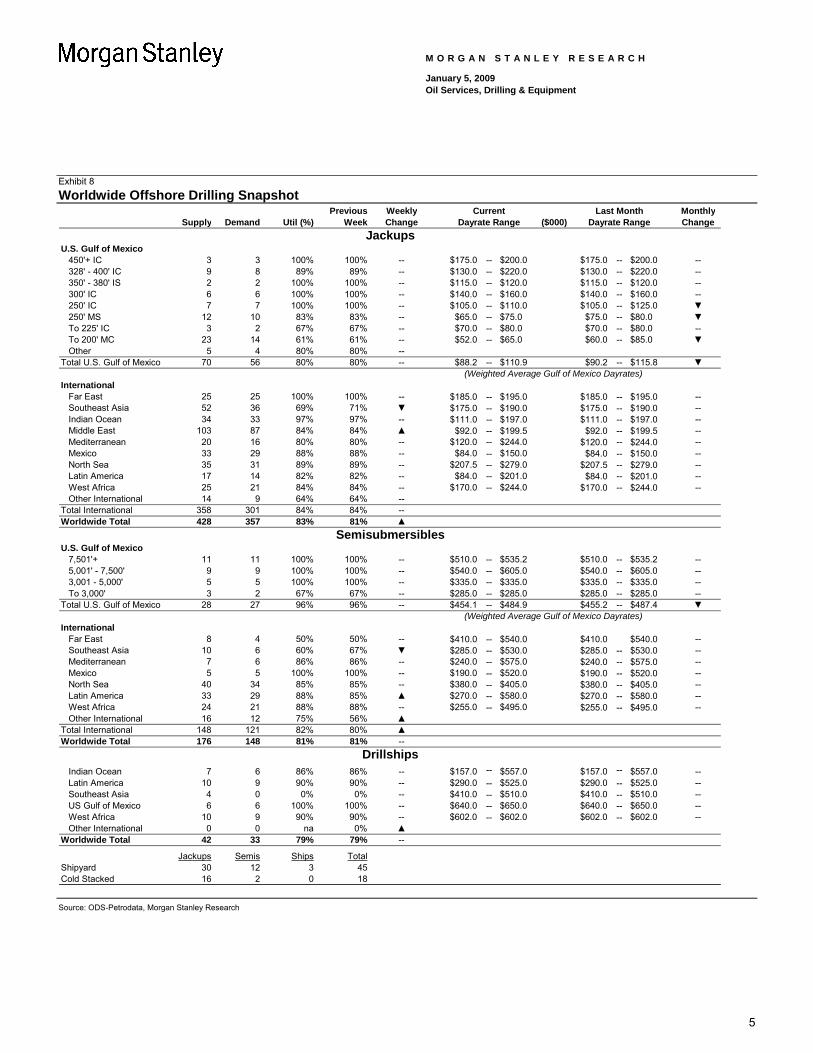
Exhibit 8 Worldwide Offshore Drilling Snapshot
Previous Weekly Current Last Month MonthlySupply Demand Util (%) Week Change Dayrate Range ($000) Dayrate Range Change
U.S. Gulf of Mexico450'+ IC 3 3 100% 100% -- $175.0 -- $200.0 $175.0 -- $200.0 --328' - 400' IC 9 8 89% 89% -- $130.0 -- $220.0 $130.0 -- $220.0 --350' - 380' IS 2 2 100% 100% -- $115.0 -- $120.0 $115.0 -- $120.0 --300' IC 6 6 100% 100% -- $140.0 -- $160.0 $140.0 -- $160.0 --250' IC 7 7 100% 100% -- $105.0 -- $110.0 $105.0 -- $125.0 ▼250' MS 12 10 83% 83% -- $65.0 -- $75.0 $75.0 -- $80.0 ▼To 225' IC 3 2 67% 67% -- $70.0 -- $80.0 $70.0 -- $80.0 --To 200' MC 23 14 61% 61% -- $52.0 -- $65.0 $60.0 -- $85.0 ▼Other 5 4 80% 80% --
Total U.S. Gulf of Mexico 70 56 80% 80% -- $88.2 -- $110.9 $90.2 -- $115.8 ▼(Weighted Average Gulf of Mexico Dayrates)
InternationalFar East 25 25 100% 100% -- $185.0 -- $195.0 $185.0 -- $195.0 --Southeast Asia 52 36 69% 71% ▼ $175.0 -- $190.0 $175.0 -- $190.0 --Indian Ocean 34 33 97% 97% -- $111.0 -- $197.0 $111.0 -- $197.0 --Middle East 103 87 84% 84% ▲ $92.0 -- $199.5 $92.0 -- $199.5 --Mediterranean 20 16 80% 80% -- $120.0 -- $244.0 $120.0 -- $244.0 --Mexico 33 29 88% 88% -- $84.0 -- $150.0 $84.0 -- $150.0 --North Sea 35 31 89% 89% -- $207.5 -- $279.0 $207.5 -- $279.0 --Latin America 17 14 82% 82% -- $84.0 -- $201.0 $84.0 -- $201.0 --West Africa 25 21 84% 84% -- $170.0 -- $244.0 $170.0 -- $244.0 --Other International 14 9 64% 64% --
Total International 358 301 84% 84% --Worldwide Total 428 357 83% 81% ▲
U.S. Gulf of Mexico7,501'+ 11 11 100% 100% -- $510.0 -- $535.2 $510.0 -- $535.2 --5,001' - 7,500' 9 9 100% 100% -- $540.0 -- $605.0 $540.0 -- $605.0 --3,001 - 5,000' 5 5 100% 100% -- $335.0 -- $335.0 $335.0 -- $335.0 --To 3,000' 3 2 67% 67% -- $285.0 -- $285.0 $285.0 -- $285.0 --
Total U.S. Gulf of Mexico 28 27 96% 96% -- $454.1 -- $484.9 $455.2 -- $487.4 ▼(Weighted Average Gulf of Mexico Dayrates)
InternationalFar East 8 4 50% 50% -- $410.0 -- $540.0 $410.0 $540.0 --Southeast Asia 10 6 60% 67% ▼ $285.0 -- $530.0 $285.0 -- $530.0 --Mediterranean 7 6 86% 86% -- $240.0 -- $575.0 $240.0 -- $575.0 --Mexico 5 5 100% 100% -- $190.0 -- $520.0 $190.0 -- $520.0 --North Sea 40 34 85% 85% -- $380.0 -- $405.0 $380.0 -- $405.0 --Latin America 33 29 88% 85% ▲ $270.0 -- $580.0 $270.0 -- $580.0 --West Africa 24 21 88% 88% -- $255.0 -- $495.0 $255.0 -- $495.0 --Other International 16 12 75% 56% ▲
Total International 148 121 82% 80% ▲Worldwide Total 176 148 81% 81% --
Indian Ocean 7 6 86% 86% -- $157.0 -- $557.0 $157.0 -- $557.0 --Latin America 10 9 90% 90% -- $290.0 -- $525.0 $290.0 -- $525.0 --Southeast Asia 4 0 0% 0% -- $410.0 -- $510.0 $410.0 -- $510.0 --US Gulf of Mexico 6 6 100% 100% -- $640.0 -- $650.0 $640.0 -- $650.0 --West Africa 10 9 90% 90% -- $602.0 -- $602.0 $602.0 -- $602.0 --Other International 0 0 na 0% ▲
Worldwide Total 42 33 79% 79% --
Jackups Semis Ships TotalShipyard 30 12 3 45Cold Stacked 16 2 0 18
Jackups
Semisubmersibles
Drillships
Source: ODS-Petrodata, Morgan Stanley Research

6
M O R G A N S T A N L E Y R E S E A R C H
January 5, 2009 Oil Services, Drilling & Equipment
Exhibit 9 Average Dayrates for GoM Commodity Jackups
$0
$20
$40
$60
$80
$100
$120
$140
19981999200020012002200320042005200620072008$0
$20
$40
$60
$80
$100
$120
$140
GoM 250 ICGoM 200 MCGoM 250 MS
Source: ODS-Petrodata, Morgan Stanley Research Exhibit 10 Average Dayrates for International Jackups
$0
$50
$100
$150
$200
$250
1998 1999 2000 2001 2002 2003 2004 2005 2006 2007 2008$0
$50
$100
$150
$200
$250
SE AsiaW. AfricaME
Source: ODS-Petrodata, Morgan Stanley Research
Exhibit 11 Average Dayrates for GoM High Spec Jackups
$0
$20
$40
$60
$80
$100
$120
$140
$160
$180
$200
1998 1999 2000 2001 2002 2003 2004 2005 2006 2007 2008$0
$20
$40
$60
$80
$100
$120
$140
$160
$180
$200
GoM 300+ ICGoM 300 ICMexico 300 IC
Source: ODS-Petrodata, Morgan Stanley Research Exhibit 12 Average Dayrates for North Sea Jackups
$0
$50
$100
$150
$200
$250
$300
$350
1998 1999 2000 2001 2002 2003 2004 2005 2006 2007 2008$0
$50
$100
$150
$200
$250
$300
$350
Harsh High SpecHarsh Standard
Source: ODS-Petrodata, Morgan Stanley Research
Exhibit 13 Morgan Stanley: Key Jackup Rollover Assumptions ($kpd)
GoM Jackups 1Q09 2Q09 3Q09 4Q09 1Q10 2Q10 3Q10 4Q10250 MS 60 55 55 55 55 55 65 75200 MC 63 58 58 58 58 58 68 78250 IC 65 60 60 60 60 60 70 80300 IC 95 90 90 90 90 90 100 110350 IC 110 105 105 105 105 105 115 125
International 300 IC 1Q09 2Q09 3Q09 4Q09 1Q10 2Q10 3Q10 4Q10Mexico 120 105 105 105 105 105 105 105N. Sea (standard) 170 150 120 120 120 120 120 120N. Sea (harsh) 190 170 140 140 140 140 140 140Middle East 145 125 110 110 110 110 110 110Rest of World 135 115 115 115 115 115 115 115
Source: ODS-Petrodata, Morgan Stanley Research estimates

7
M O R G A N S T A N L E Y R E S E A R C H
January 5, 2009 Oil Services, Drilling & Equipment
Exhibit 14 Average Dayrates for Floaters in the GoM
$0
$100
$200
$300
$400
$500
$600
1998 1999 2000 2001 2002 2003 2004 2005 2006 2007 2008$0
$100
$200
$300
$400
$500
$600
DeepwaterMid-water
Source: ODS-Petrodata, Morgan Stanley Research Exhibit 15 Average Dayrates for Floaters in West Africa
$0
$100
$200
$300
$400
$500
$600
1998 1999 2000 2001 2002 2003 2004 2005 2006 2007 2008$0
$100
$200
$300
$400
$500
$600
DeepwaterMid-water
Source: ODS-Petrodata, Morgan Stanley Research
Exhibit 16 Average Dayrates for Floaters in Brazil
$0
$100
$200
$300
$400
$500
$600
1998 1999 2000 2001 2002 2003 2004 2005 2006 2007 2008$0
$100
$200
$300
$400
$500
$600
DeepwaterMid-water
Source: ODS-Petrodata, Morgan Stanley Research Exhibit 17 Average Dayrates for Floaters in the North Sea
$0
$100
$200
$300
$400
$500
$600
1998 1999 2000 2001 2002 2003 2004 2005 2006 2007 2008$0
$100
$200
$300
$400
$500
$600
HarshStandard
Source: ODS-Petrodata, Morgan Stanley Research
Exhibit 18 Morgan Stanley: Key Floater Rollover Assumptions ($kpd)
Floaters 1Q09 2Q09 3Q09 4Q09 1Q10 2Q10 3Q10 4Q10<2,000 ft 252 227 205 185 185 185 185 1852,000-4,000 312 286 265 245 240 240 240 2404,001-7,500 464 436 405 384 384 386 388 3907,500+ 576 550 530 512 512 514 516 518
North Sea Floaters 1Q09 2Q09 3Q09 4Q09 1Q10 2Q10 3Q10 4Q10Standard 330 305 280 255 255 255 255 255Harsh 400 385 370 370 370 370 370 370
Source: ODS-Petrodata, Morgan Stanley Research estimates

8
M O R G A N S T A N L E Y R E S E A R C H
January 5, 2009 Oil Services, Drilling & Equipment
Exhibit 19 Morgan Stanley Estimates of Average Achieved Dayrates by Asset Class and Contractor
AVERAGE RATES BY ASSET CLASS ($000/day)RIG Quantity 2005 2006 2007 2008e 2009e 2010e PDE Quantity 2005 2006 2007 2008e 2009e 2010eJackups Jackups250 IC 14 48 83 123 135 126 105 250 MS 6 41 88 81 79 73 69300 IC 31 65 109 128 161 155 133 200 MC 12 43 85 94 84 69 71350 IC 11 69 103 153 175 171 145 250 IC 2 50 50 45 68 90 98400 IC 7 86 114 170 189 190 155 300 IC 6 53 63 118 140 114 106Floaters Floaters2G 5 84 139 241 326 364 295 2G 4 68 83 165 223 246 2253G/4G 41 110 170 265 319 338 344 3G/4G 8 121 154 205 274 305 2785G/6G 30 185 226 291 395 451 489 5G/6G 6 165 174 196 265 330 378
DO Quantity 2005 2006 2007 2008e 2009e 2010e ATW Quantity 2005 2006 2007 2008e 2009e 2010eJackups Jackups250 MS 1 43 88 68 61 59 63 300 IC 1 65 88 140 155 135 115200 MC 2 46 99 84 65 63 68 350 IC 1 na na na na 165 165250 IC 1 48 103 115 125 88 85 400 IC 1 68 75 135 135 131 130300 IC 7 60 116 118 123 114 104 Floaters350 IC 4 60 110 114 138 163 119 2G 1 46 88 179 320 150 160Floaters 3G/4G 3 85 139 193 269 395 4642G 12 73 138 195 286 304 2783G/4G 13 103 158 248 331 349 3765G/6G 6 146 211 281 308 370 378
NE Quantity 2005 2006 2007 2008e 2009e 2010e HERO Quantity 2005 2006 2007 2008e 2009e 2010eJackups Jackups250 IC 11 54 85 143 166 151 100 250 MS 9 79 79 79 79 76 76300 IC 21 53 70 103 138 126 115 200 MC 10 43 89 80 75 69 71350 IC 1 75 108 125 164 190 130 250 IC 3 na na na 143 135 135400 IC 7 65 89 124 156 139 158 350 IC 1 na na na 108 106 113Floaters Barges 27 na 39 45 39 38 393G/4G 8 120 185 264 335 394 416 GoM Liftboats 45 na na 12 9 8 105G/6G 9 111 125 161 223 310 371 Int'l Liftboats 20 na na 13 17 17 19
ESV Quantity 2005 2006 2007 2008e 2009e 2010e RDC Quantity 2005 2006 2007 2008e 2009e 2010eJackups Jackups250 IC 18 60 101 114 118 110 90 300 IC 7 70 136 144 145 144 148300 IC 10 64 94 128 150 135 119 350 IC 11 79 128 135 134 116 115350 IC 4 80 125 109 156 134 128 400 IC 11 106 170 219 223 233 200400 IC 11 85 129 190 205 190 155Floaters5G/6G 8 161 188 195 395 430 423
DAYS CONTRACTEDJACKUPS FLOATERSContractor Quantity Total Days Contracted Days Percent Covered Contractor Quantity Total Days Contracted Days Percent Covered
2009 2010 2009 2010 2009 2010 2009 2010 2009 2010 2009 2010RIG 64 23,360 23,360 18,231 7,780 78% 33% RIG 66 24,090 24,090 22,366 17,838 93% 74%DO 14 5,110 5,110 2,097 279 41% 5% DO 31 11,315 11,315 11,041 8,776 98% 78%NE 42 15,330 15,330 12,288 4,606 80% 30% NE 14 5,110 5,110 4,924 4,744 96% 93%ESV 43 15,695 15,695 10,933 4,875 70% 31% ESV 2 365 365 365 365 100% 100%PDE 23 8,395 8,395 2,832 597 34% 7% PDE 14 5,110 5,110 5,019 4,202 98% 82%ATW 3 1,095 1,095 569 365 52% 33% ATW 4 1,460 1,460 1,103 1,095 76% 75%RDC 22 8,030 8,030 6,197 3,093 77% 39% RDC 0 na na na na na naHERO 30 10,950 10,950 4,528 2,104 41% 19% HERO 0 na na na na na na
Source: Company data, Morgan Stanley Research. Note: “Average Rates” section includes contracted and estimated dayrates, and includes cold-stacked rigs in the “quantity”; “Days Contracted” section excludes cold-stacked rigs and rigs under construction
9
M O R G A N S T A N L E Y R E S E A R C H
January 5, 2009 Oil Services, Drilling & Equipment
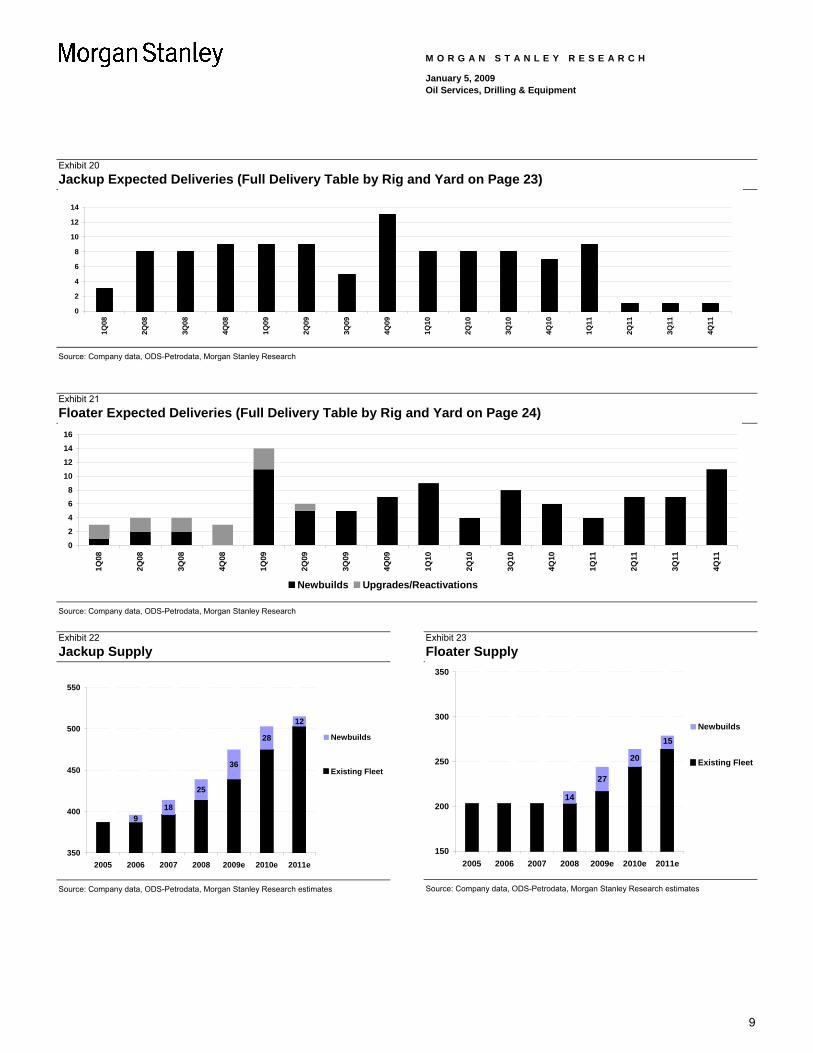
Exhibit 20 Jackup Expected Deliveries (Full Delivery Table by Rig and Yard on Page 23)
0
2
4
6
8
10
12
14
1Q08
2Q08
3Q08
4Q08
1Q09
2Q09
3Q09
4Q09
1Q10
2Q10
3Q10
4Q10
1Q11
2Q11
3Q11
4Q11
Source: Company data, ODS-Petrodata, Morgan Stanley Research
Exhibit 21 Floater Expected Deliveries (Full Delivery Table by Rig and Yard on Page 24)
02468
10121416
1Q08
2Q08
3Q08
4Q08
1Q09
2Q09
3Q09
4Q09
1Q10
2Q10
3Q10
4Q10
1Q11
2Q11
3Q11
4Q11
Newbuilds Upgrades/Reactivations
Source: Company data, ODS-Petrodata, Morgan Stanley Research
Exhibit 22 Jackup Supply
918
25
36
28
12
350
400
450
500
550
2005 2006 2007 2008 2009e 2010e 2011e
Newbuilds
Existing Fleet
Source: Company data, ODS-Petrodata, Morgan Stanley Research estimates
Exhibit 23 Floater Supply
14
27
20
15
150
200
250
300
350
2005 2006 2007 2008 2009e 2010e 2011e
Newbuilds
Existing Fleet
Source: Company data, ODS-Petrodata, Morgan Stanley Research estimates

10
M O R G A N S T A N L E Y R E S E A R C H
January 5, 2009 Oil Services, Drilling & Equipment
U.S. and International Rig CountsExhibit 24 Weekly US Land Rig Count vs. Oil / Gas Strip
600800
1,0001,2001,4001,6001,8002,0002,200
01/0
007
/00
01/0
107
/01
01/0
207
/02
01/0
307
/03
01/0
407
/04
01/0
507
/05
01/0
607
/06
01/0
707
/07
01/0
807
/08
Rig
s W
orki
ng
051015202530354045
20/8
0 O
il vs
. Gas
US Land Rigs Oil / Gas Strip Source: Baker Hughes, Bloomberg Exhibit 25 International Rig Count (Updated Dec 05, 2008)
500550600650700750800850900950
100010501100
01/9
3
01/9
4
01/9
5
01/9
6
01/9
7
01/9
8
01/9
9
01/0
0
01/0
1
01/0
2
01/0
3
01/0
4
01/0
5
01/0
6
01/0
7
01/0
8
Inte
rnat
iona
l Rig
Cou
nt
Source: Baker Hughes (adjusted to exclude Iran and Sudan)
Exhibit 26 Weekly North American Rig Counts
This Last Last Recent01/02/09 Week Week Change Year Peak
US Land 1,547 1,645 (98) 1,682 1,938US Offshore 68 68 0 63 181US Inland 8 8 0 29 31US Total 1,623 1,721 (98) 1,774 2,031Canada 230 279 (49) 319 727Total North America 1,853 2,000 (147) 2,093 2,467Gulf of Mexico 63 64 (1) 61 176US Gas 1,267 1,347 (80) 1,450 1,606US Oil 346 364 (18) 316 442
Source: Baker Hughes Exhibit 27 International Monthly Rig Count (Updated Dec 05, 2008)
Last RecentLand 11/08 10/08 Change Year PeakEurope 55 53 2 34 58 Middle East 244 253 (9) 235 257 Africa 45 48 (3) 51 58 Latin America 320 325 (5) 271 325 Asia / Pacific 135 133 2 129 142 Total Land 799 812 (13) 720 815 OffshoreEurope 52 48 4 37 71 Middle East 36 35 1 30 43 Africa 14 12 2 18 35 Latin America 77 78 (1) 69 89 Asia / Pacific 118 111 7 118 132 Total Offshore 297 284 13 272 321 US Workover 1,496 1,480 16 1,539 1,657 Canada Workover 635 826 (191) 488 826 NA Workover 2,131 2,306 (175) 2,027 2,407
Source: Baker Hughes. Note: updated the first week of every month. Data from Iran and Sudan discontinued on Jan 1, 2006.
Exhibit 28 Morgan Stanley US and International Rig Count Forecast
1Q08A 2Q08A 3Q08A 4Q08E 1Q09E 2Q09E 3Q09E 4Q09E 2006A 2007A 2008E 2009E 2010EUnited States 1,770 1,864 1,978 1,879 1,663 1,476 1,369 1,332 1,647 1,767 1,873 1,460 1,449
Change % YoY 2% 6% 11% 5% -6% -21% -31% -29% 19% 7% 6% -22% -1%Canada 507 169 432 410 457 152 389 369 470 344 380 342 350
Change % YoY -5% 21% 24% 15% -10% -10% -10% -10% 3% -27% 10% -10% 2%North America 2,278 2,033 2,410 2,290 2,120 1,628 1,758 1,701 2,117 2,110 2,253 1,802 1,799
Change % YoY 1% 7% 13% 7% -7% -20% -27% -26% 15% 0% 7% -20% 0%Gulf of Mexico 57 65 66 56 57 58 58 60 86 71 61 58 61Europe 91 97 101 101 100 100 100 100 77 78 97 100 104Middle East 272 278 287 293 284 274 265 257 238 265 282 270 269Africa 65 68 64 69 69 68 67 67 58 66 67 68 70Latin America 373 382 386 407 399 391 383 377 324 355 387 388 402Asia/Pacific 245 259 257 257 255 253 250 249 228 241 255 252 263Int'l Land 763 776 797 813 787 762 737 714 656 720 787 750 761Int'l Offshore 284 308 299 315 320 326 328 336 269 286 301 328 347Total Int'l 1,046 1,084 1,096 1,128 1,107 1,087 1,066 1,050 925 1,005 1,088 1,078 1,108
Change % YoY 7% 8% 7% 11% 6% 0% -3% -7% 2% 9% 8% -1% 3% Source: Baker Hughes, Morgan Stanley Research estimates

11
M O R G A N S T A N L E Y R E S E A R C H
January 5, 2009 Oil Services, Drilling & Equipment
Trading and Valuation Summary: Contract Drillers Exhibit 29 Offshore Drillers: Summary of Valuation based on EPS and NAV Projections
Average Asset ValuesWater Average Asset Values 2008e Last RVA/ NAV/ Price/Depth Type Repl. Mkt. Type Repl. Mkt. Company Price Share Share RVA NAV
550' IC $280 $180 2G Semi $300 $200 SDRL-OSL NKr 58 NKr 83 NKr 41 70% 143%450' IC $265 $160 3G Semi $350 $240 RIG $52 $98 $56 53% 94%400' HD/HE IC $280 $170 4G Semi $450 $300 DO $63 $108 $70 58% 90%400' IC $250 $150 5G (7,500-ft) $650 $450 ESV $30 $92 $38 33% 80%400' IS $205 $110 HERO $5 $64 $7 8% 73%375' IC $220 $135 5G (10,000-ft) DP $700 $500 NE $24 $58 $35 41% 69%350' HD/HE IC $240 $140 5G (10,000-ft) HE $800 $600 RDC $17 $48 $25 36% 68%350' IC $200 $130 PDE $18 $56 $34 31% 52%350' IS $180 $100 Drillship (5,000-ft) DP $650 $500 ATW $18 $63 $35 28% 50%328' IC $180 $90 Drillship (10,000-ft) DP $800 $600300' IC $170 $80Tarzan IC $145 $80 (Values in $ mill.) 2009e Last RVA/ NAV/ Price/250' IC $135 $68 Company Price Share Share RVA NAV250' MC $110 $50250' MS $100 $30 SDRL-OSL NKr 58 NKr 92 NKr 37 63% 158%250' IS $95 $30 RIG $52 $111 $69 47% 75%200' IC $115 $55 DO $63 $107 $70 59% 91%200' MC $115 $35 ESV $30 $95 $42 32% 72%200' MS $95 $28 HERO $5 $66 $9 8% 56%150' IC $95 $25 NE $24 $61 $38 39% 63%
RDC $17 $53 $31 32% 57%PDE $18 $53 $35 33% 50%
North Sea Certification: $10-20 MM ATW $18 $65 $37 27% 47%
Source: Company data, Morgan Stanley Research estimates
Exhibit 30 Second-Hand Market Values for Offshore Rigs
2000 2001 2002 2003 2004 2005 2006 2007 2008 2008EOct Oct Oct Oct Oct Oct Oct Oct Oct Dec
Jackups built after 1980150 feet ind cantilever 21 17 10 10 18 28 40 40 40 25200 feet mat cantilever 25 21 19 22 25 38 55 55 55 35250 feet mat slot 21 19 16 16 21 33 45 45 50 30250 feet ind cantilever 35 32 40 30 45 65 100 100 100 68300 feet ind cant international 55 50 60 48 65 85 130 130 135 80300 feet ind cant N Sea 55 55 70 50 65 90 150 150 150 85New 350 feet IC n/a 135 135 125 135 145 210 210 220 175
SemisubmersiblesAker H-3 North Sea 45 40 25 25 25 80 225 225 275 2003rd gen North Sea 90 90 70 60 60 115 250 250 325 2404th generation 200 200 180 170 135 240 300 300 400 3005th gen 8,000 ft + n/a 340 325 290 270 390 450 450 650 450New 6th gen 10,000 ft + n/a n/a n/a n/a n/a n/a 600 675 700 600
DrillshipsConventional mid 1970s 25 30 23 17 17 45 170 200 250 150DP 4000 feet+ (not newbuild) 120 100 70 60 55 125 270 285 300 2505th gen 8,000 ft + n/a 325 325 270 265 390 450 450 650 450New 6th gen 10,000 ft+ n/a n/a n/a n/a n/a n/a 600 675 725 600
Source: ODS-Petrodata, Morgan Stanley Research
Exhibit 31 Price/NAV Range (Since 2001)
0%
50%
100%
150%
200%
250%
300%
DO ESV NE PDE RIG RDC HERO ATW
P/NAV Range and Price Target (line) Current P/NAV (2008E)
Source: FactSet, Morgan Stanley Research
Exhibit 32 HERO P/NAV Trading Range
0%20%40%60%80%
100%120%140%160%180%200%
Jan-06 Jul-06 Jan-07 Jul-07 Jan-08 Jul-08
Standard Deviation Range Average HERO P/NAV
Source: FactSet, Morgan Stanley Research
Exhibit 33 Equal-Weighted P/NAV Trading Range
40%
60%
80%
100%
120%
140%
160%
180%
200%
220%
2001 2002 2003 2004 2005 2006 2007 2008
Standard Deviation Range Average Offshore Drillers P/NAV
Source: FactSet, Morgan Stanley Research, Companies included: DO, ESV, NE, PDE, RDC and RIG.

12
M O R G A N S T A N L E Y R E S E A R C H
January 5, 2009 Oil Services, Drilling & Equipment
Exhibit 34 Global Valuation Summary
Reuters MS Recent Price Mkt Cap Earnings per Share P/E EV/EBITDA RNOA Net Debt/Market CapitalizationCompany Symbol Rating Price Target ($MM) 07A 08E 09E 10E 08E 09E 10E 08E 09E 10E 08E 09E 10E 08E 09E 10E
Oil Services:Schlumberger SLB.N O $45.62 $88 $54,569 $4.18 $4.48 $3.65 $4.09 10.2 12.5 11.2 5.6 6.3 5.6 27.5% 19.6% 20.8% 2.9% 0.4% -0.6%Halliburton HAL.N O $19.45 $36 $17,384 $2.47 $2.75 $2.00 $2.20 7.1 9.7 8.8 4.0 5.0 4.7 18.2% 10.9% 12.0% 14.7% 5.0% 7.9%Weatherford WFT.N O $11.66 $29 $8,019 $1.67 $1.93 $1.35 $1.65 6.0 8.7 7.1 4.7 5.1 4.6 12.2% 7.8% 9.0% 64.9% 54.0% 49.2%Baker Hughes BHI.N O $34.33 $53 $10,558 $4.75 $5.03 $3.58 $3.90 6.8 9.6 8.8 3.3 4.3 4.0 22.9% 14.9% 15.1% 0.7% -2.4% -2.8%Smith International SII.N O $25.03 $51 $5,478 $3.17 $3.82 $3.15 $3.61 6.6 7.9 6.9 4.5 4.4 4.0 25.8% 11.9% 13.6% 44.5% 23.1% 14.8%BJ Services BJS.N E-W $12.43 $21 $3,630 $2.55 $2.07 $1.26 $1.58 6.0 9.9 7.9 5.2 4.7 3.9 18.0% 10.3% 12.1% 11.2% 7.5% 2.3%
Average 7.1 9.7 8.4 4.5 5.0 4.5 20.8% 12.6% 13.8% 23.2% 14.6% 11.8%
Offshore Drillers:Transocean RIG.N O $52.01 $117 $16,600 $8.52 $14.45 $14.25 $14.10 3.6 3.7 3.7 4.0 3.7 3.1 17.3% 16.2% 14.9% 79.0% 60.5% 36.6%Diamond Offshore DO.N O $63.12 $126 $8,774 $6.56 $9.60 $9.75 $10.50 6.6 6.5 6.0 3.7 3.8 3.5 44.9% 40.3% 40.8% 1.7% 1.7% 1.8%Noble Corporation NE.N E-W $23.75 $45 $6,265 $4.60 $5.70 $5.80 $5.40 4.2 4.1 4.4 2.9 2.7 2.4 30.1% 25.7% 21.5% 9.1% 1.6% -8.2%Seadrill Limited SDRL.OL E-W NKr 58 NKr 65 $3,378 $0.31 $1.19 $2.55 $3.00 7.1 3.3 2.8 16.8 6.4 4.9 3.9% 9.1% 10.8% 277.5% 239.6% 190.6%ENSCO International ESV.N U $30.33 $51 $4,301 $6.68 $8.11 $6.50 $6.20 3.7 4.7 4.9 2.1 2.4 2.1 29.0% 19.4% 16.2% -12.9% -20.3% -25.9%Pride International PDE.N U $17.58 $24 $3,043 $2.61 $3.54 $2.85 $2.70 5.0 6.2 6.5 3.0 3.8 4.0 13.6% 8.9% 7.6% 7.9% 10.7% 16.4%Rowan Companies RDC.N E-W $17.25 $27 $1,949 $4.14 $3.82 $3.50 $3.20 4.5 4.9 5.4 2.6 3.0 2.9 16.8% 12.7% 10.0% 14.6% 18.8% 8.5%Hercules Offshore HERO.O O $5.04 $11 $443 $2.35 $0.78 $0.00 $0.65 6.5 NM 7.8 3.9 4.1 2.9 4.0% 1.5% 3.5% 236.3% 196.8% 175.6%Atwood Oceanics ATW.N E-W $17.52 $36 $1,122 $2.16 $3.34 $3.85 $4.60 5.2 4.6 3.8 8.6 4.5 3.8 41.3% 29.9% 22.3% 4.4% 31.9% 33.1%
Average 5.2 4.7 5.0 5.3 3.8 3.3 22.3% 18.2% 16.4% 68.2% 59.8% 47.2%
Land Drillers:Nabors Industries NBR.N O $13.27 $27 $3,776 $2.96 $3.11 $2.00 $1.70 4.3 6.6 7.8 3.7 4.3 4.5 13.4% 8.2% 6.9% 80.5% 69.0% 63.2%Patterson-UTI PTEN.O E-W $12.58 $17 $1,945 $2.55 $2.31 $0.50 $0.40 5.4 25.1 31.4 2.1 4.9 5.1 10.8% 2.2% 1.8% -4.0% 0.9% 3.4%
Average 4.9 15.8 19.6 2.9 4.6 4.8 12.1% 5.2% 4.3% 38.3% 35.0% 33.3%
Equipment:Tenaris S.A. TS.N O $22.02 $40 $12,998 $3.16 $3.73 $3.20 $3.20 5.9 6.9 6.9 3.6 3.3 2.9 22.6% 17.4% 19.6% 15.0% -13.0% -28.2%National Oilwell Varco NOV.N O $26.83 $44 $11,197 $3.74 $4.90 $3.50 $3.15 5.5 7.7 8.5 2.8 3.0 2.7 30.1% 11.2% 10.6% -7.6% -28.6% -40.4%Vallourec VLLP.PA E-W € 86.32 € 115 $6,470 € 18.71 € 18.04 € 16.12 € 14.74 4.8 5.4 5.9 2.9 3.0 3.1 42.3% 24.2% 21.7% 9.6% 1.4% -7.5%Cameron International CAM.N E-W $22.07 $36 $4,845 $2.10 $2.61 $2.36 $2.52 8.5 9.4 8.7 4.7 4.6 3.9 27.9% 24.0% 26.0% 0.7% 0.5% 3.7%FMC Technologies FTI.N U $25.32 $44 $3,166 $2.29 $2.89 $2.80 $2.90 8.8 9.0 8.7 5.2 5.6 5.2 34.0% 30.5% 26.8% 7.8% 9.6% 13.1%Oceaneering International OII.N O $30.34 $48 $1,653 $3.29 $3.48 $3.06 $3.48 8.7 9.9 8.7 4.6 4.8 4.1 17.7% 12.8% 14.3% 20.1% 10.1% 5.9%Dresser-Rand DRC.N E-W $18.77 $33 $1,538 $1.57 $2.23 $2.38 $2.15 8.4 7.9 8.7 4.7 4.1 3.8 19.4% 20.5% 19.0% 14.6% 0.5% -13.3%Dril Quip DRQ.N O $22.03 $40 $860 $2.52 $2.53 $2.41 $2.55 8.7 9.2 8.7 4.6 4.5 4.1 23.4% 17.6% 18.7% -10.8% -24.6% -30.5%Chart Industries GTLS.O U $11.02 $19 $313 $1.78 $2.64 $2.20 $1.70 4.2 5.0 6.5 2.8 2.2 2.2 17.5% 14.7% 13.4% 28.7% -6.4% -18.5%
Average 7.0 7.8 7.9 4.0 3.9 3.5 26.1% 19.2% 18.9% 8.7% -5.9% -12.9%
Engineering & Construction:Helix Energy Solutions HLX.N NA $7.86 NA $722 $2.90 $2.08 $2.24 $3.05 3.8 3.5 2.6 3.4 2.9 2.2 8.3% 8.2% 10.0% 244.3% 220.0% 166.9%Saipem SPMI.MI O € 12.19 € 23 $7,495 € 1.31 € 1.58 € 1.66 € 2.02 7.7 7.4 6.0 5.5 5.5 4.4 18.2% 13.7% 13.2% 46.6% 67.1% 64.1%Technip TECF.PA E-W € 23.74 € 34 $3,613 € 1.03 € 3.98 € 3.38 € 3.49 6.0 7.0 6.8 3.0 3.4 3.0 17.9% 14.0% 12.9% 4.2% 1.1% 9.4%SBM Offshore SBMO.AS E-W € 10.00 € 15 $2,028 $1.83 $1.47 $1.97 $1.79 9.5 7.1 7.8 5.4 4.2 4.7 11.5% 13.0% 12.2% 50.6% 41.8% 64.1%Acergy ACY.OL E-W NKr 42 NKr 65 $1,176 $0.63 $1.43 $1.11 $1.08 4.2 5.5 5.6 2.2 1.9 1.8 44.0% 23.4% 22.0% 1.2% 15.6% 25.0%Wood Group WG.L O £2.00 £3.40 $1,527 $0.37 $0.51 $0.46 $0.49 5.6 6.4 5.8 3.4 3.4 2.9 22.2% 16.5% 17.6% 17.6% 3.5% 5.0%Subsea 7 SUB.OL O NKr 43 NKr 85 $921 $1.39 $1.83 $1.61 $1.44 3.4 3.9 4.4 2.5 2.6 2.6 29.4% 18.3% 14.5% 48.4% 38.3% 27.7%Sevan Marine SEVAN.OL O NKr 8 NKr 39 $238 ($0.57) ($0.35) $0.05 $0.31 NM NM 4.0 NM 16.0 10.8 4.0% 4.1% 5.2% 474.5% 791.4% 986.6%
Average (excludes Sevan Marine) 5.7 5.8 5.6 3.6 3.4 3.1 21.7% 15.3% 14.6% 57.4% 50.6% 40.5%
Reservoir Information / Seismic:ION Geophysical IO.N U $3.78 NA $376 $0.52 $0.66 ($0.48) ($0.00) 5.8 NM NM 2.8 12.2 7.5 11.3% -3.8% 1.0% 63.2% 50.0% 63.9%CGG Veritas GEPH.PA U € 11.59 € 13 $2,431 € 2.49 € 3.50 € 2.60 € 2.32 3.3 4.5 5.0 2.1 2.7 2.7 11.0% 7.9% 7.0% 51.1% 31.0% 19.6%Petroleum Geo-Services PGS.OL U NKr 30 NKr 40 $776 $1.81 $2.43 $1.85 $1.34 1.8 2.3 3.2 2.0 2.2 2.1 23.6% 13.2% 8.3% 150.5% 133.7% 96.7%
Average 3.6 3.4 4.1 2.3 5.7 4.1 15.3% 5.8% 5.4% 88.3% 71.6% 60.0% Source: FactSet, Company data, Morgan Stanley Research; e = Morgan Stanley Research estimates

13
M O R G A N S T A N L E Y R E S E A R C H
January 5, 2009 Oil Services, Drilling & Equipment
Price Target and Valuation Summary: Oil Services & DrillersExhibit 35 Service/Equipment: Price Target Summary
MS Last 2010 2010 Target TargetSymbol Rating Price EPS P/E P/E Price UpsideWFT O $11.7 $1.65 7.1x 17.6x $29 149%SII O $25.0 $3.61 6.9x 14.1x $51 104%SLB O $45.6 $4.09 11.2x 21.5x $88 93%HAL O $19.5 $2.20 8.8x 16.3x $36 85%TS O $22.0 $3.20 6.9x 12.5x $40 82%DRQ O $22.0 $2.55 8.7x 15.7x $40 82%DRC E-W $18.8 $2.15 8.7x 15.3x $33 76%FTI U $25.3 $2.90 8.7x 15.2x $44 74%GTLS U $11.0 $1.70 6.5x 11.2x $19 72%BJS E-W $12.4 $1.58 7.9x 13.3x $21 69%NOV O $26.8 $3.15 8.5x 14.0x $44 64%CAM E-W $22.1 $2.52 8.7x 14.3x $36 63%OII O $30.3 $3.48 8.7x 13.8x $48 58%BHI O $34.3 $3.90 8.8x 13.6x $53 54%
Source: FactSet; Company data, Morgan Stanley Research
Exhibit 36 Contract Drillers: Price Target Summary
MS Last 2010 2010 Target TargetSymbol Rating Price EPS P/E P/E Price UpsideRIG O $52.0 $14.10 3.7x 8.3x $117 125%HERO O $5.0 $0.65 7.8x 17.0x $11 118%ATW E-W $17.5 $4.60 3.8x 7.8x $36 105%NBR O $13.3 $1.70 7.8x 15.9x $27 103%DO O $63.1 $10.50 6.0x 12.0x $126 100%NE E-W $23.8 $5.40 4.4x 8.3x $45 89%ESV U $30.3 $6.20 4.9x 8.2x $51 68%RDC E-W $17.3 $3.20 5.4x 8.4x $27 57%PDE U $17.6 $2.70 6.5x 8.9x $24 37%PTEN E-W $12.6 $0.40 31.4x 42.4x $17 35%
Source: FactSet; Company data, Morgan Stanley Research
Exhibit 37 Land Drillers: EV/Rig (Current)
$0 $2 $4 $6 $8 $10
PDC
GW
PTEN
BRNC
Source: FactSet; Morgan Stanley Research
Exhibit 38 PTEN: Historic EV/Rig ($m/rig, monthly)
$0m
$2m
$4m
$6m
$8m
$10m
$12m
$14m
$16m
$18m
1997 1998 1999 2000 2001 2002 2003 2004 2005 2006 2007 2008 2009
Standard Deviation Range Average PTEN EV/Rig
Source: Company reports, FactSet, Morgan Stanley Research
Exhibit 39 Oil Services and Equipment: Price/Book
0.0x
1.0x
2.0x
3.0x
4.0x
5.0x
6.0x
7.0x
1997 1998 1999 2000 2001 2002 2003 2004 2005 2006 2007 2008 2009
Standard Deviation Range Average P/B
Source: FactSet, Morgan Stanley Research. Includes Services, Equipment and Land Drillers
Exhibit 40 Oil Services and Equipment: Price/Sales
0.0x
0.5x
1.0x
1.5x
2.0x
2.5x
3.0x
3.5x
4.0x
1997 1998 1999 2000 2001 2002 2003 2004 2005 2006 2007 2008 2009
Standard Deviation Range Average P/S
Source: FactSet, Morgan Stanley Research. Includes Services, Equipment and Land Drillers

14
M O R G A N S T A N L E Y R E S E A R C H
January 5, 2009 Oil Services, Drilling & Equipment
Consensus Earnings Revisions and Short Interest Ratios Exhibit 41 2009 Consensus EPS Revisions (Past 4-Weeks)
HEROIO
PTENSLB
WFTHALNBRHLX
TSBJS
FTIBHI
CAMNOVRDCPDE
SIIDRQESV
RIGDRC
NEDO
GTLS
-45% -40% -35% -30% -25% -20% -15% -10% -5% 0% 5%
Source: FactSet; Morgan Stanley Research
Exhibit 42 Short Interest Ratio
TSSLB
DRCNOV
FTIATW
BHIOII
WFTIONE
CAMPDESIIGTLSHALDO
BJSRIG
DRQNBR
ESVRDCHLX
PTENHERO
0% 2% 4% 6% 8% 10% 12% 14%
Source: FactSet; Morgan Stanley Research
Exhibit 43 2009 Consensus EPS Revisions (Past 3-Months)
HEROPTEN
IOHLX
NBRSLBWFT
BJSGTLS
HALBHI
SIITS
PDERDCNOVCAM
FTIDRQ
DRCESV
DORIG
NE
-70% -60% -50% -40% -30% -20% -10% 0% 10% Source: FactSet; Morgan Stanley Research
Exhibit 44 2010 Consensus EPS Revisions (Past 3-Months)
HEROPTEN
SLBGTLS
NBRBJSWFT
SIIBHIHALNOVHLX
IODRC
FTICAM
TSRDC
DRQESV
PDERIG
NEDO
-70% -60% -50% -40% -30% -20% -10% 0% Source: FactSet; Morgan Stanley Research

15
M O R G A N S T A N L E Y R E S E A R C H
January 5, 2009 Oil Services, Drilling & Equipment
Exhibit 45 Morgan Stanley EPS Estimates versus FactSet Consensus ReutersSymbol Mar-08 Jun-08 Sep-08 Dec-08 Mar-09 Jun-09 Sep-09 Dec-09 2007A 2008E 2009E 2010E 08 vs 07 09 vs 08 10 vs 09
SLB.N 1.05 1.16 1.25 1.02 0.97 0.93 0.90 0.85 4.18 4.48 3.65 4.09 7% -19% 12%Consensus 1.05 1.16 1.25 1.14 1.07 1.02 1.03 1.07 4.18 4.75 4.15 3.64 14% -13% -12%
HAL.N 0.63 0.69 0.76 0.68 0.50 0.50 0.52 0.47 2.47 2.75 2.00 2.20 11% -27% 10%Consensus 0.63 0.69 0.76 0.76 0.67 0.66 0.66 0.72 2.47 2.82 2.63 2.73 14% -7% 4%
BHI.N 1.21 1.36 1.29 1.16 1.07 0.85 0.85 0.81 4.75 5.03 3.58 3.90 6% -29% 9%Consensus 1.21 1.36 1.29 1.36 1.23 1.16 1.18 1.21 4.75 5.29 4.85 4.76 11% -8% -2%
WFT.N 0.50 0.43 0.55 0.45 0.38 0.29 0.33 0.35 1.67 1.93 1.35 1.65 16% -30% 22%Consensus 0.50 0.43 0.55 0.55 0.51 0.44 0.51 0.58 1.67 2.04 2.02 1.98 23% -1% -2%
BJS.N 0.43 0.48 0.58 0.41 0.31 0.24 0.30 0.34 2.55 2.07 1.26 1.58 -19% -39% 25%Consensus 0.43 0.48 0.58 0.57 0.49 0.41 0.33 0.40 2.55 2.06 1.74 1.58 -19% -16% -9%
SII.N 0.87 0.91 1.01 1.03 0.87 0.75 0.77 0.77 3.17 3.82 3.15 3.61 21% -18% 14%Consensus 0.87 0.91 1.01 1.07 0.95 0.88 0.88 0.94 3.17 3.84 3.68 3.78 21% -4% 2%
IO.N 0.08 0.16 0.25 0.17 -0.15 -0.13 -0.13 -0.07 0.52 0.66 -0.48 0.00 26% -173% NMConsensus 0.08 0.16 0.25 0.21 0.01 0.04 0.13 0.19 0.52 0.72 0.53 0.88 37% -25% 64%
TS.N 0.77 0.96 0.97 1.03 0.91 0.81 0.69 0.79 3.16 3.73 3.20 3.20 18% -14% 0%Consensus 0.77 0.96 0.97 1.03 0.95 0.91 0.72 0.74 3.16 3.95 3.41 3.46 25% -14% 1%
NOV.N 1.11 1.20 1.35 1.22 1.01 0.86 0.83 0.80 3.74 4.90 3.50 3.15 31% -29% -10%Consensus 1.11 1.20 1.35 1.35 1.27 1.21 1.19 1.21 3.74 4.98 4.97 4.47 33% 0% -10%
CAM.N 0.55 0.65 0.73 0.68 0.61 0.55 0.64 0.55 2.10 2.61 2.36 2.52 24% -10% 7%Consensus 0.55 0.65 0.73 0.75 0.67 0.69 0.71 0.75 2.10 2.67 2.77 2.75 27% 3% -1%
FTI.N 0.70 0.80 0.67 0.72 0.67 0.69 0.70 0.74 2.29 2.89 2.80 2.90 26% -3% 4%Consensus 0.70 0.80 0.67 0.70 0.69 0.73 0.73 0.79 2.29 2.73 2.83 2.81 19% 3% -1%
OII.N 0.74 0.91 0.99 0.85 0.63 0.82 0.84 0.77 3.29 3.48 3.06 3.48 6% -12% 14%Consensus 0.74 0.91 0.99 0.95 0.79 0.97 1.03 1.02 3.29 3.58 3.86 4.24 9% 8% 10%
DRC.N 0.26 0.55 0.57 0.87 0.28 0.54 0.64 0.91 1.57 2.23 2.38 2.15 42% 6% -10%Consensus 0.26 0.55 0.57 0.81 0.42 0.58 0.65 0.84 1.57 2.18 2.45 2.28 39% 13% -7%
DRQ.N 0.62 0.68 0.69 0.55 0.56 0.59 0.66 0.59 2.52 2.53 2.41 2.55 1% -5% 6%Consensus 0.62 0.68 0.69 0.68 0.69 0.71 0.71 0.72 2.52 2.65 2.95 3.13 5% 11% 6%
GTLS.O 0.51 0.73 0.76 0.65 0.56 0.54 0.64 0.45 1.78 2.64 2.20 1.70 48% -17% -23%Consensus 0.51 0.73 0.76 0.64 0.56 0.58 0.66 0.61 1.78 2.62 2.34 2.08 47% -11% -11%
RIG.N 3.80 3.46 3.45 3.74 3.56 3.54 3.62 3.53 8.52 14.45 14.25 14.10 70% -1% -1%Consensus 3.80 3.46 3.45 3.73 3.85 3.69 3.94 4.12 8.52 14.23 15.43 16.65 67% 8% 8%
NE.N 1.45 1.30 1.47 1.48 1.33 1.49 1.50 1.49 4.60 5.70 5.80 5.40 24% 2% -7%Consensus 1.45 1.30 1.47 1.51 1.58 1.75 1.81 1.87 4.60 5.69 7.07 7.26 24% 24% 3%
DO.N 2.09 2.93 2.39 2.18 2.12 2.61 2.44 2.58 6.56 9.60 9.75 10.50 46% 2% 8%Consensus 2.09 2.93 2.39 2.46 2.75 3.00 2.71 3.19 6.56 9.76 11.46 12.89 49% 17% 13%
ESV.N 1.91 2.07 2.13 2.00 1.62 1.79 1.55 1.53 6.68 8.11 6.50 6.20 21% -20% -5%Consensus 1.91 2.07 2.13 2.08 1.99 2.08 2.12 2.15 6.68 8.16 8.27 8.10 22% 1% -2%
PDE.N 0.70 0.80 1.03 1.02 0.84 0.71 0.77 0.53 2.61 3.54 2.85 2.70 36% -20% NMConsensus 0.70 0.80 1.03 1.07 0.92 0.84 0.87 0.78 2.61 3.65 3.38 3.60 40% -7% 7%
HERO.O 0.05 0.22 0.37 0.13 0.07 0.02 -0.04 -0.05 2.35 0.78 0.00 0.65 -67% -100% NMConsensus 0.05 0.22 0.37 0.28 0.17 0.23 0.19 0.21 2.35 0.95 0.98 1.06 -59% 3% 9%
RDC.N 0.84 1.05 0.88 1.04 0.82 0.94 0.83 0.90 4.14 3.82 3.50 3.20 -8% -8% -9%Consensus 0.84 1.05 0.88 1.12 1.05 1.07 1.11 1.15 4.14 3.90 4.27 4.04 -6% 10% -6%
ATW.N 0.65 0.93 1.16 1.14 0.82 0.77 1.12 1.18 2.16 3.34 3.85 4.60 55% 15% 19%Consensus 0.65 0.93 1.16 1.20 0.93 1.09 1.20 1.35 2.16 3.34 4.48 5.10 55% 34% 14%
NBR.N 0.81 0.72 0.76 0.82 0.72 0.44 0.44 0.40 2.96 3.11 2.00 1.70 5% -36% -15%Consensus 0.81 0.72 0.76 0.85 0.74 0.56 0.55 0.58 2.96 3.10 2.50 2.49 5% -19% -1%
PTEN.O 0.50 0.51 0.70 0.60 0.34 0.15 0.04 -0.02 2.55 2.31 0.50 0.40 -10% -78% -20%Consensus 0.50 0.51 0.70 0.62 0.40 0.26 0.21 0.22 2.55 2.32 1.21 1.09 -9% -48% -10%
HLX.N 0.37 0.86 0.65 0.20 0.34 0.54 0.71 0.65 2.90 2.08 2.24 3.05 -28% 7% 36%Consensus 0.37 0.86 0.65 0.43 0.54 0.66 0.74 0.69 2.90 2.82 2.65 3.16 -3% -6% 19%
Source: FactSet; Company data, Morgan Stanley Research; e = Morgan Stanley Research estimates

16
M O R G A N S T A N L E Y R E S E A R C H
January 5, 2009 Oil Services, Drilling & Equipment
Exhibit 46 Morgan Stanley Revenue Growth Projections by Area for Top Five Service Names
REVENUE BY REGION 2008 2009 2010 GROWTH IN REVENUESLB 2004 2005 2006 2007 2008E 2009E 2010E 2003 2004 2005 2006 2007 2008E 2009E 2010ENorth America 3,107.0 3,760.3 5,273.4 5,345.0 5,797.5 4,172.6 4,414.1 15.2% 20.8% 21.0% 40.2% 1.4% 8.5% -28.0% 5.8%Latin America 1,746.0 2,209.1 2,563.4 3,295.1 4,320.5 4,243.5 4,588.7 8.9% 23.1% 26.5% 16.0% 28.5% 31.1% -1.8% 8.1%Europe/CIS/Africa 2,788.0 3,533.3 5,054.0 6,590.1 8,329.1 7,844.2 8,464.2 4.4% 11.9% 26.7% 43.0% 30.4% 26.4% -5.8% 7.9%Middle East/Asia 2,477.0 3,032.6 3,723.8 4,880.8 5,752.3 5,669.3 5,750.7 9.3% 20.6% 22.4% 22.8% 31.1% 17.9% -1.4% 1.4%OFS 10,240.0 12,648.2 16,762.6 20,306.3 24,414.5 22,149.3 23,437.3 9.2% 19.1% 23.5% 32.5% 21.1% 20.2% -9.3% 5.8%WesternGeco 1,239.0 1,661.8 2,475.8 2,962.9 2,799.4 2,542.0 2,788.1 -19.8% 4.7% 34.1% 49.0% 19.7% -5.5% -9.2% 9.7%SLB 11,479.0 14,310.0 19,238.4 23,269.2 27,213.9 24,691.3 26,225.4 4.6% 17.4% 24.7% 34.4% 21.0% 17.0% -9.3% 6.2%Consensus 19,238.4 23,269.2 27,302.6 26,740.8 26,264.2 4.6% 17.4% 24.7% 34.4% 21.0% 17.3% -2.1% -1.8%
HAL 2004 2005 2006 2007 2008E 2009E 2010E 2003 2004 2005 2006 2007 2008E 2009E 2010ENorth America 3,609.0 4,819.0 6,458.0 7,133.0 7,907.0 5,362.0 5,684.1 1.8% 17.0% 33.5% 34.0% 10.5% 10.9% -32.2% 6.0%Latin America 1,082.0 1,344.0 1,514.0 1,798.0 2,444.3 2,435.9 2,523.2 7.2% 19.3% 24.2% 12.6% 18.8% 35.9% -0.3% 3.6%Europe/CIS/Africa 1,924.0 2,274.0 2,860.0 3,700.0 4,354.5 4,121.8 4,244.4 7.0% 14.0% 18.2% 25.8% 29.4% 17.7% -5.3% 3.0%Middle East/Asia 1,383.0 1,663.0 2,123.0 2,633.0 3,140.1 3,041.5 3,090.9 -4.8% 5.2% 20.2% 27.7% 24.0% 19.3% -3.1% 1.6%Total 7,998.0 10,100.0 12,955.0 15,264.0 17,846.0 14,961.3 15,542.6 2.3% 14.3% 26.3% 28.3% 17.8% 16.9% -16.2% 3.9%Consensus 12,955.0 15,264.0 18,158.6 18,155.9 18,270.8 2.3% 14.3% 26.3% 28.3% 17.8% 19.0% 0.0% 0.6%
BHI 2004 2005 2006 2007 2008E 2009E 2010E 2003 2004 2005 2006 2007 2008E 2009E 2010ENorth America 2,539.9 3,141.2 4,076.2 4,440.4 4,969.3 3,770.3 4,067.3 14.1% 14.4% 23.7% 29.8% 8.9% 11.9% -24.1% 7.9%Latin America 622.9 638.2 751.0 903.3 1,071.3 1,048.6 1,097.5 1.4% 20.1% 2.5% 17.7% 20.3% 18.6% -2.1% 4.7%Europe/CIS/Africa 1,765.5 2,006.6 2,489.6 3,076.3 3,437.7 3,324.9 3,397.0 0.9% 14.7% 13.7% 24.1% 23.6% 11.7% -3.3% 2.2%Middle East/Asia 1,172.1 1,398.2 1,710.6 2,008.2 2,126.3 2,086.2 2,112.3 11.1% 20.4% 19.3% 22.3% 17.4% 5.9% -1.9% 1.3%Total 6,100.4 7,184.2 9,027.4 10,428.2 11,604.7 10,230.0 10,674.0 8.1% 16.1% 17.8% 25.7% 15.5% 11.3% -11.8% 4.3%Consensus 9,027.4 10,428.2 11,724.2 11,591.0 11,933.3 8.1% 16.1% 17.8% 25.7% 15.5% 12.4% -1.1% 3.0%
WFT 2004 2005 2006 2007 2008E 2009E 2010E 2003 2004 2005 2006 2007 2008E 2009E 2010ENorth America 1,887.6 2,400.7 3,672.6 3,937.5 4,347.0 3,129.0 3,475.9 11.3% 4.1% 27.2% 53.0% 7.2% 10.4% -28.0% 11.1%Latin America 283.1 424.0 726.2 882.3 1,169.0 1,858.2 2,011.3 11.3% 118.5% 49.7% 71.3% 21.5% 32.5% 59.0% 8.2%Europe/CIS/Africa 409.0 617.6 827.3 1,188.5 1,594.7 1,548.2 1,677.4 11.3% 5.2% 51.0% 34.0% 43.7% 34.2% -2.9% 8.3%Middle East/Asia 566.3 891.0 1,352.8 1,823.8 2,360.4 2,325.6 2,521.4 11.3% 118.5% 57.3% 51.8% 34.8% 29.4% -1.5% 8.4%Total 3,145.9 4,333.2 6,578.9 7,832.1 9,471.1 8,860.9 9,686.0 11.3% 21.4% 37.7% 51.8% 19.0% 20.9% -6.4% 9.3%Consensus 6,578.9 7,832.1 9,593.8 10,321.9 11,213.6 11.3% 21.4% 37.7% 51.8% 19.0% 22.5% 7.6% 8.6%
SII 2004 2005 2006 2007 2008E 2009E 2010E 2003 2004 2005 2006 2007 2008E 2009E 2010ENorth America 2,470.0 3,234.3 4,276.0 4,739.2 5,819.6 6,069.8 6,561.1 9.9% 26.3% 30.9% 32.2% 10.8% 22.8% 4.3% 8.1%Latin America 424.1 452.3 543.8 738.0 997.1 945.4 984.7 12.7% 23.2% 6.7% 20.2% 35.7% 35.1% -5.2% 4.2%Europe/CIS/Africa 961.8 1,188.0 1,605.6 2,105.7 2,656.8 2,556.9 2,702.3 25.5% 12.4% 23.5% 35.1% 31.2% 26.2% -3.8% 5.7%Middle East/Asia 563.2 704.3 908.1 1,181.3 1,254.6 1,171.0 1,202.3 9.0% 28.1% 25.1% 28.9% 30.1% 6.2% -6.7% 2.7%Total 4,419.0 5,579.0 7,333.6 8,764.3 10,728.0 10,743.1 11,450.4 13.4% 22.9% 26.2% 31.4% 19.5% 22.4% 0.1% 6.6%Consensus 7,333.6 8,764.3 10,786.5 11,547.6 11,874.6 13.4% 22.9% 26.2% 31.4% 19.5% 23.1% 7.1% 2.8%
TOP FIVE 2004 2005 2006 2007 2008E 2009E 2010E 2003 2004 2005 2006 2007 2008E 2009E 2010ENorth America 13,613.5 17,355.5 23,756.2 25,595.1 28,840.4 22,503.8 24,202.5 9.7% 16.9% 27.5% 36.9% 7.7% 12.7% -22.0% 7.5%Latin America 4,158.1 5,067.6 6,098.4 7,616.7 10,002.2 10,531.7 11,205.3 7.7% 25.3% 21.9% 20.3% 24.9% 31.3% 5.3% 6.4%Europe/CIS/Africa 7,848.2 9,619.5 12,836.5 16,660.7 20,372.8 19,396.0 20,485.4 6.8% 12.7% 22.6% 33.4% 29.8% 22.3% -4.8% 5.6%Middle East/Asia 6,161.6 7,689.1 9,818.3 12,527.1 14,633.8 14,293.6 14,677.5 5.6% 22.2% 24.8% 27.7% 27.6% 16.8% -2.3% 2.7%Total 33,142.4 41,506.4 55,133.3 65,557.8 76,863.7 69,486.6 73,578.4 6.3% 17.5% 25.2% 32.8% 18.9% 17.2% -9.6% 5.9%Consensus 33,142.4 41,506.4 55,133.3 65,557.8 77,565.6 78,357.1 79,556.5 6.3% 17.5% 25.2% 32.8% 18.9% 18.3% 1.0% 1.5%
TOP FIVE 2004 2005 2006 2007 2008E 2009E 2010E 2003 2004 2005 2006 2007 2008E 2009E 2010EInternational 18,167.9 22,376.3 28,753.2 36,804.5 45,008.8 44,221.2 46,368.3 6.6% 18.6% 23.2% 28.5% 28.0% 22.3% -1.7% 4.9%
SLB 7,011.0 8,775.0 11,341.2 14,766.0 18,401.9 17,757.1 18,803.6 7.1% 17.6% 25.2% 29.2% 30.2% 24.6% -3.5% 5.9%HAL 4,389.0 5,281.0 6,497.0 8,131.0 9,939.0 9,599.2 9,858.5 2.8% 12.3% 20.3% 23.0% 25.2% 22.2% -3.4% 2.7%BHI 3,560.5 4,043.0 4,951.2 5,987.8 6,635.4 6,459.7 6,606.8 4.1% 17.4% 13.6% 22.5% 20.9% 10.8% -2.6% 2.3%WFT 1,258.4 1,932.5 2,906.3 3,894.6 5,124.1 5,732.0 6,210.1 11.3% 61.9% 53.6% 50.4% 34.0% 31.6% 11.9% 8.3%SII 1,949.0 2,344.7 3,057.5 4,025.1 4,908.5 4,673.2 4,889.3 17.9% 18.9% 20.3% 30.4% 31.6% 21.9% -4.8% 4.6%
TOP FIVE 2004 2005 2006 2007 2008E 2009E 2010E 2003 2004 2005 2006 2007 2008E 2009E 2010ENorth America 13,613.5 17,355.5 23,756.2 25,595.1 28,840.4 22,503.8 24,202.5 9.7% 16.9% 27.5% 36.9% 7.7% 12.7% -22.0% 7.5%
SLB 3,107.0 3,760.3 5,273.4 5,345.0 5,797.5 4,172.6 4,414.1 15.2% 20.8% 21.0% 40.2% 1.4% 8.5% -28.0% 5.8%HAL 3,609.0 4,819.0 6,458.0 7,133.0 7,907.0 5,362.0 5,684.1 1.8% 17.0% 33.5% 34.0% 10.5% 10.9% -32.2% 6.0%BHI 2,539.9 3,141.2 4,076.2 4,440.4 4,969.3 3,770.3 4,067.3 14.1% 14.4% 23.7% 29.8% 8.9% 11.9% -24.1% 7.9%WFT 1,887.6 2,400.7 3,672.6 3,937.5 4,347.0 3,129.0 3,475.9 11.3% 4.1% 27.2% 53.0% 7.2% 10.4% -28.0% 11.1%SII 2,470.0 3,234.3 4,276.0 4,739.2 5,819.6 6,069.8 6,561.1 9.9% 26.3% 30.9% 32.2% 10.8% 22.8% 4.3% 8.1%
Source: FactSet, Morgan Stanley Research e = Morgan Stanley Research estimates

17
M O R G A N S T A N L E Y R E S E A R C H
January 5, 2009 Oil Services, Drilling & Equipment
Exhibit 47 Morgan Stanley EBIT Margins Projections by Area for Top Five Service Names
EBIT MARGINS BY REGION 2008 2009 2010 CHANGE IN EBIT MARGINSSLB 2004 2005 2006 2007 2008 2009 2010 2006 2007 2008E 2009E 2010ENorth America 16.7% 24.8% 30.4% 28.7% 22.4% 19.3% 20.5% 560bps -167bps -634bps -307bps 121bpsLatin America 12.7% 14.9% 19.3% 22.9% 20.6% 20.4% 21.7% 439bps 357bps -228bps -18bps 130bpsEurope/CIS/Africa 16.0% 19.9% 25.5% 28.5% 27.9% 25.7% 25.8% 562bps 299bps -62bps -221bps 13bpsMiddle East/Asia 26.2% 28.7% 32.1% 35.1% 34.9% 32.4% 33.5% 339bps 299bps -19bps -247bps 110bpsOFS 17.6% 22.2% 27.7% 29.3% 26.8% 25.2% 25.9% 552bps 164bps -257bps -156bps 73bpsWesternGeco 10.1% 19.0% 32.8% 35.8% 30.1% 17.6% 21.8% 1377bps 300bps -568bps -1255bps 424bpsTotal 14.7% 20.2% 26.6% 28.8% 26.1% 23.4% 24.5% 634bps 225bps -271bps -270bps 103bpsConsensus 26.0% 28.4% 26.2% 23.6% 22.8% 240bps -221bps -260bps -79bps
HAL 2004 2005 2006 2007 2008 2009 2010 2006 2007 2008E 2009E 2010ENorth America 19.0% 26.8% 32.1% 27.8% 24.4% 17.9% 18.5% 526bps -431bps -338bps -648bps 60bpsLatin America 11.4% 15.0% 19.8% 19.4% 20.8% 19.2% 19.3% 486bps -40bps 136bps -155bps 10bpsEurope/CIS/Africa 10.8% 17.8% 18.8% 20.1% 18.5% 17.5% 18.6% 108bps 126bps -161bps -105bps 119bpsMiddle East/Asia 14.2% 20.2% 24.0% 25.4% 24.9% 23.8% 24.8% 382bps 139bps -46bps -110bps 93bpsTotal 15.2% 22.1% 26.4% 24.5% 22.6% 19.2% 19.9% 429bps -188bps -196bps -335bps 72bpsConsensus 26.4% 23.0% 21.4% 19.0% 19.7% -338bps -162bps -236bps 70bps
BHI 2004 2005 2006 2007 2008 2009 2010 2006 2007 2008E 2009E 2010ENorth America 21.6% 26.7% 26.5% 24.6% 17.3% 17.8% 506bps -15bps -187bps -737bps 50bpsLatin America 21.0% 20.3% 19.4% 17.8% 16.7% 17.7% -74bps -88bps -162bps -102bps 96bpsEurope/CIS/Africa 17.6% 21.3% 22.3% 22.5% 21.8% 22.9% 372bps 96bps 22bps -74bps 113bpsMiddle East/Asia 18.2% 23.0% 23.4% 19.5% 18.1% 19.1% 472bps 47bps -392bps -144bps 106bpsTotal 14.0% 19.8% 24.0% 24.1% 22.4% 18.8% 19.7% 418bps 10bps -162bps -360bps 82bpsConsensus 23.3% 22.0% 20.5% 18.3% 18.4% -126bps -151bps -221bps 7bps
WFT 2004 2005 2006 2007 2008 2009 2010 2006 2007 2008E 2009E 2010ENorth America 28.0% 25.7% 24.5% 17.4% 19.7% -232bps -118bps -708bps 225bpsLatin America 18.3% 23.0% 22.5% 21.9% 22.2% 471bps -50bps -68bps 33bpsEurope/CIS/Africa 20.6% 24.2% 25.5% 24.1% 24.4% 355bps 126bps -131bps 26bpsMiddle East/Asia 20.2% 22.8% 23.0% 21.6% 21.9% 261bps 17bps -136bps 28bpsTotal 12.5% 15.4% 20.7% 21.0% 20.6% 17.3% 18.3% 530bps 29bps -36bps -334bps 107bpsConsensus 20.7% 21.3% 21.4% 19.2% 19.5% 60bps 13bps -222bps 31bps
SII 2004 2005 2006 2007 2008 2009 2010 2006 2007 2008E 2009E 2010ETotal 10.6% 12.1% 14.7% 15.6% 15.8% 13.9% 14.4% 261bps 90bps 15bps -190bps 49bpsConsensus 14.5% 15.4% 15.7% 14.5% 13.5% 91bps 26bps -120bps -92bps
TOP FIVE 2004 2005 2006 2007 2008 2009 2010 2006 2007 2008E 2009E 2010ENorth America 17.8% 24.4% 29.3% 27.2% 24.0% 18.0% 19.1% 487bps -211bps -319bps -600bps 114bpsLatin America 12.0% 17.0% 19.4% 21.2% 20.4% 19.6% 20.2% 247bps 175bps -76bps -85bps 67bpsEurope/CIS/Africa 13.4% 18.4% 21.6% 23.8% 23.6% 22.3% 22.9% 316bps 219bps -18bps -133bps 67bpsMiddle East/Asia 20.2% 22.4% 24.8% 26.7% 25.6% 24.0% 24.8% 244bps 186bps -110bps -159bps 84bpsTotal 14.0% 18.3% 22.7% 22.9% 21.6% 18.9% 19.6% 438bps 21bps -127bps -275bps 77bpsConsensus 22.2% 22.0% 21.0% 18.9% 18.8% -15bps -99bps -212bps -12bps
TOP FIVE 2004 2005 2006 2007 2008 2009 2010 2006 2007 2008E 2009E 2010EInternational 15.2% 19.3% 21.9% 23.9% 23.2% 21.9% 22.7% 269bps 193bps -68bps -126bps 73bps
SLB 18.3% 21.2% 25.7% 28.8% 27.8% 26.2% 27.0% 447bps 318bps -103bps -162bps 84bpsHAL 12.1% 17.6% 20.9% 21.6% 21.4% 20.2% 20.9% 325bps 75bps -24bps -123bps 74bpsBHI 18.9% 21.5% 21.7% 19.9% 18.9% 19.9% 257bps 18bps -177bps -107bps 105bpsWFT 19.7% 23.3% 23.7% 22.5% 22.8% 362bps 31bps -112bps 29bps
TOP FIVE 2004 2005 2006 2007 2008 2009 2010 2006 2007 2008E 2009E 2010ENorth America 17.8% 24.4% 29.3% 27.2% 24.0% 18.0% 19.1% 487bps -211bps -319bps -600bps 114bps
SLB 16.7% 24.8% 30.4% 28.7% 22.4% 19.3% 20.5% 560bps -167bps -634bps -307bps 121bpsHAL 19.0% 26.8% 32.1% 27.8% 24.4% 17.9% 18.5% 526bps -431bps -338bps -648bps 60bpsBHI 21.6% 26.7% 26.5% 24.6% 17.3% 17.8% 506bps -15bps -187bps -737bps 50bpsWFT 28.0% 25.7% 24.5% 17.4% 19.7% -232bps -118bps -708bps 225bps
Source: FactSet, Morgan Stanley Research

18
M O R G A N S T A N L E Y R E S E A R C H
January 5, 2009 Oil Services, Drilling & Equipment
Exhibit 48 Oil Services: Revenue Growth and EPS Assumptions
Top Line 2008 2009 2010 Top Line Growth2003 2004 2005 2006 2007 2008E 2009E 2010E 2003 2004 2005 2006 2007 2008E 2009E 2010E
SLB MS 9,779 11,479 14,310 19,238 23,269 27,214 24,691 26,225 4.6% 17.4% 24.7% 34.4% 21.0% 17.0% -9.3% 6.2%Consensus 9,779 11,479 14,310 19,238 23,269 27,303 26,741 26,264 4.6% 17.4% 24.7% 34.4% 21.0% 17.3% -2.1% -1.8%
HAL MS 6,995 7,998 10,100 12,955 15,264 17,846 14,961 15,543 2.3% 14.3% 26.3% 28.3% 17.8% 16.9% -16.2% 3.9%Consensus 6,995 7,998 10,100 12,955 15,264 18,159 18,156 18,271 2.3% 14.3% 26.3% 28.3% 17.8% 19.0% 0.0% 0.6%
BHI MS 5,252 6,100 7,184 9,027 10,428 11,605 10,230 10,674 8.1% 16.1% 17.8% 25.7% 15.5% 11.3% -11.8% 4.3%Consensus 5,252 6,100 7,184 9,027 10,428 11,724 11,591 11,933 8.1% 16.1% 17.8% 25.7% 15.5% 12.4% -1.1% 3.0%
BJS MS 2,143 2,601 3,243 4,368 4,802 5,426 4,439 4,663 14.9% 21.4% 24.7% 34.7% 9.9% 13.0% -18.2% 5.0%Consensus 2,143 2,601 3,243 4,368 4,802 5,426 5,182 5,030 14.9% 21.4% 24.7% 34.7% 9.9% 13.0% -4.5% -2.9%
WFT MS 2,591 3,146 4,333 6,579 7,832 9,471 8,861 9,686 11.3% 21.4% 37.7% 51.8% 19.0% 20.9% -6.4% 9.3%Consensus 2,591 3,146 4,333 6,579 7,832 9,594 10,322 11,214 11.3% 21.4% 37.7% 51.8% 19.0% 22.5% 7.6% 8.6%
SII MS 3,595 4,419 5,579 7,334 8,764 10,728 10,743 11,450 13.4% 22.9% 26.2% 31.4% 19.5% 22.4% 0.1% 6.6%Consensus 3,595 4,419 5,579 7,334 8,764 10,786 11,548 11,875 13.4% 22.9% 26.2% 31.4% 19.5% 23.1% 7.1% 2.8%
Average MS 5,059 5,957 7,458 9,917 11,727 13,715 12,321 13,040 9.1% 18.9% 26.2% 34.4% 17.1% 16.9% -10.3% 5.9%Average Consensus 5,059 5,957 7,458 9,917 11,727 13,832 13,923 14,098 9.1% 18.9% 26.2% 34.4% 17.1% 17.9% 1.2% 1.7%
Source: FactSet, Company data, Morgan Stanley Research. Note: top line figures for SLB excludes Sema prior to 2004, top line figures for HAL excludes KBR prior to 2007 Exhibit 49 Oil Services Revenue Growth: MS vs. Consensus
1.2%
-10.3%
-20%
-10%
0%
10%
20%
30%
40%
2003 2004 2005 2006 2007 2008E 2009E 2010E-20%
-10%
0%
10%
20%
30%
40%
Consensus MS
Source: FactSet, Company data, Morgan Stanley Research Includes historical figures and MS vs. consensus projection of top line growth for the average of SLB, HAL, WFT, BHI, SII, and BJS
Exhibit 50 Oil Services EPS Growth: MS vs. Consensus
-8.1%
-26.8%-40%
-20%
0%
20%
40%
60%
80%
2003 2004 2005 2006 2007 2008E 2009E 2010E-40%
-20%
0%
20%
40%
60%
80%
Consensus MS
Source: FactSet, Company data, Morgan Stanley Research Includes historical figures and MS vs. consensus projection of EPS growth for the average of SLB, HAL, WFT, BHI, SII and BJS
Exhibit 51 Oil Services: EBIT Margins Assumptions
EBIT Margins 2008 2009 2010 Incremental EBIT Margins (bps)2003 2004 2005 2006 2007 2008E 2009E 2010E 2003 2004 2005 2006 2007 2008E 2009E 2010E
SLB MS 0.0% 0.0% 20.2% 26.6% 28.8% 26.1% 23.4% 24.5% 0 0 2024 634 225 -271 -270 103Consensus 0.0% 0.0% 20.2% 26.6% 28.8% 26.2% 23.6% 22.8% 0 0 2024 634 225 -264 -260 -79
HAL MS 12.3% 15.2% 22.1% 26.0% 24.5% 22.6% 19.2% 19.9% 99 290 694 391 -151 -196 -335 72Consensus 12.3% 15.2% 22.1% 26.0% 24.5% 21.4% 19.0% 19.7% 99 290 694 391 -151 -312 -236 70
BHI MS 11.5% 14.0% 18.6% 22.4% 21.7% 20.0% 16.7% 17.6% -52 258 458 374 -67 -166 -330 82Consensus 11.5% 14.0% 18.6% 22.4% 21.7% 20.5% 18.3% 18.4% -52 258 458 374 -67 -119 -221 7
BJS MS 13.7% 16.9% 20.0% 26.8% 24.0% 16.7% 13.3% 15.3% -41 317 318 679 -286 -724 -342 199Consensus 13.7% 16.9% 20.0% 26.8% 24.0% 16.7% 14.2% 14.8% -41 317 318 679 -286 -724 -248 54
WFT MS 10.6% 12.5% 15.4% 20.7% 21.0% 20.6% 17.3% 18.3% -116 188 291 530 29 -36 -334 107Consensus 10.6% 12.5% 15.4% 20.7% 21.0% 21.4% 19.2% 19.5% -116 188 291 530 29 43 -222 31
SII MS 9.3% 10.6% 12.1% 14.7% 15.6% 15.8% 13.9% 14.4% 119 137 148 261 90 15 -190 49Consensus 9.3% 10.6% 12.1% 14.7% 15.6% 15.7% 14.5% 13.5% 119 137 148 261 90 3 -120 -92
Average MS 9.5% 11.5% 18.1% 22.9% 22.6% 20.3% 17.3% 18.3% 2 198 656 478 -27 -230 -300 102Average Consensus 9.5% 11.5% 18.1% 22.9% 22.6% 20.3% 18.1% 18.1% 2 198 656 478 -27 -229 -218 -1
Source: FactSet, Company data, Morgan Stanley Research. Note: figures for SLB excludes Sema prior to 2004, figures for HAL excludes KBR prior to 2007

19
M O R G A N S T A N L E Y R E S E A R C H
January 5, 2009 Oil Services, Drilling & Equipment
Exhibit 52 Equipment: Revenue Growth and EPS Assumptions
Top Line 2008 2009 2010 Top Line Growth2003 2004 2005 2006 2007 2008E 2009E 2010E 2003 2004 2005 2006 2007 2008E 2009E 2010E
NOV MS 2,582 3,044 5,642 8,419 11,614 13,719 11,129 10,191 37.9% 17.9% 85.3% 49.2% 38.0% 18.1% -18.9% -8.4%Consensus 2,582 3,044 5,642 8,419 11,614 13,365 14,144 12,108 37.9% 17.9% 85.3% 49.2% 38.0% 15.1% 5.8% -14.4%
CAM MS 1,634 2,093 2,518 3,743 4,666 5,756 5,641 6,247 6.3% 28.1% 20.3% 48.7% 24.7% 23.4% -2.0% 10.7%Consensus 1,634 2,093 2,518 3,743 4,666 5,841 6,102 6,171 6.3% 28.1% 20.3% 48.7% 24.7% 25.2% 4.5% 1.1%
FTI MS 2,307 2,768 3,227 3,905 4,632 5,039 4,896 5,396 11.4% 20.0% 16.6% 21.0% 18.6% 8.8% -2.8% 10.2%Consensus 2,307 2,768 3,227 3,905 4,632 4,785 4,754 4,953 11.4% 20.0% 16.6% 21.0% 18.6% 3.3% -0.6% 4.2%
TS MS 3,180 3,718 6,210 7,728 10,180 12,599 11,776 10,902 -1.2% 16.9% 67.0% 24.4% 31.7% 23.8% -6.5% -7.4%Consensus 3,180 3,718 6,210 7,728 10,180 12,138 11,313 11,185 -1.2% 16.9% 67.0% 24.4% 31.7% 19.2% -6.8% -1.1%
DRC MS 1,335 916 1,208 1,502 1,665 2,198 2,283 2,455 29.5% -31.4% 31.9% 24.3% 10.9% 32.0% 3.9% 7.5%Consensus 1,335 916 1,208 1,502 1,665 2,217 2,291 2,289 29.5% -31.4% 31.9% 24.3% 10.9% 33.2% 3.3% -0.1%
DRQ MS 219 222 341 443 496 540 515 535 1.7% 1.0% 53.8% 29.9% 11.9% 9.0% -4.5% 3.7%Consensus 219 222 341 443 496 549 600 663 1.7% 1.0% 53.8% 29.9% 11.9% 10.7% 9.4% 10.4%
GTLS MS 266 306 403 537 666 765 737 751 N/A 15.1% 31.9% 33.3% 24.0% 14.7% -3.7% 2.0%Consensus 266 306 403 537 666 759 759 790 N/A 15.1% 31.9% 33.3% 24.0% 13.9% 0.1% 4.0%
Average MS 1,646 1,867 2,793 3,754 4,846 5,802 5,283 5,211 14.2% 9.6% 43.8% 33.0% 22.8% 18.5% -4.9% 2.6%Average Consensus 1,646 1,867 2,793 3,754 4,846 5,665 5,709 5,451 14.2% 9.6% 43.8% 33.0% 22.8% 17.2% 2.2% 0.6%
Source: FactSet, Company data, Morgan Stanley Research. Note: top line for NOV includes GRP for all periods; some consensus numbers might lack relevance due to the low number of estimates Exhibit 53 Equipment Revenue Growth: MS vs. Consensus
2.2%
-4.9%-10%
0%
10%
20%
30%
40%
50%
2003 2004 2005 2006 2007 2008E 2009E 2010E-10%
0%
10%
20%
30%
40%
50%
Consensus MS
Source: FactSet, Company data, Morgan Stanley Research Includes historical figures and MS vs. consensus projection of top line growth for the average of NOV, CAM, FTI, TS, DRC, DRQ and GTLS
Exhibit 54 Equipment EPS Growth: MS vs. Consensus
0.9%
-10.1%-20%
0%
20%
40%
60%
80%
100%
2003 2004 2005 2006 2007 2008E 2009E 2010E-20%
0%
20%
40%
60%
80%
100%
Consensus MS
Source: FactSet, Company data, Morgan Stanley Research Includes historical figures and MS vs. consensus projection of top line growth for the average of NOV, CAM, FTI, TS, DRC, DRQ and GTLS
Exhibit 55 Equipment: EBIT Margins Assumptions
EBIT Margins 2008 2009 2010 Incremental EBIT Margins (bps)2003 2004 2005 2006 2007 2008E 2009E 2010E 2003 2004 2005 2006 2007 2008E 2009E 2010E
NOV MS 8.2% 9.6% 13.2% 18.3% 22.6% 21.2% 19.6% 18.8% -76 132 368 510 428 -145 -155 -82Consensus 8.2% 9.6% 13.2% 18.3% 22.6% 22.2% 21.2% 18.6% -76 132 368 510 428 -41 -97 -266
CAM MS 5.6% 7.1% 10.4% 13.9% 15.8% 15.4% 14.7% 14.2% -204 153 326 351 188 -38 -68 -50Consensus 5.6% 7.1% 10.4% 13.9% 15.8% 15.7% 15.6% 14.0% -204 153 326 351 188 -4 -18 -155
FTI MS 5.6% 4.7% 5.0% 8.9% 10.4% 11.7% 11.5% 10.9% 13 -88 33 394 146 126 -13 -67Consensus 5.6% 4.7% 5.0% 8.9% 10.4% 11.4% 11.4% 10.4% 13 -88 33 394 146 100 0 -99
TS MS 9.1% 21.7% 31.3% 36.1% 29.3% 27.6% 26.4% 27.1% N/A 1260 967 480 -685 -167 -119 62Consensus 9.1% 21.7% 31.3% 36.1% 29.3% 28.0% 27.1% 27.0% N/A 1260 967 480 -685 -132 -91 -2
DRC MS 2.9% 8.4% 9.6% 12.5% 14.5% 14.4% 14.5% 12.2% 109 547 121 291 197 -10 11 -230Consensus 2.9% 8.4% 9.6% 12.5% 14.5% 14.1% 14.1% 12.1% 109 547 121 291 197 -41 1 -196
DRQ MS 7.3% 8.3% 14.4% 27.6% 27.9% 25.5% 24.9% 24.3% -32 100 617 1321 28 -240 -61 -63Consensus 7.3% 8.3% 14.4% 27.6% 27.9% 26.2% 25.6% 24.4% -32 100 617 1321 28 -168 -67 -115
GTLS MS 13.4% 12.1% 8.5% 12.4% 13.9% 17.0% 15.5% 12.6% N/A -123 -366 397 148 308 -152 -289Consensus 13.4% 12.1% 8.5% 12.4% 13.9% 17.1% 16.1% 14.3% N/A -123 -366 397 148 319 -97 -182
Average MS 7.4% 10.3% 13.2% 18.6% 19.2% 19.0% 18.2% 17.1% -38 283 295 535 64 -24 -79 -103Average Consensus 7.4% 10.3% 13.2% 18.6% 19.2% 19.3% 18.7% 17.3% -38 283 295 535 64 5 -53 -145
Source: FactSet, Company data, Morgan Stanley Research. Note: figures for NOV include GRP for all periods; some consensus numbers might lack relevance due to the low number of estimates

20
M O R G A N S T A N L E Y R E S E A R C H
January 5, 2009 Oil Services, Drilling & Equipment
Exhibit 56 12-Month Forward Rolling Consensus EPS
RecentCompany Symbol Price EPS CEPS High Low Avg Std Dev Current High Low Avg Std Dev Current
Oil Services:Schlumberger SLB 45.62 4.15 5.57 51.9 9.9 27.3 9.6 11.0 22.3 7.7 14.4 3.3 8.2Halliburton HAL 19.45 2.63 3.13 41.5 6.0 19.8 7.9 7.4 21.0 4.8 12.1 3.6 6.2Baker Hughes BHI 34.33 4.85 6.24 55.7 6.5 23.9 10.7 7.1 17.3 4.8 12.2 2.6 5.5BJ Services BJS 12.43 1.70 3.12 47.6 6.3 18.8 8.7 7.3 25.1 4.0 12.5 4.2 4.0Weatherford WFT 11.66 2.02 2.75 51.8 5.4 32.6 12.9 5.8 31.3 3.7 15.5 4.6 4.2Smith International SII 25.03 3.68 4.32 56.4 6.2 22.9 10.5 6.8 27.8 4.8 14.4 4.2 5.8ION Geophysical IO 3.78 0.54 1.16 57.9 4.5 26.8 10.8 7.1 44.1 1.7 15.3 7.3 3.3
Average (excludes IO) 50.8 6.7 24.2 10.1 7.6 24.1 5.0 13.5 3.8 5.7
Offshore Drillers:Atwood Oceanics ATW 17.52 4.64 3.27 44.2 3.3 16.8 9.3 3.8 49.8 3.0 12.0 6.5 5.4Diamond Offshore DO 63.12 11.46 8.32 5.1 19.5 10.0 0.0 5.5 4.5 11.7 3.2 0.0 7.6ENSCO International ESV 30.33 8.27 8.17 43.1 3.4 17.1 9.5 3.7 30.0 3.0 12.1 5.9 3.7Noble Corporation NE 23.75 7.07 5.72 49.0 3.1 26.8 13.1 3.4 31.6 2.8 16.7 6.6 4.2Pride International PDE 17.58 3.38 4.47 47.7 4.5 18.3 10.8 5.2 12.4 2.2 7.0 2.0 3.9Rowan Companies RDC 17.25 4.27 5.13 50.0 3.7 19.3 13.1 4.0 27.7 3.0 12.1 5.6 3.4Transocean RIG 52.01 15.44 13.21 32.5 3.1 14.9 6.1 3.4 22.4 2.8 9.5 3.1 3.9Hercules Offshore HERO 5.04 0.98 4.02 15.4 3.8 8.7 3.0 5.1 12.6 1.3 6.6 2.5 1.3Nabors Industries NBR 13.27 2.50 5.07 47.0 4.8 19.0 10.1 5.3 23.0 2.6 11.1 4.9 2.6Patterson-UTI PTEN 12.58 1.20 4.39 49.6 5.3 18.4 11.3 10.4 18.2 2.9 9.5 3.8 2.9
Average 38.4 5.5 16.9 8.7 5.0 23.2 3.5 10.0 4.1 3.9
Equipment:Tenaris TS 22.02 3.41 3.47 23.1 3.7 12.3 3.6 6.5 15.8 2.9 9.2 2.7 6.3National Oilwell Varco NOV 26.83 4.97 4.31 50.7 4.9 30.3 12.3 5.4 42.9 4.6 22.7 8.8 6.2Cameron International CAM 22.07 2.77 2.60 48.9 7.2 33.4 12.7 8.0 31.4 6.3 18.9 5.0 8.5FMC Technologies FTI 25.32 2.83 2.96 25.1 8.4 19.5 3.2 9.0 21.1 2.9 13.5 3.0 8.5Oceaneering International OII 30.34 3.86 5.04 21.4 6.5 16.0 2.9 7.9 14.7 4.3 8.1 2.1 6.0Dril-Quip DRQ 22.03 2.95 2.62 45.9 6.5 23.5 7.7 7.5 37.4 5.7 16.5 5.3 8.4Dresser-Rand DRC 18.77 2.45 2.40 24.5 6.8 16.8 4.2 7.7 16.0 5.4 12.2 2.4 7.8Chart Industries GTLS 11.02 2.33 2.59 18.5 4.1 11.9 4.0 4.7 14.9 3.1 9.0 3.2 4.3
Average 32.2 6.0 20.5 6.3 7.1 24.3 4.4 13.8 4.1 7.0
Engineering & Construction:Helix Energy Solutions HLX 7.86 2.65 7.06 34.9 2.2 16.2 7.1 3.0 18.4 1.1 8.8 3.5 1.1
Consensus12-Month Rolling Price-to-12-Month Rolling EPS Price-to-12-Month Rolling CEPS
Source: FactSet, Morgan Stanley Research CEPS = cash EPS is equal to net income + depreciation and amortization + convertible interest (where applicable)
Exhibit 57 OSX versus Weighted 12-Month Forward Rolling Consensus EPS of OSX Constituents
-1.002.003.004.005.006.007.008.00
07/9
7
01/9
8
07/9
8
01/9
9
07/9
9
01/0
0
07/0
0
01/0
1
07/0
1
01/0
2
07/0
2
01/0
3
07/0
3
01/0
4
07/0
4
01/0
5
07/0
5
01/0
6
07/0
6
01/0
7
07/0
7
01/0
8
07/0
8
01/0
9
05010015020025030035040012-Month Forward Rolling EPS OSX
Source: FactSet, Morgan Stanley Research

21
M O R G A N S T A N L E Y R E S E A R C H
January 5, 2009 Oil Services, Drilling & Equipment
Commodity Data Exhibit 58 US Natural Gas Storage
0.5
1.0
1.5
2.0
2.5
3.0
3.5
Jan Feb Mar Apr May Jun Jul Aug Sep Oct Nov Dec
Trill
ions
of C
ubic
Fee
t
5-Yr. Range 2008 2007 2006 2005 2004
Source: Energy Information Administration (EIA)
Exhibit 59 Natural Gas Injection Rate
(300)
(250)
(200)
(150)
(100)
(50)
0
50
100
150
Jan Feb Mar Apr May Jun Jul Aug Sep Oct Nov Dec
5 Year Range 2008 2007 2006
Source: Energy Information Administration (EIA), Morgan Stanley Research
Exhibit 60 Weekly US Natural Gas Storage: Injection (Withdrawal)
(200)(180)(160)(140)(120)(100)(80)(60)(40)(20)
020
Inje
ctio
n (W
ithdr
awal
)(B
cf)
Weekly Change (80.0) (178.0) 1.0 (47.0) (87.0) (143.0) (78.2)
2003 2004 2005 2006 2007 2008 '03-'07 Avg.
Source: Department of Energy (DOE), Morgan Stanley Research
Exhibit 61 US LNG Monthly Imports
0
20
40
60
80
100
120
Jan Feb Mar Apr May Jun Jul Aug Sep Oct Nov Dec
Bcf
2008 2007 2006 2005 Avg 03-07
Source: Waterborne, Morgan Stanley Research
Exhibit 62 US Total Oil Inventories
560
580
600
620
640
660
680
700
720
Jan Feb Mar Apr May Jun Jul Aug Sep Oct Nov Dec
Mill
ions
of B
arre
ls
2008 2007 2006 2005 2004 Source: Energy Information Administration (EIA), Morgan Stanley Research
Exhibit 63 US Oil Inventory Data
Prior Weekly Previous 5-Yr.API 12/26/08 Week Change Year Avg.
Crude Oil 324.6 316.7 7.9 297.7 296.5 Motor Gasoline 206.6 204.8 1.8 212.9 212.9 Middle Distillates 175.6 172.0 3.6 173.3 178.6 Distillates 137.9 134.1 3.9 133.7 138.5 Kerosene 37.7 37.9 (0.2) 39.6 40.1 Naphtha - - - - 0.0 Residual 36.1 36.4 (0.3) 39.1 40.0 Unfinished 85.9 87.4 (1.5) 85.3 83.9 Total Oil 828.8 817.2 11.6 808.3 811.9 DOECrude Oil 318.7 318.2 0.5 289.6 293.8 Motor Gasoline 208.1 207.3 0.8 207.8 211.8 Distillates 136.0 135.3 0.7 127.2 132.9
Total Oil 662.9 660.8 2.1 624.6 638.5 Source: American Petroleum Institute (API), Department of Energy (DOE), Morgan Stanley Research

22
M O R G A N S T A N L E Y R E S E A R C H
January 5, 2009 Oil Services, Drilling & Equipment
Exhibit 64 Middle East Total Fixings
5.0
6.0
7.0
8.0
9.0
10.0
11.0
Jan Feb Mar Apr May Jun Jul Aug Sep Oct Nov Dec
mbp
d
2008 2007 2006 Source: Oil Movements, Morgan Stanley Research. Note: 4-week average
Exhibit 65 Middle East Westbound Fixings
1.0
2.0
3.0
4.0
5.0
Jan Feb Mar Apr May Jun Jul Aug Sep Oct Nov Dec
mbp
d
2008 2007 2006 Source: Oil Movements, Morgan Stanley Research. Note: 4-week average
Exhibit 66 Middle East Westbound Sailings
4.5
5.0
5.5
6.0
Jan Feb Mar Apr May Jun Jul Aug Sep Oct Nov Dec
mbp
d
2009 2008 2007 Avg 05-08
Source: Oil Movements, Morgan Stanley Research. Note: 4-week average
Exhibit 67 Middle East Westbound Oil in Transit
120
130
140
150
160
170
180
Jan Feb Mar Apr May Jun Jul Aug Sep Oct Nov Dec
mbb
ls
2009 2008 2007 Avg 05-08
Source: Oil Movements, Morgan Stanley Research. Note: 4-week average
Exhibit 68 North American Long Haul Arrivals
5.0
5.5
6.0
6.5
7.0
Jan Feb Mar Apr May Jun Jul Aug Sep Oct Nov Dec
mbp
d
2008 2007 2006 2009 Source: Oil Movements, Morgan Stanley Research. Note: 4-week average
Exhibit 69 VLCC Rates
$0
$30,000
$60,000
$90,000
$120,000
$150,000
$180,000
$210,000
$240,000
$270,000
Jan Feb Mar Apr May Jun Jul Aug Sep Oct Nov Dec
$ / D
ay
2009 2008 20072006 2005
Source: CRS, Morgan Stanley Research

23
M O R G A N S T A N L E Y R E S E A R C H
January 5, 2009 Oil Services, Drilling & Equipment
Exhibit 70 Future Deliveries of Newbuild Jackups
Water Est. Expected Date of TermOwner Manager Rig Name Design Depth (ft) Type Cost Delivery Shipyard Region Delivery Contract
1 Aban Offshore (Sinvest) Premium Driling Deep Driller 8 KFELS MOD V Super B Class (HP/H 350 IC $197 1Q09 Keppel FELS Sing. 2009Hindustan Petroleum3 Awilco AS Permium Drilling WilStrike KFELS Mod V B 400 IC $163 2Q09 Keppel FELS Sing. 2009 --4 Awilco AS Permium Drilling Wil Confidence Baker Marine Pacific Class 375 375 IC $149 3Q09 Jurong Sing. 2009 --5 Chekovo (Saudi interests) Contractor TBC Thule Power Baker Marine BMC-200-H 250 IC $350 1Q09 QGM Group M.E. 2009 --6 COSL COSL COSL 936 MSC CJ46-X100D 350 IC -- 1Q10 Yiu Lian China 2010 --7 COSL COSL COSL 937 MSC CJ46-X100D 350 IC -- 1Q10 Dalian China 2010 --8 COSL COSL COSL 921 Friede & Goldman L-780 MOD II 200 IC -- 4Q09 -- China 2009 --9 COSL COSL COSL 922 Friede & Goldman L-780 MOD II 200 IC -- 2Q10 Tanggu China 2010 --10 COSL COSL COSL 923 Friede & Goldman L-780 MOD II 200 IC -- 2Q10 Tanggu China 2010 --11 COSL COSL COSL 924 Friede & Goldman L-780 MOD II 200 IC -- 3Q10 Tanggu China 2010 --12 CPOE CPOE CPOE-7 Offshore Engineering & Equipment 131 IC -- 2Q09 Qingdao Beihai China 2009 CPOE13 CPOE CPOE CPOE-8 Offshore Engineering & Equipment 131 IC -- 2Q09 Qingdao Beihai China 2009 CPOE14 CPOE CPOE CPOE-9 Fried & Goldman 300 IC -- 2Q09 Dalian China 2009 CPOE15 CPOE CPOE CPOE-10 Friede & Goldman L-780 MOD II 300 IC -- 4Q09 Dalian China 2009 CPOE16 Drydocks World Drydocks World Unnamed GustoMSC CJ46-X100D 350 IC -- 4Q10 Drydocks Indonesia 2010 --17 Drydocks World Drydocks World Unnamed GustoMSC CJ46-X100D 350 IC -- 1Q11 Drydocks Indonesia 2011 --18 EODC EGAS Unnamed Baker Marine Pacific Class 375 375 IC $213 4Q10 Jurong Sing. 2010 --19 EODC EGAS Unnamed Baker Marine Pacific Class 375 375 IC $213 1Q11 Jurong Sing. 2011 --20 Egyptian Drilling Egyptian Drilling Unnamed Baker Marine Pacific Class 375 375 IC $201 1Q10 Jurong Sing. 2010 --21 Egyptian Drilling Egyptian Drilling Unnamed Baker Marine Pacific Class 375 375 IC $220 3Q10 Jurong Sing. 2010 --22 Essar Essar Unnamed F&G JU-2000-A 350 IC $240 4Q10 ABG Shipyard India 2010 --23 Essar Essar Unnamed F&G JU-2000-A 350 IC $240 2Q11 ABG Shipyard India 2011 --24 Gazflot Gazflot Arkticheskaya CDB Corrall 6500/10-30 328 IC $100 2Q09 Zvezdochka Russia 2009 --25 Great Offshore Great Offshore Samed Shikhar LeTourneau Super 116E 350 IC $230 2Q09 Bharati Shipyard India 2009 ONGC26 Greatship Greatship Greatdrill Chitra KFELS MOD V B 350 IC $182 4Q09 Keppel FELS Sing. 2009 ONGC27 KS Energy KS Energy KS Endeavour F&G Super M2 300 IC $148 3Q09 MIS Shipyard M.E. 2009 --28 Maersk Maersk Maersk High Efficiency 3 CJ50-X100MC 350 IC $153 1Q09 Keppel FELS Sing. 2009 Private29 Maersk Maersk Maersk High Efficiency 4 CJ50-X100MC 350 IC $153 2Q09 Keppel FELS Sing. 2009 --30 MEANdrill MEANdrill Unnamed Friede & Goldman Super M2 300 IC $182 4Q10 MIS Shipyard Sing. 2010 --31 MEANdrill MEANdrill Unnamed Friede & Goldman Super M2 300 IC $182 1Q11 MIS Shipyard Sing. 2011 --32 Mercator Offshore Greatship Greatdrill Chetna KFELS Mod V B 350 IC $211 1Q09 Keppel FELS Sing. 2009 ONGC33 Mosvold ME Jackup Mosvold ME Jackup Mosvold 106 F&G Super M2 300 IC $184 1Q10 MIS Shipyard M.E. 2010 --34 Mosvold ME Jackup Mosvold ME Jackup Mosvold 108 F&G Super M2 300 IC $184 2Q10 MIS Shipyard M.E. 2010 --35 NIDC NIDC Unnamed ---- 300 IC $117 1Q11 Khorramshahr M.E. 2011 Pars Oil & Gas36 NIDC NIDC Unnamed ---- 300 IC $117 1Q11 Khorramshahr M.E. 2011 Pars Oil & Gas37 NIDC NIDC Unnamed ---- 300 IC -- 4Q09 Sanaye Farasahel M.E. 2009 Pars Oil & Gas38 NIDC NIDC Unnamed ---- 300 IC -- 4Q09 Sanaye Farasahel M.E. 2009 Pars Oil & Gas39 NIDC NIDC Unnamed ---- 300 IC -- 4Q10 Khorramshahr M.E. 2010 Pars Oil & Gas40 Noble Corp. Noble Corp. Noble Scott Marks F&G JU 2000E (HE) 400 IC $190 3Q09 Dalian China 2009 Venture41 Odebrecht Odebrecht Unnamed LeTourneau 350 IC -- 3Q10 Bahia Brazil 2010 Petrobras42 Odebrecht Odebrecht Unnamed LeTourneau 350 IC -- 3Q10 Bahia Brazil 2010 Petrobras43 Perforadora Central Perforadora Central Tuxpan LeTourneau Super 116E 350 IC $190 4Q09 AMFELS USA 2009 PEMEX44 PetroProd PetroProd Unnamed GustoMSC CJ-70-X-150A 492 IC $560 3Q10 Jurong Sing. 2010 --45 PV Drilling PV Drilling PV Drilling II KFELS Mod V B 375 IC $191 4Q09 Keppel FELS Sing. 2009 Undisclosed46 PV Drilling PV Drilling PV Drilling III KFELS Mod V B 360 IC $205 4Q09 Keppel FELS Sing. 2009 --47 Riginvest Riginvest Unnamed LeTourneau Super 116E 350 IC $186 2Q10 Lamprell M.E. 2010 --48 Rowan Rowan Ralph Coffman LeTourneau 240-C (HT/HP) 400 IC $165 3Q09 LeTourneau USA 2009 --49 Rowan Rowan Unnamed LeTourneau Super 116E 350 IC $175 2Q10 AMFELS USA 2010 --50 Rowan Rowan Unnamed LeTourneau Super 116E 350 IC $175 3Q10 AMFELS USA 2010 --51 Rowan Rowan Unnamed LeTourneau Super 116E 350 IC $175 1Q11 AMFELS USA 2011 --52 Rowan Rowan Unnamed LeTourneau Super 116E 350 IC $175 1Q11 AMFELS USA 2011 --53 Rowan Rowan Unnamed LeTourneau 240-C (HT/HP) 400 IC $200 3Q10 LeTourneau USA 2010 --54 Rowan Rowan Unnamed LeTourneau 240-C (HT/HP) 400 IC $200 3Q11 LeTourneau USA 2011 --55 Saipem Saipem Perro Negro 6 GustoMSC CJ-46-X 100D 350 IC $147 2Q09 Drydocks World Indonesia 2009 --56 Saipem Saipem Unnamed GustoMSC CJ-46-X 100D 350 IC $154 4Q09 Drydocks World Indonesia 2009 --57 Scorpion Offshore Scorpion Offshore Offshore Intrepid LeTourneau Super 116 350 IC $144 1Q09 AMFELS USA 2009 Khafji O&G (LOI)58 Scorpion Offshore Scorpion Offshore Offshore Freedom LeTourneau Super 116E 350 IC $200 1Q09 Lamprell M.E. 2009 Khafji O&G (LOI)59 Scorpion Offshore Scorpion Offshore Offshore Mischief LeTourneau Super 116E 350 IC $211 1Q10 Lamprell M.E. 2010 --60 SeaWolf SeaWolf SeaWolf Oritsetimeyin F&G Super M2 300 IC $143 1Q09 MIS Shipyard M.E. 2009 TBA61 SeaWolf SeaWolf SeaWolf Onome F&G Super M2 300 IC $143 1Q09 MIS Shipyard M.E. 2009 TBA62 SeaDrill SeaDrill West Callisto KFELS Mod V B 400 IC $210 2Q10 Keppel FELS Sing. 2010 --63 SeaDrill SeaDrill West Juno KFELS Mod V B 400 IC $210 4Q10 Keppel FELS Sing. 2010 --64 SeaDrill SeaDrill West Leda Baker Marine Pacific Class 375 375 IC $220 1Q10 Jurong Sing. 2010 --65 SeaDrill SeaDrill West Elara Baker Marine Pacific Class 375 375 IC $220 4Q10 Jurong Sing. 2010 --66 Sinopec Sinopec Unnamed Baker Marine Pacific Class 375 375 IC $229 1Q11 Jurong Sing. 2011 --67 Skeie Skeie Unnamed KFELS N Class 400 IC $450 2Q10 Keppel FELS Sing. 2010 --68 Skeie Skeie Unnamed KFELS N Class 430 IC $480 3Q10 Keppel FELS Sing. 2010 Skeie69 Skeie Skeie Unnamed KFELS N Class 430 IC $504 1Q11 Keppel FELS Sing. 2011 --70 Thule Drilling Thule Drilling Thule Energy F&G Super M2 300 IC $160 1Q10 QGM Group M.E. 2010 --71 Thule Drilling Thule Drilling Thule Force F&G Super M2 300 IC $160 2Q10 QGM Group M.E. 2010 --72 Togico/SAAG SAAG Drilling Unnamed MSC CJ46-X 100D 300 IC $155 4Q11 Labuan Shipyard Malaysia 2010 TBA73 UMW Standard Drilling UMW Standard Drilling Naga-2 MSC CJ46-X 100D 350 IC $177 1Q09 Drydocks World Indonesia 2009 PCPP JOC74 UMW Standard Drilling UMW Standard Drilling Naga-3 MSC CJ46-X 100D 350 IC $154 2Q09 Drydocks World Indonesia 2009 --75 Vantage Vantage Aquamarine Driller Baker Marine Pacific Class 375 375 IC $190 1Q10 Jurong Sing. 2010 --29 Vantage Vantage Sapphire Driller Baker Marine Pacific Class 375 375 IC $155 3Q09 Jurong Sing. 2009 --30 Vantage Vantage Topaz Driller Baker Marine Pacific Class 375 375 IC $198 4Q09 Jurong Sing. 2009 --31 Yantai Raffles Yantai Raffles Unnamed Friede & Goldman Super M2 300 IC -- 4Q09 Yantai Raffles China 2009 --32 Yantai Raffles Yantai Raffles Unnamed Friede & Goldman Super M2 300 IC -- 4Q09 Yantai Raffles China 2009 --33 Yantai Raffles Yantai Raffles Unnamed Friede & Goldman Super M2 300 IC -- 4Q09 Yantai Raffles China 2009 --
Source: Company data, ODS-Petrodata, Morgan Stanley Research

24
M O R G A N S T A N L E Y R E S E A R C H
January 5, 2009 Oil Services, Drilling & Equipment
Exhibit 71 Future Deliveries of Newbuild Floaters
Water Est. Expected Date of TermOwner Manager Rig Name Design Depth (ft) Cost Delivery Shipyard Region Delivery Contract
Newbuilds:1 Aker Drilling Aker Drilling Aker Spitsbergen Aker H-6e (Harsh) 10,000 $615 1Q09 Aker Kvaerner Norway 2009 Statoil2 Aker Drilling Aker Drilling Aker Barents Aker H-6e (Harsh) 10,000 $603 2Q09 Aker Stord Norway 2009 Aker Exploration/Pertra3 Atwood Oceanics Atwood Oceanics Unnamed Friede & Goldman Ex-D Millenium 6,000 $580 1Q11 Jurong Sing. 2011 Chevron4 Atwood Oceanics Atwood Oceanics Unnamed Friede & Goldman Ex-D Millenium 10,000 $750 2Q12 Jurong Sing. 2012 --5 CNOOC COSL Unnamed Friede & Goldman ExD 9,843 $599 1Q11 Shanghai Waigaoqiao China 2011 CNOOC6 COSL COSL COSLPioneer GM-4000 2,460 $365 3Q09 Yantai Raffles China 2009 British Petroleum7 COSL COSL COSLInnovator GM-4000 2,460 $380 1Q10 Yantai Raffles China 2009 Norsk Hydro8 COSL COSL COSLPromoter GM-4000 2,460 $380 3Q10 Yantai Raffles China 2010 Norsk Hydro9 Delba Delba Delba III GustoMSC TDS 2500 7,874 $611 2Q10 IMAC Abu Dhabi 2010 Petrobras10 Delba Delba Delba IV GustoMSC TDS-2500 7,874 -- 4Q11 -- UAE 2011 Petrobras11 Delba Delba Delba V ---- 8,000 -- 2Q12 -- -- 2012 Petrobras12 Delba Delba Delba VI ---- 8,000 -- 2Q12 -- -- 2012 Petrobras13 Delba Delba Delba VII Samsung Heavy Industries 10,000 $700 1Q12 Samsung Heavy Korea 2012 Petrobras14 Delba Delba Delba VIII Samsung Heavy Industries 10,000 $740 2Q12 Samsung Heavy Korea 2012 Petrobras15 Dryships Ocean Rig Unnamed (Drillship) Samsung Heavy Industries 10,000 $790 3Q11 Samsung Heavy Korea 2011 --16 Dryships Ocean Rig Unnamed (Drillship) Samsung Heavy Industries 10,000 $792 4Q11 Samsung Heavy Korea 2011 --17 Dryships Ocean Rig Unnamed (Drillship) Samsung Heavy Industries 10,000 $713 1Q11 Samsung Heavy Korea 2011 --18 Dryships Ocean Rig Unnamed (Drillship) Samsung Heavy Industries 10,000 $713 2Q11 Samsung Heavy Korea 2011 --19 ENSCO ENSCO ENSCO 8501 ENSCO 8500 8,500 $338 2Q09 Keppel FELS Sing. 2009 Nexen/Noble20 ENSCO ENSCO ENSCO 8502 ENSCO 8500 8,500 $385 4Q09 Keppel FELS Sing. 2009 Nexen21 ENSCO ENSCO ENSCO 8503 ENSCO 8500 8,500 $427 3Q10 Keppel FELS Sing. 2010 Cobalt22 ENSCO ENSCO ENSCO 8504 ENSCO 8500 8,500 $515 3Q11 Keppel FELS Sing. 2011 --23 ENSCO ENSCO ENSCO 8505 ENSCO 8500 8,500 $537 2Q12 Keppel FELS Sing. 2012 --24 ENSCO ENSCO ENSCO 8506 ENSCO 8500 8,500 $560 3Q12 Keppel FELS Sing. 2012 --25 Etesco Etesco ET-VIII ---- 10,000 $709 2Q12 Samsung Heavy Korea 2012 Petrobras26 Frontier/Shell Frontier Drilling Bully GustoMSC PRD12,000 (Harsh) 12,000 -- 1Q10 Keppel FELS Sing. 2010 Frontier/Shell27 Frontier/Shell Frontier Drilling Bully 2 GustoMSC PRD12,000 (Harsh) 12,000 $632 3Q10 Keppel FELS Sing. 2010 Frontier/Shell28 Gazflot Gazflot Unnamed (Semi) Moss Maritime CS-50 1,148 $573 2Q10 Samsung Heavy Korea 2010 Gazflot29 Gazflot Gazflot Unnamed (Semi) Moss Maritime CS-50 1,148 $573 2Q11 Samsung Heavy Korea 2011 Gazflot30 Grupo R IPC Unnamed (Semi) GVA 7500-N 8,200 $709 4Q11 Daewoo Korea 2011 --31 Grupo R IPC La Muralla III GVA 7500-N 7,500 $633 3Q10 Daewoo Korea 2010 PEMEX32 Maersk Maersk Drilling Maersk Developer DSS 21 10,000 $450 1Q09 Keppel FELS Sing. 2009 Statoil33 Maersk Maersk Drilling Unnamed DSS 21 10,000 $450 1Q09 Keppel FELS Sing. 2009 Woodside34 Maersk Maersk Drilling Unnamed DSS 21 10,000 $415 4Q10 Keppel FELS Sing. 2010 --35 MARACC Offshore Offshore Island Innovator Global Maritime GM-4000 2,460 $633 4Q10 COSCO China 2010 --36 Metrostar Odfjell Drilling Deepsea Metro I GustoMSC P10000 10,000 $668 2Q11 Hyundai Heavy Korea 2011 --37 Metrostar Odfjell Drilling Deepsea Metro II GustoMSC P10000 10,000 $668 4Q11 Hyundai Heavy Korea 2011 --38 NIOC COSL Iran Alborz GVA4000 3,281 $270 1Q09 Sadra Iran 2009 Caspian Oil/NOIC39 Noble Corp. Noble Corp. Noble Danny Adkins Bingo 9000 12,000 $500 1Q09 Jurong Sing. 2009 Shell40 Noble Corp. Noble Corp. Noble Jim Day Bingo 9000 12,000 $550 4Q09 Jurong Sing. 2009 Marathon41 Noble Corp. Noble Corp. Unnamed Huisman Globetrotter 10,000 $585 4Q11 Dalian China 2011 --42 Odebrecht Odebrecht Norbe VI GustoMSC TDS-2000Plus 7,874 -- 1Q10 IMAC Abu Dhabi 2010 Petrobras43 Odebrecht Odebrecht Norbe VIII ---- 10,000 $690 4Q11 Daewoo Korea 2011 Petrobras44 Odebrecht Odebrecht Norbe IX ---- 10,000 $690 4Q11 Daewoo Korea 2011 Petrobras45 Odfjell Drilling Odfjell Drilling Deepsea Stavanger GVA 7500-N-E 10,000 $674 3Q10 Daewoo Korea 2010 --46 Petrobras Petrobras Unnamed Samsung Heavy Industries 10,000 $616 2Q10 Samsung Heavy Korea 2010 Petrobras47 Petromena Larsen Oil & Gas PetroRig IV F&G Ex-D 10,000 $640 2Q11 Jurong Sing. 2011 --48 Petromena Larsen Oil & Gas PetroRig III F&G Ex-D 10,000 $620 1Q10 Jurong Sing. 2010 PEMEX49 Petromena Larsen Oil & Gas PetroRig II F&G Ex-D 10,000 $553 4Q09 Jurong Sing. 2009 Petrobras50 Petromena Larsen Oil & Gas PetroRig I F&G Ex-D 10,000 $535 1Q09 Jurong Sing. 2009 Petrobras51 Petroserv Petroserv SSV Victoria GVA 7500-N 7,874 $485 2Q09 Daewoo Korea 2009 Petrobras52 Petroserv Petroserv Unnamed ---- 10,000 $755 2Q11 Daewoo Korea 2011 Petrobras53 Pride International/Pacific Pride International Unnamed Saipem 1000 (Harsh) 10,000 $730 1Q10 Samsung Heavy Korea 2010 BP54 Pride International Pride International Unnamed Samsung Heavy Industries 12,000 $725 3Q10 Samsung Heavy Korea 2010 BP55 Pride International Pride International Unnamed Samsung Heavy Industries 12,000 $720 2Q11 Samsung Heavy Korea 2011 Petrobras56 Pride International Pride International Unnamed Samsung Heavy Industries 12,000 $745 4Q11 Samsung Heavy Korea 2011 --57 Queiroz Galvao Queiroz Galvao Lone Star GustoMSC TDS-2000Plus 7,874 $480 2Q09 IMAC Abu Dhabi 2009 Petrobras58 Queiroz Galvao Queiroz Galvao Gold Star KFELS/MSC DSS 38 9,000 -- 4Q09 Keppel FELS Sing. 2009 Petrobras59 Queiroz Galvao Queiroz Galvao Alpha Star KFELS/MSC DSS 38 9,000 -- 3Q11 Keppel FELS Sing. 2011 Petrobras60 Saipem Saipem Scarabeo 8 Moss Maritime CS-50 MkII (N) 9,843 $615 1Q10 Fincantieri Italy 2010 Eni61 Saipem Saipem Saipem 12000 Samsung/Saipem 12,000 12,000 $660 1Q10 Samsung Heavy Korea 2010 Total62 Saipem Saipem Scarabeo 9 D90 DRR DP3 12,000 $533 3Q09 Yantai Raffles China 2009 Eni63 Schahin Schahin Schahin III Friede & Goldman ExD 7,875 -- 3Q09 Yantai Raffles China 2009 Petrobras64 Schahin Schahin Schahin I Friede & Goldman ExD 6,560 -- 1Q10 Yantai Raffles China 2010 Petrobras65 Schahin Schahin Unnamed ---- 10,000 $682 3Q11 Samsung Heavy Korea 2011 Petrobras66 Schahin Schahin Unnamed ---- 10,000 -- 4Q12 Samsung Heavy Korea 2012 Petrobras67 Scorpion Offshore Scorpion Offshore Unnamed KFELS/MSC DSS 38 7,874 $714 2Q12 Keppel FELS Sing. 2012 Petrobras68 SeaDragon Offshore SeaDragon Offshore Oban B Moss CS50 6G 10,000 $510 4Q09 Haverton/Severodvinsk Russia 2009 PEMEX69 SeaDragon Offshore SeaDragon Offshore SDO II Moss CS50 6G 10,000 $510 4Q10 Haverton/Vyborg Russia 2010 --70 SeaDrill SeaDrill West Aquarius GVA 7500-N (Harsh) 7,500 $526 1Q09 Daewoo Korea 2009 ExxonMobil71 SeaDrill SeaDrill West Orion Friede & Goldman ExD 10,000 $625 2Q10 Jurong Sing. 2010 Petrobras72 SeaDrill SeaDrill West Gemini Samsung/Saipem 10,000 10,000 $615 3Q10 Samsung Heavy Korea 2010 --73 SeaDrill SeaDrill West Capricorn Friede & Goldman ExD 10,000 $640 4Q11 Jurong Sing 2011 --74 Sevan Sevan Sevan Driller SSP Drilling Unit 7,874 $500 1Q09 Hantong China 2009 Petrobras75 Sevan Sevan Sevan Brasil Sevan Drilling Sevan 650 7,874 -- 4Q11 COSCO China 2011 Petrobras76 Sevan Sevan Sevan Driller 2 Sevan Drilling Sevan 650 10,000 -- 1Q11 COSCO China 2011 ONGC77 Stena Stena Stena Forth Stena/Samsung (Harsh) 7,500 $760 3Q09 Samsung Heavy Korea 2009 Hess78 Stena Stena Stena DrillMAX IV Stena/Samsung (Harsh) 10,000 $1,150 4Q11 Samsung Heavy Korea 2011 --79 Tanker Pacific Pacific Drilling Unnamed Samsung Heavy Industries 10,000 $632 4Q10 Samsung Heavy Korea 2010 --80 Tanker Pacific Pacific Drilling Unnamed Samsung Heavy Industries 10,000 $632 2Q11 Samsung Heavy Korea 2011 --81 Tanker Pacific Pacific Drilling Unnamed Samsung Heavy Industries 10,000 $650 3Q11 Samsung Heavy Korea 2011 --82 Tanker Pacific Pacific Drilling Unnamed Samsung Heavy Industries 10,000 $650 3Q11 Samsung Heavy Korea 2011 --83 TMT/Mandarin TMT/Mandarin Unnamed Daewoo Shipbuilding & Marine 12,000 $782 3Q11 Daewoo Korea 2011 --84 TMT/Mandarin TMT/Mandarin Unnamed Daewoo Shipbuilding & Marine 10,000 $672 1Q12 Daewoo Korea 2012 --85 Transocean Transocean Discoverer Clear Leader Enterprise-Class 12,000 $650 1Q09 Daewoo Korea 2009 Chevron86 Transocean Transocean Discoverer Americas Enterprise-Class 12,000 $615 2Q09 Daewoo Korea 2009 Norsk Hydro87 Transocean Transocean Discoverer Inspiration Enterprise-Class 12,000 $670 4Q09 Daewoo Korea 2009 Chevron88 Transocean Transocean Discoverer Luanda Daewoo Shipbuilding & Marine 7,500 $670 1Q10 Daewoo Korea 2010 British Petroleum89 Transocean Transocean Dhirubhai Deepwater KG1 Samsung/Saipem 10,000 12,000 $600 1Q09 Samsung Heavy Korea 2009 Reliance90 Transocean Transocean Dhirubhai Deepwater KG2 Samsung/Saipem 10,000 10,000 $550 4Q09 Samsung Heavy Korea 2009 Reliance91 Transocean Transocean GSF DD III DSS 51 7,500 $590 1Q09 Keppel FELS Sing. 2009 British Petroleum92 Transocean Transocean Transocean HHI Drsh GustoMSC P10,000 (Harsh) 10,000 $740 3Q10 Hyundai Heavy Korea 2010 ExxonMobil93 Transocean Transocean Unnamed Enterprise-Class 10,000 $730 4Q10 Daewoo Korea 2010 Reliance94 Transocean Transocean Petrobras 10000 Samsung Heavy Industries 10,000 $750 3Q09 Samsung Heavy Korea 2009 Petrobras95 Vantage Energy Vantage Energy Platinum Explorer Daewoo Shipbuilding & Marine 12,000 $761 4Q10 Daewoo Korea 2010 --
Source: Company data, ODS-Petrodata, Morgan Stanley Research

25
M O R G A N S T A N L E Y R E S E A R C H
January 5, 2009 Oil Services, Drilling & Equipment
Performance Review Exhibit 72 Segment and Index Performance
Last Last
Week Month 2009 2008 2007 2006
Logistics 17.9% 21.6% 3.2% -42.8% 22.1% 15.4%
Land Drillers 12.5% 3.2% 5.4% -45.7% -4.4% -23.1%
Equipment 12.2% 16.7% 6.7% -58.0% 54.2% 43.4%
Offshore Drillers 14.9% 5.9% 8.7% -63.2% 36.9% 20.3%
Services 18.6% 22.6% 8.6% -64.6% 28.5% 9.9%
Offshore Construction 13.1% 21.5% 8.7% -72.1% 45.0% 42.7%
Seismic 16.7% 13.0% 8.6% -73.4% 33.4% 81.5%
Henry Hub (Gas) -2.9% -10.9% 0.0% -24.4% 18.8% -43.9%
XNG 10.0% 4.9% 5.2% -34.5% 29.6% 11.2%
XOI 9.7% 14.2% 4.1% -37.2% 31.3% 20.4%
S&P 500 6.8% 7.0% 3.2% -38.5% 3.5% 13.6%
WTI (Oil) 18.3% -4.7% 0.0% -53.5% 57.2% 0.0%
OSX 14.5% 13.4% 7.6% -59.8% 50.9% 9.8% Source: Company data, Morgan Stanley Research
Exhibit 73 Relative Performance of the OSX to S&P 500 (52-wk)
50
60
70
80
90
100
110
120
130
140
01/08 02/08 03/08 04/08 05/08 06/08 07/08 08/08 09/08 10/08 11/08 12/08
Source: FactSet; Morgan Stanley Research
Exhibit 74 Stock Performance in 2009 (YTD)
GMRNAT
S&P 500SPM-MILNASDAQGTLS
OIIFROTS
OSGHEROFTIBJSVK-PARESVWG-LONHALBHIDOSBMO-AMSDRQNESDRL-OSLOSXCAMWFTSLB
ACY-OSLSUB-OSLRDCHLXDRCTEC-PARPGS-OSLPTENSIIGA-PARNOVTKPDERIGIO
NBRATWSEVAN-OSL
-5% 0% 5% 10% 15% 20%
Source: FactSet; Morgan Stanley Research. Graph is for total return for period.
Exhibit 75 Component Contribution to Overall Performance of the OSX Last Week
GLBLBJS RDC HAL NE WFT CAM NBR OII
SII TDW NOVBHI
SLB
RIG
0.0%
0.5%
1.0%
1.5%
2.0%
2.5%
3.0%
Source: FactSet; Morgan Stanley Research

26
M O R G A N S T A N L E Y R E S E A R C H
January 5, 2009 Oil Services, Drilling & Equipment
Exhibit 76 Global Coverage Universe (US$) Performance Review
Price 52-wk 52-wk % Below % Above Last Last LastCompany USD High Low 52W-HI 52W-LO Week 4-Wks 3-Mos 2008 2009Oil Services:
BJ Services 12.43 34.94 8.34 -64.4% 49.0% 16.0% 34.8% -24.6% -51.9% 6.5%Halliburton 19.45 55.38 12.80 -64.9% 52.0% 12.8% 41.1% -27.0% -52.0% 7.0%Schlumberger 45.62 111.95 37.07 -59.3% 23.1% 15.6% 14.0% -36.8% -57.0% 7.8%Baker Hughes 34.33 90.81 24.40 -62.2% 40.7% 15.9% 31.9% -30.1% -60.5% 7.0%Weatherford 11.66 49.98 7.75 -76.7% 50.5% 21.7% 34.3% -41.7% -68.5% 7.8%Smith International 25.03 88.40 18.23 -71.7% 37.3% 15.0% 26.9% -50.7% -69.0% 9.3%
Offshore Drillers:ENSCO International 30.33 83.24 22.38 -63.6% 35.5% 10.4% 21.9% -40.1% -52.4% 6.8%Pride International 17.58 48.86 11.38 -64.0% 54.5% 17.4% 39.1% -29.7% -52.9% 10.0%Diamond Offshore 63.12 147.77 54.52 -57.3% 15.8% 9.1% 6.5% -31.1% -58.5% 7.1%Rowan Companies 17.25 47.94 12.00 -64.0% 43.8% 13.4% 26.0% -32.2% -59.7% 8.5%Noble Corporation 23.75 68.99 19.23 -65.6% 23.5% 10.6% 13.6% -36.6% -60.9% 7.5%Transocean 52.01 163.00 41.95 -68.1% 24.0% 17.7% 8.4% -45.1% -67.0% 10.1%Seadrill Limited 8.46 36.57 5.64 -76.9% 50.0% 22.1% 23.0% -50.3% -67.8% 7.5%Atwood Oceanics 17.52 63.46 12.60 -72.4% 39.0% 24.2% 19.6% -42.6% -69.5% 14.7%Hercules Offshore 5.04 39.47 3.06 -87.2% 64.7% 9.1% 10.5% -55.4% -80.0% 6.1%
Land Drillers:Patterson-UTI 12.58 37.45 8.64 -66.4% 45.6% 16.2% 34.7% -20.3% -41.0% 9.3%Nabors Industries 13.27 50.58 9.72 -73.8% 36.5% 22.3% 21.3% -37.4% -56.3% 10.9%
Equipment:Tenaris S.A. 22.02 75.43 15.32 -70.8% 43.7% 8.5% 14.5% -31.8% -53.1% 5.0%Dresser-Rand 18.77 42.49 11.70 -55.8% 60.4% 14.9% 23.9% -32.3% -55.8% 8.8%Oceaneering International 30.34 82.49 18.05 -63.2% 68.1% 9.9% 53.7% -26.0% -56.7% 4.1%Cameron International 22.07 58.53 16.15 -62.3% 36.7% 13.0% 27.9% -29.3% -57.4% 7.7%FMC Technologies 25.32 78.96 20.27 -67.9% 24.9% 11.5% 12.5% -37.5% -58.0% 6.3%Vallourec 120.29 353.63 80.29 -66.0% 49.8% 9.5% 18.6% -35.0% -58.4% 6.8%Dril Quip 22.03 65.36 14.15 -66.3% 55.7% 21.5% 28.0% -38.7% -63.2% 7.4%Chart Industries 11.02 55.73 6.42 -80.2% 71.7% 0.1% 34.2% -53.3% -65.6% 3.7%National Oilwell Varco 26.83 92.70 17.60 -71.1% 52.4% 15.8% 35.8% -35.0% -66.7% 9.8%
Engineering & Construction:SBM Offshore 13.93 42.07 12.16 -66.9% 14.6% 10.5% 2.6% -30.4% -58.8% 7.2%Saipem 16.99 48.69 12.51 -65.1% 35.7% 3.1% 22.1% -35.7% -59.0% 3.4%Technip 33.08 99.49 20.95 -66.8% 57.9% 17.7% 34.2% -35.1% -62.0% 9.1%Wood Group 2.89 10.03 2.26 -71.1% 28.2% 4.9% 6.4% -49.4% -68.6% 6.9%Subsea 7 6.27 30.56 4.60 -79.5% 36.1% 16.8% 7.8% -48.2% -74.2% 8.3%Acergy 6.03 28.53 3.49 -78.9% 72.8% 17.1% 17.9% -33.3% -75.1% 8.3%Helix Energy Solutions 7.86 42.83 3.91 -81.6% 101.0% 23.6% 51.2% -61.2% -82.6% 8.6%Sevan Marine 1.21 17.83 0.89 -93.2% 37.0% -0.3% -0.5% -53.8% -93.0% 14.9%
Reservoir Information / Seismic:CGG Veritas 16.14 59.10 10.56 -72.7% 52.9% 15.3% 18.0% -40.5% -74.2% 9.6%ION Geophysical 3.78 18.26 2.14 -79.3% 76.6% 26.0% 35.0% -68.0% -78.3% 10.2%Petroleum Geo-Services 4.31 32.63 2.84 -86.8% 51.9% 20.6% 25.2% -62.9% -86.4% 9.2%
Energy Shipping:Nordic American Tankers 34.39 42.00 22.00 -18.1% 56.3% 2.5% 15.8% 22.3% 2.8% 1.9%Frontline 31.02 72.36 25.00 -57.1% 24.1% 6.1% 18.3% -24.8% -38.3% 4.8%General Maritime 10.76 23.13 6.60 -53.5% 63.1% 8.5% 18.4% -9.0% -40.8% -0.4%Overseas Shipholding 44.63 87.79 28.29 -49.2% 57.8% 14.7% 31.9% -12.6% -43.4% 6.0%Teekay 21.58 54.71 10.95 -60.6% 97.1% 35.4% 54.1% -3.6% -63.1% 9.8%
Indices:XNG 395.0 776.1 300.8 -49.1% 31.3% 10.0% 17.3% -13.5% -34.5% 5.2%XOI 1,019.8 1,664.0 744.6 -38.7% 37.0% 9.7% 20.9% -3.7% -37.2% 4.1%S&P 500 931.8 1,471.8 741.0 -36.7% 25.7% 6.8% 10.2% -15.2% -38.5% 3.2%NASDAQ 1,632.2 2,661.5 1,295.5 -38.7% 26.0% 6.7% 12.9% -16.2% -40.5% 3.5%OSX 130.7 364.3 97.2 -64.1% 34.5% 14.5% 25.5% -35.0% -59.8% 7.6%
Source: FactSet; Morgan Stanley Research

27
M O R G A N S T A N L E Y R E S E A R C H
January 5, 2009 Oil Services, Drilling & Equipment
Valuation Methodologies and Investment RisksThe valuation methodologies we use vary as the earnings cycle develops. At the (perceived) trough, we essentially want to answer the question, “how low could it go?” We favor an investment approach that has a bias towards value at this point, not momentum. We assess where the risk/reward is decidedly more attractive for accumulating longer-term positions using normalized earnings, price-to-book, price-to-sales, and for the offshore drillers, net asset value. We often concentrate more on the offshore drillers at this point of the cycle given the tangible asset valuation that is obtainable versus the uncertainties in earnings. Such a value approach however does carry the risk of being early.
As the earnings cycle begins to turn up, we use a two year forward earnings multiple, as well as a 12-month forward rolling multiple, price-to-book, price-to-sales, and a peak earnings analysis. The peak earnings analysis offers insight into what the stock could be worth once the EPS revision phase of the cycle really kicks in. For the offshore drillers, we continue to use a net asset value assessment, but also use an EV/EBITDA multiple, CEPS (cash EPS is equal to net income + depreciation and amortization + convertible interest (where applicable) and peak earnings.
Our two year forward earnings multiples are based upon prior cycle ranges (see “Trading and Valuation Summary” in this report). The average multiples achieved at the equity peaks of the previous two cycles were 19−23x with a range of 18−33x. The North American natural gas levered stocks typically achieve the higher-end of this range in the early stages of the cycle as the discounting mechanism is rather substantial in these stocks. The later cycle stocks typically include the equipment names, particularly subsea.
As the earnings cycle matures, momentum often overtakes value as the market digests an onslaught of upward earnings revisions. While the net asset value assessment for offshore drillers is still useful, it becomes more of a reality check. At this stage, the two year forward consensus earnings begin to narrow the gap with peak earnings assumptions, and a two-year forward multiple is placed on these “best case” pricing and utilization scenarios for the services and equipment.
Net Asset Value (NAV) is one of the more useful exercises in terms of identifying support levels for the asset intensive offshore drilling stocks. Depending on the mix of assets, a typical price/NAV support level has been 70−100%, while the upside is near two times NAV. The variance in the multiples on
net asset value is largely a function of the fleet composition. Today the horsepower is in the deepwater, whereas in prior years, a bias toward jackups yielded a wider trading range. We calculate a NAV/share by applying a vendor published second-hand market value to each rig within a company’s fleet, then grossing up to a fleet market value plus other assets, then adjusting for debt.
Investment Risks The Oil Services and Equipment industry is one of the most volatile and unpredictable industries in the “old economy.” The main investment risk is the overall health of the global economy, although with particular interim risk exposure to the fiscal and geopolitical uncertainties in areas including, but not limited to the Middle East, Latin America, Russia, Southeast Asia, and West Africa. In North America, E&P spending is highly susceptible to changes in oil and natural gas prices, more so in the short-run than any other region due to the dominance of the spot market and independents.
Main Investment Risks include: The health of the global economy and its impact on the
global demand for oil and natural gas.
Merger and acquisition activity among operators typically has a negative impact on spending budgets.
Capacity expansion in long-lived assets such as marine seismic, pressure pumping equipment, and drilling rigs, particularly speculative newbuilding.
Changes in fiscal terms (taxes) on oil and natural gas production in the major drilling basins including, but not limited to the Gulf of Mexico, Venezuela, Mexico, Brazil, Argentina, North Sea, West Africa, Southeast Asia, Russia, and the Middle East.
Adoption of new technology is often slow in the oilfield. There is meaningful risk to companies whose success is predominantly dependent upon a single new technology and the acceptance of that technology.

28
M O R G A N S T A N L E Y R E S E A R C H
January 5, 2009 Oil Services, Drilling & Equipment
Exhibit 77 Oil Service: Price Target Methodology and Risks Ticker Price Target MethodologyOil ServiceSLB Based on 21.5x 2010E EPS or 77% historical 12-month forward average
of 28x. Multiple compression due to risks on sustainability of commodity price cycle which would result in lower oil demand and drilling activity.
HAL Based on 16.3x 2010E EPS or 82% historical 12-month forward average of 20x. Multiple compression due to risks of additional pressure pumping capacity leading to pricing pressure in the North American market.
BHI Based on 13.6x 2010E EPS or 57% historical 12-month forward average of 24x. Multiple compression due to lingering execution risks related to capacity additions in international markets.
WFT Based on 17.6x 2010E EPS or 53% historical 12-month forward average of 33x. Multiple compression due to execution risks related to international expansion and large percentage of revenue exposure to the North American market
BJS Based on 13.3x 2010E EPS or 70% historical 12-month forward average of 19x. Multiple compression due to risks of additional pressure pumping capacity leading to pricing pressure in the North American market.
SII Based on 14.1x 2010E EPS or 61% historical 12-month forward average of 23x. Multiple compression due to risks related to delays in the offshore newbuilding cycle which could delay the company's organic growth profile in 2008 and beyond.
Source: Company data, Morgan Stanley Research
Exhibit 78 Oil Service Equipment: Price Target Methodology and Risks Ticker Price Target MethodologyEquipmentTS Based on 12.5x 2010E EPS, roughly a 20% discount to US equipment
names CAM (13.9x) and DRQ (16.9x). Risks include integration of recent acquisition of Maverick and Hydril as well as potential capacity additions of seamless OCTG.
NOV Based on 14.0x 2010E EPS or 45% historical 12-month forward average of 31x. Multiple compression due to risks of a slowdown in rig construction as the cycle matures.
CAM Based on 14.3x 2010E EPS or 42% historical 12-month forward average of 34x. Multiple compression due to integration of Dresser Flow Control.
FTI Based on 15.2x 2010E EPS or 76% historical 12-month forward average of 20x. Multiple compression due to risks associated with supply chain management and ability to execute on record backlog.
DRC Based on 15.3x 2010E EPS or 90% historical 12-month forward average of 17x. Execution risks associated with back-end loaded year-end results and competition in compressors from GE and Seimens.
DRQ Based on 15.7x 2010E EPS or 65% historical 12-month forward average of 24x. Multiple compression due to risks associated with the introduction of new technologies including liner hangers and fully integrated subsea systems.
OII Based on 13.8x 2010E EPS or 86% historical 12-month forward average of 16x. Multiple compression due to risks associated with cancellations and delays of deepwater floater newbuilds.
GTLS Based on 11.2x 2010E EPS, roughly a 20-30% discount to the production-oriented equipment peers (CAM, FTI, DRQ). Risks include the company’s exposure to the industrial gas market, delays in sanctioning planned large-scale LNG projects and execution risks.
Source: Company data, Morgan Stanley Research
Exhibit 79 Offshore and Land Drillers: Price Target Methodology and Risks Ticker Price Target MethodologyOffshore DrillersRIG Based on 8.3x 2010E EPS or 55% historical 12-month forward average of
15x. Multiple compression due to oversupply concerns based on the current newbuilding cycle.
NE Based on 8.3x 2010E EPS or 31% historical 12-month forward average of 27x. Multiple compression due to oversupply concerns based on the current newbuilding cycle.
DO Based on DO adopting a relatively full quarterly payout policy, with shares re-rating to a 7% dividend yield.
ESV Based on 8.2x 2010E EPS or 48% historical 12-month forward average of 17x. Multiple compression due to oversupply concerns based on the current newbuilding cycle.
PDE Based on 8.9x 2010E EPS or 46% historical 12-month forward average of 19x. Multiple compression due to oversupply concerns based on the current newbuilding cycle and execution on restructuring efforts.
RDC Based on 8.4x 2010E EPS or 42% historical 12-month forward average of 20x. Multiple compression due to oversupply concerns based on the current newbuilding cycle.
HERO Based on 17.0x 2010E EPS, above industry peers, due to greater post-trough growth potential. Risks include continued weakness in North American natural gas prices that will depress demand for jackups in the Gulf of Mexico as well as a political or economic disruption that may reduce liftboat activity in West Africa.
ATW Based on 7.8x 2010E EPS or 46% historical 12-month forward average of 17x. Multiple compression due to oversupply concerns based on the current newbuilding cycle.
Land DrillersNBR Based on 15.9x 2010E EPS or 83% historical 12-month forward average
of 19x. Multiple compression due to high leading edge dayrates and oversupply concerns on rig capacity additions in North America.
PTEN Based on 42.4x 2010E EPS or 236% historical 12-month forward average of 18x, and in line with historical trough earnings multiples.
Source: Company data, Morgan Stanley Research.

29
M O R G A N S T A N L E Y R E S E A R C H
January 5, 2009 Oil Services, Drilling & Equipment
Disclosure Section The information and opinions in Morgan Stanley Research were prepared by Morgan Stanley & Co. Incorporated, and/or Morgan Stanley C.T.V.M. S.A. and their affiliates (collectively, "Morgan Stanley"). For important disclosures, stock price charts and rating histories regarding companies that are the subject of this report, please see the Morgan Stanley Research Disclosure Website at www.morganstanley.com/researchdisclosures, or contact your investment representative or Morgan Stanley Research at 1585 Broadway, (Attention: Equity Research Management), New York, NY, 10036 USA. Analyst Certification The following analysts hereby certify that their views about the companies and their securities discussed in this report are accurately expressed and that they have not received and will not receive direct or indirect compensation in exchange for expressing specific recommendations or views in this report: Ole Slorer. Unless otherwise stated, the individuals listed on the cover page of this report are research analysts. Global Research Conflict Management Policy Morgan Stanley Research has been published in accordance with our conflict management policy, which is available at www.morganstanley.com/institutional/research/conflictpolicies. Important US Regulatory Disclosures on Subject Companies The following analyst, strategist, or research associate (or a household member) owns securities (or related derivatives) in a company that he or she covers or recommends in Morgan Stanley Research: Paulo Loureiro - Baker Hughes (common stock). Morgan Stanley policy prohibits research analysts, strategists and research associates from investing in securities in their sub industry as defined by the Global Industry Classification Standard ("GICS," which was developed by and is the exclusive property of MSCI and S&P). Analysts may nevertheless own such securities to the extent acquired under a prior policy or in a merger, fund distribution or other involuntary acquisition. As of November 28, 2008, Morgan Stanley beneficially owned 1% or more of a class of common equity securities of the following companies covered in Morgan Stanley Research: BJ Services, Cameron International, Chart Industries, ENSCO, Halliburton Co., Helix Energy Solutions, Nabors Industries Inc., Rowan Companies, Weatherford International. As of November 28, 2008, Morgan Stanley held a net long or short position of US$1 million or more of the debt securities of the following issuers covered in Morgan Stanley Research (including where guarantor of the securities): Baker Hughes, Cameron International, Chart Industries, Diamond Offshore, Dresser-Rand, Halliburton Co., Nabors Industries Inc., Noble Corporation, Pride International Inc., Schlumberger, Smith International Inc., Transocean, Weatherford International. Within the last 12 months, Morgan Stanley managed or co-managed a public offering of securities of Baker Hughes, Cameron International, Halliburton Co.. Within the last 12 months, Morgan Stanley has received compensation for investment banking services from Baker Hughes, Cameron International, Chart Industries, Dresser-Rand, Dril Quip Inc., FMC Technologies, Halliburton Co., Oilexco Inc., Rowan Companies, Schlumberger, Transocean, Weatherford International. In the next 3 months, Morgan Stanley expects to receive or intends to seek compensation for investment banking services from Baker Hughes, BJ Services, Cameron International, Chart Industries, Diamond Offshore, Dresser-Rand, ENSCO, FMC Technologies, Halliburton Co., Hercules Offshore, Noble Corporation, Oilexco Inc., Pride International Inc., Rowan Companies, Schlumberger, Smith International Inc., Tenaris S.A, Transocean, Weatherford International. Within the last 12 months, Morgan Stanley & Co. Incorporated has received compensation for products and services other than investment banking services from Dril Quip Inc., Transocean. Within the last 12 months, Morgan Stanley has provided or is providing investment banking services to, or has an investment banking client relationship with, the following company: Baker Hughes, BJ Services, Cameron International, Chart Industries, Diamond Offshore, Dresser-Rand, Dril Quip Inc., ENSCO, FMC Technologies, Halliburton Co., Hercules Offshore, Noble Corporation, Oilexco Inc., Pride International Inc., Rowan Companies, Schlumberger, Smith International Inc., Tenaris S.A, Transocean, Weatherford International. Within the last 12 months, Morgan Stanley has either provided or is providing non-investment banking, securities-related services to and/or in the past has entered into an agreement to provide services or has a client relationship with the following company: Baker Hughes, Cameron International, Dril Quip Inc., FMC Technologies, Halliburton Co., Helix Energy Solutions, Nabors Industries Inc., National Oilwell Varco, Schlumberger, Tenaris S.A, Transocean, Weatherford International. The research analysts, strategists, or research associates principally responsible for the preparation of Morgan Stanley Research have received compensation based upon various factors, including quality of research, investor client feedback, stock picking, competitive factors, firm revenues and overall investment banking revenues. An employee or director of Morgan Stanley is a director of Schlumberger. Morgan Stanley & Co. Incorporated makes a market in the securities of Baker Hughes, BJ Services, Chart Industries, ENSCO, Halliburton Co., Hercules Offshore, Nabors Industries Inc., National Oilwell Varco, Noble Corporation, Patterson-UTI Energy, Rowan Companies, Schlumberger, Smith International Inc., Transocean, Weatherford International. Certain disclosures listed above are also for compliance with applicable regulations in non-US jurisdictions. STOCK RATINGS Morgan Stanley uses a relative rating system using terms such as Overweight, Equal-weight, Not-Rated or Underweight (see definitions below). Morgan Stanley does not assign ratings of Buy, Hold or Sell to the stocks we cover. Overweight, Equal-weight, Not-Rated and Underweight are not the equivalent of buy, hold and sell. Investors should carefully read the definitions of all ratings used in Morgan Stanley Research. In addition, since Morgan Stanley Research contains more complete information concerning the analyst's views, investors should carefully read Morgan Stanley Research, in its entirety, and not infer the contents from the rating alone. In any case, ratings (or research) should not be used or relied upon as investment advice. An investor's decision to buy or sell a stock should depend on individual circumstances (such as the investor's existing holdings) and other considerations. Global Stock Ratings Distribution (as of December 31, 2008) For disclosure purposes only (in accordance with NASD and NYSE requirements), we include the category headings of Buy, Hold, and Sell alongside our ratings of Overweight, Equal-weight, Not-Rated and Underweight. Morgan Stanley does not assign ratings of Buy, Hold or Sell to the stocks we cover. Overweight, Equal-weight, Not-Rated and Underweight are not the equivalent of buy, hold, and sell but represent recommended relative weightings (see definitions below). To satisfy regulatory requirements, we correspond Overweight, our most positive stock rating, with a buy recommendation; we correspond Equal-weight and Not-Rated to hold and Underweight to sell recommendations, respectively.

30
M O R G A N S T A N L E Y R E S E A R C H
January 5, 2009 Oil Services, Drilling & Equipment
Coverage Universe Investment Banking Clients (IBC)
Stock Rating Category Count % of Total Count
% of Total IBC
% of Rating Category
Overweight/Buy 811 34% 240 40% 30%Equal-weight/Hold 1060 45% 271 45% 26%Not-Rated/Hold 33 1.4% 8 1.3% 24.2%Underweight/Sell 463 20% 87 14% 19%Total 2,367 606 Data include common stock and ADRs currently assigned ratings. An investor's decision to buy or sell a stock should depend on individual circumstances (such as the investor's existing holdings) and other considerations. Investment Banking Clients are companies from whom Morgan Stanley or an affiliate received investment banking compensation in the last 12 months. Analyst Stock Ratings Overweight (O). The stock's total return is expected to exceed the average total return of the analyst's industry (or industry team's) coverage universe, on a risk-adjusted basis, over the next 12-18 months. Equal-weight (E). The stock's total return is expected to be in line with the average total return of the analyst's industry (or industry team's) coverage universe, on a risk-adjusted basis, over the next 12-18 months. Not-Rated/Hold (NA or NAV). Currently the analyst does not have adequate conviction about the stock's total return relative to the average total return of the analyst's industry (or industry team's) coverage universe, on a risk-adjusted basis, over the next 12-18 months. Please note that NA or NAV may also be used to designate stocks where a rating is not currently available for policy reasons. For the current list of Not-Rated/Hold stocks as counted above in the Global Stock Ratings Distribution Table, please email [email protected]. Underweight (U). The stock's total return is expected to be below the average total return of the analyst's industry (or industry team's) coverage universe, on a risk-adjusted basis, over the next 12-18 months. Unless otherwise specified, the time frame for price targets included in Morgan Stanley Research is 12 to 18 months. Analyst Industry Views Attractive (A): The analyst expects the performance of his or her industry coverage universe over the next 12-18 months to be attractive vs. the relevant broad market benchmark, as indicated below. In-Line (I): The analyst expects the performance of his or her industry coverage universe over the next 12-18 months to be in line with the relevant broad market benchmark, as indicated below. Cautious (C): The analyst views the performance of his or her industry coverage universe over the next 12-18 months with caution vs. the relevant broad market benchmark, as indicated below. Benchmarks for each region are as follows: North America - S&P 500; Latin America - relevant MSCI country index or MSCI Latin America Index; Europe - MSCI Europe; Japan - TOPIX; Asia - relevant MSCI country index. . Other Important Disclosures Morgan Stanley produces a research product called a "Tactical Idea." Views contained in a "Tactical Idea" on a particular stock may be contrary to the recommendations or views expressed in this or other research on the same stock. This may be the result of differing time horizons, methodologies, market events, or other factors. For all research available on a particular stock, please contact your sales representative or go to Client Link at www.morganstanley.com. For a discussion, if applicable, of the valuation methods used to determine the price targets included in this summary and the risks related to achieving these targets, please refer to the latest relevant published research on these stocks. Morgan Stanley Research does not provide individually tailored investment advice. Morgan Stanley Research has been prepared without regard to the individual financial circumstances and objectives of persons who receive it. The securities/instruments discussed in Morgan Stanley Research may not be suitable for all investors. Morgan Stanley recommends that investors independently evaluate particular investments and strategies, and encourages investors to seek the advice of a financial adviser. The appropriateness of a particular investment or strategy will depend on an investor's individual circumstances and objectives. The securities, instruments, or strategies discussed in Morgan Stanley Research may not be suitable for all investors, and certain investors may not be eligible to purchase or participate in some or all of them. Morgan Stanley Research is not an offer to buy or sell or the solicitation of an offer to buy or sell any security/instrument or to participate in any particular trading strategy. The "Important US Regulatory Disclosures on Subject Companies" section in Morgan Stanley Research lists all companies mentioned where Morgan Stanley owns 1% or more of a class of common securities of the companies. For all other companies mentioned in Morgan Stanley Research, Morgan Stanley may have an investment of less than 1% in securities or derivatives of securities of companies and may trade them in ways different from those discussed in Morgan Stanley Research. Employees of Morgan Stanley not involved in the preparation of Morgan Stanley Research may have investments in securities or derivatives of securities of companies mentioned and may trade them in ways different from those discussed in Morgan Stanley Research. Derivatives may be issued by Morgan Stanley or associated persons Morgan Stanley and its affiliate companies do business that relates to companies/instruments covered in Morgan Stanley Research, including market making and specialized trading, risk arbitrage and other proprietary trading, fund management, commercial banking, extension of credit, investment services and investment banking. Morgan Stanley sells to and buys from customers the securities/instruments of companies covered in Morgan Stanley Research on a principal basis. With the exception of information regarding Morgan Stanley, research prepared by Morgan Stanley Research personnel are based on public information. Morgan Stanley makes every effort to use reliable, comprehensive information, but we make no representation that it is accurate or complete. We have no obligation to tell you when opinions or information in Morgan Stanley Research change apart from when we intend to discontinue research coverage of a subject company. Facts and views presented in Morgan Stanley Research have not been reviewed by, and may not reflect information known to, professionals in other Morgan Stanley business areas, including investment banking personnel. Morgan Stanley Research personnel conduct site visits from time to time but are prohibited from accepting payment or reimbursement by the company of travel expenses for such visits. The value of and income from your investments may vary because of changes in interest rates or foreign exchange rates, securities prices or market indexes, operational or financial conditions of companies or other factors. There may be time limitations on the exercise of options or other rights in your securities transactions. Past performance is not necessarily a guide to future performance. Estimates of future performance are based on assumptions that may not be realized. Unless otherwise stated, the cover page provides the closing price on the primary exchange for the subject company's securities/instruments. To our readers in Taiwan: Information on securities/instruments that trade in Taiwan is distributed by Morgan Stanley Taiwan Limited ("MSTL"). Such information is for your reference only. Information on any securities/instruments issued by a company owned by the government of or incorporated in the PRC and listed in on the Stock Exchange of Hong Kong ("SEHK"), namely the H-shares, including the component company stocks of the Stock Exchange of Hong Kong ("SEHK")'s Hang Seng China Enterprise Index; or any securities/instruments issued by a company that is 30% or more directly- or indirectly-owned by the government of or a company incorporated in the PRC and traded on an exchange in Hong Kong or Macau, namely SEHK's Red Chip shares, including the component company of the SEHK's China-affiliated Corp Index is distributed only to Taiwan Securities Investment Trust Enterprises ("SITE"). The reader should independently evaluate the investment risks and is solely responsible for their investment decisions. Morgan Stanley Research may not be distributed to the public media or quoted or used by the public media without the express written consent of Morgan Stanley. Information on securities/instruments that do not trade in Taiwan is for informational purposes only and is not to be construed as a recommendation or a solicitation to trade in such securities/instruments. MSTL may not execute transactions for clients in these securities/instruments. To our readers in Hong Kong: Information is distributed in Hong Kong by and on behalf of, and is attributable to, Morgan Stanley Asia Limited as part of its regulated activities in Hong Kong. If you have any queries concerning Morgan Stanley Research, please contact our Hong Kong sales representatives.

31
M O R G A N S T A N L E Y R E S E A R C H
January 5, 2009 Oil Services, Drilling & Equipment
Morgan Stanley Research is disseminated in Japan by Morgan Stanley Japan Securities Co., Ltd.; in Hong Kong by Morgan Stanley Asia Limited (which accepts responsibility for its contents); in Singapore by Morgan Stanley Asia (Singapore) Pte. (Registration number 199206298Z) and/or Morgan Stanley Asia (Singapore) Securities Pte Ltd (Registration number 200008434H), regulated by the Monetary Authority of Singapore, which accepts responsibility for its contents; in Australia by Morgan Stanley Australia Limited A.B.N. 67 003 734 576, holder of Australian financial services licence No. 233742, which accepts responsibility for its contents; in Korea by Morgan Stanley & Co International plc, Seoul Branch; in India by Morgan Stanley India Company Private Limited; in Canada by Morgan Stanley Canada Limited, which has approved of, and has agreed to take responsibility for, the contents of Morgan Stanley Research in Canada; in Germany by Morgan Stanley Bank AG, Frankfurt am Main, regulated by Bundesanstalt fuer Finanzdienstleistungsaufsicht (BaFin); in Spain by Morgan Stanley, S.V., S.A., a Morgan Stanley group company, which is supervised by the Spanish Securities Markets Commission (CNMV) and states that Morgan Stanley Research has been written and distributed in accordance with the rules of conduct applicable to financial research as established under Spanish regulations; in the United States by Morgan Stanley & Co. Incorporated, which accepts responsibility for its contents. Morgan Stanley & Co. International plc, authorized and regulated by Financial Services Authority, disseminates in the UK research that it has prepared, and approves solely for the purposes of section 21 of the Financial Services and Markets Act 2000, research which has been prepared by any of its affiliates. Private U.K. investors should obtain the advice of their Morgan Stanley & Co. International plc representative about the investments concerned. In Australia, Morgan Stanley Research, and any access to it, is intended only for "wholesale clients" within the meaning of the Australian Corporations Act. RMB Morgan Stanley (Proprietary) Limited is a member of the JSE Limited and regulated by the Financial Services Board in South Africa. RMB Morgan Stanley (Proprietary) Limited is a joint venture owned equally by Morgan Stanley International Holdings Inc. and RMB Investment Advisory (Proprietary) Limited, which is wholly owned by FirstRand Limited. The information in Morgan Stanley Research is being communicated by Morgan Stanley & Co. International plc (DIFC Branch), regulated by the Dubai Financial Services Authority (the DFSA), and is directed at wholesale customers only, as defined by the DFSA. This research will only be made available to a wholesale customer who we are satisfied meets the regulatory criteria to be a client. The information in Morgan Stanley Research is being communicated by Morgan Stanley & Co. International plc (QFC Branch), regulated by the Qatar Financial Centre Regulatory Authority (the QFCRA), and is directed at business customers and market counterparties only and is not intended for Retail Customers as defined by the QFCRA. As required by the Capital Markets Board of Turkey, investment information, comments and recommendations stated here, are not within the scope of investment advisory activity. Investment advisory service is provided in accordance with a contract of engagement on investment advisory concluded between brokerage houses, portfolio management companies, non-deposit banks and clients. Comments and recommendations stated here rely on the individual opinions of the ones providing these comments and recommendations. These opinions may not fit to your financial status, risk and return preferences. For this reason, to make an investment decision by relying solely to this information stated here may not bring about outcomes that fit your expectations. The trademarks and service marks contained in Morgan Stanley Research are the property of their respective owners. Third-party data providers make no warranties or representations of any kind relating to the accuracy, completeness, or timeliness of the data they provide and shall not have liability for any damages of any kind relating to such data. The Global Industry Classification Standard ("GICS") was developed by and is the exclusive property of MSCI and S&P. Morgan Stanley Research, or any portion hereof may not be reprinted, sold or redistributed without the written consent of Morgan Stanley. Morgan Stanley Research is disseminated and available primarily electronically, and, in some cases, in printed form. Additional information on recommended securities/instruments is available on request.

© 2009 Morgan Stanley
M O R G A N S T A N L E Y R E S E A R C H
Industry Coverage:Oil Services, Drilling & Equipment
Company (Ticker) Rating (as of) Price (01/02/2009)
Ole Slorer Atwood Oceanics Inc (ATW.N) E (09/16/2008) $17.52BJ Services (BJS.N) E (09/25/2008) $12.43Baker Hughes (BHI.N) O (07/27/2006) $34.33Cameron International (CAM.N) E (09/25/2008) $22.07Chart Industries (GTLS.O) U (10/20/2008) $11.02Diamond Offshore (DO.N) O (10/23/2007) $63.12Dresser-Rand (DRC.N) E (09/25/2008) $18.77Dril Quip Inc. (DRQ.N) O (03/03/2008) $22.03ENSCO (ESV.N) U (11/13/2006) $30.33FMC Technologies (FTI.N) U (02/01/2008) $25.32Halliburton Co. (HAL.N) O (01/25/2008) $19.45Helix Energy Solutions (HLX.N) NA (12/14/2008) $7.86Hercules Offshore (HERO.O) O (06/12/2007) $5.04ION Geophysical (IO.N) U (02/18/2005) $3.78Nabors Industries Inc. (NBR.N) O (09/25/2008) $13.27National Oilwell Varco (NOV.N) O (09/25/2008) $26.83Noble Corporation (NE.N) E (06/26/2008) $23.75Oceaneering International Inc (OII.N)
O (09/16/2008) $30.34
Patterson-UTI Energy (PTEN.O) E (09/25/2008) $12.58Pride International Inc. (PDE.N) U (07/25/2007) $17.58Rowan Companies (RDC.N) E (01/19/2006) $17.25Schlumberger (SLB.N) O (04/21/2008) $45.62Smith International Inc. (SII.N) O (06/30/2008) $25.03Transocean (RIG.N) O (10/20/2008) $52.01Weatherford International (WFT.N) O (09/22/2003) $11.66
Stock Ratings are subject to change. Please see latest research for each company.
The Americas 1585 Broadway New York, NY 10036-8293 United States Tel: +1 (1) 212 761 4000
Europe 20 Bank Street, Canary Wharf London E14 4AD United Kingdom Tel: +44 (0) 20 7 425 8000
Japan 4-20-3 Ebisu, Shibuya-ku Tokyo 150-6008 Japan Tel: +81 (0) 3 5424 5000
Asia/Pacific 1 Austin Road West Kowloon Hong Kong Tel: +852 2848 5200