Igneous-Petrology.ppt
61
Igneous Igneous Petrology Petrology
description
presentation
Transcript of Igneous-Petrology.ppt
IgneousIgneous PetrologyPetrology

PETROGRAPHYThe description and systematic classification of rocks, aided by the microscopic examination of thin sections. PETROLOGY The study of the origin, occurrence, structure and history of rocks, much broader process/study than petrography. PETROGENESISA branch of petrology dealing with the origin and formation of rocks. Involves a combination of mineralogical, chemical and field data. Petrologic, petrographic, and petrogenetic studies can be applied to igneous, metamorphic or sedimentary rocks.

The Earth’s InteriorCrust:Oceanic crust
Thin: 10 km
Relatively uniform stratigraphy
= ophiolite suite: • Sediments• pillow basalt• sheeted dikes• more massive gabbro• ultramafic (mantle)
Continental CrustThicker: 20-90 km average ~35 km
Highly variable composition– Average ~ granodiorite

The Earth’s InteriorThe Earth’s Interior
Mantle:Mantle:Peridotite (ultramafic)Peridotite (ultramafic)
UpperUpper to 410 km (olivine to 410 km (olivine spinel) spinel) Low Velocity LayerLow Velocity Layer 60-220 km60-220 km
Transition ZoneTransition Zone as velocity increases ~ rapidlyas velocity increases ~ rapidly 660 spinel 660 spinel perovskite-type perovskite-type
SiSiIVIV Si SiVIVI
Lower MantleLower Mantle has more gradual has more gradual velocity increasevelocity increase
Figure 1-2. Major subdivisions of the Earth. Winter (2001) An Introduction to Igneous and Metamorphic Petrology. Prentice Hall.

The Earth’s InteriorThe Earth’s Interior
Core: Core: Fe-Ni metallic alloyFe-Ni metallic alloy
Outer CoreOuter Core is liquidis liquid No S-wavesNo S-waves
Inner CoreInner Core is solidis solid
Figure 1-2. Major subdivisions of the Earth. Winter (2001) An Introduction to Igneous and Metamorphic Petrology. Prentice Hall.

Figure 1-3. Variation in P and S wave velocities with depth. Compositional subdivisions of the Earth are on the left, rheological subdivisions on the right. After Kearey and Vine (1990), Global Tectonics. © Blackwell Scientific. Oxford.

NOMENCLATURE AND CLASSIFICATIONNOMENCLATURE AND CLASSIFICATION

-Formation of minerals in an igneous rocks is controlled by the chemical composition of the magma and the physical- chemical conditions present during crystallization.
- Mineralogical composition and texture are used to describe, name and classify rocks.
- Both overall chemistry ( whole-rock chemistry) and the chemistry of constitute minerals offer clues to igneous rock origins.
- Studies of rock chemistry reveal where magmas form and how they are modified before they solidify.
- the problem in rock classification is the selection of a basis for classification.
- proposed classifications use texture, mineralogy, chemistry, geographic location and rock associations.

-Systems of nomenclature and classification may reflect: genetic, textural, chemical or mineralogical features.
GENETIC
basic system which classifies rocks on the basis of where they form.
plutonic - at depth hypabyssal - intermediate depth volcanic - on the Earth's surface. This system is not very practical, but it serves as a first approximation, it tells nothing about mineralogy, chemistry of the rocks and can not distinguish basalt from rhyolite.
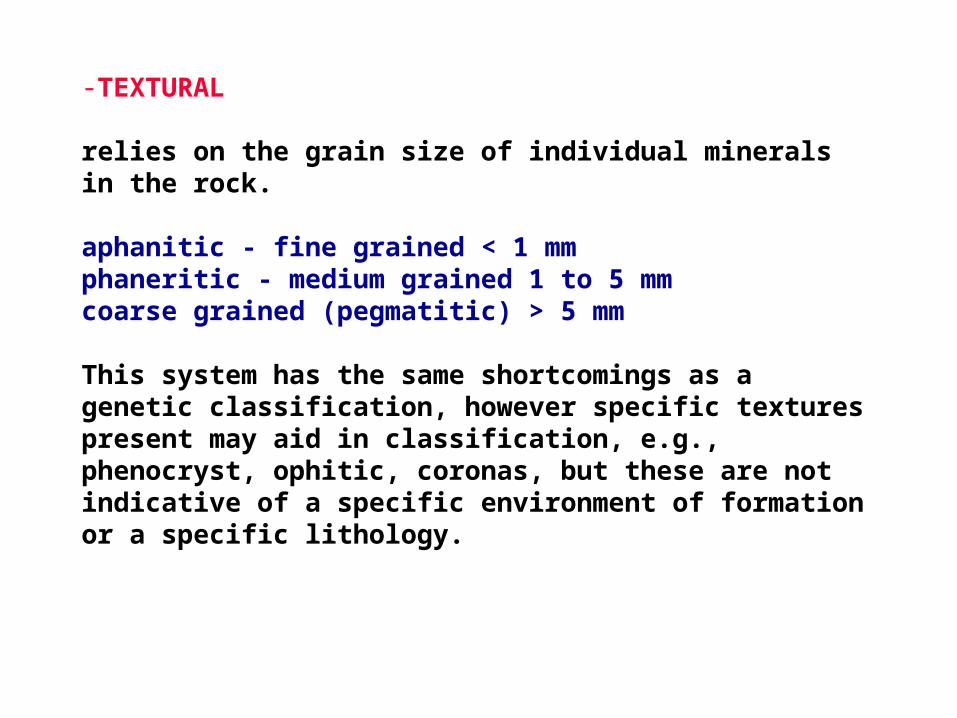
-TEXTURAL
relies on the grain size of individual minerals in the rock. aphanitic - fine grained < 1 mmphaneritic - medium grained 1 to 5 mmcoarse grained (pegmatitic) > 5 mm
This system has the same shortcomings as a genetic classification, however specific textures present may aid in classification, e.g., phenocryst, ophitic, coronas, but these are not indicative of a specific environment of formation or a specific lithology.

-CHEMICAL
This type of classification requires a complete chemical analysis of the rock
A chemical classification system has been proposed for volcanic rocks and a comparable scheme for plutonic rocks is not available. This leaves us with a system based on mineralogy.

MINERALOGICAL
The one gaining application is the result of several years work by the IUGS Subcommission on the Classification of Igneous Rocks or Streckeissen Classification.
CLASSIFICATION SYSTEMS

Several aspects which historically have played and continue to play a role in the classification of igneous rocks should also be considered. GRADATION IN SILICA CONTENT
- referred to as acid or basic, implying a range of silica content. Acidic > 66 wt% SiO2 Granites ~ 72 wt% SiO2, granodiorites ~ 68 wt% SiO2 Intermediate - 52 to 66 wt% SiO2 Andesite 57 wt% SiO2 Basic - 45 to 52 Wt% SiO2 Basalts range from 48 to 50 wt% Ultrabasic - < 45 wt% SiO2 peridotites 41 to 42 wt% SiO2

COLOUR GRADATION
Felsic rocks are light coloured, contain felsic minerals (e.g. qtz, feldspar, feldspathoids) which are themselves light in colour and have a low density which contribute to the pale colour of the rock. Mafic Rocks are denser and dark coloured, the result of containing mafic minerals (pyroxene, amphibole, olivine, biotite). These minerals contribute to the green, brown and black colour of these rocks.

Chemistry of Igneous rocks

-Modern chemical analyses of igneous rocks generally include a major elements analyses and minor or trace elements analyses.
- Earth is composed almost entirely of 15 elements, 12 of which are the dominant elements of the crust.
- The crustal elements, considered to be the major elements, in order of decreasing abundance, are O, Si, Al, Fe, Ca, Na, Mg, K, Ti, H, P and Mn.

Composition of Earth shellsElements wt%
Crust Mantle Core
Continental Oceanic Upper Lower Outer Inner
O 41.2 43.7 44.7 43.710--15
Si 28 22 21.1 22.5
Al 14.3 7.5 1.9 1.6
Fe 4.7 8.5 5.6 9.8 80--85 80
Ca 3.9 7.1 1.4 1.7
K 2.3 0.33 0.08 0.11
Na 2.2 1.6 0.15 0.84
Mg 1.9 7.6 24.7 18.8
Ti 0.4 1.1 0.12 0.08
C 0.3
H 0.2
Mn 0.07 0.15 0.07 0.33
Ni 5 20
Cr 0.51

The chemical composition of rocks is determined by analyzing a powder of the rock.
Routine geochemical analysis of geologic materials can be carried out using either or a combination of the following two techiques: X-ray Fluoresence Spectroscopy (XRF) to determine both major and trace elements
Atomic Absorbtion Spectrometry (AAS) to determine both major and trace elements
The composition of an igneous rock is dependant on: Composition of the source material Depth of melting Tectonic environment where crystallization occurs. e.g. rifting vs. subduction Secondary alteration

These are the 13 major oxide components which are reported as weight percent (wt%).
Because these are reported as a percentage the total should sum to 100 %, ideally, however acceptable totals lie in the range 98.5 to 101 wt%.

Rare Earth Elements (REE or lathanides, atomic number 57 to 71), are reported in ppm or mg/g. The REE are important for petrogenetic studies, because as a group the REE behave coherently.

SATURATION CONCEPTUsed in reference to the SiO2 and Al2O3 which are the two most abundant components of igneous rocks. SiO2 Saturation
SiO2 Saturation Minerals present in igneous rocks can be divided into two groups:
Those which are compatible with quartz or primary SiO2 mineral (tridymite, cristobalite) these minerals are saturated with respect to Si, e.g feldspars, pyroxenes. Those which never occur with a primary silica mineral. These are undersaturated minerals, e.g. Mg-rich olivine, nepheline.
The occurrence of quartz with an undersaturated mineral causes a reaction between the two minerals to form a saturated mineral. 2SiO2 + NaAlSiO4 ===> NaAlSi3O8 Qtz + Ne ===> Albite SiO2 + Mg2SiO4 ===> 2MgSiO3 Qtz + Ol ===> En

Rock Classification (Silica saturation)
Oversaturated - contains primary silica mineral Saturated - contains neither quartz nor an unsaturated mineral Unsaturated - contains unsaturated minerals
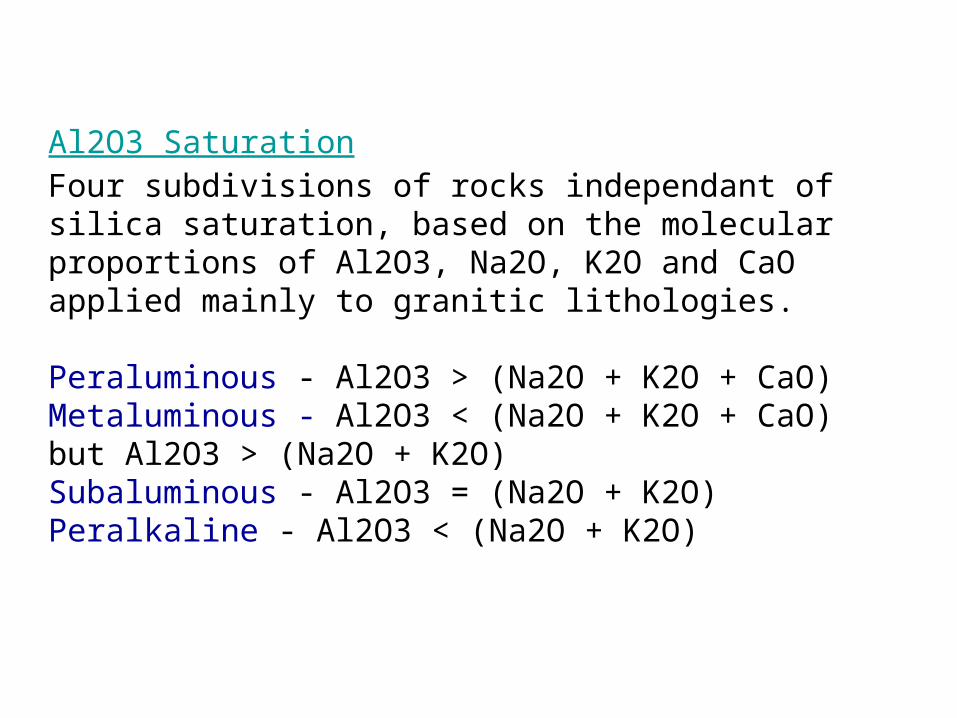
Al2O3 Saturation Four subdivisions of rocks independant of silica saturation, based on the molecular proportions of Al2O3, Na2O, K2O and CaO applied mainly to granitic lithologies.
Peraluminous - Al2O3 > (Na2O + K2O + CaO) Metaluminous - Al2O3 < (Na2O + K2O + CaO) but Al2O3 > (Na2O + K2O) Subaluminous - Al2O3 = (Na2O + K2O) Peralkaline - Al2O3 < (Na2O + K2O)

VARIATION DIAGRAMS

A main objective of any research program on igneous rocks is to describe and display chemical variations for simplicity and to facilitate condensing information. The best way to simplify and condense analytical data is by graphical means.

Harker Diagrams
The oldest method is the variation diagram or Harker diagram which dates from 1909, and plots oxides of elements against SiO2.

12
17
22
Al2O3
0
5
10
MgO
0
5
10FeO*
0
2
4
6
Na2O
0
5
10
15
CaO
45 50 55 60 65 70 75
0
1
2
3
4
K2O
SiO2
45 50 55 60 65 70 75
SiO2
Bivariate (x-y) diagramsBivariate (x-y) diagramsOxides ( K2O, Na2O, Oxides ( K2O, Na2O, CaO,MgO, Al2O3) plotted CaO,MgO, Al2O3) plotted against Silica (SiO2) form against Silica (SiO2) form linear arrays.linear arrays.A set of such plots is called a A set of such plots is called a Harker diagram.Harker diagram.
With increasing Silica the With increasing Silica the following trends are following trends are evident: evident:
FeO, MgO and CaO decrease FeO, MgO and CaO decrease in abundance.in abundance.
K2O and Na2O increase.K2O and Na2O increase. Al2O3 does not exhibit a Al2O3 does not exhibit a
strong variation.strong variation.

wt %
wt %

Figure 9-1.Figure 9-1. Harker Diagram for Crater Lake. From data Harker Diagram for Crater Lake. From data compiled by Rick Conrey. From Winter (2001) An Introduction compiled by Rick Conrey. From Winter (2001) An Introduction to Igneous and Metamorphic Petrology. Prentice Hall.to Igneous and Metamorphic Petrology. Prentice Hall.
Note Note magnitude magnitude of of tracetrace element element changeschanges
Trace ElementsTrace Elements
ppm
ppm
ppm
ppm

Triangular Variation Diagrams

Triangular Variation DiagramsThese diagrams visually present the variation in 3 chemical parameters. Two are commonly used: AFM - Mainly for Mafic RocksA = Na2O + K2O F = FeO (+Fe2O3) M = MgO Plotted as either molecular or weight percent values. Na2O - K2O - CaO - Mainly for Felsic Rocks Uses either the molecular or weight percent values for the three oxides listed. Data may be plotted as weight percent oxide or atomic percent of the cations. The disadvantage to this is that the absolute values of the analyses are not readliy determined.

Table 9-6 A brief summary of some particularly useful trace elements in igneous petrology
Element Use as a petrogenetic indicator
Ni, Co, Cr Highly compatible elements. Ni (and Co) are concentrated in olivine, and Cr in spinel andclinopyroxene. High concentrations indicate a mantle source.
V, Ti Both show strong fractionation into Fe-Ti oxides (ilmenite or titanomagnetite). If they behavedifferently, Ti probably fractionates into an accessory phase, such as sphene or rutile.
Zr, Hf Very incompatible elements that do not substitute into major silicate phases (although they mayreplace Ti in sphene or rutile).
Ba, Rb Incompatible element that substitutes for K in K-feldspar, micas, or hornblende. Rb substitutesless readily in hornblende than K-spar and micas, such that the K/Ba ratio may distinguish thesephases.
Sr Substitutes for Ca in plagioclase (but not in pyroxene), and, to a lesser extent, for K in K-feldspar. Behaves as a compatible element at low pressure where plagioclase forms early, butas an incompatible at higher pressure where plagioclase is no longer stable.
REE Garnet accommodates the HREE more than the LREE, and orthopyroxene and hornblende doso to a lesser degree. Sphene and plagioclase accommodates more LREE. Eu2+
is stronglypartitioned into plagioclase.
Y Commonly incompatible (like HREE). Strongly partitioned into garnet and amphibole. Spheneand apatite also concentrate Y, so the presence of these as accessories could have asignificant effect.
Table 9-6.Table 9-6. After Green (1980). Tectonophys., After Green (1980). Tectonophys., 6363, 367-385. From Winter (2001) An Introduction to Igneous , 367-385. From Winter (2001) An Introduction to Igneous and Metamorphic Petrology. Prentice Hall.and Metamorphic Petrology. Prentice Hall.
Trace elements as a tool to determine paleotectonic
environment
• Useful for rocks in mobile belts that are no longer recognizably in their original setting
• Can trace elements be discriminators of igneous environment?
• Approach is empirical on modern occurrences
• Concentrate on elements that are immobile during low/medium grade metamorphism

Table 18-4. A Classification of Granitoid Rocks Based on Tectonic Setting. After Pitcher (1983) in K. J. Hsü (ed.), Mountain Building Processes, Academic Press, London; Pitcher (1993), The Nature and Origin of Granite, Blackie, London; and Barbarin (1990) Geol. Journal, 25, 227-238. Winter (2001) An Introduction to Igneous and Metamorphic Petrology. Prentice Hall.
SiO2 is generally chosen because it is the most abundant oxide in igneous rocks and exhibits a wide variation in composition. This type of graphical presentation is useful for large quantities of analytical data and yields an approximation of inter-element variations for a group of samples.
No genetic link can be inferred from Harker diagrams, i.e. that the lowest SiO2 content present on the diagram represents the original or first liquid, for the group of samples presented, from which all other liquids were derived.

• Harker diagrams: SiO2 vs. oxide.• The meaning of geochemical trends: can be interpreted as magmatic“evolution” from “primitive” to “differenciated” rocks. More or less implicitlyassumes fractional crystallization.• The nature of the phases crystallizing can be inferred from the shape of thetrends. Ex.: decreasing Fe, Mg = precipitation of mafic minerals.

Magmatic series: reflect first order differences between rock groups.• TAS diagram separates alkali and sub-alkali series• Sub-alkali series are further separated on the basis of their Fe-Mg contens(AFM diagram) into tholeitic and calc-alkalineIn addition, important role of the relative proportions of Al2O3 and CaO-Na2O-K2O• A>CNK: Peraluminous rocks. Have Al-rich minerals such as biotite,muscovite, garnet, cordierite…• A<CNK:o .. and A>NK: Metaluminous. No particular minerals, mafics arepyroxene, amphibole, biotiteo .. and A<NK: peralkaline rocks. Alklai-rich minerals such as alkaliamphiboles and pyroxenes.

12
10
8
6
4
2
35 40 45 50 55 60 65
%SiO2
%N
a2O
+ K
2O
Alkaline
Subalkaline
Alkali vs. Silica diagram for Hawaiian volcanics:Alkali vs. Silica diagram for Hawaiian volcanics:Seems to be two distinct groupings: Seems to be two distinct groupings: alkalinealkaline and and subalkalinesubalkaline

F
A M
Calc-alkaline
T
ho leiitic
AFM diagram:AFM diagram: can further subdivide the subalkaline can further subdivide the subalkaline magma series into a magma series into a tholeiitictholeiitic and a and a calc-alkalinecalc-alkaline series series
Figure 8-14. AFM diagram showing the distinction between selected tholeiitic rocks from Iceland, the Mid-Atlantic Ridge, the Columbia River Basalts, and Hawaii (solid circles) plus the calc-alkaline rocks of the Cascade volcanics (open circles). From Irving and Baragar (1971). After Irvine and Baragar (1971). Can. J. Earth Sci., 8, 523-548.

1. Tholeitic seriesFe-rich, alkali poor.Metaluminous Px/Hb/Bt-bearing basalts, andesites, dacites, rhyolites (BADR)Tholeitic series are common in oceanic ridges, intraplate-volcanoes ± convergentmargins. They correspond to melting by decrease of pressure.2. Calc-alkaline seriesModerately alkaline, more magnesianMetaluminous to peraluminous BADR, that can feature ms/gt/cd in the more differenciated termsCalc-alkaline series are mostly found in convergent margins. They correspond tomelting by adding water to the source (and therefore “shifting” the solidus towardslower temperatures).3. Alkaline seriesAlkali rich, Fe-richMetaluminous to peralkaline Evolution towards trachytes (moderaltely alkaline series) or phonolites (veryalkaline series), that can feature riebeckite, aegyrine, etc.Alkaline series are found in intra-plate situations ± convergent margins. Theycorrespond to melting by increase of temperature.

Fractionation Indices

To obtain a genetic link between analyses of a given suite of samples fractionation indices were developed. These indices attempt to the results of chemical analyses from an individual igneous suite into their correct evolutionary order. These indices are not realistic but several come close to such an order.

MgO Index This is used for basaltic rocks. Positive correlations are
produced for Na2O, K2O, and P2O5 indicating enrichment in these oxides with successive liquids. Negative correlations result for CaO.
Mg-Fe Ratios Again used for basaltic rocks. These involve a ratio of Mg to Fe: MgO/MgO+FeO (ferrous) MgO/MgO+FeO+Fe2O3 (ferric) Mg/Mg+Fe (uses atomic proportions of the cations). Normative Ab/Ab+An Based on the values of Na2O and CaO. Only good for rocks
which crystallize plagioclase, not effected by mafic mineral formation. Generally applied to granites.
The above three indices are only good for specific lithologies, and thus have a restricted application.

Two fractionation indices, based on complex equations have been suggested for more comprehensive use.
Solidification Index (Kuno, 1959) SI = 100 MgO/(MgO+FeO+Fe2O3+Na2O+K2O) For basalts this is similar to Mg/Fe ratios due to the relatively
poor alkali content. As fractionation progresses the residual liquids become enriched in alkaliis, thus Na2O and K2O contents offset the Mg-Fe index. For mafic rocks SI is high, for felsic rocks SI is low.
Differentiation Index (Thornton and tuttle, 1960) DI = normative Q+Or+Ab+Ne+Ks+Lc This is based on the normative analyis results. For mafic
rocks DI will be low, because in normative calculation these minerals are minor. Felsic rocks DI will be high because these minerals are abundant in the norm.

12
10
8
6
4
2
35 40 45 50 55 60 65
%SiO2
%N
a2O
+ K
2O
Alkaline
Subalkaline
Alkali vs. Silica diagram for Hawaiian volcanics:Alkali vs. Silica diagram for Hawaiian volcanics:Seems to be two distinct groupings: Seems to be two distinct groupings: alkalinealkaline and and subalkalinesubalkaline


F
A M
Calc-alkaline
T
ho leiitic
AFM diagram:AFM diagram: can further subdivide the subalkaline can further subdivide the subalkaline magma series into a magma series into a tholeiitictholeiitic and a and a calc-alkalinecalc-alkaline series series
Figure 8-14. AFM diagram showing the distinction between selected tholeiitic rocks from Iceland, the Mid-Atlantic Ridge, the Columbia River Basalts, and Hawaii (solid circles) plus the calc-alkaline rocks of the Cascade volcanics (open circles). From Irving and Baragar (1971). After Irvine and Baragar (1971). Can. J. Earth Sci., 8, 523-548.

F
A M
Rhyolite
Dacite
Andesite
Basaltic Andesite
Ferro-Basalt
Basalt
Calc-alkaline
Tholeiitic
Basalt
B-A
A
D
R

Al2O3K2O
CaO
Al2O3
K2O
CaO
Al2O3
CaO
biotitemuscovitecordieriteandalusitegarnet
pyroxenehornblendebiotite
aegirineriebeckitearfvedsonite
Peraluminous Metaluminous Peralkaline
mol
es
Na2ONa2O
K2O
Na2O
CaO
Figure 18-2. Alumina saturation classes based on the molar proportions of Al2O3/(CaO+Na2O+K2O) (“A/CNK”) after
Shand (1927). Common non-quartzo-feldspathic minerals for each type are included. After Clarke (1992). Granitoid Rocks. Chapman Hall.

AlkalineCalc-alkalineTholeitic

Series Alkali content
Fe-Mg Al
Alkaline High Fe-rich Metaluminous to peralkaline
Sub-alkaline
Calc-alkaline
Low to moderate
Mg-rich Metaluminous to per-aluminous
Tholeitic Low Fe-rich Metaluminous

CharacteristicSeries Convergent Divergent Oceanic ContinentalAlkaline yes yes yesTholeiitic yes yes yes yesCalc-alkaline yes
Plate Margin Within Plate
A world-wide survey suggests that there may be A world-wide survey suggests that there may be some important differences between the three seriessome important differences between the three series
After Wilson (1989). Igneous Petrogenesis. Unwin Hyman - Kluwer

- B. Normalization and spidergrams1. What is “normalization”, and why do it?Abundance of elements varies greatly in the Earth:• Different families of elements are more or less present• Even within a family, nucleosynthesis results in huge variations2. SpidergramsSpidergrams allow to• See many elements at a time• Compare elements with large differences of absolute abundance (log scale!)• To some degree, make petrogenetic interpretationsMaking a spidergram• For each sample, arrange elements in order of increasing compatibility (i.e.,the more incompatible at the left). (technically, this implies a different orderfor each different source!).• Plot the normalized value of each elements (log scale!)• Link the dots• Look at the “anomalies”!Some classical spidergrams:• REE diagrams (n’ed to chondrites or PRIMA=PRImitive MAntle in general)• Multi-element diagrams for incompatible elements (N’ed toPRIMA/chondrites, or to MORBs)• PGE diagrams• Transition metal diagrams

MODAL ANALYSIS

Two types of analysis are useful when examining Igneous Rocks: Modal analysis - requires only a thin section,
Normative analysis - requires a chemical analysis.

MODAL ANALYSIS
Produces an accurate representation of the distribution and volume percent of the mineral within a thin section. Three methods of analysis are used:
Measure the surface area of mineral grains of the same mineral, relative to the total surface area of the thin section.
Measure the intercepts of each mineral along a series of lines.
POINT COUNT - Count each mineral occurrence along a series of traverse line across a given thin section. For a statistically valid result > 2000 individual points must be counted.
The number of grains counted, the spacing between points and successive traverse lines is dependant on the mean grain size of the sample.

AdvantagesOne can compare rocks from different areas if you
only have a thin section, no chemical analysis is required, using a petrographic microscope.
Gives the maximum and minimum grain sizes. DisadvantagesMeaningless if the sample has a preferred orientation
of one or more minerals. Porphyritic rocks are difficult to count. Total area of sample must be sufficiently larger than
the max. diameter of the smallest grain size.

NORMATIVE ANALYSIS OR NORM

Normative analysis is defined as the calculation of a theoretical assemblage of standard minerals for a rock based, on the whole rock chemical composition as determined by analytical techniques. The original purpose for the norm was essentially taxonomic. An elaborate classification scheme based on the normative mineral percentages was proposed. The classification groups together rocks of similar bulk composition irrespective of their mineralogy. Various types of NORMs have been proposed - CIPW, Niggli, Barth. Each of theses proposals has its own specific advantages and/or disadvantages.
The CIPW norm, originally proposed in 1919, was proposed as a means of comparing and classifying all igneosu rocks for which chemical analyses wers available. The NORM takes it's name from the four authors who proposed it - Cross, Iddings, Pirsson and Washington. This NORM was very elegant and based on a number of simplifications:
The magma crystallizes under anhydrous conditions so that no hydrous minerals (hornblende, biotite) are formed.
The feromagnesium minerals are assumed to be free of Al2O3. The Fe/Mg ratio for all feromagnesium minerals is assumed to be the same. Several minerals are assumed to be incompatible, thus nepheline and/or
olivine never appear with quartz in the norm. Since the CIPW NORM was introduced in 1919 several other normative
calculations have been suggested, e.g. Niggli norm, Barth mesonorm. The latter is used commonly when examining granitic rocks.

Plate Tectonic - Igneous Genesis
1. Mid-ocean Ridges
2. Intracontinental Rifts
3. Island Arcs
4. Active Continental
Margins
5.5. Back-arc BasinsBack-arc Basins
6.6. Ocean Island BasaltsOcean Island Basalts
7.7. Miscellaneous Intra-Miscellaneous Intra-Continental Continental
ActivityActivity kimberlites, carbonatites, kimberlites, carbonatites,
anorthosites...anorthosites...