
iGETT Exercise Lesson Classify
25
1 iGETT Cohort 3, Classify Exercise, Michelle Kinzel, [email protected] iGETT Classify Exercise Supporting Conservation Efforts and Aiding in Poaching Reduction with Satellite Imagery and Geospatial Analysis in a Zambian National Park Problem Statement: In the South Luangwa National Park, located in Zambia, poachers have been targeting the elephant populations, and other wildlife, with the use of snare traps. These snare traps are set and left in the park areas to entrap large game animals. The South Luangwa Conservation Society collects data on the locations of elephant mortalities and poaching activity related to the locations of snares. One of the barriers to conservation efforts is the belief by local residents that elephants are destroying the Mopane Woodland by their grazing. The guides and local residents see many of the changes in landcover as being a negative impact from overgrazing by elephants. This belief leads to tolerance of poaching activities in some instances. It is hoped that if the local residents can see evidence of changing amounts of Mopane from seasonal effects, they will understand that elephants are not the only agents of change, and be more supportive of the conservation efforts of local organizations fighting against poachers. In an effort to help the conservation and monitoring efforts of the park, you have been tasked with analyzing land cover types in the park, creating a collection of maps detailing classifications based on spectral information within the park boundaries, and comparing changes in land cover using geospatial tools. Your goal as the project analyst is to create map products and digitally processed imagery to better understand the various land cover areas of the park, and assess the different amounts of the main vegetation types in the park, Water, Riverine, Open Grass and Mopane Woodland. You will use ArcGIS 10.1 software to create maps and analysis of remotely sensed images. Geographic location: South Luangwa National Park, Zambia, Africa Landsat Path 170, Row 69, 13°00’ S 31°30’ E Scientific and/or geographic concepts: Land Cover Classification Unsupervised Classification Supervised Classification Ecological and conservation principles, particularly with respect to Elephant habitat
-
Upload
michelle-kinzel-gisp -
Category
Documents
-
view
38 -
download
0
Transcript of iGETT Exercise Lesson Classify

1 iGETT Cohort 3, Classify Exercise, Michelle Kinzel, [email protected]
iGETT Classify Exercise
Supporting Conservation Efforts and Aiding in Poaching Reduction with Satellite Imagery and
Geospatial Analysis in a Zambian National Park
Problem Statement: In the South Luangwa National Park, located in Zambia, poachers have been targeting the elephant populations, and other wildlife, with the use of snare traps. These snare traps are set and left in the park areas to entrap large game animals. The South Luangwa Conservation Society collects data on the locations of elephant mortalities and poaching activity related to the locations of snares. One of the barriers to conservation efforts is the belief by local residents that elephants are destroying the Mopane Woodland by their grazing. The guides and local residents see many of the changes in landcover as being a negative impact from overgrazing by elephants. This belief leads to tolerance of poaching activities in some instances. It is hoped that if the local residents can see evidence of changing amounts of Mopane from seasonal effects, they will understand that elephants are not the only agents of change, and be more supportive of the conservation efforts of local organizations fighting against poachers. In an effort to help the conservation and monitoring efforts of the park, you have been tasked with analyzing land cover types in the park, creating a collection of maps detailing classifications based on spectral information within the park boundaries, and comparing changes in land cover using geospatial tools. Your goal as the project analyst is to create map products and digitally processed imagery to better understand the various land cover areas of the park, and assess the different amounts of the main vegetation types in the park, Water, Riverine, Open Grass and Mopane Woodland. You will use ArcGIS 10.1 software to create maps and analysis of remotely sensed images.
Geographic location: South Luangwa National Park, Zambia, Africa Landsat Path 170, Row 69, 13°00’ S 31°30’ E
Scientific and/or geographic concepts:
Land Cover Classification
Unsupervised Classification
Supervised Classification
Ecological and conservation principles, particularly with respect to Elephant habitat

2 iGETT Cohort 3, Classify Exercise, Michelle Kinzel, [email protected]
Exercise Description: You will access the following data sets from a folder or download process– GIS Data – 1) Park boundaries/Study area 2) Water bodies in Zambia 3) GPS Data collected in the South Luangwa National Park on Safari Drives, August 2013 Imagery – Landsat Imagery – to perform Land Cover Classification, 2003 (LE7) and 2013 (LE8) Images Collected in April, the Cool Dry Season for Zambia, Africa
Sample scene results for Landsat8-OLI data from the Earth Explorer site. You will follow a project plan to perform the following image processing and map making steps: 1) Download imagery for the South Luangwa National Park, Path 170, Row 69 from Earth Explorer http://earthexplorer.usgs.gov/
2) Confirm that the imagery you have acquired matches the study area/park boundaries
3) Subset the relatively large Landsat imagery sets to a smaller geographic extent (park boundaries)
4) Visually assess the 2003 and 2013 imagery data sets
5) Perform land cover classification on the Landsat Subset using ArcGIS Image Analysis software
6) Interpret the classification results
7) Extract land cover statistics for the study area
8) Compare graphical representation of results of classification
9) Create a map of the land cover types and relevant GIS data

3 iGETT Cohort 3, Classify Exercise, Michelle Kinzel, [email protected]
Learning Objectives
In this exercise you will learn how to:
ArcGIS Skills
Create a map document and map products using raster and vector data
Use Landsat imagery and land cover classes to create a thematic map of the study area in ArcGIS
software.
Visual Interpretation Skills
Use visual cues such as tone, texture, shape, pattern and relationship to other objects to visually
identify known features within the park
Compare satellite imagery, digitally processed imagery and base map layers to analyze the park
features
Prerequisites
For this exercise it helps to have a basic understanding of remote sensing, and know basic ArcMap skills
required to create a map document, and produce a map layout.
Organize and Prepare Your Workspace
The following preliminary steps are essential for organizing your workspace and are essential for a
successful geospatial analysis. In a geospatial project, you must practice good file management
techniques, and carefully keep track of the data and calculations. You will work with a number of
different files and Geoprocessing tools, and your goal is to keep them organized and contained in the
project working folders. To accomplish this goal, it is suggested that you create a folder for this lesson
on the C drive of your computer, and use the file naming conventions of having a working or data folder
and a results or scratch folder.
1) Create a folder on your C drive for this exercise C:/iGETT_Classify
2) Download the data from the iGETT webpage
3) Using ArcCatalog, copy the data to the folder you created on your C drive.
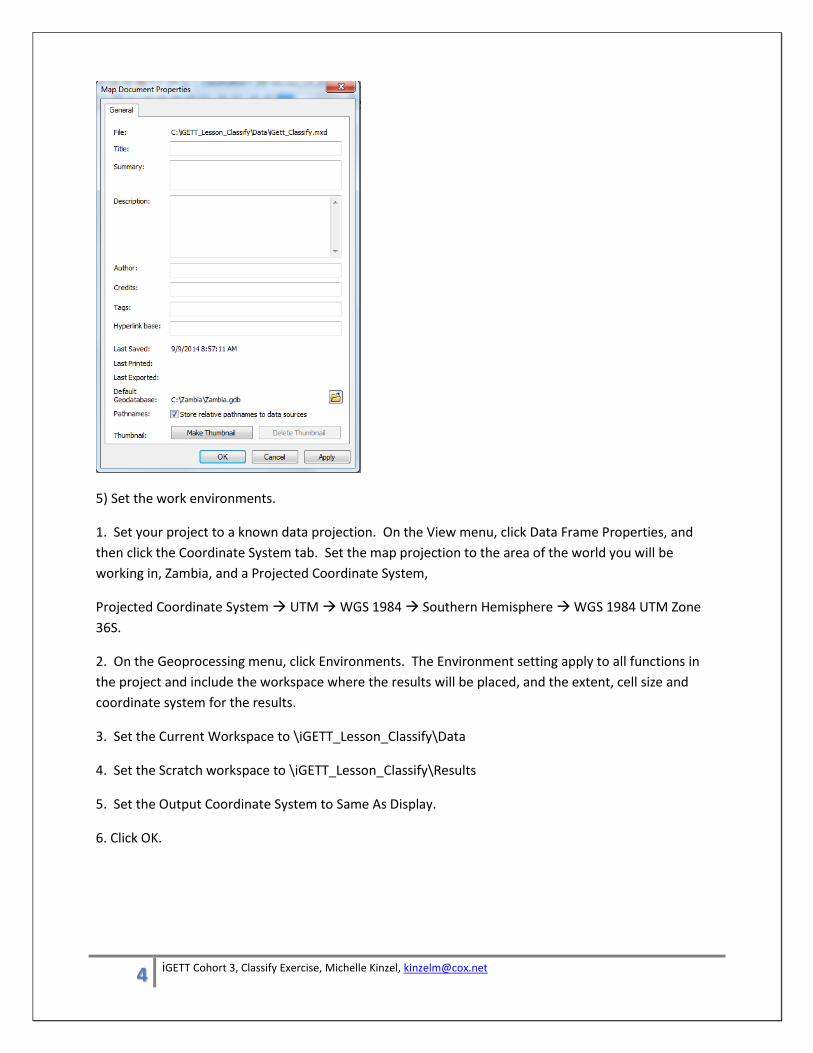
4) Document the map. You need to add descriptive properties to the map document you will produce.
You also need to direct the software to create relative pathnames so that your data can be moved to
another computer.
1. On the File menu, click on Map Document Properties. Add an appropriate title, summary, description,
author, credits, tags, and hyperlink base for this project.
2. Click the pathnames check box. This will direct ArcMap to store relative pathnames to your data
sources and allows ArcMap to automatically find all relevant data if you move your project to another
computer.
4 iGETT Cohort 3, Classify Exercise, Michelle Kinzel, [email protected]
5) Set the work environments.
1. Set your project to a known data projection. On the View menu, click Data Frame Properties, and
then click the Coordinate System tab. Set the map projection to the area of the world you will be
working in, Zambia, and a Projected Coordinate System,
Projected Coordinate System UTM WGS 1984 Southern Hemisphere WGS 1984 UTM Zone
36S.
2. On the Geoprocessing menu, click Environments. The Environment setting apply to all functions in
the project and include the workspace where the results will be placed, and the extent, cell size and
coordinate system for the results.
3. Set the Current Workspace to \iGETT_Lesson_Classify\Data
4. Set the Scratch workspace to \iGETT_Lesson_Classify\Results
5. Set the Output Coordinate System to Same As Display.
6. Click OK.

5 iGETT Cohort 3, Classify Exercise, Michelle Kinzel, [email protected]
Locate and Acquire Data Sets for Your Project
For this project, we will be looking at the South Luangwa National Park, located in Zambia, Africa. We
will be using satellite data from Landsat 8 and we want to acquire 2 images, one from late in the dry
season and one from late in the wet season.
1) Examine this website http://www.safaribookings.com/zambia/climate for information on the climate
of Zambia.

6 iGETT Cohort 3, Classify Exercise, Michelle Kinzel, [email protected]
Q1) Which months have the highest average rainfall? This is the wet season.
Q2) Which months have relatively little or no rainfall? This is the dry season.
Q3) Which month represents the end of the wet season?
Q4) Which month represents the end of the dry season?
2) Now you will search the Earth Explorer website http://earthexplorer.usgs.gov/ for suitable satellite
images. Based on your answers to questions 1 – 4 above, decide on the date range for searching in
Earth Explorer. Note that in this lesson, you are also given photographs and GPS Data that were
collected during the month of August, 2013. This is a type of in situ or ground truthing data that can
help you when you begin to assign training classes to your data. You may want to consider this when
choosing your images. While September is technically the last month of the dry season, choosing a
satellite image from August will more closely match the GPS Data notes you have been given with this
lesson.
1. Log in to your Earth Explorer Account or create a new one.
2. Search for Address/Place – ‘South Luangwa National Park’
3. Click on the Address/Place in results
4. Enter Date Range You Choose. Note the image below shows a range, and this may not be the
one you choose. It is suggested you search for all of 2013 images.

7 iGETT Cohort 3, Classify Exercise, Michelle Kinzel, [email protected]
5. Select the Satellite Platform – Click on Data Sets, Check the box for Landsat 8 OLI/TIRS
3) Check Images for Cloud Cover
1. Click on ‘Show Browse Overlay’ icon
2. Examine Image in Map View for cloud cover
Q5) Which images fit your criterion for ideal dates and low cloud cover?
4) Download Images you select for your project.

8 iGETT Cohort 3, Classify Exercise, Michelle Kinzel, [email protected]
Student Activity
1) Open ArcMap.
2) Add the South Luangwa National Park Boundary shapefile. Add the River shapefile.
3) Add the Landsat Images.
4) Note the satellite image names. Each satellite image is named to include the following information in
the name
LC82013170069122GNC.jpg
LC8 = Landsat 8, 2013 = Year of image collection, 170 = Path name, 069 = Row name, 122 = Julian
Calendar Day of image collection.
5) Examine the metadata for the satellite images.
Q1) Fill in this chart of metadata
File Name Publication Information: Who created
the data?
Time Period data is
relevant
Spatial horizontal coordinate
system
Data Type Resolution for raster
*LC82013170069125.jpg
*LC82013170069221.jpg
*The lesson instructions, screenshots and accompanying PowerPoint were created using these 2
images from 2013. Your files may differ, or you can use these images which are included in the lesson
data folder.
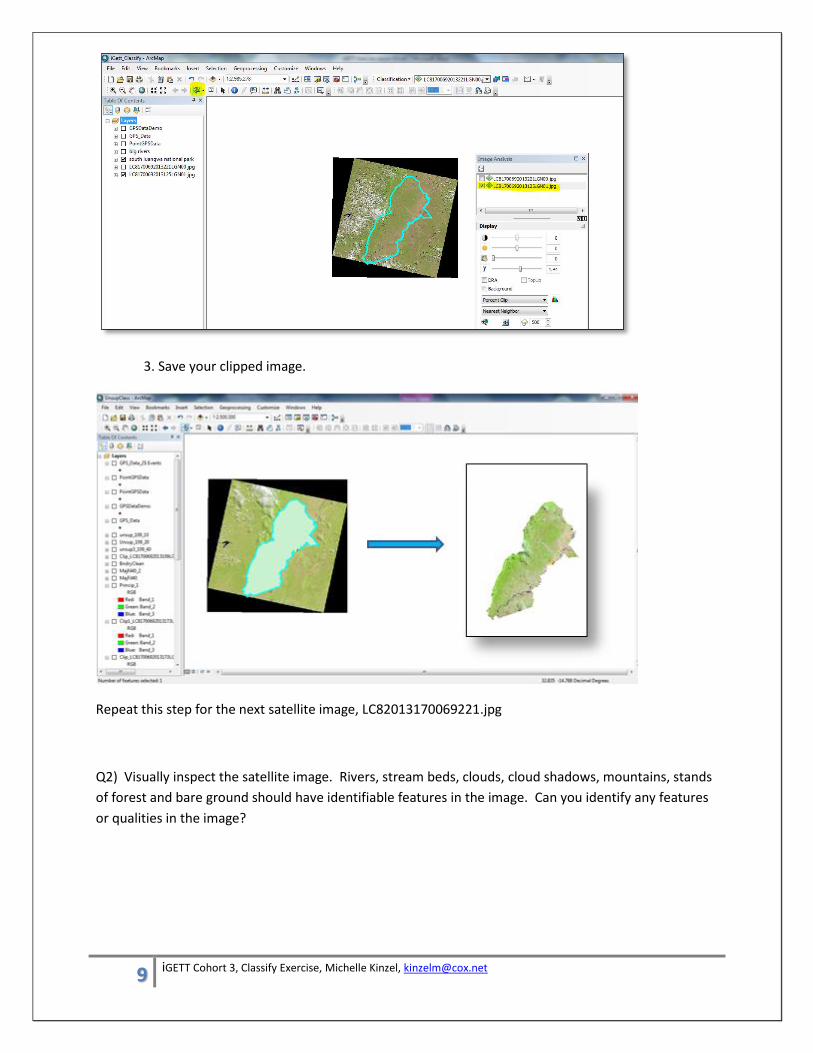
6) Clip Raster satellite image LC82013170069221.jpg to the boundaries of the South Luangwa National
Park.
1. Use the Select by Polygon tool and click inside the South Luangwa National Park boundaries
until the entire park boundary is highlighted.
2. Use the clip icon on the Image Analysis Window to clip. Be sure the correct satellite image
you want to clip is selected in the Image Analysis Window.
9 iGETT Cohort 3, Classify Exercise, Michelle Kinzel, [email protected]
3. Save your clipped image.
Repeat this step for the next satellite image, LC82013170069221.jpg
Q2) Visually inspect the satellite image. Rivers, stream beds, clouds, cloud shadows, mountains, stands
of forest and bare ground should have identifiable features in the image. Can you identify any features
or qualities in the image?

10 iGETT Cohort 3, Classify Exercise, Michelle Kinzel, [email protected]
UNSUPERVISED CLASSIFICATION
7) Perform Iso Unsupervised Classification with ArcGIS 10 Image Analysis Window on the clipped raster
of the South Luangwa National Park, assigning 40 classes on the clipped image for the
LC82013170069221.jpg satellite image.
8) Perform Iso Unsupervised Classification with ArcGIS 10 Image Analysis Window on the clipped raster
of the South Luangwa National Park, assigning 20 classes on the clipped image for the
LC82013170069221.jpg satellite image.
9) Perform Iso Unsupervised Classification with ArcGIS 10 Image Analysis Window on the clipped raster
of the South Luangwa National Park, assigning 10 classes on the clipped image for the
LC82013170069221.jpg satellite image.
Repeat Steps 10-12 on the other image, LC82013170069125.jpg.
Q3) Visually compare the 3 different Unsupervised Classification rasters. Do you see any patterns in the
images?

11 iGETT Cohort 3, Classify Exercise, Michelle Kinzel, [email protected]
SUPERVISED CLASSIFICATION
10) Use this method to assign classifications to 5 types of land cover - Water, Bare Ground, Riverine,
Open Grass and Mopane Woodland. Study the images provided to get a sense of what the land cover
classification areas look like from the ground within the park.
Water

12 iGETT Cohort 3, Classify Exercise, Michelle Kinzel, [email protected]
Bare Ground
Riverine Vegetation

15 iGETT Cohort 3, Classify Exercise, Michelle Kinzel, [email protected]
11) Add the GPS_points shapefile. Edit the GPS_points shapefile to include information from your Field
Notes collected during a Safari Drive of the Park. You can highlight the GPS Point Numbers in the
Attribute table of the GPS_points shapefile, and find the highlighted points on the raster image in the
map view. Examine the points and the corresponding pixels to estimate what the various land
classifications look like in the satellite image. Use these clues and identified areas to assign training
classes to your image.
Suggested Techniques –
1) For Multiple Points with the same description – find them in the GIS Map, then find them in the
clipped satellite image. Do the pixels all appear the same? If so – this would make a great area for a
future training class.
2) For Single Points – after you have examined the image and created several training areas, or are
familiar with the various land cover types in the image, locate the single points and assess whether or
not there is a good set of pixels for a training class.
3) Begin classifying in an area with identifiable river, and dry river bed. Use the river layer to find the
major waterways. The water is visually easy to see in the classification rasters, and it generally follows
the same path as the vector shapefile layer. It is easy to determine the main class assigned to water in
your raster. These areas are easy to distinguish in the satellite images.
4) Progress to identifying training classes of Mopane vegetation and open grassland, as these are also
easy to distinguish in the satellite image, once you have correlated a few areas with your GPS data and
your pixelated satellite image.
5) Use the Swipe Tool with the Unsupervised Classification layer on top of the Satellite Image. By
swiping back and forth, you can get a sense for what colors the Unsupervised Classification assigned to
areas that you can identify in the satellite image. In this example, the river is shown in the satellite
image on the right as bright blue pixels, and on the left with brown pixels (the shape is easy to compare
between the 2 images). The red oval, labeled with number 1, should be classified as water in your first
training sample. Create more than one training sample for each land cover classification, this is just to
get you started. For the next land cover class, it is easy to distinguish in the satellite image where the
dry river bed is located, it appears like a broad open sandy patch that follows the contours of the river.
The polygons labeled 2 in these images show river bed, and appear in this classification as the colors
orange and bright green. The polygon labeled 3 is placed above the dark green patch and assigned as
Riverine and the polygon labeled 4 has been placed over points that were identified in the field notes as
GPS points of open grass.

16 iGETT Cohort 3, Classify Exercise, Michelle Kinzel, [email protected]
GPS Data – The following data was collected to provide a ground truthing reference for the
classifications. Notes were taken along with GPS points at various points within and near the South
Luangwa National Park. Not all of the information will be useful, and it is up to you as the analyst to
decide which reference poitns to use in your analysis.
GPS Point Number
Notes Collected on Safari Drives, August 3, August 8 and August 10, 2013.
001 Dry Lagoon
052-055 Mopani
057 Riverine
056 Channel of Water, approximately 3 feet deep
057 Edge – open field and riverine forest
058 Mopani Woodland
61 Thickets
62-66 Open grass; short grass
67-73 Riverine
74-81 Open area, possibly water in raining season
82-84 Dry River Channel, 3 foot banks, dry now
85 – 99 Mopani
100 -112 Open grass; short grass
121 - 136 Mopani Shrub, 1 km long stretch of Mopani trees
138 Creek Bed, 2 foot walls
139 Mopani

17 iGETT Cohort 3, Classify Exercise, Michelle Kinzel, [email protected]
157 River Edge
158 - 173 Mopani
185 Bridge over green pond
186 - 193 Riverine; Mahogany Trees, Sausage Trees, Combritum, Wild Mango, Ebony
198 - 202 Riverine; thinning out and transition at Point 201 and 202
203 – 220 Mopane Woodland; heavily grazed areas, lots of secondary succession
221 - 251 Open Grass; open area with short dry grass, pure pixels 241-251
252-256 Riverine; patch of riverine vegetation near large dry lagoon bed
257 – 258 Dry River Bed Channel
259-261 Open Grass; tall grass
262-264 Mopani; stands of Mopane overgrazed by elephants
265-270 Riverine
298 – 299 Water; Lagoon at Mfuwe Lodge
12) Use Identify tool, Use GPS points and find the locations labeled in the GPS points layer with
classifications. Visually determine what riverine vegetation looks like in your unsupervised classes.
Visually assess what Mopane woodland looks like in your supervised classes.

19 iGETT Cohort 3, Classify Exercise, Michelle Kinzel, [email protected]
13) Assign vegetation classes to these 5 classes – Water, Bare Ground, Riverine, Open Grass and
Mopane Woodland. Draw training samples for each of the 5 classes. Select a minimum of 3 different
areas to draw polygons for each training class.
14) Merge training samples into classes and rename in Training Sample Manager window.
15) Save signature file in your working results folder using the Save Signature file button.
16) Visually inspect the histograms using Image Analysis window Histogram button.
Q4) Do the histograms show separate classes?
17) Visually inspect the scatter plots using Image Analysis window Scatter Plot button.

20 iGETT Cohort 3, Classify Exercise, Michelle Kinzel, [email protected]
Q5) Do the scatter plots show separate classes?
18) Examine the statistics by clicking on the Statistics button in the Training Sample Manager.

21 iGETT Cohort 3, Classify Exercise, Michelle Kinzel, [email protected]
Q6) In general, a low covariance indicates a more accurate representation of a distinct land cover class.
Which land cover class had the lowest reported covariance? Which land cover class had the highest
reported covariance?
19) Using ArcGIS 10 Image Analysis window, run Maximum Likelihood Classification on the 3 files, 2 from
2013 and one from 2003.
20) Determine the counts of total pixels for each class.
Q7) Which land cover type has the most pixels? Which has the least? Provide answers for both wet and
dry season analysis.
Fill in this chart for land cover types, counts of pixels and quantify the % change using this formula –
(# dry pixels/#wet pixels) – 1 = % change
Values less than 100% indicate a decrease, and values greater than 100% indicate an increase.
Water Bare Ground Riverine Open Grass Mopane
File Name – Wet Season
File Name – Dry Season
% Change Wet Season to Dry Season
Increase or Decrease?
21) Create a bar chart comparing the counts of pixels.

22 iGETT Cohort 3, Classify Exercise, Michelle Kinzel, [email protected]
Q8) Describe the data shown in the bar chart. Which land cover types increased in total number of
pixels, which decreased? What possible reasons can you think of for these changes?
Mixed Pixels
Definition In remote sensing, a pixel whose digital number represents the average of several spectral
classes within the area that it covers on the ground, each emitted or reflected by a different type of
material. Mixed pixels are common along the edges of features.
http://support.esri.com/en/knowledgebase/GISDictionary/term/mixed%20pixel
When working with 30m resolution, land cover may not be ‘pure’ within the entire 900m2 area
represented in the pixel. The Geoprocessing tools will manipulate the raster so that each pixel
represents on land cover type, when in reality, it may be comprised of more than one land cover type.
This creates errors in estimating the amounts of land cover types.
Examples of diagrammatic mixed pixel and approximate 30m x 30m area showing water, Riverine and
Open Grass land cover types.

23 iGETT Cohort 3, Classify Exercise, Michelle Kinzel, [email protected]
22) Create pie graphs comparing the relative percentages of the 4 major land cover classifications.

24 iGETT Cohort 3, Classify Exercise, Michelle Kinzel, [email protected]
Q9) Interpret the results shown in the pie charts. Which land cover types showed the greatest amount
of change? Which land cover types showed the least amount of change?
23) Interpret your results
Consider dry versus wet season, greening up, changes in standing water, natural variations and
pressures from elephant grazing.
Q10) What steps would you suggest to improve the research? What would you add or do in additional
to the methods you used here to study the land cover changes in the South Luangwa National Park?
24) Communicate your results in a PowerPoint, poster, article or paper summary form. Prepare a map
layout showing the results of your analysis, selecting the images and files that best tell your story and
show your interpretations.
Q11) Prepare a report for The Zambian Wildlife Authorities (ZAWA) of your findings.