IFRS Annualr Report 2015-16 040816 - tcs.com Annual Report 2015-16 ... Asia Pacific Girish...
80
IFRS Annual Report 2015-16 Financial Statements prepared in accordance with International Financial Reporting Standards - Fiscal 2016
Transcript of IFRS Annualr Report 2015-16 040816 - tcs.com Annual Report 2015-16 ... Asia Pacific Girish...

Tata Consultancy Services Limited9th Floor Nirmal Building Nariman Point Mumbai 400 021www.tcs.com
IT ServicesBusiness SolutionsConsulting
IFRS Annual Report 2015-16
Financial Statements prepared in accordance with International Financial Reporting Standards - Fiscal 2016
CMYK


i
Contents
Board of Directors 1
Management Team 2
Management Discussion and Analysis 3
Independent Auditors’ Report 17
Consolidated Statements of Financial Position as of March 31, 2016 and 2015 18
Consolidated Statements of Profit or Loss and Other Comprehensive Income for the years ended March 31, 2016, 2015 and 2014
19
Consolidated Statements of Changes in Equity for the years ended March 31, 2014, 2015 and 2016 20
Consolidated Statements of Cash Flows for the years ended March 31, 2016, 2015 and 2014 21
Notes to the Consolidated Financial Statements 23
REPORT FOR THE YEAR ENDED MARCH 31, 2016
ii
Annual Report 2015-16
THIS PAgE IS INTENTIONALLY LEFT BLANk

1
Board of Directors
Cyrus Mistry (Chairman)
N Chandrasekaran (CEO & Managing Director)
Aman Mehta
V Thyagarajan
Prof. Clayton M Christensen
Dr. Ron Sommer
Dr. Vijay Kelkar
Ishaat Hussain
O. P. Bhatt
Phiroz Vandrevala
Aarthi Subramanian (Executive Director)
Company Secretary
Suprakash Mukhopadhyay
Statutory Auditors
Deloitte Haskins & Sells LLP
IFRS Auditors
Deloitte Haskins & Sells LLP
Registered Office9th Floor, Nirmal Building
Nariman Point, Mumbai 400 021
Tel : 91 22 6778 9595
Fax : 91 22 6778 9660
Website : www.tcs.com
CIN : L22210MH1995PLC084781
Corporate OfficeTCS House
Raveline Street, Fort
Mumbai 400 001
Tel : 91 22 6778 9999
Fax : 91 22 6778 9000
E-mail: [email protected]
Registrars & Transfer AgentsTSR DARASHAW Limited
6-10, Haji Moosa Patrawala Industrial
Estate
20, Dr. E. Moses Road, Mahalaxmi
Mumbai 400 011
Tel : 91 22 6656 8484
Fax : 91 22 6656 8494
E-mail: [email protected]
Website: www.tsrdarashaw.com
2
Annual Report 2015-16
Management TeamFunction Name
Corporate
Chief Executive Officer & Managing Director N Chandrasekaran
Global Head, Delivery Excellence, Governance & Compliance Aarthi Subramanian
Chief Financial Officer Rajesh Gopinathan
Global Head, Human Resources Ajoyendra Mukherjee
Company Secretary & Treasury Suprakash Mukhopadhyay
Marketing John Lenzen
Communication Pradipta Bagchi
Research & Development K Ananth Krishnan
Legal Vishwanathan Iyer
Geography Heads
North America, UK & Europe Surya Kant
Latin America Henry Manzano
India, Middle-East & Africa Ravi Viswanathan
Asia Pacific Girish Ramachandran
Japan AS Lakshminarayanan
Strategic Growth Unit Heads
Financial Solutions NG Subramaniam
iON Venguswamy Ramaswamy
Industry Service Unit Heads
Banking & Financial Services K Krithivasan
Banking & Financial Services Susheel Vasudevan
Banking & Financial Services Ramanamurthy Magapu
Insurance & Healthcare Suresh Muthuswami
Retail, Travel & Consumer Products Pratik Pal
Life Sciences, Manufacturing & Energy Debashis Ghosh
Manufacturing Milind Lakkad
Communication, Media & Information Services Kamal Bhadada
Service Unit Heads
Enterprise Solutions & Global Consulting Practice Krishnan Ramanujam
Engineering & Industrial Services Regu Ayyaswamy
Business Process Services Dinanath Kholkar
IT Infrastructure Services P R Krishnan
Assurance Services Siva Ganesan
Digital Enterprise Services & Solutions Satya Ramaswamy

3
Management Discussion and Analysis
The following management discussion and analysis (MD&A) should be read together with the audited consolidated financial statements of Tata Consultancy Services Limited and its subsidiaries (collectively referred to as TCS Limited, TCS or the Company) for the years ended March 31, 2016, 2015 and 2014.
The Company’s financial year ends on March 31. All references to a particular financial year are to the twelve-month period ended March 31 of that year.
Highlights
Revenue aggregated $16,544.9 million in fiscal 2016 ($15,454.4 million in fiscal 2015) representing a growth of 7.06% over fiscal 2015.
For a like to like comparison, the financial performance and other operating parameters relevant to fiscal 2016 have been analysed with reference to the performance in fiscal 2015, without considering the impact of one-time employee reward (referred to as ‘ex rewards’) in fiscal 2015.
Operating profit aggregated $4,384.6 million in fiscal 2016 ($4,150.6 million in fiscal 2015, ex rewards) - a growth of 5.64%.
Profit for the year aggregated $3,706.5 million in fiscal 2016 ($3,576.5 million in fiscal 2015, ex rewards) - a growth of 3.63%.
The employee strength was 353,843 as at March 31, 2016 (319,656 as at March 31, 2015) - a growth of 10.69%.
gross addition of employees in fiscal 2016 aggregated 90,182 of which 16,173 associates were added in overseas locations.
The Company’s earnings per share (EPS) aggregated to $1.88 in fiscal 2016 ($1.83 in fiscal 2015, ex rewards) – a growth of 2.73%.
For the first three quarters of fiscal 2016, the Company paid a total interim dividend of $0.25 per equity share. On April 18, 2016, the board of directors recommended, for approval of shareholders, a final dividend of $0.41 per equity share. The cash outflow on account of final dividend inclusive of corporate dividend tax would amount to approximately $961.8 million.
Overview
TCS is an information technology services, consulting and business solutions company, servicing large global corporations across a range of industry verticals including banking, financial services & insurance, retail & consumer packaged goods (CPg), telecom, media & entertainment, manufacturing, hi-tech, life sciences & healthcare, energy, resources & utilities, travel, transportation & hospitality and government sectors.
The Company’s expertise in traditional and new age technologies extends across its full services portfolio of consulting and enterprise solutions, application development & maintenance, assurance services, engineering & industrial services, IT infrastructure services, business process services and asset leveraged solutions.
These services are delivered through its unique global network delivery model (gNDM™), recognised as the benchmark of excellence in software development. With over 353,000 employees and a global delivery footprint that covers over 145 solution centers, TCS is amongst the world’s top 10 IT service-providers.
TCS’ focus on execution excellence, its scale, domain expertise and its array of intellectual property have been recognised by customers, giving the Company tremendous traction in the various markets it operates in. The Company’s compounded annual growth rate (CAgR) since fiscal 2007 is 21.6%, with industry-leading operating margins.
The management discussion and analysis are based on the consolidated financial statements which have been prepared in accordance with International Financial Reporting Standards (IFRS), as issued by the International Accounting Standard Board (IASB).
Management TeamFunction Name
Corporate
Chief Executive Officer & Managing Director N Chandrasekaran
Global Head, Delivery Excellence, Governance & Compliance Aarthi Subramanian
Chief Financial Officer Rajesh Gopinathan
Global Head, Human Resources Ajoyendra Mukherjee
Company Secretary & Treasury Suprakash Mukhopadhyay
Marketing John Lenzen
Communication Pradipta Bagchi
Research & Development K Ananth Krishnan
Legal Vishwanathan Iyer
Geography Heads
North America, UK & Europe Surya Kant
Latin America Henry Manzano
India, Middle-East & Africa Ravi Viswanathan
Asia Pacific Girish Ramachandran
Japan AS Lakshminarayanan
Strategic Growth Unit Heads
Financial Solutions NG Subramaniam
iON Venguswamy Ramaswamy
Industry Service Unit Heads
Banking & Financial Services K Krithivasan
Banking & Financial Services Susheel Vasudevan
Banking & Financial Services Ramanamurthy Magapu
Insurance & Healthcare Suresh Muthuswami
Retail, Travel & Consumer Products Pratik Pal
Life Sciences, Manufacturing & Energy Debashis Ghosh
Manufacturing Milind Lakkad
Communication, Media & Information Services Kamal Bhadada
Service Unit Heads
Enterprise Solutions & Global Consulting Practice Krishnan Ramanujam
Engineering & Industrial Services Regu Ayyaswamy
Business Process Services Dinanath Kholkar
IT Infrastructure Services P R Krishnan
Assurance Services Siva Ganesan
Digital Enterprise Services & Solutions Satya Ramaswamy

4
Annual Report 2015-16
Significant accounting policies
Note 3 of ‘Notes to Consolidated Financial Statements’ gives the summary of significant accounting policies used for the preparation and presentation of the consolidated financial statements.
The functional currency of Tata Consultancy Services Limited and its Indian subsidiaries is the Indian rupee, whereas the functional currency of foreign subsidiaries are the currencies in their respective countries of incorporation. The accompanying consolidated financial statements are presented in US dollars ($).
The preparation of consolidated financial statements in conformity with the recognition and measurement principles of IFRS requires management to make estimates and assumptions that affect (a) the reported amounts of assets and liabilities, (b) disclosures of contingent liabilities at the date of these consolidated financial statements and (c) the reported amounts of revenue and expenses for the years presented. Estimates and underlying assumptions are reviewed on an ongoing basis. Revisions to key source of estimation of uncertainty at the date of the consolidated financial statements, which may cause a material adjustment to the carrying amounts of assets and liabilities within the next financial year, is in respect of (a) impairment of goodwill, (b) useful lives of property, plant and equipment, (c) valuation of deferred tax assets and (d) contingent liabilities. Actual results could differ from these estimates.
The Company has reviewed and revised the useful lives and the depreciation method of property, plant and equipment. Accordingly, the Company has recognised an additional depreciation expense of $34.9 million for the year ended March 31, 2015.
5
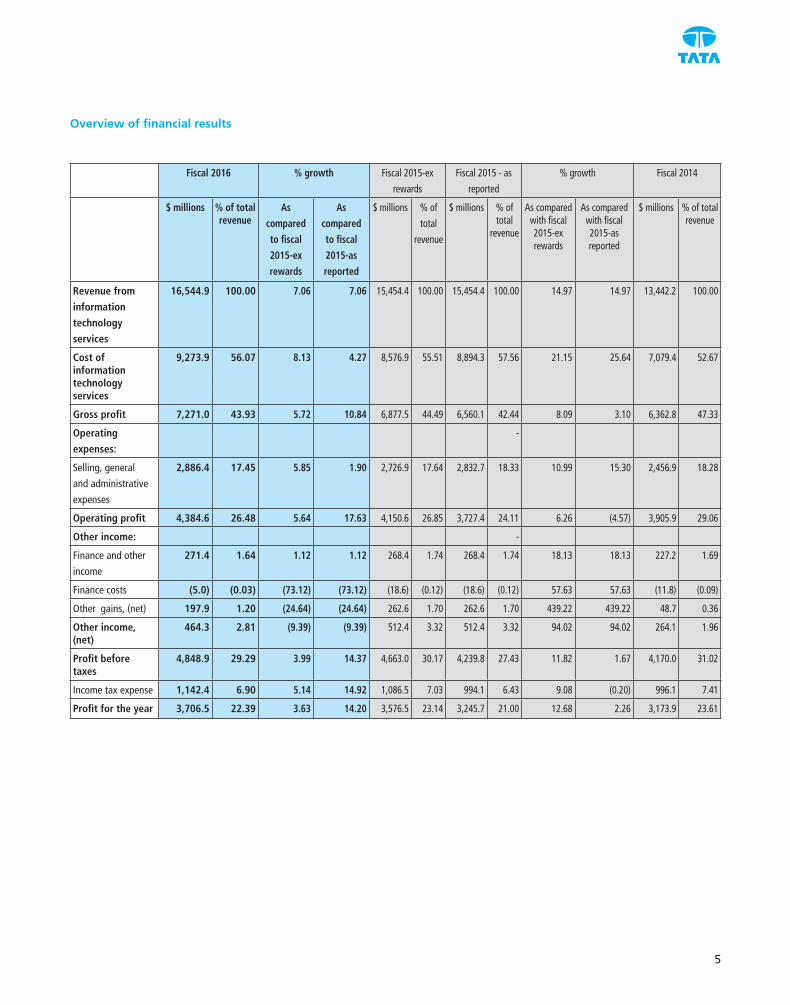
Overview of financial results
Fiscal 2016 % growth Fiscal 2015-ex
rewards
Fiscal 2015 - as
reported
% growth Fiscal 2014
$ millions % of total revenue
As
compared
to fiscal
2015-ex
rewards
As
compared
to fiscal
2015-as
reported
$ millions % of
total
revenue
$ millions % of total
revenue
As compared with fiscal 2015-ex rewards
As compared with fiscal 2015-as reported
$ millions % of total revenue
Revenue from
information
technology
services
16,544.9 100.00 7.06 7.06 15,454.4 100.00 15,454.4 100.00 14.97 14.97 13,442.2 100.00
Cost of information technology services
9,273.9 56.07 8.13 4.27 8,576.9 55.51 8,894.3 57.56 21.15 25.64 7,079.4 52.67
Gross profit 7,271.0 43.93 5.72 10.84 6,877.5 44.49 6,560.1 42.44 8.09 3.10 6,362.8 47.33
Operating
expenses:
-
Selling, general
and administrative
expenses
2,886.4 17.45 5.85 1.90 2,726.9 17.64 2,832.7 18.33 10.99 15.30 2,456.9 18.28
Operating profit 4,384.6 26.48 5.64 17.63 4,150.6 26.85 3,727.4 24.11 6.26 (4.57) 3,905.9 29.06
Other income: -
Finance and other
income
271.4 1.64 1.12 1.12 268.4 1.74 268.4 1.74 18.13 18.13 227.2 1.69
Finance costs (5.0) (0.03) (73.12) (73.12) (18.6) (0.12) (18.6) (0.12) 57.63 57.63 (11.8) (0.09)
Other gains, (net) 197.9 1.20 (24.64) (24.64) 262.6 1.70 262.6 1.70 439.22 439.22 48.7 0.36
Other income, (net)
464.3 2.81 (9.39) (9.39) 512.4 3.32 512.4 3.32 94.02 94.02 264.1 1.96
Profit before taxes
4,848.9 29.29 3.99 14.37 4,663.0 30.17 4,239.8 27.43 11.82 1.67 4,170.0 31.02
Income tax expense 1,142.4 6.90 5.14 14.92 1,086.5 7.03 994.1 6.43 9.08 (0.20) 996.1 7.41
Profit for the year 3,706.5 22.39 3.63 14.20 3,576.5 23.14 3,245.7 21.00 12.68 2.26 3,173.9 23.61
6
Annual Report 2015-16
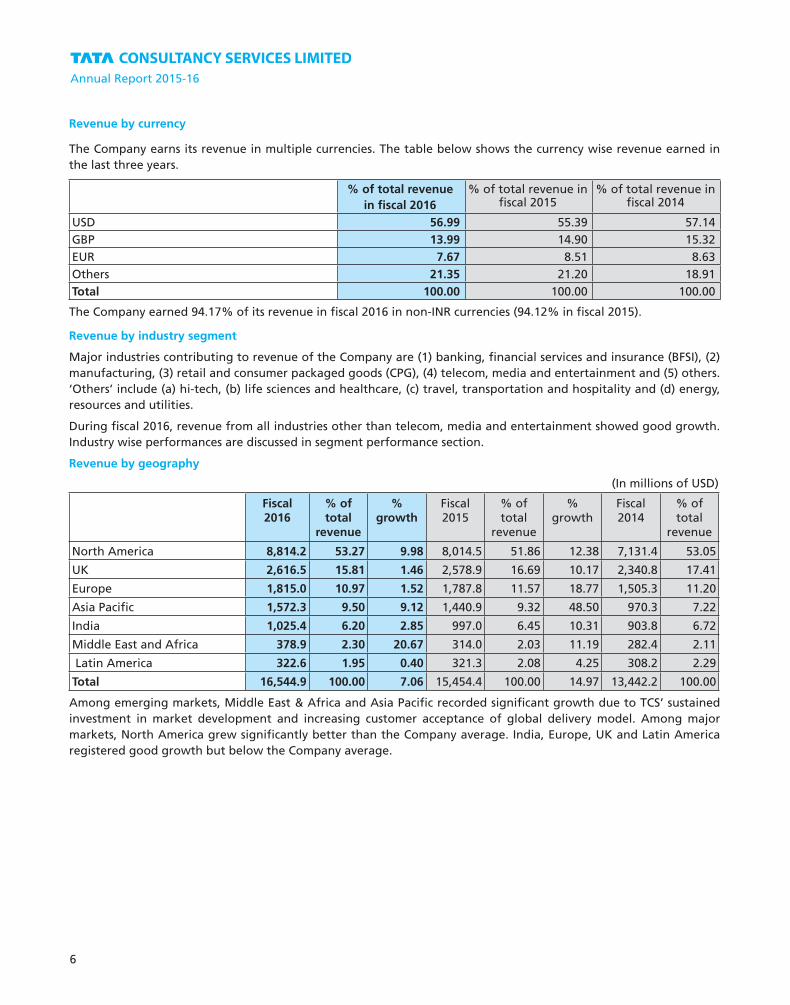
Revenue by currency
The Company earns its revenue in multiple currencies. The table below shows the currency wise revenue earned in the last three years.
% of total revenue in fiscal 2016
% of total revenue in fiscal 2015
% of total revenue in fiscal 2014
USD 56.99 55.39 57.14 gBP 13.99 14.90 15.32 EUR 7.67 8.51 8.63 Others 21.35 21.20 18.91 Total 100.00 100.00 100.00
The Company earned 94.17% of its revenue in fiscal 2016 in non-INR currencies (94.12% in fiscal 2015).
Revenue by industry segment
Major industries contributing to revenue of the Company are (1) banking, financial services and insurance (BFSI), (2) manufacturing, (3) retail and consumer packaged goods (CPg), (4) telecom, media and entertainment and (5) others. ‘Others’ include (a) hi-tech, (b) life sciences and healthcare, (c) travel, transportation and hospitality and (d) energy, resources and utilities.
During fiscal 2016, revenue from all industries other than telecom, media and entertainment showed good growth. Industry wise performances are discussed in segment performance section.
Revenue by geography
(In millions of USD)
Fiscal 2016
% of total
revenue
% growth
Fiscal 2015
% of total
revenue
% growth
Fiscal 2014
% of total
revenue
North America 8,814.2 53.27 9.98 8,014.5 51.86 12.38 7,131.4 53.05
Uk 2,616.5 15.81 1.46 2,578.9 16.69 10.17 2,340.8 17.41
Europe 1,815.0 10.97 1.52 1,787.8 11.57 18.77 1,505.3 11.20
Asia Pacific 1,572.3 9.50 9.12 1,440.9 9.32 48.50 970.3 7.22
India 1,025.4 6.20 2.85 997.0 6.45 10.31 903.8 6.72
Middle East and Africa 378.9 2.30 20.67 314.0 2.03 11.19 282.4 2.11
Latin America 322.6 1.95 0.40 321.3 2.08 4.25 308.2 2.29
Total 16,544.9 100.00 7.06 15,454.4 100.00 14.97 13,442.2 100.00
Among emerging markets, Middle East & Africa and Asia Pacific recorded significant growth due to TCS’ sustained investment in market development and increasing customer acceptance of global delivery model. Among major markets, North America grew significantly better than the Company average. India, Europe, Uk and Latin America registered good growth but below the Company average.

7
Revenue by service practice
(In millions of USD)
Fiscal 2016
% of total
revenue
% growth
Fiscal 2015
% of total
revenue
% growth
Fiscal 2014
% of total
revenue
Technology services:
Application development and maintenance (ADM)
6,595.5 39.86 6.12 6,215.0 40.21 11.16 5,591.1 41.59
Enterprise solutions (ES) & Consulting
2,893.0 17.49 (0.94) 2,920.6 18.90 15.32 2,532.5 18.84
Assurance services 1,429.2 8.64 8.71 1,314.7 8.51 16.65 1,127.0 8.38
Infrastructure services (IS) 2,474.1 14.95 15.80 2,136.4 13.82 33.18 1,604.2 11.93
Business process srevices (BPS) 1,916.4 11.58 6.19 1,804.7 11.68 11.67 1,616.1 12.02
Engineering and industrial services (EIS)
747.0 4.52 7.02 698.0 4.52 10.36 632.5 4.71
Asset leveraged solutions 489.7 2.96 34.16 365.0 2.36 7.73 338.8 2.53
Total 16,544.9 100.00 7.06 15,454.4 100.00 14.97 13,442.2 100.00
Asset leveraged solutions registered the highest growth (34.16%) well above the Company average. IS and assurance services recorded higher growth than the Company average, while growth in EIS, BPS, ADM and ES & consulting were lower.
ADM continues to be the major contributor although its relative weight to the total revenue has come down over the past years (39.86% in fiscal 2016, 52.20% in fiscal 2007) in line with our strategy of focusing on new services.
Cost of revenue (COR)
Cost of revenue (COR) includes expenses directly attributable for the execution of projects such as compensation of employees, travel expenses, employee allowances, fees to external consultants, depreciation & amortisation of production related equipment, software, facility expenses and communication costs.
For the purpose of this MD&A, employee related costs and cost of external consultants taken to fill gaps of skill-set required for execution of projects have been combined under ‘manpower cost’.
(In millions of USD)
Fiscal 2016 Fiscal 2015-ex rewards Fiscal 2015 - as reported
Fiscal 2014
` crores % of total revenue
` crores % of total
revenue
` crores % of total
revenue
` crores % of total
revenue
Employee cost 6,379.1 38.56 5,925.8 38.34 6,243.2 40.39 4,984.0 37.08
Fees to external consultants 1,190.4 7.20 998.3 6.46 998.3 6.46 820.4 6.10
Manpower cost 7,569.5 45.76 6,924.1 44.80 7,241.5 46.85 5,804.4 43.18
Cost of equipment and software licences
391.3 2.36 302.7 1.97 302.7 1.97 242.6 1.81
Others 1,313.1 7.95 1,350.1 8.74 1,350.1 8.74 1,032.4 7.68
Total 9,273.9 56.07 8,576.9 55.51 8,894.3 57.56 7,079.4 52.67
As a percentage of total revenue, COR has marginally increased from 55.51% in fiscal 2015 to 56.07% in fiscal 2016.

8
Annual Report 2015-16
Employee cost increased marginally by 0.22% as a percentage of total revenue in fiscal 2016. The Company had to use the services of external consultants to supplement requirement of specialised technical and domain skills to meet client requirements. Fees for external consultants included in COR increased by 0.74% as percentage of total revenue in fiscal 2016. In relation to total revenue, cost of equipment and software licences increased by 0.39%.
Details of ‘others’ included in COR are depicted in the table given below:
(In millions of USD)
Fiscal 2016 % of total revenue
Fiscal 2015 - as reported
% of total revenue
Fiscal 2014 % of total revenue
Facility expenses 329.9 1.99 353.5 2.29 271.6 2.02
Travel 243.4 1.47 238.2 1.54 175.0 1.30
Depreciation & amortisation 205.7 1.24 208.0 1.35 141.0 1.05
Communication 124.6 0.75 122.6 0.79 97.7 0.73
Others 409.5 2.50 427.8 2.77 347.0 2.58
Total 1,313.1 7.95 1,350.1 8.74 1,032.3 7.68
Selling, general and administrative (SG&A) expenses
The Company’s Sg&A expenses primarily comprise compensation for employees in sales, administration and other functions not directly engaged in the IT services delivery process. Sg&A also includes depreciation and amortisation of intangibles and software for internal use, facility expenses, business promotion expenses, allowances for uncollectible receivables, travel expenses, legal and professional fees, marketing expenses and other general expenses not directly attributable to execution of projects.
For the purpose of this MD&A, employee related costs and cost of external consultants have been combined under ‘manpower cost’.
(In millions of USD)
Fiscal 2016
% of total
revenue
Fiscal 2015 - ex rewards
% of total
revenue
Fiscal 2015 - as reported
% of total
revenue
Fiscal 2014
% of total
revenue
Employee cost 2,050.8 12.40 1,929.8 12.48 2,035.6 13.17 1,676.8 12.47
Fees to external consultants 89.6 0.54 86.2 0.56 86.2 0.56 62.9 0.47
Manpower cost 2,140.4 12.94 2,016.0 13.04 2,121.8 13.73 1,739.7 12.94
Others 746.0 4.51 710.9 4.60 710.9 4.60 717.2 5.34
Total 2,886.4 17.45 2,726.9 17.64 2,832.7 18.33 2,456.9 18.28
As a percentage of total revenue, Sg&A decreased marginally by 0.19%, from 17.64% in fiscal 2015 to 17.45% in fiscal 2016.

9
Details of ‘other’ expenses included in Sg&A are shown in the table below:
(In millions of USD)
Fiscal 2016
% of total revenue
Fiscal 2015 - as reported
% of total revenue
Fiscal 2014
% of total revenue
Facility expenses 188.9 1.14 166.2 1.08 185.0 1.38
Travel 161.8 0.98 154.4 1.01 160.6 1.20
Depreciation & amortisation 81.8 0.49 97.9 0.63 76.7 0.57
Education, recruitment and training 31.0 0.19 37.6 0.24 48.7 0.36
Communication 44.2 0.27 49.8 0.32 46.3 0.34
Bad debts 20.6 0.12 29.0 0.19 15.6 0.12
Other expenses 217.7 1.32 176.0 1.14 184.3 1.37
Total 746.0 4.51 710.9 4.60 717.2 5.34
Operating profit
Operating profit has grown by 5.64% in fiscal 2016. As a percentage of total revenue, it decreased marginally by 0.37%, mainly due to increase in COR expenses by 0.56% and offset by decrease in Sg&A expenses by 0.19% respectively.
Other income / (expense)
Other income / (expense) includes interest and dividend income, foreign currency exchange gains and losses, profit / loss on sale of investments, income from rent, miscellaneous income and interest expense on bank overdraft and debt.
(In millions of USD)Fiscal 2016
% of total
revenue
Fiscal 2015 - as reported
% of total
revenue
Fiscal 2014
% of total
revenueInterest income 265.8 1.61 263.8 1.71 222.7 1.65 Interest expense 5.0 0.03 18.6 0.12 11.8 0.09 Net interest income 260.8 1.58 245.2 1.59 210.9 1.57 Net foreign exchange gains 113.1 0.68 212.6 1.38 6.6 0.05 Dividend received 1.8 0.01 1.6 0.01 1.5 0.01 Rental income 3.8 0.02 3.0 0.02 3.0 0.02 Others, net 84.8 0.51 50.0 0.32 42.1 0.31 Total 464.3 2.81 512.4 3.32 264.1 1.96
Other income / (expense) decreased by 0.51% of total revenue in fiscal 2016, mainly due to decrease in foreign exchange gains.
Income tax
Income tax expense comprises current and deferred tax expense.
Tax expense increased to $1,142.4 million in fiscal 2016 from $994.1 million as reported in fiscal 2015. As a percentage of revenue, it has increased from 6.43% in fiscal 2015 to 6.90% in fiscal 2016.
Profit for the year
The Company’s profit for the year in fiscal 2016 was $3,706.5 million (22.39% of total revenue) as compared to $3,576.5 million in fiscal 2015 ex rewards (23.14% of total revenue). The decrease of 0.75% in terms of total revenue is primarily attributable to decrease in profit before taxes.

10
Annual Report 2015-16
Segment performance
Operating segments are components of the Company for which discrete financial information are made available for evaluation of performance in order to meet targets and long term goals.
TCS has identified industry as its reportable segment. Revenue and expenses directly attributable to segments are reported under each reportable segment. Expenses which are not directly identifiable to each reporting segment have been allocated on the basis of associated revenue of the segment and manpower efforts. All other expenses which are not attributable or allocable to segments have been disclosed as unallocable expenses.
Segment summary
(In millions of USD)
Fiscal 2016 % of total revenue
% growth Fiscal 2015 % of total revenue
% growth Fiscal 2014 % of total revenue
Banking, financial services and insurance (BFSI)
6,724.7 40.65 6.77 6,298.1 40.75 9.16 5,769.4 42.92
Retail and CPg 2,325.7 14.06 11.01 2,095.0 13.56 12.71 1,858.8 13.83
Telecom, media and entertainment
1,805.5 10.91 1.09 1,786.1 11.56 13.07 1,579.7 11.75
Manufacturing 1,660.6 10.04 10.14 1,507.7 9.76 31.30 1,148.3 8.54
Others 4,028.4 24.34 6.93 3,767.5 24.37 22.08 3,086.0 22.96
Total 16,544.9 100.00 7.06 15,454.4 100.00 14.97 13,442.2 100.00
Banking, financial services and insurance (BFSI)
The status of BFSI industry and details of recent significant developments have been given in the management discussion and analysis for Indian gAAP.
In fiscal 2016, BFSI constituted 40.65% of Company’s revenue (40.75% in fiscal 2015), growing at 6.77% (9.16% in fiscal 2015).
Telecom, media & entertainment
The status of telecom, media and entertainment industry and details of recent significant developments have been given in the management discussion and analysis for Indian gAAP.
In fiscal 2016, telecom, media & entertainment constituted 10.91% of Company’s revenue (11.56% in fiscal 2015), growing at 1.09% (13.07% in fiscal 2015).
Retail and (CPG)
The status of retail & CPg industry and details of recent significant developments have been given in the management discussion and analysis for Indian gAAP.
In fiscal 2016, retail & CPg constituted 14.06% of Company’s revenue (13.56% in fiscal 2015), growing at 11.01% (12.71% in fiscal 2015).
Manufacturing
The status of manufacturing industry and details of recent significant developments have been given in the management discussion and analysis for Indian gAAP.
In fiscal 2016, manufacturing constituted 10.04% of Company’s revenue (9.76% in fiscal 2015), growing at 10.14% (31.30% in fiscal 2015).

11
Others
Segments combined in ‘Others’ includes:
• Lifesciencesandhealthcare
• Energy,resourcesandutilities
• Travel,transportationandhospitality
• Hi-tech
Despite a sharp slowdown in the energy sub-segment towards the end of the fiscal year, resulting from the depressed oil prices, all the segments grouped in ‘Others’ showed good revenue growth over fiscal 2015, reflecting the Company’s growing traction in these industries on the back of strong domain expertise and domain-specific digital solutions.
In fiscal 2016, the aggregate growth of ‘Others’ segment showed a good growth of 6.93%. The share of these segments in aggregate revenue remained steady at 24.34% in fiscal 2016 (24.37% in fiscal 2015).
‘Life sciences & healthcare’ registered high growth in revenue at 18.54% followed by ‘travel, transportation and hospitality’ 10.12%, ‘energy, resources and utilities’ 5.94% and ‘hi-tech’ 5.47%.
Financial position
overview
As at March 31, 2016, the Company’s balance sheet and liquidity position remains strong and it is well positioned to support its strategies and growth plans. Cash and cash equivalents was $950.3 million as at March 31, 2016 ($297.6 million as at March 31, 2015), an increase of $652.7 million from the prior year-end position. The Company’s robust cash flows from operations ensure funding of most of its cash requirements from internally generated funds.
As at March 31, 2016, the Company’s trade receivables stood at $3,633.9 million ($3,266.3 million as at March 31, 2015). Additions to property, plant and equipment in fiscal 2016 were $472.9 million ($600.7 million in fiscal 2015). Capital work in progress aggregated $274.6 million as at March 31, 2016 ($468.5 million as at March 31, 2015).
The total equity increased to $11,102.0 million in fiscal 2016 from $9,331.0 million in fiscal 2015.
During fiscal 2016, the Company generated $3,186.5 million in cash from operations after tax payments ($3,462.3 million in fiscal 2015).
Liquidity and capital resources
The Company has consistently generated strong cash flow from operations. The Company ensures additional liquidity for the conduct of its business operations by ensuring adequate credit facilities for all its units. As at March 31, 2016, the Company had available lines of credit with multiple banks aggregating $914.6 million interchangeable between fund-based and non fund-based limits ( $920.3 million as at March 31, 2015).
Working capital
As at March 31, 2016, the Company had $7,192.5 million in working capital ($5,470.0 million as at March 31, 2015).

12
Annual Report 2015-16
Analysis of working capital
(In millions of USD)
As at March 31, 2016
As at March 31, 2015
Increase/ (decrease)
Current assets 9,542.7 7,814.5 1,728.2
Current liabilities 2,350.2 2,344.5 5.7
Working capital 7,192.5 5,470.0 1,722.5
Current ratio 4.06 3.33 0.73
Capital employed (total equity + non-current liabilities) 11,418.9 9,654.7 1,764.2
Working capital as a percentage of capital employed 62.99 56.66 6.33
Total assets 13,769.1 11,999.2 1,769.9
Working capital as a percentage of total assets 52.24 45.59 6.65
The increase in working capital as a percentage of capital employed is primarily attributable to the one-time employee reward of $423.2 million which was provided in fiscal 2015 and liquidated in fiscal 2016.
Details of major components of current assets and current liabilities are analysed below.
Overview of cash, bank and investments
(In millions of USD)As at March
31, 2016As at
March 31, 2015
As at March 31, 2016
As at March 31,
2015
As at March 31, 2016
As at March 31,
2015
Increase/ (decrease)
Current Non -current TotalInvestments 3,271.8 239.9 51.8 40.5 3,323.6 280.4 3,043.2 Cash and bank and in hand
515.4 241.2 - - 515.4 241.2 274.2
Deposits with banks 442.9 2,674.4 62.6 79.9 505.5 2,754.3 (2,248.8)Inter-corporate deposits 259.8 184.4 372.1 251.2 631.9 435.6 196.3 Total 4,489.9 3,339.9 486.5 371.6 4,976.4 3,711.5 1,264.9
Investments exclude liabilities for purchase of government securities. The increase in investments is primarily on account of investment in government securities.
Trade receivables (AR) and unbilled revenue (UBR)
(In millions of USD)As at March
31, 2016% of total revenue
As at March 31, 2015
% of total revenue
Trade receivables 3,633.9 21.96 3,266.3 21.14 Unbilled revenue 602.6 3.64 611.6 3.96 Total 4,236.5 25.61 3,877.9 25.09
The Company monitors AR and UBR separately and collectively. The close monitoring has ensured that the AR and UBR as a percentage of revenue has remained steady (25.61% in fiscal 2016, 25.09% in fiscal 2015).
Trade payables
Trade payables have increased from $1,411.3 million in fiscal 2015 to $1,138.3 million in fiscal 2016. As a percentage of revenue, trade payables have decreased from 9.13% in fiscal 2015 to 6.88% in fiscal 2016. The decrease is primarily attributable to the one-time employee reward of $423.2 million which was provided in fiscal 2015 and liquidated in fiscal 2016 constituting 2.56% of revenues.

13
Non – current assets
Property, plant and equipment (PPE)
(In millions of USD)Asset addition
fiscal 2016Asset addition
fiscal 2015Increase/
(decrease)PPE as at March 31,
2016
PPE as at March 31,
2015
Increase/ (decrease)
Freehold land - - - 52.6 55.5 (2.9)Buildings 196.3 213.4 (17.1) 751.7 635.2 116.5 Leasehold improvements 28.2 71.3 (43.1) 130.0 139.4 (9.4)Computer equipment 99.6 169.3 (69.7) 216.9 244.8 (27.9)Furniture, fixtures, office equipments and other assets
148.8 146.7 2.1 353.9 305.8 48.1
Total 472.9 600.7 (127.8) 1,505.1 1,380.7 124.4 Capital work-in-progress 274.6 468.5 (193.9)Total PPE 1,779.7 1,849.2 (69.5)
The Company has been investing in infrastructure development across various locations in India to meet its growing business needs. In fiscal 2016, TCS has invested in state-of-the-art facilities at Mumbai, Hyderabad, kolkata, Thiruvananthapuram, Nagpur, Bangalore & Delhi for significant capacities.
Goodwill
(In millions of USD)As at
March 31, 2016As at
March 31, 2015Opening balance 593.1 662.6 Additional amount recognised from business combination during the year - 0.9 Foreign currency exchange loss (17.7) (70.4)Closing balance 575.4 593.1
The Company carries out impairment test of goodwill on annual basis.
Detailed note on goodwill is available in note 13 of the notes to consolidated financial statements.
Borrowings
(In millions of USD)As at
March 31, 2016
As at March 31,
2015
As at March 31,
2016
As at March 31,
2015
As at March 31,
2016
As at March 31,
2015
Increase/ (decrease)
Current Non -current TotalBorrowings 24.5 38.9 12.5 18.3 37.0 57.2 (20.2)Total 24.5 38.9 12.5 18.3 37.0 57.2 (20.2)
Current borrowings were primarily on account of bank overdrafts required for management of working capital. Non-current borrowings were primarily on account of finance lease obligations.

14
Annual Report 2015-16
Shareholders’ equity
(In millions of USD)
As at March 31, 2016
As at March 31, 2015
Increase/ (decrease)
Share capital 43.8 43.6 0.2
Share premium 911.2 427.5 483.7
Retained earnings 12,499.4 10,669.7 1,829.7
Accumulated other comprehensive losses (2,406.0) (1,955.9) (450.1)
Equity attributable to shareholders of TCS Limited 11,048.4 9,184.9 1,863.5
Non-controlling interests 53.6 146.1 (92.5)
Total 11,102.0 9,331.0 1,771.0
The increase in total equity is mainly attributable to the following:
• Increaseinsharecapitalandsharepremiumonaccountof11,699,962equitysharesof$0.02(`1) each having fair value of $483.9 million issued to the non-controlling shareholders of CMC Limited in terms of the Scheme of arrangement sanctioned by the High Courts of Judicature at Bombay and Hyderabad.
• Increase in retainedearningsonaccountof increase inprofit for theyear ($3,687.5millions forfiscal2016,$3,212.3 millions for fiscal 2015) and decrease in dividend paid ($1,465.6 millions in fiscal 2016, $2,811.4 millions in fiscal 2015)
• Increase in losses on account of foreign currency translation ($2,407.4 millions as at March 31, 2016, $1,962.8 millions as at March 31, 2015)
Summary of cash flows
The Company’s cash flows from operating, investing and financing activities, is summarised below.
The one-time employee reward, provided on accrual basis in the financial statements for fiscal 2015 was paid in fiscal 2016. In the following discussions, the impact of the one-time employee reward on cash flow from operating activities has been excluded for like to like comparison.
(In millions of USD)
Fiscal 2016 - as reported
Fiscal 2016 - excluding
payment of one-time employee
reward
Fiscal 2015 - as reported
Fiscal 2014
Cash and cash equivalents at the beginning of the year 297.6 297.6 244.5 339.3
Net cash provided by operating activities 3,186.5 3,186.5 3,462.3 2,613.0
Net cash used in investing activities (1,050.3) (1,050.3) (556.2) (1,770.4)
Net cash used in financing activities (1,498.8) (1,498.8) (2,835.1) (930.7)
Net increase in cash and cash equivalents 637.4 637.4 71.0 (88.1)
Effect of foreign exchange on cash and cash equivalents 15.3 15.3 (17.9) (6.7)
Cash and cash equivalents at the end of the year 950.3 950.3 297.6 244.5

15
Cash flows from operating activities
(In millions of USD)
Fiscal 2016 - as reported
Fiscal 2016 - excluding
payment of one-time employee
reward
Fiscal 2015 - excluding provision
of one-time employee
reward
Fiscal 2015 - as reported
Fiscal 2014
Profit for the year 3,706.5 3,706.5 3,668.9 3,245.7 3,173.9
Adjustments:
Depreciation and amortisation 287.5 287.5 305.8 305.8 217.7
Others 1,088.0 1,088.0 988.8 988.8 970.2
Adjusted operating income before working capital changes
5,082.0 5,082.0 4,963.5 4,540.3 4,361.8
Effect of working capital changes (741.7) (332.8) (272.9) 150.3 (590.4)
Cash generated from operations 4,340.3 4,749.2 4,690.6 4,690.6 3,771.4
Taxes paid (1,153.8) (1,174.9) (1,228.3) (1,228.3) (1,158.4)
Net cash provided by operating activities 3,186.5 3,574.3 3,462.3 3,462.3 2,613.0
Cash generated from operations, was $4,749.2 million in fiscal 2016 ($4,690.6 million in fiscal 2015), registering an increase of 1.2% over the previous fiscal. Net cash provided by operating activities post tax, increased to $3,574.3 million in fiscal 2016 ($3,462.3 million in fiscal 2015).
Cash flows from investing activities
(In millions of USD)
Fiscal 2016 Fiscal 2015 Fiscal 2014
Net (purchase) / sale of investments (2,969.7) 330.7 (202.6)
Net purchase of property, plant and equipment (299.6) (479.1) (506.0)
Purchase of subsidiries and businesses, net of cash acquired (including additional consideration & purchase price adjustments)
- (43.9) (75.2)
Net (investment) / redemption of inter-corporate deposits (205.1) 29.9 135.1
Net investment in bank deposits 2,424.5 (393.5) (1,120.5)
Purchase of intangible assets (0.4) (0.3) (1.2)
Net cash used in investing activities (1,050.3) (556.2) (1,770.4)
Increase in cash outflows on account of investing activities was primarily attributable to net investment in government securities amounting to $3,063.7 million.

16
Annual Report 2015-16
Cash flows from financing activities
(In millions of USD)
Fiscal 2016 Fiscal 2015 Fiscal 2014
Dividend paid including dividend tax (1,478.4) (2,818.1) (906.6)
Others (20.4) (17.0) (24.1)
Net cash used in financing activities (1,498.8) (2,835.1) (930.7)
In fiscal 2016, dividend paid includes the final dividend and tax thereon for fiscal 2015 approved by the shareholders at the last annual general meeting. In addition, the dividend paid includes the interim dividend of fiscal 2016.
‘Others’ in fiscal 2016 includes net payments related to borrowings.
Risks
A robust enterprise compliance management (ECM) framework and process has been deployed across the Company. The process is enabled by a digital platform that provides an enterprise-wide view of compliance across global locations. The Company ensures compliance of all applicable laws globally, including those relating to employment & immigration, taxation, forex and export controls, health, safety & environment (HSE), company laws, establishment, SEZ regulations, data privacy, anti-bribery & anti-corruption regulations and IT Security. A committee at corporate level oversees and monitors the deployment of the compliance function. Changes in the applicable regulations are tracked on a global basis.
TCS has aligned its current systems of internal financial control with the requirement of Companies Act 2013, on lines of globally accepted risk based framework as issued by the committee of sponsoring organisations (COSO) of the treadway commission. The Internal Control – Integrated Framework (the 2013 framework) is intended to increase transparency and accountability in an organisation’s process of designing and implementing a system of internal control. The framework requires a company to identify and analyse risks and manage appropriate responses. The Company has successfully laid down the framework and ensured its effectiveness.
Significant risks faced by the Company have been discussed in the management discussion and analysis for Indian gAAP.
Cautionary statement
Certain statements made in the management discussion and analysis report relating to the Company’s objectives, projections, outlook, expectations, estimates, etc. may constitute ‘forward looking statements’ within the meaning of applicable laws and regulations. Actual results may differ from such expectations, projections, etc., whether express or implied. Several factors could make significant difference to the Company’s operations. These include economic conditions affecting demand and supply, government regulations and taxation, natural calamities, etc. over which the Company does not have any direct control.

17
INDEPENDENT AUDITORS' REPORT
To the Board of Directors and Shareholders ofTata Consultancy Services LimitedMumbai, India
We have audited the accompanying consolidated financial statements of Tata Consultancy Services Limited and its subsidiaries (the "Company"), which comprise the consolidated statements of financial position as of March 31, 2016 and 2015, and the related consolidated statements of profit or loss and other comprehensive income, changes in equity and cash flows for each of three years in the period ended March 31, 2016, and the related notes to the consolidated financial statements.
Management’s Responsibility for the Consolidated Financial Statements
Management is responsible for the preparation and fair presentation of these consolidated financial statements in accordance with the International Financial Reporting Standards as issued by the International Accounting Standards Board; this includes the design, implementation and maintenance of internal control relevant to the preparation and fair presentation of consolidated financial statements that are free from material misstatement, whether due to fraud or error.
Auditors’ Responsibility
Our responsibility is to express an opinion on these consolidated financial statements based on our audits. We conducted our audits in accordance with auditing standards generally accepted in the United States of America. Those standards require that we plan and perform the audit to obtain reasonable assurance about whether the consolidated financial statements are free from material misstatement.
An audit involves performing procedures to obtain audit evidence about the amounts and disclosures in the consolidated financial statements. The procedures selected depend on the auditor’s judgment, including the assessment of the risks of material misstatement of the consolidated financial statements, whether due to fraud or error. In making those risk assessments, the auditor considers internal control relevant to the Company's preparation and fair presentation of the consolidated financial statements in order to design audit procedures that are appropriate in the circumstances, but not for the purpose of expressing an opinion on the effectiveness of the Company's internal control. Accordingly, we express no such opinion. An audit also includes evaluating the appropriateness of accounting policies used and the reasonableness of significant accounting estimates made by management, as well as evaluating the overall presentation of the consolidated financial statements.
We believe that the audit evidence we have obtained is sufficient and appropriate to provide a basis for our audit opinion.
Opinion
In our opinion, the consolidated financial statements referred to above present fairly, in all material respects, the financial position of Tata Consultancy Services Limited and its subsidiaries as of March 31, 2016 and 2015, and the results of their operations and their cash flows for each of three years in the period ended March 31, 2016, in accordance with the International Financial Reporting Standards as issued by International Accounting Standards Board.
Ms/ Deloitte Haskins & Sells LLPCHARTERED ACCOUNTANTS
Mumbai, IndiaDate: June 16, 2016

18
Annual Report 2015-16
Note As of March 31, 2016
As of March 31, 2015
(In millions of USD)ASSETS: Current assets:
Cash and cash equivalents 6 950.3 297.6 Bank deposits 8.0 2,618.0 Trade receivables 7 3,633.9 3,266.3 Investments 8(a) 3,393.3 239.9 Unbilled revenue 602.6 611.6 Other current financial assets 9(a) 618.8 433.7 Current income tax assets 4.8 12.0 Other current assets 10(a) 331.0 335.4
Total current assets 9,542.7 7,814.5 Non-current assets:
Bank deposits 62.6 79.9 Investments 8(b) 51.8 40.5 Other non-current financial assets 9(b) 510.5 370.1 Non-current income tax assets 673.9 654.1 Deferred income tax assets (net) 17 435.0 417.9 Property, plant and equipment 11 1,779.7 1,849.2 Intangible assets 12 20.3 35.0 Goodwill 13 575.4 593.1 Other non-current assets 10(b) 117.2 144.9
Total non-current assets 4,226.4 4,184.7 TOTAL ASSETS 13,769.1 11,999.2
LIABILITIES AND EQUITY: Liabilities: Current liabilities:
Trade and other payables 14 1,138.3 1,411.3 Borrowings 24.5 38.9 Other current financial liabilities 15(a) 349.4 189.8 Unearned and deferred revenue 205.1 169.8 Employee benefit obligations 20(a) 246.9 216.7 Other provisions 17.3 16.5 Current income tax liabilities 121.5 87.2 Other current liabilities 16(a) 247.2 214.3
Total current liabilities 2,350.2 2,344.5 Non-current liabilities:
Borrowings 12.5 18.3 Other non-current financial liabilities 15(b) 74.4 105.8 Employee benefit obligations 20(b) 35.7 32.5 Other provisions 6.1 15.1 Deferred income tax liabilities (net) 17 121.5 87.5 Other non-current liabilities 16(b) 66.7 64.5
Total non-current liabilities 316.9 323.7 TOTAL LIABILITIES 2,667.1 2,668.2
Equity: Share capital 18 43.8 43.6 Share premium 911.2 427.5 Retained earnings 12,499.4 10,669.7 Accumulated other comprehensive losses (2,406.0) (1,955.9)
Equity attributable to shareholders of TCS Limited 11,048.4 9,184.9
Non-controlling interests 53.6 146.1 TOTAL EQUITY 11,102.0 9,331.0
TOTAL LIABILITIES AND EQUITY 13,769.1 11,999.2
See accompanying notes to consolidated financial statements
Consolidated Statements of Financial PositionAs of March 31, 2016 and 2015

19
Note Year ended March 31, 2016
Year ended March 31, 2015
Year ended March 31, 2014
(In millions of USD, except shares and per share data)Revenue from information technology services
16,544.9 15,454.4 13,442.2
Cost of information technology services 21 9,273.9 8,894.3 7,079.4 Gross profit 7,271.0 6,560.1 6,362.8 Operating expenses:
Selling, general and administrative expenses 21 2,886.4 2,832.7 2,456.9 Operating profit 4,384.6 3,727.4 3,905.9 Other income:
Finance and other income 22 271.4 268.4 227.2 Finance costs 23 (5.0) (18.6) (11.8) Other gains, (net) 24 197.9 262.6 48.7
Other income (net) 464.3 512.4 264.1
Profit before taxes 4,848.9 4,239.8 4,170.0 Income tax expense 17 1,142.4 994.1 996.1
Profit for the year 3,706.5 3,245.7 3,173.9 Other comprehensive (losses) / income, net of taxes:
Items that may be reclassified subsequently to profit or loss:
Exchange differences on translation of foreign operations
(444.7) (436.9) (591.4)
Net change in fair value of intrinsic value of cash flow hedges
(10.0) 17.3 (5.4)
Net change in fair value of time value of cash flow hedges
(3.0) (0.8) (3.0)
Net gains on financial assets other than equity shares carried at fair value through OCI
7.9 - -
Items that will not be reclassified subsequently to profit or loss:
Net gains / (losses) on equity shares carried at fair value through OCI
0.4 0.4 (0.5)
Remeasurement of defined employee benefit plans
(16.4) (25.8) 3.1
Total other comprehensive losses, net of taxes (465.8) (445.8) (597.2)Total comprehensive income for the year, net of taxes 3,240.7 2,799.9 2,576.7
Profit for the year attributable to: Shareholders of TCS Limited 3,687.5 3,212.3 3,138.9 Non-controlling interests 19.0 33.4 35.0
3,706.5 3,245.7 3,173.9 Total comprehensive income attributable to:
Shareholders of TCS Limited 3,221.9 2,778.3 2,553.8 Non-controlling interests 18.8 21.6 22.9
3,240.7 2,799.9 2,576.7
Weighted average number of shares used in computing basic and diluted earnings per share
1,966,040,455 1,958,727,979 1,958,100,069
Basic and diluted earnings per share in USD 1.88 1.64 1.60
See accompanying notes to consolidated financial statements
Consolidated Statements of Profit or Loss and Other Comprehensive IncomeFor the years ended March 31, 2016, 2015 and 2014

20
Annual Report 2015-16
(In
mil
lio
ns
of
USD
, exce
pt
share
data
)
Nu
mb
er
o
f sh
are
s S
hare
ca
pit
al
Sh
are
p
rem
ium
Reta
ined
earn
ing
s F
ore
ign
cu
rren
cy
tran
slati
on
re
serv
e
C
ash
flo
w
hed
gin
g r
ese
rve
In
vest
men
t re
valu
ati
on
re
serv
e
Eq
uit
y
att
rib
uta
ble
to
sh
are
ho
lders
o
f TC
S L
imit
ed
No
n-
con
tro
llin
g
inte
rest
s
To
tal
eq
uit
y I
ntr
insi
c valu
e
Tim
e
valu
e
Bala
nce
as
of
Ap
ril
1, 2013
1,95
7,22
0,99
6 4
3.6
427
.4
8,0
25.3
(
958.
2) (
0.7)
(1.
0) 0
.5
7,5
36.9
1
20.7
7
,657
.6
Pro
fit
for
the
year
3,1
38.9
-
-
-
-
3
,138
.9
35.
0 3
,173
.9
Oth
er c
om
pre
hen
sive
inco
me
3.0
(
579.
3) (
5.4)
(3.
0) (
0.4)
(58
5.1)
(12
.1)
(59
7.2)
Tota
l co
mp
reh
en
sive i
nco
me
-
-
-
3,1
41.9
(
579.
3) (
5.4)
(3.
0) (
0.4)
2,5
53.8
2
2.9
2,5
76.7
D
ivid
end
(in
clu
din
g t
ax o
n
div
iden
d o
f $9
3.3
mill
ion
) -
-
(
900.
1) -
-
-
-
(
900.
1) (
6.5)
(90
6.6)
Ad
just
men
t o
f eq
uit
y o
f m
erg
ed
enti
ty -
0
.1
(0.
1) -
-
-
-
-
-
-
Issu
e o
f sh
ares
an
d a
dju
stm
ent
to
no
n-c
on
tro
llin
g in
tere
st o
n m
erg
er 1
,506
,983
-
-
2
2.1
-
-
-
-
22.
1 (
22.1
) -
Bala
nce
as
of
Marc
h 3
1, 2014
1,9
58,7
27,9
79
43.
6 4
27.5
1
0,28
9.1
(1,
537.
5) (
6.1)
(4.
0) 0
.1
9,2
12.7
1
15.0
9
,327
.7
Bala
nce
as
of
Ap
ril
1, 2014
1,95
8,72
7,97
9 4
3.6
427
.5
10,
289.
1 (
1,53
7.5)
(6.
1) (
4.0)
0.1
9
,212
.7
115
.0
9,3
27.7
Pr
ofi
t fo
r th
e ye
ar 3
,212
.3
-
-
-
-
3,2
12.3
3
3.4
3,2
45.7
O
ther
co
mp
reh
ensi
ve in
com
e (
25.6
) (
425.
3) 1
7.3
(0.
8) 0
.4
(43
4.0)
(11
.8)
(44
5.8)
Tota
l co
mp
reh
en
sive i
nco
me
-
-
-
3,1
86.7
(
425.
3) 1
7.3
(0.
8) 0
.4
2,7
78.3
2
1.6
2,7
99.9
D
ivid
end
(in
clu
din
g t
ax o
n
div
iden
d o
f $3
81.0
mill
ion
) -
-
(
2,81
1.4)
-
-
-
-
(2,
811.
4) (
6.7)
(2,
818.
1)
Exce
ss o
f fa
ir v
alu
e o
ver
carr
yin
g
cost
of
sub
sid
iary
tra
nsf
erre
d t
o
no
n-c
on
tro
llin
g in
tere
sts
-
-
8.7
-
-
-
-
8
.7
59.
3 6
8.0
Net
ass
ets
rece
ived
fro
m e
nti
ty
un
der
co
mm
on
co
ntr
ol
-
-
3.3
-
-
-
-
3
.3
-
3.3
Purc
has
e o
f n
on
-co
ntr
olli
ng
in
tere
sts
-
-
(6.
7) -
-
-
-
(
6.7)
(6.
1) (
12.8
)
Ob
ligat
ion
to
acq
uir
e n
on
-co
ntr
olli
ng
inte
rest
s (R
efer
no
te 5
) -
-
-
-
-
-
-
-
(
37.0
) (
37.0
)
Bala
nce
as
of
Marc
h 3
1, 2015
1,9
58,7
27,9
79
43.
6 4
27.5
1
0,66
9.7
(1,
962.
8) 1
1.2
(4.
8) 0
.5
9,1
84.9
1
46.1
9
,331
.0
Bala
nce
as
of
Ap
ril
1, 2015
1,95
8,72
7,97
9 4
3.6
427
.5
10,
669.
7 (
1,96
2.8)
11.
2 (
4.8)
0.5
9
,184
.9
146
.1
9,3
31.0
Pr
ofi
t fo
r th
e ye
ar 3
,687
.5
-
-
-
-
3,6
87.5
1
9.0
3,7
06.5
O
ther
co
mp
reh
ensi
ve in
com
e (
16.3
) (
444.
6) (
10.0
) (
3.0)
8.3
(
465.
6) (
0.2)
(46
5.8)
Tota
l co
mp
reh
en
sive i
nco
me
-
-
-
3,6
71.2
(
444.
6) (
10.0
) (
3.0)
8.3
3
,221
.9
18.
8 3
,240
.7
Div
iden
d (
incl
ud
ing
tax
on
d
ivid
end
of
$231
.2 m
illio
n)
-
-
(1,
465.
6) -
-
-
-
(
1,46
5.6)
(12
.8)
(1,
478.
4)
Purc
has
e o
f n
on
-co
ntr
olli
ng
in
tere
sts
11,
699,
962
0.2
4
83.7
(
376.
7) -
-
-
-
1
07.2
(
107.
2) -
Rea
lised
gai
n o
n e
qu
ity
shar
es
carr
ied
at
fair
val
ue
thro
ug
h O
CI
-
-
0.8
-
-
-
(
0.8)
-
-
-
Rem
easu
rem
ent
of
ob
ligat
ion
to
ac
qu
ire
no
n-c
on
tro
llin
g in
tere
sts
-
-
-
-
-
-
-
-
8.7
8
.7
Bala
nce
as
of
Marc
h 3
1, 2016
1,9
70,4
27,9
41
43.
8 9
11.2
1
2,49
9.4
(2,
407.
4) 1
.2
(7.
8) 8
.0
11,
048.
4 5
3.6
11,
102.
0
See a
cco
mp
an
yin
g n
ote
s to
co
nso
lid
ate
d fi
nan
cial
state
men
ts
Co
nso
lid
ate
d S
tate
men
ts o
f C
han
ges
in E
qu
ity
For
the y
ears
en
ded
Marc
h 3
1, 2014, 2015 a
nd
2016

21
Consolidated Statements of Cash FlowsFor the years ended March 31, 2016, 2015 and 2014
Year ended March 31, 2016
Year ended March 31, 2015
Year ended March 31, 2014
(In millions of USD)
Cash flows from operating activities:
Profit for the year 3,706.5 3,245.7 3,173.9
Adjustments to reconcile profit or loss to net cash provided by operating activities:
Depreciation and amortisation 287.5 305.8 217.7
Gain on disposal of property, plant and equipment (0.8) (0.4) (0.8)
Income tax expense 1,142.4 994.1 996.1
Gain on disposal of investments (70.3) (37.9) (28.3)
Interest accrued on investments - (1.4) (5.2)
Provision for diminution in value of investments - 0.2 -
Non-cash interest on put-call option liability 2.0 1.5 -
Bad debts, provision for trade receivables and advances (net)
20.6 29.0 15.6
Unrealised (gain) / loss (5.9) 3.7 (7.2)
Operating profit before working capital changes 5,082.0 4,540.3 4,361.8
Net change in:
Trade receivables (447.1) (475.2) (525.0)
Unbilled revenue (7.8) (2.0) (106.7)
Other financial assets (110.9) 28.8 (80.5)
Other assets (1.3) (126.4) (0.9)
Trade and other payables (310.5) 586.5 68.2
Unearned and deferred revenue 39.9 23.3 (1.8)
Other financial liabilities 22.3 12.4 (7.3)
Other liabilities 73.7 102.9 63.6
Cash generated from operations 4,340.3 4,690.6 3,771.4
Taxes paid (1,153.8) (1,228.3) (1,158.4)
Net cash provided by operating activities 3,186.5 3,462.3 2,613.0

22
Annual Report 2015-16
Consolidated Statements of Cash FlowsFor the years ended March 31, 2016, 2015 and 2014
Year ended March 31, 2016
Year ended March 31, 2015
Year ended March 31, 2014
(In millions of USD) Cash flows from investing activities:
Bank deposits placed (9.9) (2,488.8) (2,093.1)Inter-corporate deposits placed (385.5) (291.1) (438.8)Purchase of investments* (17,681.2) (10,912.1) (13,556.3)Purchase of property, plant and equipment (303.0) (480.3) (508.3)Purchase of intangible assets (0.4) (0.3) (1.2)Purchase of subsidiaries and business, net of cash of NIL, $4.2 million and $8.9 million respectively (including additional consideration and purchase price adjustment)
- (43.9) (75.2)
Restricted cash placed with banks (69.7) (31.5) - Proceeds from bank deposits 2,456.8 2,122.8 972.6 Proceeds from inter-corporate deposits 180.4 321.0 573.9 Proceeds from disposal of investments* 14,711.5 11,242.8 13,353.7 Proceeds from disposal of property, plant and equipment
3.4 1.2 2.3
Proceeds from restricted cash 47.3 4.0 - Net cash used in investing activities (1,050.3) (556.2) (1,770.4)
Cash flows from financing activities:Short-term borrowings (net) (11.3) 6.5 1.4 Repayment of long-term borrowings (0.1) (0.1) (0.2)Proceeds from other borrowings - - 19.5 Dividend paid to non-controlling interests (12.8) (6.7) (6.5)Dividend paid including dividend tax (1,465.6) (2,811.4) (900.1)Purchase of non-controlling interests - (12.3) - Repayment of other borrowings - - (23.2)Repayment of finance lease obligations (9.2) (11.1) (5.0)Issue of shares to non-controlling interests 0.2 - - Redemption of preference shares - - (16.6)Net cash used in financing activities (1,498.8) (2,835.1) (930.7)Net change in cash and cash equivalents 637.4 71.0 (88.1)Effect of foreign exchange on cash and cash equivalents
15.3 (17.9) (6.7)
Cash and cash equivalents, beginning of the year 297.6 244.5 339.3 Cash and cash equivalents, end of the year 950.3 297.6 244.5 Supplementary cash flow information: Interest paid 3.1 22.7 9.9 Interest received 276.6 328.8 227.6 Dividend received 1.8 1.6 1.5 Supplementary disclosure of non-cash investing activities:
Investment in shares at cost received in settlement of trade receivables
- 10.0 -
Issue of shares on acquisition of subsidiary - 11.5 - Issue of shares on merger of subsidiary 483.9 - -
See accompanying notes to consolidated financial statements
* Purchase of investments include $72.1 million, NIL and NIL as on March 31, 2016, 2015 and 2014, respectively, and Proceeds from disposal of investments include $29.7 million, NIL and NIL as on March 31, 2016, 2015 and 2014, respectively, held by TCS Foundation, formed for conducting corporate social responsibility activities of the Group.

Notes to Consolidated Financial Statements
23
1. Background and operations
Tata Consultancy Services Limited (the “Company”) and its subsidiaries (collectively “TCS Limited” or the “Group”) provide consulting-led integrated portfolio of information technology (IT) and IT-enabled services delivered through a network of locations around the globe. The Group’s full services portfolio consists of IT and Assurance Services, Business Intelligence and Performance Management, Business Process Services, Cloud Services, Connected Marketing Solutions, Consulting, Eco-sustainability Services, Engineering and Industrial Services, Enterprise Security and Risk Management, Enterprise Solutions, iON -Small and Medium Businesses, IT Infrastructure Services, Mobility Products and Services and Platform Solutions.
The Company is a public limited company incorporated and domiciled in India. The address of its corporate office is TCS House, Raveline Street, Fort, Mumbai 400001. As of March 31, 2016, Tata Sons Limited owned 73.26% of Tata Consultancy Services Limited’s equity share capital and is the holding company.
The consolidated financial statements were approved by the Board of Directors and authorised for issue on June 16, 2016.
2. Application of new and revised International Financial Reporting Standards (IFRSs)
The Group has adopted the following new standards and amendments to standards:
Amendments to IAS 19 – Defined Benefit Plans: Employee Contributions
In November 2013, IASB issued Amendments to IAS 19 to clarify the requirements that relate to how contributions from employees or third parties that are linked to service should be attributed to periods of service. In addition, it permits a practical expedient if the amount of the contributions is independent of the number of years of service, in those contributions, can, but are not required, to be recognised as a reduction in the service cost in the period in which the related service is rendered. These amendments are effective for annual periods beginning on or after July 1, 2014. The amendments do not have any material impact on the financial statements of TCS Limited.
IFRS 9 (2014) Financial Instruments
The Group has elected to early adopt IFRS 9 (2014) which supersedes all previous versions of IFRS 9. The Group had already early adopted IFRS 9 (2013).
On early adoption of IFRS 9 (2014), debt instruments that are held by the Group under a business model whose objective is achieved by both collecting contractual cash flows and selling financial assets and the contractual terms of the financial asset give rise on specified dates to cash flows that are solely payments of principal and interest on the principal amount outstanding, are recognised at fair value through other comprehensive income. There is no effect of change in classification of such debt instruments on the Group’s financial position and results in all the periods presented and therefore the change has not been applied retrospectively.
The impairment model of financial instruments in IFRS 9 (2014) is based on the premise of providing for expected losses which has been explained under note number 3(o).
3. Summary of significant accounting policies
a. Statement of compliance
These consolidated financial statements have been prepared in accordance with International Financial Reporting Standards (IFRS), as issued by the International Accounting Standard Board (IASB).
b. Basis of preparation
The consolidated financial statements have been prepared on the historical cost basis except for certain financial instruments which are measured at fair values.
c. Basis of consolidation
Tata Consultancy Services Limited consolidates all entities which are controlled by it.

Notes to Consolidated Financial Statements
24
Annual Report 2015-16
The Company establishes control when; it has power over the entity, is exposed, or has rights, to variable returns from its involvement with the entity and has the ability to affect the entity’s returns by using its power over the entity.
Subsidiaries are consolidated from the date control commences until the date control ceases.
The results of subsidiaries acquired, or sold, during the year are consolidated from the effective date of acquisition and up to the effective date of disposal, as appropriate.
All inter-company transactions, balances and income and expenses are eliminated in full on consolidation.
Changes in the Company’s interests in subsidiaries that do not result in a loss of control are accounted for as equity transactions. The carrying amount of the Company’s interests and the non-controlling interests are adjusted to reflect the changes in their relative interests in the subsidiaries. Any difference between the amount by which the non-controlling interests are adjusted and the fair value of the consideration paid or received is recognised directly in equity and attributed to owners of the Company.
d. Business combinations
The Company accounts for its business combinations under acquisition method of accounting. Acquisition related costs are recognised in profit or loss as incurred. The acquiree’s identifiable assets, liabilities and contingent liabilities that meet the condition for recognition are recognised at their fair values at the acquisition date.
Purchase consideration paid in excess of the fair value of net assets acquired is recognised as goodwill. Where the fair value of identifiable assets and liabilities exceed the cost of acquisition, the excess is recognised in determination of profit or loss after reassessing the fair values of the net assets and contingent liabilities.
The interest of non-controlling shareholders is initially measured either at fair value or at the non-controlling interests’ proportionate share of the acquiree’s identifiable net assets. The choice of measurement basis is made on an acquisition-by-acquisition basis. Subsequent to acquisition, the carrying amount of non-controlling interests is the amount of those interests at initial recognition plus the non-controlling interests’ share of subsequent changes in equity of subsidiaries.
Business combinations arising from transfers of interests in entities that are under the common control are accounted at historical cost. The difference between any consideration given and the aggregate historical carrying amounts of assets and liabilities of the acquired entity are recorded in shareholders’ equity.
e. Use of estimates and judgments
The preparation of consolidated financial statements in conformity with the recognition and measurement principles of IFRS requires management to make estimates and assumptions that affect the reported amounts of assets and liabilities, disclosures of contingent liabilities at the date of the consolidated financial statements and the reported amounts of revenue and expenses for the periods presented.
Estimates and underlying assumptions are reviewed on an ongoing basis. Revisions to accounting estimates are recognised in the period in which the estimates are revised and future periods are affected.
Key source of estimation of uncertainty at the date of the consolidated financial statements, which may cause a material adjustment to the carrying amounts of assets and liabilities within the next financial year, is in respect of impairment of goodwill, useful lives of property, plant and equipment, valuation of deferred tax assets and contingent liabilities.
Impairment of Goodwill
TCS Limited performed an annual impairment test on goodwill of $575.4 million as on March 31, 2016. The Group estimated the value-in-use of the cash generating units (CGUs) based on the future cash flows after considering current economic conditions and trends, estimated future operating results and growth rate and anticipated future economic and regulatory conditions. The estimated cash flows were developed using internal forecasts. The discount rates used for the CGUs represented the weighted-average cost of capital based on the historical market returns of comparable companies.

Notes to Consolidated Financial Statements
25
Useful lives of property, plant and equipment
The Company reviews the carrying amount of property, plant and equipment at the end of each reporting period. This reassessment may result in change in depreciation expense in future periods. The carrying amount of property, plant and equipment at March 31, 2016 is $1,779.7 million.
Valuation of deferred tax assets
The Company reviews the carrying amount of deferred tax assets at the end of each reporting period. The policy for the same has been explained under note 3(k).
f. Revenue recognition
TCS Limited earns revenue primarily from providing information technology and consultancy services, including services under contracts for software development, implementation and other related services, licensing and sale of its own software, business process services and maintenance of equipment.
TCS Limited recognises revenue as follows:
Revenue from bundled contracts that involve supplying computer equipment, licensing software and providing services is allocated separately for each element based on their fair values.
Revenue from contracts priced on a time and material basis is recognised as services are rendered and as related costs are incurred.
Revenue from software development contracts, which are generally time bound fixed price contracts, is recognised over the life of the contract using the percentage-of-completion method, with contract costs determining the degree of completion. Losses on such contracts are recognised when probable. Revenue in excess of billings is recognised as unbilled revenue in the statement of financial position; to the extent billings are in excess of revenue recognised, the excess is reported as unearned and deferred revenue in the statement of financial position.
Revenue from Business Process Services contracts priced on the basis of time and material or unit of delivery is recognised as services are rendered or the related obligation is performed.
Revenue from the sale of internally developed and manufactured systems and third party products which do not require significant modification is recognised upon delivery, which is when the absolute right to use passes to the customer and TCS Limited does not have any material remaining service obligations.
Revenue from maintenance contracts is recognised on a pro-rata basis over the period of the contract.
Revenue is recognised only when evidence of an arrangement is obtained and the other criteria to support revenue recognition are met, including the price is fixed or determinable, services have been rendered and collectability of the resulting receivables is reasonably assured.
Revenue is reported net of discounts, indirect and service taxes.
g. Leases
Finance lease
Assets taken on lease by the Group in its capacity as lessee, where the Group has substantially all the risks and rewards of ownership are classified as finance lease. Such leases are capitalised at the inception of the lease at lower of the fair value or the present value of the minimum lease payments and a liability is recognised for an equivalent amount. Each lease rental paid is allocated between the liability and the interest cost so as to obtain a constant periodic rate of interest on the outstanding liability for each year.
Operating lease
Operating lease payments are recognised on a straight line basis over the lease term in the statement of comprehensive income.

Notes to Consolidated Financial Statements
26
Annual Report 2015-16
h. Cost recognition
Costs and expenses are recognised when incurred and have been classified according to their primary functions in the following categories:
Cost of information technology services
These costs primarily include employee compensation of personnel engaged in providing services, travel expenses, employee allowances, payroll related taxes, fees to external consultants engaged in providing services, cost of hardware and software bought for reselling, depreciation and amortisation of production related equipment and software, facility expenses, communication costs and other project related expenses.
Selling, general and administrative expenses
Selling costs primarily include employee compensation for sales and marketing personnel, travel costs, advertising, business promotion expenses, allowances for delinquent receivables, facility expenses for sales and marketing offices and market research costs.
General and administrative costs primarily include employee compensation for administrative, supervisory, managerial and practice management personnel, depreciation and amortisation of non-production equipment and software, facility expenses for administrative offices, communication costs, fees to external consultants and other general expenses.
i. Foreign currency
The functional currency of Tata Consultancy Services Limited and its Indian subsidiaries is the Indian Rupee (`) whereas the functional currency of foreign subsidiaries is the currency of their countries of domicile. These consolidated financial statements are presented in US Dollars ($) to facilitate the investors’ ability to evaluate TCS Limited’s performance and financial position in comparison to similar companies domiciled in different foreign jurisdictions.
Foreign currency transactions are recorded at exchange rates prevailing on the date of the transaction. Foreign currency denominated monetary assets and liabilities are restated into the functional currency using exchange rates prevailing on the dates of statements of financial position. Gains and losses arising on settlement and restatement of foreign currency denominated monetary assets and liabilities are included in the profit or loss.
Assets and liabilities of entities with functional currency other than presentation currency have been translated to the presentation currency using exchange rates prevailing on the dates of statements of financial position. Statement of profit or loss and other comprehensive income statement items have been translated using weighted average exchange rates. Translation adjustments have been reported as foreign currency translation reserve in the statement of changes in equity.
j. Finance and other income
Dividend is recorded when the right to receive payment is established. Interest income is recognised on time proportion basis taking into account the amount outstanding and the rate applicable.
k. Income taxes
Income tax expense comprises current tax expense and the net change in the deferred tax asset or liability during the year. Current and deferred tax are recognised in profit or loss, except when they relate to items that are recognised in other comprehensive income or directly in equity, in which case, the current and deferred tax are also recognised in other comprehensive income or directly in equity, respectively.
Current income taxes
The current income tax expense includes income taxes payable by Tata Consultancy Services Limited, its overseas branches and its subsidiaries in India and overseas. The current tax payable by Tata Consultancy Services Limited and its subsidiaries in India is Indian income tax payable for their worldwide income after taking credit for tax relief available for export operations in Special Economic Zones (SEZs).

Notes to Consolidated Financial Statements
27
Current income tax payable by overseas branches of Tata Consultancy Services Limited is computed in accordance with the tax laws applicable in the jurisdiction in which the respective branch operates. The taxes paid are generally available for set off against the Indian income tax liability of Tata Consultancy Services Limited's worldwide income.
The current income tax expense for overseas subsidiaries has been computed based on the tax laws applicable to each subsidiary in the respective jurisdiction in which it operates.
Advance taxes and provisions for current income taxes are presented in the statement of financial position after off-setting advance tax paid and income tax provision arising in the same tax jurisdiction and where the relevant tax paying units intends to settle the asset and liability on a net basis.
Deferred income taxes
Deferred income tax is recognised using the balance sheet approach. Deferred income tax assets and liabilities are recognised for deductible and taxable temporary differences arising between the tax base of assets and liabilities and their carrying amount, except when the deferred income tax arises from the initial recognition of goodwill or an asset or liability in a transaction that is not a business combination and affects neither accounting nor taxable profit or loss at the time of the transaction.
Deferred income tax asset are recognised to the extent that it is probable that taxable profit will be available against which the deductible temporary differences and the carry forward of unused tax credits and unused tax losses can be utilised.
Deferred income tax liabilities are recognised for all taxable temporary differences except in respect of taxable temporary differences associated with investments in subsidiaries where the timing of the reversal of the temporary difference can be controlled and it is probable that the temporary difference will not reverse in the foreseeable future.
The carrying amount of deferred income tax assets is reviewed at each reporting date and reduced to the extent that it is no longer probable that sufficient taxable profit will be available to allow all or part of the deferred income tax asset to be utilised.
Deferred tax assets and liabilities are measured using substantively enacted tax rates expected to apply to taxable income in the years in which the temporary differences are expected to be received or settled.
For operations carried out in SEZs, deferred tax assets or liabilities, if any, have been established for the tax consequences of those temporary differences between the carrying values of assets and liabilities and their respective tax bases that reverse after the tax holiday ends.
Deferred tax assets and liabilities are offset when they relate to income taxes levied by the same taxation authority and the relevant entity intends to settle its current tax assets and liabilities on a net basis.
Deferred tax assets include Minimum Alternative Tax (MAT) paid in accordance with the tax laws in India, which is likely to give future economic benefits in the form of availability of set off against future income tax liability. Accordingly, MAT is recognised as deferred tax asset in the statement of financial position when the asset can be measured reliably and it is probable that the future economic benefit associated with the asset will be realised.
The Group recognises interest levied and penalties related to income tax assessments in income tax expenses.
l. Financial instruments
Financial assets and liabilities are recognised when the Company becomes a party to the contractual provisions of the instrument. Financial assets and liabilities are initially measured at fair value. Transaction costs that are directly attributable to the acquisition or issue of financial assets and financial liabilities (other than financial assets and financial liabilities at fair value through profit or loss) are added to or deducted from the fair value measured on initial recognition of financial asset or financial liability.
Cash and cash equivalents
TCS Limited considers all highly liquid financial instruments, which are readily convertible into known amounts of cash that are subject to an insignificant risk of change in value and having original maturities

Notes to Consolidated Financial Statements
28
Annual Report 2015-16
of three months or less from the date of purchase, to be cash equivalents. Cash and cash equivalents consist of balances with banks which are unrestricted for withdrawal and usage.
Financial assets at amortised cost
Financial assets are subsequently measured at amortised cost if these financial assets are held within a business whose objective is to hold these assets in order to collect contractual cash flows and the contractual terms of the financial asset give rise on specified dates to cash flows that are solely payments of principal and interest on the principal amount outstanding.
Financial assets at fair value through other comprehensive income
Financial assets are measured at fair value through other comprehensive income if these financial assets are held within a business whose objective is achieved by both collecting contractual cash flows and selling financial assets and the contractual terms of the financial asset give rise on specified dates to cash flows that are solely payments of principal and interest on the principal amount outstanding.
The Company has made an irrevocable election to present in other comprehensive income subsequent changes in the fair value of equity investments not held for trading.
Financial assets at fair value through profit or loss
Financial assets are measured at fair value through profit or loss unless it is measured at amortised cost or at fair value through other comprehensive income on initial recognition. The transaction costs directly attributable to the acquisition of financial assets and liabilities at fair value through profit or loss are immediately recognised in profit or loss.
Financial liabilities
Financial liabilities are measured at amortised cost using the effective interest method.
Equity instruments
An equity instrument is a contract that evidences residual interest in the assets of the company after deducting all of its liabilities. Equity instruments recognised by the Company are recognised at the proceeds received net off direct issue cost.
Hedge accounting
TCS Limited designates certain foreign exchange forward, option and future contracts as hedge instruments in respect of foreign exchange risks. These hedges are accounted for as cash flow hedges.
TCS Limited uses hedging instruments that are governed by the policies of the Company and its subsidiaries which are approved by their respective Board of Directors, which provide written principles on the use of such financial derivatives consistent with the risk management strategy of the Company and its subsidiaries.
The hedge instruments are designated and documented as hedges at the inception of the contract. The effectiveness of hedge instruments to reduce the risk associated with the exposure being hedged is assessed and measured at inception and on an ongoing basis. The ineffective portion of designated hedges are recognised immediately in the profit or loss.
The effective portion of change in the fair value of the designated hedging instrument is recognised in the other comprehensive income and accumulated under the heading cash flow hedge reserve.
The Group separates the intrinsic value and time value of an option and designates as hedging instruments only the change in intrinsic value of the option. The change in fair value of the time value and intrinsic value of an option is recognised in the statement of other comprehensive income and accounted as a separate component of equity. Such amounts are reclassified into the profit or loss when the related hedged items affect profit or loss.
Hedge accounting is discontinued when the hedging instrument expires or is sold, terminated or no longer qualifies for hedge accounting. Any gain or loss recognised in other comprehensive income and accumulated in equity till that time remains and is recognised in profit or loss when the forecasted transaction ultimately affects the profit or loss. When a forecasted transaction is no longer expected to occur, the cumulative gain or loss accumulated in equity is transferred to the profit or loss.

Notes to Consolidated Financial Statements
29
m. Property, plant and equipment
Property, plant and equipment are stated at cost, less accumulated depreciation (other than freehold land) and impairment loss, if any.
Depreciation is provided for property, plant and equipment so as to expense the cost less residual values over their estimated useful lives. The estimated useful lives, residual values and depreciation method are reviewed at the end of each reporting period, with the effect of any changes in estimate accounted for on a prospective basis. The estimated useful lives are as mentioned below:
Type of asset Method Useful livesBuildings, including leasehold buildings Straight line Lower of lease period and 20 yearsComputer equipments Straight line 4 yearsFurniture, fixtures, office equipments and other assets
Straight line 4-10 years
Leasehold improvements are amortised over the lease term. Assets held under finance leases are depreciated over the shorter of the lease term and their useful lives. Depreciation is not recorded on capital work-in-progress until construction and installation are complete and the asset is ready for its intended use. Capital work-in-progress includes capital advances.
In the previous year, the Group had revised the useful lives and the depreciation method of property, plant and equipment. Accordingly, the Group had recognised an additional depreciation expense of $34.9 million for the year ended March 31, 2015.
n. Goodwill and intangible assets
Goodwill represents the cost of acquired business as established at the date of acquisition of the business in excess of the acquirer’s interest in the net fair value of the identifiable assets, liabilities and contingent liabilities less accumulated impairment losses, if any. Goodwill is tested for impairment annually or when events or circumstances indicate that the implied fair value of goodwill is less than its carrying amount.
Intangible assets purchased including acquired in business combination, are measured at cost or fair value as of the date of acquisition, as applicable, less accumulated amortisation and accumulated impairment, if any.
Intangible assets are amortised on a straight line basis.
Intangible assets consist of customer-related intangibles, acquired contract rights, technology-related rights and rights under licensing agreement and software licences. Following table summarises the nature of intangibles and the estimated useful lives.
Nature of intangible Useful livesCustomer-related intangibles 3 yearsAcquired contract rights 3-12 yearsTechnology-related rights 5 yearsRights under licensing agreement and software licences Lower of licence period and 2-5 year
o. Impairment
A. Financial assets (other than at fair value)
The Group assesses at each date of statements of financial position whether a financial asset or a group of financial assets is impaired. IFRS 9 (2014) requires expected credit losses to be measured through a loss allowance. The Group recognises lifetime expected losses for all contract assets and /or all trade receivables that do not constitute a financing transaction. For all other financial assets, expected credit losses are measured at an amount equal to the 12-month expected credit losses or at an amount equal to the life time expected credit losses if the credit risk on the financial asset has increased significantly since initial recognition.

Notes to Consolidated Financial Statements
30
Annual Report 2015-16
B. Non-financial assets
(i) Tangible and intangible assets
Property, plant and equipment and intangible assets with finite life are evaluated for recoverability whenever there is any indication that their carrying amounts may not be recoverable. If any such indication exists, the recoverable amount (i.e. higher of the fair value less cost to sell and the value-in-use) is determined on an individual asset basis unless the asset does not generate cash flows that are largely independent of those from other assets. In such cases, the recoverable amount is determined for the cash generating unit (CGU) to which the asset belongs.
If the recoverable amount of an asset (or CGU) is estimated to be less than its carrying amount, the carrying amount of the asset (or CGU) is reduced to its recoverable amount. An impairment loss is recognised in the profit or loss.
(ii) Goodwill
CGUs to which goodwill has been allocated are tested for impairment annually, or more frequently when there is indication for impairment. If the recoverable amount of a CGU is less than its carrying amount, the impairment loss is allocated first to reduce the carrying amount of any goodwill allocated to the unit and then to the other assets of the unit pro-rata on the basis of the carrying amount of each asset in the unit.
p. Employee benefits
Defined benefit plans
For defined benefit plans, the cost of providing benefits is determined using the Projected Unit Credit Method, with actuarial valuations being carried out at the date of each statement of financial position. Actuarial gains and losses are recognised in full in the other comprehensive income for the period in which they occur. Past service cost both vested and unvested is recognised as an expense at the earlier of (a) when the plan amendment or curtailment occurs; and (b) when the entity recognises related restructuring costs or termination benefits.
The retirement benefit obligations recognised in the statement of financial position represents the present value of the defined benefit obligations reduced by the fair value of scheme assets. Any asset resulting from this calculation is limited to the present value of available refunds and reductions in future contributions to the scheme.
Defined contribution plans
Contributions to defined contribution plans are recognised as expense when employees have rendered services entitling them to such benefits.
Compensated absences
Compensated absences which are not expected to occur within twelve months after the end of the period in which the employee renders the related services are recognised as an actuarially determined liability at the present value of the obligation at the year end.
q. Earnings per share
Basic earnings per share are computed by dividing profit or loss attributable to equity shareholders of TCS Limited by the weighted average number of equity shares outstanding during the period. TCS Limited did not have any potentially dilutive securities in any of the periods presented.
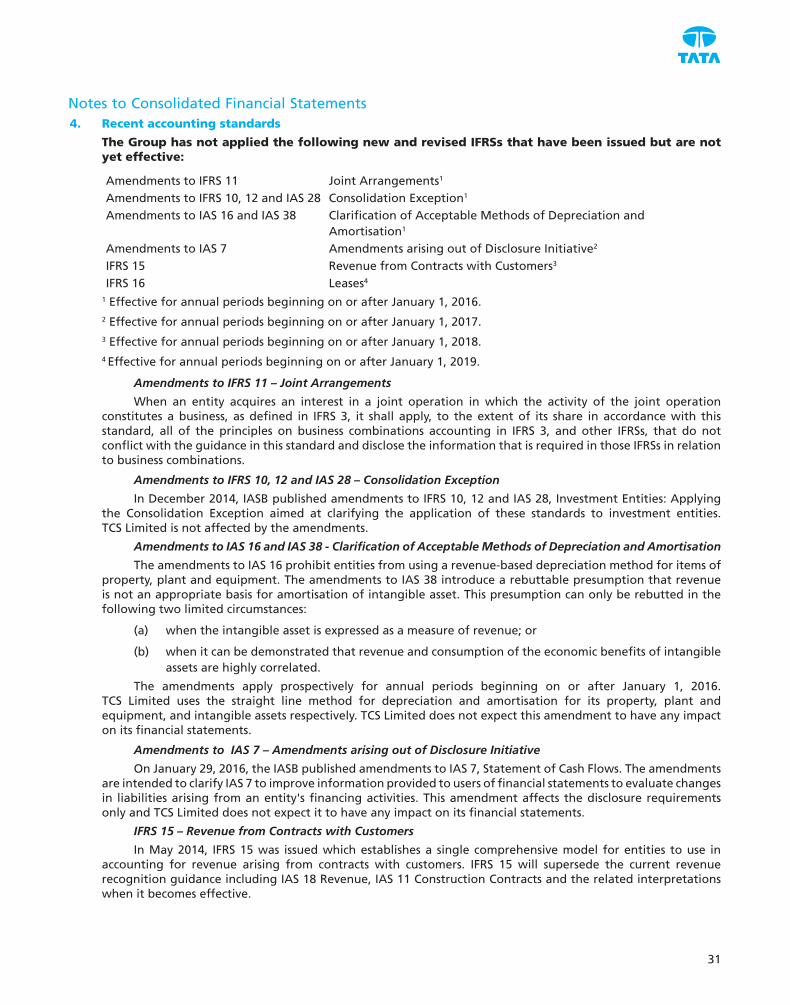
Notes to Consolidated Financial Statements
31
4. Recent accounting standards
The Group has not applied the following new and revised IFRSs that have been issued but are not yet effective:
Amendments to IFRS 11 Joint Arrangements1
Amendments to IFRS 10, 12 and IAS 28 Consolidation Exception1
Amendments to IAS 16 and IAS 38 Clarification of Acceptable Methods of Depreciation and Amortisation1
Amendments to IAS 7 Amendments arising out of Disclosure Initiative2
IFRS 15 Revenue from Contracts with Customers3
IFRS 16 Leases4
1 Effective for annual periods beginning on or after January 1, 2016.
2 Effective for annual periods beginning on or after January 1, 2017.
3 Effective for annual periods beginning on or after January 1, 2018.
4 Effective for annual periods beginning on or after January 1, 2019.
Amendments to IFRS 11 – Joint Arrangements
When an entity acquires an interest in a joint operation in which the activity of the joint operation constitutes a business, as defined in IFRS 3, it shall apply, to the extent of its share in accordance with this standard, all of the principles on business combinations accounting in IFRS 3, and other IFRSs, that do not conflict with the guidance in this standard and disclose the information that is required in those IFRSs in relation to business combinations.
Amendments to IFRS 10, 12 and IAS 28 – Consolidation Exception
In December 2014, IASB published amendments to IFRS 10, 12 and IAS 28, Investment Entities: Applying the Consolidation Exception aimed at clarifying the application of these standards to investment entities. TCS Limited is not affected by the amendments.
Amendments to IAS 16 and IAS 38 - Clarification of Acceptable Methods of Depreciation and Amortisation
The amendments to IAS 16 prohibit entities from using a revenue-based depreciation method for items of property, plant and equipment. The amendments to IAS 38 introduce a rebuttable presumption that revenue is not an appropriate basis for amortisation of intangible asset. This presumption can only be rebutted in the following two limited circumstances:
(a) when the intangible asset is expressed as a measure of revenue; or
(b) when it can be demonstrated that revenue and consumption of the economic benefits of intangible assets are highly correlated.
The amendments apply prospectively for annual periods beginning on or after January 1, 2016. TCS Limited uses the straight line method for depreciation and amortisation for its property, plant and equipment, and intangible assets respectively. TCS Limited does not expect this amendment to have any impact on its financial statements.
Amendments to IAS 7 – Amendments arising out of Disclosure Initiative
On January 29, 2016, the IASB published amendments to IAS 7, Statement of Cash Flows. The amendments are intended to clarify IAS 7 to improve information provided to users of financial statements to evaluate changes in liabilities arising from an entity's financing activities. This amendment affects the disclosure requirements only and TCS Limited does not expect it to have any impact on its financial statements.
IFRS 15 – Revenue from Contracts with Customers
In May 2014, IFRS 15 was issued which establishes a single comprehensive model for entities to use in accounting for revenue arising from contracts with customers. IFRS 15 will supersede the current revenue recognition guidance including IAS 18 Revenue, IAS 11 Construction Contracts and the related interpretations when it becomes effective.

Notes to Consolidated Financial Statements
32
Annual Report 2015-16
The core principle of IFRS 15 is that an entity should recognise revenue to depict the transfer of promised goods or services to customers in an amount that reflects the consideration to which the entity expects to be entitled in exchange for those goods or services. Specifically, the Standard introduces a 5-step approach to revenue recognition:
• Step1:Identifythecontract(s)withacustomer
• Step2:Identifytheperformanceobligationincontract
• Step3:Determinethetransactionprice
• Step4:Allocatethetransactionpricetotheperformanceobligationsinthecontract
• Step5:Recogniserevenuewhen(oras)theentitysatisfiesaperformanceobligation
Under IFRS 15, an entity recognises revenue when (or as) a performance obligation is satisfied, i.e. when ‘control’ of the goods or services underlying the particular performance obligation is transferred to the customer. TCS Limited is evaluating the impact, if any, of this Standard on its financial statements.
IFRS 16 - Leases
On January 13, 2016, the International Accounting Standards Board issued the final version of IFRS 16, Leases. IFRS 16 will replace the existing leases Standard, IAS 17 Leases, and related Interpretations. The Standard sets out the principles for the recognition, measurement, presentation and disclosure of leases for both parties to a contract i.e., the lessee and the lessor. IFRS 16 introduces a single lessee accounting model and requires a lessee to recognize assets and liabilities for all leases with a term of more than 12 months, unless the underlying asset is of low value. Currently, operating lease expenses are charged to the statement of comprehensive income. The Standard also contains enhanced disclosure requirements for lessees. IFRS 16 substantially carries forward the lessor accounting requirements in IAS 17. The impact of this standard on the financial statements will be evaluated.
5. Acquisitions
On July 1, 2014, Tata Consultancy Services Asia Pacific Pte Ltd., a wholly owned subsidiary of Tata Consultancy Services Limited, acquired a controlling interest in IT Frontier Corporation (referred to as “ITF”) from Mitsubishi Corporation (referred to as “Non-controlling interests”) in Japan for a consideration of $59.6 million. The purchase consideration consists of the fair value of shares in a subsidiary of $11.5 million transferred to Mitsubishi Corporation and cash consideration of $48.1 million. Transaction cost related to acquisition of subsidiary of $1.0 million was incurred which is included in ‘Other expenses’ in selling, general and administrative expenses (Refer note 21). Purchase price allocated to the fair values of assets acquired and liabilities assumed includes value of intangible assets in the nature of customer relationships and acquired contract rights, which has been valued at $22.4 million, to be amortised over the period of 3 years. The excess of purchase consideration over net assets and the identified intangible asset of $0.9 million has been recognised as goodwill.
Additionally, the Company has a call option and the non-controlling interest has a put option on 15% of the non-controlling interest’s equity ownership in ITF. The option is exercisable from June 2019. The call and put options collectively contains an obligation for the Company to acquire 15% of the non-controlling interests and accordingly financial liability for the present value of the redemption amount has been recognised.

Notes to Consolidated Financial Statements
33
Purchase consideration paid for this acquisition has been allocated as follows:
(In millions of USD)Net assets acquired, at fair value
Property, plant and equipment (includes Capital work-in-progress of $9.4 million) 56.3Intangible assets 22.4Trade receivables 46.6Other current assets 29.5Other current liabilities (75.9)Other non-current financial assets 11.8Other non-current assets 46.0Other non-current financial liabilities (2.0)Other non-current liabilities (19.8)
Fair value of net assets as on date of acquisition 114.9Non-controlling interests (56.2)Goodwill 0.9Purchase Consideration 59.6
ITF is an information technology services company incorporated in Japan. The acquisition of this entity shall enhance the customer base of TCS Limited in Japan and other regions in Asia pacific in various business verticals. Acquisition of ITF will create a new IT Services company of significant scale in the Japanese market. ITF brings its long standing relationships with Japanese corporations, talented workforce and competencies in industries like retail, distribution and trading. This will complement TCS’ deep domain knowledge, technology expertise and strong execution track record.
Proforma results for ITF acquisition
The following proforma financial information presents the combined results of operations of TCS Limited and ITF as if the acquisition had occurred as of the beginning of the current reporting period. The proforma results for current reporting period presented include amortisation charges for identified intangible assets, eliminations of inter-company transactions and related tax effects.
The unaudited proforma result is as follows for the fiscal year ended March 31, 2015:
Year endedMarch 31, 2015
(In millions of USD)Revenue 15,557.0 Profit for the year 3,249.1
The proforma financial information is presented for informational purposes and is not indicative of the results of operations that may have been achieved if the acquisition had taken place at the beginning of the period presented.

Notes to Consolidated Financial Statements
34
Annual Report 2015-16
6. Cash & Cash equivalents
Cash and cash equivalents consist of the following:
As of March 31, 2016
As of March 31, 2015
(In millions of USD)
Cash at banks and in hand 515.4 241.2
Bank deposits (original maturity less than three months) 434.9 56.4
Total 950.3 297.6
Held within India 613.2 46.6
Held outside India 337.1 251.0
Total 950.3 297.6
7. Trade receivables
Trade receivables consist of the following: As of March 31, 2016
As of March 31, 2015
(In millions of USD)
Trade receivables 3,720.5 3,337.8
Less: Allowance for doubtful trade receivables (86.6) (71.5)
Total 3,633.9 3,266.3
8. Investments
Investments consist of the following:
(a) Investments - Current
As of March 31, 2016
As of March 31, 2015
(In millions of USD) Investments carried at fair value through profit or loss Mutual fund units 257.9 239.9
257.9 239.9 Investments carried at fair value through OCI
Government securities 3,057.4 -
3,057.4 -
Investments carried at amortised cost
Certificate of deposits 74.2 -
Corporate debentures and bonds 3.8 -
78.0 - Total investments - Current 3,393.3 239.9

Notes to Consolidated Financial Statements
35
(b) Investments - Non-current
As of March 31, 2016
As of March 31, 2015
(In millions of USD) Investments carried at fair value through profit or loss Mutual fund units 8.7 1.1
8.7 1.1 Investments designated at fair value through OCI Equity shares 25.5 26.5
25.5 26.5 Investments carried at amortised cost Corporate debentures and bonds 2.4 4.0 Government securities 15.2 8.9
17.6 12.9 Total investments - Non-current 51.8 40.5
9. Other financial assets
Other financial assets consist of the following:
(a) Other current financial assets
As of March 31, 2016
As of March 31, 2015
(In millions of USD) Accrued interest 31.1 54.6 Employee loans and advances 154.2 53.6 Foreign exchange derivative assets 81.0 58.4 Inter-corporate deposits 259.8 184.4 Premises deposits 20.5 19.1 Restricted cash 66.4 50.0 Others 5.8 13.6 Total 618.8 433.7
(b) Other non-current financial assets
As of March 31, 2016
As of March 31, 2015
(In millions of USD) Accrued interest 11.0 3.9 Employee loans and advances 1.1 1.4 Inter-corporate deposits 372.1 251.2 Premises deposits 97.5 93.1 Restricted cash 13.0 0.1 Others 15.8 20.4 Total 510.5 370.1
Restricted cash in current and non-current financial assets mainly includes amounts restricted for Corporate Social Responsibility activities and margin money deposit for derivative contracts.

Notes to Consolidated Financial Statements
36
Annual Report 2015-16
10. Other assets
Other assets consist of the following:
(a) Other current assets
As of March 31, 2016
As of March 31, 2015
(In millions of USD)
Advances to suppliers 36.4 17.5
Indirect tax recoverable 51.3 49.3
Prepaid expenses 207.7 241.6
Others 35.6 27.0
Total 331.0 335.4
(b) Other non-current assets
As of March 31, 2016
As of March 31, 2015
(In millions of USD)
Prepaid expenses 67.6 85.4
Prepaid rent 35.5 38.5
Others 14.1 21.0
Total 117.2 144.9
11. Property, plant and equipment
Property, plant and equipment consist of the following:
Freehold land
Buildings Leasehold improve-
ments
Computer equipment
Furniture, fixtures,
office equipments and other
assets
Total
(In millions of USD)Cost as of April 1, 2015 55.5 771.9 267.6 810.8 714.4 2,620.2Additions - 196.3 28.2 99.6 148.8 472.9Disposals - (0.2) (5.7) (25.2) (8.1) (39.2)Translation exchange difference (2.9) (44.4) (12.5) (41.2) (38.5) (139.5)Cost as of March 31, 2016 52.6 923.6 277.6 844.0 816.6 2,914.4 Accumulated depreciation as of April 1, 2015
- (136.7) (128.2) (566.0) (408.6) (1,239.5)
Disposals - 0.1 4.3 25.2 7.0 36.6 Depreciation for the year - (43.1) (30.5) (116.7) (82.4) (272.7)Translation exchange difference - 7.8 6.8 30.4 21.3 66.3 Accumulated depreciation as of March 31, 2016
- (171.9) (147.6) (627.1) (462.7) (1,409.3)
Net carrying amount as of March 31, 2016
52.6 751.7 130.0 216.9 353.9 1,505.1
Capital work-in-progress 274.6Total 1,779.7
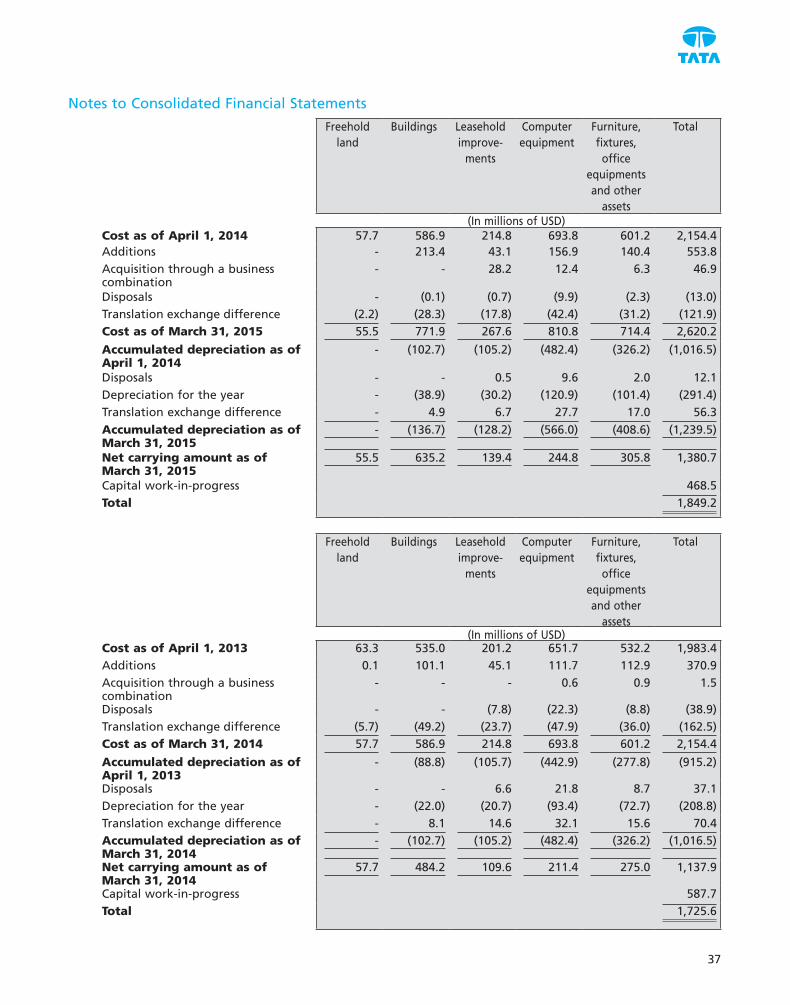
Notes to Consolidated Financial Statements
37
Freehold land
Buildings Leasehold improve-
ments
Computer equipment
Furniture, fixtures, office
equipments and other
assets
Total
(In millions of USD)Cost as of April 1, 2014 57.7 586.9 214.8 693.8 601.2 2,154.4 Additions - 213.4 43.1 156.9 140.4 553.8Acquisition through a business combination
- - 28.2 12.4 6.3 46.9
Disposals - (0.1) (0.7) (9.9) (2.3) (13.0)Translation exchange difference (2.2) (28.3) (17.8) (42.4) (31.2) (121.9)Cost as of March 31, 2015 55.5 771.9 267.6 810.8 714.4 2,620.2
Accumulated depreciation as of April 1, 2014
- (102.7) (105.2) (482.4) (326.2) (1,016.5)
Disposals - - 0.5 9.6 2.0 12.1 Depreciation for the year - (38.9) (30.2) (120.9) (101.4) (291.4)Translation exchange difference - 4.9 6.7 27.7 17.0 56.3
Accumulated depreciation as of March 31, 2015
- (136.7) (128.2) (566.0) (408.6) (1,239.5)
Net carrying amount as of March 31, 2015
55.5 635.2 139.4 244.8 305.8 1,380.7
Capital work-in-progress 468.5 Total 1,849.2
Freehold land
Buildings Leasehold improve-
ments
Computer equipment
Furniture, fixtures, office
equipments and other
assets
Total
(In millions of USD)Cost as of April 1, 2013 63.3 535.0 201.2 651.7 532.2 1,983.4 Additions 0.1 101.1 45.1 111.7 112.9 370.9 Acquisition through a business combination
- - - 0.6 0.9 1.5
Disposals - - (7.8) (22.3) (8.8) (38.9)Translation exchange difference (5.7) (49.2) (23.7) (47.9) (36.0) (162.5)Cost as of March 31, 2014 57.7 586.9 214.8 693.8 601.2 2,154.4
Accumulated depreciation as of April 1, 2013
- (88.8) (105.7) (442.9) (277.8) (915.2)
Disposals - - 6.6 21.8 8.7 37.1 Depreciation for the year - (22.0) (20.7) (93.4) (72.7) (208.8)Translation exchange difference - 8.1 14.6 32.1 15.6 70.4 Accumulated depreciation as of March 31, 2014
- (102.7) (105.2) (482.4) (326.2) (1,016.5)
Net carrying amount as of March 31, 2014
57.7 484.2 109.6 211.4 275.0 1,137.9
Capital work-in-progress 587.7 Total 1,725.6

Notes to Consolidated Financial Statements
38
Annual Report 2015-16
Net carrying amount of property, plant and equipment under finance lease arrangements were as follows:
As of March 31, 2016
As of March 31, 2015
(In millions of USD)
Leasehold improvements 15.9 16.8
Computer equipment 27.5 25.7
Office equipment 1.1 1.1
Leased assets 44.5 43.6
Less: Accumulated depreciation (30.2) (21.1)
Leased assets (net) 14.3 22.5
12. Intangible assets
Intangible assets consist of the following:
Customer-related
intangibles
Technology-related rights
Acquired contract rights
Rights under
licensing agreement
and software licences
Total
(In millions of USD)
Cost as of April 1, 2015 13.6 2.1 58.1 22.7 96.5
Additions - - - 0.4 0.4
Translation exchange difference 0.4 (0.1) (1.0) (1.3) (2.0)
Cost as of March 31, 2016 14.0 2.0 57.1 21.8 94.9
Accumulated amortisation as of April 1, 2015
(9.2) (2.1) (33.7) (16.5) (61.5)
Amortisation for the year (3.2) - (10.1) (1.5) (14.8)
Translation exchange difference (0.3) 0.1 0.9 1.0 1.7
Accumulated amortisation as of March 31, 2016
(12.7) (2.0) (42.9) (17.0) (74.6)
Net carrying amount as of March 31, 2016
1.3 - 14.2 4.8 20.3

Notes to Consolidated Financial Statements
39
Customer-related
intangibles
Technology-related rights
Acquired contract
rights
Rights under
licensing agreement
and software licences
Total
(In millions of USD)
Cost as of April 1, 2014 14.6 2.2 42.0 23.6 82.4
Additions - - - 0.3 0.3
Acquisition through a business combination
1.6 - 20.8 - 22.4
Translation exchange difference (2.6) (0.1) (4.7) (1.2) (8.6)
Cost as of March 31, 2015 13.6 2.1 58.1 22.7 96.5
Accumulated amortisation as of April 1, 2014
(7.1) (2.1) (28.5) (15.2) (52.9)
Amortisation for the year (3.5) (0.1) (8.6) (2.2) (14.4)
Translation exchange difference 1.4 0.1 3.4 0.9 5.8
Accumulated amortisation as of March 31, 2015
(9.2) (2.1) (33.7) (16.5) (61.5)
Net carrying amount as of March 31, 2015
4.4 - 24.4 6.2 35.0
Customer-related
intangibles
Technology-related rights
Acquired contract
rights
Rights under
licensing agreement
and software licences
Total
(In millions of USD)
Cost as of April 1, 2013 4.3 2.3 38.3 25.0 69.9
Additions - 0.1 - 1.2 1.3
Acquisition through a business combination
9.5 - - 0.4 9.9
Disposals - - - (0.6) (0.6)
Translation exchange difference 0.8 (0.2) 3.7 (2.4) 1.9
Cost as of March 31, 2014 14.6 2.2 42.0 23.6 82.4
Accumulated amortisation as of April 1, 2013
(4.3) (2.2) (22.8) (14.3) (43.6)
Amortisation for the year (2.5) (0.1) (3.4) (2.9) (8.9)
Disposals - - - 0.6 0.6
Translation exchange difference (0.3) 0.2 (2.3) 1.4 (1.0)
Accumulated amortisation as of March 31, 2014
(7.1) (2.1) (28.5) (15.2) (52.9)
Net carrying amount as of March 31, 2014
7.5 0.1 13.5 8.4 29.5

Notes to Consolidated Financial Statements
40
Annual Report 2015-16
Function wise amortisation of intangible assets is as follows:
Year ended March 31, 2016
Year ended March 31, 2015
Year ended March 31, 2014
(In millions of USD) Cost of information technology services 4.1 2.2 2.0Selling, general and administrative expenses 10.7 12.2 6.9Total 14.8 14.4 8.9
The estimated amortisation for each of the five fiscal years subsequent to March 31, 2016 is as follows:
Year ending March 31, Amortisation expense
(In millions of USD) 2017 12.52018 6.02019 1.12020 0.72021 -Thereafter -Total 20.3
13. Goodwill Goodwill consists of the following:
As of March 31, 2016
As of March 31, 2015
(In millions of USD) Balance at the beginning of the year 593.1 662.6 Additional amount recognised from business combination during the year
- 0.9
Foreign currency exchange loss (17.7) (70.4)Balance at the end of the year 575.4 593.1
TCS Limited tests goodwill annually for impairment.
Goodwill of $323.2 million and $342.2 million as of March 31, 2016 and 2015 has been allocated to TCS business process services (BPS) CGU. TCS Limited estimated the value-in-use of TCS BPS based on future cash flows of this CGU using a 5% annual growth rate for periods subsequent to the forecast period of 5 years and discount rate of 15%. An analysis of the sensitivity of the computation to a combined change in key parameters (operating margin, discount rates and long term average growth rate), based on reasonably probable assumptions, did not identify any probable scenario in which the recoverable amount of the CGU would decrease below its carrying amount.
Goodwill of $87.2 million has been allocated to the TCS business in France. The estimated value-in-use of this CGU is based on the future cash flows using a 1.5% annual growth rate for periods subsequent to the forecast period of 5 years and discount rate of 9.6%. An analysis of the sensitivity of the computation to a combined change in key parameters (operating margin, discount rates and long term average growth rate), based on reasonably probable assumptions, did not identify any probable scenario in which the recoverable amount of the CGU would decrease below its carrying amount.
The remaining amount of goodwill of $165.0 million (relating to different CGUs individually immaterial) has been evaluated based on the cash flow forecasts of the related CGUs and the recoverable amounts of these CGUs exceeded their carrying amounts.
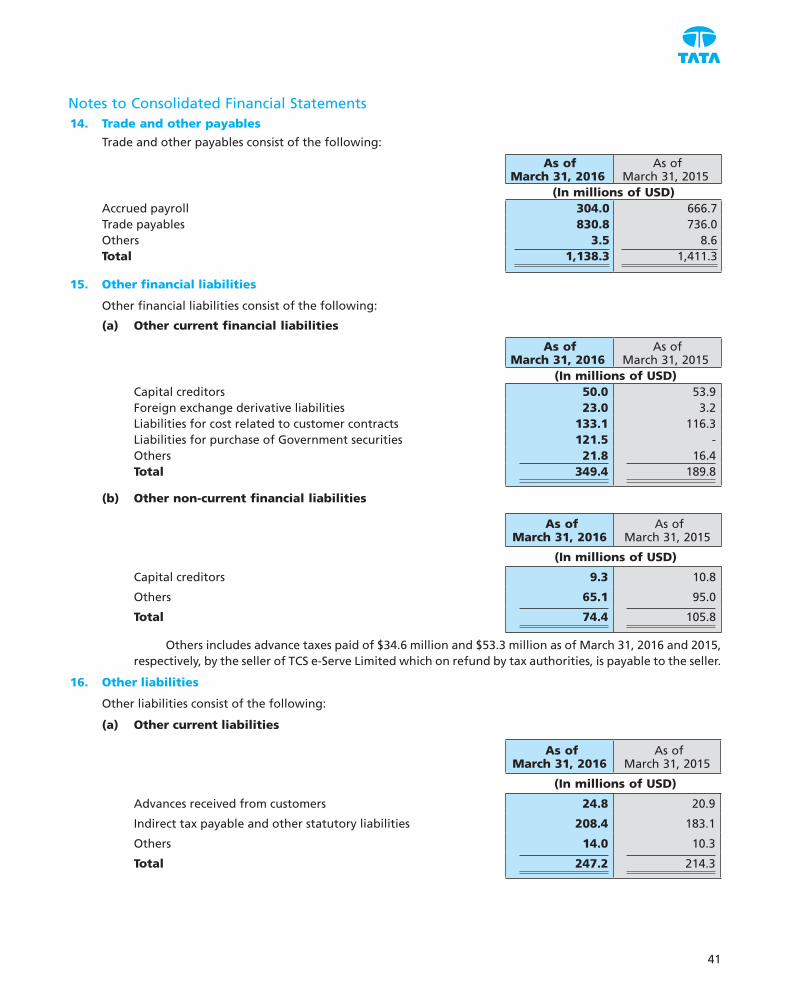
Notes to Consolidated Financial Statements
41
14. Trade and other payables
Trade and other payables consist of the following:
As of March 31, 2016
As of March 31, 2015
(In millions of USD) Accrued payroll 304.0 666.7 Trade payables 830.8 736.0 Others 3.5 8.6 Total 1,138.3 1,411.3
15. Other financial liabilities
Other financial liabilities consist of the following:
(a) Other current financial liabilities
As of March 31, 2016
As of March 31, 2015
(In millions of USD) Capital creditors 50.0 53.9 Foreign exchange derivative liabilities 23.0 3.2 Liabilities for cost related to customer contracts 133.1 116.3 Liabilities for purchase of Government securities 121.5 - Others 21.8 16.4 Total 349.4 189.8
(b) Other non-current financial liabilities
As of March 31, 2016
As of March 31, 2015
(In millions of USD)
Capital creditors 9.3 10.8
Others 65.1 95.0
Total 74.4 105.8
Others includes advance taxes paid of $34.6 million and $53.3 million as of March 31, 2016 and 2015, respectively, by the seller of TCS e-Serve Limited which on refund by tax authorities, is payable to the seller.
16. Other liabilities
Other liabilities consist of the following:
(a) Other current liabilities
As of March 31, 2016
As of March 31, 2015
(In millions of USD)
Advances received from customers 24.8 20.9
Indirect tax payable and other statutory liabilities 208.4 183.1
Others 14.0 10.3
Total 247.2 214.3

Notes to Consolidated Financial Statements
42
Annual Report 2015-16
(b) Other non-current liabilities
As of March 31, 2016
As of March 31, 2015
(In millions of USD)
Operating lease liabilities 57.3 55.1
Others 9.4 9.4
Total 66.7 64.5
17. Income taxes
The income tax expense consists of the following:
Year ended March 31, 2016
Year ended March 31, 2015
Year ended March 31, 2014
(In millions of USD)
Current tax:
Current tax expense for current year 1,140.7 1,027.4 1,016.9
Current tax expense / (benefit) pertaining to prior years
3.0 5.2 (8.4)
1,143.7 1,032.6 1,008.5
Deferred tax benefit (1.3) (38.5) (12.4)
Total income tax expense recognised in current year
1,142.4 994.1 996.1
The reconciliation of estimated income tax expense at Indian statutory income tax rate to income tax expense reported in statement of profit or loss is as follows:
Year ended March 31, 2016
Year ended March 31, 2015
Year ended March 31, 2014
(In millions of USD) Profit before income taxes 4,848.9 4,239.8 4,170.0 Indian statutory income tax rate 34.61% 33.99% 33.99%Expected income tax expense 1,678.2 1,441.1 1,417.4 Tax effect of adjustments to reconcile expected income tax expense to reported income tax expense:Tax holidays (681.7) (638.6) (580.0)Income exempt from tax (14.8) (3.0) (2.8)Undistributed earnings in branches and subsidiaries
62.4 33.6 60.8
Tax on income at different rates 35.7 97.7 18.2 Tax pertaining to prior years 3.8 4.6 51.7 Others (net) 58.8 58.7 30.8 Total income tax expense 1,142.4 994.1 996.1
Tata Consultancy Services Limited benefit from the tax holiday available for units set up under the Special Economic Zone Act, 2005. These tax holidays are available for a period of fifteen years from the date of commencement of operations. Under the SEZ scheme, the unit which begins providing services on or after April 1, 2005 will be eligible for deductions of 100% of profits or gains derived from export of services for the first five years, 50% of such profits or gains for a further period of five years and 50% of such profits or gains for the balance period of five years subject to fulfillment of certain conditions. From April 1, 2011 units set up under SEZ scheme are subject to Minimum Alternate Tax (MAT).

Notes to Consolidated Financial Statements
43
Significant components of net deferred tax assets and liabilities for the year ended March 31, 2016 are as follows:
Opening balance
Recognised in profit or
loss
Recognised in / reclassified from other
comprehensive income
Acquisitions / disposals
Exchange difference
Closing balance
(In millions of USD) Deferred tax assets / (liabilities) in relation to:Property, plant and equipment and intangible assets
(19.8) 6.0 - - 0.6 (13.2)
Retirement benefits and compensated absences
47.0 3.1 0.9 - (1.5) 49.5
Cash flow hedges (3.5) - 2.1 - - (1.4)Receivables, financial assets at amortised cost
25.3 4.8 - - (1.3) 28.8
MAT credit entitlement 304.3 12.2 - - (16.7) 299.8 Branch profit tax (41.0) (13.6) - - 2.3 (52.3)Undistributed earnings of subsidiaries
(25.5) (27.3) - - 1.2 (51.6)
Unrealised gain on securities carried at fair value through profit or loss / other comprehensive income
(0.5) 0.2 (4.0) - (0.1) (4.4)
Others 44.1 15.9 - (1.7) 58.3 Net deferred tax assets / (liabilities)
330.4 1.3 (1.0) - (17.2) 313.5
Gross deferred tax assets and liabilities are as follows:
As of March 31, 2016 Assets Liabilities Net
(In millions of USD)
Deferred tax assets / (liabilities) in relation to:
Property, plant and equipment and intangible assets 2.2 15.4 (13.2)
Retirement benefits and compensated absences 49.4 (0.1) 49.5
Cash flow hedges (1.4) - (1.4)
Receivables, financial assets at amortised cost 28.7 (0.1) 28.8
MAT credit entitlement 299.8 - 299.8
Branch profit tax - 52.3 (52.3)
Undistributed earnings of subsidiaries - 51.6 (51.6)
Unrealised gain on securities carried at fair value through profit or loss / other comprehensive income
(4.4) - (4.4)
Others 60.7 2.4 58.3
Net deferred tax assets / (liabilities) 435.0 121.5 313.5

Notes to Consolidated Financial Statements
44
Annual Report 2015-16
Significant components of net deferred tax assets and liabilities for the year ended March 31, 2015 are as follows:
Opening balance
Recognised in profit or
loss
Recognised in / reclassified from other
comprehensive income
Acquisitions / disposals
Exchange difference
Closing balance
(In millions of USD)
Deferred tax assets / (liabilities) in relation to:
Property, plant and equipment and intangible assets
(27.1) 13.1 - (6.5) 0.7 (19.8)
Retirement benefits and compensated absences
35.3 0.4 5.8 8.4 (2.9) 47.0
Cash flow hedges (0.8) - (2.7) - - (3.5)
Receivables, financial assets at amortised cost
18.8 7.3 - - (0.8) 25.3
MAT credit entitlement 315.6 1.4 - - (12.7) 304.3
Operating loss carry forward 1.8 (5.7) - 4.3 (0.4) -
Branch profit tax (36.3) (6.3) - - 1.6 (41.0)
Undistributed earnings of subsidiaries
(38.9) 11.7 - - 1.7 (25.5)
Unrealised gain on securities carried at fair value through profit or loss / other comprehensive income
- (0.3) (0.2) - - (0.5)
Others 23.0 16.9 - 6.5 (2.3) 44.1
Net deferred tax assets / (liabilities)
291.4 38.5 2.9 12.7 (15.1) 330.4
Gross deferred tax assets and liabilities are as follows:
As of March 31, 2015 Assets Liabilities Net (In millions of USD)
Deferred tax assets / (liabilities) in relation to:Property, plant and equipment and intangible assets 1.8 21.6 (19.8)Retirement benefits and compensated absences 46.5 (0.5) 47.0 Cash flow hedges (3.5) - (3.5)Receivables, financial assets at amortised cost 25.3 - 25.3 MAT credit entitlement 304.3 - 304.3 Operating loss carry forward - - - Branch profit tax - 41.0 (41.0)Undistributed earnings of subsidiaries - 25.5 (25.5)Unrealised gain on securities carried at fair value through profit or loss / other comprehensive income
(0.5) - (0.5)
Others 44.0 (0.1) 44.1 Net deferred tax assets / (liabilities) 417.9 87.5 330.4

Notes to Consolidated Financial Statements
45
Significant components of net deferred tax assets and liabilities for the year ended March 31, 2014 are as follows:
Opening balance
Recognised in profit or
loss
Recognised in / reclassified from other
comprehensive income
Acquisitions / disposals
Exchange difference
Closing balance
(In millions of USD)
Deferred tax assets / (liabilities) in relation to:Property, plant and equipment and intangible assets
(27.3) (2.4) - - 2.6 (27.1)
Retirement benefits and compensated absences
32.2 4.8 0.3 0.5 (2.5) 35.3
Cash flow hedges (1.0) - 0.4 - (0.2) (0.8)Receivables, financial assets at amortised cost
14.0 5.9 - - (1.1) 18.8
MAT credit entitlement 339.5 8.2 - - (32.1) 315.6 Operating loss carry forward 1.0 0.9 - - (0.1) 1.8 Branch profit tax (29.5) (9.9) - - 3.1 (36.3)Undistributed earnings of subsidiaries
(45.0) 1.5 - - 4.6 (38.9)
Unrealised gain on securities carried at fair value through profit or loss / other comprehensive income
(0.2) (0.1) 0.2 - 0.1 -
Others 20.8 3.5 - 0.2 (1.5) 23.0 Net deferred tax assets / (liabilities)
304.5 12.4 0.9 0.7 (27.1) 291.4
Under the Indian Income Tax Act, 1961, unabsorbed business losses expire 8 years after the year in which they originate. In respect of certain foreign subsidiaries, business losses can be carried forward indefinitely unless there is a substantial change in the ownership.
Unrecognised deferred tax assets relate primarily to business losses. These losses will expire based on the year of origination as follows:
March 31, Unabsorbed business losses
(In millions of USD)
2017 3.1
2018 2.2
2019 3.6
2020 5.5
2021 12.1
2022 6.7
Thereafter 37.7
Total 70.9
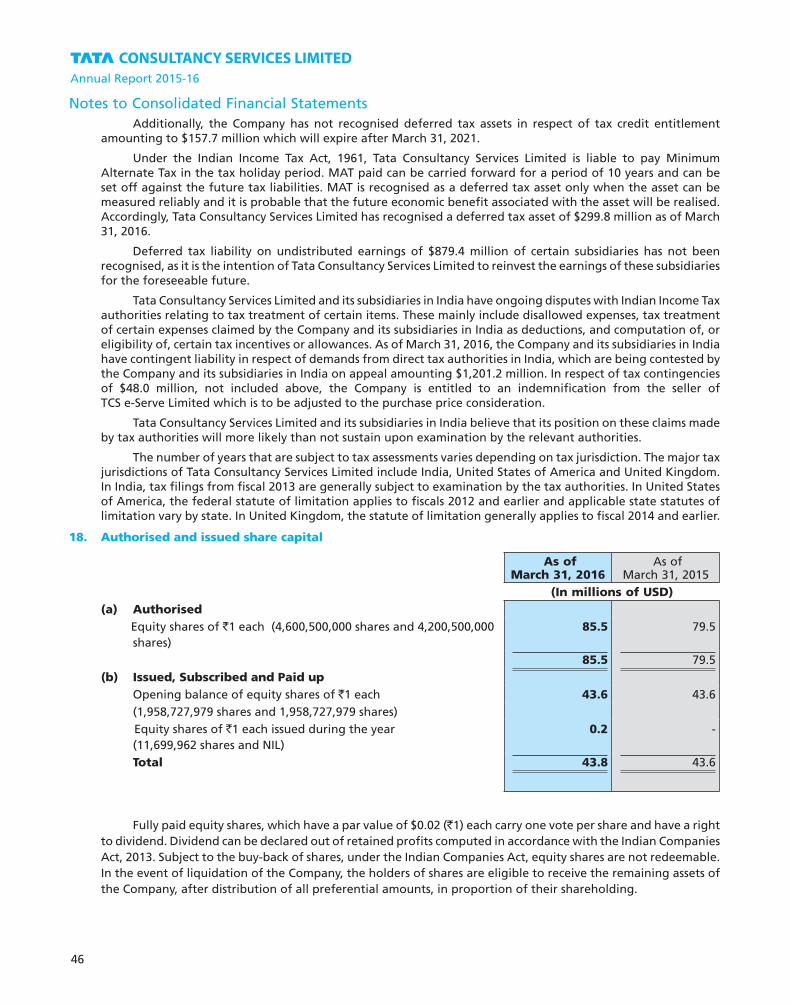
Notes to Consolidated Financial Statements
46
Annual Report 2015-16
Additionally, the Company has not recognised deferred tax assets in respect of tax credit entitlement amounting to $157.7 million which will expire after March 31, 2021.
Under the Indian Income Tax Act, 1961, Tata Consultancy Services Limited is liable to pay Minimum Alternate Tax in the tax holiday period. MAT paid can be carried forward for a period of 10 years and can be set off against the future tax liabilities. MAT is recognised as a deferred tax asset only when the asset can be measured reliably and it is probable that the future economic benefit associated with the asset will be realised. Accordingly, Tata Consultancy Services Limited has recognised a deferred tax asset of $299.8 million as of March 31, 2016.
Deferred tax liability on undistributed earnings of $879.4 million of certain subsidiaries has not been recognised, as it is the intention of Tata Consultancy Services Limited to reinvest the earnings of these subsidiaries for the foreseeable future.
Tata Consultancy Services Limited and its subsidiaries in India have ongoing disputes with Indian Income Tax authorities relating to tax treatment of certain items. These mainly include disallowed expenses, tax treatment of certain expenses claimed by the Company and its subsidiaries in India as deductions, and computation of, or eligibility of, certain tax incentives or allowances. As of March 31, 2016, the Company and its subsidiaries in India have contingent liability in respect of demands from direct tax authorities in India, which are being contested by the Company and its subsidiaries in India on appeal amounting $1,201.2 million. In respect of tax contingencies of $48.0 million, not included above, the Company is entitled to an indemnification from the seller of TCS e-Serve Limited which is to be adjusted to the purchase price consideration.
Tata Consultancy Services Limited and its subsidiaries in India believe that its position on these claims made by tax authorities will more likely than not sustain upon examination by the relevant authorities.
The number of years that are subject to tax assessments varies depending on tax jurisdiction. The major tax jurisdictions of Tata Consultancy Services Limited include India, United States of America and United Kingdom. In India, tax filings from fiscal 2013 are generally subject to examination by the tax authorities. In United States of America, the federal statute of limitation applies to fiscals 2012 and earlier and applicable state statutes of limitation vary by state. In United Kingdom, the statute of limitation generally applies to fiscal 2014 and earlier.
18. Authorised and issued share capital
As of March 31, 2016
As of March 31, 2015
(In millions of USD) (a) Authorised Equity shares of `1 each (4,600,500,000 shares and 4,200,500,000
shares) 85.5 79.5
85.5 79.5 (b) Issued, Subscribed and Paid up Opening balance of equity shares of `1 each 43.6 43.6 (1,958,727,979 shares and 1,958,727,979 shares) Equity shares of `1 each issued during the year
(11,699,962 shares and NIL) 0.2 -
Total 43.8 43.6
Fully paid equity shares, which have a par value of $0.02 (`1) each carry one vote per share and have a right to dividend. Dividend can be declared out of retained profits computed in accordance with the Indian Companies Act, 2013. Subject to the buy-back of shares, under the Indian Companies Act, equity shares are not redeemable. In the event of liquidation of the Company, the holders of shares are eligible to receive the remaining assets of the Company, after distribution of all preferential amounts, in proportion of their shareholding.

Notes to Consolidated Financial Statements
47
CMC Limited, a subsidiary, merged with Tata Consultancy Services Limited, in accordance with the terms of the Scheme of amalgamation sanctioned by the High Court of judicature at Bombay vide its order dated August 14, 2015 and High Court of judicature at Hyderabad through its order dated July 20, 2015. The Company issued 11,699,962 equity shares of $0.02 (`1) each having fair value of $483.9 million to the non-controlling shareholders of CMC Limited pursuant to the Scheme of amalgamation without payment being received in cash. The difference between the fair value of the shares issued and the carrying value of the non-controlling interest has been recorded in retained earnings.
The Company’s objective for capital management is to maximise shareholder value, safeguard business continuity and support the growth of the Company. The Company determines the capital requirement based on annual operating plans and long-term and other strategic investment plans. The funding requirements are met through equity and operating cash flows generated.
19. Other components of equity
Other components of equity consist of the following:
(a) Investment revaluation reserve
Year ended March 31, 2016
Year ended March 31, 2015
Year ended March 31, 2014
(In millions of USD) Balance at the beginning of the year 0.5 0.1 0.5 Net gains / (losses) arising on revaluation of financial assets carried at fair value
0.2 0.6 (0.7)
Deferred tax relating to gains / (losses) arising on revaluation of financial assets carried at fair value
(0.1) (0.2) 0.2
Cumulative gain reclassified to retained earnings on sale of financial assets carried at fair value
(0.8) - -
Deferred tax relating to cumulative gain reclassified to profit or loss on sale of financial assets carried at fair value
0.3 - -
Net gains arising on revaluation of investments other than equities carried at fair value through other comprehensive income
20.4 - -
Deferred tax relating to gains arising on revaluation of investments other than equities carried at fair value through other comprehensive income
(7.1) - -
Cumulative gain reclassified to profit or loss on sale of investments other than equities carried at fair value
(8.3) - -
Deferred tax relating to cumulative gain reclassified to profit or loss on sale of investments other than equities carried at fair value
2.9 - -
Transferred to non-controlling interests - - 0.1
Balance at the end of the year 8.0 0.5 0.1

Notes to Consolidated Financial Statements
48
Annual Report 2015-16
(b) Cash flow hedging reserve
Refer note 26(b) for movements in hedging reserve.
(c) Foreign currency translation reserve
Refer statements of change in equity for movements in foreign currency translation reserve.
20. Employee benefits
Function wise employee cost is as follows:
Year ended March 31, 2016
Year ended March 31, 2015
Year ended March 31, 2014
(In millions of USD) Cost of information technology services 6,379.1 6,243.2 4,984.0Selling, general and administrative expenses 2,050.8 2,035.6 1,676.8Total 8,429.9 8,278.8 6,660.8
(a) Current employee benefit obligations
As of March 31, 2016
As of March 31, 2015
(In millions of USD)
Compensated absences 243.7 214.2
Other employee benefit obligations 3.2 2.5
Total 246.9 216.7
(b) Non-current employee benefit obligations
As of March 31, 2016
As of March 31, 2015
(In millions of USD)
Gratuity liability 0.4 3.3
Foreign defined benefit plans 25.6 22.4
Other employee benefit obligations 9.7 6.8
Total 35.7 32.5
Defined benefit plan
Gratuity and pension
In accordance with Indian law, Tata Consultancy Services Limited and its subsidiaries in India provide to the eligible employees defined benefit plans such as gratuity and pension plan. The gratuity plan provides for a lump sum payment to vested employees at retirement, death while in employment or on termination of employment of an amount equivalent to 15 to 30 days’ salary payable for each completed year of service. Vesting occurs upon completion of five continuous years of service. The measurement date used for determining retirement benefits for gratuity is March 31. Certain overseas subsidiaries of the Company also provide for retirement benefit pension plans in accordance with the local laws.
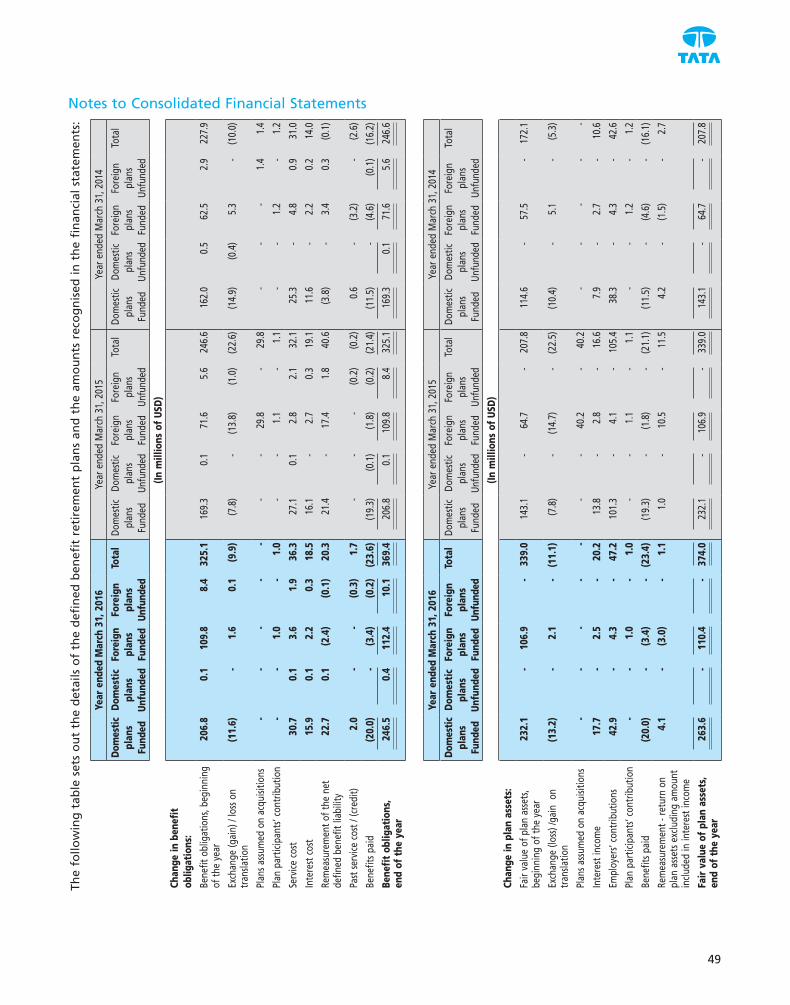
Notes to Consolidated Financial Statements
49
Th
e fo
llow
ing
tab
le s
ets
ou
t th
e d
etai
ls o
f th
e d
efin
ed b
enefi
t re
tire
men
t p
lan
s an
d t
he
amo
un
ts r
eco
gn
ised
in
th
e fi
nan
cial
sta
tem
ents
:
Year
end
ed M
arch
31,
201
6Ye
ar e
nded
Mar
ch 3
1, 2
015
Year
end
ed M
arch
31,
201
4
Dom
esti
c pl
ans
Fund
ed
Dom
esti
c pl
ans
Unfu
nded
Fore
ign
plan
s Fu
nded
Fore
ign
plan
s Un
fund
ed
Tota
lDo
mes
tic
plan
s Fu
nded
Dom
estic
pl
ans
Unfu
nded
Fore
ign
plan
s Fu
nded
Fore
ign
plan
s Un
fund
ed
Tota
lDo
mes
tic
plan
s Fu
nded
Dom
estic
pl
ans
Unfu
nded
Fore
ign
plan
s Fu
nded
Fore
ign
plan
s Un
fund
ed
Tota
l
(In m
illio
ns o
f US
D)
Chan
ge in
ben
efit
oblig
atio
ns:
Bene
fit o
blig
atio
ns, b
egin
ning
of
the
year
206
.8
0.1
1
09.8
8
.4
325
.1
169
.3
0.1
7
1.6
5.6
2
46.6
1
62.0
0
.5
62.
5 2
.9
227
.9
Exch
ange
(gai
n) /
loss
on
tran
slatio
n (
11.6
) -
1.6
0
.1
(9.
9) (7
.8)
- (1
3.8)
(1.0
) (2
2.6)
(14.
9) (0
.4)
5.3
-
(10.
0)
Plan
s ass
umed
on
acqu
isitio
ns -
- -
- -
- -
29.
8 -
29.
8 -
- -
1.4
1
.4
Plan
par
ticip
ants
’ con
trib
utio
n -
- 1
.0
- 1
.0
- -
1.1
-
1.1
-
- 1
.2
- 1
.2
Serv
ice c
ost
30.
7 0
.1
3.6
1
.9
36.
3 2
7.1
0.1
2
.8
2.1
3
2.1
25.
3 -
4.8
0
.9
31.
0
Inte
rest
cos
t 1
5.9
0.1
2
.2
0.3
1
8.5
16.
1 -
2.7
0
.3
19.
1 1
1.6
- 2
.2
0.2
1
4.0
Rem
easu
rem
ent o
f the
net
de
fined
ben
efit l
iabi
lity
22.
7 0
.1
(2.
4) (
0.1)
20.
3 2
1.4
- 1
7.4
1.8
4
0.6
(3.8
) -
3.4
0
.3
(0.1
)
Past
serv
ice c
ost /
(cre
dit)
2.0
-
- (
0.3)
1.7
-
- -
(0.2
) (0
.2)
0.6
-
(3.2
) -
(2.6
)
Bene
fits p
aid
(20
.0)
- (
3.4)
(0.
2) (
23.6
) (1
9.3)
(0.1
) (1
.8)
(0.2
) (2
1.4)
(11.
5) -
(4.6
) (0
.1)
(16.
2)
Bene
fit
oblig
atio
ns,
end
of t
he y
ear
246
.5
0.4
1
12.4
1
0.1
369
.4
206
.8
0.1
1
09.8
8
.4
325
.1
169
.3
0.1
7
1.6
5.6
2
46.6
Year
end
ed M
arch
31,
201
6Ye
ar e
nded
Mar
ch 3
1, 2
015
Year
end
ed M
arch
31,
201
4
Dom
esti
c pl
ans
Fund
ed
Dom
esti
c pl
ans
Unfu
nded
Fore
ign
plan
s Fu
nded
Fore
ign
plan
s Un
fund
ed
Tota
lDo
mes
tic
plan
s Fu
nded
Dom
estic
pl
ans
Unfu
nded
Fore
ign
plan
s Fu
nded
Fore
ign
plan
s Un
fund
ed
Tota
lDo
mes
tic
plan
s Fu
nded
Dom
estic
pl
ans
Unfu
nded
Fore
ign
plan
s Fu
nded
Fore
ign
plan
s Un
fund
ed
Tota
l
(In m
illio
ns o
f US
D)
Chan
ge in
pla
n as
sets
:
Fair
valu
e of
pla
n as
sets
, be
ginn
ing
of th
e ye
ar 2
32.1
-
106
.9
- 3
39.0
1
43.1
-
64.
7 -
207
.8
114
.6
- 5
7.5
- 1
72.1
Exch
ange
(los
s) /g
ain
on
tran
slatio
n (
13.2
) -
2.1
-
(11
.1)
(7.8
) -
(14.
7) -
(22.
5) (1
0.4)
- 5
.1
- (5
.3)
Plan
s ass
umed
on
acqu
isitio
ns -
- -
- -
- -
40.
2 -
40.
2 -
- -
- -
Inte
rest
inco
me
17.
7 -
2.5
-
20.
2 1
3.8
- 2
.8
- 1
6.6
7.9
-
2.7
-
10.
6
Empl
oyer
s’ co
ntrib
utio
ns 4
2.9
- 4
.3
- 4
7.2
101
.3
- 4
.1
- 1
05.4
3
8.3
- 4
.3
- 4
2.6
Plan
par
ticip
ants
’ con
trib
utio
n -
- 1
.0
- 1
.0
- -
1.1
-
1.1
-
- 1
.2
- 1
.2
Bene
fits p
aid
(20
.0)
- (
3.4)
- (
23.4
) (1
9.3)
- (1
.8)
- (2
1.1)
(11.
5) -
(4.6
) -
(16.
1)
Rem
easu
rem
ent -
retu
rn o
n pl
an a
sset
s exc
ludi
ng a
mou
nt
inclu
ded
in in
tere
st in
com
e
4.1
-
(3.
0) -
1.1
1
.0
- 1
0.5
- 1
1.5
4.2
-
(1.5
) -
2.7
Fair
val
ue o
f pl
an a
sset
s,
end
of t
he y
ear
263
.6
- 1
10.4
-
374
.0
232
.1
- 1
06.9
-
339
.0
143
.1
- 6
4.7
- 2
07.8

Notes to Consolidated Financial Statements
50
Annual Report 2015-16A
s o
f M
arc
h 3
1,
2016
As
of
Mar
ch 3
1, 2
015
Do
mest
ic
pla
ns
Fun
ded
Do
mest
ic
pla
ns
Un
fun
ded
Fore
ign
p
lan
s Fu
nd
ed
Fore
ign
p
lan
s U
nfu
nd
ed
Tota
lD
om
esti
c p
lan
s Fu
nd
ed
Do
mes
tic
pla
ns
Un
fun
ded
Fore
ign
p
lan
s Fu
nd
ed
Fore
ign
p
lan
s U
nfu
nd
ed
Tota
l
(In
mil
lio
ns
of
USD
)
Fun
ded
sta
tus:
Defi
cit
of
pla
n a
sset
s o
ver
ob
ligat
ion
s -
(
0.4
) (
15.5
) (
10.1
) (
26.0
) (
3.2)
(0.
1) (
14.0
) (
8.4)
(25
.7)
Surp
lus
of
pla
n a
sset
s o
ver
ob
ligat
ion
s 1
7.1
-
1
3.5
-
3
0.6
2
8.5
-
11.
1 -
3
9.6
Un
reco
gn
ised
ass
et d
ue
to a
sset
ce
ilin
g -
-
(
9.9
) -
(
9.9
) -
-
(
11.4
) -
(
11.4
)
17.1
(
0.4
) (
11.9
) (
10.1
) (
5.3
) 2
5.3
(0.
1) (
14.3
) (
8.4)
2.5
As
of
Marc
h 3
1,
2016
As
of
Mar
ch 3
1, 2
015
Do
mest
ic
pla
ns
Fun
ded
Do
mest
ic
pla
ns
Un
fun
ded
Fore
ign
p
lan
s Fu
nd
ed
Fore
ign
p
lan
s U
nfu
nd
ed
Tota
lD
om
esti
c p
lan
s Fu
nd
ed
Do
mes
tic
pla
ns
Un
fun
ded
Fore
ign
p
lan
s Fu
nd
ed
Fore
ign
p
lan
s U
nfu
nd
ed
Tota
l
(In
mil
lio
ns
of
USD
)
Cate
go
ry o
f ass
ets
:
Co
rpo
rate
bo
nd
s 4
7.1
-
1
4.9
-
6
2.0
2
7.9
-
19.
4 -
4
7.3
Equ
ity
shar
es 6
.4
-
7.7
-
1
4.1
-
-
2
1.4
-
21.
4
Go
vern
men
t Se
curi
ties
75.5
-
-
-
7
5.5
4
2.4
-
15.
9 -
5
8.3
Ind
ex li
nke
d g
ilt -
-
1
7.1
-
1
7.1
-
-
1
7.2
-
17.
2
Insu
rer
man
aged
fu
nd
s 1
11.2
-
2
9.9
-
1
41.1
1
19.6
-
2
7.6
-
147
.2
Ban
k b
alan
ces
14.7
-
4
0.8
-
5
5.5
3
4.7
-
0.9
-
3
5.6
Oth
ers
8.7
-
-
-
8
.7
7.5
-
4
.5
-
12.
0
Tota
l 2
63.6
-
1
10.4
-
3
74.0
2
32.1
-
1
06.9
-
3
39.0
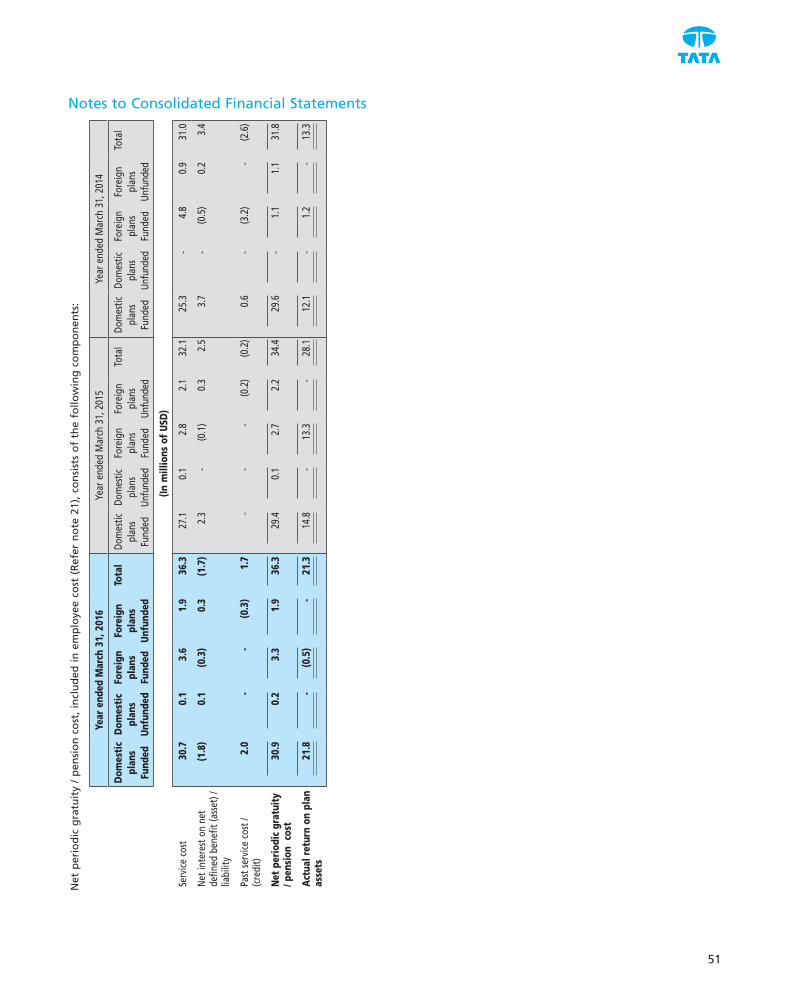
Notes to Consolidated Financial Statements
51
N
et p
erio
dic
gra
tuit
y /
pen
sio
n c
ost
, in
clu
ded
in
em
plo
yee
cost
(R
efer
no
te 2
1),
con
sist
s o
f th
e fo
llow
ing
co
mp
on
ents
:
Year
end
ed M
arch
31,
201
6Ye
ar e
nded
Mar
ch 3
1, 2
015
Year
end
ed M
arch
31,
201
4
Dom
esti
c pl
ans
Fund
ed
Dom
esti
c pl
ans
Unfu
nded
Fore
ign
plan
s Fu
nded
Fore
ign
plan
s Un
fund
ed
Tota
lDo
mes
tic
plan
s Fu
nded
Dom
estic
pl
ans
Unfu
nded
Fore
ign
plan
s Fu
nded
Fore
ign
plan
s Un
fund
ed
Tota
lDo
mes
tic
plan
s Fu
nded
Dom
estic
pl
ans
Unfu
nded
Fore
ign
plan
s Fu
nded
Fore
ign
plan
s Un
fund
ed
Tota
l
(In m
illio
ns o
f US
D)
Serv
ice c
ost
30.
7 0
.1
3.6
1
.9
36.
3 2
7.1
0.1
2
.8
2.1
3
2.1
25.
3 -
4.8
0
.9
31.
0
Net i
nter
est o
n ne
t de
fined
ben
efit (
asse
t) /
liabi
lity
(1.
8) 0
.1
(0.
3) 0
.3
(1.
7) 2
.3
- (0
.1)
0.3
2
.5
3.7
-
(0.5
) 0
.2
3.4
Past
serv
ice c
ost /
(cre
dit)
2.0
-
- (
0.3)
1.7
-
- -
(0.2
) (0
.2)
0.6
-
(3.2
) -
(2.6
)
Net
per
iodi
c gr
atui
ty
/ pen
sion
cos
t 3
0.9
0.2
3
.3
1.9
3
6.3
29.
4 0
.1
2.7
2
.2
34.
4 2
9.6
- 1
.1
1.1
3
1.8
Act
ual r
etur
n on
pla
n as
sets
21.
8 -
(0.5
) -
21.
3 1
4.8
- 1
3.3
- 2
8.1
12.
1 -
1.2
-
13.
3

Notes to Consolidated Financial Statements
52
Annual Report 2015-16
Remeasurement of the net defined benefit liability / (asset) :
Year ended March 31, 2016Domestic
plans Funded
Domestic plans
Unfunded
Foreign plans
Funded
Foreign plans
Unfunded
Total
(In millions of USD)Actuarial (gains) and losses arising from changes in demographic assumptions
2.0 - (1.7) (0.2) 0.1
Actuarial (gains) and losses arising from changes in financial assumptions
9.1 0.1 (0.2) - 9.0
Actuarial (gains) and losses arising from changes in experience adjustments
11.6 - (0.5) 0.1 11.2
Remeasurement of the net defined benefit liability
22.7 0.1 (2.4) (0.1) 20.3
Remeasurement - return on plan assets excluding amount included in interest income
(4.1) - 3.0 - (1.1)
Asset ceiling recognised in OCI - - (1.9) - (1.9)Total 18.6 0.1 (1.3) (0.1) 17.3
Year ended March 31, 2015Domestic
plans Funded
Domestic plans
Unfunded
Foreign plans
Funded
Foreign plans
Unfunded
Total
(In millions of USD)Actuarial (gains) and losses arising from changes in demographic assumptions
(0.5) - (1.5) 0.4 (1.6)
Actuarial (gains) and losses arising from changes in financial assumptions
16.8 - 18.3 1.3 36.4
Actuarial (gains) and losses arising from changes in experience adjustments
5.1 - 0.6 0.1 5.8
Remeasurement of the net defined benefit liability
21.4 - 17.4 1.8 40.6
Remeasurement - return on plan assets excluding amount included in interest income
(1.0) - (10.5) - (11.5)
Asset ceiling recognised in OCI - - 2.5 - 2.5 Total 20.4 - 9.4 1.8 31.6

Notes to Consolidated Financial Statements
53
The assumptions used in accounting for the defined benefit plan are set out below:
Year ended March 31, 2016 Year ended March 31, 2015 Year ended March 31, 2014Domestic
plansForeign plans
Domestic plans
Foreign plans
Domestic plans
Foreign plans
Discount rate 7.50% - 7.75% 0.40% - 7.13% 8.00% 0.87% - 6.75% 9.00% 2.25% - 7.60%
Rate of increase in compensation levels of covered employees
6.00% - 10.00% 1.25% - 4.64% 6.00% - 7.00% 1.00% - 4.64% 4.00% - 7.00% 1.50% - 4.64%
Rate of return on plan assets 7.50% - 7.75% 0.40% - 7.13% NA NA NA NA
Weighted average duration of defined benefit obligations
4-10 years 11-29 years 9 years 12-31 years 9 years 6-29 years
The expected benefits are based on the same assumptions as are used to measure TCS Limited’s defined benefit plan obligations as of March 31, 2016. TCS Limited is expected to contribute $17.2 million to defined benefit plan obligations funds in fiscal 2017 comprising domestic component of $15.5 million and foreign component of $1.7 million.
Remeasurement gain of defined employee benefit plans in other comprehensive income for the fiscals 2016, 2015 and 2014 are $17.3 million, $31.6 million and $2.8 million.
The significant actuarial assumptions for the determination of the defined benefit obligations are discount rate and expected salary increase. The sensitivity analysis below have been determined based on reasonably possible changes of the respective assumptions occurring at the end of the reporting period, while holding all other assumptions constant.
If the discount rate increases (decreases) by 0.50%, the defined benefit obligations would decrease by $18.5 million (increase by $20.1 million) as of March 31, 2016.
If the expected salary growth increases (decreases) by 0.50%, the defined benefit obligations would increase by $10.1 million (decrease by $9.5 million) as of March 31, 2016.
The sensitivity analysis presented above may not be representative of the actual change in the defined benefit obligations as it is unlikely that the change in assumptions would occur in isolation of one another as some of the assumption may be correlated.
Furthermore, in presenting the above sensitivity analysis, the present value of the defined benefit obligations has been calculated using the Projected Unit Credit Method at the end of the reporting period, which is the same as that applied in calculating the defined benefit obligation liability recognised in the statement of financial position.
Each year an Asset - Liability matching study is performed in which the consequences of the strategic investment policies are analysed in terms of risk and return profiles. Investment and contribution policies are integrated within this study.
The defined benefit obligations shall mature after year ended March 31, 2016 as follows:
Year ending March 31, Defined benefit obligations
(In millions of USD) 2017 28.22018 30.72019 34.12020 37.22021 41.1Thereafter 241.3
Defined contribution plans
Superannuation
In addition to gratuity benefits, all eligible employees are entitled to benefits under Superannuation, a defined contribution plan. TCS Limited makes monthly contributions until retirement or resignation of the

Notes to Consolidated Financial Statements
54
Annual Report 2015-16
employee. TCS Limited recognises such contributions as an expense when incurred. TCS Limited has no further obligation beyond its monthly contribution.
TCS Limited contributed $37.9 million, $36.3 million and $31.5 million to the Employees’ Superannuation Fund in fiscals 2016, 2015 and 2014, respectively.
Provident fund
In accordance with Indian law, all eligible employees of Tata Consultancy Services Limited and its subsidiaries are entitled to receive benefits under the provident fund, a defined contribution plan in which both the employee and employer (at a determined rate) contribute monthly. Tata Consultancy Services Limited and its subsidiaries in India contribute as specified under the law to the Provident Fund where set up as a trust and to the respective Regional Provident Fund Commissioner. Tata Consultancy Services Limited and its subsidiaries in India which contributes to the Provident Fund where set up as a trust are liable for future provident fund benefits to the extent of its annual contribution and any shortfall in fund assets based on government specified minimum rates of return relating to current period service and recognises such contributions and shortfall, if any, as an expense in the year incurred. In accordance with an actuarial valuation, there is no deficiency in the interest cost as the present value of the expected future earnings on the fund is greater than the expected amount to be credited to the individual members based on the expected guaranteed rate of interest.
Tata Consultancy Services Limited and its subsidiaries contributed $103.5 million, $99.0 million and $92.8 million to the provident fund in fiscals 2016, 2015 and 2014, respectively.
Foreign Defined Contribution Plan
Tata Consultancy Services Limited and its subsidiaries contributed $124.3 million, $116.8 million and $88.8 million in fiscals 2016, 2015 and 2014, respectively, towards foreign defined contribution plan.
21. Expenses by nature
Year ended March 31, 2016
Year ended March 31, 2015
Year ended March 31, 2014
(In millions of USD) Employee cost 8,429.9 8,278.8 6,660.8 Fees to external consultants 1,280.0 1,084.5 883.3 Facility expenses 518.8 519.7 456.6 Cost of equipment and software licences 391.3 302.7 242.6 Travel expenses 405.2 392.7 335.6 Depreciation and amortisation 287.5 305.8 217.7 Communication 168.8 172.4 144.0 Education, recruitment and training 31.0 37.6 48.7 Marketing and sales promotion 74.4 68.7 59.1 Bad debts, provision for trade receivable and advances (net)
20.6 29.0 15.6
Other expenses 552.8 535.1 472.3 Total 12,160.3 11,727.0 9,536.3
Research and development expenditure aggregating $36.1 million, $36.5 million and $32.7 million, incurred during the years ended March 31, 2016, 2015 and 2014, respectively, is included in the above expenses.
Refer note 20 for function wise bifurcation of employee cost.
Transaction cost related to acquisition of subsidiary of NIL, $1.0 million and $2.2 million for fiscals 2016, 2015 and 2014, respectively, has been included in other expenses (Refer note 5).
In the previous year, an amount of $423.2 million was recognised in the statement of profit or loss in respect of one-time bonus to eligible employees.

Notes to Consolidated Financial Statements
55
22. Finance and other income
Year ended March 31, 2016
Year ended March 31, 2015
Year ended March 31, 2014
(In millions of USD) Dividend received 1.8 1.6 1.5Interest income on bank balances 222.4 197.2 122.7Interest on financial assets carried at amortised cost 38.7 66.6 100.0Interest on financial assets carried at fair value through OCI
4.7 - -
Rental revenue 3.8 3.0 3.0Total 271.4 268.4 227.2
23. Finance costs (at effective interest rate method)
Year ended March 31, 2016
Year ended March 31, 2015
Year ended March 31, 2014
(In millions of USD) Interest on bank overdrafts and loans 2.6 13.3 5.6 Other interest expenses 2.4 5.3 6.2 Total 5.0 18.6 11.8
24. Other gains, (net)
Year ended March 31, 2016
Year ended March 31, 2015
Year ended March 31, 2014
(In millions of USD) Net gains on disposal of property, plant and equipment
0.8 0.4 0.8
Net gains on investments carried at fair value through profit or loss
62.0 33.8 28.2
Net gains on disposal of financial assets other than equity shares carried at fair value through OCI
8.3 - -
Net gains on disposal of investments carried at amortised cost
- 4.1 0.1
Net foreign exchange gains 113.1 212.6 6.6 Others 13.7 11.7 13.0 Total 197.9 262.6 48.7
25. Leases
TCS Limited has taken on lease property and equipment under operating lease arrangements. Most of the leases include renewal and escalation clauses. Operating lease rent expenses were $258.5 million, $256.7 million and $234.3 million in fiscals 2016, 2015 and 2014, respectively.
The following is a summary of future minimum lease rental commitments towards non-cancellable operating leases and finance leases:
Operating lease As of March 31, 2016
As of March 31, 2015
(In millions of USD) Within one year of balance sheet date 110.6 122.0 Due in a period between one year and five years 327.5 358.5 Due after five years 186.1 224.3 Total minimum lease commitments 624.2 704.8

Notes to Consolidated Financial Statements
56
Annual Report 2015-16
As of March 31, 2016 As of March 31, 2015 Finance lease Minimum
lease commitments
Present value of minimum
lease commitments
Minimum lease
commitments
Present value of minimum
lease commitments
(In millions of USD) Within one year of balance sheet date 8.9 7.4 11.2 9.2 Due in a period between one year and five years
12.1 8.4 17.5 12.9
Due after five years 5.0 4.0 7.1 5.2 Total minimum lease commitments 26.0 19.8 35.8 27.3 Less: Interest (6.2) (8.5)Present value of minimum lease commitments
19.8 27.3
Receivables under sub leases As of March 31, 2016
As of March 31, 2015
(In millions of USD) Within one year of balance sheet 2.9 2.8Due in a period between one year and five years 2.4 5.8Due after five years - -Total 5.3 8.6
Income from sub leases of $3.8 million, $3.0 million and $3.0 million have been recognised in the statement of profit or loss and other comprehensive income for the periods ended March 31, 2016, 2015 and 2014, respectively.
26. Financial instruments
The significant accounting policies, including the criteria for recognition, the basis of measurement and the basis on which income and expenses are recognised, in respect of each class of financial asset, financial liability and equity instrument are disclosed in note 3(l) to the consolidated financial statements.
(a) Financial assets and liabilities
The carrying value of financial instruments by categories as of March 31, 2016 is as follows:
Fair value through profit
or loss
Fair value through other comprehensive
income
Derivative instruments in hedging
relationship
Derivative instruments
not in hedging
relationship
Amortised cost
Total carrying
value
(In millions of USD) Financial assets:Cash and cash equivalents - - - - 950.3 950.3 Bank deposits - - - - 70.6 70.6 Investments 266.6 3,082.9 - - 95.6 3,445.1 Other financial assets* - - 17.4 63.6 1,048.3 1,129.3 Total 266.6 3,082.9 17.4 63.6 2,164.8 5,595.3 Financial liabilities:Borrowings - - - - 37.0 37.0 Other financial liabilities - - 2.3 20.7 400.8 423.8 Total - - 2.3 20.7 437.8 460.8
*Other financial assets include inter-corporate deposits of $631.9 million, with original maturity period within 50 months.
The fair value of investments is $3,445.9 million.

Notes to Consolidated Financial Statements
57
The carrying value of financial instruments by categories as of March 31, 2015 is as follows:
Fair value through profit
or loss
Fair value through other comprehensive
income
Derivative instruments in hedging relationship
Derivative instruments
not in hedging
relationship
Amortised cost
Total carrying value
(In millions of USD) Financial assets:Cash and cash equivalents - - - - 297.6 297.6 Bank deposits - - - - 2,697.9 2,697.9 Investments 241.0 26.5 - - 12.9 280.4 Other financial assets* - - 29.7 28.7 745.4 803.8 Total 241.0 26.5 29.7 28.7 3,753.8 4,079.7 Financial liabilities:Borrowings - - - - 57.2 57.2 Other financial liabilities - - - 3.2 292.4 295.6 Total - - - 3.2 349.6 352.8
*Other financial assets include inter-corporate deposits of $435.6 million, with original maturity period within 19 months.
The fair value of investments is $281.0 million.
Fair value hierarchy:
The fair value hierarchy is based on inputs to valuation techniques that are used to measure fair value that are either observable or unobservable and consists of the following three levels:
• Level1—Inputsarequotedprices(unadjusted)inactivemarketsforidenticalassetsorliabilities. • Level2—InputsareotherthanquotedpricesincludedwithinLevel1thatareobservableforthe
asset or liability, either directly (i.e. as prices) or indirectly (i.e. derived from prices). • Level3—Inputsarenotbasedonobservablemarketdata(unobservableinputs).Fairvaluesare
determined in whole or in part using a valuation model based on assumptions that are neither supported by prices from observable current market transactions in the same instrument nor are they based on available market data.
The investments included in Level 2 of fair value hierarchy have been valued using quotes available for similar assets and liabilities in the active market. The investments included in Level 3 of fair value hierarchy have been valued using the cost approach to arrive at their fair value. The cost of unquoted investments approximate the fair value because there is a range of possible fair value measurements and the cost represents estimate of fair value within that range.
The following table summarises financial assets and liabilities measured at fair value on a recurring basis and financial assets that are not measured at fair value on a recurring basis (but fair value disclosure are required):
As of March 31, 2016 Level 1 Level 2 Level 3 Total (In millions of USD)
Financial assets:Mutual fund units 266.6 - - 266.6 Equity shares - - 25.5 25.5 Corporate debentures and bonds - 6.2 - 6.2 Government securities 3,072.6 - - 3,072.6 Certificate of deposits - 74.2 - 74.2 Derivative financial assets - 81.0 - 81.0 Total 3,339.2 161.4 25.5 3,526.1 Financial liabilities:Derivative financial liabilities - 23.0 - 23.0 Total - 23.0 - 23.0

Notes to Consolidated Financial Statements
58
Annual Report 2015-16
As of March 31, 2015: Level 1 Level 2 Level 3 Total
(In millions of USD)
Financial assets:Mutual fund units 241.0 - - 241.0 Equity shares 0.6 - 25.9 26.5 Corporate debentures and bonds - 4.0 - 4.0 Government securities 8.9 - - 8.9 Derivative financial assets - 58.4 - 58.4 Total 250.5 62.4 25.9 338.8 Financial liabilities:Derivative financial liabilities - 3.2 - 3.2
Total - 3.2 - 3.2
(b) Derivative financial instruments and hedging activity
TCS Limited’s revenue is denominated in foreign currency predominantly US Dollar, Sterling Pound and Euro. In addition to these currencies, TCS Limited also does business in Australian Dollar, Singapore Dollar, Saudi Arabian Riyal, Danish Kroner and Brazilian Real. Given the nature of the business, a large portion of the costs are denominated in Indian Rupee. This exposes TCS Limited to currency fluctuations.
TCS Limited monitors and manages the financial risks relating to its operations by analysing its foreign exchange exposures by the level and extent of currency risks.
Tata Consultancy Services Limited and its subsidiaries use various derivative financial instruments governed by policies approved by the board of directors such as foreign exchange forward, option and future contracts to manage and mitigate its exposure to foreign exchange rates. The counterparty is generally a bank. Tata Consultancy Services Limited and its subsidiaries can enter into contracts for a period between one day and eight years.
Tata Consultancy Services Limited and its subsidiaries report quarterly to its risk management committee, an independent body that monitors foreign exchange risks and policies implemented to manage its foreign exchange exposures.
The following are outstanding currency option contracts, which have been designated as cash flow hedges as of:
March 31, 2016Foreign currency No. of contracts Notional amount
of currency option contracts
(In millions)
Fair value (In millions of USD)
US Dollar 9 225.0 6.3 Sterling Pound 8 160.0 7.8 Australian Dollar 21 228.0 (1.9)Euro 24 285.0 2.9
March 31, 2015Foreign currency No. of contracts Notional amount
of currency option contracts
(In millions)
Fair value (In millions of USD)
Sterling Pound 18 297.0 10.7 Australian Dollar 6 97.0 5.0 Euro 9 171.0 14.0

Notes to Consolidated Financial Statements
59
The movement in accumulated other comprehensive income for the years ended March 31, 2016, 2015 and 2014 for derivatives designated as cash flow hedges is as follows:
Year ended March 31, 2016
Year ended March 31, 2015
Year ended March 31, 2014
Intrinsic value
Time value
Intrinsic value
Time value
Intrinsic value
Time value
(In millions of USD)
Balance at the beginning of the year 11.2 (4.8) (6.1) (4.0) (0.7) (1.0)
(Gains) / Losses transferred to profit or loss on occurrence of forecasted hedge transaction
(48.9) 48.5 (126.0) 71.0 95.0 23.9
Deferred tax on (gains) / losses transferred to profit or loss on occurrence of forecasted hedge transaction
6.4 (6.2) 14.9 (10.2) (12.5) (3.1)
Change in the fair value of effective portion of cash flow hedges
37.2 (51.9) 146.5 (72.3) (100.4) (27.2)
Deferred tax on fair value of effective portion of cash flow hedges
(4.7) 6.6 (18.1) 10.7 12.6 3.4
Amount transferred to non-controlling interests during the year
- - - - (0.1) -
Balance at the end of the year 1.2 (7.8) 11.2 (4.8) (6.1) (4.0)
In addition to the above cash flow hedges, TCS Limited has outstanding foreign exchange forwards, currency option and futures contracts with notional amounts aggregating $3,342.7 million and $3,187.9 million, whose fair value showed a net gain of $42.9 million and $25.5 million as of March 31, 2016 and 2015, respectively. Although these contracts are effective as hedges from an economic perspective, they do not qualify for hedge accounting.
Exchange gain of $25.5 million and $220.9 million and exchange loss of $15.3 million on foreign exchange forward contracts and currency option and futures contracts have been recognised in earnings in fiscals 2016, 2015 and 2014, respectively.
Net gain on derivative instruments of $7.5 million, recognised in accumulated other comprehensive income as of March 31, 2016, is expected to be reclassified into earnings by March 31, 2017. The maximum period over which the exposure to cash flow variability has been hedged is through calendar year 2016.
Following table summarises approximate gain / (loss) on Group’s other comprehensive income on account of appreciation / depreciation of the underlying foreign currencies.
Year ended March 31, 2016
Year ended March 31, 2015
Year ended March 31, 2014
(In millions of USD)
10% Appreciation of the underlying foreign currencies
(35.9) (7.6) 0.3
10% Depreciation of the underlying foreign currencies
94.1 95.7 85.2

Notes to Consolidated Financial Statements
60
Annual Report 2015-16
(c) Financial risk management:
TCS Limited is exposed primarily to fluctuations in foreign currency exchange rates, credit, liquidity and interest rate risks, which may adversely impact the fair value of its financial instruments. The Group has a risk management policy which covers risks associated with the financial assets and liabilities. The risk management policy is approved by the Board of Directors. The focus of the risk management committee is to assess the unpredictability of the financial environment and to mitigate potential adverse effects on the financial performance of the Group.
i. Market risk
Market risk is the risk that the fair value or future cash flows of a financial instrument will fluctuate because of changes in market prices. Such changes in the values of financial instruments may result from changes in the foreign currency exchange rates, interest rates, credit, liquidity and other market changes. The Group’s exposure to market risk is primarily on account of foreign currency exchange rate risk.
i. (a) Foreign currency exchange rate risk
The fluctuation in foreign currency exchange rates may have potential impact on the statement of profit or loss and other comprehensive income and equity, where any transaction references more than one currency or where assets / liabilities are denominated in a currency other than the functional currency of the respective entities.
Considering the countries and economic environment in which the Group operates, its operations are subject to risks arising from fluctuations in exchange rates in those countries. The risks primarily relate to fluctuations in US Dollar, Euro, Great Britain Pound, Australian Dollar, Singapore Dollar, Saudi Arabian Riyal, Danish Kroner and Brazilian Real against the respective functional currencies of Tata Consultancy Services Limited and its subsidiaries.
The Group, as per its risk management policy, uses derivative instruments primarily to hedge foreign exchange. Further, any movement in the functional currencies of the various operations of the Group against major foreign currencies may impact the Group’s revenue in international business.
The Group evaluates the impact of foreign exchange rate fluctuations by assessing its exposure to exchange rate risks. It hedges a part of these risks by using derivative financial instruments in line with its risk management policies.
The foreign exchange rate sensitivity is calculated by aggregation of the net foreign exchange rate exposure and a simultaneous parallel foreign exchange rates shift of all the currencies by 10% against the respective functional currencies of Tata Consultancy Services Limited and its subsidiaries.
The following analysis has been worked out based on the net exposures for each of the subsidiaries and Tata Consultancy Services Limited as of the date of statements of financial position which could affect the statements of profit or loss and other comprehensive income and equity. Further the exposure as indicated below is mitigated by some of the derivative contracts entered into by the Group as disclosed in note 26(b).
The following table sets forth information relating to foreign currency exposure as of March 31, 2016:
USD EUR GBP AUD SGD DKK BRL SAR Others*
(In millions of USD)
Net financial assets 169.5 19.2 11.2 3.9 4.2 8.7 1.5 - 96.3
Net financial liabilities (48.6) (0.9) (10.8) (10.3) (3.5) (0.4) (1.6) (81.2) (47.4)
10% appreciation / depreciation of the respective foreign currencies with respect to functional currency of Tata Consultancy Services Limited and its subsidiaries would result in decrease / increase in the Group’s profit before tax by approximately $11.0 million for the year ended March 31, 2016.

Notes to Consolidated Financial Statements
61
The following table sets forth information relating to foreign currency exposure as of March 31, 2015:
USD EUR GBP AUD SGD DKK BRL SAR Others*
(In millions of USD)
Net financial assets 141.2 10.1 16.9 2.4 15.7 15.7 15.2 - 47.1
Net financial liabilities (359.3) (15.9) (2.7) (2.4) (0.7) (0.6) - (1.2) (11.7)
10% appreciation / depreciation of the respective foreign currencies with respect to functional currency of Tata Consultancy Services Limited and its subsidiaries would result in decrease / increase in the Group’s profit before tax by approximately $13.0 million for the year ended March 31, 2015.
*Others include currencies such as South African Rand, Canadian Dollar, Swiss Franc, Norwegian Kroner etc.
i. (b) Interest rate risk
The Group’s investments are primarily in fixed rate interest bearing investments. Hence the Group is not significantly exposed to interest rate risk.
ii. Credit risk
Credit risk is the risk of financial loss arising from counterparty failure to repay or service debt according to the contractual terms or obligations. Credit risk encompasses of both, the direct risk of default and the risk of deterioration of creditworthiness as well as concentration of risks. Credit risk is controlled by analysing credit limits and creditworthiness of customers on a continuous basis to whom the credit has been granted after obtaining necessary approvals for credit.
Financial instruments that are subject to concentrations of credit risk principally consist of trade receivables, unbilled revenue, investments, derivative financial instruments, cash and cash equivalents, bank deposits and other financial assets. Inter-corporate deposits of $631.9 million are with a financial institution having a high credit-rating assigned by credit-rating agencies. Bank deposits include an amount of $62.6 million held with an Indian bank having high quality credit rating which are individually in excess of 10% or more of the Group’s total bank deposits in fiscal 2016. None of the other financial instruments of the Group result in material concentration of credit risk.
Exposure to credit risk
The carrying amount of financial assets represents the maximum credit exposure. The maximum exposure to credit risk was $9,806.1 million and $7,930.9 million as of March 31, 2016 and 2015, respectively, being the total of the carrying amount of balances with banks, bank deposits, trade receivables, unbilled revenue, other financial assets and investments excluding equity and preference investments.
TCS Limited’s exposure to customers is diversified and no single customer contributes to more than 10% of outstanding accounts receivable and unbilled revenue as of March 31, 2016 and 2015.
Geographic concentration of credit risk
TCS Limited also has a geographic concentration of trade receivables, net of allowances and unbilled revenue is given below:
As of March 31, 2016
As of March 31, 2015
(In %) United States of America 42.9 41.9India 15.3 16.5United Kingdom 15.0 15.0
Geographical concentration of credit risk is allocated based on the location of the customers.

Notes to Consolidated Financial Statements
62
Annual Report 2015-16
iii. Liquidity risk
Liquidity risk refers to the risk that the Group cannot meet its financial obligations. The objective of liquidity risk management is to maintain sufficient liquidity and ensure that funds are available for use as per requirements.
The Group consistently generated sufficient cash flows from operations to meet its financial obligations as and when they fall due.
The tables below provide details regarding the contractual maturities of significant financial liabilities as of:
March 31, 2016 Due in 1st year
Due in 2nd year
Due in 3rd to 5th year
Due after 5th year
Total
(In millions of USD)
Non-derivative financial liabilities:Trade and other payables 1,138.3 - - - 1,138.3 Borrowings 24.5 3.6 4.9 4.0 37.0 Other financial liabilities 326.4 6.6 64.9 2.9 400.8 Total 1,489.2 10.2 69.8 6.9 1,576.1 Derivative financial liabilities
23.0 - - - 23.0
Total 1,512.2 10.2 69.8 6.9 1,599.1
March 31, 2015 Due in 1st year
Due in 2nd year
Due in 3rd to 5th year
Due after 5th year
Total
(In millions of USD)
Non-derivative financial liabilities:
Trade and other payables 1,411.3 - - - 1,411.3
Borrowings 38.9 6.8 6.1 5.4 57.2
Other financial liabilities 186.6 10.1 94.1 1.6 292.4
Total 1,636.8 16.9 100.2 7.0 1,760.9
Derivative financial liabilities
3.2 - - - 3.2
Total 1,640.0 16.9 100.2 7.0 1,764.1
27. Segment information
Operating segments are defined as components of an enterprise for which discrete financial information is available that is evaluated regularly by the chief operating decision maker, in deciding how to allocate resources and assessing performance. TCS Limited’s chief operating decision maker is the Chief Executive Officer and Managing Director.
The Group has identified business segments (industry practice) as reportable segments. Business segments comprise banking, finance and insurance services, manufacturing, retail and consumer packaged goods, telecom, media and entertainment and others such as energy, resources and utilities, Hi-Tech, life science and healthcare, s-Governance, travel, transportation and hospitality, products, etc.

Notes to Consolidated Financial Statements
63
Revenue and expenses directly attributable to segments are reported under each reportable segment. Expenses which are not directly identifiable to each reporting segment have been allocated on the basis of associated revenue of the segment and manpower efforts. All other expenses which are not attributable or allocable to segments have been disclosed as unallocable expenses.
Assets directly attributable or allocable to segments are disclosed under each reportable segment. All other assets are disclosed as unallocable. Property, plant and equipment that are used interchangeably among segments are not allocated to reportable segments.
Summarised segment information for the years ended March 31, 2016, 2015 and 2014 is as follows:
Year ended March 31, 2016(In millions of USD)
Banking, Financial Services
and Insurance
Manufac-turing
Retail and Consumer Packaged
Goods
Telecom, Media and Entertain-
ment
Others Total
Revenue 6,724.7 1,660.6 2,325.7 1,805.5 4,028.4 16,544.9 Segment result 1,958.0 445.0 628.6 520.1 1,106.4 4,658.1 Depreciation 273.5 Total Unallocable expenses 273.5 Operating profit 4,384.6 Other income (net) 464.3 Profit before taxes 4,848.9 Income tax expense 1,142.4 Net profit 3,706.5
Depreciation and amortisation 13.7 - - - 0.3 14.0 Significant non-cash items (allocable)
4.7 1.4 1.5 1.4 11.6 20.6
Significant non-cash items (unallocable)
-
As of March 31, 2016Segment assetsAllocable assets 2,047.5 426.4 550.1 554.9 1,344.2 4,923.1 Unallocable assets 8,846.0 Total assets 13,769.1 Segment liabilitiesAllocable liabilities 277.8 22.6 29.2 44.6 139.6 513.8 Unallocable liabilities 2,153.3 Total liabilities 2,667.1

Notes to Consolidated Financial Statements
64
Annual Report 2015-16
Year ended March 31, 2015(In millions of USD)
Banking, Financial
Services and Insurance
Manufac-turing
Retail and Consumer Packaged
Goods
Telecom, Media and Entertain-
ment
Others Total
Revenue 6,298.1 1,507.7 2,095.0 1,786.1 3,767.5 15,454.4
Segment result 1,747.1 365.5 536.0 456.0 903.6 4,008.2
Depreciation 280.8 Total Unallocable expenses 280.8 Operating profit 3,727.4 Other income (net) 512.4 Profit before taxes 4,239.8 Income tax expense 994.1 Net profit 3,245.7 Depreciation and amortisation 14.1 - - - 10.9 25.0 Significant non-cash items (allocable)
4.6 1.3 9.0 1.2 12.9 29.0
Significant non-cash items (unallocable)
0.2
As of March 31, 2015Segment assetsAllocable assets 1,859.1 390.1 524.7 514.9 1,396.3 4,685.1 Unallocable assets 7,314.1
Total assets 11,999.2 Segment liabilitiesAllocable liabilities 414.4 54.5 84.9 88.1 292.0 933.9 Unallocable liabilities 1,734.3
Total liabilities 2,668.2
Year ended March 31, 2014(In millions of USD)
Banking, Financial
Services and Insurance
Manufac-turing
Retail and Consumer Packaged
Goods
Telecom, Media and Entertain-
ment
Others Total
Revenue 5,769.4 1,148.3 1,858.8 1,579.7 3,086.0 13,442.2 Segment result 1,895.6 336.5 601.1 449.4 824.4 4,107.0 Depreciation 201.1 Total Unallocable expenses 201.1 Operating profit 3,905.9 Other income (net) 264.1 Profit before taxes 4,170.0 Income tax expense 996.1 Net profit 3,173.9 Depreciation and amortisation 12.2 - - - 4.4 16.6 Significant non-cash items (allocable)
3.1 0.7 (0.2) 4.4 7.6 15.6
Geographical revenue is allocated based on the location of the customers.

Notes to Consolidated Financial Statements
65
Information regarding geographical revenue is as follows:
Geography Year ended March 31, 2016
Year ended March 31, 2015
Year ended March 31, 2014
(In millions of USD) Americas (1) 9,136.8 8,335.8 7,439.6 Europe (2) 4,431.5 4,366.7 3,846.1 India 1,025.4 997.0 903.8 Others 1,951.2 1,754.9 1,252.7 Total 16,544.9 15,454.4 13,442.2
Geographical non-current assets (property, plant and equipment, goodwill, intangible assets, advance income tax and other non-current assets) are allocated based on the location of the assets.
Information regarding geographical non-current assets is as follows:
Geography As of March 31, 2016
As of March 31, 2015
(In millions of USD) Americas (3) 350.7 384.7Europe (4) 236.8 257.2India 2,397.3 2,420.0Others 181.7 214.4Total 3,166.5 3,276.3
i. (1) and (3) are substantially related to operations in the United States of America.
ii. (2) includes revenue from operations in the United Kingdom of $2,616.5 million, $2,578.9 million and $2,340.8 million for the years ended March 31, 2016, 2015 and 2014, respectively.
iii. (4) includes non-current assets from operations in the United Kingdom of $82.2 million and $99.7 million as of March 31, 2016 and 2015, respectively.
Information about major customers:
No single customer represents 10% or more of the Group’s total revenue in fiscals 2016, 2015 and 2014.
28. Commitments and contingencies
Commitments and contingent liabilities are as follows:
Capital commitments
As of March 31, 2016, $219.9 million was contractually committed for purchase of property, plant and equipment.
Contingencies
Direct tax matters
Refer note 17.
Indirect tax matters
Tata Consultancy Services Limited and its subsidiaries in India have ongoing disputes with Indian tax authorities mainly relating to treatment of characterisation and classification of certain items. As of March 31, 2016, Tata Consultancy Services Limited and its subsidiaries in India have demands on appeal amounting to $29.2 million from various indirect tax authorities in Indian jurisdiction, which are being contested by the Company and its subsidiaries in India. In respect of indirect tax contingencies of $1.3 million, not included above, the Company is entitled to an indemnification from the seller of TCS e-Serve Limited.

Notes to Consolidated Financial Statements
66
Annual Report 2015-16
Other claims TCS Limited has examined the social security and tax aspects of contracts with legal entities which provide
services to an overseas subsidiary and, based on legal opinion, concludes that the subsidiary is in compliance with the related statutory requirements.
As of March 31, 2016, claims aggregating $1,059.3 million against the Group (individually insignificant) have not been acknowledged as debts.
In October 2014, Epic Systems Corporation (referred to as Epic) filed a legal claim against the Company in the Court of Western District Madison, Wisconsin for alleged unauthorised download and mis-use of Epic's confidential information and trade secrets. In April 2016, the Company received an unfavorable jury verdict awarding damages totalling $940 million to Epic which the trial judge has indicated his intent to reduce. On the basis of legal opinion and legal precedence, the Company expects to defend itself against the claim and believes that the claim will not sustain.
29. List of direct and indirect subsidiaries, place of incorporation and percentage of voting power
Name of the Company Country of incorporation
% of voting power as at March 31,
2016
% of voting power as at March 31,
2015Subsidiaries (held directly)APTOnline Limited (Formerly APOnline Limited) India 89.00 89.00 C-Edge Technologies Limited India 51.00 51.00 CMC Limited India - 51.12 Diligenta Limited UK 100.00 100.00 MP Online Limited India 89.00 89.00 Tata Consultancy Services Canada Inc. Canada 100.00 100.00 Tata America International Corporation USA 100.00 100.00 Tata Consultancy Services Asia Pacific Pte Ltd. Singapore 100.00 100.00 Tata Consultancy Services Belgium S.A. Belgium 100.00 100.00 Tata Consultancy Services Deutschland GmbH Germany 100.00 100.00 Tata Consultancy Services Netherlands BV Netherlands 100.00 100.00 Tata Consultancy Services Sverige AB Sweden 100.00 100.00 TCS FNS Pty Limited Australia 100.00 100.00 TCS Iberoamerica SA Uruguay 100.00 100.00 Tata Consultancy Services (Africa) (PTY) Ltd. South Africa 100.00 100.00 MahaOnline Limited India 74.00 74.00 Tata Consultancy Services Qatar S.S.C. Qatar 100.00 100.00 TCS e-Serve International Limited India 100.00 100.00 TCS Foundation (w.e.f. March 25, 2015) India 100.00 100.00 CMC Americas Inc. (w.e.f. August 14, 2015) USA 100.00 100.00 Subsidiaries (held indirectly)TCS Financial Solutions Beijing Co., Ltd. China 100.00 100.00 Tata Consultancy Services (China) Co., Ltd. China 90.00 90.00 TCS Solution Center S.A. Uruguay 100.00 100.00 Tata Consultancy Services Argentina S.A. Argentina 99.99 99.99 Tata Consultancy Services Do Brasil Ltda Brazil 100.00 100.00 Tata Consultancy Services De Mexico S.A., De C.V. Mexico 100.00 100.00 Tata Consultancy Services De Espana S.A. Spain 100.00 100.00 TCS Italia SRL Italy 100.00 100.00 Tata Consultancy Services Japan, Ltd. (Refer note 5) Japan 51.00 51.00 Tata Consultancy Services Malaysia Sdn Bhd Malaysia 100.00 100.00 Tata Consultancy Services Luxembourg S.A. Capellen
(G.D. de Luxembourg)
100.00 100.00

Notes to Consolidated Financial Statements
67
Name of the Company Country of incorporation
% of voting power as at March 31,
2016
% of voting power as at March 31,
2015Tata Consultancy Services Portugal Unipessoal Limitada Portugal 100.00 100.00 TCS Inversiones Chile Limitada Chile 99.99 99.99 Tata Consultancy Services Chile S.A. Chile 100.00 100.00 TATA SOLUTION CENTER S.A. Ecuador 100.00 100.00 TCS Financial Solutions Australia Holdings Pty Limited Australia 100.00 100.00 TCS Financial Solutions Australia Pty Limited Australia 100.00 100.00 PT Financial Network Services Indonesia 100.00 100.00 PT Tata Consultancy Services Indonesia Indonesia 100.00 100.00 Tata Consultancy Services Switzerland Ltd. Switzerland 100.00 100.00 Tata Consultancy Services France S.A.S. France 100.00 100.00 Tata Consultancy Services (South Africa) (PTY) Ltd. South Africa 75.00 75.00 Tata Consultancy Services (Thailand) Limited Thailand 100.00 100.00 Tata Consultancy Services (Philippines) Inc. Philippines 100.00 100.00 TCS e-Serve America, Inc. USA 100.00 100.00 TCS Uruguay S. A. Uruguay 100.00 100.00 MGDC S.C. Mexico 100.00 100.00 Diligenta 2 Limited UK 100.00 100.00 MS CJV Investments Corporation USA 100.00 100.00 CMC eBiz Inc. USA 100.00 100.00 Tata Consultancy Services Osterreich GmbH Austria 100.00 100.00 Tata Consultancy Services Danmark ApS Denmark 100.00 100.00 Alti S.A. France 100.00 100.00 Planaxis Technologies Inc. Canada 100.00 100.00 Alti HR S.A.S. France 100.00 100.00 Alti Infrastructures Systemes & Reseaux S.A.S. France 100.00 100.00 Alti NV Belgium 100.00 100.00 Tescom (France) Software Systems Testing S.A.R.L. France 100.00 100.00 Alti Switzerland S.A. Switzerland 100.00 100.00 Teamlink Belgium 100.00 100.00 Tata Consultancy Services Saudi Arabia (w.e.f. July 2, 2015) Saudi Arabia 76.00 - Technology Outsourcing S.A.C. (w.e.f. October 30, 2015) Peru 100.00 -
There are no non-wholly owned subsidiaries that have material non-controlling interests.
On July 2, 2015, the Company through its wholly owned subsidiary, Tata Consultancy Services Netherlands BV subscribed to 76% share capital of Tata Consultancy Services Saudi Arabia.
On October 30, 2015, the Company through its wholly owned subsidiaries TCS Inversiones Chile Limitada and Tata Consultancy Services Chile S.A. subscribed to 100% share capital of Technology Outsourcing S.A.C., an information technology services provider in Peru.
30. Related party transactions
Tata Consultancy Services Limited’s principal related parties consist of its holding company Tata Sons Limited and its subsidiaries, its own subsidiaries, affiliates and its key managerial personnel. TCS Limited routinely enters into transactions with its related parties in the ordinary course of business.
Transactions and balances with its own subsidiaries are eliminated on consolidation.

Notes to Consolidated Financial Statements
68
Annual Report 2015-16
Transactions with related parties are as follows:
Year ended March 31, 2016
With Tata Sons Limited
With subsidiaries of Tata Sons
Limited
With associates / joint ventures
of Tata Sons Limited
With other related parties
Total
(In millions of USD)
Revenue from sale of services and licences
0.7 33.9 329.3 - 363.9
Purchases of goods and services (including reimbursement)
0.5 96.4 75.0 - 171.9
Brand equity contribution 19.5 - - - 19.5
Dividend paid 890.1 0.6 0.4 - 891.1
Purchase of property, plant and equipment
- 4.6 9.2 - 13.8
Contribution to employees post employment benefit plans
- - - 126.2 126.2
Rent expense 0.1 4.2 0.8 - 5.1
Loans and advances given - 0.1 - - 0.1
Purchase of investments - 1,346.5 - - 1,346.5
Redemption of investments - 1,359.5 - - 1,359.5
Year ended March 31, 2015 With Tata
Sons Limited With
subsidiaries of Tata Sons
Limited
With associates / joint ventures of Tata Sons Limited
With other related parties
Total
(In millions of USD) Revenue from sale of services and licences
0.5 39.5 325.0 - 365.0
Interest income 8.1 4.9 3.7 - 16.7 Purchases of goods and services (including reimbursement)
0.1 43.8 65.6 - 109.5
Brand equity contribution 20.1 - - - 20.1 Dividend paid 1,767.3 2.1 - 0.1 1,769.5 Purchase of property, plant and equipment
- 10.8 14.8 - 25.6
Inter-corporate deposits realisation
- 63.4 16.6 - 80.0
Contribution to employees post employment benefit plans
- - - 192.0 192.0
Interest expense 4.7 - - - 4.7 Allowances / (write back) for doubtful accounts receivables and advances (net)
- 0.1 0.2 - 0.3
Rent expense 0.2 0.6 4.8 - 5.6 Loans and advances recovered - - 0.3 - 0.3 Purchase of investments - 1,204.8 - - 1,204.8 Redemption of investments 4.9 1,092.7 0.5 - 1,098.1

Notes to Consolidated Financial Statements
69
Year ended March 31, 2014
With Tata Sons Limited
With subsidiaries of Tata Sons
Limited
With associates / joint ventures of Tata Sons Limited
With other related parties
Total
(In millions of USD)
Revenue from sale of services and licences
0.3 32.2 226.7 - 259.2
Interest income 20.8 9.1 8.3 - 38.2
Purchases of goods and services (including reimbursement)
0.2 43.0 56.5 - 99.7
Brand equity contribution 19.4 - - - 19.4
Dividend paid 593.0 1.1 - - 594.1
Purchase of property, plant and equipment
- 6.6 20.7 - 27.3
Inter-corporate deposits placed - 55.8 - - 55.8
Inter-corporate deposits realisation
- 0.8 - - 0.8
Contribution to employees post employment benefit plans
- - - 130.5 130.5
Interest expense 4.8 - - - 4.8
Allowances / (write back) for doubtful accounts receivables and advances (net)
- 0.1 - - 0.1
Rent expense 0.1 0.7 0.7 - 1.5
Loans and advances given - - 2.1 - 2.1
Loans and advances recovered - - 0.8 - 0.8
Purchase of investments - 4.0 - - 4.0
Redemption of investments 79.7 - - - 79.7
Preference shares redeemed 16.6 - - - 16.6
Balances receivable from related parties are as follows:
As of March 31, 2016 With
Tata Sons Limited
With subsidiaries of Tata Sons
Limited
With associates / joint ventures
of Tata Sons Limited
Total
(In millions of USD)
Trade receivables and unbilled revenue (net) 0.3 16.7 94.3 111.3
Loans, advances and deposits 0.4 0.3 1.4 2.1
Investments - 99.9 - 99.9
Total 0.7 116.9 95.7 213.3

Notes to Consolidated Financial Statements
70
Annual Report 2015-16
As of March 31, 2015 With Tata
Sons Limited With
subsidiaries of Tata Sons
Limited
With associates / joint ventures of Tata Sons Limited
Total
(In millions of USD) Trade receivables and unbilled revenue (net) 0.2 18.6 106.2 125.0
Loans, advances and deposits 0.4 0.1 1.7 2.2
Investments - 108.1 - 108.1
Total 0.6 126.8 107.9 235.3
Balances payable to related parties are as follows:
As of March 31, 2016 With
Tata Sons Limited
With subsidiaries of Tata Sons
Limited
With associates / joint ventures
of Tata Sons Limited
Total
(In millions of USD) Trade payables, unearned and deferred revenue, Other financial liabilities and Other liabilities
17.7 3.0 13.1 33.8
Total 17.7 3.0 13.1 33.8Commitments - 3.7 8.9 12.6
As of March 31, 2015 With Tata
Sons Limited With
subsidiaries of Tata Sons
Limited
With associates / joint ventures of Tata Sons Limited
Total
(In millions of USD) Trade payables, unearned and deferred revenue, Other financial liabilities and Other liabilities
18.2 5.7 15.3 39.2
Total 18.2 5.7 15.3 39.2 Commitments - 8.1 15.2 23.3
Compensation of key management personnel is as follows:
Year ended March 31, 2016
Year ended March 31, 2015
Year ended March 31, 2014
(In millions of USD)
Short-term benefits 6.6 3.8 3.3 Post-employment benefits 0.2 0.3 0.1 Dividend paid during the year 0.1 0.1 -
Total 6.9 4.2 3.4
The remuneration of directors and key executives is determined by the remuneration committee having regard to the performance of individuals and market trends.

Notes to Consolidated Financial Statements
71
31. Dividends
Dividends paid during fiscal 2016 include an amount of $0.37 (`24) per equity share towards final dividend for fiscal 2015 and an amount of $0.25 (`16.5) per equity share towards interim dividend for fiscal 2016. Dividends paid during fiscal 2015 include an amount of $0.33 (`20) per equity share towards final dividend for fiscal 2014 and an amount of $0.91 (`55) per equity share towards interim dividend for fiscal 2015.
The dividends declared by Tata Consultancy Services Limited are in Indian Rupees and are based on the profits available for distribution as reported in the unconsolidated statutory financial statements of Tata Consultancy Services Limited prepared in accordance with Indian GAAP. Accordingly, the retained earnings reported in these financial statements may not be fully distributable. As of March 31, 2016, 2015 and 2014, income (net of dividend tax) available for distribution were $7,941.4 million (`521,524.5 million), $6,601.5 million (`403,958.3 million) and $6,469.9 million (`394,337.4 million), respectively. Subsequent to March 31, 2016, the Board of Directors of Tata Consultancy Services Limited have proposed a final dividend of $0.41 (`27) per share in respect of fiscal 2016. The proposal is subject to the approval of shareholders at the Annual General Meeting, and if approved, would result in a cash outflow of approximately $961.8 million, inclusive of corporate dividend tax of $162.7 million. Remittance of dividend within India is exempt from tax in the hands of shareholders.

72
Annual Report 2015-16
NOTES

73
NOTES

74
Annual Report 2015-16
NOTES


Tata Consultancy Services Limited9th Floor Nirmal Building Nariman Point Mumbai 400 021www.tcs.com
IT ServicesBusiness SolutionsConsulting
IFRS Annual Report 2015-16
Financial Statements prepared in accordance with International Financial Reporting Standards - Fiscal 2016
CMYK