IFIP AICT 413 - Geo-analysis of Landscape Level ... · Geo-analysis of Landscape Level Degradation...
9
J. Hřebíček et al. (Eds.): ISESS 2013, IFIP AICT 413, pp. 285–293, 2013. © IFIP International Federation for Information Processing 2013 Geo-analysis of Landscape Level Degradation and Natural Risk Formation under Uncertainty A Case Study of Selected Czech Urban Watercourses Radka Báčová, Petr Kubíček, Jiří Jakubínský, Eva Svobodová, and Vladimír Herber Department of Geography, Faculty of Science, Masaryk University, Brno, Czech Republic [email protected], [email protected], {jakubinsky,svobodova}@mail.muni.cz, [email protected] Abstract. Rivers and streams in urban areas are losing their natural environ- mental qualities. A lack of river management and insufficient interest on the part of municipal authorities has become the norm, especially in the case of small watercourses. Here, an interdisciplinary approach to landscape-level deg- radation is applied to selected catchments in the Czech Republic (the streams known as the Lačnovský and the Leskava). This approach includes basic geo- graphical approaches to the quantification of the relationship between anthro- pogenic pressure and ecological stability. The methods employed include hy-dromorphological field research, identification of changes in land use, and an inventory of anthropogenic landforms. The existence of urban stream syndrome was established in model catch- ments. Parameters for these areas were compared with values for susceptibility to natural risk and preliminary results show a spatial pattern consistent with the areas at most risk also being prone to flooding. The observations were subjected to cartographic visualization and enriched with thematic and temporal uncer- tainty features, thus refining the results and highlighting any ambiguity. Keywords: degradation of landscape, cartographic visualization, uncertainty, natural risk, river landscape, the Leskava stream, the Lačnovský stream. 1 Introduction River landscapes have always supported human development, providing conditions and functions without which today’s settlements could not exist. The floodplains along rivers, in particular, have been an ideal environment for life. Step by step, peo- ple come to inhabit this landscape and to exploit it. This progress intensified with population growth. New ways of life developed and became more sophisticated, than unnatural processes began to affect river landscapes. Primary ecological values started to decline. Anthropogenic pressure, directly or indirectly, currently influences ap- proximately 30% of Earth’s surface. Tockner [17] and others used the epithet “the double-edged face of floods” when describing the hazards and human benefits of flood plains. They had in mind the conflict between constantly-growing population density in floodplains and the increase in flood-related economic losses. Today, about
Transcript of IFIP AICT 413 - Geo-analysis of Landscape Level ... · Geo-analysis of Landscape Level Degradation...

J. Hřebíček et al. (Eds.): ISESS 2013, IFIP AICT 413, pp. 285–293, 2013. © IFIP International Federation for Information Processing 2013
Geo-analysis of Landscape Level Degradation and Natural Risk Formation under Uncertainty
A Case Study of Selected Czech Urban Watercourses
Radka Báčová, Petr Kubíček, Jiří Jakubínský, Eva Svobodová, and Vladimír Herber
Department of Geography, Faculty of Science, Masaryk University, Brno, Czech Republic [email protected], [email protected],
{jakubinsky,svobodova}@mail.muni.cz, [email protected]
Abstract. Rivers and streams in urban areas are losing their natural environ-mental qualities. A lack of river management and insufficient interest on the part of municipal authorities has become the norm, especially in the case of small watercourses. Here, an interdisciplinary approach to landscape-level deg-radation is applied to selected catchments in the Czech Republic (the streams known as the Lačnovský and the Leskava). This approach includes basic geo-graphical approaches to the quantification of the relationship between anthro-pogenic pressure and ecological stability. The methods employed include hy-dromorphological field research, identification of changes in land use, and an inventory of anthropogenic landforms.
The existence of urban stream syndrome was established in model catch-ments. Parameters for these areas were compared with values for susceptibility to natural risk and preliminary results show a spatial pattern consistent with the areas at most risk also being prone to flooding. The observations were subjected to cartographic visualization and enriched with thematic and temporal uncer-tainty features, thus refining the results and highlighting any ambiguity.
Keywords: degradation of landscape, cartographic visualization, uncertainty, natural risk, river landscape, the Leskava stream, the Lačnovský stream.
1 Introduction
River landscapes have always supported human development, providing conditions and functions without which today’s settlements could not exist. The floodplains along rivers, in particular, have been an ideal environment for life. Step by step, peo-ple come to inhabit this landscape and to exploit it. This progress intensified with population growth. New ways of life developed and became more sophisticated, than unnatural processes began to affect river landscapes. Primary ecological values started to decline. Anthropogenic pressure, directly or indirectly, currently influences ap-proximately 30% of Earth’s surface. Tockner [17] and others used the epithet “the double-edged face of floods” when describing the hazards and human benefits of flood plains. They had in mind the conflict between constantly-growing population density in floodplains and the increase in flood-related economic losses. Today, about
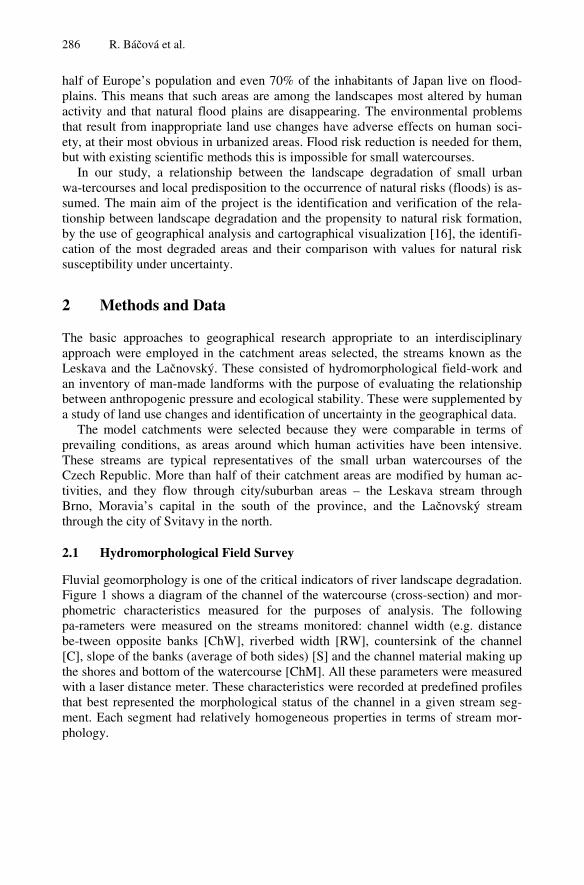
286 R. Báčová et al.
half of Europe’s population and even 70% of the inhabitants of Japan live on flood-plains. This means that such areas are among the landscapes most altered by human activity and that natural flood plains are disappearing. The environmental problems that result from inappropriate land use changes have adverse effects on human soci-ety, at their most obvious in urbanized areas. Flood risk reduction is needed for them, but with existing scientific methods this is impossible for small watercourses.
In our study, a relationship between the landscape degradation of small urban wa-tercourses and local predisposition to the occurrence of natural risks (floods) is as-sumed. The main aim of the project is the identification and verification of the rela-tionship between landscape degradation and the propensity to natural risk formation, by the use of geographical analysis and cartographical visualization [16], the identifi-cation of the most degraded areas and their comparison with values for natural risk susceptibility under uncertainty.
2 Methods and Data
The basic approaches to geographical research appropriate to an interdisciplinary approach were employed in the catchment areas selected, the streams known as the Leskava and the Lačnovský. These consisted of hydromorphological field-work and an inventory of man-made landforms with the purpose of evaluating the relationship between anthropogenic pressure and ecological stability. These were supplemented by a study of land use changes and identification of uncertainty in the geographical data.
The model catchments were selected because they were comparable in terms of prevailing conditions, as areas around which human activities have been intensive. These streams are typical representatives of the small urban watercourses of the Czech Republic. More than half of their catchment areas are modified by human ac-tivities, and they flow through city/suburban areas – the Leskava stream through Brno, Moravia’s capital in the south of the province, and the Lačnovský stream through the city of Svitavy in the north.
2.1 Hydromorphological Field Survey
Fluvial geomorphology is one of the critical indicators of river landscape degradation. Figure 1 shows a diagram of the channel of the watercourse (cross-section) and mor-phometric characteristics measured for the purposes of analysis. The following pa-rameters were measured on the streams monitored: channel width (e.g. distance be-tween opposite banks [ChW], riverbed width [RW], countersink of the channel [C], slope of the banks (average of both sides) [S] and the channel material making up the shores and bottom of the watercourse [ChM]. All these parameters were measured with a laser distance meter. These characteristics were recorded at predefined profiles that best represented the morphological status of the channel in a given stream seg-ment. Each segment had relatively homogeneous properties in terms of stream mor-phology.

Geo-analysis of Landscape Level Degradation and Natural Risk Formation 287
Fig. 1. Morphometric parameters measured in the channel
The acquired data was entered into the calculation of a pair of indicators that pro-vide information on the status of channel morphometry and its patency: the channel morphology index (CMI) and the channel capacity coefficient (CCC) were further calculated. Both indicators may serve as sources of information about the potential for flooding, since they include a number of variables that may impact upon flooding processes. The aim of the CCC calculation is to identify the critical locations within the hydrographical network, where a flood can easily occur in the event of high dis-charge. Generally the higher the CCC, the lower the capacity of the channel and the greater the risk of flooding [7], [8].
The principle indicator calculation is represented by equations 1 and 2:
CCC = AW1 + BW2 + CW3 + DW4 + EW5 + FW6 (1)
where the importance of variables and weights is: A … undersized bridge (W1 = 1.5); B … barrier within the channel (W2 = 1.2); C … reduced channel capacity (W3 = 1.4); D … narrow inundation area (W4 = 1.3); E … unsuitably situated buildings (W5 = 1.0); F … alternation of artificial and natural channel (W6 = 1.1).
CMI = (ChW-RW+C) * S/100 * ShM (2)
Variables as Figure 1.
2.2 Inventory of Anthropogenic Landforms
The second method employed was to take an inventory of man-made landforms in model catchments. These were classified into nine categories on the basis of genesis [1]: mining landforms, industrial landforms, agricultural landforms, urban landforms, transport landforms, water landforms, funeral landforms, pilgrimage landforms, and recreational and sports landforms. We observed surface and subsurface man-made landforms [14], both of which may modify natural processes in the event of flooding.
The level of the natural process of flood modification was expressed as two weights, the first of which classified identified landforms into four categories, based on their effects on the process:

288 R. Báčová et al.
• Positive effect (0) – man-made landform built for flood protection. Its main func-tion is retention of water in the landscape (e.g. water reservoir, pond, dam) and re-duction of flood (e.g. levee, protective wall).
• Without effect - minimal negative effect (1) – behaviour of these landforms does not significantly affect the process of floods. However, they can change the hydro-logical regime and accelerate or decelerate runoff water from the landscape (e.g. mine, sand pit, wildlife crossing (ecoduct), agricultural terrace, sewage disposal plant, graveyard).
• Moderate negative effect (2) – landforms that can accelerate the flow of water in the watercourse (e.g. man-modified watercourse, canal). These may constitute a barrier to a flood or a source of sediments and debris that reduce the profile of the riverbed (e.g. mining heap, agricultural heap, industrial heap, bridge construction, waste dump). Land-forms that significantly reduce water infiltration and retention in the landscape are included here (e.g. industrial estate, urban planes, transport platforms, parking-sites, agricultural platforms).
• Very negative effect (3) – undersized bridge, weir, spillway and sewage network in the category of man-made landforms, strongly influencing the process of floods. These create barriers and radically change the flow of the flood.
These categories are valid for point (e.g. weir) and areal landforms (e.g. polder). However, the linear types are affected by their orientation with reference to the water-course. They may fall into any of the categories; this principal is illustrated in Figure 2.
Fig. 2. Position of linear landform with reference to watercourse and effects on the process of flooding
The second of the weights specifies the location of anthropogenic form within the catchment area of the stream. We defined three zones – up to 5 metres from the watercourse (3), river landscape area beyond 5 metres from the watercourse (2)
Geo-analysis of Landscape Level Degradation and Natural Risk Formation 289
remainder of the catchment beyond the river landscape (1). All these weights were identified on the basis of general experience in flood risk and catchment management, but they contain a certain degree of uncertainty, which is discussed below.
2.3 Identification of Uncertainty in Geodata
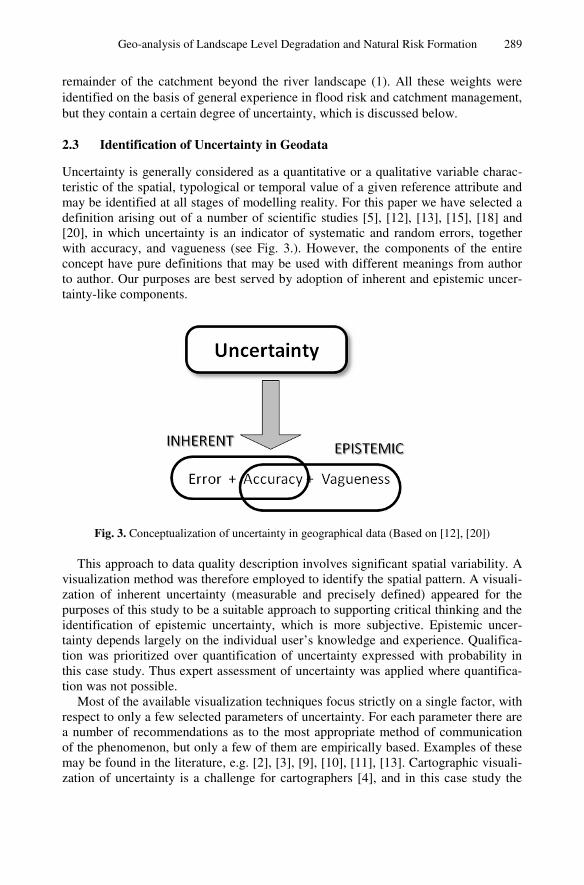
Uncertainty is generally considered as a quantitative or a qualitative variable charac-teristic of the spatial, typological or temporal value of a given reference attribute and may be identified at all stages of modelling reality. For this paper we have selected a definition arising out of a number of scientific studies [5], [12], [13], [15], [18] and [20], in which uncertainty is an indicator of systematic and random errors, together with accuracy, and vagueness (see Fig. 3.). However, the components of the entire concept have pure definitions that may be used with different meanings from author to author. Our purposes are best served by adoption of inherent and epistemic uncer-tainty-like components.
Fig. 3. Conceptualization of uncertainty in geographical data (Based on [12], [20])
This approach to data quality description involves significant spatial variability. A visualization method was therefore employed to identify the spatial pattern. A visuali-zation of inherent uncertainty (measurable and precisely defined) appeared for the purposes of this study to be a suitable approach to supporting critical thinking and the identification of epistemic uncertainty, which is more subjective. Epistemic uncer-tainty depends largely on the individual user’s knowledge and experience. Qualifica-tion was prioritized over quantification of uncertainty expressed with probability in this case study. Thus expert assessment of uncertainty was applied where quantifica-tion was not possible.
Most of the available visualization techniques focus strictly on a single factor, with respect to only a few selected parameters of uncertainty. For each parameter there are a number of recommendations as to the most appropriate method of communication of the phenomenon, but only a few of them are empirically based. Examples of these may be found in the literature, e.g. [2], [3], [9], [10], [11], [13]. Cartographic visuali-zation of uncertainty is a challenge for cartographers [4], and in this case study the

290 R. Báčová et al.
possibilities of multidimensional form have been explored. Two visualization meth-ods were employed – comparatives and combined maps [12].
The system of uncertainty identification was discussed between geographers and cartographers. The objective was to evaluate thematic and temporal uncertainty to-gether, with no accentuation of individual components. Thematic uncertainty was determined as the role of man-made landforms in the natural process of flood and corresponds with the three distance zones from the watercourse (above). The uncer-tainty grows with increasing distance because we are not able to make a determination of the impact of anthropogenic landforms in the watershed catchment. Thematic un-certainty was identified in the selected landforms in which experience was lacking of their impact in modelling floods. Temporal uncertainty was fixed in landforms where temporal change is obvious, e.g. the highest temporal uncertainty was reflected at a farm track, the lowest at a bridge construction.
3 Results and Discussion
The above analyses enable identification of the most degraded areas that may affect natu-ral flood processes. Both hydromorphological indexes, CCC (channel coefficient capac-ity) and CMI (channel morphology index), define a level of natural state degra-dation conditioned by human activities in homogenous sections of the watercourse. The situa-tion is at its worst in permanently occupied urban areas where people co-habit with streams. The anthropogenic landforms inventory supports these hypothe-ses.
Figure 4 clearly shows the river network and it easy to confirm that the most de-graded area is river landscape, also the most vulnerable. The hexagonal net map is used as the main cartographic visualization method; it can take the ideal neighbour-hood of every hexagon subarea into account. The area of these polygons is 1 ha, but changing this parameter may result in a different pattern. The efficiency of the tech-niques employed needs to be discussed. The rare visualization of single landforms might be more accurate, but its ability to be entered into future analyses is reduced.
The data quality is characterized by level of uncertainty. The reliable areas appear in the illustration in Fig. 5. Maps of comparatives (Fig. 5, upper picture) are created by two different maps, one showing the hexagonal net maps from the previous case and the other showing the bivariate map of temporal and thematic uncertainty by changing size and colours of symbols. The growing thematic uncertainty of the water-shed basin with the most confident areas near the watercourse is clearly visible. Combined maps (Fig. 5, lower picture) show the same situation in one presentation. This is one typical example, where the most degraded hexagon (in the left part) in dark red is disputed, with a high level of temporal uncertainty. Its temporal change is highly variable and it is therefore not permanent enough to enter analysis. One future plan is to verify the benefit of qualitative and quantitative expressions of uncertainty. The authors remain, meanwhile, convinced that quantitative definition would be more confusing.
Geo-analysis of Landscape Level Degradation and Natural Risk Formation 291
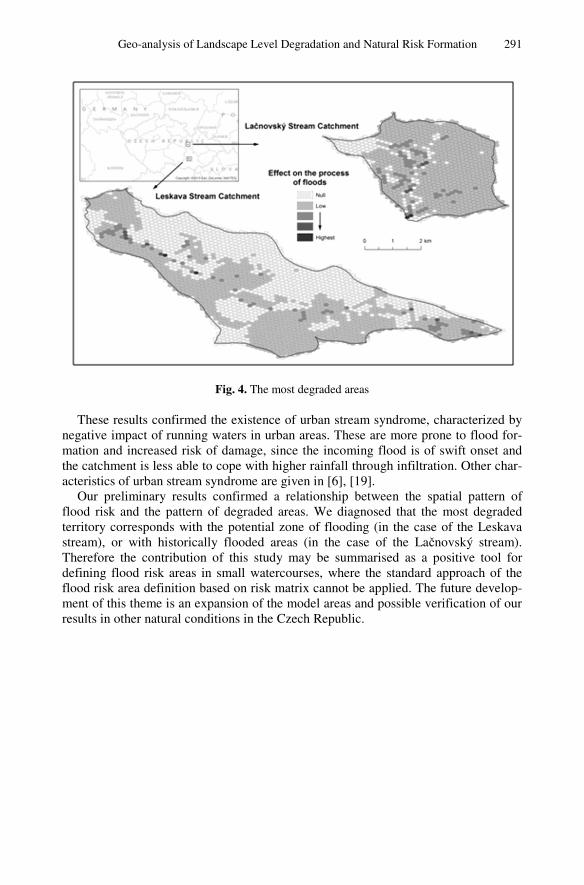
Fig. 4. The most degraded areas
These results confirmed the existence of urban stream syndrome, characterized by negative impact of running waters in urban areas. These are more prone to flood for-mation and increased risk of damage, since the incoming flood is of swift onset and the catchment is less able to cope with higher rainfall through infiltration. Other char-acteristics of urban stream syndrome are given in [6], [19].
Our preliminary results confirmed a relationship between the spatial pattern of flood risk and the pattern of degraded areas. We diagnosed that the most degraded territory corresponds with the potential zone of flooding (in the case of the Leskava stream), or with historically flooded areas (in the case of the Lačnovský stream). Therefore the contribution of this study may be summarised as a positive tool for defining flood risk areas in small watercourses, where the standard approach of the flood risk area definition based on risk matrix cannot be applied. The future develop-ment of this theme is an expansion of the model areas and possible verification of our results in other natural conditions in the Czech Republic.

292 R. Báčová et al.
Fig. 5. Comparatives (upper) and combined (lower) uncertainty maps (illustration)
References
1. Demek, J., Embleton, C. (eds.): Guide to Medium – Scale Geomor-phological Mapping. IGU Commission on Geomorphological Survey and Mapping. Brno (1978)

Geo-analysis of Landscape Level Degradation and Natural Risk Formation 293
2. Dvorsky, J., Snasel, V., Vozenilek, V.: Map Similarity Testing Using Matrix Decomposi-tion. In: Badr, Y.K., Caballe, S., Xhafa, F., Abraham, A., Gros, B. (eds.) International Conference on Intelligent Networking and Collaborative Systems, pp. 290–295 (2009)
3. Edwards, L.D., Nelson, E.S.: Visualizing data certainty: A case study using graduated cir-cles maps. Cartographic Perspectives 38, 19–36 (2001)
4. Feiden, K., Kruse, F., Řezník, T., Kubíček, P., Schentz, H., Eberhardt, E., Baritz, R.: Best Practice Network GS SOIL Promoting Access to European, Interoperable and INSPIRE Compliant Soil Information. In: Hřebíček, J., Schimak, G., Denzer, R. (eds.) ISESS 2011. IFIP AICT, vol. 359, pp. 226–234. Springer, Heidelberg (2011)
5. Goodchild, M.: Visualizing fizzy map. In: Hearnshaw, H. (ed.) Visualization in Geo-Graphical Information Systems, pp. 158–167. John Willey & Sons, London (1994)
6. Gurnell, A., et al.: Urban rivers: Hydrology, geomorphology, ecology and opportunities for change. Geography Compass 1(5), 1118–1137 (2007)
7. Jakubínský, J.: The influence of watercourses regulations on runoff processes and the de-velopment of floods (a case study of the Košátecký stream), Diploma Thesis (2011)
8. Jakubínský, J., Báčová, R.: Environmental Values: the Dunajovický and the Košátecký Stream Catchments, Czech Republic. Journal of Maps 9(3), 9 p. (2013), doi:10.1080/17445647.2013.829409
9. Kubíček, P., Šašinka, Č.: Thematic Uncertainty Visualization Usability – Comparison of Basic Methods. Annals of GIS 17, 20 (2011)
10. Leitner, M., Buttenfield, B.P.: Guidelines for the display of attribute uncertainty. Carto-graphy and Geographic Information Science 27, 3–14 (2000)
11. MacEachren, A., et al.: Visualizing uncertain information. Cartographic Perspec-tives 13(3), 10–19 (1992)
12. MacEachren, A., et al.: Visualising geospatial information uncertainty. What we know and what we need to know. Cartography and Geographic Information Science 32, 139–160 (2005)
13. Pang, A., et al.: Visualizing uncertainty in geo-spatial data. In: Proceedings of the Workshop on the Intersections between Geospatial Information and Information Technology, pp. 1–14. National Academies Committee of the Computer Science and Tele-communications Board, Washington, D. C (1997)
14. Pechanec, V., Janíková, V., Brus, J., Kiliánová, H.: Typological data in the process of landscape potential identification with using GIS. Moravian Geographical Reports 17, 12–24 (2009)
15. Shi, W.: Principles of modelling uncertainties in spatial data and spatial analyses. Taylor and Francis, London (2010)
16. Staněk, K., Friedmannová, L., Kubíček, P., Konečný, M.: Selected issues of cartographic communication optimization for emergency centers. International Journal of Digital Earth 3, 316–339 (2010)
17. Tockner, K., Bunn, S.E., Gordon, C., Naiman, R.J., Quinn, G.P., Stanford, J.: Flood plains: critically threatened ecosystems. In: Polunin, N. (ed.) Aquatic systems, trends and global prospects, pp. 45–61. Cambridge University Press (2008)
18. Tucek, P., Paszto, V., Vozenilek, V.: Regular use of entropy for studying dissimilar geo-graphical phenomena. Geografie-Sbornik CGS 114, 117–129 (2009)
19. Walsh, C.H.J., et al.: The urban stream syndrome: current knowledge and the search for a cure. J. N. Am. Benthol. Soc. 24, 706–723 (2005)
20. Zhang, J., Goodchild, M.: Uncertainty in Geographical Information. Taylor and Francis, London (2002)