
IFFM012014
28
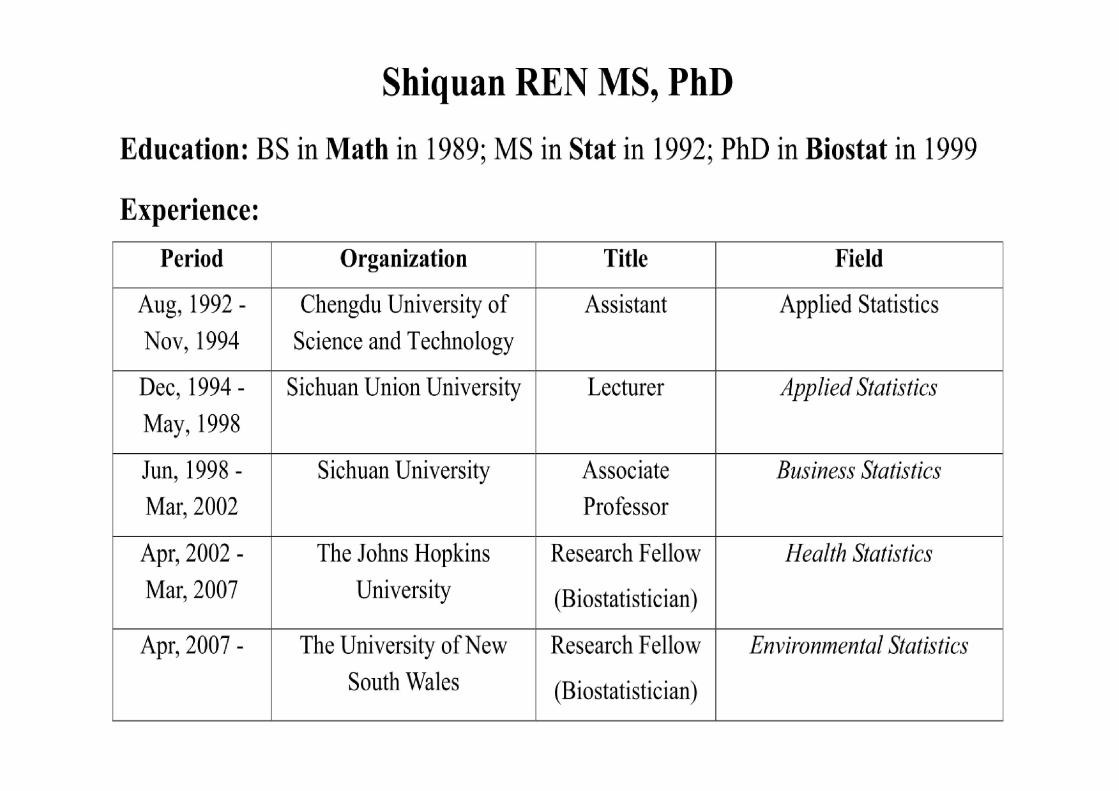
New Temporal and Spatio-temporal Modelling: Integrated Flow and Flood Modelling (IFFM) Shiquan REN, PhD https://www.linked.com/in/ctusren [email protected] Partly working with Richard Kingsford at UNSW January, 2014
-
Upload
shiquan-ren -
Category
Documents
-
view
44 -
download
1
Transcript of IFFM012014

New Temporal and Spatio-temporal Modelling: Integrated Flow and Flood
Modelling (IFFM)
Shiquan REN, PhD
https://www.linked.com/in/ctusren
Partly working with Richard Kingsford at UNSW
January, 2014

Current Research
• Statistical Models and Methods
• IFFM in the Macquarie River and Macquarie Marshes
• IFFM in the Murrumbidgee River and Lowbidgee
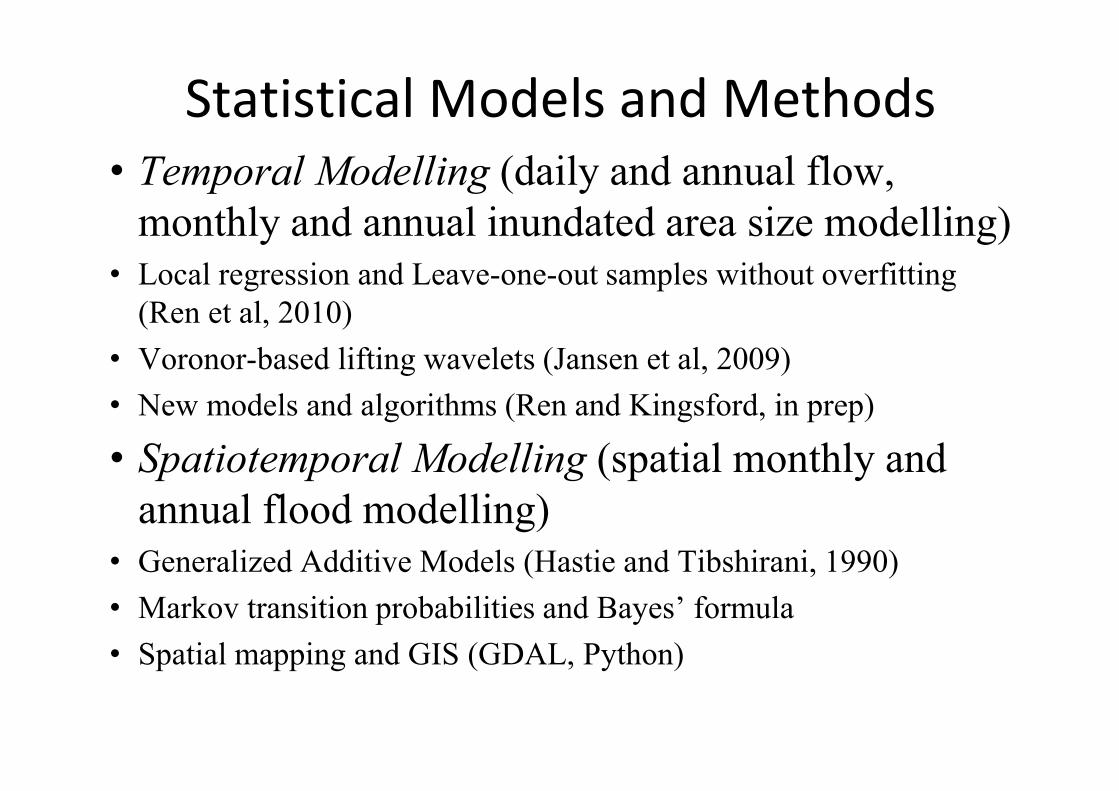
Statistical Models and Methods• Temporal Modelling (daily and annual flow,
monthly and annual inundated area size modelling)• Local regression and Leave-one-out samples without overfitting
(Ren et al, 2010)
• Voronor-based lifting wavelets (Jansen et al, 2009)
• New models and algorithms (Ren and Kingsford, in prep)
• Spatiotemporal Modelling (spatial monthly and annual flood modelling)
• Generalized Additive Models (Hastie and Tibshirani, 1990)
• Markov transition probabilities and Bayes’ formula
• Spatial mapping and GIS (GDAL, Python)
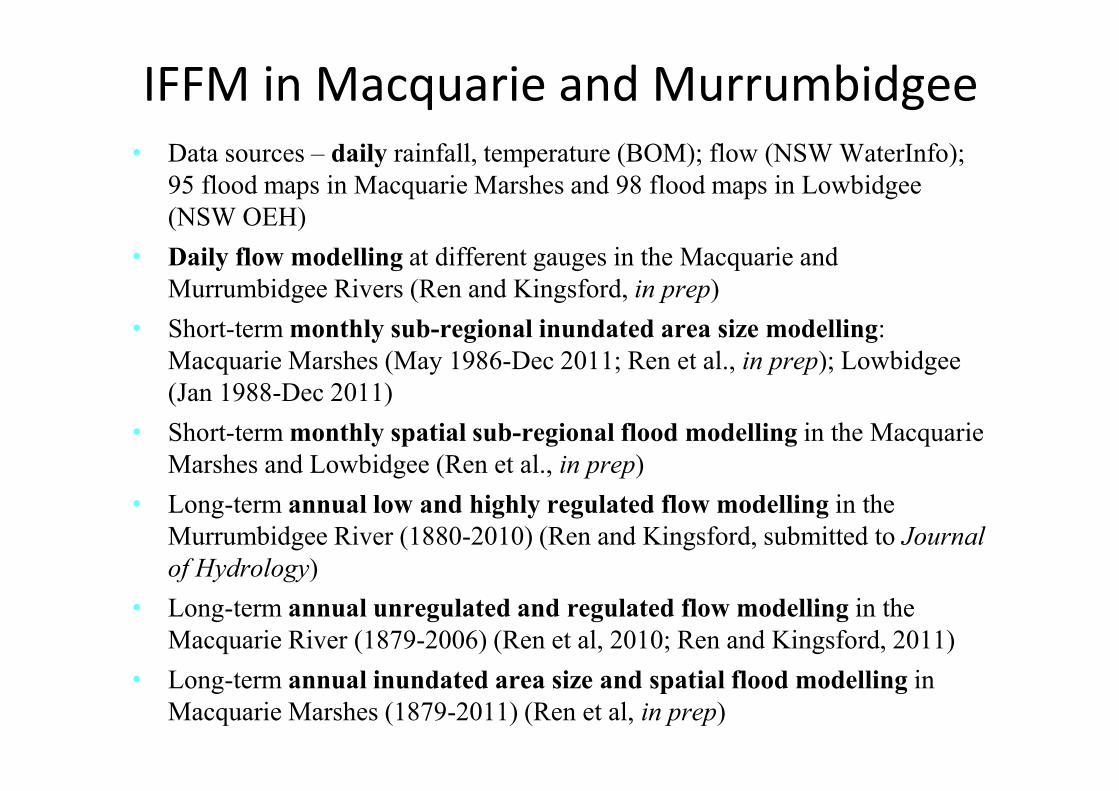
IFFM in Macquarie and Murrumbidgee• Data sources – daily rainfall, temperature (BOM); flow (NSW WaterInfo);
95 flood maps in Macquarie Marshes and 98 flood maps in Lowbidgee(NSW OEH)
• Daily flow modelling at different gauges in the Macquarie and Murrumbidgee Rivers (Ren and Kingsford, in prep)
• Short-term monthly sub-regional inundated area size modelling: Macquarie Marshes (May 1986-Dec 2011; Ren et al., in prep); Lowbidgee(Jan 1988-Dec 2011)
• Short-term monthly spatial sub-regional flood modelling in the Macquarie Marshes and Lowbidgee (Ren et al., in prep)
• Long-term annual low and highly regulated flow modelling in the Murrumbidgee River (1880-2010) (Ren and Kingsford, submitted to Journal of Hydrology)
• Long-term annual unregulated and regulated flow modelling in the Macquarie River (1879-2006) (Ren et al, 2010; Ren and Kingsford, 2011)
• Long-term annual inundated area size and spatial flood modelling in Macquarie Marshes (1879-2011) (Ren et al, in prep)
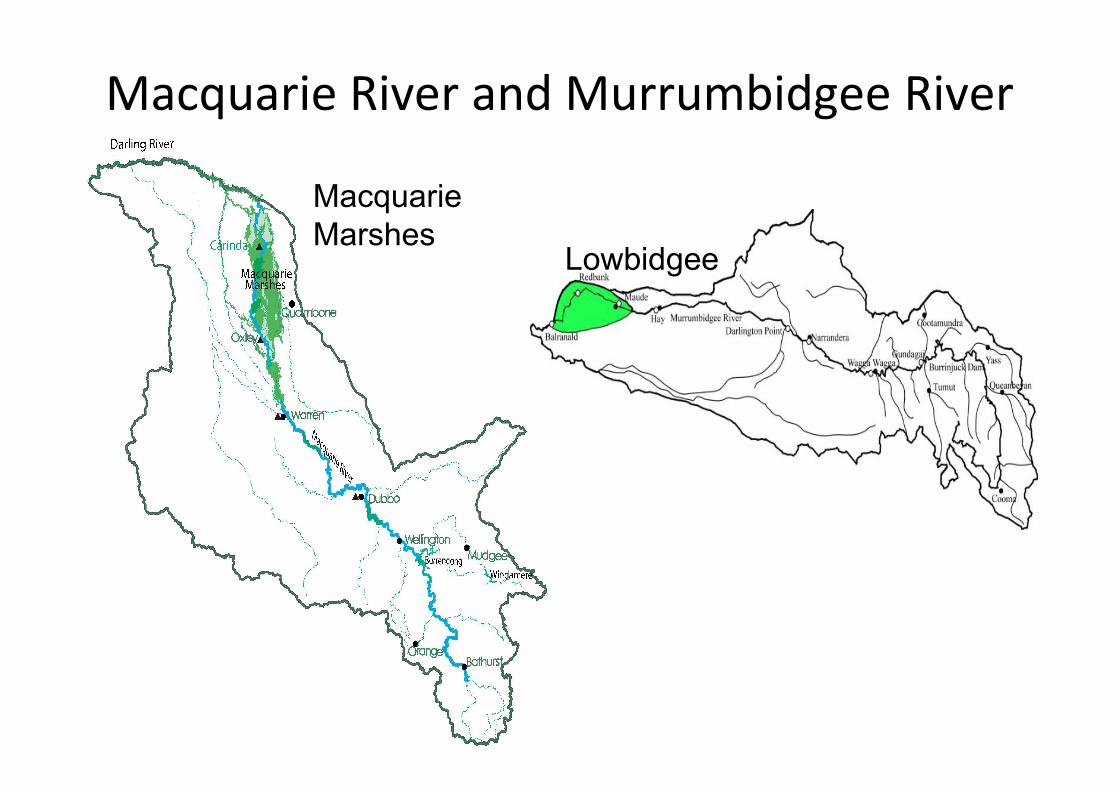
Macquarie River and Murrumbidgee River
Lowbidgee
Macquarie Marshes
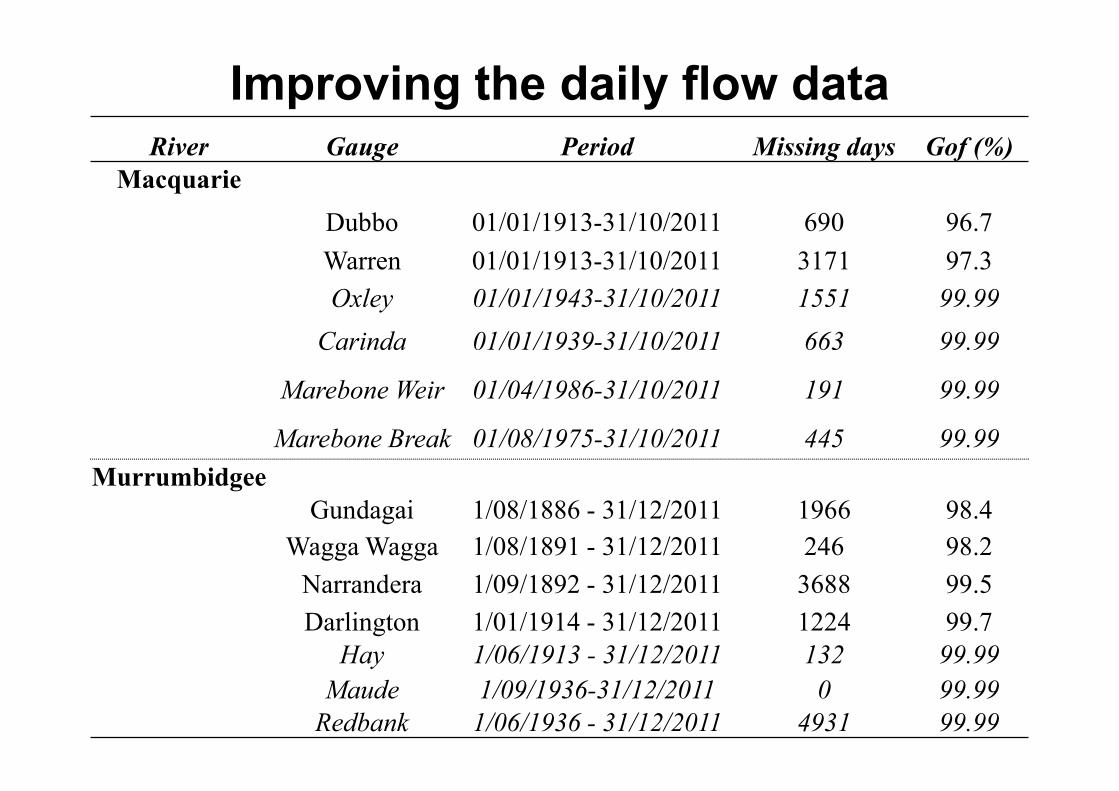
River Gauge Period Missing days Gof (%)Macquarie
Dubbo 01/01/1913-31/10/2011 690 96.7
Warren 01/01/1913-31/10/2011 3171 97.3
Oxley 01/01/1943-31/10/2011 1551 99.99
Carinda 01/01/1939-31/10/2011 663 99.99
Marebone Weir 01/04/1986-31/10/2011 191 99.99
Marebone Break 01/08/1975-31/10/2011 445 99.99
MurrumbidgeeGundagai 1/08/1886 - 31/12/2011 1966 98.4
Wagga Wagga 1/08/1891 - 31/12/2011 246 98.2
Narrandera 1/09/1892 - 31/12/2011 3688 99.5
Darlington 1/01/1914 - 31/12/2011 1224 99.7Hay 1/06/1913 - 31/12/2011 132 99.99
Maude 1/09/1936-31/12/2011 0 99.99Redbank 1/06/1936 - 31/12/2011 4931 99.99
Improving the daily flow data
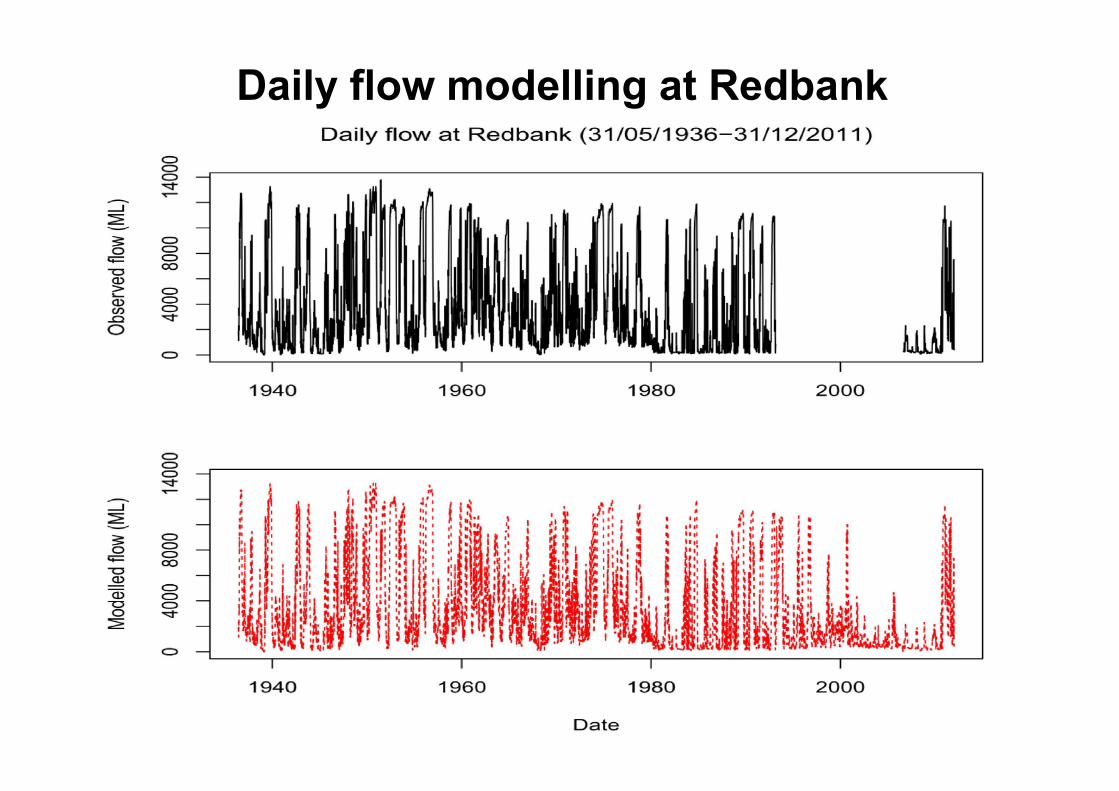
Daily flow modelling at Redbank

Daily flow modelling at Oxley
IFFM daily flow modelling (Nash–Sutcliffe efficiency is 99.99% at Oxley from 01/01/1943 to 31/10/2011 and 99.99% at Carinda from 01/01/1939 to 31/10/2011) may be better than IQQM (95% at Oxley and 76% at Carinda from 01/01/1991 to 31/12/2009 - Wen et al., 2013)
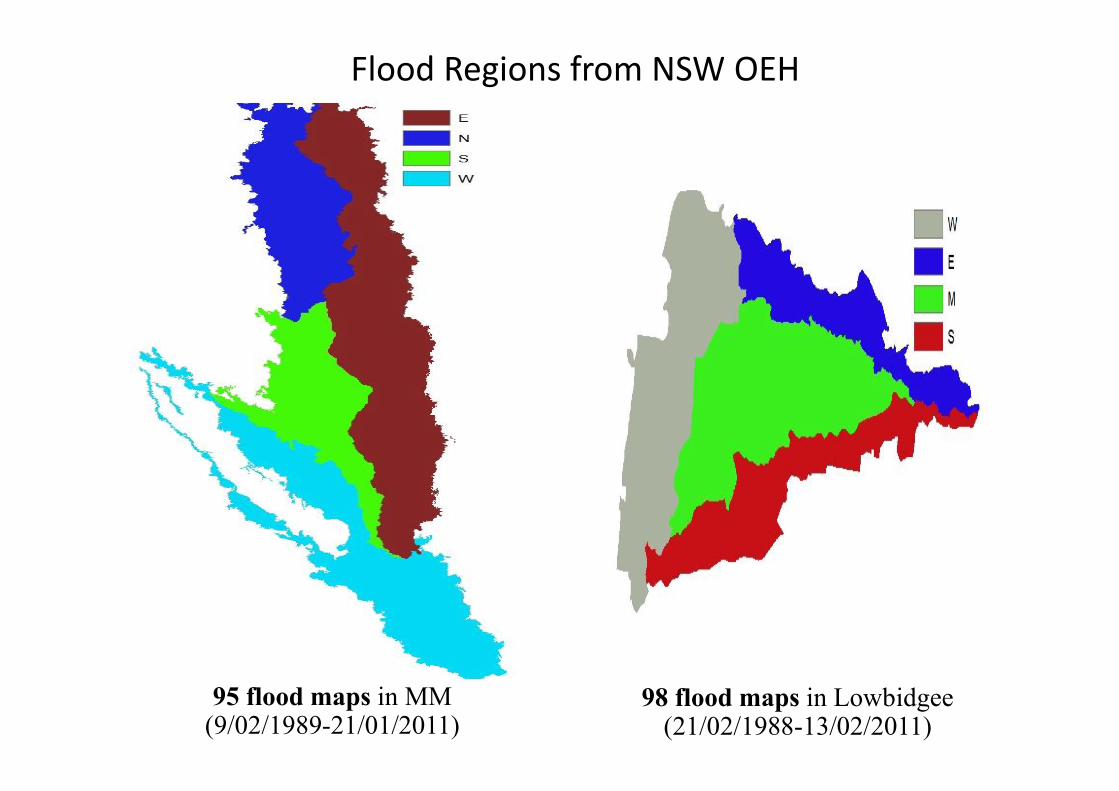
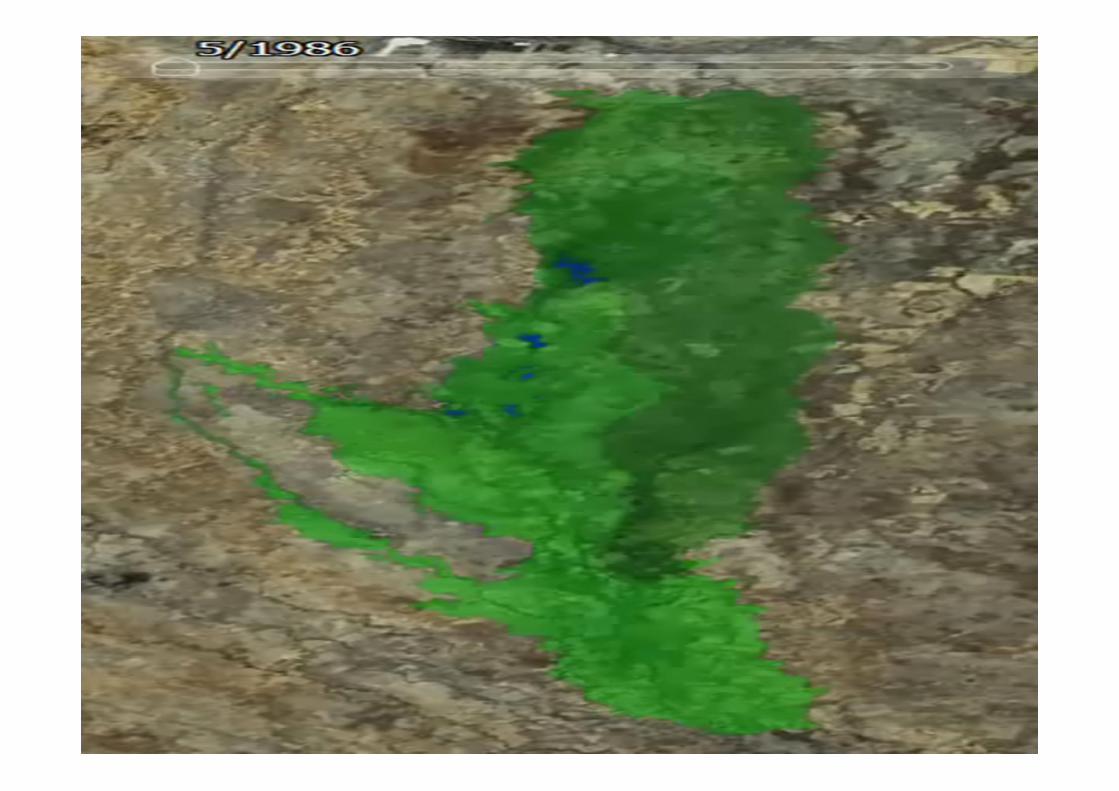
95 flood maps in MM(9/02/1989-21/01/2011)
Flood Regions from NSW OEH
98 flood maps in Lowbidgee(21/02/1988-13/02/2011)
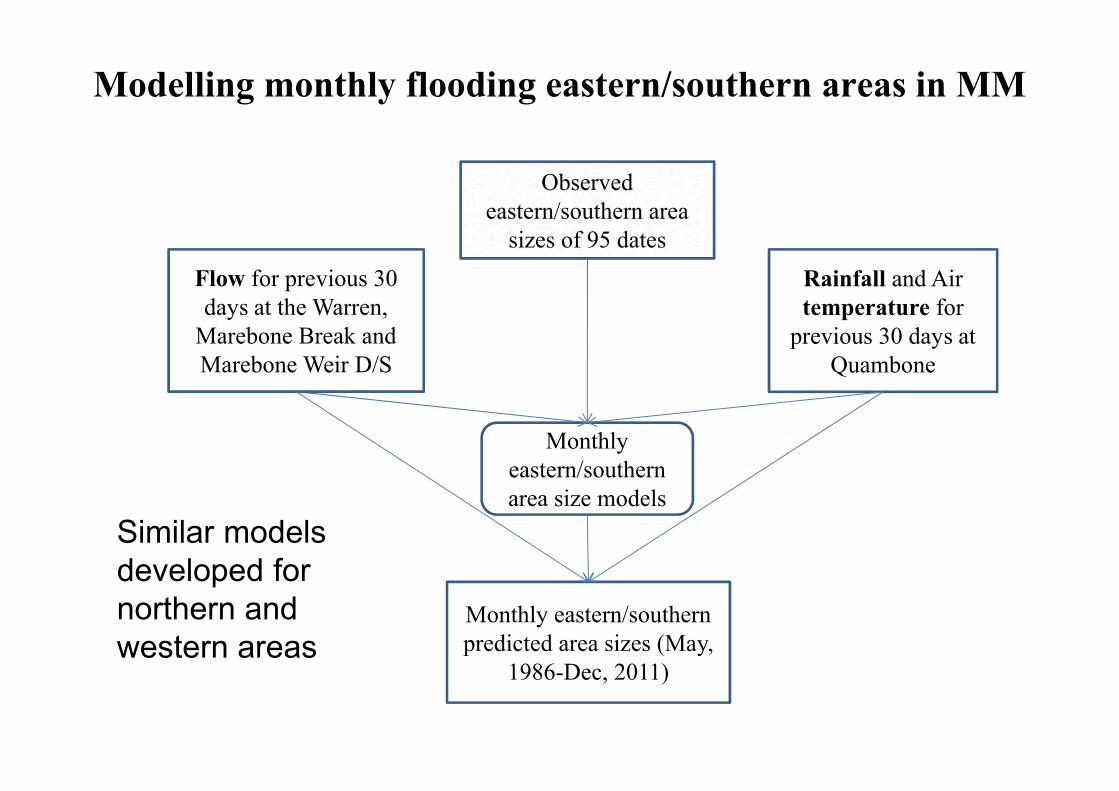
Modelling monthly flooding eastern/southern areas in MM
Monthly eastern/southern area size models
Observed eastern/southern area
sizes of 95 dates
Flow for previous 30 days at the Warren,
Marebone Break and Marebone Weir D/S
Monthly eastern/southern predicted area sizes (May,
1986-Dec, 2011)
Rainfall and Air temperature for
previous 30 days at Quambone
Similar models developed for northern and western areas
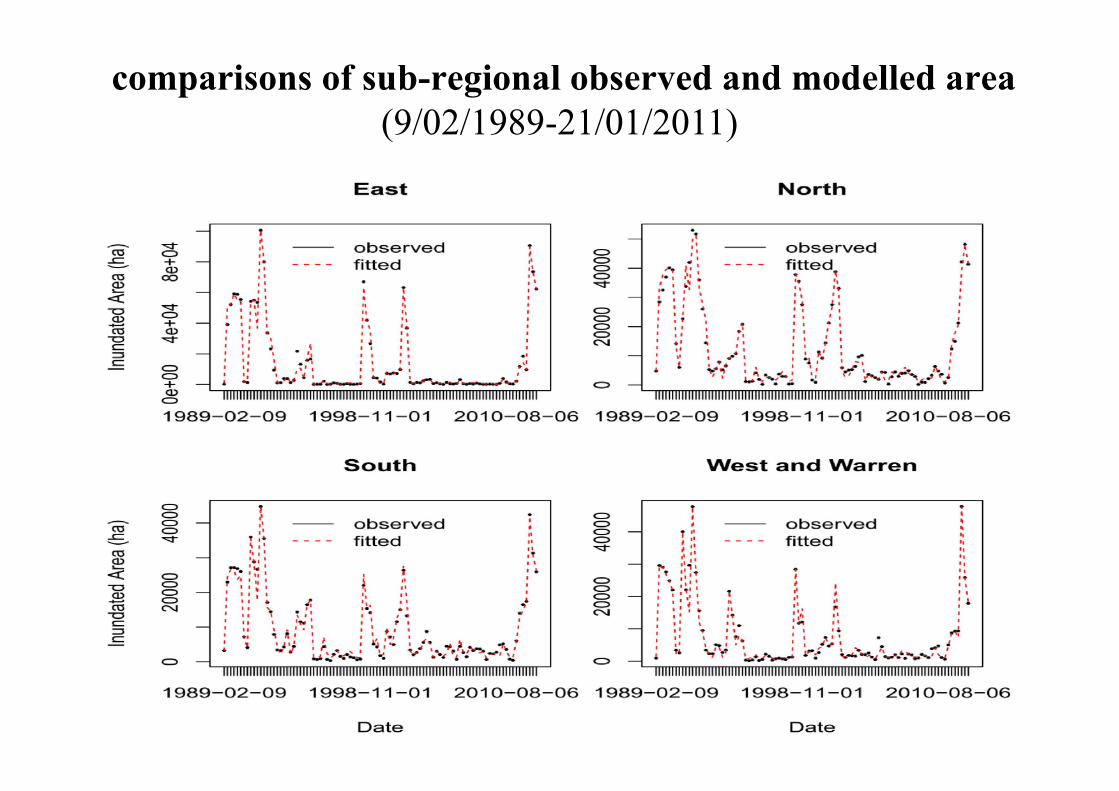
comparisons of sub-regional observed and modelled area (9/02/1989-21/01/2011)
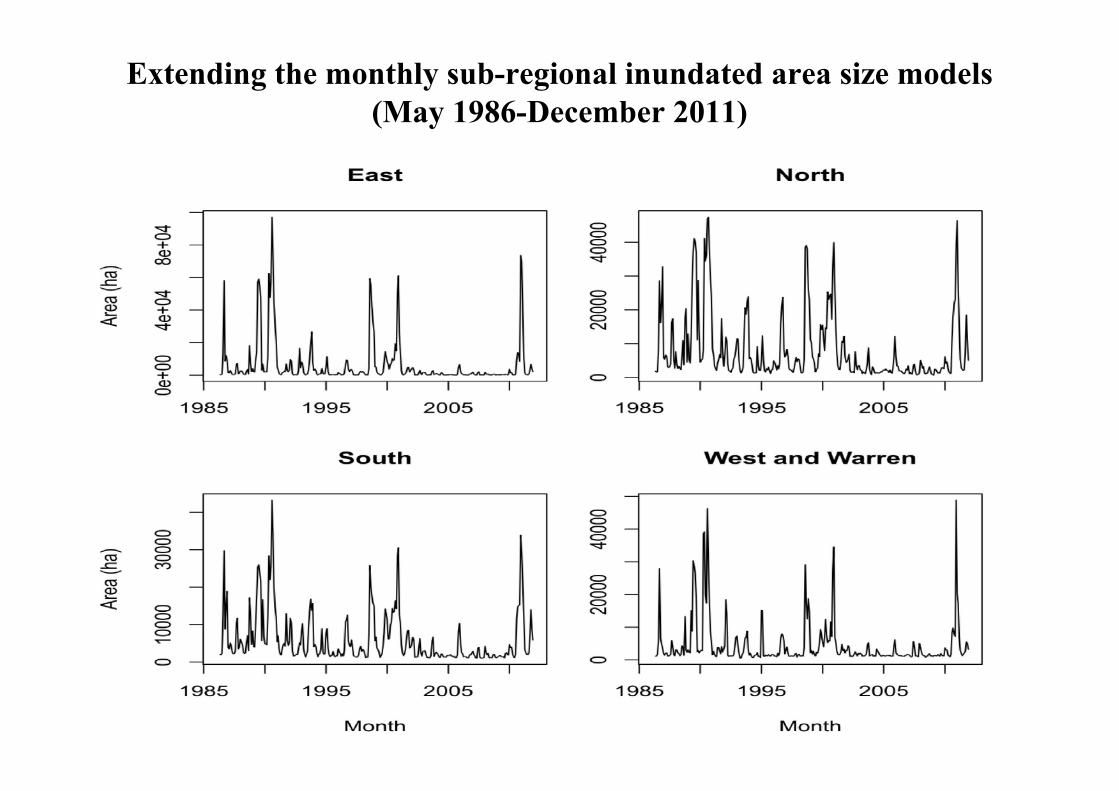
Extending the monthly sub-regional inundated area size models (May 1986-December 2011)
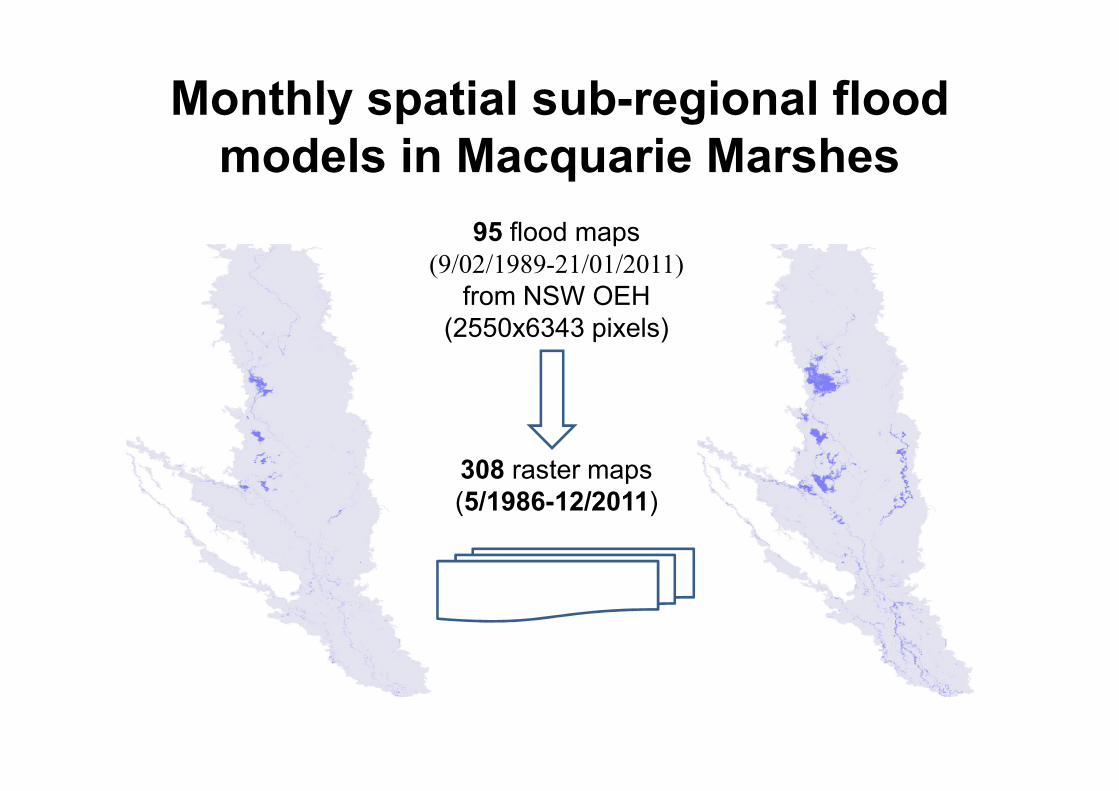
Monthly spatial sub-regional flood models in Macquarie Marshes
308 raster maps (5/1986-12/2011)
95 flood maps(9/02/1989-21/01/2011)
from NSW OEH (2550x6343 pixels)

Monthly Spatial Sub-regional Flood Models in MM
Monthly spatial sub-regional flood models
Sub-regional observed area sizes (9/02/1989-21/01/2011)
1 arc second DEM of Australia
Monthly sub-regional predicted area sizes
(May, 1986-Dec, 2011)
Monthly sub-regional predicted flood maps
(May, 1986-Dec, 2011)
Sub-regional observed flood maps (9/02/1989-
21/01/2011)
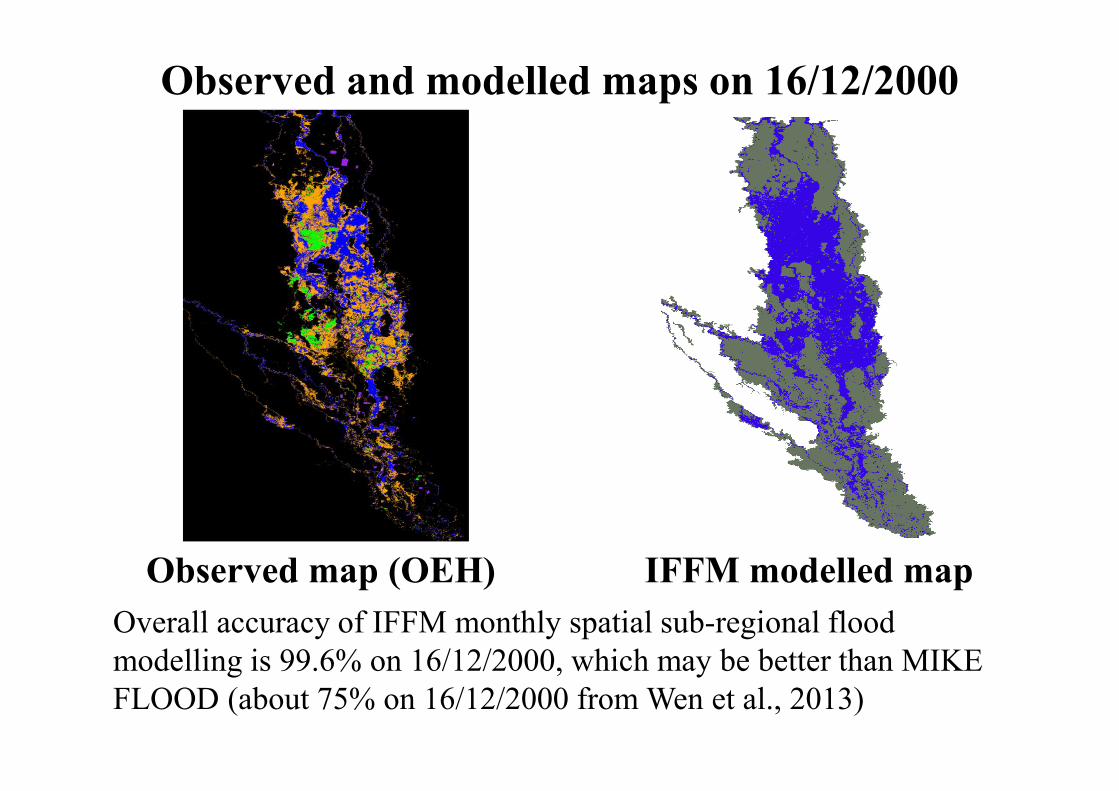
Overall accuracy of IFFM monthly spatial sub-regional flood modelling is 99.6% on 16/12/2000, which may be better than MIKE FLOOD (about 75% on 16/12/2000 from Wen et al., 2013)
Observed and modelled maps on 16/12/2000
Observed map (OEH) IFFM modelled map
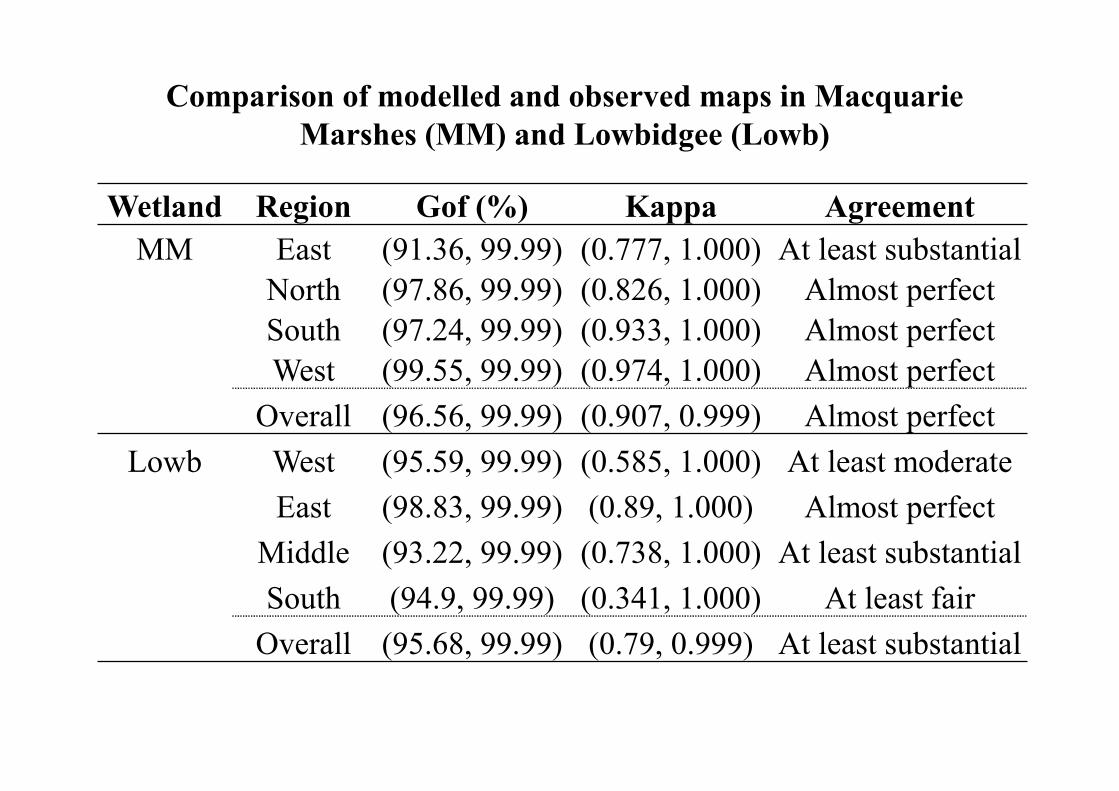
Comparison of modelled and observed maps in Macquarie Marshes (MM) and Lowbidgee (Lowb)
Wetland Region Gof (%) Kappa Agreement
MM East (91.36, 99.99) (0.777, 1.000) At least substantial
North (97.86, 99.99) (0.826, 1.000) Almost perfect
South (97.24, 99.99) (0.933, 1.000) Almost perfect
West (99.55, 99.99) (0.974, 1.000) Almost perfect
Overall (96.56, 99.99) (0.907, 0.999) Almost perfect
Lowb West (95.59, 99.99) (0.585, 1.000) At least moderate
East (98.83, 99.99) (0.89, 1.000) Almost perfect
Middle (93.22, 99.99) (0.738, 1.000) At least substantial
South (94.9, 99.99) (0.341, 1.000) At least fair
Overall (95.68, 99.99) (0.79, 0.999) At least substantial
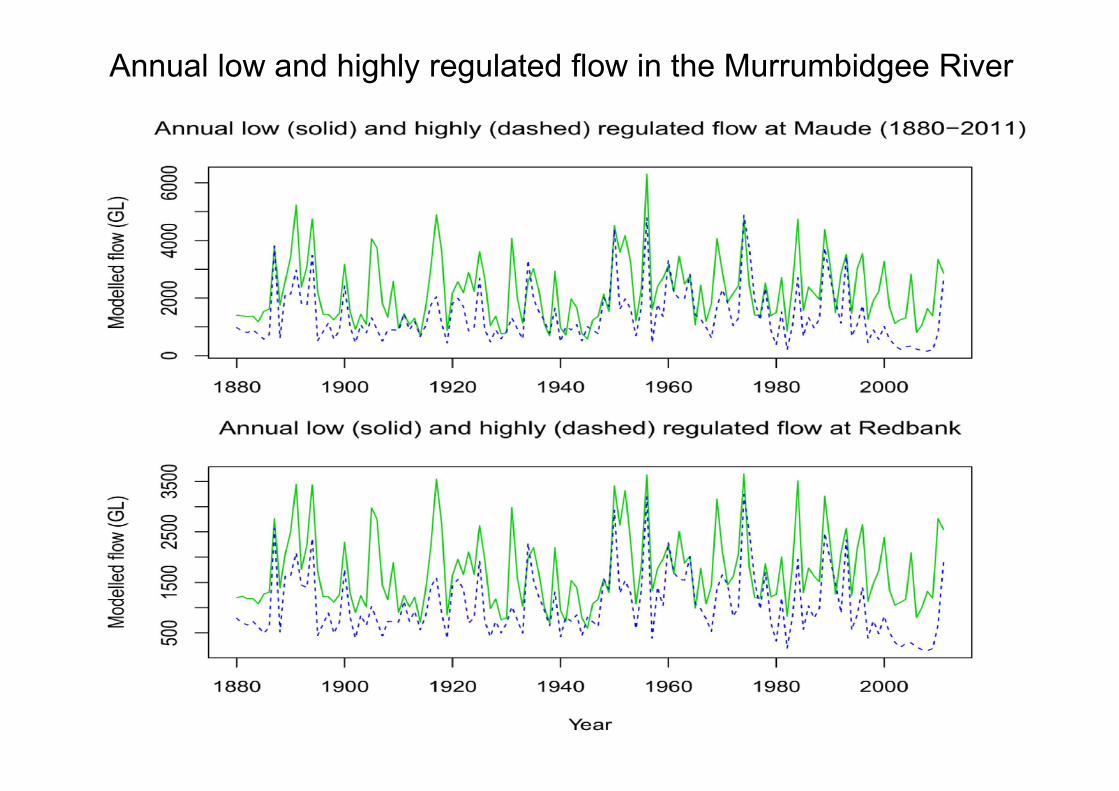
Annual low and highly regulated flow in the Murrumbidgee River
Period Gauges Period goodness-of-fit
IFFM IQQM
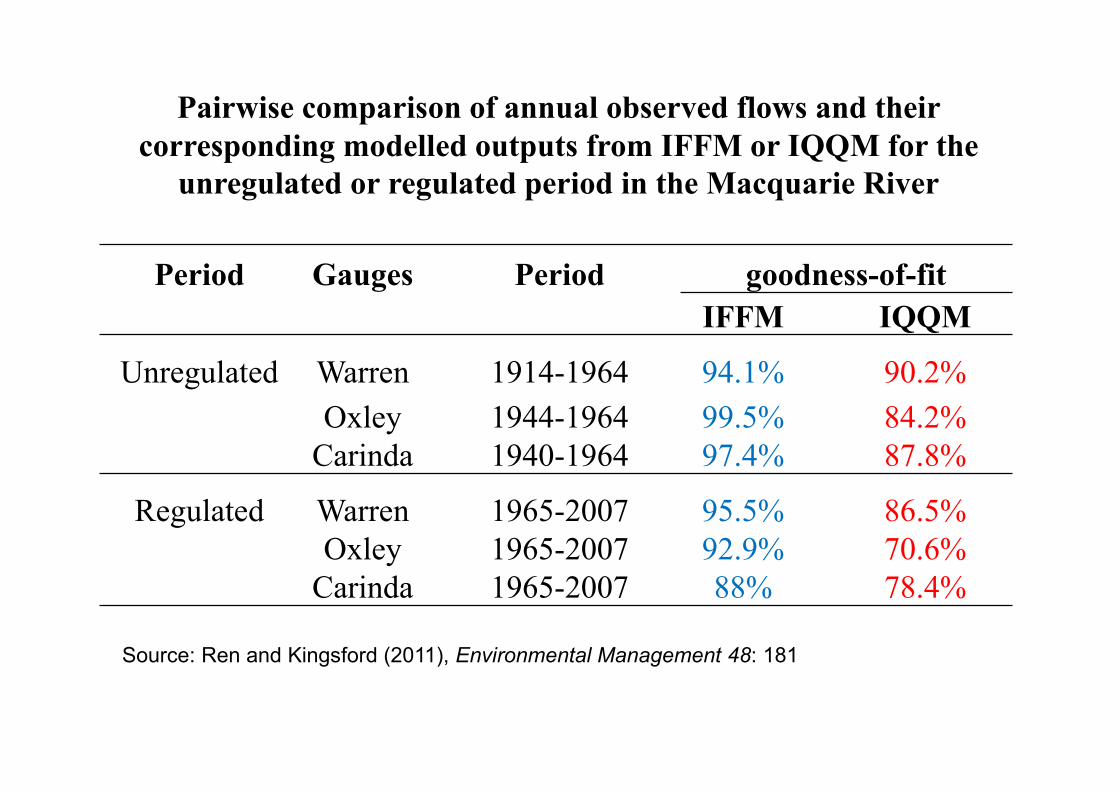
Unregulated Warren 1914-1964 94.1% 90.2%
Oxley 1944-1964 99.5% 84.2%Carinda 1940-1964 97.4% 87.8%
Regulated Warren 1965-2007 95.5% 86.5%Oxley 1965-2007 92.9% 70.6%
Carinda 1965-2007 88% 78.4%
Pairwise comparison of annual observed flows and their corresponding modelled outputs from IFFM or IQQM for the
unregulated or regulated period in the Macquarie River
Source: Ren and Kingsford (2011), Environmental Management 48: 181
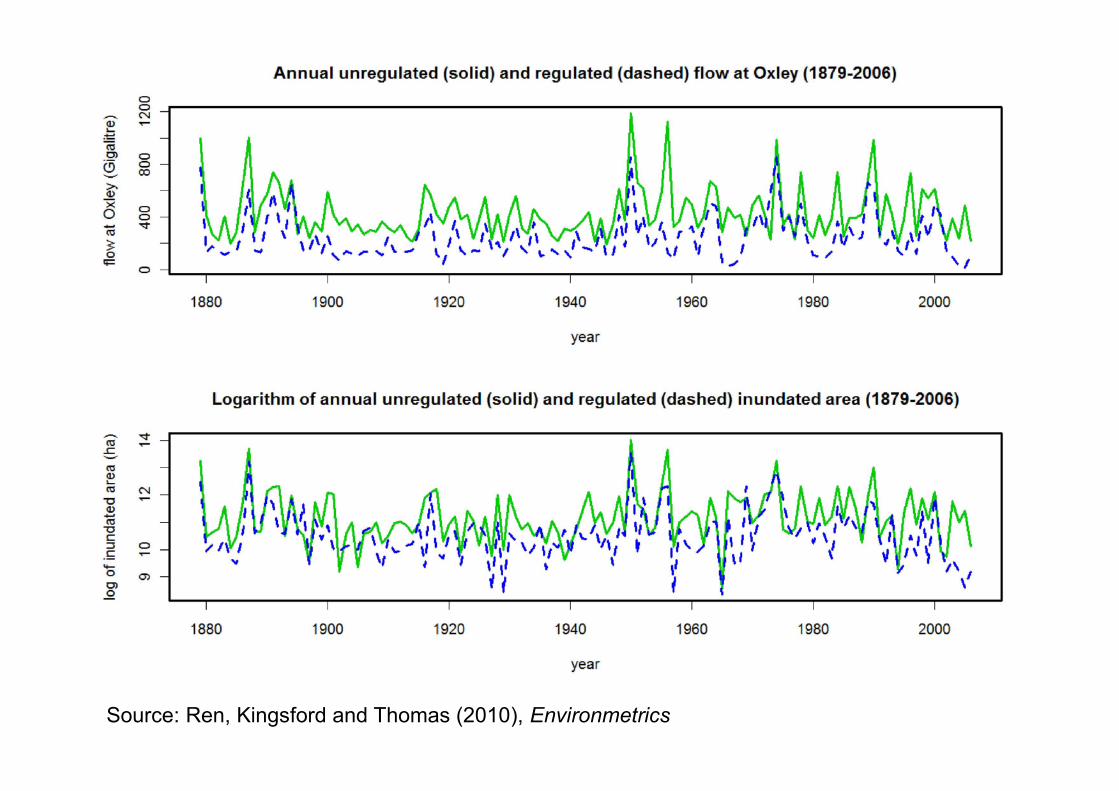
Source: Ren, Kingsford and Thomas (2010), Environmetrics
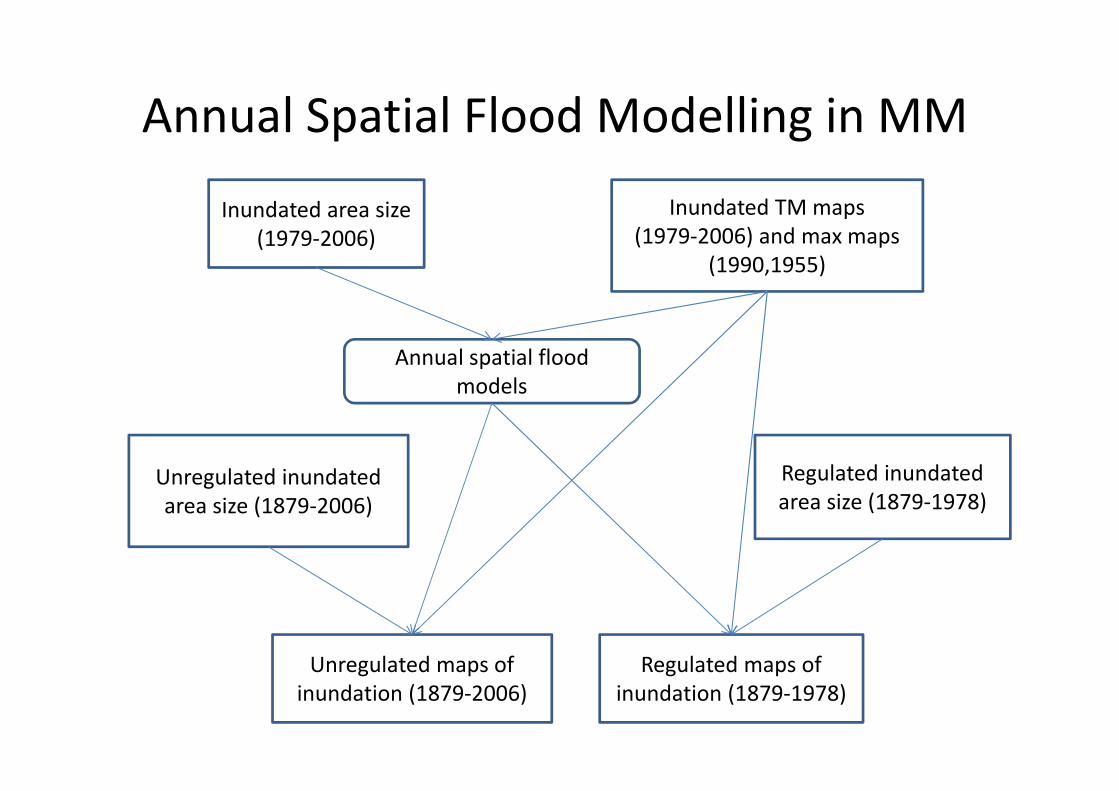
Annual Spatial Flood Modelling in MM
Annual spatial flood models
Inundated area size (1979-2006)
Inundated TM maps(1979-2006) and max maps
(1990,1955)
Unregulated inundated area size (1879-2006)
Unregulated maps of inundation (1879-2006)
Regulated maps of inundation (1879-1978)
Regulated inundated area size (1879-1978)
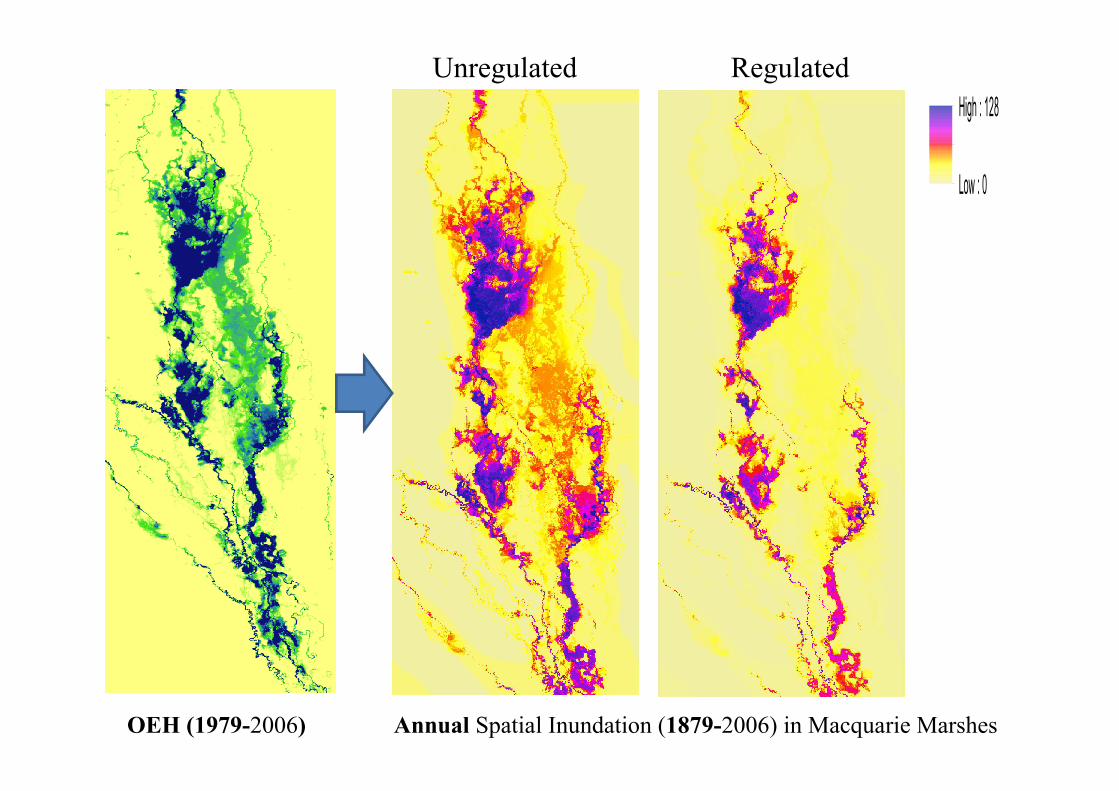
Unregulated Regulated
Annual Spatial Inundation (1879-2006) in Macquarie Marshes
High : 128
Low : 0
OEH (1979-2006)
Future Research
• Environmental Statistics• IFFM in the other river and wetlands, for
example, Gwydir River and Gwydir Floodplain, Lachlan River and the Great Cumbung Swamp
• Daily flow modelling in the Murray Darling Basin
• Monthly Water Planning at Burrendong Dam
• Extending IFFM to the other countries

Future Research
• Business Statistics• Daily modelling and forecasting in foreign
exchange and stock market
• Daily electricity forecasting
• Risk management
• Health Statistics• Health risks and services
• Health performance (weekly and monthly trend)
Future Research
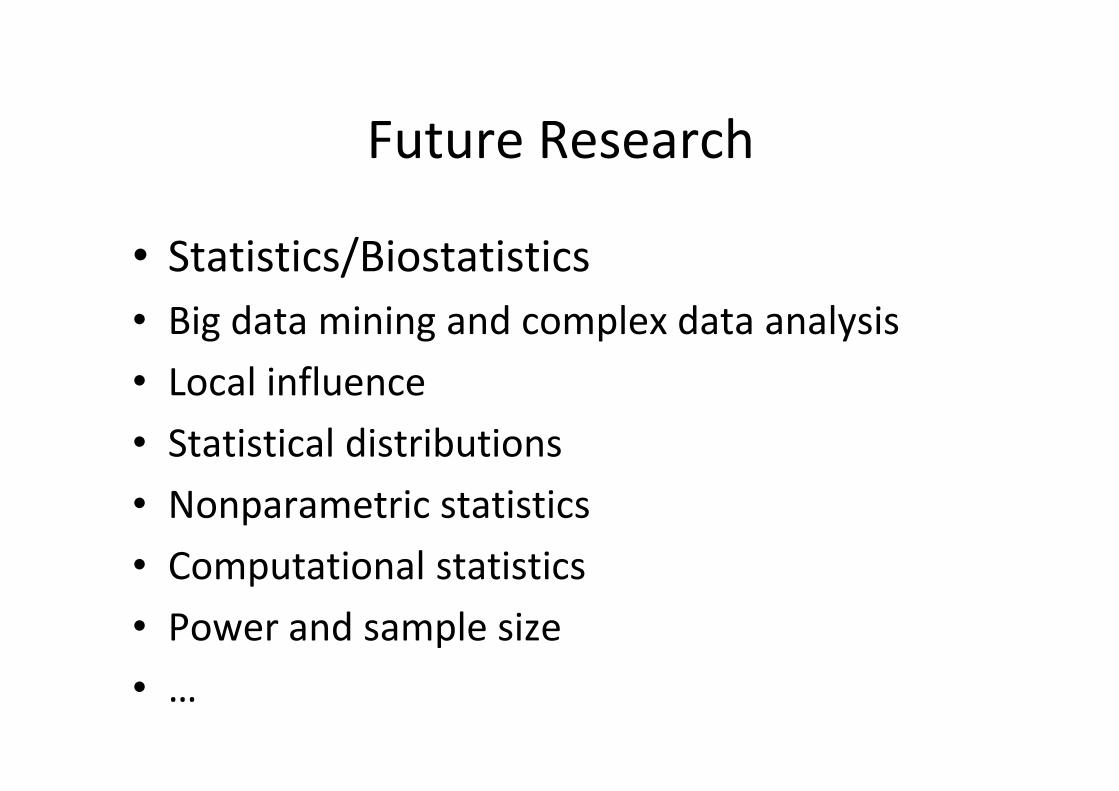
• Statistics/Biostatistics
• Big data mining and complex data analysis
• Local influence
• Statistical distributions
• Nonparametric statistics
• Computational statistics
• Power and sample size
• …
Conclusions
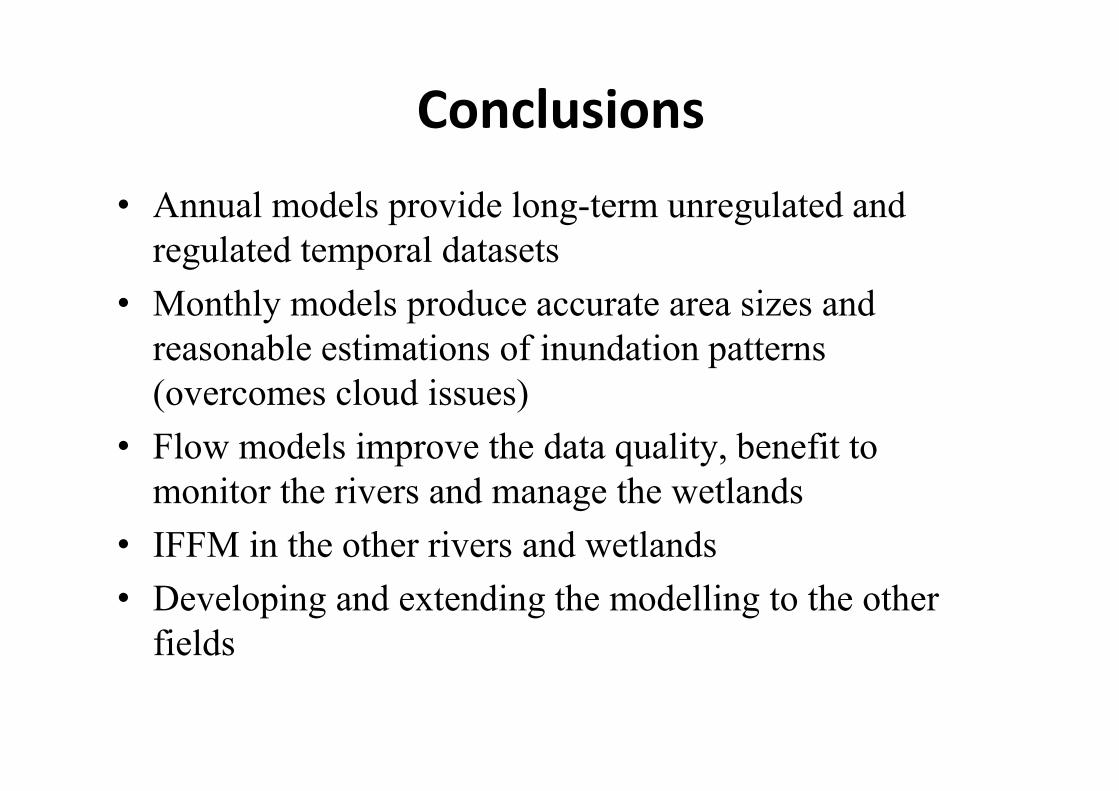
• Annual models provide long-term unregulated and regulated temporal datasets
• Monthly models produce accurate area sizes and reasonable estimations of inundation patterns (overcomes cloud issues)
• Flow models improve the data quality, benefit to monitor the rivers and manage the wetlands
• IFFM in the other rivers and wetlands
• Developing and extending the modelling to the other fields
Acknowledgements
• Richard Kingsford
• Land and Water Australia
• CSIRO
• NSW Office of Environment and Heritage
• NSW Office of Water
• Bureau of Meteorology
• NSW WaterInfo
• Geoscience Australia
• Guy Nason and Rachael Thomas


