IFF Q4 & FY 2018 Earnings Conference Call
25
INTERNATIONAL FLAVORS & FRAGRANCES IFF Q4 & FY 2018 Earnings Conference Call February 14, 2018
Transcript of IFF Q4 & FY 2018 Earnings Conference Call
INTERNATIONAL FLAVORS & FRAGRANCES
IFF Q4 & FY 2018Earnings ConferenceCall
February 14, 2018
Cautionary StatementThis presentation contains forward-looking statements within the meaning of Section 27A of the Securities Act of 1933, as amended, and Section 21E of the Securities Exchange Act of 1934, as amended. All statements regarding IFF’s expected future financial position, results of operations, cash flows, financing plans, business strategy, budgets, capital expenditures, competitive positions, growth opportunities, plans and objectives of management and statements containing the words such as “anticipate,” “approximate,” “believe,” “plan,” “estimate,” “expect,” “project,” “could,” “should,” “will,” “intend,” “may” and other similar expressions, are forward-looking statements. Statements in this presentation concerning IFF’s outlook for 2019 and beyond and future economic performance, anticipated profitability, revenues, expenses or other financial items, together with other statements that are not historical facts, are forward-looking statements that are estimates reflecting management’s best judgment based upon currently available information.
Factors that could cause IFF’s actual results to differ materially include, but are not limited to (1) risks related to the integration of the Frutarom business, including whether we will realize the benefits anticipated from the acquisition in the expected time frame; (2) unanticipated costs, liabilities, charges or expenses resulting from the Frutarom acquisition, (3) the increase in the Company’s leverage resulting from the additional debt incurred to pay a portion of the consideration for Frutarom and its impact on the Company’s liquidity and ability to return capital to its shareholders, (4) the Company’s ability to successfully market to its expanded and decentralized Taste and Frutarom customer base, (5) the Company’s ability to effectively compete in its market and develop and introduce new products that meet customers’ needs, (6) the Company’s ability to successfully develop innovative and cost-effective products that allow customers to achieve their own profitability expectations, (7) the impact of the disruption in the Company’s manufacturing operations, (8) the impact of a disruption in the Company’s supply chain, including the inability to obtain ingredients and raw materials from third parties, (9) volatility and increases in the price of raw materials, energy and transportation, (10) the Company’s ability to comply with, and the costs associated with compliance with, regulatory requirements and industry standards, including regarding product safety, quality, efficacy and environmental impact, (11) the impact of any failure or interruption of the Company’s key information technology systems or a breach of information security, (12) the Company’s ability to react in a timely and cost-effective manner to changes in consumer preferences and demands, (13) the Company’s ability to establish and manage collaborations, joint ventures or partnership that lead to development or commercialization of products, (14) the Company’s ability to benefit from its investments and expansion in emerging markets; (15) the impact of currency fluctuations or devaluations in the principal foreign markets in which it operates; (16) economic, regulatory and political risks associated with the Company’s international operations, (17) the impact of global economic uncertainty on demand for consumer products, (18) the inability to retain key personnel; (19) the Company’s ability to comply with, and the costs associated with compliance with, U.S. and foreign environmental protection laws, (20) the Company’s ability to realize the benefits of its cost and productivity initiatives, (21) the Company’s ability to successfully manage its working capital and inventory balances, (22) the impact of the failure to comply with U.S. or foreign anti-corruption and anti-bribery laws and regulations, including the U.S. Foreign Corrupt Practices Act, (23) the Company’s ability to protect its intellectual property rights, (24) the impact of the outcome of legal claims, regulatory investigations and litigation, (25) changes in market conditions or governmental regulations relating to our pension and postretirement obligations, (26) the impact of future impairment of our tangible or intangible long-lived assets, (27) the impact of changes in federal, state, local and international tax legislation or policies, including the recently enacted Tax Cuts and Jobs Act, with respect to transfer pricing and state aid, and adverse results of tax audits, assessments, or disputes, (28) the effect of potential government regulation on certain product development initiatives, and restrictions or costs that may be imposed on the Company or its operations as a result, and (29) the impact of the United Kingdom’s expected departure from the European Union in 2019. New risks emerge from time to time and it is not possible for management to predict all such risk factors or to assess the impact of such risks on the IFF’s business. Accordingly, IFF undertakes no obligation to publicly revise any forward-looking statements, whether as a result of new information, future events, or otherwise.
In addition to the factors set forth above, other factors that may affect IFF’s plans, results or stock price are set forth in IFF’s Annual Report on Form 10-K, Quarterly Reports on Form 10-Q and Current Reports on Form 8-K. Many of these factors are beyond IFF’s control and IFF cautions investors that any forward-looking statements made by IFF are not guarantees of future performance. IFF disclaims any obligation to update any such factors or to announce publicly the results of any revisions to any of the forward-looking statements to reflect future events or developments.
2
Cautionary StatementUse of Non-GAAP Financial MeasuresWe provide in this press release non-GAAP financial measures, including: (i) currency neutral sales, which eliminates the effects that result from translating its international sales in U.S. dollars; (ii) adjusted operating profit and adjusted EPS, which exclude restructuring costs and other significant items of a non-recurring and/or non-operational nature such as legal charges/credits, gains on sale of assets, tax assessment, operational improvement initiatives, integration related costs, FDA mandated product recall costs, acquisition related costs, CTA realization, Frutarom acquisition related costs, U.S. Tax reform (often referred to as “Items Impacting Comparability); (iii) adjusted EPS ex amortization, which excludes Items Impacting Comparability and the amortization of acquisition related intangible assets; and (iv) currency neutral adjusted EPS ex amortization, which eliminates the effects that result from translating its international sales in U.S. dollars on adjusted EPS ex amortization.
These non-GAAP measures are intended to provide additional information regarding our underlying operating results and comparable year-over-year performance. Such information is supplemental to information presented in accordance with GAAP and is not intended to represent a presentation in accordance with GAAP. In discussing our historical and expected future results and financial condition, we believe it is meaningful for investors to be made aware of and to be assisted in a better understanding of, on a period-to-period comparable basis, financial amounts both including and excluding these identified items, as well as the impact of exchange rate fluctuations. These non-GAAP measures should not be considered in isolation or as substitutes for analysis of the Company’s results under GAAP and may not be comparable to other companies’ calculation of such metrics.
When we provide our expectations for adjusted EPS and adjusted EPS ex amortization for our full year 2019 guidance and our expectations for currency neutral sales and currency neutral adjusted EPS ex amortization for our long-term combined guidance for 2019-2021, the closest corresponding GAAP measure and a reconciliation of the differences between the non-GAAP expectation and the corresponding GAAP measure is not available without unreasonable effort due to length of the forecasted period and potential variability, complexity and low visibility as to items such as future contingencies and other costs that would be excluded from the GAAP measure, and the tax impact of such items, in the relevant future period. The variability of the excluded items may have a significant, and potentially unpredictable, impact on our future GAAP results.
CombinedFor purposes of this presentation, we calculated “combined” numbers by combining (i) our results (including Frutarom from October 4, 2018 through December 31, 2018) with (ii) the results of Frutarom prior to itsacquisition by us on October 4, 2018, and adjusting for divestitures of Frutarom businesses since October 4, 2018, but do not include any other adjustments that would have been made had we owned Frutarom for such periods prior to October 4, 2018.
3

Conference Call Participants
Andreas FibigChairman & CEO
Rich O’LearyEVP & CFO 4
1. Executive Summary
2. Financial Review
3. Integration Priorities
4. Outlook
5. Q&A
Agenda
5
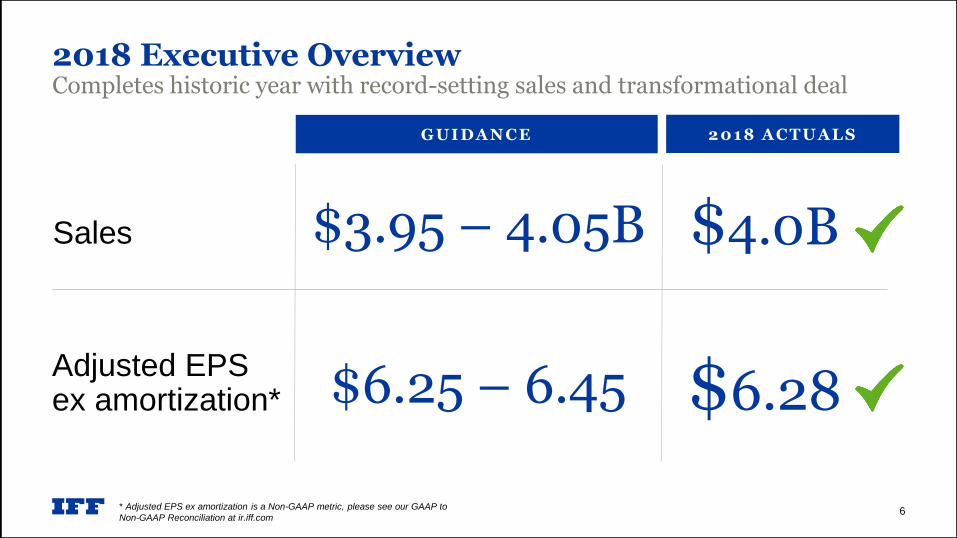
2018 Executive OverviewCompletes historic year with record-setting sales and transformational deal
$6.28Adjusted EPS ex amortization*
$4.0BSales
* Adjusted EPS ex amortization is a Non-GAAP metric, please see our GAAP to
Non-GAAP Reconciliation at ir.iff.com6
G UI DA N CE 2 0 1 8 A C TUA L S
$3.95 – 4.05B
$6.25 – 6.45
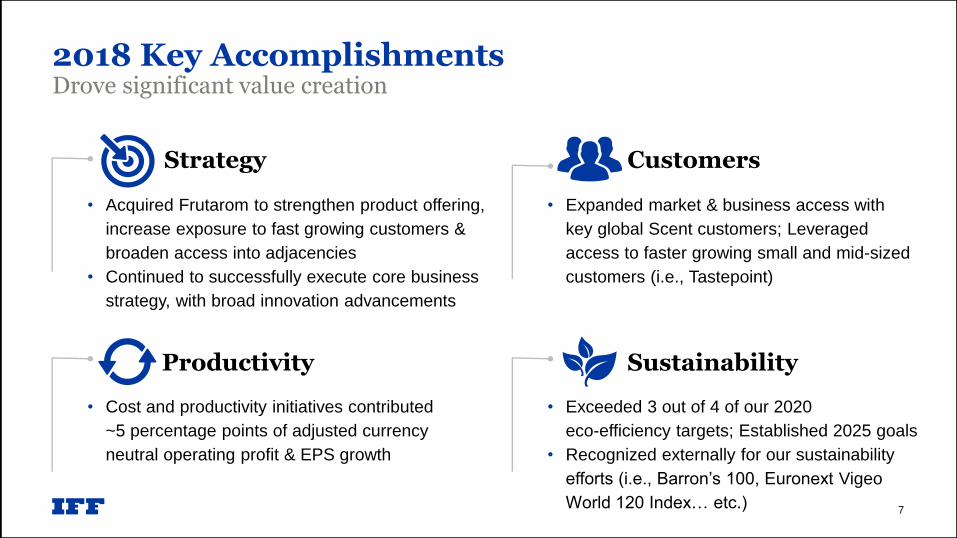
2018 Key AccomplishmentsDrove significant value creation
• Acquired Frutarom to strengthen product offering,
increase exposure to fast growing customers &
broaden access into adjacencies
• Continued to successfully execute core business
strategy, with broad innovation advancements
Strategy Customers
• Expanded market & business access with
key global Scent customers; Leveraged
access to faster growing small and mid-sized
customers (i.e., Tastepoint)
Productivity
• Cost and productivity initiatives contributed
~5 percentage points of adjusted currency
neutral operating profit & EPS growth
Sustainability
• Exceeded 3 out of 4 of our 2020
eco-efficiency targets; Established 2025 goals
• Recognized externally for our sustainability
efforts (i.e., Barron’s 100, Euronext Vigeo
World 120 Index… etc.)7
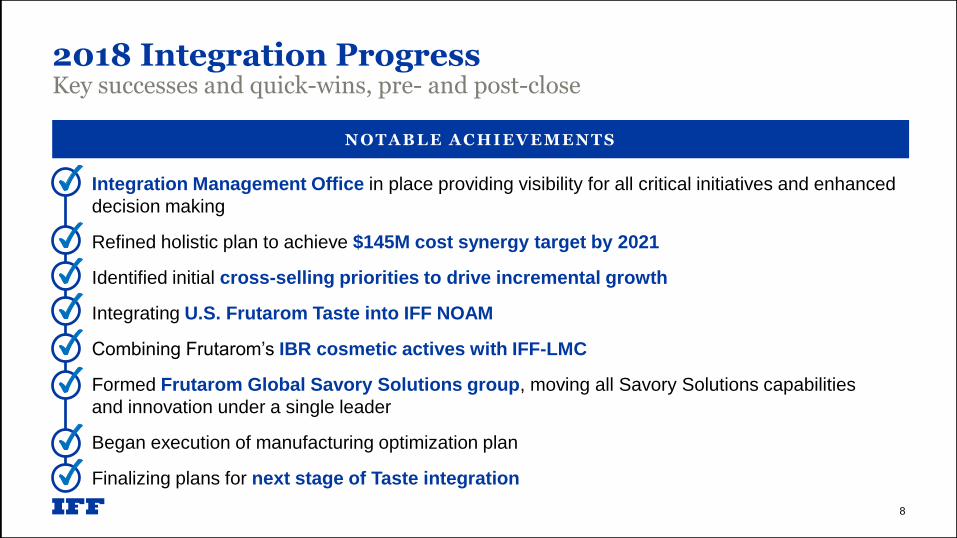
• Integration Management Office in place providing visibility for all critical initiatives and enhanced
decision making
• Refined holistic plan to achieve $145M cost synergy target by 2021
• Identified initial cross-selling priorities to drive incremental growth
• Integrating U.S. Frutarom Taste into IFF NOAM
• Combining Frutarom’s IBR cosmetic actives with IFF-LMC
• Formed Frutarom Global Savory Solutions group, moving all Savory Solutions capabilities
and innovation under a single leader
• Began execution of manufacturing optimization plan
• Finalizing plans for next stage of Taste integration
2018 Integration ProgressKey successes and quick-wins, pre- and post-close
N O TA B L E A C HI E VE ME N TS
8
1. Executive Summary
2. Financial Review
3. Integration Priorities
4. Outlook
5. Q&A
Agenda
9
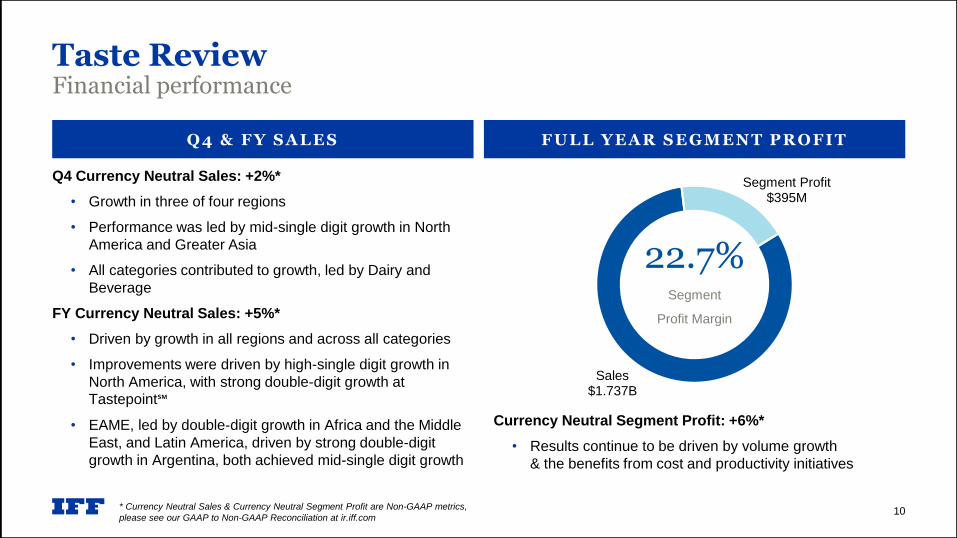
Q4 Currency Neutral Sales: +2%*
• Growth in three of four regions
• Performance was led by mid-single digit growth in North
America and Greater Asia
• All categories contributed to growth, led by Dairy and
Beverage
FY Currency Neutral Sales: +5%*
• Driven by growth in all regions and across all categories
• Improvements were driven by high-single digit growth in
North America, with strong double-digit growth at
Tastepoint℠
• EAME, led by double-digit growth in Africa and the Middle
East, and Latin America, driven by strong double-digit
growth in Argentina, both achieved mid-single digit growth
Taste ReviewFinancial performance
* Currency Neutral Sales & Currency Neutral Segment Profit are Non-GAAP metrics,
please see our GAAP to Non-GAAP Reconciliation at ir.iff.com10
Q 4 & F Y S A L E S F UL L YE A R S E G ME N T P R O F I T
Sales$1.737B
Segment Profit$395M
22.7%Segment
Profit Margin
Currency Neutral Segment Profit: +6%*
• Results continue to be driven by volume growth
& the benefits from cost and productivity initiatives

Q4 Currency Neutral Sales: +3%*
• Performance driven by mid-single digit improvement in
Fragrance Ingredients and low-single digit growth in
Consumer Fragrances
• Fine Fragrance challenged by a strong double-digit year-
ago comparison
FY Currency Neutral Sales: +4%*
• Strongest improvement in Fragrance Ingredients, which
grew high-single digits, led by price increases and strong
double-digit growth in Cosmetic Active Ingredients
• Consumer Fragrances grew mid-single digits, including
price, as performance was driven by double-digit growth in
Hair Care and mid-single digit growth in Fabric Care, Home
Care and Toiletries
Scent ReviewFinancial performance
Sales$1.881B
Segment Profit$330M
17.5%Segment
Profit Margin
* Currency Neutral Sales & Currency Neutral Segment Profit are Non-GAAP metrics,
please see our GAAP to Non-GAAP Reconciliation at ir.iff.com11
Q 4 & F Y S A L E S F UL L YE A R S E G ME N T P R O F I T
Currency Neutral Segment Profit: (2)%*
• Benefits from cost and productivity initiatives were more
than offset by unfavorable price to input costs, reflecting
unprecedented raw material inflation as well as higher
manufacturing costs
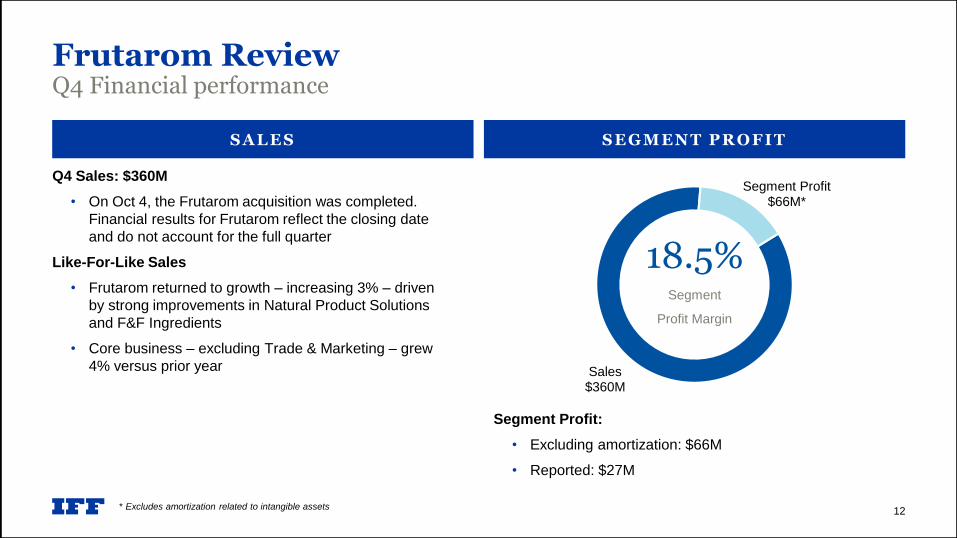
Q4 Sales: $360M
• On Oct 4, the Frutarom acquisition was completed.
Financial results for Frutarom reflect the closing date
and do not account for the full quarter
Like-For-Like Sales
• Frutarom returned to growth – increasing 3% – driven
by strong improvements in Natural Product Solutions
and F&F Ingredients
• Core business – excluding Trade & Marketing – grew
4% versus prior year
Frutarom ReviewQ4 Financial performance
Sales$360M
Segment Profit$66M*
18.5%Segment
Profit Margin
12
S A L E S S E G MEN T P R O F I T
Segment Profit:
• Excluding amortization: $66M
• Reported: $27M
* Excludes amortization related to intangible assets
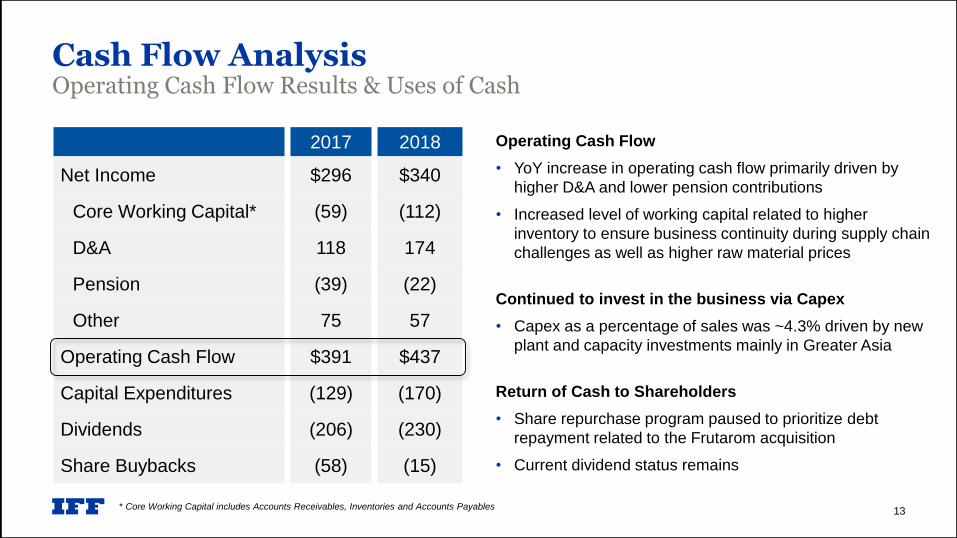
Operating Cash Flow
• YoY increase in operating cash flow primarily driven by
higher D&A and lower pension contributions
• Increased level of working capital related to higher
inventory to ensure business continuity during supply chain
challenges as well as higher raw material prices
Continued to invest in the business via Capex
• Capex as a percentage of sales was ~4.3% driven by new
plant and capacity investments mainly in Greater Asia
Return of Cash to Shareholders
• Share repurchase program paused to prioritize debt
repayment related to the Frutarom acquisition
• Current dividend status remains
2017 2018
Net Income $296 $340
Core Working Capital* (59) (112)
D&A 118 174
Pension (39) (22)
Other 75 57
Operating Cash Flow $391 $437
Capital Expenditures (129) (170)
Dividends (206) (230)
Share Buybacks (58) (15)
Cash Flow AnalysisOperating Cash Flow Results & Uses of Cash
* Core Working Capital includes Accounts Receivables, Inventories and Accounts Payables 13
1. Executive Summary
2. Financial Review
3. Integration Priorities
4. Outlook
5. Q&A
Agenda
14
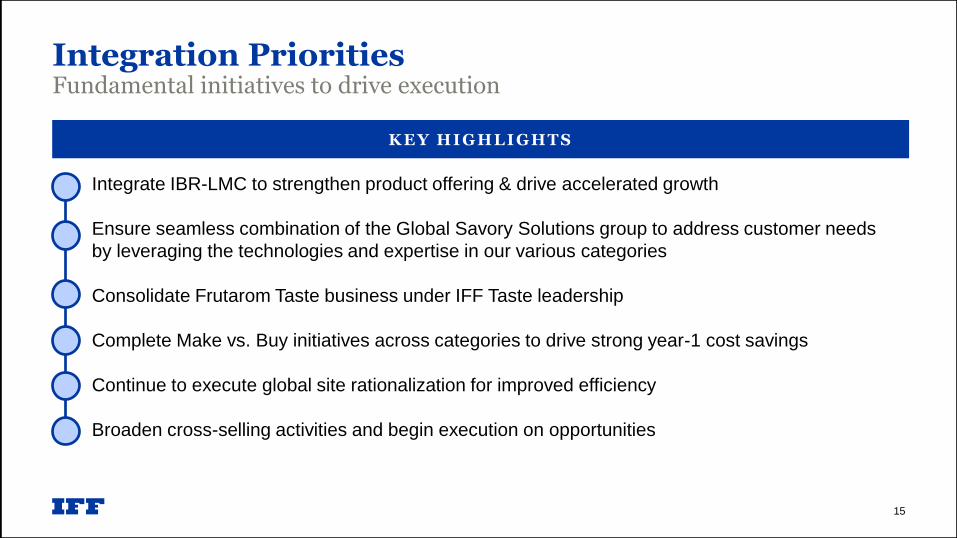
Integration PrioritiesFundamental initiatives to drive execution
K E Y HI G HL I GHTS
15
• Integrate IBR-LMC to strengthen product offering & drive accelerated growth
• Ensure seamless combination of the Global Savory Solutions group to address customer needs
by leveraging the technologies and expertise in our various categories
• Consolidate Frutarom Taste business under IFF Taste leadership
• Complete Make vs. Buy initiatives across categories to drive strong year-1 cost savings
• Continue to execute global site rationalization for improved efficiency
• Broaden cross-selling activities and begin execution on opportunities
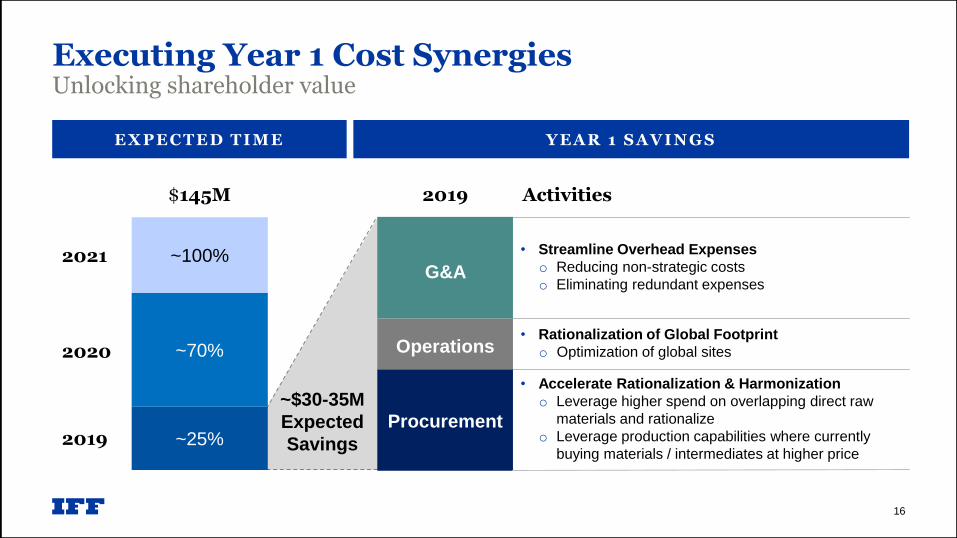
Executing Year 1 Cost SynergiesUnlocking shareholder value
E X P E C TE D TI ME YE A R 1 S A VI N G S
$145M
2019
2020
2021
16
~25%
~70%
~100%
Procurement
Operations
G&A
• Accelerate Rationalization & Harmonization
o Leverage higher spend on overlapping direct raw
materials and rationalize
o Leverage production capabilities where currently
buying materials / intermediates at higher price
• Rationalization of Global Footprint
o Optimization of global sites
• Streamline Overhead Expenses
o Reducing non-strategic costs
o Eliminating redundant expenses
2019 Activities
~$30-35M
Expected
Savings
1. Executive Summary
2. Financial Review
3. Integration Priorities
4. Outlook
5. Q&A
Agenda
17
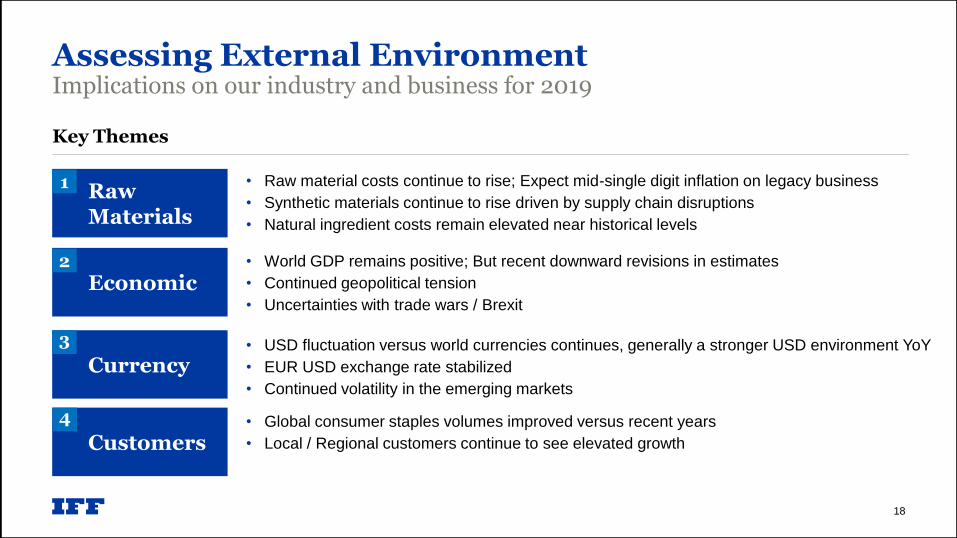
• Raw material costs continue to rise; Expect mid-single digit inflation on legacy business
• Synthetic materials continue to rise driven by supply chain disruptions
• Natural ingredient costs remain elevated near historical levels
Assessing External EnvironmentImplications on our industry and business for 2019
Raw Materials
1
Economic 2
Currency
3
Key Themes
18
• World GDP remains positive; But recent downward revisions in estimates
• Continued geopolitical tension
• Uncertainties with trade wars / Brexit
• USD fluctuation versus world currencies continues, generally a stronger USD environment YoY
• EUR USD exchange rate stabilized
• Continued volatility in the emerging markets
Customers
4 • Global consumer staples volumes improved versus recent years
• Local / Regional customers continue to see elevated growth
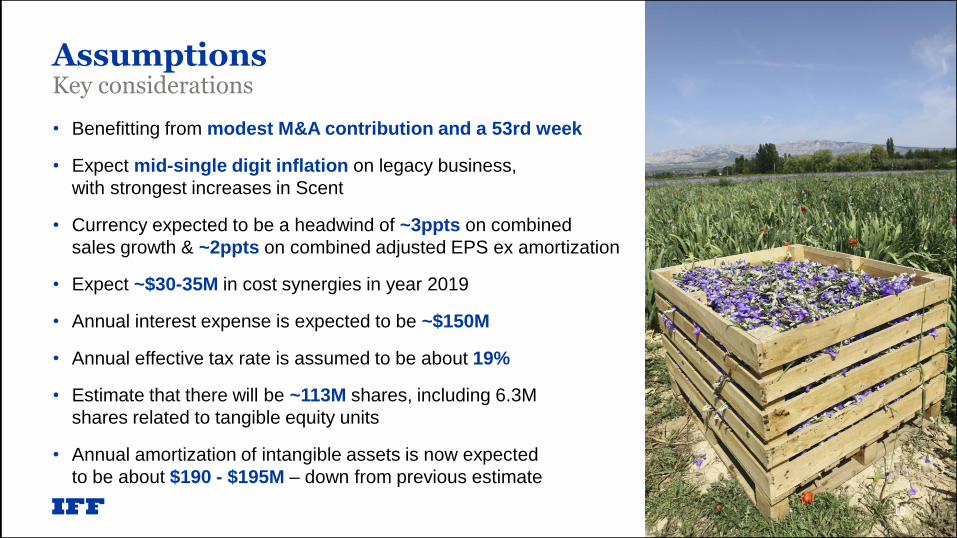
AssumptionsKey considerations
19
• Benefitting from modest M&A contribution and a 53rd week
• Expect mid-single digit inflation on legacy business,
with strongest increases in Scent
• Currency expected to be a headwind of ~3ppts on combined
sales growth & ~2ppts on combined adjusted EPS ex amortization
• Expect ~$30-35M in cost synergies in year 2019
• Annual interest expense is expected to be ~$150M
• Annual effective tax rate is assumed to be about 19%
• Estimate that there will be ~113M shares, including 6.3M
shares related to tangible equity units
• Annual amortization of intangible assets is now expected
to be about $190 - $195M – down from previous estimate
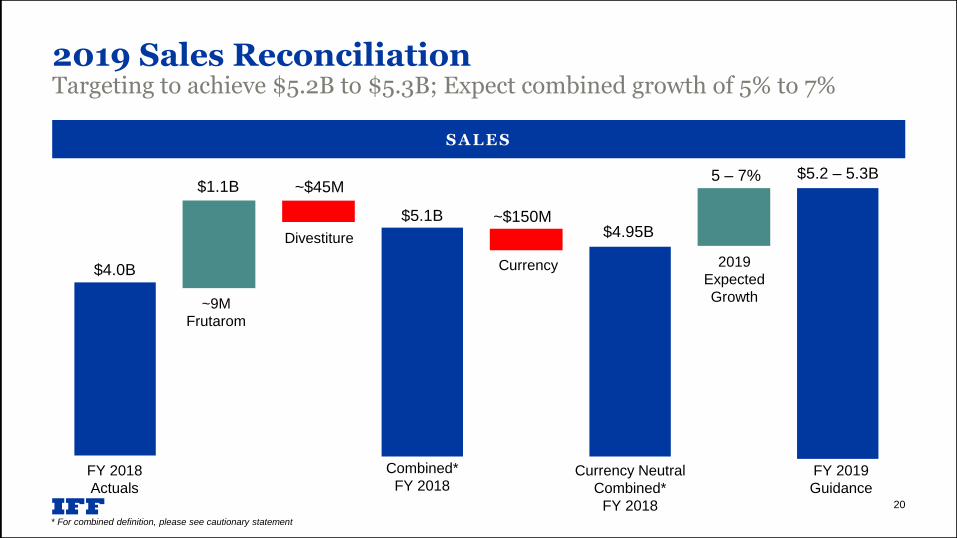
$1.1B
~9M
Frutarom
FY 2018
Actuals
$4.0B
Combined*
FY 2018
$5.1B
Currency
Neutral
Adjusted
EPS*
5 – 7%
2019
Expected
Growth
Currency Neutral
Combined*
FY 2018
$4.95B
~$45M
Divestiture
~$150M
Currency
$5.2 – 5.3B
FY 2019
Guidance
2019 Sales ReconciliationTargeting to achieve $5.2B to $5.3B; Expect combined growth of 5% to 7%
20
S A L E S
* For combined definition, please see cautionary statement
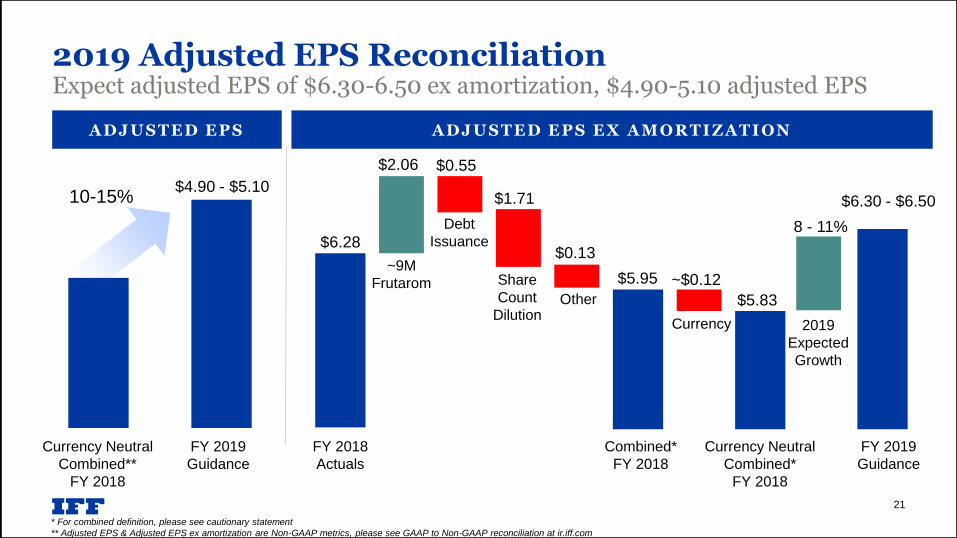
2019 Adjusted EPS ReconciliationExpect adjusted EPS of $6.30-6.50 ex amortization, $4.90-5.10 adjusted EPS
* For combined definition, please see cautionary statement
** Adjusted EPS & Adjusted EPS ex amortization are Non-GAAP metrics, please see GAAP to Non-GAAP reconciliation at ir.iff.com
A DJ US TE D E P S E X A MO R TI Z A TI ON
FY 2018
Actuals
$2.06
~9M
Frutarom
$6.28
$0.55
Debt
Issuance
Share
Count
Dilution
$1.71
$5.95 ~$0.12
Currency
$5.83
8 - 11%
$6.30 - $6.50
Combined*
FY 2018
Currency Neutral
Combined*
FY 2018
2019
Expected
Growth
FY 2019
Guidance
A DJ US TE D E P S
Currency Neutral
Combined**
FY 2018
FY 2019
Guidance
$4.90 - $5.1010-15%
$0.13
Other
21
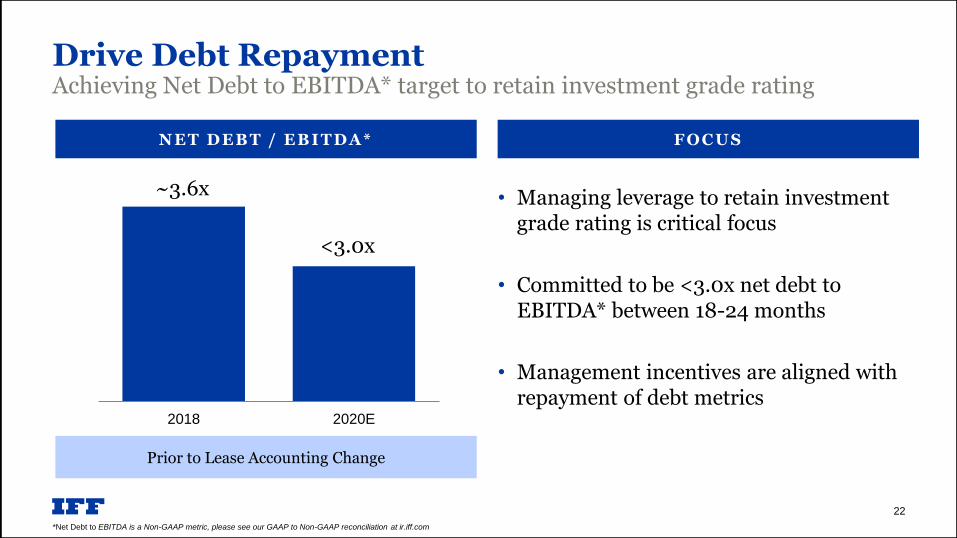
~3.6x
2018 2020E
Drive Debt RepaymentAchieving Net Debt to EBITDA* target to retain investment grade rating
F O C USN E T DE B T / E B I TDA *
• Managing leverage to retain investment grade rating is critical focus
• Committed to be <3.0x net debt to EBITDA* between 18-24 months
• Management incentives are aligned with repayment of debt metrics
22
*Net Debt to EBITDA is a Non-GAAP metric, please see our GAAP to Non-GAAP reconciliation at ir.iff.com
Prior to Lease Accounting Change
<3.0x
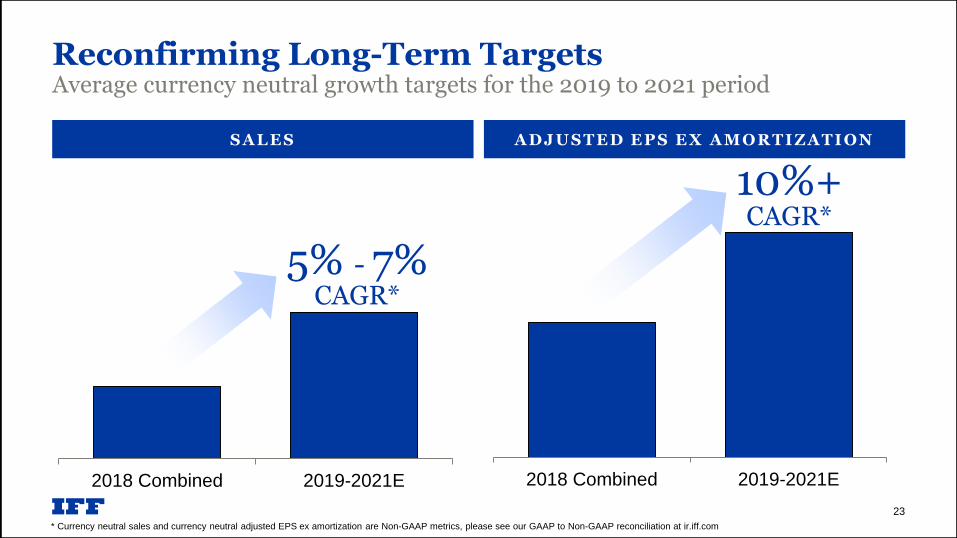
2018 Combined 2019-2021E2018 Combined 2019-2021E
Reconfirming Long-Term TargetsAverage currency neutral growth targets for the 2019 to 2021 period
23
S A L E S A DJ US TE D E P S E X A MO R TI Z A TI ON
5% - 7%CAGR*
10%+ CAGR*
* Currency neutral sales and currency neutral adjusted EPS ex amortization are Non-GAAP metrics, please see our GAAP to Non-GAAP reconciliation at ir.iff.com
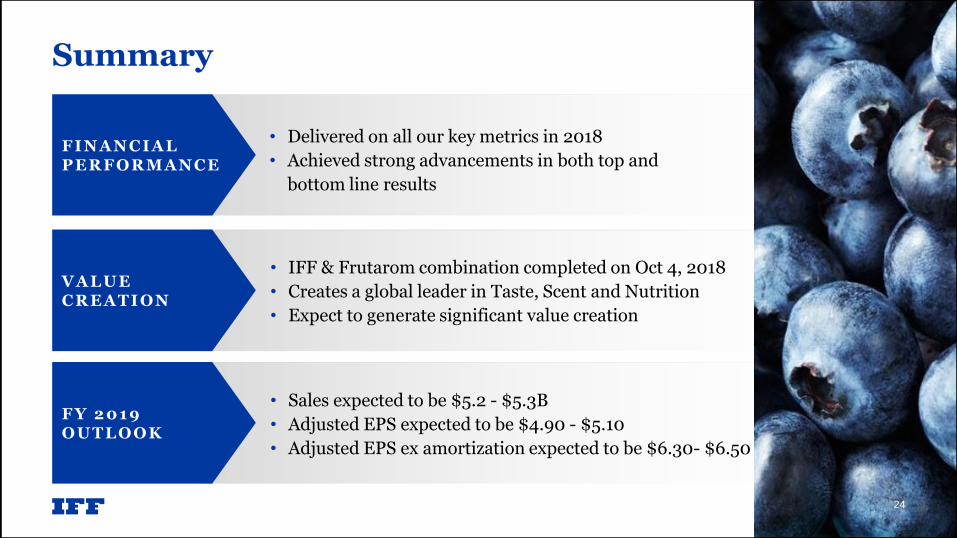
F I N A N C IA L P E R F O R MAN CE
• Delivered on all our key metrics in 2018
• Achieved strong advancements in both top and
bottom line results
VA L UE C R E A TI O N
• IFF & Frutarom combination completed on Oct 4, 2018
• Creates a global leader in Taste, Scent and Nutrition
• Expect to generate significant value creation
Summary
24
F Y 2 0 1 9 O UTL O O K
• Sales expected to be $5.2 - $5.3B
• Adjusted EPS expected to be $4.90 - $5.10
• Adjusted EPS ex amortization expected to be $6.30- $6.50
24

INTERNATIONAL FLAVORS & FRAGRANCES
Q&A