IFEA 25Jan12 SusaD RUN TEST The heat run test, i.e. temperature rise test, is the type test carried...
28
SINTEF Energy Research Dejan Susa on behalf of SINTEF Electric Power Technology Department [email protected] 1 POWER TRANSFORMERS
Transcript of IFEA 25Jan12 SusaD RUN TEST The heat run test, i.e. temperature rise test, is the type test carried...

SINTEF Energy Research
Dejan Susa on behalf of SINTEF Electric Power Technology Department
1
POWER TRANSFORMERS

SINTEF Energy Research
Transformer design • Insulation– Liquid, Air
– Solid
• Stresses– Thermal
– Dielectric
– Mechanical
2
Electrical Breakdown

SINTEF Energy Research
Insulation Degradation: Remaining lifetime
3
TRE
ENDNOWA
eADPDP
emainingLifRe
11
SINTEF Energy Research 4
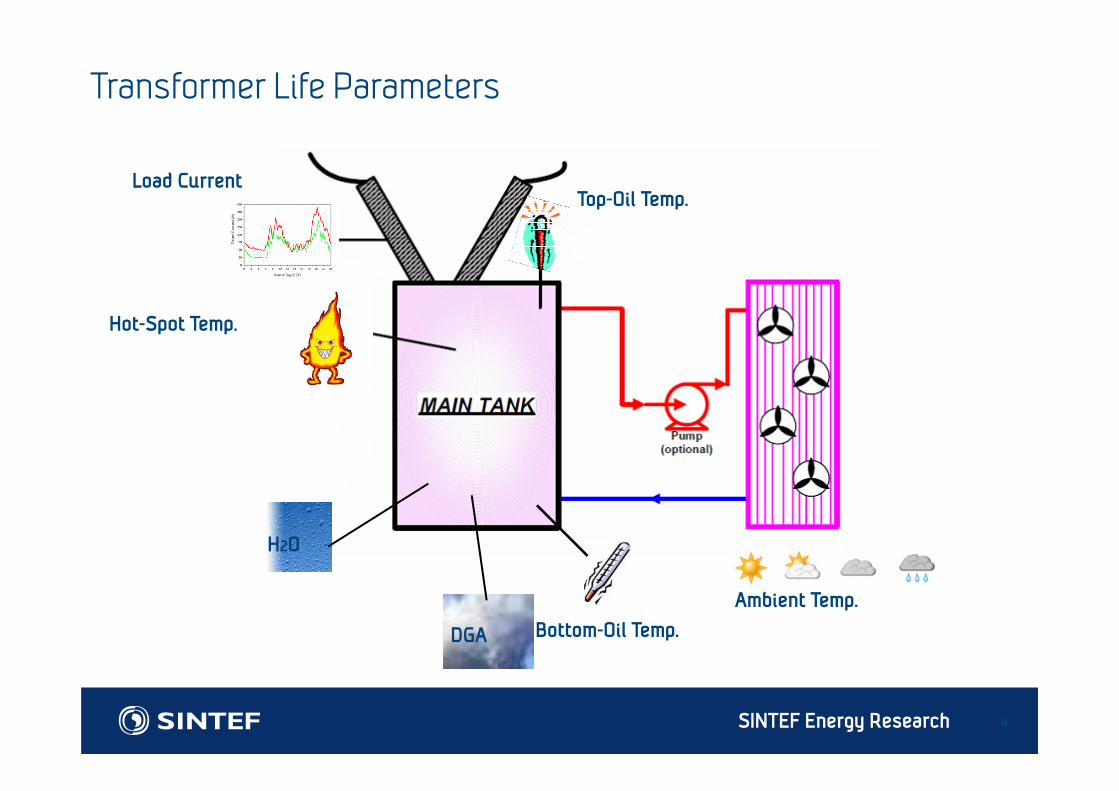
Transformer Life Parameters
H2O
DGA
Top-Oil Temp.Load Current
Hot-Spot Temp.
Bottom-Oil Temp.
Ambient Temp.

SINTEF Energy Research 5
Characteristic Temperatures
Cool
er
Core
LV w
indi
ng
HV
win
ding
H x gr
gr
Bottom Oil-Winding
Ambient
Top Oil-Winding
Average Winding
Top Oil Tank
Average Oil
Temperature rise
Rela
tive
Pos
ition
Hot-Spot

SINTEF Energy Research
Temperature limits are based on expected lifetime
6
IEC 60076-2: Temperature rises
Requirements forTemperature rise limits
K
Top liquid 60Average winding (by winding resistance variation):
65
70
– ON.. and OF.. cooling methods – OD.. cooling method
Hot-spot winding 78
Ambient temperatures
°C
Correction of temperature
rise
K *yearly average
monthly average
maximum
20 30 40 025 35 45 –530 40 50 –1035 45 55 –15
* Referred to the values given in Table 1.

SINTEF Energy Research
HEAT RUN TEST The heat run test, i.e. temperature rise test, is the type test carried out to verify the
guaranteed temperature rises for oil and windings
It is also used to reveal the possible overheated locations inside and outside windings due to high stray fields for the high powers
In addition, as indicated above, the temperature rises obtained during a heat-run test are used for estimating transformer loading capability by application of the relevant thermal models
During a heat run test the following temperatures could be directly measured: Ambient temperature Top-oil temperature Bottom-oil temperature Hot-spot temperature, hottest winding temperature (if fiber optic sensors are installed)
There are two methods used for performing the heat run test: short circuit back-to-back
7

SINTEF Energy Research 8
Hot-Spot Temperature Direct Measurements

SINTEF Energy Research 9
Transient state: Hot-spot and Top-oil Temperatures
9
Hot-spot to top-oil gradient
Top-oil rise over ambient
Ambient Temperature
= H • gr ·Ky • fhs-oil(t)
=(Top-oil rise)r •[(1+R·K2)/(1+R)]x • foil(t)
Ambient Temperature
Top-
oil t
emp.
Hot
-spo
t te
mpe
ratu
re
f1(t)
oil TIME TIME
f2(t)
k21
foil(t)=f1(t)=(1-e-t/(k11·o,r)) fhs-oil(t)=f2(t)=k21[1-e-t/(k22w,r)]-(k21-1) [1-e-t/(o/k22)]

SINTEF Energy Research10
Recommended thermal characteristics for exponential equations

SINTEF Energy Research 11
0
10
20
30
40
50
60
70
80
90
100
0 100 200 300Time, min
Tem
pera
ture
, deg
C
Hot-Spot Temperature:400 MVA ONAF UNIT/120 kV WDG
IEC 76-7: New and Active Guide Measured
IEC 354: OLD GUIDE

SINTEF Energy Research 12
IEC 60076-7 versus IEC 354
1. Oil pocket
2. CT
3. Heating element
4. Matching Resistance
1
2
3
4TIME
-IEC 76-7
oil
oil
oil,ss
1
TIME
3,4
TIME
-IEC 354

SINTEF Energy Research 13
Oil Viscosity Effect on Power Transformer Thermal Performance: New Oils
TIME
-IEC 76-7

SINTEF Energy Research 14
Transformer Oils:Mineral Oil- Natural Ester – Synthetic Ester
• Viscosity-temperaturerelationship is not strictlyArrhenius type

SINTEF Energy Research
Transformer Oils
15
Ester
SINTEF Energy Research 16
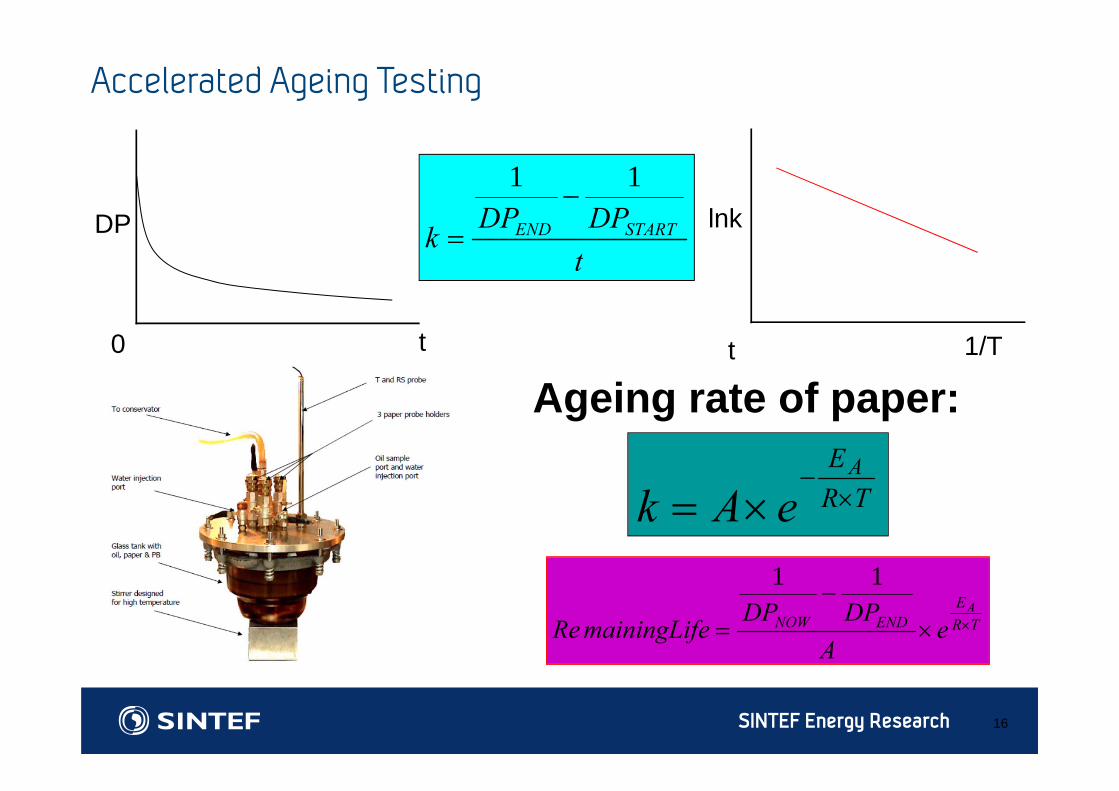
Accelerated Ageing Testing
lnk
1/T
tDPDP
k STARTEND
11
t
DP
0 t
Ageing rate of paper:
TREA
eAk
TRE
ENDNOWA
eADPDP
emainingLifRe
11

SINTEF Energy Research 17
A and E Parameters

SINTEF Energy Research 18
Moisture in Paper• Equilibrium Charts

SINTEF Energy Research 19
Pictures – Paper Sampler Rig

SINTEF Energy Research 20
Paper Sampler Rig - schematic
SINTEF Energy Research 21
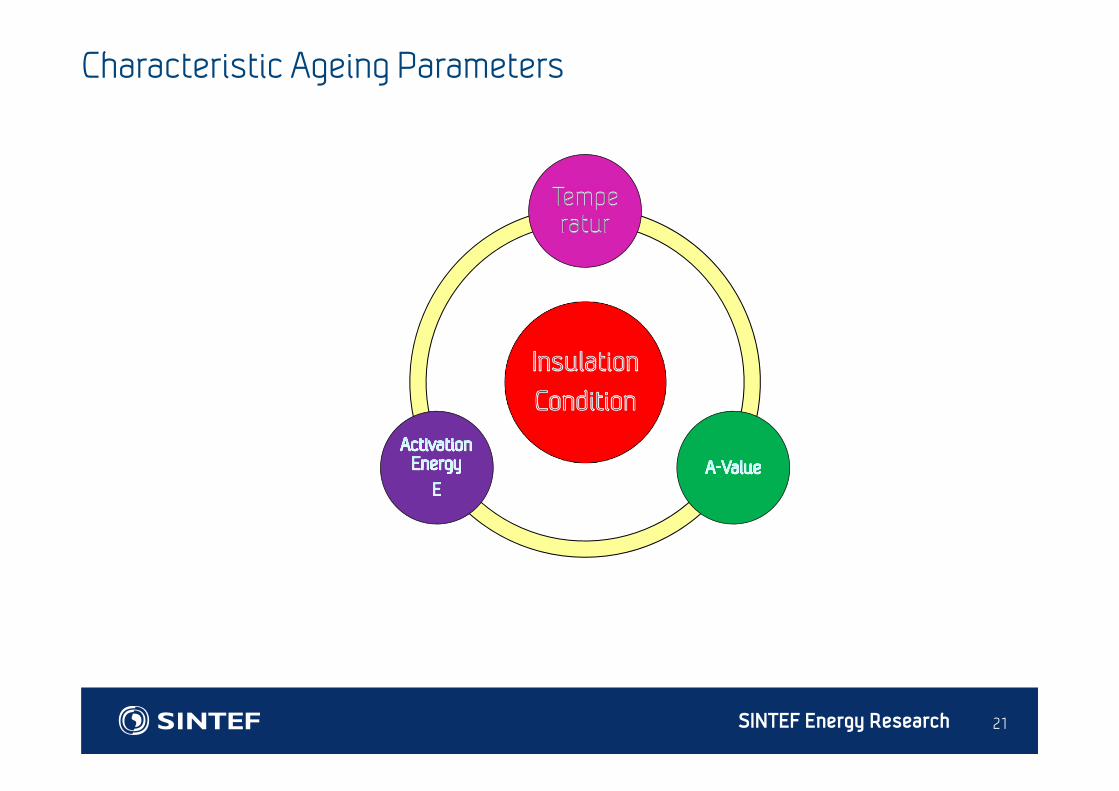
Characteristic Ageing Parameters

SINTEF Energy Research 22
Application
Load History Temperature
A:Contamination Moisture, LMA
Age EA:Process Material
New Now End
Year 2011 ?
1000 ? 200DP scale
Age scale
Condition scale
Load Forecast Temperature
A:Contamination Forecast Moisture, LMA
EA:Process Forecast Material
TRE
ENDNOWA
eADPDPemainingLifRe
1111
START
TRE
NOW DPteADP
A

SINTEF Energy Research 23
Example:Eidsiva Anlegg AS; Gjøvik T1
• Top-Oil Temperature=40 degC• Moisture in Paper=1.5% (Equilibrium Curves)• Production Year: 1986• DPSTART=1000• DPEND=200
TRE
ENDNOWA
eADPDP
emainingLifRe
11
11
START
TRE
NOW DPteADP
A

SINTEF Energy Research 24
Example: Loss of Life (IEC 60076-7) Relative Aging Rate due to Hot-Spot Temperature (V):
Non-thermally Upgraded Paper
Thermally Upgraded Paper
The relative ageing rate V = 1,0 corresponds to a temperature of 98 °C for non-thermallyupgraded paper and to 110 °C for thermally upgraded paper:
6/)98(2 hV
)273
15000273110
15000(
heV
Loss-of-Life (L)
Over certain period: L=ΣVnxtn, where n(1,N)

SINTEF Energy Research 25
Loss of Life Example
Load Steps of the Transformer
0,00
0,50
1,00
1,50
2,00
2,50
0 4 8 12 16 20 24
Time (hours)
Load
Fac
tor
Hot Spot Temperature Calculation
0
50
100
150
200
250
0 4 8 12 16 20 24
Time (hours)
Hot
Spo
t Tem
p (D
eg C
)
Loss of Life Calculation
0102030405060708090
100
0 4 8 12 16 20 24
Time (hours)
Loss
of L
ife (d
ays)
Dry and Clean IEC 76-7
Load Profile Hot-Spot Temperature Profile
Time, hoursTime, hours
Time, hours
Load
fact
or, K
Loss
of l
ife,
day
s
Tem
pera
ture
, deg
C

SINTEF Energy Research 26
Monitoring Gasses
• DGA
Limited gas range monitor
Complete gas range monitor
•Hydrogen, H2•Methane, CH4•Ethane, C2H6•Ethylene*, C2H4•Acetylene*, C2H2 •Carbon Monoxide, CO•Carbon Dioxide, CO2•Oxygen, O2•Nitrogen, N2
•Hydrogen, H2 (100%)•Ethylene, C2H4 (8 %)•Acetylene, C2H2 (1.5)•Carbon Monoxide, CO(18%)

SINTEF Energy Research
Typical gasses generated:
27
IN CASE OF TRACKING DISCHARGE IN WET INSULATION
IN CASE OF CORE CIRCULATION CURRENTS
Low energy electrical discharge: Hydrogen H2, Methane CH4
Circulation currents in the core: Ethylene C2H4, Methane CH4 and Hydrogen H2

SINTEF Energy Research
Typical gasses generated:
28
IN CASE OF OVERHEATED CONNECTION
IN CASE OF WINDING OVERHEATING
Local hot-spots: CO and Ethylene C2H4, Methane CH¤
Thermal degradation of insulating paper: CO