Ieeepro Techno Solutions - Ieee 2013 Embedded Project a Review on Design of Portable Ecg System
Upload
srinivasanece7Category
view
147download
2
IEEE TRANSACTIONS ON INTELLIGENT TRANSPORTATION SYSTEMS, VOL. 14, NO. 3, SEPTEMBER 2013 1231
Reasoning-Based Framework for Driving SafetyMonitoring Using Driving Event Recognition
Bing-Fei Wu, Fellow, IEEE, Ying-Han Chen, Chung-Hsuan Yeh, and Yen-Feng Li
Abstract—With the growing concern for driving safety, manydriving-assistance systems have been developed. In this paper,we develop a reasoning-based framework for the monitoring ofdriving safety. The main objective is to present drivers with anintuitively understood green/yellow/red indicator of their dangerlevel. Because the danger level may change owing to the interactionof the host vehicle and the environment, the proposed frameworkinvolves two stages of danger-level alerts. The first stage collectslane bias, the distance to the front car, longitudinal and lateralaccelerations, and speed data from sensors installed in a realvehicle. All data were recorded in a normal driving environmentfor the training of hidden Markov models of driving events,including normal driving, acceleration, deceleration, changing tothe left or right lanes, zigzag driving, and approaching the car infront. In addition to recognizing these driving events, the degree ofeach event is estimated according to its character. In the secondstage, the danger-level indicator, which warns the driver of adangerous situation, is inferred by fuzzy logic rules that addressthe recognized driving events and their degrees. A hierarchicaldecision strategy is also designed to reduce the number of rulesthat are triggered. The proposed framework was successfullyimplemented on a TI DM3730-based embedded platform and wasfully evaluated in a real road environment. The experimentalresults achieved a detection ratio of 99% for event recognition,compared with that achieved by four conventional methods.
Index Terms—Driving events, driving safety, fuzzy logic, hiddenMarkov models (HMMs).
I. INTRODUCTION
A STUDY by the National Highway Traffic Safety Admin-istration reported that each year, approximately 56 000 car
accidents are caused by driver fatigue, in which approximately1500 drivers die. In Taiwan, a traffic accident occurs every2 min on average, whereas drunk driving and other humanerrors were the prime causes of accidents in the decade studied[1]. With advances in automotive electronics in recent years, awide range of automotive safety systems have been released,such as driver blind-spot detection and a 360◦ panorama imag-ing system [2], [3]. These driving assistance systems focuson the detection of certain events, such as lane departure, orthe approach of vehicles in the front/back/blind spots. They
Manuscript received September 6, 2012; revised February 8, 2013; acceptedApril 2, 2013. Date of publication April 30, 2013; date of current versionAugust 28, 2013. This work was supported by the National Science Council(NSC) under Grant NSC 101-2221-E-009-099. The Associate Editor for thispaper was H. Dia.
B.-F. Wu, Y.-H. Chen, and C.-H. Yeh are with the Department of ElectricalEngineering, National Chiao Tung University, Hsinchu 300, Taiwan (e-mail:[email protected]).
Y.-F. Li is with CSSP Inc., Hsinchu 300, Taiwan.Color versions of one or more of the figures in this paper are available online
at http://ieeexplore.ieee.org.Digital Object Identifier 10.1109/TITS.2013.2257759
provide drivers with warnings when such events are detected[4], because a timely warning may prevent a possible accident.The occurrence of an accident is related to many factors. Webelieve that if dangerous events frequently occur, there is ahigh probability that an accident will occur. For drivers whoare responsible for the transportation of people or goods, anaccident has a more serious impact than it does for individuals.If we could choose drivers with better driving performance,i.e., no frequent occurrence of dangerous events, this wouldfacilitate the safety and protection of both people and goods.For this reason, there has been an increase in research into themonitoring of a driver’s performance to prevent potential risks.
A driver’s performance can be evaluated using several in-dexes. People intuitively understand poor driving behaviorwhen they feel that a driver is performing dangerous maneuversthat make them uncomfortable. However, it is difficult to definewhat kind of behavior is dangerous or the danger level thatit represents. Because exact danger patterns have not beenestablished, the danger level of a given behavior may changewhen it takes place in different environments. Although thetime at which a detected event occurs can be recorded, it isstill difficult to provide a reasonable value of the danger levelto evaluate the driver’s performance in terms of any singleevent or when it occurs. Recent years have seen a growingbody of research on driving safety, and the methods used todetermine the degrees of dangerous driving are broadly dividedinto three categories, according to the subjects being studied:1) the states of the driver, 2) the states of the vehicle, and 3) thehybrid [5], [6].
A. Driver’s States
The first category considers the danger for which the driveris responsible. Different danger levels are determined by thedriver’s state using various physiological signals and theirimplications. In such cases, driver fatigue, distraction, anddrunkenness are often a cause of danger. If a system couldidentify these states, system warnings might be able to awakena driver in time to correct his/her course, and possible accidentsmight be avoided. This research approach thus focuses on howto effectively detect the driver’s state.
Some reports in the literature employ physiological signals,such as the heart rate [7], [8], electroencephalogram (EEG) [9]–[12], electrocardiograph (ECG) [13], and the respiration rate[14], to determine the driver’s state. In [7], a new calculationmethod for respiratory sinus arrhythmia and Mayer wave-related sinus arrhythmia is derived from an analysis of heart ratevariability, to evaluate the driver’s mental stress and drowsiness.
1524-9050 © 2013 IEEE

1232 IEEE TRANSACTIONS ON INTELLIGENT TRANSPORTATION SYSTEMS, VOL. 14, NO. 3, SEPTEMBER 2013
Jap et al. [9] assessed four EEG activities, namely, delta, theta,alpha, and beta, during a monotonous driving session. Theresults have implications for the detection of fatigue, based onan increase in the ratio of slow- to fast-wave EEG activities overtime. Chua et al. [13] combined ECG and photoplethysmogrammeasurements to estimate psychomotor vigilance by establish-ing multiple linear regression models. Yang et al. [15] proposeda driver fatigue recognition model based on a dynamic Bayesiannetwork that uses physiological features (ECG and EEG), andthey applied the hidden Markov model (HMM) to compute thedynamics of the network at different points in time. To acquirethe given signals, however, one or more intrusive sensors mustbe attached to the driver’s body. This requirement makes mostdrivers unwilling to use the system and is impractical in mostsituations.
To avoid these shortcomings of intrusive sensors, the otherapproach to research uses cameras to identify driver fatigueand distraction via the recognition of characteristic facial ex-pressions. Single or multiple facial features, such as the per-centage of eye closure (PERCLOS), eye closure duration, blinkfrequency, nodding frequency, face position, and fixed gaze, areused to characterize a driver’s state [16]–[19]. Albu et al. [20]proposed an approach that focuses on a single visual cueand uses a custom-designed template-matching algorithm foronline eye-state detection of fatigued drivers. Qiang et al. [21]described a driver fatigue monitor that recognizes eyelid move-ment, gaze movement, head movement, and facial expression.A probabilistic model was then developed to model humanfatigue based on visual cues. Ueno et al. [22] developed asystem for drowsiness detection that recognizes whether adriver’s eyes are open or closed, using image processing tech-nology. Their preliminary evaluations gave promising results,which showed that the system’s performance is comparable tothat of techniques that use physiological signals. However, thevariations in light and shadow during the day affect the visualappearance of the driver, which makes it a difficult challenge touse computer vision techniques to reliably obtain accurate androbust results.
Another approach involves finding the correlations be-tween the car performance and the driver’s state [23]–[25].Eskandarian and Mortazavi [26] used an artificial neural net-work (ANN)-based algorithm to detect drowsiness using onlyinput from the steering wheel. However, it is not easy to acquiresuch information from a vehicle without the use of a controllerarea network (CAN) bus or additional supports.
B. Vehicle’s States
The second approach deals with the behavior of vehicles andnot of drivers. The features of interest in this approach includethe parameters of the host vehicle and of the environment, suchas lateral positions, accelerations/decelerations, the distance tothe vehicle in front, and the distance to the lane markings [27],[28]. These features also indirectly indicate the driver’s stateand can be extracted by various sensors. Many researchershave conducted studies along these lines to develop drivingsafety systems. Liu et al. [29] proposed a method of hazardous-event detection that employs object tracking and a finite-state
machine. The tracking results are mapped to a region calleda driving environment state map and are then used to predictthe behavior of the tracking vehicle. Inata et al. [30] proposedthe modeling of longitudinal driving behavior based on urbandriving data of human pedal operation for longitudinal vehiclecontrol. Huang [31] constructed a long- and short-term modelfor filtering the variations of parameters, and the results areclassified to define different types of dangerous driving situ-ations. However, there are several challenges in developing asafety monitoring system based on the identification of vehiclebehaviors. For rule-based approaches, it is difficult to design acomprehensive set of rules that cover all dangerous behaviors.
For this reason, some researchers have used statisticalmethods to determine the dangerous behaviors using patternrecognition techniques. Zhou et al. [32] proposed a discrimi-native learning approach, i.e., conditional random field, whichcombines multichannel sequential data to detect unsafe drivingpatterns, using semisupervised learning algorithms. Ning et al.[33] proposed an approach to learning the danger-level func-tion. The danger level is treated as an expected future reward,and temporal difference learning is used to learn the func-tion to approximate the expected future reward. Wang et al.[34] introduced a dangerous-driving warning system that usesstatistical modeling to predict driving risks. In this system,a semisupervised learning method utilizes both labeled andunlabeled data to build an appropriate danger-level function.Aoude et al. [35] developed algorithms based on support vectormachines (SVMs) and HMMs for estimating driver behavior atroad intersections, which are combined with Bayesian filteringto classify drivers as being compliant or in violation. Patternsof dangerous behavior are difficult to define, and the boundariesof the patterns may not be so clear. Another research group hasused regression techniques to identify levels of danger [36]. Inthis case, however, it is also difficult to explain the influence ofeach parameter in the regression model.
C. Hybrid
Hybrid means that states of both the driver and the vehicleare simultaneously considered. Sathyanarayana et al. [37] triedto detect distraction by using data from the CAN and motionsensors (accelerometer and gyroscope). The collected data wereanalyzed using principal component analysis and linear dis-criminant analysis to reduce the number of features. Then, ak-nearest neighbor classifier was trained and verified. Theresults showed that this system could yield an accuracy of over90% for distraction detection. However, not every related workin this category showed the comparison detection results ofusing the single state and the hybrid. It is difficult to concludethat using the approach of the single state is definitely worsethan the approach of the hybrid.
In this paper, we propose a reasoning-based framework toprovide drivers with an intuitively understandable indicator thatalerts them to a definite level of danger, which is based on therecognition of different driving events. There are two stages inour framework. The first stage is the recognition of the follow-ing seven driving events, using HMMs: normal driving (ND),acceleration (ACC), deceleration (DEC), changing left (CL),

WU et al.: FRAMEWORK FOR DRIVING SAFETY MONITORING USING DRIVING EVENT RECOGNITION 1233
changing right (CR), zigzag driving (ZD), and approaching thecar in front (AFC). In the second stage, a fuzzy inference system(FIS) is introduced that produces a danger-level indicator thatalerts the driver to dangerous situations. The higher the valueindicated, the worse the status of the driver’s situation. Thedata that are used come from a camera, an accelerometer,and a global positioning system (GPS) receiver, which provideinformation regarding lane bias, the distance to the car in front,frontal and lateral accelerations, and the velocity of the hostvehicle. We sought to treat the process in a clearly analyticalmanner. The first stage is a classification-based problem, whichrequires a well-designed approach to obtain a good detectionratio. The second stage relies on an expert system that weexpect can offer drivers a clear and reasonable explanation ofthe meaning of the danger level that is indicated.
The main contribution of the proposed system is that itprovides drivers not only with a simple indicator of the dangerlevel but also with information that defines the present drivingevent. This system is, thus, particularly useful for managementapplications, as it can use easily installed sensors that haveinterfaces that are nonintrusive for either people or vehicles,fostering increased willingness to apply the system. Moreover,all training and testing data were acquired from a real vehiclein a real environment, and the framework was implemented onan embedded platform to evaluate its performance.
The rest of this paper is organized as follows: Section IIintroduces the design of the vehicle behavior model and theusage of selected sensors. The details of driving event recog-nition and the logic that governs the different danger levels areaddressed in Sections III and IV, respectively. The experimen-tal results and comparisons of performance are presented inSection V. Finally, our conclusions are presented in Section VI.
II. SETUP OF THE VEHICLE BEHAVIOR MODEL
The act of driving consists of many complicated behaviorsand factors. To easily and constructively describe and analyzedriving behavior, a vehicle behavior model must first be devel-oped. In surveying past research, we found that most drivingsituations can be described in terms of three aspects, namely,longitudinal, lateral, and car-following behaviors. As shownin Fig. 1, longitudinal behaviors characterize the longitudinalvariation of vehicles, such as acceleration and deceleration,whereas lateral behaviors explain the lateral variation of vehi-cles. In general, there is not just a single car on the road, andmost accidents are caused by collisions between vehicles. Forthis reason, car-following behaviors are introduced to accountfor the variable distance between one car and the car in front ofit. We believe that the combination of these three aspects canbe used to model most driving behaviors and provide sufficientinformation to infer the level of danger. ACC, DEC, CL, CR,ZD, and AFC were selected as representative behaviors thatcover the three aspects. The details of these behaviors are listedin Table I. In addition, the given behaviors are also referred toas “driving events” in this work, and the recognition of thesedriving events is the most important task in the first stage of theproposed framework.
Fig. 1. Vehicle behavior model.
TABLE IDRIVING BEHAVIOR CATEGORIES
Unlike most research, which uses a simulator to obtain thedata needed for analysis and evaluation, the proposed frame-work is designed to be a practical system. Accordingly, theselected sensors needed to be easily acquired and installed.For this reason, we chose a camera, an accelerometer, anda GPS receiver to collect the needed data. Most people arefamiliar with these different kinds of sensors, which are evenavailable on their mobile phones. The driving events in thelongitudinal and lateral behaviors are relative to the velocity andthe acceleration of the host vehicle, which can be obtained fromthe accelerometer and the GPS receiver. The accelerometer isset on the dashboard, and the x-axis and the y-axis of thesensor coordinate system are aligned with the longitudinal andlateral directions of the vehicle, respectively. The events of lanechanging and approaching the car in front, however, are relatednot only to the host vehicle but to the environment as well,i.e., the position relative to the lane markings and the vehiclein front.
Detection of lane markings and vehicles has been a fieldof interest in the development of advanced driver assistancesystems. Many vision-based solutions have reported robustperformance, and in many applications, they have been found tooutperform other techniques [4], [28]. Therefore, to efficientlyextract the needed parameters, this study has employed theresults of lane markings and vehicle detection that appeared inour previous research [38], [39]. After correctly detecting thelane markings and the vehicle in front using image processingtechnology, the system can acquire values for the lane bias andthe distance to the car in front, which are the major featuresrelated to lane changing and approaching the car in front, asshown in Fig. 2. The lane bias is derived from the lane mark-ings, whose meaning can be clarified, as shown in Fig. 2(a).The solid line represents the center line in the complete image,and the dashed line represents the center line within the lane.Thus, the lane bias is the difference between the solid line andthe dashed line.
III. DRIVING EVENT RECOGNITION
The major task in the first stage is to facilitate drivingevent recognition by HMMs, including the training and the

1234 IEEE TRANSACTIONS ON INTELLIGENT TRANSPORTATION SYSTEMS, VOL. 14, NO. 3, SEPTEMBER 2013
Fig. 2. Detection results of lane markings and the vehicle in front.(a) Significant lane bias. (b) Short distance to the car in front.
Fig. 3. Flowchart of the recognition procedure.
evaluation. A flowchart of the recognition procedure is shownin Fig. 3. The data collected from sensors include lane bias,the distance to the car in front, frontal/lateral accelerations, andthe velocity of the host vehicle. The lane bias and the distanceto the car in front are acquired by processing captured cameraimages that are taken at 30 frames/s. The three-axis accelerationvalue is provided by the accelerometer at a sampling rate of50 Hz, while the velocity is transmitted by the GPS receiverevery second. Because the data sources have different in-put rates, they have to be preprocessed before executing thenext step.
A. Data Preprocessing
Data preprocessing consists of four subprocesses, namely,filtering, downsampling, normalization, and quantization.
1) Filtering: A second-order Butterworth low-pass filterwith a 2-Hz cutoff frequency is applied to reduce theinfluence of noise. Because a vehicle is a relatively largemass, the behaviors of concern in our system generallyappear in the range of the low-frequency part.
2) Downsampling: The input data with a high sampling ratehave to be downsampled to reduce computational load.Both the data from the accelerometer and the camera aredownsampled to 5 Hz. If we take the accelerometer as anexample, we see that it provides three-axis acceleration ata sampling rate of 50 Hz. The mean is calculated everyten samples as a new value. This implies that the originalsampling rate of 50 Hz is downsampled to a rate of 5 Hz.The downsampled data are gathered through a slidingwindow. We assume that the normal behavior of a vehicle
is presented within 5 s, which means that there are 250samples of raw data and 25 samples after downsampling.Therefore, the length of the sliding window is set to 25 toacquire sufficient data.
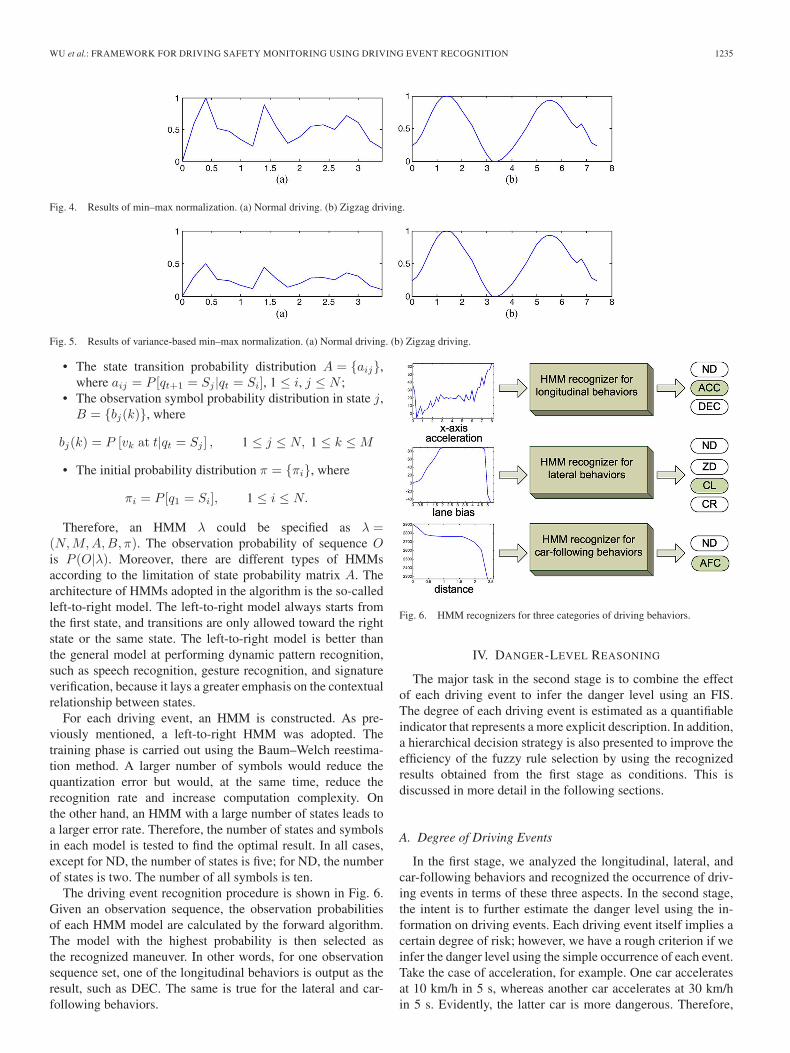
3) Normalization: Normalization, which is performed tostandardize the range of independent variables or featuresof data, is applied. Since the range of values of rawdata widely varies in many machine learning algorithms,objective functions will not properly work without nor-malization. The selected HMM method is no exception.The minimum and the maximum are selected from the25 samples in the window, and these two values areused to scale the data range into [0, 1]. In particular,instead of such commonly used normalization methodsas min–max normalization and mean–variance normal-ization, a modified version of min–max normalization,which is called variance-based min–max normalization,is used for the following reasons. Conventional min–maxnormalization preserves the trend of the data but loses theamplitude information, which is the key feature of drivingevents. For example, the min–max normalization resultsof normal driving and zigzag driving are quite similar,as shown in Fig. 4. Therefore, variance-based min–maxnormalization checks the variance to remap the range ofnormalization to preserve the amplitude information. Ifthe data variance < Tvar, where Tvar is the maximumvalue of the statistics from the data of normal driving, therange is remapped to [0, 0.5] instead of [0, 1], as shownin Fig. 5.
4) Quantization: Vector quantization is introduced to gener-ate distinct observation symbols for HMM usage. Vectorquantization works by encoding values from a multidi-mensional vector space into a finite set of values from adiscrete subspace of a lower dimension. The dimensionof quantized data represents the number of symbols usedin an HMM, and it affects HMM complexity. Quantizeddata with a low dimension may eliminate the variationof the data, whereas data with a high dimension increasecomputational complexity. By observing the recordeddata, we chose a dimension of 10 to preserve the trendof the data. This means that the normalized value in [0, 1]is quantized with an integer in [1] and [10].
B. Behavior Recognition
After data preprocessing is accomplished, the HMM is ap-plied to recognize the driving events. An HMM is a probabilis-tic tool for time-series data recognition. Owing to its stochasticnature, the HMM has been successfully used in a wide rangeof applications in the area of pattern recognition, particularlyin speech recognition. Theories of HMMs were introduced byBaum and Petrie in the late 1960s [40]. Here, only the basicconcepts are introduced. Detailed tutorials on HMMs can befound in [41].
An HMM is characterized by the following elements:
• N , the number of states in the HMM model;• M , the number of distinct observation symbols per state;
WU et al.: FRAMEWORK FOR DRIVING SAFETY MONITORING USING DRIVING EVENT RECOGNITION 1235
Fig. 4. Results of min–max normalization. (a) Normal driving. (b) Zigzag driving.
Fig. 5. Results of variance-based min–max normalization. (a) Normal driving. (b) Zigzag driving.
• The state transition probability distribution A = {aij},where aij = P [qt+1 = Sj |qt = Si], 1 ≤ i, j ≤ N ;
• The observation symbol probability distribution in state j,B = {bj(k)}, where
bj(k) = P [vk at t|qt = Sj ] , 1 ≤ j ≤ N, 1 ≤ k ≤ M
• The initial probability distribution π = {πi}, where
πi = P [q1 = Si], 1 ≤ i ≤ N.
Therefore, an HMM λ could be specified as λ =(N,M,A,B, π). The observation probability of sequence Ois P (O|λ). Moreover, there are different types of HMMsaccording to the limitation of state probability matrix A. Thearchitecture of HMMs adopted in the algorithm is the so-calledleft-to-right model. The left-to-right model always starts fromthe first state, and transitions are only allowed toward the rightstate or the same state. The left-to-right model is better thanthe general model at performing dynamic pattern recognition,such as speech recognition, gesture recognition, and signatureverification, because it lays a greater emphasis on the contextualrelationship between states.
For each driving event, an HMM is constructed. As pre-viously mentioned, a left-to-right HMM was adopted. Thetraining phase is carried out using the Baum–Welch reestima-tion method. A larger number of symbols would reduce thequantization error but would, at the same time, reduce therecognition rate and increase computation complexity. Onthe other hand, an HMM with a large number of states leads toa larger error rate. Therefore, the number of states and symbolsin each model is tested to find the optimal result. In all cases,except for ND, the number of states is five; for ND, the numberof states is two. The number of all symbols is ten.
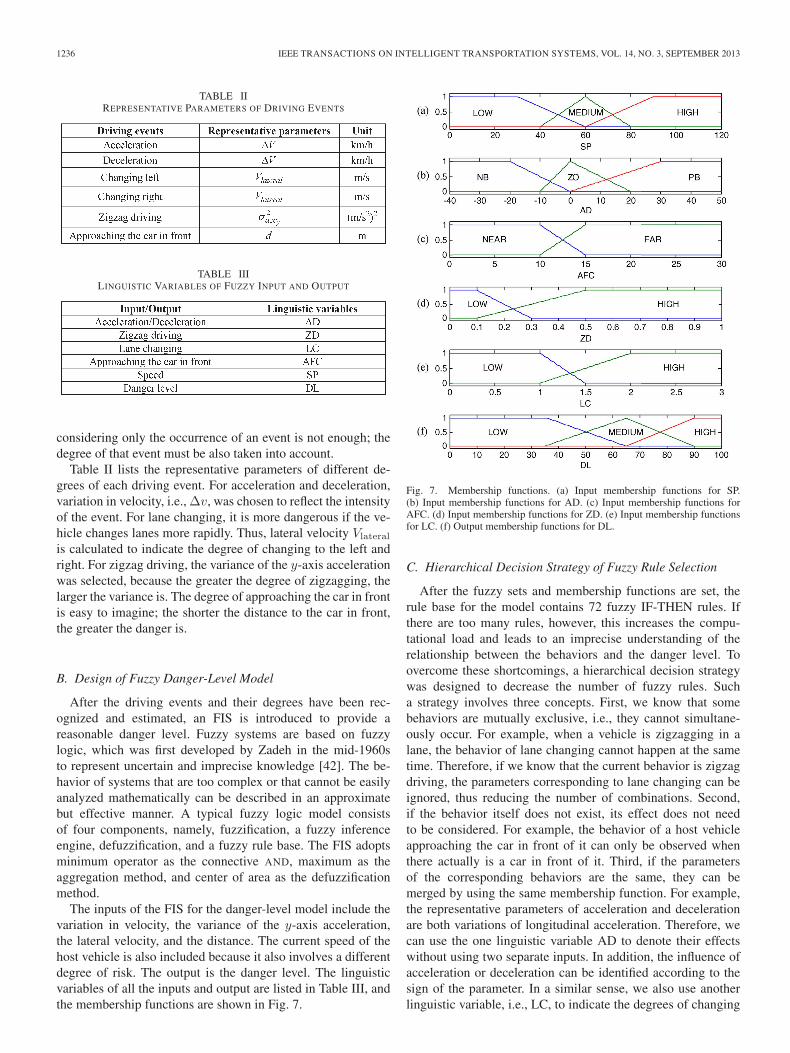
The driving event recognition procedure is shown in Fig. 6.Given an observation sequence, the observation probabilitiesof each HMM model are calculated by the forward algorithm.The model with the highest probability is then selected asthe recognized maneuver. In other words, for one observationsequence set, one of the longitudinal behaviors is output as theresult, such as DEC. The same is true for the lateral and car-following behaviors.
Fig. 6. HMM recognizers for three categories of driving behaviors.
IV. DANGER-LEVEL REASONING
The major task in the second stage is to combine the effectof each driving event to infer the danger level using an FIS.The degree of each driving event is estimated as a quantifiableindicator that represents a more explicit description. In addition,a hierarchical decision strategy is also presented to improve theefficiency of the fuzzy rule selection by using the recognizedresults obtained from the first stage as conditions. This isdiscussed in more detail in the following sections.
A. Degree of Driving Events
In the first stage, we analyzed the longitudinal, lateral, andcar-following behaviors and recognized the occurrence of driv-ing events in terms of these three aspects. In the second stage,the intent is to further estimate the danger level using the in-formation on driving events. Each driving event itself implies acertain degree of risk; however, we have a rough criterion if weinfer the danger level using the simple occurrence of each event.Take the case of acceleration, for example. One car acceleratesat 10 km/h in 5 s, whereas another car accelerates at 30 km/hin 5 s. Evidently, the latter car is more dangerous. Therefore,
1236 IEEE TRANSACTIONS ON INTELLIGENT TRANSPORTATION SYSTEMS, VOL. 14, NO. 3, SEPTEMBER 2013
TABLE IIREPRESENTATIVE PARAMETERS OF DRIVING EVENTS
TABLE IIILINGUISTIC VARIABLES OF FUZZY INPUT AND OUTPUT
considering only the occurrence of an event is not enough; thedegree of that event must be also taken into account.
Table II lists the representative parameters of different de-grees of each driving event. For acceleration and deceleration,variation in velocity, i.e., Δv, was chosen to reflect the intensityof the event. For lane changing, it is more dangerous if the ve-hicle changes lanes more rapidly. Thus, lateral velocity Vlateral
is calculated to indicate the degree of changing to the left andright. For zigzag driving, the variance of the y-axis accelerationwas selected, because the greater the degree of zigzagging, thelarger the variance is. The degree of approaching the car in frontis easy to imagine; the shorter the distance to the car in front,the greater the danger is.
B. Design of Fuzzy Danger-Level Model
After the driving events and their degrees have been rec-ognized and estimated, an FIS is introduced to provide areasonable danger level. Fuzzy systems are based on fuzzylogic, which was first developed by Zadeh in the mid-1960sto represent uncertain and imprecise knowledge [42]. The be-havior of systems that are too complex or that cannot be easilyanalyzed mathematically can be described in an approximatebut effective manner. A typical fuzzy logic model consistsof four components, namely, fuzzification, a fuzzy inferenceengine, defuzzification, and a fuzzy rule base. The FIS adoptsminimum operator as the connective AND, maximum as theaggregation method, and center of area as the defuzzificationmethod.
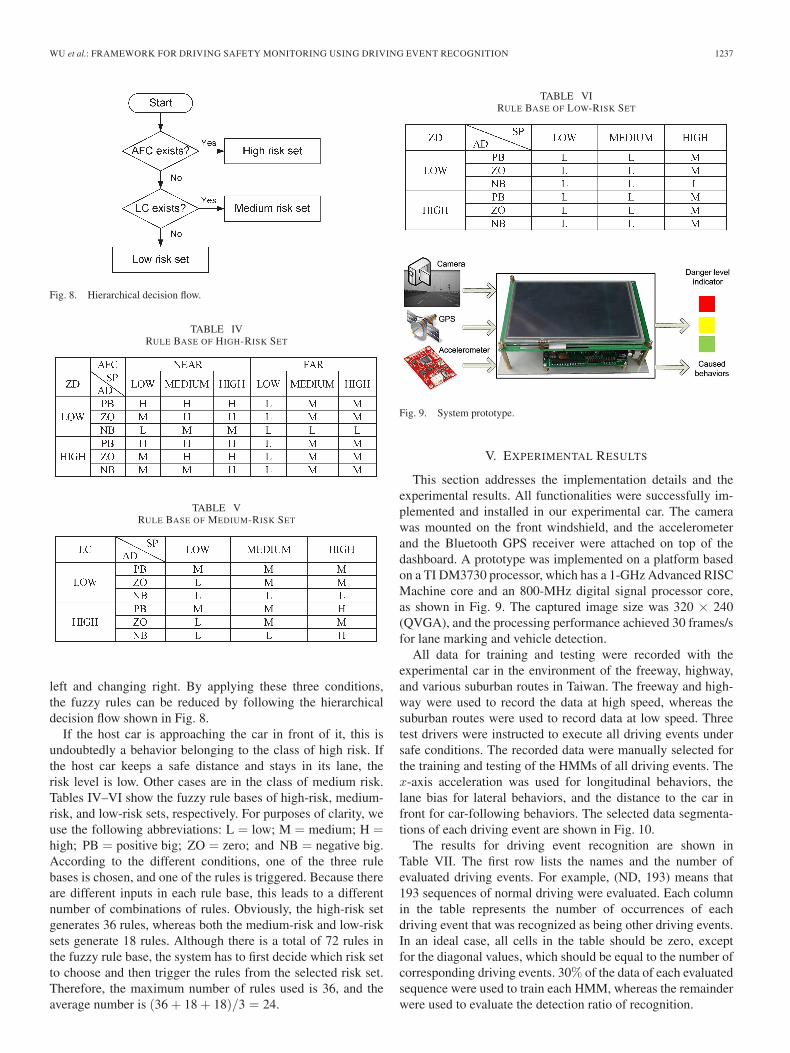
The inputs of the FIS for the danger-level model include thevariation in velocity, the variance of the y-axis acceleration,the lateral velocity, and the distance. The current speed of thehost vehicle is also included because it also involves a differentdegree of risk. The output is the danger level. The linguisticvariables of all the inputs and output are listed in Table III, andthe membership functions are shown in Fig. 7.
Fig. 7. Membership functions. (a) Input membership functions for SP.(b) Input membership functions for AD. (c) Input membership functions forAFC. (d) Input membership functions for ZD. (e) Input membership functionsfor LC. (f) Output membership functions for DL.
C. Hierarchical Decision Strategy of Fuzzy Rule Selection
After the fuzzy sets and membership functions are set, therule base for the model contains 72 fuzzy IF-THEN rules. Ifthere are too many rules, however, this increases the compu-tational load and leads to an imprecise understanding of therelationship between the behaviors and the danger level. Toovercome these shortcomings, a hierarchical decision strategywas designed to decrease the number of fuzzy rules. Sucha strategy involves three concepts. First, we know that somebehaviors are mutually exclusive, i.e., they cannot simultane-ously occur. For example, when a vehicle is zigzagging in alane, the behavior of lane changing cannot happen at the sametime. Therefore, if we know that the current behavior is zigzagdriving, the parameters corresponding to lane changing can beignored, thus reducing the number of combinations. Second,if the behavior itself does not exist, its effect does not needto be considered. For example, the behavior of a host vehicleapproaching the car in front of it can only be observed whenthere actually is a car in front of it. Third, if the parametersof the corresponding behaviors are the same, they can bemerged by using the same membership function. For example,the representative parameters of acceleration and decelerationare both variations of longitudinal acceleration. Therefore, wecan use the one linguistic variable AD to denote their effectswithout using two separate inputs. In addition, the influence ofacceleration or deceleration can be identified according to thesign of the parameter. In a similar sense, we also use anotherlinguistic variable, i.e., LC, to indicate the degrees of changing
WU et al.: FRAMEWORK FOR DRIVING SAFETY MONITORING USING DRIVING EVENT RECOGNITION 1237
Fig. 8. Hierarchical decision flow.
TABLE IVRULE BASE OF HIGH-RISK SET
TABLE VRULE BASE OF MEDIUM-RISK SET
left and changing right. By applying these three conditions,the fuzzy rules can be reduced by following the hierarchicaldecision flow shown in Fig. 8.
If the host car is approaching the car in front of it, this isundoubtedly a behavior belonging to the class of high risk. Ifthe host car keeps a safe distance and stays in its lane, therisk level is low. Other cases are in the class of medium risk.Tables IV–VI show the fuzzy rule bases of high-risk, medium-risk, and low-risk sets, respectively. For purposes of clarity, weuse the following abbreviations: L = low; M = medium; H =high; PB = positive big; ZO = zero; and NB = negative big.According to the different conditions, one of the three rulebases is chosen, and one of the rules is triggered. Because thereare different inputs in each rule base, this leads to a differentnumber of combinations of rules. Obviously, the high-risk setgenerates 36 rules, whereas both the medium-risk and low-risksets generate 18 rules. Although there is a total of 72 rules inthe fuzzy rule base, the system has to first decide which risk setto choose and then trigger the rules from the selected risk set.Therefore, the maximum number of rules used is 36, and theaverage number is (36 + 18 + 18)/3 = 24.
TABLE VIRULE BASE OF LOW-RISK SET
Fig. 9. System prototype.
V. EXPERIMENTAL RESULTS
This section addresses the implementation details and theexperimental results. All functionalities were successfully im-plemented and installed in our experimental car. The camerawas mounted on the front windshield, and the accelerometerand the Bluetooth GPS receiver were attached on top of thedashboard. A prototype was implemented on a platform basedon a TI DM3730 processor, which has a 1-GHz Advanced RISCMachine core and an 800-MHz digital signal processor core,as shown in Fig. 9. The captured image size was 320 × 240(QVGA), and the processing performance achieved 30 frames/sfor lane marking and vehicle detection.
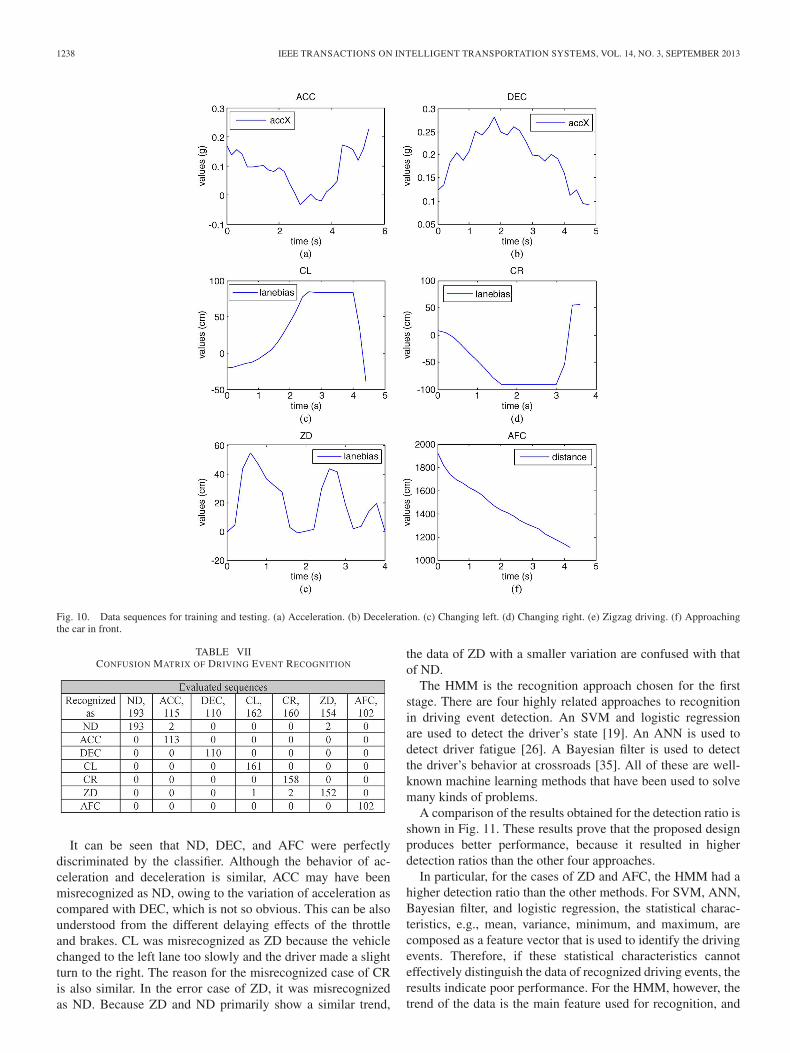
All data for training and testing were recorded with theexperimental car in the environment of the freeway, highway,and various suburban routes in Taiwan. The freeway and high-way were used to record the data at high speed, whereas thesuburban routes were used to record data at low speed. Threetest drivers were instructed to execute all driving events undersafe conditions. The recorded data were manually selected forthe training and testing of the HMMs of all driving events. Thex-axis acceleration was used for longitudinal behaviors, thelane bias for lateral behaviors, and the distance to the car infront for car-following behaviors. The selected data segmenta-tions of each driving event are shown in Fig. 10.
The results for driving event recognition are shown inTable VII. The first row lists the names and the number ofevaluated driving events. For example, (ND, 193) means that193 sequences of normal driving were evaluated. Each columnin the table represents the number of occurrences of eachdriving event that was recognized as being other driving events.In an ideal case, all cells in the table should be zero, exceptfor the diagonal values, which should be equal to the number ofcorresponding driving events. 30% of the data of each evaluatedsequence were used to train each HMM, whereas the remainderwere used to evaluate the detection ratio of recognition.
1238 IEEE TRANSACTIONS ON INTELLIGENT TRANSPORTATION SYSTEMS, VOL. 14, NO. 3, SEPTEMBER 2013
Fig. 10. Data sequences for training and testing. (a) Acceleration. (b) Deceleration. (c) Changing left. (d) Changing right. (e) Zigzag driving. (f) Approachingthe car in front.
TABLE VIICONFUSION MATRIX OF DRIVING EVENT RECOGNITION
It can be seen that ND, DEC, and AFC were perfectlydiscriminated by the classifier. Although the behavior of ac-celeration and deceleration is similar, ACC may have beenmisrecognized as ND, owing to the variation of acceleration ascompared with DEC, which is not so obvious. This can be alsounderstood from the different delaying effects of the throttleand brakes. CL was misrecognized as ZD because the vehiclechanged to the left lane too slowly and the driver made a slightturn to the right. The reason for the misrecognized case of CRis also similar. In the error case of ZD, it was misrecognizedas ND. Because ZD and ND primarily show a similar trend,
the data of ZD with a smaller variation are confused with thatof ND.
The HMM is the recognition approach chosen for the firststage. There are four highly related approaches to recognitionin driving event detection. An SVM and logistic regressionare used to detect the driver’s state [19]. An ANN is used todetect driver fatigue [26]. A Bayesian filter is used to detectthe driver’s behavior at crossroads [35]. All of these are well-known machine learning methods that have been used to solvemany kinds of problems.
A comparison of the results obtained for the detection ratio isshown in Fig. 11. These results prove that the proposed designproduces better performance, because it resulted in higherdetection ratios than the other four approaches.
In particular, for the cases of ZD and AFC, the HMM had ahigher detection ratio than the other methods. For SVM, ANN,Bayesian filter, and logistic regression, the statistical charac-teristics, e.g., mean, variance, minimum, and maximum, arecomposed as a feature vector that is used to identify the drivingevents. Therefore, if these statistical characteristics cannoteffectively distinguish the data of recognized driving events, theresults indicate poor performance. For the HMM, however, thetrend of the data is the main feature used for recognition, and

WU et al.: FRAMEWORK FOR DRIVING SAFETY MONITORING USING DRIVING EVENT RECOGNITION 1239
Fig. 11. Comparison of the detection ratio for recognition results.
TABLE VIIICOMPARISON OF FALSE-ALARM RATES (BY PERCENTAGE)
the proposed variance-based min–max normalization alsoincreases the level of discrimination for different driving events.These characteristics resulted in better performance for ZDand AFC.
In addition to a high detection ratio, a low false-alarm rateis also significant. Table VIII lists the comparative results ofthe false-alarm rates for the proposed approach and for theother four approaches. Except for ND and ZD, the other drivingevents produced no false alarms. In Table VII, we can see thatthe false alarms for ZD are due to the misrecognition of CLand CR and that those for ND are due to the misrecognition ofACC and ZD. The average false-alarm rate was only 0.57%,which is much lower than that of the other approaches. Wewould recall here that the recognition process involves com-paring the probability of each model and choosing the modelwith the highest probability as being the recognized drivingevent. Therefore, the difference between the highest probabilityand the second highest probability reflects the robustness ofrecognition. The average ratio of the highest probability and thesecond highest probability of recognized driving events in allsuccessful identifications was 2.17. This means that the highestprobability value is twice that of the second highest value,which indicates that the recognition process is quite robust.
Fig. 12 shows a safe driving course, on which the drivermaintained a smooth pace and a steady path, and there wereno cars in the front. The longitudinal, lateral, and car-followingbehaviors were all recognized as representing normal driving.The details of the driving data were as follows: The speedwas 95 km/h, and the variation of speed was −8.43 km/h. Thevariance of the y-axis acceleration was 0.107 (m/s2)2.
Owing to the hierarchical decision strategy of danger-levelreasoning, the rule base of low risk was invoked. Two rules weretherefore activated.
Fig. 12. Safe driving course.
Fig. 13. Dangerous driving situation.
1) If ZD is LOW and AD is ZO and SP is HIGH , thenDL is MEDIUM .
2) If ZD is LOW and AD is NB and SP is HIGH , thenDL is LOW .
The evaluated danger level was 40.2, which represents a safedriving situation. Therefore, the safety indicator on the upperright-hand corner in Fig. 12 shows a green sign. This way, adriver can understand his/her situation at a glance.
Fig. 13 shows a relatively more dangerous situation. Thedriver speeded up and came close to the car in front. This isdefinitely dangerous driving. The details of the driving datawere as follows: The speed was 83 km/h, and the variation ofspeed was 23.4 km/h. The variance of the y-axis accelerationwas 0.109 (m/s2)2. The distance to the car in front was 10.5 m.
1240 IEEE TRANSACTIONS ON INTELLIGENT TRANSPORTATION SYSTEMS, VOL. 14, NO. 3, SEPTEMBER 2013
Because of the existing AFC, the rule base of high risk wasinvoked. These two rules were therefore activated.
1) If AFC is NEAR and ZD is LOW and AD is PB andSP is HIGH , then DL is HIGH .
2) If AFC is FAR and ZD is LOW and AD is PB andSP is HIGH , then DL is MEDIUM .
The evaluated danger level was 81.3, and the safety indicatorshowed a red sign. The driver would immediately know thathe/she is in danger and must slow down to avoid an accident.
The degree of danger level is determined by the fuzzy rules.However, for the inferred danger level, e.g., the system showsa yellow indicator, some drivers might think that the situationis much dangerous, whereas some might feel just appropri-ate. We believe that this circumstance exists due to differentcharacteristics in different persons. Therefore, our evaluationstrategy focuses on examining the accuracy of the occurrenceof medium- and high-danger degrees. Three test drivers wereinstructed to drive on the freeway for about 30 min. Two kindsof tests were performed. The first kind of test is to watch outfor circumstances and drive in a normal and safe way. Theinferred danger levels were recorded, and we expected that allof them revealed the low danger level. The results with mediumor high danger levels were represented as false alarms. Thesecond kind of test is to behave dangerous actions consciouslyand carefully, e.g., changing lane rapidly. The inferred dangerlevels were manually marked every time the driver started doingthe dangerous action. We expected that none of the markeddanger levels revealed the low danger level. The results withlow danger levels were represented as false alarms. The firstand second types of tests were performed by three drivers for 10times in each case, whereas 20 dangerous actions were behavedduring the second test. The results showed that there are no falsealarms in both tests, which means that the performance of thesecond stage in the proposed framework is applicable.
VI. CONCLUSION
This study has proposed a two-stage reasoning-based frame-work that uses driving event recognition to provide drivers withan intuitive danger-level indicator for driving safety. Except forthe information on driving events, a single index to evaluatea driver’s performance is very useful, because it is convenientto know drivers’ status on their routes. People could moreeasily clarify the cause of an accident or know the stability ofa driver by examining the occurring driving events accordingto danger levels. To overcome the issue of labeling that arisesfrom the uncertain definition of a dangerous pattern, the dangerlevel is inferred by an FIS, using information based on recog-nized driving events. Our system not only informs drivers oftheir current safety status but offers information regarding thepossible behaviors that led to this status as well. To reducethe complexity of the FIS, a hierarchical decision strategywas proposed, which can significantly decrease the number ofrules. The developed functions were fully implemented on anembedded platform and were then tested in a real environment.All HMM training models for seven driving events achievedan average detection ratio of approximately 99%. Two typesof tests were designed to evaluate the inferred results, and the
results signified that the danger-level indicator could providesuitable notifications for driving safety monitoring. However,the design of danger-level inference is insufficient because theground truth of a danger level is not available in this study.Although the evaluation shows that the results are functionalfor notification, we cannot conclude that the inferred dangerlevel is accurate. In the future, a valid approach to directlyor indirectly estimate the value of danger will be investigated.Then, the methods for automatic rule generation and structureoptimization are possible to apply in the inference stage in ourframework to acquire more comprehensive inferred results.
REFERENCES
[1] C. M. Feng, “Road accidents profile in Taiwan,” J. Int. Assoc. TrafficSafety Sci., vol. 31, no. 1, pp. 138–139, Feb. 2007.
[2] T. Ehlgen, T. Pajdla, and D. Ammon, “Eliminating blind spots for assisteddriving,” IEEE Trans. Intell. Transp. Syst., vol. 9, no. 4, pp. 657–665,Dec. 2008.
[3] T. Gandhi and M. M. Trivedi, “Vehicle surround capture: Survey of tech-niques and a novel omni-video-based approach for dynamic panoramicsurround maps,” IEEE Trans. Intell. Transp. Syst., vol. 7, no. 3, pp. 293–308, Sep. 2006.
[4] V. Kastrinaki, M. Zervakis, and K. Kalaitzakis, “A survey of video pro-cessing techniques for traffic applications,” Image Vis. Comput., vol. 21,no. 4, pp. 359–381, Apr. 2003.
[5] Y. Dong, Z. Hu, K. Uchimura, and N. Murayama, “Driver inattentionmonitoring system for intelligent vehicles: A review,” IEEE Trans. Intell.Transp. Syst., vol. 12, no. 2, pp. 596–614, Jun. 2011.
[6] A. Doshi and M. M. Trivedi, “Tactical driver behavior prediction andintent inference: A review,” in Proc. IEEE Intell. Transp. Syst., 2011,pp. 1892–1897.
[7] B. Atsumi, “Evaluation of mental condition on drivers by analysis ofheart rate variability: Measurement of mental stress and drowsiness byindexes of autonomic nervous system,” JSAE Rev., vol. 16, no. 1, p. 110,Jan. 1995.
[8] K. Jiao, Z. Li, M. Chen, C. Wang, and S. Qi, “Effect of different vibra-tion frequencies on heart rate variability and driving fatigue in healthydrivers,” Int. Arch. Occup. Environ. Health, vol. 77, no. 3, pp. 205–212,Apr. 2004.
[9] B. T. Jap, S. Lal, P. Fischer, and E. Bekiaris, “Using EEG spectral compo-nents to assess algorithms for detecting fatigue,” Exp. Syst. Appl., vol. 36,no. 2, pp. 2352–2359, Mar. 2009.
[10] M. V. M. Yeo, X. Li, K. Shen, and E. P. V. Wilder-Smith, “Can SVMbe used for automatic EEG detection of drowsiness during car driving?”Safety Sci., vol. 47, no. 1, pp. 115–124, Jan. 2009.
[11] K. Q. Shen, X. P. Li, C. J. Ong, S. Y. Shao, and E. P. V. Wilder-Smith,“EEG-based mental fatigue measurement using multi-class support vectormachines with confidence estimate,” Clin. Neurophysiol., vol. 119, no. 7,pp. 1524–1533, Jul. 2008.
[12] C. T. Lin, R. C. Wu, S. F. Liang, W. H. Chao, Y. J. Chen, and T. P. Jung,“EEG-based drowsiness estimation for safety driving using independentcomponent analysis,” IEEE Trans. Circuits Syst. I, Reg. Papers, vol. 52,no. 12, pp. 2726–2738, Dec. 2005.
[13] C. P. Chua, G. McDarby, and C. Heneghan, “Combined electrocardio-gram and photoplethysmogram measurements as an indicator of objectivesleepiness,” Physiol. Meas., vol. 29, no. 8, pp. 857–868, Aug. 2008.
[14] S. K. L. Lal and A. Craig, “A critical review of the psychophysiology ofdriver fatigue,” Biol. Psychol., vol. 55, no. 3, pp. 173–194, Feb. 2001.
[15] G. Yang, Y. Lin, and P. Bhattacharya, “A driver fatigue recognition modelbased on information fusion and dynamic Bayesian network,” Inf. Sci.,vol. 180, no. 10, pp. 1942–1954, May 2010.
[16] L. M. Bergasa, J. Nuevo, M. A. Sotelo, R. Barea, and M. E. Lopez, “Real-time system for monitoring driver vigilance,” IEEE Trans. Intell. Transp.Syst., vol. 7, no. 1, pp. 63–77, Mar. 2006.
[17] Q. Ji and X. Yang, “Real-time eye, gaze, and face pose tracking formonitoring driver vigilance,” Real-Time Imag., vol. 8, no. 5, pp. 357–377,Oct. 2002.
[18] Q. Ji and X. Yang, “Real time visual cues extraction for monitoring drivervigilance,” in Proc. Comput. Vis. Syst., 2001, vol. 2095, pp. 107–124.
[19] L. Yulan, M. L. Reyes, and J. D. Lee, “Real-time detection of drivercognitive distraction using support vector machines,” IEEE Trans. Intell.Transp. Syst., vol. 8, no. 2, pp. 340–350, Jun. 2007.
WU et al.: FRAMEWORK FOR DRIVING SAFETY MONITORING USING DRIVING EVENT RECOGNITION 1241
[20] A. B. Albu, B. Widsten, W. Tiange, J. Lan, and J. Mah, “A computervision-based system for real-time detection of sleep onset in fatigueddrivers,” in Proc. IEEE Intell. Veh. Symp., 2008, pp. 25–30.
[21] J. Qiang, Z. Zhiwei, and P. Lan, “Real-time nonintrusive monitoring andprediction of driver fatigue,” IEEE Trans.Veh. Technol., vol. 53, no. 4,pp. 1052–1068, Jul. 2004.
[22] H. Ueno, M. Kaneda, and M. Tsukino, “Development of drowsiness de-tection system,” in Proc. Veh. Navig. Inf. Syst. Conf., 1994, pp. 15–20.
[23] F. Friedrichs and B. Yang, “Drowsiness monitoring by steering and lanedata based features under real driving conditions,” in Proc. Eur. SignalProcess. Conf., 2010, pp. 209–213.
[24] Y. J. Zhong, L. P. Du, K. Zhang, and X. H. Sun, “Localized energy studyfor analyzing driver fatigue state based on wavelet analysis,” in Proc.Wavelet Anal. Pattern Recognit., 2007, vol. 4, pp. 1843–1846.
[25] K. Torkkola, N. Massey, and C. Wood, “Driver inattention detectionthrough intelligent analysis of readily available sensors,” in Proc. IEEEIntell. Transp. Syst., 2004, pp. 326–331.
[26] A. Eskandarian and A. Mortazavi, “Evaluation of a smart algorithm forcommercial vehicle driver drowsiness detection,” in Proc. IEEE Intell.Veh. Symp., 2007, pp. 553–559.
[27] S. Zehang, G. Bebis, and R. Miller, “On-road vehicle detection: A review,”IEEE Trans. Pattern Anal. Mach. Intell., vol. 28, no. 5, pp. 694–711,May 2006.
[28] J. C. McCall and M. M. Trivedi, “Video-based lane estimation and track-ing for driver assistance: Survey, system, and evaluation,” IEEE Trans.Intell. Transp. Syst., vol. 7, no. 1, pp. 20–37, Mar. 2006.
[29] Y. Liu, Z. Han, Z. Zhang, and J. Jiao, “Video-based hazardous eventdetection in the driving environment,” in Proc. Eng. Manage., 2009,pp. 736–740.
[30] K. Inata, P. Raksincharoensak, and M. Nagai, “Driver behavior modelingbased on database of personal mobility driving in urban area,” in Proc.Int. Conf. Control, Autom. Syst., 2008, pp. 2902–2907.
[31] Y. R. Huang, “Real time dangerous driving status detection,” in Proc. Int.Congr. Image Signal Process., 2011, vol. 1, pp. 414–418.
[32] Y. Zhou, W. Xu, H. Ning, Y. Gong, and T. Huang, “Detecting unsafedriving patterns using discriminative learning,” in Proc. IEEE Int. Conf.Multimedia Expo., 2007, pp. 1431–1434.
[33] H. Ning, W. Xu, Y. Zhou, Y. Gong, and T. Huang, “A general frameworkto detect unsafe system states from multisensor data stream,” IEEE Trans.Intell. Transp. Syst., vol. 11, no. 1, pp. 4–15, Mar. 2010.
[34] J. Wang, S. Zhu, and Y. Gong, “Driving safety monitoring using semisu-pervised learning on time series data,” IEEE Trans. Intell. Transp. Syst.,vol. 11, no. 3, pp. 728–737, Sep. 2010.
[35] G. S. Aoude, V. R. Desaraju, L. H. Stephens, and J. P. How, “Driverbehavior classification at intersections and validation on large naturalisticdata set,” IEEE Trans. Intell. Transp. Syst., vol. 13, no. 2, pp. 724–736,Jun. 2012.
[36] S. Sekizawa, S. Inagaki, T. Suzuki, S. Hayakawa, N. Tsuchida, T. Tsuda,and H. Fujinami, “Modeling and recognition of driving behavior based onstochastic switched ARX model,” IEEE Trans. Intell. Transp. Syst., vol. 8,no. 4, pp. 593–606, Dec. 2007.
[37] A. Sathyanarayana, S. Nageswaren, H. Ghasemzadeh, R. Jafari, andJ. H. Hansen, “Body sensor networks for driver distraction identification,”in Proc. IEEE ICVES, 2008, pp. 120–125.
[38] C. J. Chen, H. Y. Peng, B. F. Wu, and Y. H. Chen, “A real-time drivingassistance and surveillance system,” J. Inf. Sci. Eng., vol. 25, no. 5,pp. 1501–1523, Sep. 2009.
[39] B. F. Wu, Y. H. Chen, C. C. Kao, Y. F. Li, and C. J. Chen, “A vision-basedcollision warning system by surrounding vehicles detection,” KSII Trans.Internet Inf. Syst., vol. 6, no. 4, pp. 1203–1222, Apr. 2012.
[40] L. E. Baum and T. Petrie, “Statistical inference for probabilistic functionsof finite state Markov chains,” Ann. Math. Stat., vol. 37, no. 6, pp. 1554–1563, Dec. 1966.
[41] L. R. Rabiner, “A tutorial on hidden Markov models and selected appli-cations in speech recognition,” Proc. IEEE, vol. 77, no. 2, pp. 257–286,Feb. 1989.
[42] L. A. Zadeh, “Fuzzy sets,” Inform. Control, vol. 8, no. 3, pp. 338–353,Jun. 1965.
Bing-Fei Wu (S’89–M’92–SM’02–F’12) receivedthe B.S. and M.S. degrees in control engineer-ing from National Chiao Tung University (NCTU),Hsinchu, Taiwan, in 1981 and 1983, respectively, andthe Ph.D. degree in electrical engineering from theUniversity of Southern California, Los Angeles, CA,USA, in 1992.
Since 1992, he has been with the Departmentof Electrical Engineering, NCTU, where he waspromoted to Professor in 1998 and DistinguishedProfessor in 2010. Since 2011, he has served as the
Director of the Institute of Electrical and Control Engineering, NCTU. Hiscurrent research interests include image recognition, vehicle driving safety, in-telligent control, intelligent transportation systems, multimedia signal analysis,and embedded systems.
Dr. Wu was elevated as a Fellow of the IEEE for his contributions tointelligent transportation and multimedia systems. Since 2011, he has been aFellow of the Institution of Engineering and Technology. In 2003, he foundedand served as the Chair of the IEEE Systems, Man, and Cybernetics (SMC)Society Taipei Chapter. In 2011, he was elected as the Chair of the TechnicalCommittee on Intelligent Transportation Systems of the IEEE SMC Society.He has received many research honors, including the Outstanding ResearchAward from the Pan Wen-Yuan Foundation in 2012; the Best TechnologyTransfer Award from the National Science Council, Taiwan, in 2008; and theOutstanding Information Technology Elite Award in 2003.
Ying-Han Chen was born in Tainan, Taiwan, in1981. He received the B.S. and M.S. degrees inelectrical engineering from National Central Univer-sity, Jhongli, Taiwan, in 2003 and 2006, respectively.He is currently working toward the Ph.D. degree inelectrical control engineering with National ChiaoTung University, Hsinchu, Taiwan.
His research interests include computer networks,embedded systems, and digital signal processing.
Chung-Hsuan Yeh was born in Changhua, Taiwan,in 1989. He received the B.S. degree in electricalengineering and the M.S. degree in electrical controlengineering from National Chiao Tung University,Hsinchu, Taiwan, in 2011 and 2012, respectively.
His research interests include signal and imageprocessing and embedded systems.
Yen-Feng Li was born in Taitung, Taiwan, in 1976.He received the B.S. degree in electronic engineer-ing from National Taiwan University of Scienceand Technology, Taipei, Taiwan, in 2007 and theM.S. degree in electronic engineering from Na-tional Chin-Yi University of Technology, Taichung,Taiwan, in 2009.
He is currently with CSSP Inc., Hsinchu, Taiwan.His research interests include image processing,embedded systems, and intelligent transportationsystems.