IEEE TRANSACTIONS ON INFORMATION …cnikou/Publications/J17_Plissiti_Nikou...IEEE TRANSACTIONS ON...
9
IEEE TRANSACTIONS ON INFORMATION TECHNOLOGY IN BIOMEDICINE, VOL. 15, NO. 2, MARCH 2011 233 Automated Detection of Cell Nuclei in Pap Smear Images Using Morphological Reconstruction and Clustering Marina E. Plissiti, Christophoros Nikou, Member, IEEE, and Antonia Charchanti Abstract—In this paper, we present a fully automated method for cell nuclei detection in Pap smear images. The locations of the candidate nuclei centroids in the image are detected with mor- phological analysis and they are refined in a second step, which incorporates a priori knowledge about the circumference of each nucleus. The elimination of the undesirable artifacts is achieved in two steps: the application of a distance-dependent rule on the resulted centroids; and the application of classification algorithms. In our method, we have examined the performance of an unsuper- vised (fuzzy C-means) and a supervised (support vector machines) classification technique. In both classification techniques, the effect of the refinement step improves the performance of the clustering algorithm. The proposed method was evaluated using 38 cytologi- cal images of conventional Pap smears containing 5617 recognized squamous epithelial cells. The results are very promising, even in the case of images with high degree of cell overlapping. Index Terms—Cell nuclei detection, fuzzy C-means (FCM), morphological reconstruction, Pap smear images, support vector machines (SVMs). I. INTRODUCTION T HE CORRECT interpretation of the microscopic exami- nation of cells and tissues is crucial for the final diagnostic decision for many diseases. One of the most interesting applica- tion fields of microscopic screening is the detection of precursors of cancer in cell samples. Nowadays, the most eminent example is screening for cervical cancer in its early stages, through the well-known Pap smear [1]. The visual interpretation of Pap smear images is a tedious, time consuming, and in many cases an error-prone procedure. This is a consequence of the fact that the conventional smear exhibits uneven layering, crowding, and overlapping of cells. Furthermore, there exist variances in illumination and dye con- centration of the cells due to the staining procedure. Also, there are numerous variables, such as air drying, excessive blood, mucus, bacteria, or inflammation, which make the recognition of the suspicious cells a difficult task. Manuscript received March 22, 2010; revised July 7, 2010; accepted September 22, 2010. Date of publication October 14, 2010; date of current version March 4, 2011. M. E. Plissiti and C. Nikou are with the Department of Computer Science, University of Ioannina, Ioannina 45110, Greece (e-mail: [email protected]; [email protected]). A. Charchanti is with the Department of Anatomy-Histology and Embryology, Medical School, University of Ioannina, Ioannina 45110, Greece (e-mail: [email protected]). Color versions of one or more of the figures in this paper are available online at http://ieeexplore.ieee.org. Digital Object Identifier 10.1109/TITB.2010.2087030 The large number of cells and the variation in cell types each Pap smear image includes are also factors of complexity. There are generally three types of squamous cells seen on Pap smear images: 1) the superficial cells are the largest of the three and have small pyknotic nuclei and cytoplasm that generally stains eosinophilic (red); 2) the intermediate squamous cells, which are similar in appearance but are slightly smaller in size and have larger, clearly structured, round nuclei with cytoplasm that usually stains basophilic (blue); and 3) the parabasal cell type that is smaller, more rounded, and immature cell type. The prerequisite for any further processing of these images is the automated detection of cell nuclei, which presents significant changes when the cell is affected by a disease. In pathological situations, the nucleus may exhibit disproportionate enlarge- ment, irregularity in form and outline, hyperchromasia, or irreg- ular chromatin condensation. The identification and quantifica- tion of these changes in the nucleus morphology and density contribute in the discrimination of normal and abnormal cells. The first attempts to detect and segment cells in cervical microscopic images were based on image-thresholding tech- niques [2]. In addition, pixel classification was also proposed for the segmentation of cervical images [3]. Another class of methods concerns morphological watersheds for the separation of the cytoplasm and the nucleus of each cell [4], [5]. The bound- aries of the structuring elements of the cells can be obtained by employing methods based on active contours [6], template fit- ting [7], [8], genetic algorithms [9], region growing with moving K-means [10], and edge detectors [11], [12]. In Table I, the methods that have appeared in the literature for the segmentation of Pap smear images are presented. As it can be observed, many methods do not take advantage of the color information of the cervical images by converting the color image to its gray-scale counterpart [4], [6]–[12], and therefore, missing the color information. Also, the problem of overlap- ping cells is not considered in many methods, which identify the borders of the nucleus and the cytoplasm in cervical im- ages that contain only one cell or isolated cells [4], [6], [9], [11], [12]. Considering the general methods that these approaches are based on, we can conclude that the powerful techniques that the mathematical morphology provides for the image segmen- tation are not efficiently exploited. Even in the case, where mor- phological watersheds are used in [4] and [5], these methods seem to suffer from several limitations. The method proposed by Bamford and Lovell [4] was applied in gray-scale images of low resolution and results in the identification of the location 1089-7771/$26.00 © 2010 IEEE
-
Upload
phungtuyen -
Category
Documents
-
view
213 -
download
0
Transcript of IEEE TRANSACTIONS ON INFORMATION …cnikou/Publications/J17_Plissiti_Nikou...IEEE TRANSACTIONS ON...

IEEE TRANSACTIONS ON INFORMATION TECHNOLOGY IN BIOMEDICINE, VOL. 15, NO. 2, MARCH 2011 233
Automated Detection of Cell Nuclei in Pap SmearImages Using Morphological Reconstruction
and ClusteringMarina E. Plissiti, Christophoros Nikou, Member, IEEE, and Antonia Charchanti
Abstract—In this paper, we present a fully automated methodfor cell nuclei detection in Pap smear images. The locations of thecandidate nuclei centroids in the image are detected with mor-phological analysis and they are refined in a second step, whichincorporates a priori knowledge about the circumference of eachnucleus. The elimination of the undesirable artifacts is achievedin two steps: the application of a distance-dependent rule on theresulted centroids; and the application of classification algorithms.In our method, we have examined the performance of an unsuper-vised (fuzzy C-means) and a supervised (support vector machines)classification technique. In both classification techniques, the effectof the refinement step improves the performance of the clusteringalgorithm. The proposed method was evaluated using 38 cytologi-cal images of conventional Pap smears containing 5617 recognizedsquamous epithelial cells. The results are very promising, even inthe case of images with high degree of cell overlapping.
Index Terms—Cell nuclei detection, fuzzy C-means (FCM),morphological reconstruction, Pap smear images, support vectormachines (SVMs).
I. INTRODUCTION
THE CORRECT interpretation of the microscopic exami-nation of cells and tissues is crucial for the final diagnostic
decision for many diseases. One of the most interesting applica-tion fields of microscopic screening is the detection of precursorsof cancer in cell samples. Nowadays, the most eminent exampleis screening for cervical cancer in its early stages, through thewell-known Pap smear [1].
The visual interpretation of Pap smear images is a tedious,time consuming, and in many cases an error-prone procedure.This is a consequence of the fact that the conventional smearexhibits uneven layering, crowding, and overlapping of cells.Furthermore, there exist variances in illumination and dye con-centration of the cells due to the staining procedure. Also, thereare numerous variables, such as air drying, excessive blood,mucus, bacteria, or inflammation, which make the recognitionof the suspicious cells a difficult task.
Manuscript received March 22, 2010; revised July 7, 2010; acceptedSeptember 22, 2010. Date of publication October 14, 2010; date of currentversion March 4, 2011.
M. E. Plissiti and C. Nikou are with the Department of Computer Science,University of Ioannina, Ioannina 45110, Greece (e-mail: [email protected];[email protected]).
A. Charchanti is with the Department of Anatomy-Histology andEmbryology, Medical School, University of Ioannina, Ioannina 45110, Greece(e-mail: [email protected]).
Color versions of one or more of the figures in this paper are available onlineat http://ieeexplore.ieee.org.
Digital Object Identifier 10.1109/TITB.2010.2087030
The large number of cells and the variation in cell types eachPap smear image includes are also factors of complexity. Thereare generally three types of squamous cells seen on Pap smearimages: 1) the superficial cells are the largest of the three andhave small pyknotic nuclei and cytoplasm that generally stainseosinophilic (red); 2) the intermediate squamous cells, whichare similar in appearance but are slightly smaller in size andhave larger, clearly structured, round nuclei with cytoplasm thatusually stains basophilic (blue); and 3) the parabasal cell typethat is smaller, more rounded, and immature cell type.
The prerequisite for any further processing of these images isthe automated detection of cell nuclei, which presents significantchanges when the cell is affected by a disease. In pathologicalsituations, the nucleus may exhibit disproportionate enlarge-ment, irregularity in form and outline, hyperchromasia, or irreg-ular chromatin condensation. The identification and quantifica-tion of these changes in the nucleus morphology and densitycontribute in the discrimination of normal and abnormal cells.
The first attempts to detect and segment cells in cervicalmicroscopic images were based on image-thresholding tech-niques [2]. In addition, pixel classification was also proposedfor the segmentation of cervical images [3]. Another class ofmethods concerns morphological watersheds for the separationof the cytoplasm and the nucleus of each cell [4], [5]. The bound-aries of the structuring elements of the cells can be obtained byemploying methods based on active contours [6], template fit-ting [7], [8], genetic algorithms [9], region growing with movingK-means [10], and edge detectors [11], [12].
In Table I, the methods that have appeared in the literaturefor the segmentation of Pap smear images are presented. As itcan be observed, many methods do not take advantage of thecolor information of the cervical images by converting the colorimage to its gray-scale counterpart [4], [6]–[12], and therefore,missing the color information. Also, the problem of overlap-ping cells is not considered in many methods, which identifythe borders of the nucleus and the cytoplasm in cervical im-ages that contain only one cell or isolated cells [4], [6], [9],[11], [12].
Considering the general methods that these approaches arebased on, we can conclude that the powerful techniques thatthe mathematical morphology provides for the image segmen-tation are not efficiently exploited. Even in the case, where mor-phological watersheds are used in [4] and [5], these methodsseem to suffer from several limitations. The method proposedby Bamford and Lovell [4] was applied in gray-scale images oflow resolution and results in the identification of the location
1089-7771/$26.00 © 2010 IEEE
234 IEEE TRANSACTIONS ON INFORMATION TECHNOLOGY IN BIOMEDICINE, VOL. 15, NO. 2, MARCH 2011
TABLE IADVANTAGES AND LIMITATIONS OF STATE OF THE ART METHODS FOR PAP SMEAR CELL NUCLEI DETERMINATION
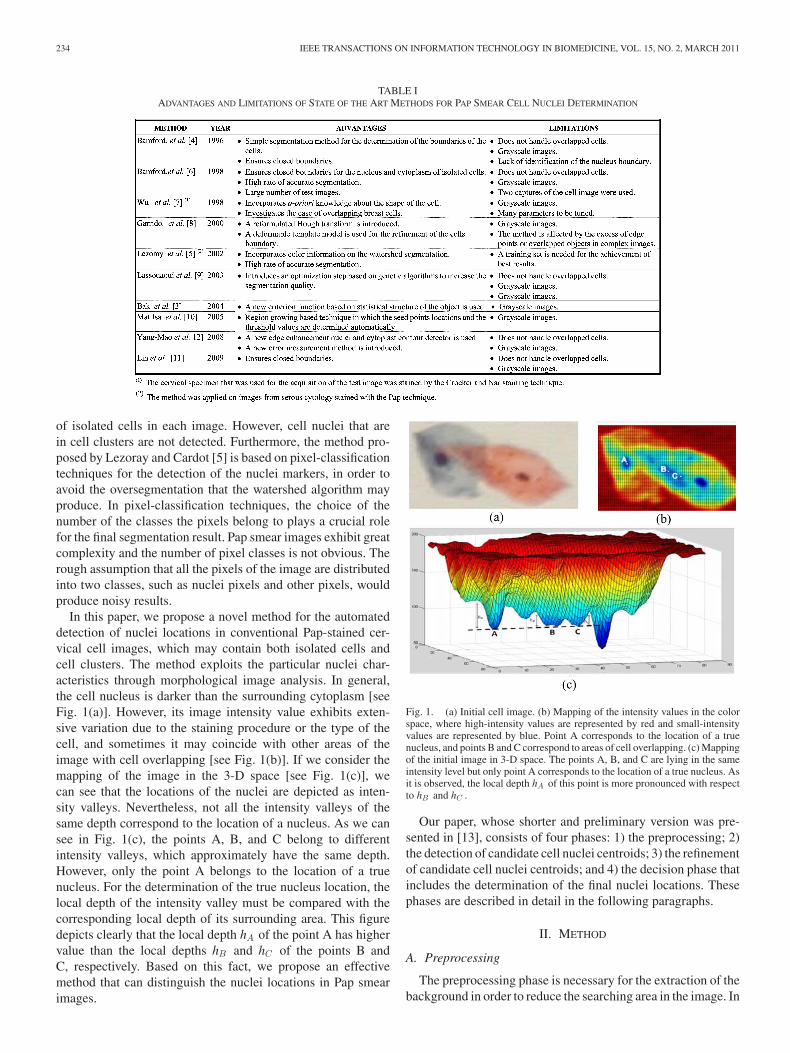
of isolated cells in each image. However, cell nuclei that arein cell clusters are not detected. Furthermore, the method pro-posed by Lezoray and Cardot [5] is based on pixel-classificationtechniques for the detection of the nuclei markers, in order toavoid the oversegmentation that the watershed algorithm mayproduce. In pixel-classification techniques, the choice of thenumber of the classes the pixels belong to plays a crucial rolefor the final segmentation result. Pap smear images exhibit greatcomplexity and the number of pixel classes is not obvious. Therough assumption that all the pixels of the image are distributedinto two classes, such as nuclei pixels and other pixels, wouldproduce noisy results.
In this paper, we propose a novel method for the automateddetection of nuclei locations in conventional Pap-stained cer-vical cell images, which may contain both isolated cells andcell clusters. The method exploits the particular nuclei char-acteristics through morphological image analysis. In general,the cell nucleus is darker than the surrounding cytoplasm [seeFig. 1(a)]. However, its image intensity value exhibits exten-sive variation due to the staining procedure or the type of thecell, and sometimes it may coincide with other areas of theimage with cell overlapping [see Fig. 1(b)]. If we consider themapping of the image in the 3-D space [see Fig. 1(c)], wecan see that the locations of the nuclei are depicted as inten-sity valleys. Nevertheless, not all the intensity valleys of thesame depth correspond to the location of a nucleus. As we cansee in Fig. 1(c), the points A, B, and C belong to differentintensity valleys, which approximately have the same depth.However, only the point A belongs to the location of a truenucleus. For the determination of the true nucleus location, thelocal depth of the intensity valley must be compared with thecorresponding local depth of its surrounding area. This figuredepicts clearly that the local depth hA of the point A has highervalue than the local depths hB and hC of the points B andC, respectively. Based on this fact, we propose an effectivemethod that can distinguish the nuclei locations in Pap smearimages.
Fig. 1. (a) Initial cell image. (b) Mapping of the intensity values in the colorspace, where high-intensity values are represented by red and small-intensityvalues are represented by blue. Point A corresponds to the location of a truenucleus, and points B and C correspond to areas of cell overlapping. (c) Mappingof the initial image in 3-D space. The points A, B, and C are lying in the sameintensity level but only point A corresponds to the location of a true nucleus. Asit is observed, the local depth hA of this point is more pronounced with respectto hB and hC .
Our paper, whose shorter and preliminary version was pre-sented in [13], consists of four phases: 1) the preprocessing; 2)the detection of candidate cell nuclei centroids; 3) the refinementof candidate cell nuclei centroids; and 4) the decision phase thatincludes the determination of the final nuclei locations. Thesephases are described in detail in the following paragraphs.
II. METHOD
A. Preprocessing
The preprocessing phase is necessary for the extraction of thebackground in order to reduce the searching area in the image. In
PLISSITI et al.: AUTOMATED DETECTION OF CELL NUCLEI IN PAP SMEAR IMAGES USING MORPHOLOGICAL RECONSTRUCTION 235
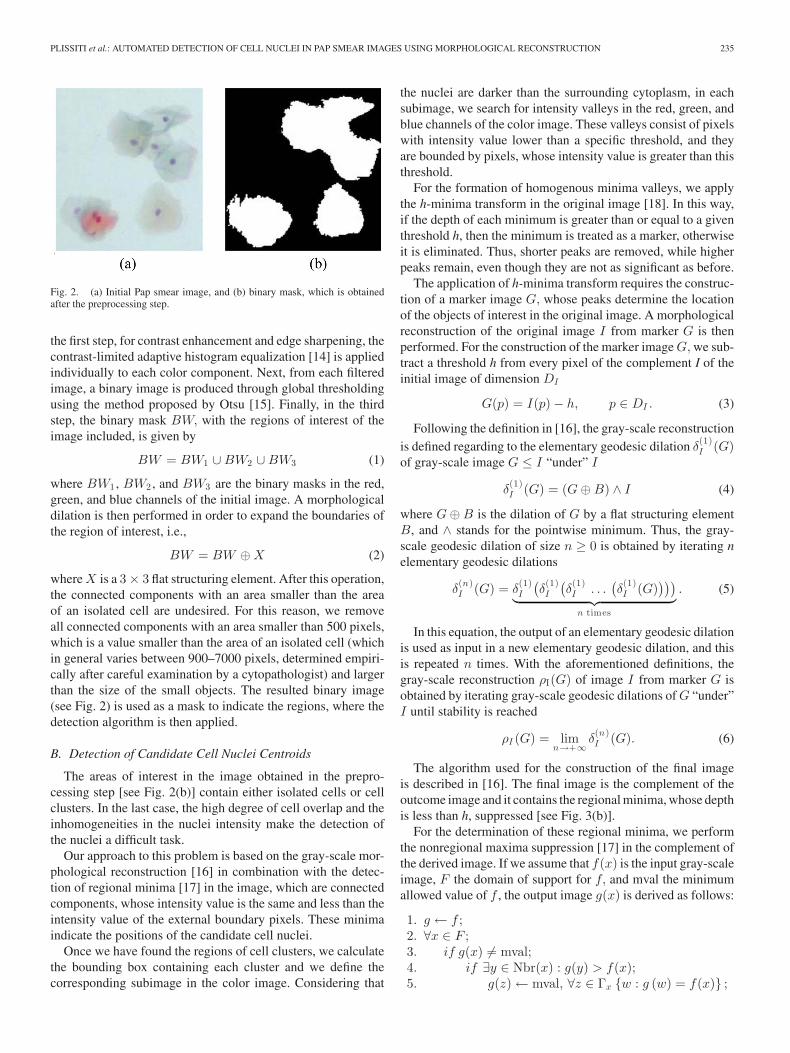
Fig. 2. (a) Initial Pap smear image, and (b) binary mask, which is obtainedafter the preprocessing step.
the first step, for contrast enhancement and edge sharpening, thecontrast-limited adaptive histogram equalization [14] is appliedindividually to each color component. Next, from each filteredimage, a binary image is produced through global thresholdingusing the method proposed by Otsu [15]. Finally, in the thirdstep, the binary mask BW, with the regions of interest of theimage included, is given by
BW = BW1 ∪ BW2 ∪ BW3 (1)
where BW1 , BW2 , and BW3 are the binary masks in the red,green, and blue channels of the initial image. A morphologicaldilation is then performed in order to expand the boundaries ofthe region of interest, i.e.,
BW = BW ⊕ X (2)
where X is a 3 × 3 flat structuring element. After this operation,the connected components with an area smaller than the areaof an isolated cell are undesired. For this reason, we removeall connected components with an area smaller than 500 pixels,which is a value smaller than the area of an isolated cell (whichin general varies between 900–7000 pixels, determined empiri-cally after careful examination by a cytopathologist) and largerthan the size of the small objects. The resulted binary image(see Fig. 2) is used as a mask to indicate the regions, where thedetection algorithm is then applied.
B. Detection of Candidate Cell Nuclei Centroids
The areas of interest in the image obtained in the prepro-cessing step [see Fig. 2(b)] contain either isolated cells or cellclusters. In the last case, the high degree of cell overlap and theinhomogeneities in the nuclei intensity make the detection ofthe nuclei a difficult task.
Our approach to this problem is based on the gray-scale mor-phological reconstruction [16] in combination with the detec-tion of regional minima [17] in the image, which are connectedcomponents, whose intensity value is the same and less than theintensity value of the external boundary pixels. These minimaindicate the positions of the candidate cell nuclei.
Once we have found the regions of cell clusters, we calculatethe bounding box containing each cluster and we define thecorresponding subimage in the color image. Considering that
the nuclei are darker than the surrounding cytoplasm, in eachsubimage, we search for intensity valleys in the red, green, andblue channels of the color image. These valleys consist of pixelswith intensity value lower than a specific threshold, and theyare bounded by pixels, whose intensity value is greater than thisthreshold.
For the formation of homogenous minima valleys, we applythe h-minima transform in the original image [18]. In this way,if the depth of each minimum is greater than or equal to a giventhreshold h, then the minimum is treated as a marker, otherwiseit is eliminated. Thus, shorter peaks are removed, while higherpeaks remain, even though they are not as significant as before.
The application of h-minima transform requires the construc-tion of a marker image G, whose peaks determine the locationof the objects of interest in the original image. A morphologicalreconstruction of the original image I from marker G is thenperformed. For the construction of the marker image G, we sub-tract a threshold h from every pixel of the complement I of theinitial image of dimension DI
G(p) = I(p) − h, p ∈ DI . (3)
Following the definition in [16], the gray-scale reconstructionis defined regarding to the elementary geodesic dilation δ
(1)I (G)
of gray-scale image G ≤ I “under” I
δ(1)I (G) = (G ⊕ B) ∧ I (4)
where G ⊕ B is the dilation of G by a flat structuring elementB, and ∧ stands for the pointwise minimum. Thus, the gray-scale geodesic dilation of size n ≥ 0 is obtained by iterating nelementary geodesic dilations
δ(n)I (G) = δ
(1)I
(δ
(1)I
(δ
(1)I . . .
(δ
(1)I (G)
)))
︸ ︷︷ ︸n times
. (5)
In this equation, the output of an elementary geodesic dilationis used as input in a new elementary geodesic dilation, and thisis repeated n times. With the aforementioned definitions, thegray-scale reconstruction ρI(G) of image I from marker G isobtained by iterating gray-scale geodesic dilations of G “under”I until stability is reached
ρI (G) = limn→+∞
δ(n)I (G). (6)
The algorithm used for the construction of the final imageis described in [16]. The final image is the complement of theoutcome image and it contains the regional minima, whose depthis less than h, suppressed [see Fig. 3(b)].
For the determination of these regional minima, we performthe nonregional maxima suppression [17] in the complement ofthe derived image. If we assume that f(x) is the input gray-scaleimage, F the domain of support for f, and mval the minimumallowed value of f , the output image g(x) is derived as follows:
1. g ← f ;2. ∀x ∈ F ;3. if g(x) �= mval;4. if ∃y ∈ Nbr(x) : g(y) > f(x);5. g(z) ← mval, ∀z ∈ Γx {w : g (w) = f(x)} ;
236 IEEE TRANSACTIONS ON INFORMATION TECHNOLOGY IN BIOMEDICINE, VOL. 15, NO. 2, MARCH 2011
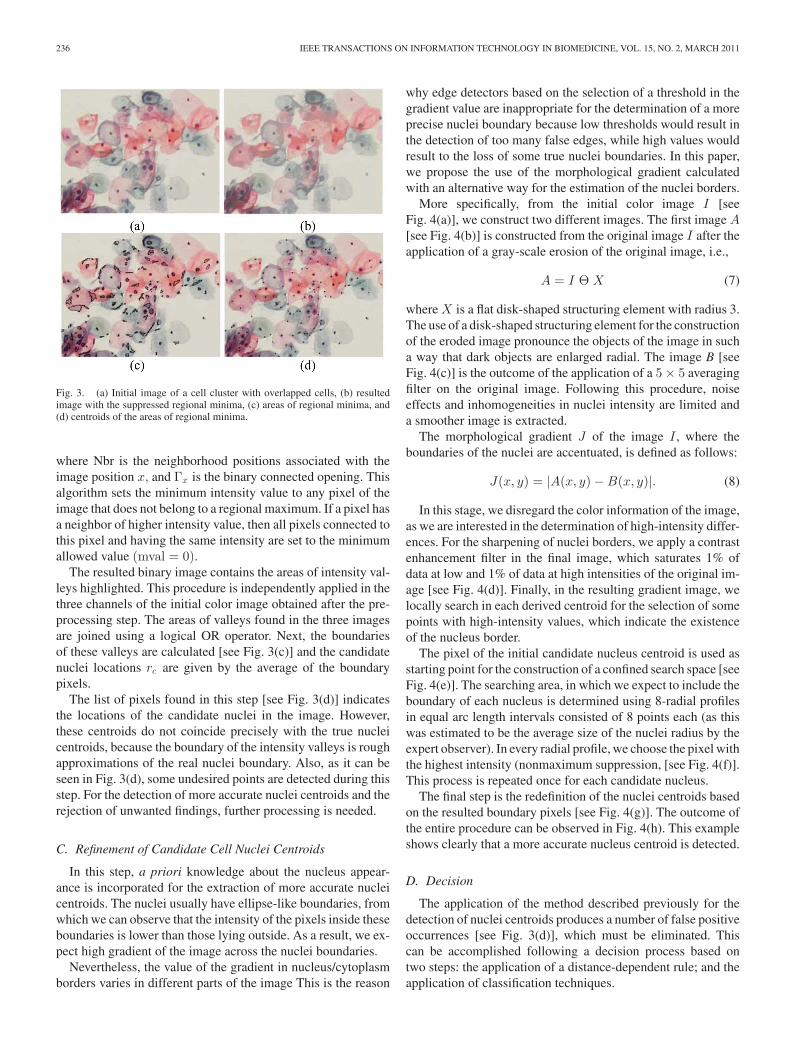
Fig. 3. (a) Initial image of a cell cluster with overlapped cells, (b) resultedimage with the suppressed regional minima, (c) areas of regional minima, and(d) centroids of the areas of regional minima.
where Nbr is the neighborhood positions associated with theimage position x, and Γx is the binary connected opening. Thisalgorithm sets the minimum intensity value to any pixel of theimage that does not belong to a regional maximum. If a pixel hasa neighbor of higher intensity value, then all pixels connected tothis pixel and having the same intensity are set to the minimumallowed value (mval = 0).
The resulted binary image contains the areas of intensity val-leys highlighted. This procedure is independently applied in thethree channels of the initial color image obtained after the pre-processing step. The areas of valleys found in the three imagesare joined using a logical OR operator. Next, the boundariesof these valleys are calculated [see Fig. 3(c)] and the candidatenuclei locations rc are given by the average of the boundarypixels.
The list of pixels found in this step [see Fig. 3(d)] indicatesthe locations of the candidate nuclei in the image. However,these centroids do not coincide precisely with the true nucleicentroids, because the boundary of the intensity valleys is roughapproximations of the real nuclei boundary. Also, as it can beseen in Fig. 3(d), some undesired points are detected during thisstep. For the detection of more accurate nuclei centroids and therejection of unwanted findings, further processing is needed.
C. Refinement of Candidate Cell Nuclei Centroids
In this step, a priori knowledge about the nucleus appear-ance is incorporated for the extraction of more accurate nucleicentroids. The nuclei usually have ellipse-like boundaries, fromwhich we can observe that the intensity of the pixels inside theseboundaries is lower than those lying outside. As a result, we ex-pect high gradient of the image across the nuclei boundaries.
Nevertheless, the value of the gradient in nucleus/cytoplasmborders varies in different parts of the image This is the reason
why edge detectors based on the selection of a threshold in thegradient value are inappropriate for the determination of a moreprecise nuclei boundary because low thresholds would result inthe detection of too many false edges, while high values wouldresult to the loss of some true nuclei boundaries. In this paper,we propose the use of the morphological gradient calculatedwith an alternative way for the estimation of the nuclei borders.
More specifically, from the initial color image I [seeFig. 4(a)], we construct two different images. The first image A[see Fig. 4(b)] is constructed from the original image I after theapplication of a gray-scale erosion of the original image, i.e.,
A = I Θ X (7)
where X is a flat disk-shaped structuring element with radius 3.The use of a disk-shaped structuring element for the constructionof the eroded image pronounce the objects of the image in sucha way that dark objects are enlarged radial. The image B [seeFig. 4(c)] is the outcome of the application of a 5 × 5 averagingfilter on the original image. Following this procedure, noiseeffects and inhomogeneities in nuclei intensity are limited anda smoother image is extracted.
The morphological gradient J of the image I , where theboundaries of the nuclei are accentuated, is defined as follows:
J(x, y) = |A(x, y) − B(x, y)|. (8)
In this stage, we disregard the color information of the image,as we are interested in the determination of high-intensity differ-ences. For the sharpening of nuclei borders, we apply a contrastenhancement filter in the final image, which saturates 1% ofdata at low and 1% of data at high intensities of the original im-age [see Fig. 4(d)]. Finally, in the resulting gradient image, welocally search in each derived centroid for the selection of somepoints with high-intensity values, which indicate the existenceof the nucleus border.
The pixel of the initial candidate nucleus centroid is used asstarting point for the construction of a confined search space [seeFig. 4(e)]. The searching area, in which we expect to include theboundary of each nucleus is determined using 8-radial profilesin equal arc length intervals consisted of 8 points each (as thiswas estimated to be the average size of the nuclei radius by theexpert observer). In every radial profile, we choose the pixel withthe highest intensity (nonmaximum suppression, [see Fig. 4(f)].This process is repeated once for each candidate nucleus.
The final step is the redefinition of the nuclei centroids basedon the resulted boundary pixels [see Fig. 4(g)]. The outcome ofthe entire procedure can be observed in Fig. 4(h). This exampleshows clearly that a more accurate nucleus centroid is detected.
D. Decision
The application of the method described previously for thedetection of nuclei centroids produces a number of false positiveoccurrences [see Fig. 3(d)], which must be eliminated. Thiscan be accomplished following a decision process based ontwo steps: the application of a distance-dependent rule; and theapplication of classification techniques.

PLISSITI et al.: AUTOMATED DETECTION OF CELL NUCLEI IN PAP SMEAR IMAGES USING MORPHOLOGICAL RECONSTRUCTION 237
Fig. 4. Illustration of the different steps of the refinement procedure. (a) Initial image, (b) eroded image, (c) filtered image, (d) contrast enhanced image of thedifference of images (b) and (c), (e) construction of the search space, (f) determination of pixels in the nucleus circumference by selecting the local maxima of thegradient amplitude, (g) the resulted nucleus contour, and (h) the initial (black cross) and the refined (white circle) centroids of the nucleus.
Fig. 5. (a) Initial image with the detected centroids depicted with an “x”.(b) Result of the distance-depended rule. (c) Result of the FCM, where thepositive (true nuclei) class is depicted with “+” and the negative class (otherfindings) with “o”. (d) Resulted centroids of the positive class.
1) Application of the Distance-Dependent Rule: It is ob-served that a lot of extracted points are located in small distancesbetween them. Even in the case of one single nucleus, the exis-tence of more than one candidate centroid is possible, and thesecandidates are generally spread into the nucleus circumference[see Fig. 5(a)]. For this reason, for all the obtained centroids,we apply the following rule:
repeat
∀ p = (x, y) ∈ Rc
if exists q = {(xq , yq ) |D (p, q) ≤ T}select r = {p, q|min {I(p), I (q)}}updateRc
until no change in Rc
where Rc is the set of all centroids, D is the Euclidean distancebetween two points, T is the threshold on the minimum distance,and I(p) is the intensity of the image at point p. The thresholdfor the minimum distance that we use is derived from the priorknowledge we have about the true diameter of a nucleus. Byapplying this rule, we have a significant reduction of the total
number of the resulted centroids, while at the same time, wehave no loss of the true nuclei [see Fig. 5(b)].
2) Application of Classification/Clustering Techniques: Inthe final set of the candidate nuclei centroids, we proceed withthe application of classification algorithms for the separationof the points of true nuclei and the points that belong to otherregional minima. We have tested our method using an unsu-pervised and a supervised classification algorithm, namely thefuzzy C-means (FCM) [19] and the support vector machine(SVM) [20], respectively. Given the fact that the FCM algo-rithm does not require any training, it is independently appliedin each image. Representative results of the FCM clusteringalgorithm in the real image are shown in Fig. 5(c)–(d).
For the application of the SVM classification algorithm, atraining data set is constructed by random selection of 34 im-ages from the entire data set. The remaining four images areused as test set. This experiment was repeated 20 times, eachtime using a different (randomly selected) training set. Aftertraining, the performance of the SVM classifier is calculatedusing the unknown images of the test set. It must be noted thatin our experiments, we have used the linear and the radial basisfunction (RBF) kernels.
3) Feature Vectors: For the definition of the set of nucleipatterns, we have used the intensity information of the neigh-borhood of the centroids. We have tested the performance ofour method using four pattern sets of different sizes for theneighborhood, that is D1 with 3 × 3 × 3 pattern size, D2 with5 × 5 × 3 pattern size, D3 with 7 × 7 × 3 pattern size, and D4with 9 × 9 × 3 pattern size (the third dimension correspondsto the color). Each pattern was centered at each centroid in theinitial color image. We have constructed two data sets of pat-terns using as the center of the neighborhood the initial and therefined centroids, respectively.
III. RESULTS
A. Study Group
Our data set is composed by 38 conventional Pap-stainedcervical cell images from 15 different Pap smear slides, acquiredthrough a CCD camera (Olympus DP71) adapted to an opticalmicroscope (Olympus BX51) using a 10× magnification lens.The size of the images is 1536 × 2048 and they were stored inJPEG format. The total number of cell nuclei in the images is5617. In order to obtain the ground truth, the nuclei locationswere manually identified by two expert cytopathologists. The

238 IEEE TRANSACTIONS ON INFORMATION TECHNOLOGY IN BIOMEDICINE, VOL. 15, NO. 2, MARCH 2011
TABLE IIEXECUTION TIME OF THE PROPOSED METHOD FOR IMAGES OF SIZE 1536 ×
2048
Fig. 6. Rate of the true positives (true nuclei centroids detected) and falsepositives for different thresholds in regional minima depth.
types of the existed cell nuclei are all the aforementioned inSection I, and there also exist some abnormal nuclei.
B. Numerical Evaluation
For the evaluation of the performance of the method, wehave to examine the performance of the different steps of themethod. Furthermore, as a measure of the computational effi-ciency of the segmentation method, we present in Table II theprocessing times of the individual steps of the method developedin MATLAB using a Pentium 2.0 GHz with 3 GB RAM.
The preprocessing is a fast procedure that results in the de-termination of the parts of the image containing isolated cellsor cell clusters. It misses nine cell nuclei in all images and itproduces a reduction of true positives cell nuclei of 0.16% of thetotal initial number of nuclei. The loss of this step is mainly dueto the existence of some faintly stained cell cytoplasms, whichare not distinguishable from the background. Thus, the nucleusis removed, as it is considered to be an isolated object.
The detection step of the cell nuclei centroids successfullyidentifies most of the nuclei in the image. In this step, 42 truenuclei are missed and the true nuclei detection rate is 99.25%.For the choice of the threshold of the depth of the intensityvalleys, we have performed several tests, and as it is depicted inFig. 6, with the threshold value of 15, we obtain the maximumnumber of true nuclei centroids detected.
The distance-dependent rule on the refined nuclei centroidsyields in the reduction of false positive findings at the rate of14.13%, while we have no loss of true nuclei centroids. Thisrate could be higher if we select a distance threshold higher than8 pixels. However, with a selection of a higher value for thisthreshold, true nuclei centroids are missed, as it can be observedin Fig. 7. It must be noted that if we omit this step, there willbe some centroids, which belong to the same nucleus and theywill introduce interference in the clustering step. For instance,
Fig. 7. ROC curve used for the threshold selection in distance-depended rule.
if they are classified in the same class (e.g., the nuclei class),we will not be able to compute the number of true detectednuclei, since one single detected nucleus will be counted twice.Furthermore, if they are assigned to different classes, then onecentroid will be counted as true positive and the other one as falsenegative. This would be wrong since both belong to the samenucleus.
For the application of the classification algorithms, we haveused two data sets, as it is already described. In FCM algo-rithm, we have used the Euclidean and the diagonal norm asthe distance-dependent metric. The Euclidean norm betweenvectors u and v of dimension N, is defined by DEuc(u, v) =√
(u − v)T (u − v). Respectively, the diagonal norm is definedby DDiag =
√(u − v)T AD (u − v),where AD is a diagonal
matrix containing the standard deviations of the vectors. Fur-thermore, the SVM classifier leads to the selection of some tensof support vectors, depending on the type of kernel, the data set,and the dimensions of the patterns that we use.
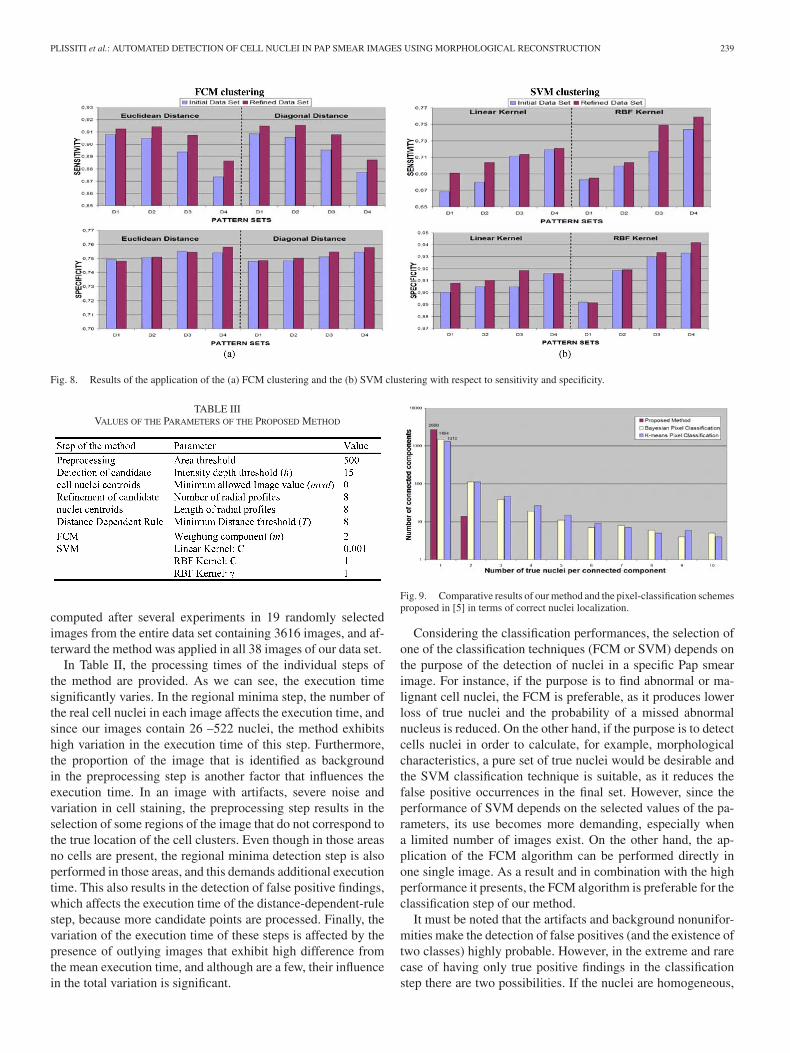
For the comparison of the results, we have calculated twowidely used statistical measures, the sensitivity and the speci-ficity (our images are annotated, and the true positive and falsepositive findings are automatically determined). As it is depictedin Fig. 8(a) and (b), the FCM has higher sensitivity rate than theSVM, which means that fewer true nuclei are missed. How-ever, the specificity of FCM is low relatively to SVM, whichmeans that FCM includes a lot of false positive centroids inthe final set of the points characterized as nuclei centroids bythe algorithm. On the contrary, the sensitivity of the SVM clas-sification is relatively low, namely, it misses more true nucleicentroids. Nevertheless, it presents high specificity rate, whichmeans that in the final set of points characterized as nuclei,the false positives are limited. An important fact that must benoted is that in both FCM and SVM, the use of the refinedcentroid data set leads to a better classification performance.This is explained by the fact that the refined centroids are closerto the true nuclei centroids and the produced patterns containmore representative features of the nuclei, which results in theimprovement of the discrimination ability of the classificationtechniques.
IV. DISCUSSION
The proposed method is fully automated and its applicationwas performed without any observer interference. The param-eters of the several steps of the method (see Table III) were
PLISSITI et al.: AUTOMATED DETECTION OF CELL NUCLEI IN PAP SMEAR IMAGES USING MORPHOLOGICAL RECONSTRUCTION 239
Fig. 8. Results of the application of the (a) FCM clustering and the (b) SVM clustering with respect to sensitivity and specificity.
TABLE IIIVALUES OF THE PARAMETERS OF THE PROPOSED METHOD
computed after several experiments in 19 randomly selectedimages from the entire data set containing 3616 images, and af-terward the method was applied in all 38 images of our data set.
In Table II, the processing times of the individual steps ofthe method are provided. As we can see, the execution timesignificantly varies. In the regional minima step, the number ofthe real cell nuclei in each image affects the execution time, andsince our images contain 26 –522 nuclei, the method exhibitshigh variation in the execution time of this step. Furthermore,the proportion of the image that is identified as backgroundin the preprocessing step is another factor that influences theexecution time. In an image with artifacts, severe noise andvariation in cell staining, the preprocessing step results in theselection of some regions of the image that do not correspond tothe true location of the cell clusters. Even though in those areasno cells are present, the regional minima detection step is alsoperformed in those areas, and this demands additional executiontime. This also results in the detection of false positive findings,which affects the execution time of the distance-dependent-rulestep, because more candidate points are processed. Finally, thevariation of the execution time of these steps is affected by thepresence of outlying images that exhibit high difference fromthe mean execution time, and although are a few, their influencein the total variation is significant.
Fig. 9. Comparative results of our method and the pixel-classification schemesproposed in [5] in terms of correct nuclei localization.
Considering the classification performances, the selection ofone of the classification techniques (FCM or SVM) depends onthe purpose of the detection of nuclei in a specific Pap smearimage. For instance, if the purpose is to find abnormal or ma-lignant cell nuclei, the FCM is preferable, as it produces lowerloss of true nuclei and the probability of a missed abnormalnucleus is reduced. On the other hand, if the purpose is to detectcells nuclei in order to calculate, for example, morphologicalcharacteristics, a pure set of true nuclei would be desirable andthe SVM classification technique is suitable, as it reduces thefalse positive occurrences in the final set. However, since theperformance of SVM depends on the selected values of the pa-rameters, its use becomes more demanding, especially whena limited number of images exist. On the other hand, the ap-plication of the FCM algorithm can be performed directly inone single image. As a result and in combination with the highperformance it presents, the FCM algorithm is preferable for theclassification step of our method.
It must be noted that the artifacts and background nonunifor-mities make the detection of false positives (and the existence oftwo classes) highly probable. However, in the extreme and rarecase of having only true positive findings in the classificationstep there are two possibilities. If the nuclei are homogeneous,

240 IEEE TRANSACTIONS ON INFORMATION TECHNOLOGY IN BIOMEDICINE, VOL. 15, NO. 2, MARCH 2011
TABLE IVCOMPARISON OF THE PROPOSED METHOD AND OTHER METHODS APPEARED IN THE LITERATURE
they will be assigned to the same class. If the nuclei exhibitdissimilarities, then they would be split into two classes. More-over, in practice, the true positive class should be indicated bythe user at the end of the procedure.
We have also compared our method with the detection meth-ods proposed by the state of the art technique of Lezoray andCardot [5], which is based on the k-means clustering algo-rithm and a Bayesian pixel-classification scheme. Following theprinciples in [5], these schemes classify each pixel of the im-ages (with the background removed) as “nuclei” or “cytoplasm”pixel.
All the parameters of the mixture of Gaussian distributionswere calculated on a training set of color vectors from randomlyselected images of our data set (50% of the images). Then, theBayesian classifier was applied in the remaining images. Thisexperiment was repeated five times, each time with a different(randomly selected) training set.
The outcome of both pixel-classification schemes are con-nected components of probable nuclei locations and they arecompared with the outcome of the detection of regional minimastep in terms of how many true nuclei centroids were recognized.The expected results would be the detection of one nucleus perconnected component. Thus, the desirable performance of eachmethod is a high number of connected components containingonly one nucleus. In Fig. 9, we can observe the average num-ber of the detected connected components, over the test sets ofimages, which were recognized by the compared methods. Aswe can see, our method is superior to the pixel-classificationschemes, since it produces more single connected components,which contain only one nucleus. Let us also notice that the verti-cal axis in Fig. 9 has a logarithmic scale making the differencesin performance more pronounced.
Beyond the comparison of our method with pixel-classification schemes, Table IV shows a comparison of ourmethod and other methods appeared in the literature. In gen-eral, it is difficult to compare the methods directly since manyof them do not include quantitative results and the performancecriteria extensively vary. Furthermore, some data parameters are
not clearly defined, which are important for the evaluation ofthe general behavior of each method.
From Table IV, we can assert that our method is superior forseveral reasons. First, the data set that was used includes imagescaptured from 15 different Pap smear slides, which evince thatthe data set contains a big variety of different cells, and theobtained results describe more precisely the general behavior ofthe method and the expected performance in a new image. Also,the proposed method can be applied in images captured directlyfrom an optical microscope and is able to successfully recognizethe cells nuclei, even in cases, where cell overlapping is present.Moreover, the average number of cells nuclei in these imagesis 148, and they are clearly more complicated than the imagescontaining only isolated cells, such as in [4], [6], [9], [11],and [12].
In terms of the general image-processing approach, themethod exploits the color information of the image, in contraryto the techniques in [4], and [6]–[12]. This is advantageous,since the staining process of the smear has different effects inthe three-color components of the image and some nuclei aremore distinguishable in a single-color channel. The use of threedifferent thresholds (one for each color channel) in the Otsu’smethod in the preprocessing step is more effective than the useof one single threshold in the gray-scale image. Furthermore,the detection of the intensity valleys in the three channels ofa color image and the merge of the detected regions in a finalimage results in the determination of more true nuclei locations,rather than the detection of the intensity valleys in the gray-scaleimage. As we can see in Fig. 10, both the preprocessing and theregional minima step fail to recognize the same number of thetrue nuclei in the gray-scale image. The individual processing ofeach color component and the combination of the results leadsin no loss of information. However, an issue that must be solvedin the future is the recognition of clustered and abnormal nuclei.
V. CONCLUSION
The task of identifying the cell nuclei in conventional Papsmear images is a challenging issue. We have developed a

PLISSITI et al.: AUTOMATED DETECTION OF CELL NUCLEI IN PAP SMEAR IMAGES USING MORPHOLOGICAL RECONSTRUCTION 241
Fig. 10. (a) Initial image. (b) Result of the preprocessing step (denoted withthe black line) in the color image. (c) Corresponding result in the gray-scaleimage. (d) Part of the initial image (e) Result of the detection of regional minimastep (denoted with white lines) in the color image. (f) Corresponding result inthe gray-scale image. The missed nuclei in the gray-scale images are markedwith the arrows in both cases.
robust and accurate method for the automated identificationof the cells nuclei, which can be used as the basis for furtherprocessing of cell images. As our image data set derives fromdifferent Pap smear slides, the method is expected to presenthigh performance, when it is applied in a new Pap smear image.The major advantage of the proposed method is that it is fullyautomated and it is suitable for images with high degree of celloverlapping, as it can successfully detect not only the nuclei ofisolated cells, but also the nuclei in cell clusters.
REFERENCES
[1] G. N. Papanicolaou, “A new procedure for staining vaginal smears,” Sci-ence, vol. 95, no. 2469, pp. 438–439, 1942.
[2] H. S. Wu, J. Gil, and J. Barba, “Optimal segmentation of cell images,”IEE Proc. Vis., Image Signal Process., vol. 145, no. 1, pp. 50–56, Feb.1998.
[3] E. Bak, K. Najarian, and J. P. Brockway, “Efficient segmentation frame-work of cell images in noise environments,” in Proc. 26th Int. Conf. IEEEEng. Med. Biol., Sep., 2004, vol. 1, pp. 1802–1805.
[4] P. Bamford and B. Lovell, “A water immersion algorithm for cytologi-cal image segmentation,” in Proc. APRS Image Segmentation Workshop,Sydney, Australia, 1996, pp. 75–79.
[5] O. Lezoray and H. Cardot, “Cooperation of color pixel classificationschemes and color watershed: A study for microscopic images,” IEEETrans. Image Process., vol. 11, no. 7, pp. 783–789, Jul. 2002.
[6] P. Bamford and B. Lovell, “Unsupervised cell nucleus segmentation withactive contours,” Signal Process., vol. 71, no. 2, pp. 203–213, 1998.
[7] H. S. Wu, J. Barba, and J. Gil, “A parametric fitting algorithm for seg-mentation of cell images,” IEEE Trans. Biomed. Eng., vol. 45, no. 3,pp. 400–407, Mar. 1998.
[8] A. Garrido and N. P. de la Blanca, “Applying deformable templates forcell image segmentation,” Pattern Recognit., vol. 33, no. 5, pp. 821–832,2000.
[9] N. Lassouaoui and L. Hamami, “Genetic algorithms and multifractal seg-mentation of cervical cell images,” in Proc. 7th Int. Symp. Signal Process.Appl., 2003, vol. 2, pp. 1–4.
[10] N. A. Mat Isa, “Automated edge detection technique for Pap smear imagesusing moving K-means clustering and modified seed based region growingalgorithm,” Int. J. Comput. Internet Manag., vol. 13, no. 3, pp. 45–59,2005.
[11] C. H. Lin, Y. K. Chan, and C. C. Chen, “Detection and segmentation ofcervical cell cytoplast and nucleus,” Int. J. Imaging Syst. Technol., vol. 19,no. 3, pp. 260–270, 2009.
[12] S. F. Yang-Mao, Y. K. Chan, and Y. P. Chu, “Edge enhancement nucleusand cytoplast contour detector of cervical smear images,” IEEE Trans.Syst. Man Cybern. B, Cybern., vol. 38, no. 2, pp. 353–366, Apr. 2008.
[13] M. E. Plissiti, E. E. Tripoliti, A. Charchanti, O. Krikoni, and D. Fotiadis,“Automated detection of cell nuclei in Pap stained smear images usingfuzzy clustering,” in Proc. 4th Eur. Congr. Med. Biomed. Eng., 2008,vol. 22, pp. 637–641.
[14] K. Zuiderveld, “Contrast limited adaptive histogram equalization,” inGraphics Gems IV. San Diego, CA: Academic, 1994, pp. 474–485.
[15] N. Otsu, “A threshold selection method from gray-level histograms,”IEEE Trans. Syst. Man Cybern., vol. SMC-9, no. 1, pp. 62–66, Jan. 1979.
[16] L. Vincent, “Morphological grayscale reconstruction in image analysis:Applications and efficient algorithms,” IEEE Trans. Image Process.,vol. 2, no. 2, pp. 176–201, Apr. 1993.
[17] E. J. Breen and R. Jones, “Attribute openings, thinning, and granulome-tries,” Comput. Vis. Image Understanding, vol. 64, no. 3, pp. 377–389,1996.
[18] P. Soille, Morphological Image Analysis: Principles and Applications.New York: Springer-Verlag, 1999.
[19] J. C. Bezdek and S. K. Pal, Fuzzy Models for Pattern Recognition.New York: IEEE Press, 1992.
[20] N. Christianini and J. S. Taylor, Support Vector Machines and OtherKernel-Based Methods. Cambridge, U.K.: Cambridge Univ. Press,2000.
Marina E. Plissiti received the B.Sc. and M.Sc. de-grees from the Department of Computer Science,University of Ioannina, Greece, in 1998 and 2001, re-spectively. She is currently working toward the Ph.D.degree in the same Department.
Since 2001 she is a Secondary School Teacher. Herresearch interests include medical image processingand artificial intelligence in biomedical applications.
Christophoros Nikou received the Diploma in elec-trical engineering from the Aristotle University ofThessaloniki, Greece, in 1994 and the DEA and Ph.D.degrees in image processing and computer visionfrom Louis Pasteur University, Strasbourg, France,in 1995 and 1999, respectively.
During 2001, he was a Senior Researcher with theDepartment of Informatics, Aristotle University ofThessaloniki. From 2002 to 2004, he was with Com-pucon S.A., Thessaloniki. Since 2004, he is with theDepartment of Computer Science, University of Ioan-
nina, Greece where he was a Lecturer (2004-2009) and since 2009, he has beenan Assistant Professor. His research interests mainly include image processingand computer vision and their application to medical imaging.
Antonia Charchanti, photograph and biography not available at the time ofpublication.