IEEE TRANSACTIONS ON DEPENDABLE AND … Joomla are more likely to be hacked than those not running...
13
IEEE TRANSACTIONS ON DEPENDABLE AND SECURE COMPUTING (IN SUBMISSION) 1 Hacking is not random: a case-control study of webserver-compromise risk Marie Vasek, John Wadleigh, Tyler Moore Abstract—We describe a case-control study to identify risk factors that are associated with higher rates of webserver compromise. We inspect a random sample of around 200 000 webservers and automatically identify attributes hypothesized to affect the susceptibility to compromise, notably content management system (CMS) and webserver type. We then cross-list this information with data on webservers hacked to serve phishing pages or redirect to unlicensed online pharmacies. We find that webservers running WordPress and Joomla are more likely to be hacked than those not running any CMS, and that servers running Apache and Nginx are more likely to be hacked than those running Microsoft IIS. We also identify several WordPress plugins and Joomla extensions that associated with compromise. Furthermore, using a series of logistic regressions, we find that a CMS’s market share is positively correlated with website compromise. Surprisingly, we find that webservers running outdated software are less likely to be compromised than those running up-to date software. We present evidence that this is true for core WordPress software (the most popular CMS platform) and many associated plugins. Finally, we examine what happens to webservers following compromise. We find that under 5% of hacked WordPress websites are subsequently updated, but those that do are recompromised about half as often as those that do not update. Keywords: Content-management systems, webserver security, case-control study, cybercrime, security economics ✦ 1 I NTRODUCTION E ACH month many thousands of websites are compromised by criminals and repurposed to host phishing websites, distribute malware, and peddle counterfeit goods. Despite the substantial harm imposed, the number of infected websites has remained stubbornly high. While many agree that the current level of Internet security is unacceptably low, there is no consensus on what countermeasures should be adopted to improve security or where limited resources should be focused. One key reason we are in such a sorry state is that measuring security outcomes (and what factors drive them) is hard. In part, this is because those who fall victim to cybercrime often prefer not to speak out. But it is also because security mechanisms are deployed in the wild, where it can be impossible to design a randomized controlled experiment isolating the effect of a particular countermeasure to evaluate effectiveness. However, even when controlled experiments are not feasible, other techniques may still be usefully applied. In this paper, we apply a widely-used method from epidemiology, called a case- control study, in order to better understand the factors driving webserver insecurity. Working backwards from data on security incidents and a control sample, we can identify risk factors associated with compromise. This in turn can help defenders better allocate scarce defensive resources to do the most good. We investigate many observable characteristics of webservers that may affect the likelihood of compromise. Chief among them is whether or not they run a content management system (CMS), an application that simplifies the creation of web content. Some of the more popular CMSes, such as Joomla and WordPress, are consistently exploited to give a miscreant control over the webserver. Additional characteristics include the server type (e.g., Apache), the hosting country, and whether or not the webserver has demonstrated savviness in secure administration practices. We find the following: • Darwin Deason Institute for Cyber Security, Southern Methodist Univer- sity, Dallas, TX. {mvasek,jwadleigh,tylerm}@smu.edu • We apply a novel case-control study design to identify risk factors associated with webserver compromise. We use two compromise datasets (phishing and search-redirection attacks) and construct a control dataset of uncompromised servers, automatically extracting characteristics suspected of affecting the risk of compromise (Section 2). • We establish a link between running particular content management systems and an elevated risk of compromise (Section 3). We present evidence that compromise risk is linked to both customizability and popularity. We show that CMSes that are both highly customizable and popular (e.g., WordPress and Joomla) face the biggest risk. • We further explore the link between popularity and com- promise and find that the greater the CMS market share, the more at risk webservers running the CMS are (Sec- tion 3). • We further explore the link between customizability and compromise and find that the more WordPress plugins or Joomla extensions a website has, the greater the odds of compromise (Section 3.3). • We discover that servers running more up-to-date software are at greater risk of compromise (Section 4). We find this to be true for WordPress and many popular WordPress plugins and Joomla extensions. We hypothesize this is because the most up-to-date software is both more cus- tomizable and more popular than previous versions. • We examine what happens to servers following an initial compromise to distribute malware (Section 5). We find that webservers running outdated software are compromised again, or recompromised, most often when compromised and are not subsequently updated. Recompromise rates are lowest when webservers are outdated at the time of com- promise but brought up-to-date following compromise.
Transcript of IEEE TRANSACTIONS ON DEPENDABLE AND … Joomla are more likely to be hacked than those not running...

IEEE TRANSACTIONS ON DEPENDABLE AND SECURE COMPUTING (IN SUBMISSION) 1
Hacking is not random: a case-control study ofwebserver-compromise risk
Marie Vasek, John Wadleigh, Tyler Moore
Abstract—We describe a case-control study to identify risk factors that are associated with higher rates of webserver compromise. Weinspect a random sample of around 200 000 webservers and automatically identify attributes hypothesized to affect the susceptibility tocompromise, notably content management system (CMS) and webserver type. We then cross-list this information with data onwebservers hacked to serve phishing pages or redirect to unlicensed online pharmacies. We find that webservers running WordPressand Joomla are more likely to be hacked than those not running any CMS, and that servers running Apache and Nginx are more likelyto be hacked than those running Microsoft IIS. We also identify several WordPress plugins and Joomla extensions that associated withcompromise. Furthermore, using a series of logistic regressions, we find that a CMS’s market share is positively correlated withwebsite compromise. Surprisingly, we find that webservers running outdated software are less likely to be compromised than thoserunning up-to date software. We present evidence that this is true for core WordPress software (the most popular CMS platform) andmany associated plugins. Finally, we examine what happens to webservers following compromise. We find that under 5% of hackedWordPress websites are subsequently updated, but those that do are recompromised about half as often as those that do not update.
Keywords: Content-management systems, webserver security, case-control study, cybercrime, security economics
F
1 INTRODUCTION
E ACH month many thousands of websites are compromised bycriminals and repurposed to host phishing websites, distribute
malware, and peddle counterfeit goods. Despite the substantialharm imposed, the number of infected websites has remainedstubbornly high. While many agree that the current level ofInternet security is unacceptably low, there is no consensus onwhat countermeasures should be adopted to improve security orwhere limited resources should be focused. One key reason weare in such a sorry state is that measuring security outcomes (andwhat factors drive them) is hard. In part, this is because thosewho fall victim to cybercrime often prefer not to speak out. But itis also because security mechanisms are deployed in the wild,where it can be impossible to design a randomized controlledexperiment isolating the effect of a particular countermeasure toevaluate effectiveness.
However, even when controlled experiments are not feasible,other techniques may still be usefully applied. In this paper, weapply a widely-used method from epidemiology, called a case-control study, in order to better understand the factors drivingwebserver insecurity. Working backwards from data on securityincidents and a control sample, we can identify risk factorsassociated with compromise. This in turn can help defenders betterallocate scarce defensive resources to do the most good.
We investigate many observable characteristics of webserversthat may affect the likelihood of compromise. Chief among themis whether or not they run a content management system (CMS),an application that simplifies the creation of web content. Someof the more popular CMSes, such as Joomla and WordPress,are consistently exploited to give a miscreant control over thewebserver. Additional characteristics include the server type (e.g.,Apache), the hosting country, and whether or not the webserverhas demonstrated savviness in secure administration practices.
We find the following:
• Darwin Deason Institute for Cyber Security, Southern Methodist Univer-sity, Dallas, TX. {mvasek,jwadleigh,tylerm}@smu.edu
• We apply a novel case-control study design to identify riskfactors associated with webserver compromise. We usetwo compromise datasets (phishing and search-redirectionattacks) and construct a control dataset of uncompromisedservers, automatically extracting characteristics suspectedof affecting the risk of compromise (Section 2).
• We establish a link between running particular contentmanagement systems and an elevated risk of compromise(Section 3). We present evidence that compromise risk islinked to both customizability and popularity. We showthat CMSes that are both highly customizable and popular(e.g., WordPress and Joomla) face the biggest risk.
• We further explore the link between popularity and com-promise and find that the greater the CMS market share,the more at risk webservers running the CMS are (Sec-tion 3).
• We further explore the link between customizability andcompromise and find that the more WordPress plugins orJoomla extensions a website has, the greater the odds ofcompromise (Section 3.3).
• We discover that servers running more up-to-date softwareare at greater risk of compromise (Section 4). We find thisto be true for WordPress and many popular WordPressplugins and Joomla extensions. We hypothesize this isbecause the most up-to-date software is both more cus-tomizable and more popular than previous versions.
• We examine what happens to servers following an initialcompromise to distribute malware (Section 5). We find thatwebservers running outdated software are compromisedagain, or recompromised, most often when compromisedand are not subsequently updated. Recompromise rates arelowest when webservers are outdated at the time of com-promise but brought up-to-date following compromise.

IEEE TRANSACTIONS ON DEPENDABLE AND SECURE COMPUTING (IN SUBMISSION) 2
2 METHODOLOGY
We begin by setting out the key research questions in Section 2.1,then outline the case-control study design in Section 2.2. We dis-cuss the data collection and classification approach in Section 2.3.The collected data and analysis scripts are publicly available forreplication purposes at doi:10.7910/DVN/25608.
2.1 Research Questions
We investigate three categories of research questions about factorsthat may influence webserver compromise: software type, softwaremarket share, and webserver hygiene.
Most generally, we hypothesize that there are measurabledifferences in compromise rates according to the type of softwarerun on webservers.
H0: Running a CMS is a positive risk factor1 for compromise.H0b: (corollary) Some CMS types are risk factors for compro-
mise.H0c: (corollary) Some CMS add-ons are risk factors for com-
promise.H1: Some server types are risk factors for compromise.
There are several reasons why servers running CMSes maybe compromised more often. First, CMSes simplify configurationby reducing technical barriers, which means that they are oftenadministered by non-experts. This could lead to a greater chancefor server misconfiguration. Second, CMS platforms are a formof software monoculture, exhibiting common vulnerabilities inboth the underlying code and the default configurations. We alsoexpect some CMS platforms to be more secure than others. Forsimilar reasons, we expect some CMS add-on software, whichadds customization to the standard platform, will also increase thelikelihood of infection
We also anticipate that there will be differences in compromiserates based on the type of server software used. This is becausethere are different amounts of exploitable vulnerabilities presentin the underlying code bases. Additionally, some applications (in-cluding CMSes) run only or primarily on particular server types,and each application has its own susceptibility to compromise.
Furthermore, we suspect that a key driving force behindthe variation in compromise rates across software types is thesoftware’s market share. When more webservers run a particulartype of software, they collectively become a more attractive targetfor miscreants. The cost of crafting new exploits can be amortizedover many more infections for more popular software. While manywould agree with such logic on software types, we hypothesizethat the same logic also applies to different versions of the samesoftware: more popular software versions tend to be targeted moreoften than less popular ones. We suspect this is true even when theless popular version is more outdated and has more vulnerabilities.
H2: CMS market share is a positive risk factor for webservercompromise.
H2b: (corollary) Outdated software with limited market pene-tration is a negative risk factor for compromise.
H2c: (corollary) The number of exploits available for a type ofsoftware is a positive risk factor for compromise.
1. In this paper, a positive risk factor is actually a bad thing, as it indicatesgreater odds of compromise. By contrast, a negative risk factor indicates lowerodds of compromise.
Our final group of hypotheses involve the individual securitypractices of webserver administrators. We believe that, indepen-dent of the software running on a webserver, adopting securitybest practices that improve server “hygiene” can influence thelikelihood of compromise.
H3: Actively hiding detailed software version information is anegative risk factor for compromise.
H4: Running a webserver on a shared hosting platform is apositive risk factor for compromise.
H5: Setting the HTTPONLY cookie, which protects againstcross-site scripting attacks, is a negative risk factor forcompromise.
We note that there are other reasons why a webserver could beput at greater risk of being hacked than just the factors discussedabove. For example, administrator competence (not captured bythe hygiene indicators) certainly plays a role. Security policiesalso matter: lax password policies or practices could lead tocompromise. Finally, the value of the target influences what getshacked: high-reputation websites, for instance, are targeted forcompromise more frequently in search-redirection attacks [1].
We have chosen not to examine the impact of these additionalfactors in the present study. We decided to focus on CMSes, serversoftware, and webserver hygiene indicators for three reasons.First, as explained above, there is substantial evidence that thesefactors strongly affect compromise rates (e.g., the large number ofexploits available that target CMSes). Second, we have restrictedourselves to factors that could manageably be observed directlyand in an automated fashion. By contrast, many of the factorsthat we chose not to study are not not directly observable, suchas a company’s password policy. Factors that require extensivelycrawling or fuzzing a domain to observe, such as inferring firewallpolicies, are also excluded because they cannot be carried outat sufficient scale. Third, we have restricted ourselves to factorsthat appear in our sample population with sufficient frequency.In particular, we investigated many of the risk factors from [2]and found the vast majority of them to occur too infrequently toinclude in our study. It is our view that the methods of analysispresented here could in fact be applied to additional factors, butwe defer the task to future work.
2.2 Case-Control Study Design
In a case-control study typically used in epidemiology, data onthose afflicted with a disease are compared against as similar apopulation as possible of those not afflicted [3]. For example, inthe seminal case-control study that uncovered the link betweensmoking and lung cancer, Doll and Arthur surveyed British doctorsabout their smoking habits, then compared it against data collectedsubsequently on doctors’ mortality rates [4]. They found thatdoctors who smoked were much more likely to die than doctorswho did not. In general, case-control studies work by comparingtwo populations, one with a condition (the ‘case’) to one withoutwho are otherwise similar (the ‘control’). Researchers can thenwork backwards to identify important risk factors by comparingthe relative incidence of different characteristics in the case andcontrol populations.
Similarly, we sample a population of webservers and comparethem to other populations of webservers that have been compro-mised. Figure 1a demonstrates the design for the phishing dataset.We start with a comparable webserver population – domains

IEEE TRANSACTIONS ON DEPENDABLE AND SECURE COMPUTING (IN SUBMISSION) 3
Population: .comdomains
Case: Phishingdataset
Control: Web-server dataset
Exposed: CMSType
Not Exposed: NoCMS
Exposed: CMSType
Not Exposed: NoCMS
(a) Case-control study design, demonstrated for phishing datasetand CMS type as risk factor.
.COM90 million
Phish15 96112 682
WebserverDataset210 496
(b) Venn diagram demonstrates how wejoin webserver and phishing datasets.
Fig. 1: We join the webserver and compromise datasets to compare risk factors with outcomes.
registered in .com. We then assign the .com domains from thephishing dataset as the case and the domains from the webserverdataset as the control. We can then treat characteristics such asCMS type, server type, and hosting country as potential riskfactors. (We explain how each of these datasets and risk factors arecollected in the next subsection below.) Figure 1b shows a Venndiagram that explains how the phishing and webserver datasetsare joined. A similar approach is used for the search-redirectionattacks dataset and the webserver dataset.
Note that with case-control data, we do not make any claimsabout the overall incidence of compromise in the population. Thisis because we compare two different samples (the compromisedand broader samples). Instead, we analyze the prevalence ofcompromise relative to the occurrence of risk factors such as CMStype.
2.3 Data Collection Overview2.3.1 Control Population: Webserver SampleTo answer our research questions, we need a random sample ofwebservers; however, obtaining a perfectly representative sampleof all webservers is not possible since there is no global listavailable from which to sample. According to Verisign, there areover 252 million registered domains [5], but most zone files listingdomains are not made public. Instead, we take a random sampleof domains listed in the .com zone file. While limited to a singleTLD, it is worth noting that .com comprises nearly half of allregistered domains, and it is used by websites in many countries.Furthermore, .com domains include websites from a wide rangeof popularities. Thus, we feel that sampling from .com is broadenough to be representative of all webservers online.
We sampled webservers over a period of 9 days, obtaininginformation on 210 496 domains selected at random from the.com zone file downloaded January 15, 2013. We chose thissample size to ensure that it would likely include enough websitesrunning CMSes with at least 1% market share. This, in turn,improves the chances of obtaining statistically significant results.
We remove all free hosting and URL shortening services(where the URLs are likely set up purposely by the criminals)from our collection. Finally, we refer to the trimmed sample of.com domains as the webserver dataset.
2.3.2 Case Populations: Compromised WebserversWe consider two sources of data on hacked webservers. First, weexamine an amalgamated “feed” of phishing URLs, comprisingreal-time reports from two firms that remove phishing websites
on behalf of banks, a large brand owner, the crowdsourced listfrom PhishTank [6], and the Anti-Phishing Working Group’scommunity feed [7]. We examined 97 788 distinct URLs from29 682 domains impersonating 1 098 different brands reportedbetween November 20, 2012 and January 7, 2013 in the phishingdataset. According to [8], 94% of domains used for phishingduring this period were compromised websites. Since nearly allof the remainder are highly-ranked sites that we excluded asdescribed below, we are confident that the domains used in ourstudy were compromised to serve phishing pages.
The second dataset on webserver compromise came fromwebsites observed to be engaging in search-redirection attacks.Here, websites with high reputation are hacked and reconfiguredto surreptitiously channel traffic from search engines to unlicensedpharmacies. Notice that we do not gather information on phar-macies set up by criminals, but rather on domains that were setup by legitimate Internet users and compromised to redirect tocriminal websites. We obtained the dataset gathered by the authorsof [1], who updated their system to detect advanced forms ofcookie-based redirection as described in [9]. The dataset includesweb search results from 218 pharmaceutical-related search terms.Webservers are included in the list if they are observed to redirectto a third-party website and subsequently found to engage incloaking. The search-redirection attacks dataset includes 58 516distinct URLs gathered between October 20, 2011 and December27, 2012. These correspond to 10 677 unique domains, 6 226 ofwhich have a .com TLD.
2.3.3 Extracting Webserver Risk FactorsThe head of an HTML webpage often contains metadataabout the webpage in so-called meta tags. One piece of in-formation that many content management system (CMS) au-thors (and text editors) include is a “generator” tag. Thisoptional tag generally contains the text editor type, contentmanagement system, version number and/or any special CMSthemes used. For example, a website running WordPress version3.2.1 might contain the tag <meta name=‘‘generator’’content=‘‘WordPress 3.2.1’’>. We downloaded acopy of the HTML for the top-level webpage on a given domain,and then parsed the HTML to extract the tag.
We then attempted to identify the CMS, if any, along withthe version information if included. We used manually craftedregular expressions to complete the task. We focused on the top13 CMSes with at least 1.0% of CMS market share as of January2013 according to W3Techs [10]. These 13 CMSes collectivelycomprise 88.4% of all websites using CMSes. We could identify

IEEE TRANSACTIONS ON DEPENDABLE AND SECURE COMPUTING (IN SUBMISSION) 4
CMS type for 9 of the top 13 (84.6% of all CMSes). We alsoincluded 3 more CMSes, each with less than 1.0% of market share.
However, we cannot solely rely on generator tags to classifywebsites by CMS. For instance, most websites running Drupal,one of the most popular CMSes, do not display generator infor-mation in their metadata. Consequently, in addition to gatheringgenerator information, we ran a number of regular expressionscorresponding to 3 of the 4 most popular CMSes against thedataset. Appendix A compares our custom approach to severaloff-the shelf tools for CMS identification.
To identify server software, we collected the packet headersalong with the HTML code. In each header was a line specifyingthe server such as Server: Microsoft-IIS/7.5. From thiswe extracted the server type and version number. We also fetchedthe IP address of the server and mapped this to the country oforigin using MaxMind [11].
We also detected the presence of add-on software commonlyused in CMSes, called plugins by WordPress and extensions byJoomla. It has been frequently argued that this third-party add-onsoftware is a natural target for attackers, especially as the coreCMS software becomes hardened. We focus on the top fifty mostpopular WordPress plugins and Joomla extensions (100 in total),as determined by their occurrence in the control dataset.
We identified WordPress plugins by scanning eachwebsite’s stored HTML files for paths beginningwith /wp-content/plugins/. The followingdirectory indicates the corresponding plugin, e.g., awebsite using the WP eCommerce plugin has the/wp-content/plugins/wp-e-commerce/ path.
We detected Joomla extensions in a similar manner. Extensionsare comprised of components, modules, plugins, templates, andlanguages. We used regular expressions to identify each plugin,such as /components/com_\w*/ for finding components.
We also tried to find versioning information forWordPress plugins. As there is no standard way to conveyversion information in plugins, from manual inspection wesuccessfully identified plugin information for 19 of the top50. Some WordPress plugins broadcast their version in aparameter handed to their scripts. For example, a websiterunning version 6.1 of Google Analyticator would containwp-content/plugins/google-analyticator/external-tracking.min.js?ver=6.1. Unfortunatelynot all plugins are so transparent with versions, and those that aremay not be specifying the plugin’s version (instead, a version ofthe script or the WordPress installation).
2.3.4 Reducing False Positives in the Infection DatasetsNot all of the URLs in the compromise datasets are from hackedwebpages. For the phishing dataset, we deem any URL to be afalse positive if the URL does anything other than impersonateanother website. For the search-redirection attacks dataset, weclassify any URL as a false positive if the destination websitefollowing redirection appears related to the source website (e.g.,ilike.com redirects to myspace.com, which bought the com-pany).
Since the false positive rates for phishing are consistentlyhigher than for search-redirection attacks, we developed auto-mated techniques to discard websites that were errantly placedon these lists. We removed all FQDNs that redirected to legit-imate US-based banks2 and other known non-banks frequently
2. Found on the FDIC website [12].
targeted by phishing, such as paypal.com, amazon.comand facebook.com. We also generated a sequence of regularexpressions that detected Microsoft Outlook Web Applicationsand coupon websites and checked them against the HTML wedownloaded previously. These initial steps reduced our overallfalse positive rate for the phishing dataset from 9.4% to 5.0%.To further improve, we manually inspected all URLs in theAlexa top million sites and excluded any false positives fromfurther consideration, yielding final false positive rates of 2.3%for phishing and 4.3% for search-redirection attacks. These falsepositive rates were calculated by inspecting a stratified randomsample by Alexa rank.
3 IDENTIFYING RISK FACTORS FOR COMPROMISE
3.1 Odds Ratios
Odds are defined by the ratio of the probability that an event willoccur to the probability it will not occur. For example, if p = 0.2,then the odds are p
1−p = 0.20.8 = 0.25. Odds express relative
probabilities. Odds ratios compare the odds of two events, eachoccurring with different probabilities.
In case-control studies, odds ratios compare the odds of asubject in the case population exhibiting a risk factor to the oddsof a subject in the control population exhibiting a risk factor.Consider the four cases:
Case (afflicted) Control (not afflicted)Has risk factor pCaseRF pCtlRF
No risk factor pCaseRF pCtlRFThe odds ratio, then, is the following product of probabilities:
odds ratio (OR) =pCaseRF/pCaseRF
pCtlRF/pCtlRF=pCaseRF ∗ pCtlRF
pCaseRF ∗ pCtlRF
An odds ratio of 1 means that there is no difference inproportions of the risk factor among the case and control groups.An odds ratio greater than 1 indicates that those in the case groupare more likely to exhibit the risk factor (so-called positive riskfactors). By contrast, an odds ratio less than 1 indicates that thosein the case group are less likely to exhibit the risk factor (indicatinga negative risk factor).
ResultsTable 1 reports odds ratios for different CMS and server types
for both compromise datasets. We computed odds ratios for web-servers running each of the major CMSes compared to webserversnot running any CMS. We denoted statistically significant positiverisk factors in red and statistically significant negative risk factorsin green. We can interpret these results as webservers runningWordPress were more than four times as likely to be compromisedto serve phishing pages than a webserver running no CMS, buta webserver running Blogger was only about a third as likelyto be compromised to serve phishing pages than a webserverrunning no CMS. For the phishing dataset, some less popularCMSes fare better than not using a CMS, but the more popularCMSes are positive risk factors. WordPress, Joomla and Zen Carthad increased odds of compromise, while Blogger, TYPO3 andHomestead reduced risk.
This supports hypothesis H0b, but partially refutes hypothesisH0 that using any CMS increases the odds of compromise. Forsearch-redirection attacks, CMSes are either as bad or worse thannot using a CMS, supporting H0. Notably, the odds ratios forJoomla and WordPress are even higher than for phishing. The

IEEE TRANSACTIONS ON DEPENDABLE AND SECURE COMPUTING (IN SUBMISSION) 5
Content Management System (CMS) TypeRisk Odds Phishing dataset Risk Odds Search-redirection attacks dataset
factor ratio 95% CI # Phish # Not phish factor ratio 95% CI # Redir. # Not redir.
No CMS 1.00 8 747 190 305 1.00 2 260 190 314WordPress + 4.44 (4.24, 4.65) 2 673 13 101 + 17.18 (16.20, 18.22) 2 674 13 106Joomla + 7.11 (6.62, 7.63) 1 106 3 384 + 23.96 (22.05, 26.04) 963 3 385Drupal 0.79 (0.58, 1.04) 46 1 279 + 6.59 (5.33, 8.07) 100 1 279Zen Cart + 4.84 (3.26, 6.96) 33 149 2.35 (0.71, 5.56) 4 149Blogger – 0.28 (0.13, 0.52) 8 637 1.08 (0.49, 2.02) 8 637TYPO3 – 0.14 (0.03, 0.37) 3 481 + 4.23 (2.72, 6.24) 24 481Homestead – 0.04 (0.00, 0.18) 1 607 – 0.16 (0.01, 0.69) 1 607
Server TypeRisk Odds Phishing dataset Risk Odds Search-redirection attacks dataset
factor ratio 95% CI # Phish # Not phish factor ratio 95% CI # Redir. # Not redir.
Microsoft IIS 1.00 1 002 60 495 1.00 193 60 497Apache + 5.44 (5.10, 5.81) 10 549 117 017 + 14.12 (12.26, 16.36) 5 276 117 031Nginx + 2.24 (2.01, 2.50) 507 13 649 + 8.63 (7.26, 10.30) 376 13 649Yahoo – 0.62 (0.41, 0.89) 27 2 634 1.57 (0.85, 2.64) 13 2 634Google 0.63 (0.35, 1.03) 14 1 359 1.88 (0.84, 3.57) 8 1 359
TABLE 1: Odds ratios for varying CMS and server types. Statistically significant results are listed in bold. Odds ratios less than oneare negative risk factors, while odds ratios greater than one are positive risk factors for compromise.
WordPress odds ratio jumps from 4.4 phishing to 17 for search-redirection attacks; for Joomla, the jump is from 7 to nearly 24!
For some smaller CMSes, the evidence for phishing andsearch-redirection attacks is mixed. Homestead has a negative riskfactor for phishing and search-redirection attacks dataset. TYPO3and Blogger are negative for phishing, but TYPO3 has a positiverisk factor for search-redirection attacks, whereas Blogger is notstatistically significant.
We note that the larger CMSes tend to be the strongestpositive risk factors for compromise, according to both datasets.This supports hypothesis H2 that CMS market share is positivelycorrelated with compromise, but more analysis is needed.
For server software type, we compute risk factors relative toMicrosoft IIS, the second-most popular server software. Apacheand Nginx are positive for both phishing and search-redirectionattacks. Note that we are not making any claims about the relativesecurity levels of the different software classes. All softwarecontains vulnerabilities, and we are not taking sides on the debateover whether open- or closed-source software has fewer unpatchedholes [13]. Instead, our results simply show that, relative tosoftware popularity, criminals tend to use Apache and Nginx morefor perpetrating their crimes than Microsoft IIS.
3.2 Logistic RegressionsWe now present logistic regressions to study why websites arecompromised. We run four regressions in all: two for webserversrunning a CMS (one each for the phishing and search-redirectionattacks datasets) and two for webservers not running any CMS(one for each compromise dataset). We run the additional regres-sions because some explanatory variables only apply to CMSes,but many of the variables measuring security signals apply regard-less of whether or not a webserver uses a CMS.
We group the following explanatory variables into threecategories: CMS market share, webserver hygiene and serverattributes.CMS Market Share# Servers: We took market share for each CMS from [10] asof January 1, 2013 and multiplied it by population of registered.com domains (106.2 million) and estimated server response rate(85%) [5]. This variable was omitted for non-CMS regressions.Webserver HygieneHTTPONLY cookie: We checked the header for an HTTPONLY
cookie used to protect against cross-site-scripting attacks. Weinterpret setting this cookie as a positive signal of overall serverhygiene. Checking for this cookie was one measure of serverhygiene also used in [2].Server Version Visible: We analyzed the server headers for anyversion information regarding the server, whether it be Apache 2or Apache 2.2.22. This is a Boolean variable which is true if theserver gave any potentially valid version information.Shared Hosting: We counted the number of times we observed anIP address in the combined webserver and compromised datasets.We deem a domain to be part of a shared host if 10 domainsresolve to the same IP address. A recent Anti-Phishing WorkingGroup report presents evidence that some attackers target sharedhosting in order to simultaneously infect many domains [8].
Server Attributes
Country: We took the top ten countries from the combined datasetand compared each of them the domains hosted in all the othercountries in the dataset.Server Type: This categorical variable looks at the type of serversoftware a webserver is running. We only consider the 5 mostpopular types: Apache, Microsoft IIS, Nginx, Google, and Yahoo.
The model takes the following form:
logpcomp
1− pcomp= c0 +c1 lg (# Servers) + c2 HTTPONLY
+c3 Server Vsn + c4 Shared Hosting
+c5 Country + c6 Server type + ε
Table 2 shows the results from these four regressions. CMSpopularity is positively correlated with compromise in the phish-ing dataset. Each doubling of the number of webservers runningthe CMS increases the odds of compromise by 9%, supportinghypothesis H2. The result is inconclusive for search-redirectionattacks, but the trend is similar. Also, Appendix B studies thelink between market share and exploitability. The analysis inAppendix B shows that the number of exploits is also a positiverisk factor for being hacked to serve phishing pages, whichsupports H2c.
We consider hygiene variables next. We do not observe anyconsistent evidence that hiding server information promotes orinhibits compromise, so we can neither refute nor support H3.Setting an HTTPONLY cookie appears to be a negative risk factor
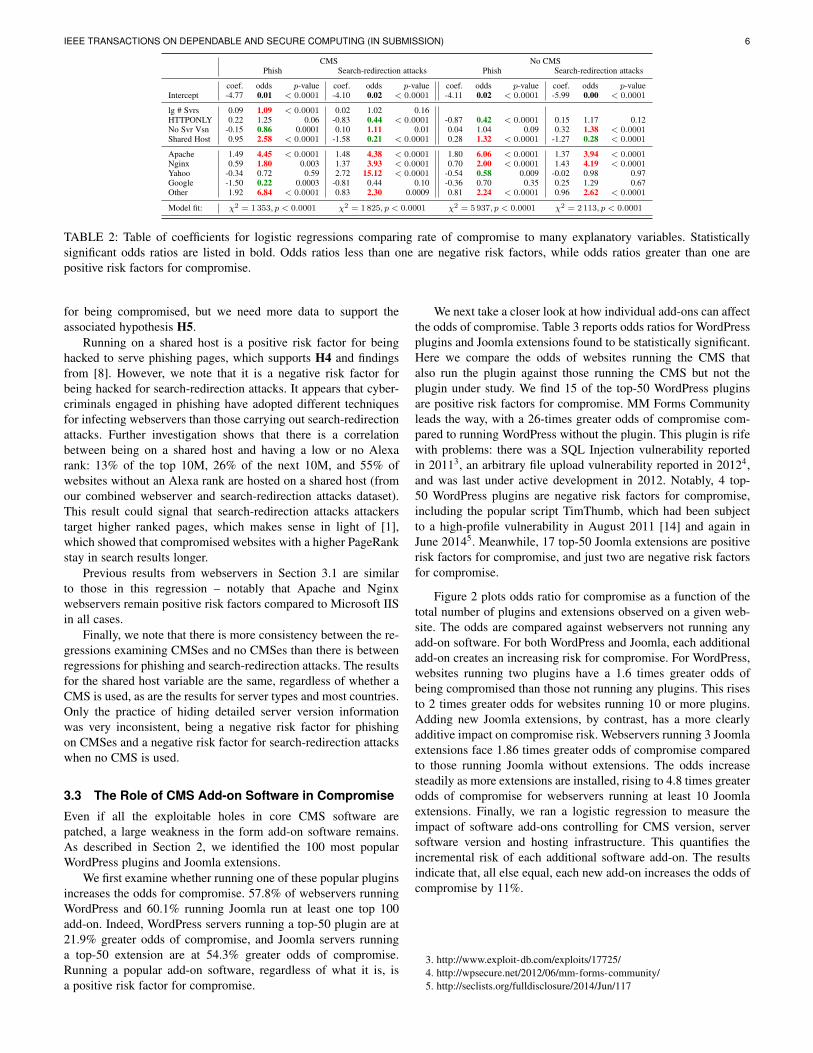
IEEE TRANSACTIONS ON DEPENDABLE AND SECURE COMPUTING (IN SUBMISSION) 6
CMS No CMSPhish Search-redirection attacks Phish Search-redirection attacks
coef. odds p-value coef. odds p-value coef. odds p-value coef. odds p-valueIntercept -4.77 0.01 < 0.0001 -4.10 0.02 < 0.0001 -4.11 0.02 < 0.0001 -5.99 0.00 < 0.0001
lg # Svrs 0.09 1.09 < 0.0001 0.02 1.02 0.16HTTPONLY 0.22 1.25 0.06 -0.83 0.44 < 0.0001 -0.87 0.42 < 0.0001 0.15 1.17 0.12No Svr Vsn -0.15 0.86 0.0001 0.10 1.11 0.01 0.04 1.04 0.09 0.32 1.38 < 0.0001Shared Host 0.95 2.58 < 0.0001 -1.58 0.21 < 0.0001 0.28 1.32 < 0.0001 -1.27 0.28 < 0.0001
Apache 1.49 4.45 < 0.0001 1.48 4.38 < 0.0001 1.80 6.06 < 0.0001 1.37 3.94 < 0.0001Nginx 0.59 1.80 0.003 1.37 3.93 < 0.0001 0.70 2.00 < 0.0001 1.43 4.19 < 0.0001Yahoo -0.34 0.72 0.59 2.72 15.12 < 0.0001 -0.54 0.58 0.009 -0.02 0.98 0.97Google -1.50 0.22 0.0003 -0.81 0.44 0.10 -0.36 0.70 0.35 0.25 1.29 0.67Other 1.92 6.84 < 0.0001 0.83 2.30 0.0009 0.81 2.24 < 0.0001 0.96 2.62 < 0.0001
Model fit: χ2 = 1353, p < 0.0001 χ2 = 1825, p < 0.0001 χ2 = 5937, p < 0.0001 χ2 = 2113, p < 0.0001
TABLE 2: Table of coefficients for logistic regressions comparing rate of compromise to many explanatory variables. Statisticallysignificant odds ratios are listed in bold. Odds ratios less than one are negative risk factors, while odds ratios greater than one arepositive risk factors for compromise.
for being compromised, but we need more data to support theassociated hypothesis H5.
Running on a shared host is a positive risk factor for beinghacked to serve phishing pages, which supports H4 and findingsfrom [8]. However, we note that it is a negative risk factor forbeing hacked for search-redirection attacks. It appears that cyber-criminals engaged in phishing have adopted different techniquesfor infecting webservers than those carrying out search-redirectionattacks. Further investigation shows that there is a correlationbetween being on a shared host and having a low or no Alexarank: 13% of the top 10M, 26% of the next 10M, and 55% ofwebsites without an Alexa rank are hosted on a shared host (fromour combined webserver and search-redirection attacks dataset).This result could signal that search-redirection attacks attackerstarget higher ranked pages, which makes sense in light of [1],which showed that compromised websites with a higher PageRankstay in search results longer.
Previous results from webservers in Section 3.1 are similarto those in this regression – notably that Apache and Nginxwebservers remain positive risk factors compared to Microsoft IISin all cases.
Finally, we note that there is more consistency between the re-gressions examining CMSes and no CMSes than there is betweenregressions for phishing and search-redirection attacks. The resultsfor the shared host variable are the same, regardless of whether aCMS is used, as are the results for server types and most countries.Only the practice of hiding detailed server version informationwas very inconsistent, being a negative risk factor for phishingon CMSes and a negative risk factor for search-redirection attackswhen no CMS is used.
3.3 The Role of CMS Add-on Software in Compromise
Even if all the exploitable holes in core CMS software arepatched, a large weakness in the form add-on software remains.As described in Section 2, we identified the 100 most popularWordPress plugins and Joomla extensions.
We first examine whether running one of these popular pluginsincreases the odds for compromise. 57.8% of webservers runningWordPress and 60.1% running Joomla run at least one top 100add-on. Indeed, WordPress servers running a top-50 plugin are at21.9% greater odds of compromise, and Joomla servers runninga top-50 extension are at 54.3% greater odds of compromise.Running a popular add-on software, regardless of what it is, isa positive risk factor for compromise.
We next take a closer look at how individual add-ons can affectthe odds of compromise. Table 3 reports odds ratios for WordPressplugins and Joomla extensions found to be statistically significant.Here we compare the odds of websites running the CMS thatalso run the plugin against those running the CMS but not theplugin under study. We find 15 of the top-50 WordPress pluginsare positive risk factors for compromise. MM Forms Communityleads the way, with a 26-times greater odds of compromise com-pared to running WordPress without the plugin. This plugin is rifewith problems: there was a SQL Injection vulnerability reportedin 20113, an arbitrary file upload vulnerability reported in 20124,and was last under active development in 2012. Notably, 4 top-50 WordPress plugins are negative risk factors for compromise,including the popular script TimThumb, which had been subjectto a high-profile vulnerability in August 2011 [14] and again inJune 20145. Meanwhile, 17 top-50 Joomla extensions are positiverisk factors for compromise, and just two are negative risk factorsfor compromise.
Figure 2 plots odds ratio for compromise as a function of thetotal number of plugins and extensions observed on a given web-site. The odds are compared against webservers not running anyadd-on software. For both WordPress and Joomla, each additionaladd-on creates an increasing risk for compromise. For WordPress,websites running two plugins have a 1.6 times greater odds ofbeing compromised than those not running any plugins. This risesto 2 times greater odds for websites running 10 or more plugins.Adding new Joomla extensions, by contrast, has a more clearlyadditive impact on compromise risk. Webservers running 3 Joomlaextensions face 1.86 times greater odds of compromise comparedto those running Joomla without extensions. The odds increasesteadily as more extensions are installed, rising to 4.8 times greaterodds of compromise for webservers running at least 10 Joomlaextensions. Finally, we ran a logistic regression to measure theimpact of software add-ons controlling for CMS version, serversoftware version and hosting infrastructure. This quantifies theincremental risk of each additional software add-on. The resultsindicate that, all else equal, each new add-on increases the odds ofcompromise by 11%.
3. http://www.exploit-db.com/exploits/17725/4. http://wpsecure.net/2012/06/mm-forms-community/5. http://seclists.org/fulldisclosure/2014/Jun/117

IEEE TRANSACTIONS ON DEPENDABLE AND SECURE COMPUTING (IN SUBMISSION) 7
WordPress Plugin Odds 95% CI Joomla Extension Odds 95% CI
MM Forms Community 25.99 (5.09, 634.31) JomCommentC 7.80 (5.27, 11.94)Dynamic Content Gallery 7.07 (5.47, 9.23) Autson Slide ShowM 2.22 (1.36, 3.68)Audio Player 2.23 (1.80, 2.76) RokStoriesC 2.17 (1.53,3.08)WPaudio MP3 Player 1.87 (1.29, 2.69) Social Media LinksM 2.04 (1.28, 3.27)Easing Slider 1.85 (1.22, 2.79) Frontpage SlideShowC 1.94 (1.31, 2.87)WordPress Popular Posts 1.72 (1.24, 2.36) JCommentsC 1.92 (1.41,2.61)WP-Polls 1.70 (1.37, 2.10) RokAjaxSearchC 1.86 (1.42, 2.43)Digg Digg 1.63 (1.21, 2.17) JA Tabs 1.84 (1.22, 2.77)WP-reCAPTCHA 1.52 (1.11, 2.07) News Show Pro GK4M 1.72 (1.22, 2.42)WP-PostRatings 1.50 (1.07, 2.10) Frontpage SlideShowM 1.64 (1.17, 2.30)MailChimp 1.40 (1.05, 1.86) AVReloaded 1.64 (1.24, 2.16)Viper’s Video Quicktags 1.39 (1.09, 1.76) Vinaora Visitors CounterM 1.58 (1.17, 2.14)Sociable 1.30 (1.06, 1.60) YOOsearchM 1.56 (1.01, 2.42)Jetpack 1.28 (1.18, 1.45) K2C 1.54 (1.28, 1.85)Google Analyticator 1.20 (1.03, 1.38) RokBoxC 1.41 (1.19, 1.68)TimThumb 0.81 (0.68, 0.95) YOOeffects 1.37 (1.00, 1.85)Custom Contact Forms 0.63 (0.44, 0.88) MTupgrade 1.31 (1.04, 1.65)Gravity Forms 0.63 (0.39, 0.97) Joom!FishC 0.56 (0.41, 0.74)IE SiteMode 0.08 (0.04, 0.12) LanguagesM 0.42 (0.23, 0.74)
TABLE 3: Odds ratios for varying plugin types (all statistically significant).
1
2
3
4
Odds of compromise when running WordPress plugins
# plugins
odds
rat
io
● ●
0 1 2 3 4 5 6 7 8 9 10+
1
2
3
4
Odds of compromise when running Joomla extensions
# extensions
●
●
●
0 1 2 3 4 5 6 7 8 9 10+
Fig. 2: Odds of compromise based on the number of top-50 WordPress plugins (left) and top-50 Joomla extensions (right). Statisticallysignificant positive risk factors are indicated by red plus signs.
4 DOES OUTDATED SOFTWARE GET HACKEDMORE OR LESS OFTEN?
A best practice for webserver security is to run the most recent ver-sion of software available, as updates tends to plug security holesas well as add new features. For instance, Google notifies web-masters via its Webmaster Tools when it detects outdated serversoftware as a way to improve security [15]. However, updatingserver software can be a nuisance, due to cross-dependencies, poorinterfaces and the demands of maintaining uptime. Consequently,many webservers run software that is many months, or even years,out of date. The security firm Sucuri Labs even runs a website [16]that names and shames websites running woefully outdated CMSor server software.
But we wondered whether or not servers running outdatedsoftware actually do get compromised more often than those thatdo not. We hypothesize that the opposite is usually true: thatoutdated webservers are compromised less often provided thatmost other webservers are already upgraded. To test this andrelated hypotheses, we first restrict ourselves to the servers runningWordPress. This is for two reasons: WordPress is the most popularcontent management system and, by default, WordPress installsprovide detailed version information ordered straightforwardly.
4.1 Comparing Compromise Across Major WordPressSubversions
Odds Ratios for Major Version Differences in WordPressFirst, we investigated whether servers running WordPress that
hid version information were at less risk of compromise (totest hypothesis H3). The results are shown in the first row ofthe table in Figure 3c. In fact, hiding WordPress version is apositive risk factor for being hacked for phishing pages. Thiscontradicts the frequently held view that hiding detailed versioninformation improves security, and it instead lends credence tothe view that publishing information helps defenders more thanattackers. For instance, WordPress and Google send out reminderemails to server administrators to update their software, but thosewho obscured their generator version for security reasons do notreceive the reminders. We also note that even though we looked atversion information through the generator tag, attackers oftentimestry their hack on any server running WordPress, regardless of whatversion it says it is. We see no statistically significant effect forsearch-redirection attacks, though the trend is similar.
There are differing degrees of outdated software. For serverswith version information, we first compared the risk facing serversat the most recent version (3.5.1 during our collection time) torunning any other version of WordPress. Running the most up-to-

IEEE TRANSACTIONS ON DEPENDABLE AND SECURE COMPUTING (IN SUBMISSION) 8
date version is a positive risk factor for being hacked for search-redirection attacks. This too goes against conventional wisdom,and indirectly supports hypothesis H2 since the most recentversion is also the most popular one.
We also looked at the difference in major versions, ignoringversion 1 since we only had 7 instances in our combined datasets.We compared all of WordPress 2.* and WordPress 3.* againstWordPress installs with no version information. We see that Word-Press 3.* installs face more risk of being hacked to serve phishingpages than WordPress 2.*. We observe similar but statisticallyinsignificant results for search-redirection attacks.
Chi-squared Test for Risk Across SubversionsThe odds ratios just discussed offer initial evidence that being
out of date reduces the risk of infection for webservers runningWordPress, at least when comparing major versions. We now drilldown and investigate differences across WordPress subversions(e.g., WordPress 3.3.*). Figure 3a plots the relative frequency ofservers in our webserver and compromise datasets running eachWordPress subversion. Note the different scales to the vertical axes– the left axis tracks the frequency in the webserver dataset whilethe right axis is used for the two compromise datasets. We firstobserve that more outdated subversions are indeed less popularcompared to the most recent subversions. We also see that thecompromise rate roughly follows the popularity of the subversion,but with substantial variation and lower compromise rates for moreoutdated versions.
But are the differences in compromise rates statistically signif-icant? We can answer that using a χ2 test, but first, we can inspectthe differences visually using the mosaic plot in Figure 3b. Thevertical axis shows for each version the proportion of compro-mised webservers (either phishing or search-redirection attacks)compared to the proportion of uncompromised webservers (fromthe webserver dataset). The horizontal axis is scaled so that thearea of each cell matches the frequency of each category. Forinstance, the dark blue cell in the bottom right corner showsthe proportion of webservers running WordPress Version 3.5.*that have been compromised. This plot shows that the fractioncompromised falls steadily as the subversions grow more outdated.It also shows that the collective proportion of outdated servers isstill quite substantial.
Finally, the cells are lightly shaded if the difference in pro-portion for being compromised is statistically significant at the95% confidence interval according to the χ2 test, and over 99%confidence interval if darkly shaded. Red cells are underrepre-sented and blue cells are overrepresented. We can see that mostof the WordPress 2.* versions are statistically overrepresented inthe webserver dataset and underrepresented in the compromisedatasets. WordPress 3.0 and 3.3 are also overrepresented inthe compromise datasets and underrepresented in the webserverdataset. The most recent, WordPress 3.5, is the only subversionoverrepresented in the phish dataset and underrepresented in thewebserver dataset. These findings support hypothesis H2b that un-popular outdated CMSes are negative risk factors for compromise.It is also consistent with our findings from the odds ratios that themost recent version is the most at risk of compromise.
Logistic RegressionsThe final check we make comparing compromise rates in
WordPress versions is to run a simple logistic regression com-paring the popularity of a version to the compromise rate in thephishing dataset.
WordPress plugin % up-to-date % out-of-date %-pts. difference Oddscompromised compromised for up-to-date ratio
WP-Table Reloaded 48.28 24.71 23.57 2.83The Events Calendar 48.84 28.30 20.54 2.39WP eCommerce 40.43 22.70 17.73 2.30WP jQuery Lightbox 37.14 21.74 15.40 2.07Theme My Login 37.93 25.00 12.93 1.82Contact Form 7 33.91 24.47 9.44 1.58Google Analyticator 38.26 29.03 9.23 1.51WP-Polls 43.72 36.88 6.84 1.33MailChimp 42.12 35.79 6.32 1.31Audio Player 47.77 41.94 5.84 1.26Easing Slider 46.67 41.27 5.40 1.24Lightbox Plus Colorbox 33.33 28.96 4.37 1.30Digg Digg 40.52 36.84 3.68 1.16WPaudio MP3 Player 43.43 42.11 1.33 1.05NextGEN Gallery 28.57 30.59 -2.06 0.95Gravity Forms 17.65 22.58 -4.93 0.74WooCommerce 23.68 28.81 -5.13 0.77cforms 25.00 31.33 -6.33 0.80WP-Paginate 29.70 39.13 -9.43 0.66
TABLE 4: Comparing compromise rates for webservers runningup-to-date versus outdated WordPress plugins (statistically signif-icant odds ratios in bold).
# Servers: We took the market share for each WordPress sub-version from [10] as of January 1, 2013 and multiplied it bypopulation of registered .COM domains (106.2 million) and theestimated server response rate (85%) from [5].
logpcomp
1− pcomp= c0 + c1 lg (# Servers) + ε.
The logistic regression yields the following results:
coef. Odds Ratio 95% conf. int. SignificanceIntercept -5.60 0.00 (0.00, 0.01) p < 0.0001lg(# Servers) 0.19 1.20 (1.17, 1.24) p < 0.0001
Model fit: χ2 = 200.31, p < 0.0001
These results show that each time the number of serversrunning the same subversion of WordPress doubles, the risk ofthe server being hacked to serve phishing pages increases by 20%.This offers further evidence supporting H2.
4.2 Comparing Compromise Across Plugin Versions
As described in Section 2, we were able to automatically extractdetailed version information for 19 of the top-50 WordPress plug-ins. We now examine whether we see a similar pattern as alreadyfound for WordPress, namely that more up-to-date software isin fact hacked more often. For each plugin, table 4 reports thepercentage of websites running an up-to-date version of the pluginthat are compromised, compared against the percentage runningoutdated software that are compromised.
To be consistent with the findings just presented for Word-Press, we would expect to see a greater incidence of compromiseamong up-to-date plugins than outdated ones. In fact, this isusually what happens. For 14 of the 19 plugins, the up-to-dateversion is compromised more often than servers running outdatedversions of the plugin. In five cases, the odds ratio is statisticallysignificant, indicating that the higher rate of compromise cannotbe attributed to chance. Notably, in all cases with statisticallysignificant odds ratios, running up-to-date plugin software is apositive risk factor for compromise. This lends further empiricalsupport to the surprising finding that running up-to-date softwaremay actually put webservers at greater risk of being hacked.

IEEE TRANSACTIONS ON DEPENDABLE AND SECURE COMPUTING (IN SUBMISSION) 9
● ● ● ● ● ● ●●
●
● ●●
●
●
●
010
0020
0030
0040
00
WordPress Subversion
Web
serv
er D
atas
et F
requ
ency
2.0
2.1
2.2
2.3
2.5
2.6
2.7
2.8
2.9
3.0
3.1
3.2
3.3
3.4
3.5
020
040
060
080
0
Com
prom
ise
Fre
quen
cy
● Webserver DatasetPhishSearch Redirection
(a) Incidence of compromise by WordPress version, along withthe popularity of WordPress version.
Sta
ndar
dize
dR
esid
uals
:<
−4
−4:
−2
−2:
00:
22:
4>
4
2.0
2.1
2.2
2.3
2.5
2.6
2.7
2.8
2.9
3.0
3.1
3.2
3.3
3.4
3.5
. Com
prom
ised
N
ot C
ompr
omis
ed
(b) Mosaic plot of WordPress version popularity and incidence ofcompromise (red cells indicate statistically significant underrepre-sentation, blue cells overrepresentation).
Risk Odds Phishing dataset Risk Odds Search-redirection attacks datasetfactor ratio 95% CI # Phish # Not phish factor ratio 95% CI # Redir. # Not redir.
Version Found 1.00 1 834 9 676 1.00 1 936 9 680No Version + 1.29 (1.18, 1.41) 839 3425 1.08 (0.98, 1.18) 738 3 426
Other WordPress versions 1.00 1 606 8 599 1.00 1 440 8 601WordPress 3.5.1 1.13 (0.97, 1.32) 228 1 077 + 2.75 (2.43, 3.09) 496 1 079
No Version 1.00 839 3 425 1.00 738 3 426WordPress 2.* – 0.12 (0.08, 0.17) 26 918 0.88 (0.73, 1.05) 173 918WordPress 3.* – 0.84 (0.77, 0.92) 1 808 8 751 0.93 (0.85, 1.03) 1 762 8 755
(c) Odds ratios by WordPress versioning.
Fig. 3: Exploring the relationship between WordPress version and the incidence of webserver compromise.
5 WHAT HAPPENS TO CMS SOFTWARE FOLLOW-ING A COMPROMISE?
Up to now, our analysis has focused on identifying which web-servers are more likely to be compromised. We have also collectedadditional data to find out what happens after a compromisetakes place: what actions webmasters take and how that affectsrecompromise rates. Cleaning up after an infection can be tricky.Because many webmasters are unaware of how the attackers gotin [17], they do not always fix the hole that the attacker used toget in the first time. We hypothesize that the steps a webmastertakes after being hacked can greatly influence whether or not thewebsite is hacked later on.
To that end, we set up an ongoing collection using malwareURL data from StopBadware’s Data Sharing Project. This in-cludes data from ESET, Fortinet, Internet Identity, Malware MustDie, Sophos, among others. We access each FQDN associated witha malware URL within an hour of the URL being submitted to thefeed. We then follow up 1, 2, 5, 9, and 15 days after the initialaccess to check whether or not the CMS software gets updated.We accessed 464 737 FQDNs from unique domains from February2014 through October 2014. Of these, 50 179 ran WordPress, thesole CMS we investigate here due to its popularity and the ease oftracking versions. We whittle this down to 44 712 of those whichhad easily discernible versioning
Of the WordPress sites, 88.7% had the same WordPress ver-sion throughout the observational period; 21.6% of these were upto date on the last day of measurement. Of the WordPress sites thatupdated their CMS, 56.4% did so to stay up to date with a newWordPress version being released. The other 43.6% who were outof date on the first day of measurement took 5 days, on average,to update their website an average of 7 subversions.
% of hacked % recomp. Odds ratiowebsites for recompromise
Up-to date when compromised 29.1% 22.6% 1Never updated 66.2% 33.5% 1.72 (1.63, 1.81)Updated after compromise 4.7% 17.0% 0.70 (0.62, 0.79)
TABLE 5: Observed updating behavior WordPress websiteshacked with drive-by-downloads, and the effect on recompromiserates.
Table 5 examines how often WordPress gets updated aftera breach. 29.1% of WordPress websites were up-to-date whenthey were hacked. Of the remaining sites, 4.7% updated after acompromise and 66% continued to run the outdated software. Butwhat impact does the decision whether or not to update haveon recompromise? We can see that 22.6% of already updatedWordPress websites are recompromised, compared to 33.5% ofsites that never updated. Surprisingly, the group that fares best ofall are those websites that are updated only after a compromisetakes place: they are recompromised just 17% of the time. Thus,the outdated websites that do get hacked would be wise to updateto the latest version, likely plugging the hole that the attacker usedto get in the first time.
6 DISCUSSION
We now sum up the results of the prior sections by first revisitingthe original hypotheses and second discussing how the results canbe leveraged by security engineers.
Evaluating Research Questions We summarize the analysis ofthe previous section by returning to the original research questions.

IEEE TRANSACTIONS ON DEPENDABLE AND SECURE COMPUTING (IN SUBMISSION) 10
H0 (Running a CMS pos. RF) Supported for search-redirection attacks, not uniformly for phishing
H0b (Some CMS types are RFs) Broadly supportedH0c: (Some CMS add-ons are RFs) Broadly supported.H1 (Some server types are RFs) Broadly supportedH2 (CMS market share pos. RF) Broadly supported,
across all CMSes and across WordPress subversionsH2b (Outdated unpopular software neg. RF) Supported
across WordPress subversionsH2c (# exploits pos. RF) SupportedH3 (Hiding version info neg. RF) ContradictedH4 (Shared hosting pos. RF) Supported for phishing,
contradicted for search-redirection attacksH5 (HTTPONLY cookie pos. RF) Inconclusive
Many hypotheses are broadly supported, especially that servertype and CMS market share are positive risk factors. We findless support for hypothesis H0 that all CMSes exhibit higherrates of compromise; instead, most CMSes, especially the popularones, are positive risk factors for compromise. Similarly, manyCMS add-on software components are also positive risk factorsfor compromise. Finally, it does not appear that hiding versioninformation is a negative risk factor in most circumstances, but itis unclear how often it may be a positive risk factor.
Making the Results Actionable So what can be made of theseresults? At a high level, the findings can help reduce informationasymmetries regarding security outcomes for different webserverconfigurations [18]. By making security outcomes such as com-promise incidents more directly comparable across of platforms,we can help others make more informed decisions about the rela-tive risks posed. Publishing such data can also motivate softwaredevelopers to improve the security of their code.
We have seen, however, that not all “name-and-shame” poli-cies are consistent with empirical observation. Notably, efforts tocall out websites running outdated software are misguided, sincethey obscure our finding that up-to-date servers tends to be hackedmore often. Instead, relative metrics such as odds ratios can beused to identify the worst offenders and apply peer pressure toimprove. They can also be used as positive reinforcement byencouraging everyone to improve compared to others.
For the system administrator, our results can be applied intwo ways. First, the results can be used to make better choiceswhen choosing among available software types and configuration.Second, after systems have been deployed, the findings can beused to manage heterogeneous configurations (e.g., environmentswith multiple CMSes and server software types). Here, administra-tors can prioritize how defensive countermeasures such as attackdetection should be deployed. Security policies could even be setin accordance with the observed relative risk.
More broadly, we have demonstrated a general method ofstudying how webserver characteristics affect the risk of com-promise. The methods presented here can be applied to othercharacteristics if the data can be collected. Furthermore, oddsratios help to identify relationships that should be tested furtherusing experimental methods.
7 RELATED WORK
While often challenging to carry out, substantial progress hasbeen made over the past several years in conducting large-scalemeasurements of cybercrime. The most relevant work to ours
is from Soska and Christin who use website features to predictwhether a webserver will be hacked in the future [19]. Where weexplicitly parse out webserver features, Soska and Christin let theiralgorithm determine the relevant features.
Some work is particularly relevant due to the results fromstudying the security of webservers. Doupe et al. describe astate-aware fuzzer in which they evaluate vulnerabilities in CMSplatforms [20]. Scholte et al. study vulnerabilities in CMS plat-forms, though they do not relate vulnerabilities to exploits orobserved compromise [21]. Wardman et. al. analyze phishingURLs to find common substrings; their method inadvertentlyfinds vulnerable CMS plugins [22]. Nikiforakis et al. crawl manywebpages on top webservers to measure the quality of third-party JavaScript libraries running on the webservers [2]. John et.al. create “heat-seeking” honeypots for attackers, some runningcommonly exploited CMSes, to observe attacker behavior [23].Moore and Clayton measure the recompromise of webserversabused for phishing and find that attackers using targeted, “evil”Google search queries to discover the webserver is a positive riskfactor for reinfection [24].
Another series of papers are relevant to the compromisedatasets we study. For example, Wang et al. performed a large-scale study of cloaking, which is often caused by search-redirection attacks [25]. Notably, the authors dealt with false posi-tives using clustering. While our data source on search-redirectionattacks focuses exclusively on redirections to unlicensed phar-macies [1], the attack technique is general [26]. Provos et. al.study drive-by-download URLs [27]. They find more outdatedversions of server software on malware landing pages than up-to-date versions.
Various techniques from epidemiology have been applied tocybersecurity, not just case-control studies. For example, Mooreet al. and Zou et al. constructed analytical models to modelthe spread of the the computer worm Code Red as well asefforts to contain it [28] [29]. Holt et al. and Bossler et al. useroutine activity theory to look at factors affecting cybercrimevictimization [30] [31].
A number of studies deploy methods in common with ourown. Notably, Lee describes the use of a small case-control studyto identify characteristics that predispose academics to spear-phishing attempts [32]. This paper was expanded by Thonnardet. al. to identify characteristics that predispose business peopleto targeted attacks [33]. Allodi and Massacci analyze the risk ofa vulnerability being exploited based on the CVSS score using acase-control study [34]. Additionally, Carlinet et. al. use a case-control study to quantify which ISP customer computers are moreat risk to generate malicious traffic [35].
We adopt one of the signals of security hygiene used by [2],while Pitsillidis et al. measure the purity of spam feeds in a mannerconsistent with how we detect false positives in our compromisedatasets [36].
Many studies have been primarily descriptive in nature, thoughsome have managed to tease out the factors affecting the preva-lence and success of attacks. For instance, Ransbotham connectedvulnerability information with intrusion detection system data toshow that open-source software tends to be exploited faster thanclosed-source software following vulnerability disclosure [37].
Our work is distinguished from prior work in two ways.First, we focus extensively on the relationship between webservercharacteristics, notably CMS type and market share, and compro-

IEEE TRANSACTIONS ON DEPENDABLE AND SECURE COMPUTING (IN SUBMISSION) 11
mise. Second, we use the case-control method to understand thecharacteristics of large cybercrime datasets.
8 CONCLUDING REMARKS
We have presented a case-control study identifying several web-server characteristics that are associated with higher and lowerrates of compromise. We joined two infection datasets on phishingand search-redirection attacks with a large sample of webservers,then automatically extracted several characteristics of these web-servers hypothesized to affect the likelihood the webserver willbe compromised. Notably, our approach is data-driven and ouranalysis has focused on security outcomes, not security levels. Bystudying compromise data, we have reported on what factors affectthe likelihood of actually being hacked, not merely what makes asystem vulnerable.
Supported by statistical methods of odds ratios and logisticregression models, we found that certain server types (notablyApache and Nginx) and content management systems (notablyJoomla and WordPress) face higher odds of compromise, rel-ative to their popularity. We also found dozens of WordPressplugins and Joomla extensions that were positive risk factorsfor compromise. We established that a key driving factor behindwhich CMSes are targeted most is the underlying popularity ofthe platform. This in turn led to perhaps our most surprisingfinding: outdated CMS software is hacked less often than up-to-date software. We showed this to be true for the core WordPresssoftware, as well as for 14 of the 19 plugins where we could obtainreliable versioning information. In many respects, this finding canbe thought of as a webserver-based corollary to the old truism fordesktop operating systems that Macs are more secure than PCsbecause they have less market share.
By inspecting a supplementary dataset of 50 000 WordPresswebsites that were hacked to distribute malware, we found that lessthan 5% updated their software after being compromised. Thosethat did, however, were much less likely to be recompromisedlater on: 16% were recompromised, compared to 32% for thosethat never updated. Hence, while our results suggest that websitesneed not rush to update their CMS software prior to compromise,they definitely should do so once a hack has occurred, since it mayclose the hole that allowed the attacker to get in.
We are optimistic that the case-control method employedhere may be applied to many other contexts of cybercrimemeasurement. We note that, when possible, the findings of case-control studies should be complemented by other forms of ex-perimentation that directly isolate explanatory factors. It is ourhope that both retrospective case-control studies and prospectiveexperimentation will be more widely adopted by cybercrimeresearchers, which will in turn yield deeper understanding of theissues defenders should prioritize.
ACKNOWLEDGMENTS
This work was partially funded by the Department of HomelandSecurity (DHS) Science and Technology Directorate, Cyber Se-curity Division (DHS S&T/CSD) Broad Agency Announcement11.02, the Government of Australia and SPAWAR Systems CenterPacific via contract number N66001-13-C-0131. This paper repre-sents the position of the authors and not that of the aforementionedagencies.
REFERENCES
[1] N. Leontiadis, T. Moore, and N. Christin, “Measuring and analyzingsearch-redirection attacks in the illicit online prescription drug trade,” inProceedings of USENIX Security 2011, San Francisco, CA, Aug. 2011.
[2] N. Nikiforakis, L. Invernizzi, A. Kapravelos, S. V. Acker, W. Joosen,C. Kruegel, F. Piessens, and G. Vigna, “You are what you include: Large-scale evaluation of remote JavaScript inclusions,” in ACM Conference onComputer and Communications Security, 2012, pp. 736–747.
[3] J. Schlesselman, Case-control studies: design, conduct, analysis. OxfordUniversity Press, USA, 1982, no. 2.
[4] R. Doll and A. Hill, “Lung cancer and other cuases of death in relationto smoking; a second report on the mortality of british doctors,” BritishMedical Journal, vol. 2, pp. 1071–1081, Nov. 1956.
[5] Verisign, “The domain name industry brief,” Apr. 2013, https://www.verisigninc.com/assets/domain-name-brief-april2013.pdf. Last accessedMay 1, 2013.
[6] “PhishTank,” 2014, https://www.phishtank.com/.[7] “Anti-Phishing Working Group,” 2014, http://www.antiphishing.org/.[8] APWG, “Global phishing survey: Trends and domain name
use in 2H2012,” 2013, http://docs.apwg.org/reports/APWGGlobalPhishingSurvey 2H2012.pdf. Last accessed May 5, 2013.
[9] N. Leontiadis, T. Moore, and N. Christin, “Pick your poison: pricingand inventories at unlicensed online pharmacies,” in ACM Conference onElectronic Commerce, 2013.
[10] W3techs, “Market share trends for content management systems,” http://w3techs.com/technologies/history overview/content management/. Lastaccessed May 3, 2013.
[11] “MaxMind GeoIP,” 2013, https://www.maxmind.com/en/geolocationlanding.
[12] “FDIC institutions,” 2013, http://www2.fdic.gov/idasp/Institutions2.zip.[13] J.-H. Hoepman and B. Jacobs, “Increased security through open source,”
Communications of the ACM, vol. 50, no. 1, pp. 79–83, 2007.[14] M. Maunder, “Zero day vulnerability in many Word-
Press themes,” 2011, http://markmaunder.com/2011/08/01/zero-day-vulnerability-in-many-wordpress-themes/. Last accessedOctober 7, 2014.
[15] P. Chapman, “‘New software version’ notifications for yoursite,” 2009, http://googlewebmastercentral.blogspot.com/2009/11/new-software-version-notifications-for.html.
[16] “URLFind,” 2013, http://urlfind.org/.[17] StopBadware and Commtouch, “Compromised websites: An
owners perspective,” 2012, https://www.stopbadware.org/files/compromised-websites-an-owners-perspective.pdf.
[18] R. Anderson and T. Moore, “The economics of information security,”Science, vol. 314, no. 5799, pp. 610–613, Oct. 2006.
[19] K. Soska and N. Christin, “Automatically detecting vulnerable websitesbefore they turn malicious,” in Proceedings of the 23rd USENIX SecuritySymposium (USENIX Security’14), San Diego, CA, Aug. 2014, pp. 625–640.
[20] A. Doupe, L. Cavedon, C. Kruegel, and G. Vigna, “Enemy of the State:A State-Aware Black-Box Vulnerability Scanner,” in Proceedings of theUSENIX Security Symposium, Bellevue, WA, August 2012.
[21] T. Scholte, D. Balzarotti, and E. Kirda, “Quo vadis? A study of theevolution of input validation vulnerabilities in web applications,” inFinancial Cryptography and Data Security. Springer, 2012, pp. 284–298.
[22] B. Wardman, G. Shukla, and G. Warner, “Identifying vulnerable websitesby analysis of common strings in phishing URLs,” in Proceedings of theFourth eCrime Researchers Summit. IEEE, 2009, pp. 1–13.
[23] J. P. John, F. Yu, Y. Xie, A. Krishnamurthy, and M. Abadi, “Heat-seeking honeypots: Design and experience,” in Proceedings of the 20thInternational Conference on the World Wide Web. ACM, 2011, pp.207–216.
[24] T. Moore and R. Clayton, “Evil searching: Compromise and recompro-mise of internet hosts for phishing,” in 13th International Conference onFinancial Cryptography and Data Security, Barbados, February 2009.
[25] D. Wang, S. Savage, and G. Voelker, “Cloak and dagger: Dynamics ofweb search cloaking,” in Proceedings of the 18th ACM Conference onComputer and Communications Security. ACM, 2011, pp. 477–490.
[26] Z. Li, S. Alrwais, Y. Xie, F. Yu, and X. Wang, “Finding the linchpinsof the dark web: A study on topologically dedicated hosts on maliciousweb infrastructures,” in 34th IEEE Symposium on Security and Privacy,2013.
[27] N. Provos, P. Mavrommatis, M. Rajab, and F. Monrose, “All your iFramespoint to us,” in Proceedings of the 17th USENIX Security Symposium,Aug. 2008.

IEEE TRANSACTIONS ON DEPENDABLE AND SECURE COMPUTING (IN SUBMISSION) 12
[28] D. Moore, C. Shannon, and J. Brown, “Code-Red: a case study onthe spread and victims of an internet worm,” in Proceedings of 2ndACM/USENIX Internet Measurement Workshop, Marseille, France, Nov.2002, pp. 273–284.
[29] C. C. Zou, W. Gong, and D. Towsley, “Code red worm propagationmodeling and analysis,” in Proceedings of the 9th ACM Conference onComputer and Communications Security. ACM, 2002.
[30] A. M. Bossler and T. J. Holt, “On-line activities, guardianship, andmalware infection: An examination of routine activities theory,” Inter-national Journal of Cyber Criminology, vol. 3, no. 1, pp. 400–420, 2009.
[31] T. J. Holt and A. M. Bossler, “Examining the applicability of lifestyle-routine activities theory for cybercrime victimization,” Deviant Behavior,vol. 30, no. 1, pp. 1–25, 2008.
[32] M. Lee, “Who’s next? identifying risks factors for subjects of targetedattacks,” in Proceedings of the Virus Bulletin Conference, 2012, pp. 301–306.
[33] O. Thonnard, L. Bilge, A. Kashyap, and M. Lee, “Are you at risk?Profiling organizations and individuals subject to targeted attacks,” inFinancial Cryptography and Data Security, 2015.
[34] L. Allodi and F. Massacci, “Comparing vulnerability severity and ex-ploits using case-control studies,” ACM Transactions on Information andSystem Security, vol. 17, no. 1, pp. 1:1–1:20, 2014.
[35] L. Carlinet, L. Me, H. Debar, and Y. Gourhant, “Analysis of computerinfection risk factors based on customer network usage,” in Conferenceon Emerging Security Information, Systems and Technologies. IEEE,2008, pp. 317–325.
[36] A. Pitsillidis, C. Kanich, G. Voelker, K. Levchenko, and S. Savage,“Taster’s choice: A comparative analysis of spam feeds,” in ACMSIGCOMM Conference on Internet Measurement, 2012, pp. 427–440.
[37] S. Ransbotham, “An empirical analysis of exploitation attempts based onvulnerabilities in open source software,” in Proceedings (online) of the9th Workshop on Economics of Information Security, Cambridge, MA,Jun. 2010.
[38] “BlindElephant web application fingerprinter,” http://blindelephant.sourceforge.net/.
[39] “WhatWeb,” 2013, http://whatweb.net/.[40] “Plecost,” 2013, https://code.google.com/p/plecost/.[41] “Exploit database,” 2013, http://www.exploit-db.com.
APPENDIX ACOMPARISON OF METHODS TO IDENTIFY CMSTYPE
While a number of tools provide CMS detection as part ofmore general-purpose web-service fingerprinters (e.g., BlindEle-phant [38], WhatWeb [39] and the WordPress-specific Plecost[40]), we opted to build the custom CMS detector describedabove to improve efficiency and accuracy over existing tools.Both BlindElephant and Plecost issue many HTTP requests tocharacterize each server. We ruled these tools out because weneeded a lightweight solution that could quickly detect CMStype and version for hundreds of thousand webservers. Like ourmethod, WhatWeb issues a single HTTP request per server (at itslowest “aggressiveness” level). Combined with its multi-threadeddesign, WhatWeb should offer fast identification of CMS versions.We therefore decided to evaluate its performance and accuracycompared to our own system.
We selected 2 000 random URLs from the webserver datasetand attempted to identify the CMS type using our system andWhatWeb’s. In terms of efficiency, we were surprised to findthat WhatWeb took nearly twice as long to finish, despite beingmultithreaded. We speculate that the difference in speed can beattributed to its general-purpose nature. We also found that our sys-tem was substantially more accurate, identifying the correct CMSon more websites and having far fewer inaccurate classifications.We manually inspected all disagreements between WhatWeb andour tool in order to establish the following detection, false positiveand false negative rates:
Method FN Rate FP Rate TN Rate TP Rate # Results
WhatWeb 40.7% 6.1% 74.3% 59.3% 1 297Our Method 5.4% 0.1% 99.0% 92.2% 1 674
Based on these findings, we conclude that our custom methodis best-suited to the task of identifying CMS type.
APPENDIX BDOES CMS POPULARITY AFFECT EXPLOITABIL-ITY?Results from the Subsection 3.1 showed that the some of themost popular CMS platforms, notably WordPress and Joomla, arecompromised disproportionately often. We now dig a bit deeperto see if there is a statistically robust connection between CMSpopularity and compromise. Before inspecting the compromiserates directly, we first compare CMS popularity to the number ofreadily-available exploits targeting the CMS platform.
For this analysis, we considered many more CMSes than inother sections. We consider all 52 CMS platforms tracked in [10].These additional CMSes all have very small market shares, andso not enough registered in our datasets to include in the otheranalysis. For each CMS we collected the following two indicators:# Servers: We took the market share for each CMS from [10] asof January 1, 2013 and multiplied it by population of registered.com domains (106.2 million) and the estimated server responserate (85%) from [5].# Exploits: The Exploit Database [41] is a search engine thatcurates working and proof-of-concept exploits from a variety ofsources, including the popular penetration-testing tool Metasploit.We searched the Exploit Database for each CMS and recorded thenumber of hits as a measure of how “exploitable” each CMS is.We discarded any results not matching the searched-for CMS. Wedeem this to be a more accurate measure of attacker interest in andthe “hackability” of a content management system than would becounting the vulnerabilities reported for a CMS. Unlikely manyvulnerabilities, exploits provide directly actionable information tocompromise machines.
We hypothesize that the number of exploits available for aCMS depends directly on the number of servers in use. Becauseboth variables are highly skewed, we apply a log transformationto each. Here is the statement of the linear regression:
lg (# Exploits) = c0 + c1 lg (# Servers) + ε.
The regression yields the following results:
coef. 95% conf. int. SignificanceIntercept -8.53 (-3.37, -13.69) p = 0.002lg(# Servers) 0.64 (0.33, 0.95) p = 0.0001
Model fit: R2 = 0.23
Indeed, this simple linear model has a reasonably good fit.While there is additional unexplained variation, this lends indirectsupport to H2. Due to the collinearity of these variables, we onlyuse one of them (# Servers) in our regressions in this paper.

IEEE TRANSACTIONS ON DEPENDABLE AND SECURE COMPUTING (IN SUBMISSION) 13
John Wadleigh is a research assistant in theDepartment of Computer Science and Engi-neering at Southern Methodist University. Heis pursuing an MS in computer science, andhis research has investigated the prevalence ofweb-based malware and the sale of counterfeitgoods.
Tyler Moore is an Assistant Professor of Com-puter Science and Engineering at SouthernMethodist University. Also at SMU, he servesas Director of the Economics and Social Sci-ences program at the Darwin Deason Institutefor Cyber Security and a Fellow at the JohnGoodman Tower Center for Political Studies. Hisresearch focuses on security economics, cyber-crime measurement, and cybersecurity policy.
Marie Vasek is a PhD student in the com-puter science department at Southern MethodistUniversity and the research scientist at Stop-Badware. Her research interests include secu-rity economics and cybercrime, particularly web-based malware.