
IEEE TRANSACTIONS ON DEPENDABLE AND...
15
Hybrid Intrusion Detection with Weighted Signature Generation over Anomalous Internet Episodes Kai Hwang, Fellow, IEEE, Min Cai, Member, IEEE, Ying Chen, Student Member, IEEE, and Min Qin Abstract—This paper reports the design principles and evaluation results of a new experimental hybrid intrusion detection system (HIDS). This hybrid system combines the advantages of low false-positive rate of signature-based intrusion detection system (IDS) and the ability of anomaly detection system (ADS) to detect novel unknown attacks. By mining anomalous traffic episodes from Internet connections, we build an ADS that detects anomalies beyond the capabilities of signature-based SNORT or Bro systems. A weighted signature generation scheme is developed to integrate ADS with SNORT by extracting signatures from anomalies detected. HIDS extracts signatures from the output of ADS and adds them into the SNORT signature database for fast and accurate intrusion detection. By testing our HIDS scheme over real-life Internet trace data mixed with 10 days of Massachusetts Institute of Technology/ Lincoln Laboratory (MIT/LL) attack data set, our experimental results show a 60 percent detection rate of the HIDS, compared with 30 percent and 22 percent in using the SNORT and Bro systems, respectively. This sharp increase in detection rate is obtained with less than 3 percent false alarms. The signatures generated by ADS upgrade the SNORT performance by 33 percent. The HIDS approach proves the vitality of detecting intrusions and anomalies, simultaneously, by automated data mining and signature generation over Internet connection episodes. Index Terms—Network security, intrusion detection systems, anomaly detection, signature generation, SNORT and Bro systems, false alarms, Internet episodes, traffic data mining. Ç 1 INTRODUCTION I NTRUSIONS and anomalies are two different kinds of attacks in an open network environment. An intrusion takes place when an unauthorized access of a host computer system is attempted. An anomaly is observed at the network connection level. Both attack types may compromise valuable hosts, disclose sensitive data, deny services to legitimate users, and pull down network-based computing resources [13], [14]. The intrusion detection system (IDS) offers intelligent protection of networked computers or distributed resources much better than using fixed-rule firewalls. Existing IDSs are built with either signature-based or anomaly-based systems [7], [18]. Signature matching is based on a misuse model, whereas anomaly detection is based on a normal use model. The design philosophies of these two models are quite different, and they were rarely mixed up in existing IDS products from the security industry. A signature-based IDS like SNORT [4], [31] employs a priori knowledge of attack signatures. The signatures are manually constructed by security experts analyzing previous attacks. The collected signatures are used to match with incoming traffic to detect intrusions. These are conventional systems that detect known attacks with low false alarms. However, the signature-based IDS cannot detect unknown attacks with- out any precollected signatures or lack of attack classifiers [33]. Furthermore, signature matching performs well only for single-connection attacks. With the sophistication of attackers, more attacks involve multiple connections. This limits the detection range by signature matching. On the other hand, an anomaly-based system uses a different philosophy. It treats any network connection violating the normal profile as an anomaly [8], [10], [16], [17]. A network anomaly is revealed if the incoming traffic pattern deviates from the normal profiles significantly. Through a data mining approach, anomaly detection discovers temporal characteristics of network traffic. This system can detect unknown attacks and handles multi- connection attacks well. However, anomaly detection may result in higher false alarms. The newly proposed HIDS is designed to solve these problems with much enhanced performance. In this paper, we present a new hybrid intrusion detection system (HIDS). This system combines the positive features of both intrusion detection models to achieve higher detection accuracy, lower false alarms, and, thus, a raised level of cybertrust. Our HIDS is network-based, which should not be confused with the host-based IDS with the same abbreviation by other authors. An adaptive base- support threshold is applied on selected axis attributes in mining the Internet episode rules. The episode rules are used to build the HIDS, which detects not only known intrusive attacks but also anomalous connection sequences. IEEE TRANSACTIONS ON DEPENDABLE AND SECURE COMPUTING, VOL. 4, NO. 1, JANUARY-MARCH 2007 1 . The authors are with the Internet and Grid Computing Laboratory, USC Viterbi School of Engineering, University of Southern California, 3740 McClintock Ave., EEB 212, Los Angeles, CA 90089. E-mail: {kaihwang, mincai, chen2, mqin}@usc.edu. Manuscript received 24 Nov. 2004; revised 4 Dec. 2006; accepted 11 Dec. 2006; published online 2 Feb. 2007. For information on obtaining reprints of this article, please send e-mail to: [email protected], and reference IEEECS Log Number TDSC-0168-1104. Digital Object Identifier no. XXX 1545-5971/07/$25.00 ß 2007 IEEE Published by the IEEE Computer Society
-
Upload
hoangtuyen -
Category
Documents
-
view
223 -
download
4
Transcript of IEEE TRANSACTIONS ON DEPENDABLE AND...

Hybrid Intrusion Detection with WeightedSignature Generation over Anomalous
Internet EpisodesKai Hwang, Fellow, IEEE, Min Cai, Member, IEEE, Ying Chen, Student Member, IEEE, and Min Qin
Abstract—This paper reports the design principles and evaluation results of a new experimental hybrid intrusion detection system
(HIDS). This hybrid system combines the advantages of low false-positive rate of signature-based intrusion detection system (IDS) and
the ability of anomaly detection system (ADS) to detect novel unknown attacks. By mining anomalous traffic episodes from Internet
connections, we build an ADS that detects anomalies beyond the capabilities of signature-based SNORT or Bro systems. A weighted
signature generation scheme is developed to integrate ADS with SNORT by extracting signatures from anomalies detected. HIDS
extracts signatures from the output of ADS and adds them into the SNORT signature database for fast and accurate intrusion
detection. By testing our HIDS scheme over real-life Internet trace data mixed with 10 days of Massachusetts Institute of Technology/
Lincoln Laboratory (MIT/LL) attack data set, our experimental results show a 60 percent detection rate of the HIDS, compared with 30
percent and 22 percent in using the SNORT and Bro systems, respectively. This sharp increase in detection rate is obtained with less
than 3 percent false alarms. The signatures generated by ADS upgrade the SNORT performance by 33 percent. The HIDS approach
proves the vitality of detecting intrusions and anomalies, simultaneously, by automated data mining and signature generation over
Internet connection episodes.
Index Terms—Network security, intrusion detection systems, anomaly detection, signature generation, SNORT and Bro systems,
false alarms, Internet episodes, traffic data mining.
Ç
1 INTRODUCTION
INTRUSIONS and anomalies are two different kinds ofattacks in an open network environment. An intrusion
takes place when an unauthorized access of a hostcomputer system is attempted. An anomaly is observed atthe network connection level. Both attack types maycompromise valuable hosts, disclose sensitive data, denyservices to legitimate users, and pull down network-basedcomputing resources [13], [14]. The intrusion detection system(IDS) offers intelligent protection of networked computersor distributed resources much better than using fixed-rulefirewalls. Existing IDSs are built with either signature-basedor anomaly-based systems [7], [18]. Signature matching isbased on a misuse model, whereas anomaly detection isbased on a normal use model.
The design philosophies of these two models are quite
different, and they were rarely mixed up in existing IDS
products from the security industry. A signature-based IDS
like SNORT [4], [31] employs a priori knowledge of attack
signatures. The signatures are manually constructed by
security experts analyzing previous attacks. The collected
signatures are used to match with incoming traffic to detect
intrusions. These are conventional systems that detect
known attacks with low false alarms. However, the
signature-based IDS cannot detect unknown attacks with-
out any precollected signatures or lack of attack classifiers
[33]. Furthermore, signature matching performs well only
for single-connection attacks. With the sophistication of
attackers, more attacks involve multiple connections. This
limits the detection range by signature matching.On the other hand, an anomaly-based system uses a
different philosophy. It treats any network connection
violating the normal profile as an anomaly [8], [10], [16],
[17]. A network anomaly is revealed if the incoming traffic
pattern deviates from the normal profiles significantly.
Through a data mining approach, anomaly detection
discovers temporal characteristics of network traffic. This
system can detect unknown attacks and handles multi-
connection attacks well. However, anomaly detection may
result in higher false alarms. The newly proposed HIDS is
designed to solve these problems with much enhanced
performance.In this paper, we present a new hybrid intrusion detection
system (HIDS). This system combines the positive features
of both intrusion detection models to achieve higher
detection accuracy, lower false alarms, and, thus, a raised
level of cybertrust. Our HIDS is network-based, which
should not be confused with the host-based IDS with the
same abbreviation by other authors. An adaptive base-
support threshold is applied on selected axis attributes in
mining the Internet episode rules. The episode rules are
used to build the HIDS, which detects not only known
intrusive attacks but also anomalous connection sequences.
IEEE TRANSACTIONS ON DEPENDABLE AND SECURE COMPUTING, VOL. 4, NO. 1, JANUARY-MARCH 2007 1
. The authors are with the Internet and Grid Computing Laboratory, USCViterbi School of Engineering, University of Southern California, 3740McClintock Ave., EEB 212, Los Angeles, CA 90089.E-mail: {kaihwang, mincai, chen2, mqin}@usc.edu.
Manuscript received 24 Nov. 2004; revised 4 Dec. 2006; accepted 11 Dec.2006; published online 2 Feb. 2007.For information on obtaining reprints of this article, please send e-mail to:[email protected], and reference IEEECS Log Number TDSC-0168-1104.Digital Object Identifier no. XXX
1545-5971/07/$25.00 � 2007 IEEE Published by the IEEE Computer Society
The rest of the paper is organized as follows: Section 2reviews related works and distinguishes the new approachfrom previous solutions. Section 3 introduces traffic datamining and describes the HIDS architecture. We presentInternet episode rules and pruning techniques in Section 4.The weighted signature generation is specified in Section 5.We describe the HIDS simulator and attack data sets inSection 6. Experimental performance results are reported inSection 7. Finally, in Section 8, we summarize the contribu-tions and comment on further research needed.
2 RELATED WORKS AND OUR APPROACH
In the past, data mining techniques such as using associationruleswere suggested to build IDS [1], [7], [17], [18], [19], [25],[28]. Lazarevic et al. [17] have distinguished the differencesbetween single-connection and multiconnection attacks. Bothsignature-based and anomaly-based IDSs are sensitive to theattack characteristics, system training history, servicesprovided, and underlying network conditions [21], [24].Data mining techniques are also used to build classificationmodels from labeled attacks [18], [19], [25].
SNORT [4], [31] and Bro [26] are two widely used IDSsthat are based on the misuse model. Other attempts to solvethe intrusion detection and response problem can be foundin [2], [6], [20], [29]. Intrusion detection must be designed tomonitor the connection features at the network, transport,and application layers [3], [12]. The MIT/LL IDS evaluationdata set and reported IDS performance results wereanalyzed in [20], [21], [23]. We use this attack data set withmixed background traffic to test the effectiveness of HIDS.
The concept of frequent episode rules (FERs) was firstproposed by Mannila and Toivonen [22]. Subsequently, Leeet al. [18], [19] suggested a framework to specify FERs foranomaly detection against normal traffic profiles. Theydeveloped a levelwise data mining algorithm for buildingADS. Fan et al. [10] extended Lee et al.’s work to discoveraccurate boundaries between known attacks and unknownanomalies.
Qin and Hwang [28] refined the rule formulationprocedure with an adaptive base-support algorithm to minenormal traffic records. Different axis attribute values applydifferent thresholds. Kaleton Internet [15] built a prototypesystem by combining the two detection systems, but theywork independently without interactions. We considerclose cooperation between the two subsystems. Many otherresearchers have studied supervised anomaly detectionsystems by training over attack-free traffic [1], [7], [8], [10],[17], [27], [34].
In this paper, we propose the HIDS architecture andprove its effectiveness through simulation experiments. TheHIDS integrates the flexibility of ADS with the accuracy of asignature-based IDS. ADS is designed by mining FERs [18],[22], [28] over Internet connections. We developed a newweighted signature generation algorithm to characterizeanomalous attacks and extract their signatures. The newsignatures are generated from anomalies detected by ADS.This idea was inspired by earlier works on weightedassociation rules [30], [32]. This new approach automati-cally enables HIDS to detect similar anomalous attacks inthe future.
3 HYBRID INTRUSION DETECTION SYSTEM (HIDS)
In this section, we first introduce the data mining conceptfor hybrid intrusion and anomaly detection. Then, wedescribe the HIDS architecture, the ADS design, and theconnection features used in ADS and automated signaturegeneration.
3.1 Traffic Data Mining for Network AnomalyDetection
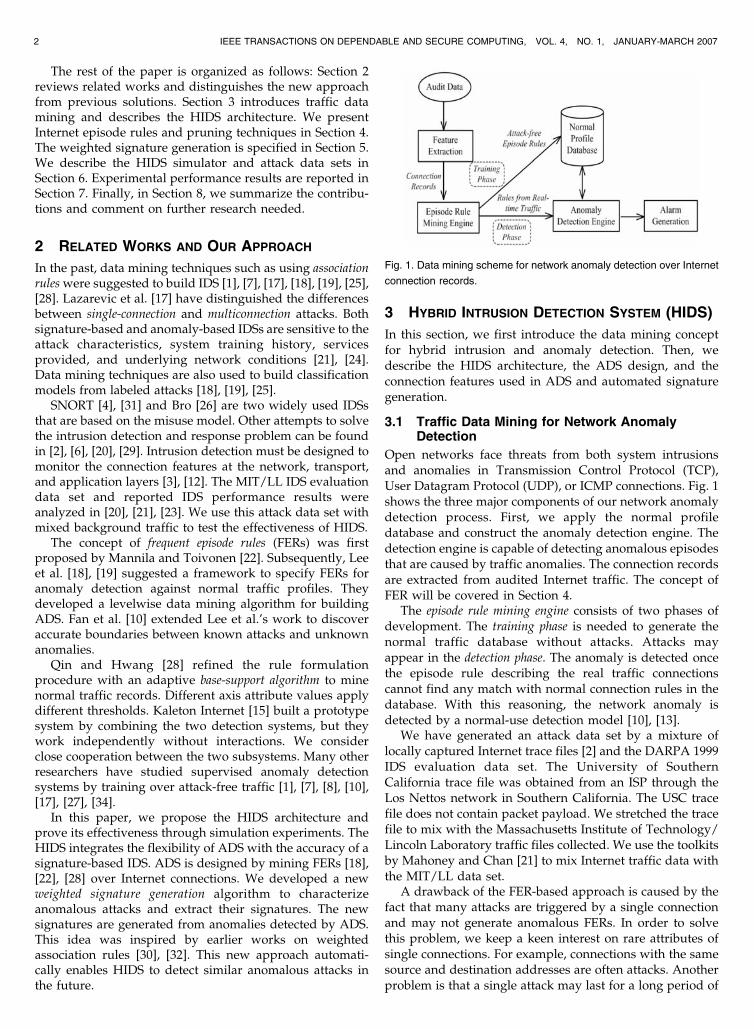
Open networks face threats from both system intrusionsand anomalies in Transmission Control Protocol (TCP),User Datagram Protocol (UDP), or ICMP connections. Fig. 1shows the three major components of our network anomalydetection process. First, we apply the normal profiledatabase and construct the anomaly detection engine. Thedetection engine is capable of detecting anomalous episodesthat are caused by traffic anomalies. The connection recordsare extracted from audited Internet traffic. The concept ofFER will be covered in Section 4.
The episode rule mining engine consists of two phases ofdevelopment. The training phase is needed to generate thenormal traffic database without attacks. Attacks mayappear in the detection phase. The anomaly is detected oncethe episode rule describing the real traffic connectionscannot find any match with normal connection rules in thedatabase. With this reasoning, the network anomaly isdetected by a normal-use detection model [10], [13].
We have generated an attack data set by a mixture oflocally captured Internet trace files [2] and the DARPA 1999IDS evaluation data set. The University of SouthernCalifornia trace file was obtained from an ISP through theLos Nettos network in Southern California. The USC tracefile does not contain packet payload. We stretched the tracefile to mix with the Massachusetts Institute of Technology/Lincoln Laboratory traffic files collected. We use the toolkitsby Mahoney and Chan [21] to mix Internet traffic data withthe MIT/LL data set.
A drawback of the FER-based approach is caused by thefact that many attacks are triggered by a single connectionand may not generate anomalous FERs. In order to solvethis problem, we keep a keen interest on rare attributes ofsingle connections. For example, connections with the samesource and destination addresses are often attacks. Anotherproblem is that a single attack may last for a long period of
2 IEEE TRANSACTIONS ON DEPENDABLE AND SECURE COMPUTING, VOL. 4, NO. 1, JANUARY-MARCH 2007
Fig. 1. Data mining scheme for network anomaly detection over Internet
connection records.

time. To solve this problem, we use connection sequencenumbers, instead of time stamps, to mine connectionsheading to the same destination.
3.2 The HIDS System Architecture
Anomaly-based systems are supposed to detect unknownattacks. These systems are often designed for offlineanalysis due to their expensive processing and memoryoverheads. Signature-based system leverages manuallycharacterized attack signatures to detect known attacks inreal-time traffic. The HIDS illustrated in Fig. 2 integrates theflexibility of ADS with the accuracy of a signature-basedSNORT. The SNORT is connected in cascade with thecustom-designed ADS. These two subsystems join hands tocover all traffic events initiated by both legitimate andmalicious users.
By 2004, SNORT has accumulated more than 2,400 attacksignatures in its database [4]. In HIDS operations, the first
step is to filter out the known attack traffic by SNORTthrough signature matching with the database. The remain-ing traffic containing unknown or burst attacks is fed to theepisode-mining engine to generate frequent episode ruleswith different levels of support threshold. This levelingallows the detection of some rare episodes, declared asanomalies. The frequent episodes are compared withprecomputed frequent episodes from normal traffic. Theepisodes that do not match the normal profiles or matchthem with unusually high frequency are labeled asanomalous.
The anomalous episodes are used to generate signatureswhich capture the anomalous behavior using a weightedfrequent item set mining scheme. These signatures are thenadded to the SNORT database for future detection of similarattacks. Unknown, burst, or multiconnection attacks aredetectable by ADS. The signature generation unit bridges twodetection subsystems in the shaded boxes. This unitcharacterizes the detected anomalies and extracts theirsignatures. We built an ADS by using the FER miningmechanisms to be described in Section 4. The new HIDSdetects many novel attacks hidden in common Internetservices, such as telnet, http, ftp, smtp, e-mail, authentication,and so forth. The HIDS deployment appeals particularly toprotect network-based clusters of computers, resourcesinside internal networks (intranets), and computationalGrids.
3.3 Internet Connection Features
The performance of ADS is directly affected by the featuresused in training and rule generation. Lee and Stolfo [19] andLazarevic et al. [17] used connection features, temporalstatistics, and content features for building IDSs. Table 1summarized the connection and temporal statistics features
HWANG ET AL.: HYBRID INTRUSION DETECTION WITH WEIGHTED SIGNATURE GENERATION OVER ANOMALOUS INTERNET EPISODES 3
Fig. 2. A hybrid intrusion detection system built with a SNORT and an
anomaly detection subsystem (ADS) through automated signature
generation from Internet episodes.
TABLE 1Connection Features and Temporal Statistics Used in HIDS Construction

used in our ADS to generate FERs by training and testing.Since we aim at detecting anomalies of network traffic, thecontent features, which are mainly extracted from systemlog files, are not used in this work. The connection featuresand temporal statistics will be used in HIDS construction.
Connection level features are extracted from rawTCPdump files. They are used in both FER and signaturegeneration. The flags are used to signal special connectionstatus. We listed three different flags: SF, S0, and REJ.Temporal statistics are related to connections with the samereference features. They can be used to improve theaccuracy of signature generation. For example, by trackingthe number of connections initiated from the same source,the Source_Count could be used to set the threshold whenwe generate new signatures. Because the episode rulegeneration does not take domain-specific knowledge intoconsideration, many ineffective or useless rules are gener-ated. How to eliminate useless rules is a major problem intraffic data mining for anomaly detection.
4 INTERNET EPISODE RULES AND PRUNING
TECHNIQUES
An Internet episode is represented by a sequence ofconnection events, such as TCP, UDP, ICMP, or otherconnections. An episode can be generated by legitimateusers or malicious attackers. Frequent episodes mostlyresulted from normal users. A rare episode is likely causedby intruders. Our purpose is to build an ADS that candistinguish the rare or abnormal episodes from the normalor frequent episodes automatically.
4.1 Generation of Internet Episode Rules
In Fig. 3, we show a typical stream of Internet traffic,represented by a sequence of connection events labeled as E1,E2, E3, and so forth These connection events are related tovarious Internet service commands such as http, ftp, smtp,authentication, and so forth. Note that some events mayrepeat to appear in the sequence. The time instants of theseconnections, in seconds, are marked below the events. Afrequent episode is a set of connection events exceeding theoccurrence threshold in a scanning window. A FER isgenerated out of a collection of frequent episodes. The FERis defined over episode sequences corresponding to multi-ple connection events in a roll.
For the first window in Fig. 3, we cover a sequence ofthree connection events: E2, E1, and E3. The event E2triggers the occurrence of events E1 and E2 in a cascade.This leads to the following FER on these three events. Thisrule is detected within a window size w. The rule is backed bya support base s, confidence level c, and minimal occurrence f .
E2 ! E1; E3 ðs; c; w; fÞ: ð1Þ
Support base s refers to the probability of event E2 to occur,and the confidence level c is represented by the probabilityof the joint connection event ðE1; E3ÞSE2 to take placeafter event E2. Formally, we calculate s ¼ Prob:½E2� andc ¼ Prob:½ðE1; E3ÞSE2�=Prob:½E2�.
The support value s reflects the percentage of minimumoccurrences of the episode rule out of the total number ofconnection records audited. The confidence level c is thejoint probability of the minimal occurrence of the jointepisodes out of the support of the left-hand side (LHS)episode. Both parameters s and c are bounded from belowby a minimum support threshold so and a minimum confidencelevel co, respectively, where so and co are preset byexperienced rule designers. The window size w is thescanning period of the window. The minimal occurrence findicates the minimum number of occurrences to establishthe rule in question.
For a real-life example, event E2 could be an authentica-tion service requested at time zero, presented by twoattributes ðservice ¼ authentication; flag ¼ SF Þ, where theflag is defined in Table 1. Events E1 and E3 correspond totwo consecutive SMTP service requests denoted by:ðservice ¼ smtpÞ ðservice ¼ smtpÞ. We obtain the followingFER with a confidence level c ¼ 80 percent for an authenti-cation service followed by two SMTP services detectedwithin a scanning window w ¼ 4 s. The three joint trafficevents account a support level s ¼ 10 percent out of allpossible network connections. The minimal occurrence f ¼1; 200 implies that 1,200 is the minimum number ofoccurrence for the rule to be generated into the rule base.
ðservice ¼ authenticationÞ ! ðservice ¼ smtpÞðservice ¼ smtpÞð0:8; 0:1; 4 s; 1; 200Þ:
ð2ÞAn association rule is aimed at finding interesting
intrarelationships inside a single connection record. TheFER describes the interrelationship among multiple con-nection records. Let T be a set of traffic connections. Ingeneral, an FER is specified by the following expression:
L1; L2;; . . . ; Ln ! R1; . . . ; Rm ðc; s; w; fÞ; ð3Þwhere Li ð1 � i � nÞ and Rj ð1 � j � mÞ are ordered con-nection events in a traffic record set T . We call L1; L2; . . .Ln
the LHS episode and R1; . . . :Rm the RHS (right-hand side) ofthe episode rule. The parameters ðc; s; w; fÞ were definedabove and exemplified in (2).
Normal traffic data mining excludes infrequent connec-tion patterns. This makes the system ineffective in detectinganomalous network connections. By lowering the supportthreshold in the FER generation process, a large number ofredundant rules would be generated. Therefore, we desireto have some rule pruning techniques (in Section 4.4) to
4 IEEE TRANSACTIONS ON DEPENDABLE AND SECURE COMPUTING, VOL. 4, NO. 1, JANUARY-MARCH 2007
Fig. 3. Generation of a frequent episode rule by scanning a stream of Internet traffic connection events from left to right using a small scanning
window.

eliminate redundant rules and reduce the rule search spaceaccordingly.
4.2 A Base-Support Data Mining Scheme
Most mining techniques exclude infrequent traffic patterns.This will make the IDS ineffective in detecting rare networkevents. If we lower the support threshold, then a largenumber of uninteresting patterns associated with frequentservices will be discovered. We introduce a new base-support mining process to handle this problem. The processis specified in Algorithm 1. Our method is improved fromthe levelwise algorithm by Lee et al. [18].
Algorithm 1. Base-Support Traffic Data Mining Algorithm
1: INPUT: Base-support threshold f0, all axis attributes
and the set T of all network connections
2: OUTPUT: New FERs to add into existing rule set L
3: for each axis item set X in T , do
4: calculate support(X);5: end for
6: scan T and compute L ¼ fitemsetY jfðY Þ � f0g;7: repeat
8: generate new epsiode rule sets E ¼ fe0; e1; . . . ; eng,where supportðe0; e1; . . . enÞ � f0 �minfbase supðeiÞg;
9: if E is not empty, then
10: generate FERs from E with confidence e above
minimum confidence eo;11: add the generated FERs into rule set L;
12: end if
13: until E is empty.
By using Lee”s algorithm, one iteratively lowers theminimum support value. Initially, a high minimum supportvalue is chosen to find the episodes related to high-frequency axis attribute values. Then, the procedureiteratively lowers the support threshold by half. This linkseach new candidate FER with at least one new axis value.The procedure terminates when a very small threshold isreached. Let X be an item set. The support base of X denotedby sup baseðXÞ is the support value of the axis item set. Forexample, when choosing the service and flag as the axisattributes, the support base for item set X ¼ ðservice ¼ftp; flag ¼ S0; srchost ¼ 128:1:1:1; destination ¼ 121:1:1:1Þ isdefined by sup baseðXÞ ¼ support ðservice ¼ ftp; flag ¼ S0Þ.The base-support fraction f for item set X is defined by:
fðXÞ ¼ supportðXÞ = base supðXÞ: ð4ÞSimilarly, the base-support fraction of an episode is
defined as the percentage of the number of minimal episodeoccurrences to the total number of records in T , whichcontains the most uncommon axis attributes embedded inthis episode. The minimum support base value of an episodee1; e2; . . . ; en is denoted by minfbase supðeiÞg. To generatean episode, its base-support must exceed a threshold fo, alower bound on f ðXÞ for all qualified item sets.
To construct the normal network profiles, attack-freetraining connection records are fed into the data miningengine. Using Lee’s levelwise algorithm, it is likely for anormal service to appear in an episode rule with anextremely low support value. This is especially true whenthe individual connections are independent of each other.
Our base-support algorithm solves this problem by requir-ing all FERs related to the common services to occur moreoften than others.
4.3 Episode Rule Training from Normal Traffic
Fig. 4 shows the FER generation and rule-matching processin anomaly detection based on Algorithm 1. When attacksare detected by SNORT, their time stamps are passed to thepackets eliminator, and the corresponding traffic flows aredeleted. The rest of the traffic is passed to the ADS. When aFER generated from the traffic does not match the normalFER database, an unknown FER anomaly is suspected.When the matched rule occurs beyond the threshold,multiple FER anomalies are suspected. The FER anomaliesare confirmed by checking some error flags and temporalstatistics listed in Table 1. Otherwise, the traffic connectionis considered normal.
To generate FERs for normal traffic profiles, the attack-free training connection records are fed into the data miningengine. We use the audit data sets collected in weeks 1 and3 of the 1999 MIT/LL IDS evaluation package [27]. Wegenerated 92 FERs with the limited training time. We do notuse FERs with extremely low support values. After findingFERs from each day’s audit record, we simply merge theminto a large rule set by removing all redundant rules basedon the pruning techniques discussed in Section 4.4. Towardthis end, we keep a keen interest on rare attributes of bothsingle and multiple connections.
We use the Bro toolkit [30] to extract useful features fromtraffic connection records. SNORT sends its time stamp tothe packet eliminator to eliminate that packet from repeatedchecking by the ADS. A major task is to determine theminimum occurrence of the traffic episodes. We distinguishthree alert types from three possible sources: the packet-levelalerts raised by SNORT, unknown FER anomalies from no-matching rules, and massive FER anomalies due to burst ofmultiple attacks. The ADS generated 187,059 traffic episoderules in 10 days.
The temporal statistics are collected from the networkconnection features. A relaxation factor � is defined by thescaling ratio of the minimal occurrence f of an FER in a
HWANG ET AL.: HYBRID INTRUSION DETECTION WITH WEIGHTED SIGNATURE GENERATION OVER ANOMALOUS INTERNET EPISODES 5
Fig. 4. Matching with frequent episode rules to detect anomalies in
incoming traffic.

window to the maximum occurrences m of the rule during
the training period. This parameter decides the threshold
value actually used to raise an alert. The factor affecting the
false alarm rate is illustrated in Fig. 5. The maximum false
alarm is observed when � ¼ 1, and we choose � � 1. An
FER is anomalous if its minimal occurrence f exceeds the
maximum number m, as formally conditioned below:
f > � m: ð5ÞWhen this condition is met, we signal an anomaly alert. We
need to adjust the value of � to reduce the false alarm rate.
As shown in Fig. 5, the number of false alarms drops
sharply as the relaxation factor increases beyond 1.2. When
� exceeds a certain limit, the false alarm rate will not be
reduced further. We find such a critical value in Fig. 5 at
� ¼ 1:20 for all window sizes.
4.4 Pruning of Ineffective Episode Rules
We consider a FER effective if it is applicable and more
frequently used in the anomaly detection process. An
episode rule is ineffective if it is rarely used in detecting
anomalies. Some FERs differ only at the LHS or at the RHS.
Keeping all rules generated will enlarge the search space
and thus increase the overhead. The following FER
transformation laws will reduce the rule search space
significantly.
4.4.1 Transposition of Episode Rules
Comparing the following two FER rules, the item set
ðservice ¼ http; flag ¼ S0Þ is implied by
ðservice ¼ smtp; flag ¼ SF Þ:Therefore, the second rule can be induced by the first rule.
We only need to keep the first rule. The general rule of the
thumb is to make the LHS as short as possible. An item set
implied by an item set on the LHS should be moved to the
RHS if the new rule satisfies the requirement of minimal
confidence.
ðservice ¼ smtp; flag ¼ SF Þ !ðservice ¼ http; flag ¼ S0Þ;ðservice ¼ http; flag ¼ SF Þ:
ð6:aÞ
ðservice ¼ smtp; flag ¼ SF Þ; ðservice ¼ http; flag ¼ S0Þ !ðservice ¼ http; flag ¼ SF Þ:
ð6:bÞDuring the detection phase, we generate only one FER
from a frequent episode. A large number of redundant rulecomparisons could be avoided if more complex rules wereremoved.
4.4.2 Elimination of Redundant Episode Rules
In general, rules with shorter LHSs are more effective thanrules with longer LHSs. This is because shorter rules areoften much easier to compare. For example, in the followingrule,
ðservice ¼ httpÞðservice ¼ authenticationÞ !ðservice ¼ smtpÞð0:6; 0:1Þ: ð7Þ
The rule above is considered ineffective with the existenceof the following rule:
ðservice ¼ authenticationÞ ! ðservice ¼ smtpÞ ð0:65; 0:1Þ:ð8Þ
The authentication is related only to the smtp operation; thehttp does not affect the other two item sets. Therefore,ðservice ¼ httpÞ can be ignored. Longer rules may introducesome redundant information. Removing them from thenormal profile will reduce the false alarms.
4.4.3 Reconstruction of Episode Rules
Many FERs detected from the network traffic have sometransitive patterns. Suppose we have two rules A ! B andB ! C in the rule set. Then, the longer rule A ! B, C isimplied. Since we reconstruct this rule from two shorterrules, the longer rule A ! B, C becomes redundant. Thereconstruction helps us split longer FERs into shorter ones.Rule pruning will reduce the false positive rate in an ADS.We are mainly interested in daily network traffic, like theTCP dump. For example, in the following rule,
ðservice ¼ ftp; srcbyte ¼ 1; 000Þ ! ðservice ¼ smtpÞðservice ¼ authenticationÞ ð9Þ
is ineffective, because it can be reconstructed from thefollowing two shorter rules:
ðservice ¼ ftp; srcbyte ¼ 1; 000Þ ! ðservice ¼ smtpÞ ð10:aÞ
ðservice ¼ smtpÞ ! ðservice ¼ authenticationÞ: ð10:bÞThis reconstruction is more powerful if the window
size is large. For smaller window sizes, the occurrence ofan episode may be longer than the window size, violatingthe basic assumption in FER formation. This reconstruc-tion may result in fewer false alarms. Fig. 6 shows theeffects of rule pruning on the 1999 MIT/LL data sets [20].Both data sets result in the pruning of 40-70 percent of the
6 IEEE TRANSACTIONS ON DEPENDABLE AND SECURE COMPUTING, VOL. 4, NO. 1, JANUARY-MARCH 2007
Fig. 5. Effect of relaxation factor � on false alarms in our anomaly
detection system. The critical value � ¼ 1:2 was set for all window sizes
based on our experimental findings.

redundant episode rules by application of the pruningtechniques above. We generate episode rules based onconnection patterns encountered. A detailed analysis ofthese results and a lot more examples can be found in ourearlier report [28].
5 WEIGHTED SIGNATURE GENERATION FROM
DETECTED ANOMALIES
In this section, we present a weighted signature generationalgorithm to characterize anomalies detected by the ADS.The signature-based SNORT imports these signatures anddetects the same attacks subsequently. The traffic data set isa normal relation table consisting of N connections. Aconnection ci hasM attribute-value pairs < aj; vi;j > , where1 � i � N and 1 � j � M. The attributes are selected fromthe connection features and temporal statistics summarizedin Table 1. Our idea extends from the work on weightedassociation rule mining reported in [30], [32].
The ADS assigns an anomaly score and a normality score
for each connection after processing a traffic data set. Theanomaly score indicates the degree of anomaly that aconnection is deviated from normal traffic, whereas thenormality score indicates how close a connection is relatedto normal traffic. The ADS assigns the anomaly and
normality scores to a given connection by comparing itsFERs with the normal profile. In our ADS, the sum ofanomaly and normality scores is normalized to be 1. Notethat the sum is not necessarily a constant in other anomaly-based detection systems.
Table 2 shows an example of traffic connections andtheir anomaly and normality scores. Given a set ofconnections, as well as their anomaly and normalityscores assigned by ADS, the problem is reduced todiscover the most specific and discriminative patterns ofabnormal connections. A connection pattern correspondsto a subset of < attribute; condition > pairs, whichdetermine possible attribute values in the episode.
We define the anomaly or normality scores of a patternas the sum of all anomaly or normality scores of allconnections matching the pattern. We define signatures asthose patterns that have high anomaly scores but relativelylow normality scores. Apparently, the higher anomaly scorea signature has, the more abnormal connections it wouldmatch. Similarly, the lower normal score a signature has,the less normal connections it would match and the fewerfalse alarms it would expect.
5.1 Weighted Signature Generation
Let I ¼ fi1;i2; . . . ; idg be a set of distinct items and T ¼ft1; t2; . . . ; tNg be a set of transactions. Each transaction ti
HWANG ET AL.: HYBRID INTRUSION DETECTION WITH WEIGHTED SIGNATURE GENERATION OVER ANOMALOUS INTERNET EPISODES 7
Fig. 6. Pruning of 40-70 percent ineffective episode rules from USC Internet trace mixed with MIT/LL attack data set, August 2005. (a) Episode rule
growth. (b) Episode rule pruning rate.
TABLE 2Traffic Connections and Their Anomaly and Normality Scores (Dataset-I)

consists of a subset of items from I. An item set X is asubset of I, and its support supðXÞ is the fraction ofconnection containing X. We find the frequent item setswhose support exceeds a user-specified threshold (min_sup). We represent each connection as a transaction andeach < attribute; value > pair as an item. The pattern of< attribute; condition > pairs are constructed from thefrequent item sets.
Fig. 7 shows the functional components in the signaturegeneration unit introduced in Fig. 2. First, similar abnormalconnections are grouped together using a clusteringanalysis. Then, signatures are extracted for each groupsharing some common characteristics. Attributes values ofeach connection are encoded into item numbers for miningthe abnormal attribute-value pairs. After eliminating non-discriminative item sets, the frequent item sets are decoded
into < attribute; condition > pairs to form the anomalysignatures.
5.2 Cluster Analysis and Attribute Preprocessing
In traffic connections, different types of unknown attacksare often mixed together. The anomaly and normality scoresassigned by ADSs are not sufficient to classify unknownattacks into different groups. It is difficult to discoveraccurate patterns or signatures for different types of attacksif they are mixed together. Different attacks have skeweddistribution on connection volume. For example, differentdenial-of-sevice (DoS) attacks could have a large volume ofshort connections, whereas remote-to-local (R2L) or user-to-root (U2R) attacks could only have a few connections.
Table 3 illustrates the attribute discretization andencoding in a Dataset-I. To separate different types ofattacks, we use cluster analysis to group similar attackstogether and generate signatures for each attack class. Weuse the density-based clustering algorithm by Ester et al. [9]to obtain the partitioned cluster. Connections in low-densityregions are classified as noises and thus omitted.
Since each connection is characterized by symbolicand continuous values, we discretize the attribute valuessuch as src_bytes in Table 3 by the entropy methodintroduced by Fayyad and Irani [11]. We encode eachpair < attribute; value > with an item number. Each itemnumber has six digits. The first two digits represent theattribute index. The remaining digits are discrete sym-bolic values. For example, the pair < proto; tcp > couldbe encoded as 3� 10; 000þ 2 ¼ 030002, where 03 is theindex of attribute prot and 0002 is the index of theattribute value tcp.
5.3 Mining of Weighted Frequent Item Sets
The weighted principle is based on the fact that if aconnection contains an item set X, then it also contains all
8 IEEE TRANSACTIONS ON DEPENDABLE AND SECURE COMPUTING, VOL. 4, NO. 1, JANUARY-MARCH 2007
Fig. 7. Functional components in a weighted signature generation unit.
TABLE 3The Discretization and Encoding of Attributes in Dataset-I
subsets of X. Therefore, the weighted support of subsets ofX must be greater than that of X. Algorithm 2 specifies aweighted a priori algorithm for generating weightedfrequent item sets. The method updates the weightedsupport of an item set using connection weight. Connec-tions are assigned different anomaly scores, and we findfrequent item sets with respect to anomaly scores.
Our signature generation is based on a weighted frequentitem set mining (WFIM) framework. Algorithm 2 extendsfrom this framework to generate anomaly scores. Let wi bethe weight of connection ti, the weighted support of an itemset X is defined by wsupðXÞ ¼ P
ti�X;ti2T wi=P
ti2T wi. Thepurpose is to discover all item sets whose weightedsupports are above the minimum support (min_wsup). Wecall those item sets weighted frequent item sets (WFIs). Theanomaly score weighs a connection. The min_wsup helpsselect desired signatures.
Algorithm 2. Weighted A Priori Algorithm for Generating
Signatures from Anomalies Detected1: INPUT: A set of items I, a set of connections (that is
transactions) T , weight wt of connection t, and
minimum weighted support min_wsup
2: OUTPUT: Weighted frequent item sets X with
wsupðXÞ > min wsup
3: W ¼ Pt2T wt;
4: k ¼ 1;
5: L1 ¼ fiji 2 I ^ wsupðiÞ > min wsupg;{ Find allweighted frequent 1 item sets }
6: repeat
7: k ¼ kþ 1;
8: Ck ¼ apriori genðLk�1Þ; { Generate candidate
item sets }
9: for each connection t 2 T , do
10: Ct ¼ subsetðCk; tÞ; { Candidates contained in t }
11: for each candidate item set c 2 Ct, do12: c:weightþ ¼ wt; { Add connection weight }
13: end for
14: end for
15: Lk ¼ fc 2 Ckjc:weight = W � min wsupg;16: until Lk ¼ ;17: return X ¼ [Lk.
We consider the all weighted connections miningprocess, which is equivalent to transactions in the a priorialgorithm [30]. The following algorithm is specified forweighted anomaly signature generation. If the support of anitem set exceeds min_sup, then all its subsets must besupported. This principle is used by the a priori algorithmto effectively prune candidate item sets. We add items toitem sets that are sufficiently large. We follow a weighted apriori principle: If the weighted support wsupðXÞ of an itemset X exceeds min_wsup, all of its subsets have theirweighted support exceeding min_wsup as well.
5.4 Signature Extraction and Mapping
For a given min_wsup threshold, the WFIM scheme dis-covers all WFIs whose weighted supports exceed thethreshold. When we consider many features as discussedin Section 3.2, the number of discovered WFIs could be toolarge to construct the precise anomaly signatures. In
particular, there are many redundant WFIs that have to be
pruned before signatures can be generated. Instead of using
all WFIs, we adopt a notion of maximal weighted frequent item
sets (MWFIs) as a compact representation of all WFIs used.An MWFI is defined as a weighted frequent item set for
which none of its immediate supersets has a support above
themin_wsup threshold. Since any subset of an MWFI is also
a WFI, the number of WFIs that an MWFI represents will
increase exponentially with the number of items in an
MWFI. For example, an MWFI with k items could represent
all 2k � 2 WFIs. When min_wsup is 90 percent, there is only
one MWFI for the Dataset-I, that is, {10,001, 20,001, 30,148,
40,010}. After the MWFIs of abnormal connections are
discovered, we extract signatures by decoding the item
numbers in MWFIs into < attribute; condition > pairs. The
< attribute; condition > pairs represent the abstract signa-
tures of the detected anomaly. These abstract signatures are
then mapped into specific signatures of a target IDS system
such as SNORT or Bro.Table 4 shows how connection attributes are mapped
into the keywords in SNORT rules. Besides the compact
representation of frequent item sets, we eliminate indis-
criminative ones that appear very often in normal traffic.
Since the min_sup threshold is relatively low to discover
frequent item sets in normal traffic, the number could be
very large. Instead, we recalculate the weighted support of
previous MWFIs by using normality scores and eliminate
the ones with large support. Recall that in the MWFI for
Dataset-I, the < attribute; condition > pair is decoded as
follows:
ðip proto ¼ icmpÞ; ðicmp type ¼ echo reqÞ;ð1; 480 <¼ src bytes < 1; 490Þ; ðdst count > 10Þ: ð11Þ
The < attribute; condition > pairs form an abstract
signature of the Pod attack. Using the attribute mappings
in Table 4, we translate the signature into a SNORT rule as
follows:
HWANG ET AL.: HYBRID INTRUSION DETECTION WITH WEIGHTED SIGNATURE GENERATION OVER ANOMALOUS INTERNET EPISODES 9
TABLE 4Mappings between Connection Attributes and SNORT Rule
Keywords
alert icmp$EXTERNAL NET any <> $HOME NET any
ðmsg :00 possible pod attack00; itype : 8;dsize : 1; 480 <> 1; 490; threshold : type both; track by dst;
count 10 seconds 1; sid : 900; 001; rev : 0; Þ:ð12Þ
6 HIDS SIMULATION AND RAW DATA COLLECTION
This section introduces the HIDS simulator architecture, the
attack data set used, and the Internet trace applied in our
security experiments to generate the performance results.
6.1 The HIDS Simulator and Attack Data Sets
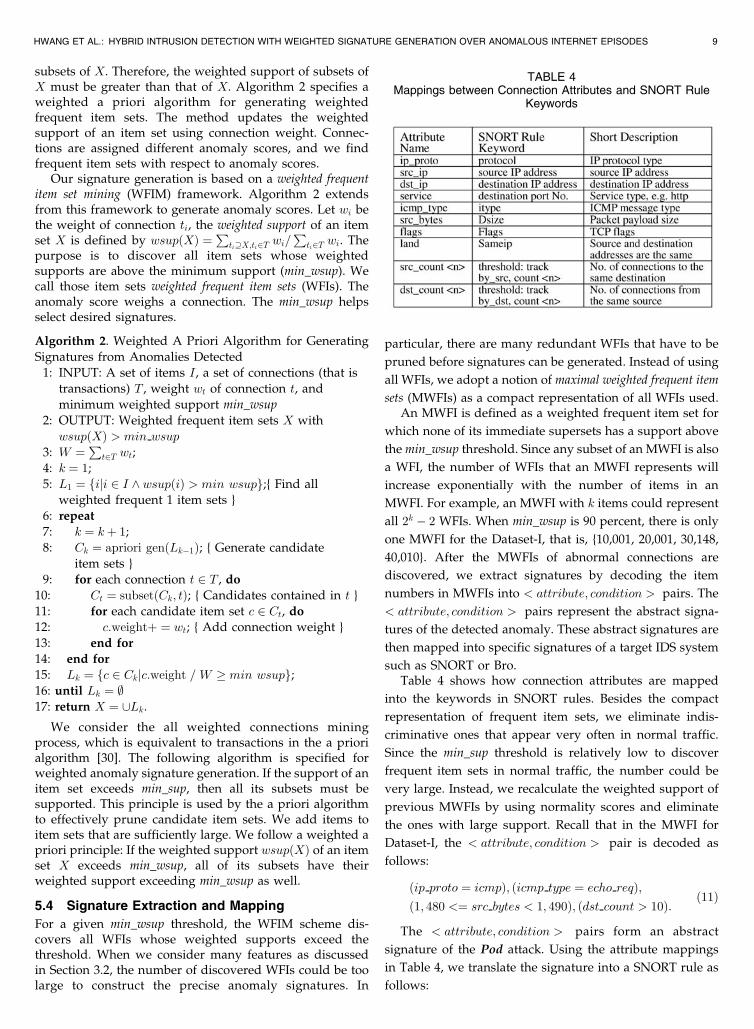
Fig. 8 shows the functional blocks in the HIDS simulator
built at USC. This system was simulated on a Dell Linux
server. The system consists of SNORT 2.1 for detecting
known attacks, an FER-based ADS for detecting anomalies,
and a signature generator between them. The installed
SNORT 2.1 is a lightweight network IDS with more than
2,000 signatures in its database [31]. The packet eliminatorremoves those attacks already detected by SNORT. Theeliminator applies the time stamps to eliminate packets toavoid repeated work by the ADS.
An episode mining engine was built in the simulator togenerate the FER database and the anomaly log files. The sizeof the FER database is decided by training data andthreshold. We applied the 1999 MIT/LL weeks 1 and 3attack-free training data set to obtain 92 FER rules fornormal traffic. This FER database is sufficient for oursimulation study. The storage requirements for bothsignature database and the FER database are rather smallin our simulator. In real-life practice, the FER database maygrow to several thousand of rules.
We used the MIT/LL data set [20], [21] to evaluate theperformance of our HIDS. There are, in total, more than200 attacks in the MIT/LL data set, consisting of 58 DoSattacks, 62 R2L attacks, 31 U2R attacks, 44 Probe or portscanning attacks, and six secret or unknown attacks. Someof the attacks repeat many times at different days. Theseattacks are included at weeks 4 and 5 of the data sets.
Since the background traffic in the MIT/LL data set issynthetically generated, it may not represent the real trafficprofile [21], [23]. We used the toolkits by Mahoney andChan [21] to mix the collected trace at USC with the MIT/LL attack data set [20]. The USC trace was obtained from anISP through the Los Nettos network in Southern California.After mixing the real-life background traffic, the entiretraffic data set experimented with is about 1.5 times largerthan the original attack data set from MIT/LL.
6.2 Simulation Parameters and Raw Data Collected
In Table 5, we summarize important system parameters andraw data collected in 10 days of simulated Internet datamining and detection experiments. We use SNORT and anADS built at our laboratory to process the incoming trafficsequentially. In total, 35.025 million packets were processed
10 IEEE TRANSACTIONS ON DEPENDABLE AND SECURE COMPUTING, VOL. 4, NO. 1, JANUARY-MARCH 2007
Fig. 8. The architecture of the HIDS simulator built with SNORT 2.1 and
an anomaly detection subsystem bridged by a weighted signature
generator.
TABLE 5Packet Counts, SNORT Log Files Reported, and Processing Times of SNORT and ADS in 10 Days of Internet Trace Experiments
on the Simulated HIDS at USC

by SNORT. Most traffic involve TCP, UDP, and ICMPpackets, plus a smaller number of ARP and other packets.The number of incidents detected by SNORT was recordedwith 24,619 alerts or log files. The total recorded time ofusing SNORT to scan all traffic packets was 339.276seconds. ADS was used for 1,298.115 seconds to generate37,223 traffic episode rules.
This implies a SNORT processing speed of 86,400 packetsper second or an average detection performance of eightintrusions per second. Compared with SNORT, the ADSdetection speed is relatively lower. The attack spectrumacross 10 days is shown in Fig. 9. With a scanning windowsize of 300 seconds, ADS generated 37,223 episode rules in1,298.115 seconds, which implies 29 rules per second on theaverage. Techniques to eliminate redundant episode rulesreduced the FER space and, thus, the anomaly detectiontime accordingly.
7 EXPERIMENTAL RESULTS AND PERFORMANCE
ANALYSIS
The detection performances of SNORT, Bro, ADS, and HIDSare reported below. ADS detects anomalous Internetconnections without signatures. HIDS is designed to copewith both known and unknown attacks. Through inter-active machine learning, HIDS could enhance its sensitivityto detect all kinds of intrusions or anomalies effectively.
7.1 Performance Metrics for Evaluating IDS
We use three metrics to evaluate the IDS performance,namely, the intrusion detection rate �, false alarm rate �, andreceiver operating characteristic (ROC). The intrusion detec-tion rate (denoted by �) is formally defined by
� ¼ d=n; ð13Þwhere d is the number of detected attacks, and n is the totalnumber of actual attacks. The false alarm rate (denoted by �)measures the percentage of false positives among all normaltraffic events. A formal definition is given by
� ¼ p=k; ð14Þ
where p is the total number of false positive alarms and kaccounts for the total number of connection events. ForTCP, SNORT generates an alarm for every connection.However, for UDP and ICMP, it generates an alarm forevery packet. Therefore, we calculate m by counting all TCPconnections and UDP/ICMP packets. The ROC curveevaluates the tradeoff between the intrusion detection rateand the false positive rate.
7.2 Performance Results of SNORT, Bro, ADS, andHIDS
Fig. 10 plots the daily average detection rate of using thefour IDSs. It shows clearly that the HIDS achieved adetection rate between 25 and 60 percent on various days.This outperforms all three other systems significantly. ADS,Bro, and SNORT have mixed performance that variesbetween 5 and 40 percent in 10 days. HIDS has capturedall attacks detected by either SNORT or ADS. There is avery small overlapping between the attacks detected byboth SNORT and ADS jointly in the feedback loop in Fig. 2.
We plot in Fig. 11 the average detection rate for four attacktypes over 10 days of experiments using the MIT/LL attackdata set. Bro performs best on U2R attacks, whereas ADSfails to detect any U2R attack with a scanning window sizethat equals 300 seconds. We could detect U2R and dataattacks by setting a different window size. HIDS performs
HWANG ET AL.: HYBRID INTRUSION DETECTION WITH WEIGHTED SIGNATURE GENERATION OVER ANOMALOUS INTERNET EPISODES 11
Fig. 9. Attack spectrum of the MIT/LL data set in 10 days, including four
categories of DoS, U2R, R2L, and probe attacks.
Fig. 10. Daily average detection rates of four IDSs over the 1999 MIT/LL
attack data set.
Fig. 11. Average detection rates for four attack types over 10 days.
the best, with 60 percent detection of all DoS attacks. Intotal, ADS has an average of 14 percent detection rate,whereas HIDS detects 40 percent of all attacks, higher than25 percent on SNORT and 27 percent on Bro system.
The time consumed by ADS is mainly attributed to thecomplexity of feature extraction, episode classification, FERgeneration, and matching with the FER database. Due to thesequential processing of IDS followed by ADS, the totalHIDS time is the sum of the two subsystems. The ADS timedominates the total processing time. Therefore, generatingnew signatures reduces the total detection time.
7.3 Effects of False Alarms on IDS Performance
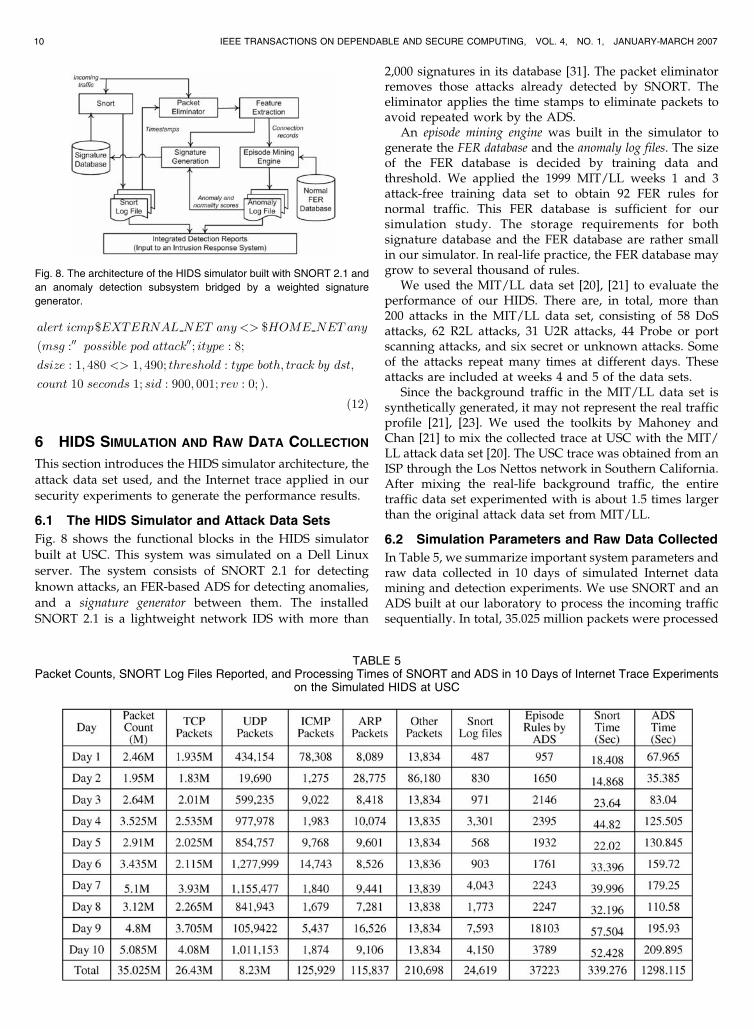
False alarms and intrusion detection accuracy are tworelated concepts. Trade-offs exist between these perfor-mance measures. Accuracy is tied to the intrusion detectionsuccess rate. We report below the effects of false alarms onthe detection results in 10 days of experiments. In Fig. 12,SNORT has less than 1 percent false alarms. The recordedADS false alarm rate was 3.2 percent in day 1 and thenreduced to less than 2.2 percent in the remaining days.HIDS has a slightly higher false alarm rate less than3.4 percent. Bro has the lowest false alarm rate, which is lessthan 0.2 percent. The false alarm rate increases with theincrease of scanning window sizes.
SNORT contributed very little to false alarms. It is ADSthat causes most false alarms. With a window of 300seconds or less, we see 11 false alarms in 10 days. For a largewindow size of 7,200 seconds (2 hours), the number of falsealarms increases to 17. The U2R attack has the lowestnumber of false alarms. The DoS and R2L attacks result in 4-6 false alarms, and the Probe attacks result in 2-4 falsealarms. To avoid false alarms, one must use smallerscanning windows. Our recommendation is to limit thewindow size to less than 300 seconds. The ROC curves inFig. 13 show the trade-off performance of four IDSs over allattack types.
The HIDS achieved a low 47 percent detection rate at1 percent false alarms. However, the detection rate can beraised to 60 percent if the false alarms can be tolerated up to30 percent. SNORT has almost a constant 30 percent
detection rate with almost zero false alarms. ADS can reacha 30 percent detection rate if we can tolerate 30 percent falsealarms. The enhanced HIDS performance is obviouslydriven by the ADS performance. As a comparison, Brohas a 22 percent detection rate with almost zero falsealarms. These results confirm the claimed advantages ofHIDS. The balancing point is up to the designer’s choicebetween detection accuracy and tolerance of false alarms.
7.4 Effects of Signature Generation on SNORTPerformance
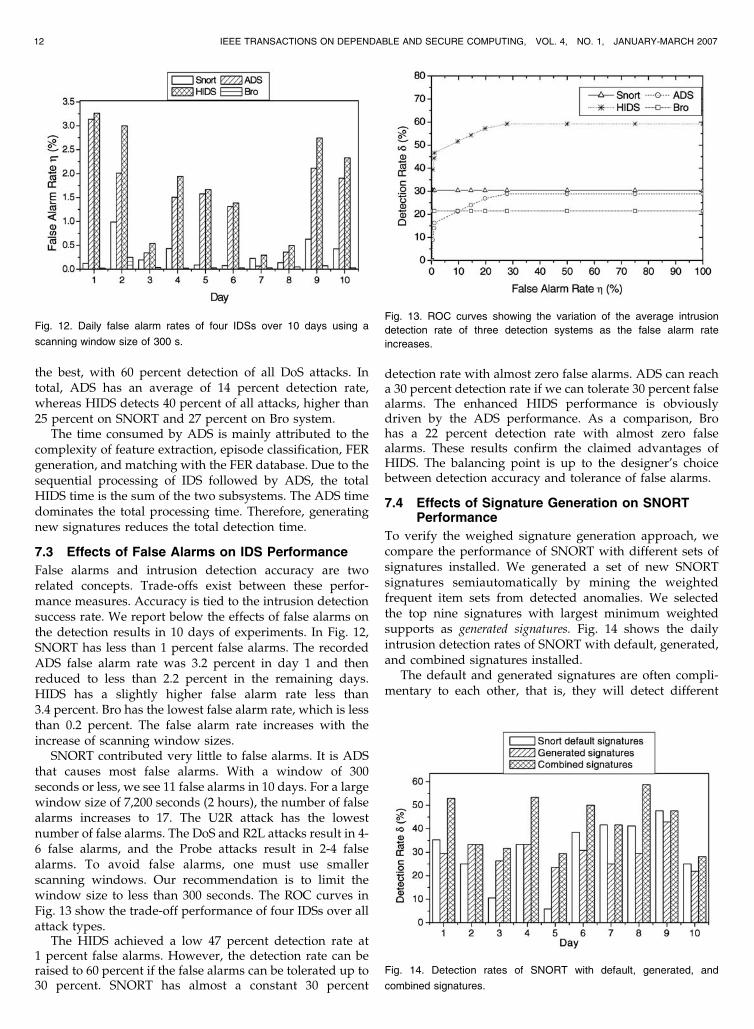
To verify the weighed signature generation approach, wecompare the performance of SNORT with different sets ofsignatures installed. We generated a set of new SNORTsignatures semiautomatically by mining the weightedfrequent item sets from detected anomalies. We selectedthe top nine signatures with largest minimum weightedsupports as generated signatures. Fig. 14 shows the dailyintrusion detection rates of SNORT with default, generated,and combined signatures installed.
The default and generated signatures are often compli-mentary to each other, that is, they will detect different
12 IEEE TRANSACTIONS ON DEPENDABLE AND SECURE COMPUTING, VOL. 4, NO. 1, JANUARY-MARCH 2007
Fig. 12. Daily false alarm rates of four IDSs over 10 days using a
scanning window size of 300 s.
Fig. 13. ROC curves showing the variation of the average intrusion
detection rate of three detection systems as the false alarm rate
increases.
Fig. 14. Detection rates of SNORT with default, generated, and
combined signatures.

attacks. For example, in the first day, the default andgenerated signatures detected 35 and 29 percent attacks,respectively, whereas 53 percent attacks were detectedwhen both sets of signatures were installed. On the otherhand, the two sets of signatures detect overlapped attacksas well. Overall, the added signatures from ADS enhancethe SNORT detection rate by 20-60 percent, except in day 9.This is a remarkable improvement with automated signa-ture generation from the anomalies detected by ADS.
Fig. 15 shows the false alarm rate of SNORT whendifferent sets of signatures were installed in 10 days. Thegenerated signatures introduce very few or zero falsealarms, compared with those flagged by using defaultsignatures. The largest daily increase of false alarms is0.03 percent in day 1. Therefore, after adding generatedsignatures, SNORT only encountered a less than 1 percentincrease in false alarms than using the original signatures.When signature generation is not used, HIDS has a higherfalse alarm rate than SNORT and Bro as shown in Fig. 12.
However, in our weighted signature generation ap-proach, only the most frequent patterns of detectedanomalies are characterized as signatures. By furthereliminating nondiscriminative patterns, the generated sig-natures are quite specific to anomalies detected. Therefore,the newly generated signatures have quite low false alarmrates. Table 6 shows the SNORT processing times underthree conditions. Using only default signatures, it takesSNORT 339.276 seconds to process a total of 35.025 millionpackets in 10 days of trace data.
The combined processing time include both originaldefault signatures and new signatures generated by ADS.The SNORT processing time varies in 10 days. During thefirst four days, the addition of generated signature evenreduced the total time, because the detection rate wasgreatly enhanced as shown in Fig. 14. This resulted from asooner ending of the matching process, when moresignatures are used. After day 5, the processing time beganto increase roughly by 15-25 percent per day. Consideringall 10 days, the addition of new signatures increased theprocessing time to 389.808 seconds. This slight increase by50 seconds in the overhead is totally acceptable for a 10-daytrace of traffic data.
8 CONCLUSIONS AND FURTHER RESEARCH
We summarize major contributions and make somesuggestions for further work on automated detection ofintrusions and anomalies in an open network environment.The hybrid IDS/ADS system applies to protect anynetworked systems, including LAN-based clusters orintranets, large-scale computational Grids, and peer-to-peerservice networks, and so forth. Summarized next arelessons learned from the HIDS construction and conclu-sions that can be made from the reported theories andexperimental results.
1. A new base-support data mining scheme for generatingfrequent episode rules. We proposed a base-support datamining scheme ([Figs. 1 and 2] and Algorithm 1) tofacilitate episode rule generation. CombiningSNORT and our ADS, the HIDS outperforms theSNORT and Bro systems by 100 percent and173 percent, respectively. The HIDS advantagescome from using dynamic data mining thresholdand automated signature generation.
2. Anomaly detection system using Internet episode rules.Both SNORT and ADS subsystems have lowprocessing overhead. The integration of ADS hasupgraded the SNORT detection rate by 40 percentwith less than a 1 percent increase in false alarms.The enlarged signature database in SNORT pays off.Generating more signatures by ADS will furtherenhance the overall performance of the hybridintrusion detection system.
3. Pruning techniques developed to reduce the episode rulespace. Three episode rule pruning techniques aredeveloped to reduce the frequent episode searchspace by 40-70 percent. Without reduction, the rulesearch space may escalate too large to be practical forjust one day’s collection of traffic records. This hassignificantly enhanced the ADS performance.
4. Weighted signature generation enables hybrid intrusiondetection. Our HIDS results in a detection rate of60 percent, which doubles the 30 percent in using
HWANG ET AL.: HYBRID INTRUSION DETECTION WITH WEIGHTED SIGNATURE GENERATION OVER ANOMALOUS INTERNET EPISODES 13
Fig. 15. False alarm rates of SNORT with default, generated, and both
sets of signatures.
TABLE 6SNORT Processing Times Using Default and Generated
Signatures
SNORT and almost triples the 22 percent in usingBro alone. To achieve an even higher detection rate,the false alarms must be maintained below 3 percent.Alerts from intrusions and anomalies detected canbe correlated to result in an even smaller overhead inthe detection process.
For further research, we suggest the two follow-ing issues for continued research and developmenteffort. Both issues demand prototyping and bench-mark experiments.
5. Prototyping HIDS is needed by the research community.The capability and accuracy of the anomaly detectionsystem depend on the training data used in Internettraffic traces. We proved the concept of weightedsignature generation with limited Internet trace datamixed with the MIT/LL attack data set. We suggestextending the simulated experimental work to aprototype HIDS construction. The developer can usethe DETER Testbed to analyze Internet episodeswithout disturbing other legitimate users.
6. Distributed HIDS will advance state of the art incollaborative intrusion detection. Extensive benchmarkexperiments are needed on the DETER testbed forthis purpose. Extending a centralized HIDS to adistributed one is highly recommended with strongcollaboration over multiple IDS sites. This offers alogical solution to protect Grids, clusters, intranets,and so forth. Cyber trust negotiations and frequentalert information exchanges among distributed IDSsites are the key research issues yet to be solved.
ACKNOWLEDGMENTS
The funding support of this work by the US NationalScience Foundation ITR Grant ACI-0325409 is appreciated.The authors thank the GridSec team members for inspiringdiscussions during the courses of this research. In parti-cular, we appreciate the critical comments by Dr. RickyKwok and the data mining experiments assisted by Ms.Hua Liu. The paper is significantly extended from theconcepts and preliminary results reported in the IEEEInternational Symposium on Network Computing andApplications (IEEE NCA ’04) and in the IEEE InternationalWorkshop on System and Network Security (SNS ’05).
REFERENCES
[1] D. Barbara, J. Couto, S. Jajodia, L. Popyack, and N. Wu, “ADAM:Detecting Intrusions by Data Mining,” Proc. IEEE WorkshopInformation Assurance and Security, 2001.
[2] D.J. Burroughs, L.F. Wilson, and G.V. Cybenko, “Analysis ofDistributed Intrusion Detection Systems Using Bayesian MethodsPerformance,” Proc. IEEE Int’l Computing and Comm. Conf.,pp. 329-334, 2002.
[3] M. Cai, K. Hwang, J. Pan, and C. Papadupolous, “WormShield:Fast Worm Signature Generation Using Distributed FingerprintAggregation,” IEEE Trans. Dependable and Secure Computing, to bepublished.
[4] B. Casewell and J. Beale, SNORT 2.1, Intrusion Detection, seconded. Syngress, May 2004.
[5] W. Cohen, “Fast Effective Rule Induction,” Proc. 12th Int’l Conf.Machine Learning. 1995.
[6] F. Cuppens and A. Miege, “Alert Correlation in a CooperativeIntrusion Detection Framework,” Proc. 2002 IEEE Symp. Securityand Privacy, pp. 187-200, 2002.
[7] L. Ertoz, E. Eilertson, A. Lazarevic, P. Tan, J. Srivastava, V. Kumar,and P. Dokas, “The MINDS—Minnesota Intrusion DetectionSystem,” Next Generation Data Mining, MIT Press, 2004.
[8] E. Eskin, A. Arnold, M. Prerau, L. Portnoy, and S. Stolfo, “AGeometric Framework for Unsupervised Anomaly Detection:Detecting Intrusions in Unlabeled Data,” Applications of DataMining in Computer Security, Kluwer Academic Publishers, 2002.
[9] M. Ester, H.-P. Kriegel, J. Sander, and X. Xu, “A Density-BasedAlgorithm for Discovering Clusters in Large Spatial Databaseswith Noise,” Proc. Second Int’l Conf. Knowledge Discovery and DataMining, 1996.
[10] W. Fan, M. Miller, S. Stolfo, W. Lee, and P. Chan, “Using ArtificialAnomalies to Detect Unknown and Known Network Intrusions,”Proc. First IEEE Int’l Conf. Data Mining, Nov. 2001.
[11] U.M. Fayyad and K.B. Irani, “Multi-Interval Discretization ofContinuous-Valued Attributes from Classification Learning,”Proc. Int’l Joint Conf. Artificial Intelligence (IJCAI ’93), pp. 1022-1027, 1993.
[12] S. Floyd and V. Paxson, “Difficulties in Simulating the Internet,”IEEE/ACM Trans. Networking, vol. 9, no. 4, pp. 392-403, Aug. 2001.
[13] K. Hwang, Y. Chen, and H. Liu, “Defending DistributedComputing Systems from Malicious Intrusions and NetworkAnomalies,” Proc. IEEE Workshop Security in Systems and Networks(SSN ’05) held with the IEEE Int’l Parallel & Distributed ProcessingSymp., 2005.
[14] K. Hwang, Y. Kwok, S. Song, M. Cai, Y. Chen, and Y. Chen,“DHT-Based Security Infrastructure for Trusted Internet and GridComputing,” Int’l J. Critical Infrastructures, vol. 2, no. 4, pp. 412-433, Dec. 2006.
[15] Kaleton Internet, “Combination of Misuse and Anomaly IntrusionDetection Systems,” http://www.kaleton.com, Mar. 2002.
[16] K.S. Killourhy and R.A. Maxion, “Undermining an Anomaly-Based Intrusion Detection System Using Common Exploits,” Proc.Int’l Symp. Recent Advances in Intrusion Detection (RAID ’02),pp. 54-73, Sept. 2002.
[17] A. Lazarevic, L. Ertoz, V. Kumar, A. Ozgur, and J. Srivastava, “AComparative Study of Anomaly Detection Schemes in NetworkIntrusion Detection,” Proc. Third SIAM Conf. Data Mining, 2003,http://www.users.cs.umn.edu/~kumar/papers.
[18] W. Lee, S.J. Stolfo, and K. Mok, “Adaptive Intrusion Detection: AData Mining Approach,” Artificial Intelligence Rev., vol. 14, no. 6,pp. 533-567, Kluwer Academic Publishers, Dec. 2000.
[19] W. Lee and S. Stolfo, “A Framework for Constructing Featuresand Models for Intrusion Detection Systems,” ACM Trans.Information and System Security (TISSec), 2000.
[20] R.P. Lippmann and J. Haines, “Analysis and Results of the 1999DARPA Off-Line Intrusion Detection Evaluation,” Proc. Third Int’lWorkshop Recent Advances in Intrusion Detection (RAID ’00),H. Debar, L. Me, and S.F. Wu, eds., pp. 162-182, 2000.
[21] M.V. Mahoney and P.K. Chan, “An Analysis of the 1999 DARPA/Lincoln Lab Evaluation Data for Network Anomaly Detection,”Proc. Int’l Symp. Recent Advances in Intrusion Detection, pp. 220-237,Sept. 2003.
[22] H. Mannila and H. Toivonen, “Discovering Generalized EpisodesUsing Minimal Occurrences,” Proc. Second Int’l Conf. KnowledgeDiscovery and Data Mining, Aug. 1996.
[23] J. McHugh, “Testing Intrusion Detection Systems: A Critique ofthe 1998 and 1999 DARPA Off-line Intrusion Detection SystemEvaluation as Performed by Lincoln Laboratory,” ACM Trans.Information and System Security, vol. 3, no. 4, Nov. 2000.
[24] P. Ning, S. Jajodia, and X.S. Wang, “Abstraction-Based IntrusionDetection in Distributed Environments,” ACM Trans. Informationand System Security, vol. 4, no. 4, pp. 407-452, Nov. 2001.
[25] S. Noel, D. Wijesekera, and C. Youman, “Modern IntrusionDetection, Data Mining, and Degrees of Attack Guilt,” Applicationsof Data Mining in Computer Security, D. Barbara and S. Jajodia, eds.,Kluwer Academic Publishers, 2002.
[26] V. Paxson, “Bro: A System for Detecting Network Intrusions inReal Time,” Proc. Seventh USENIX Security Symp., 1998.
[27] P.A. Porras and P.G. Neumann, “EMERALD: Event MonitoringEnabling Responses to Anomalous Live Disturbances,” Proc. 19thNat’l Computer Security Conf., pp. 353-365, Oct. 1997.
[28] M. Qin and K. Hwang, “Frequent Episode Rules for InternetTraffic Analysis and Anomaly Detection,” Proc. IEEE NetworkComputing and Applications (NAC ’04), Sept. 2004.
[29] D.J. Ragsdale, C.A. Carver, J. Humphries, and U. Pooch,“Adaptation Techniques for Intrusion Detection and ResponseSystems,” Proc. IEEE Int’l Conf. Systems, Man, and Cybernetics,pp. 2344-2349, Oct. 2000.
14 IEEE TRANSACTIONS ON DEPENDABLE AND SECURE COMPUTING, VOL. 4, NO. 1, JANUARY-MARCH 2007

[30] G.D. Ramkumar, S. Ranka, and S. Tsur, “Weighted AssociationRules: Model and Algorithm,” Proc. Fourth ACM Int’l Conf.Knowledge Discovery and Data Mining, 1998.
[31] M. Roesch, “SNORT—Lightweight Intrusion Detection for Net-works,” Proc. USENIX 13th Systems Administration Conf. (LISA ’99),pp. 229-238, 1999.
[32] F. Tao, F. Murtagh, and M. Farid, “Weighted Association RuleMining Using Weighted Support and Significance Framework,”Proc. Ninth ACM Int’l Conf. Knowledge Discovery and Data Mining(SIGKDD), pp. 661-666, 2003.
[33] G.B. White, E.A. Fisch, and U.W. Pooch, “Cooperating SecurityManagers: A Peer-Based Intrusion Detection System,” IEEENetwork, pp. 20-23, Jan. 1996.
[34] Y. Xie, H. Kim, D.R. O’Hallaron, M.K. Reiter, and H. Zhang,“Seurat: A Pointillist Approach to Anomaly Detection,” Proc.Seventh Int’l Symp. Recent Advances in Intrusion Detection (RAID’04).
Kai Hwang received the PhD degree from theUniversity of California, Berkeley in 1972. He isa professor of electrical engineering and com-puter science and director of Internet and GridResearch Laboratory at the University of South-ern California. Dr. Hwang is the founding editorin chief of the Journal of Parallel and DistributedComputing published by Elsevier. He is also onthe editorial board of the IEEE Transactions onParallel and Distributed Systems. Presently, he
leads a GridSec project, which is supported by the US National ScienceFoundation, in developing security-binding techniques and distributeddefense systems against write-once-read-many and direct denial-of-service attacks for trusted Grid, peer-to-peer, and Internet computing.An IEEE Fellow, he specializes in computer architecture, parallelprocessing, Internet and wireless security, P2P, Grid, cluster, anddistributed computing systems. He has published more than 200 scien-tific papers and seven books in these areas. More information can befound at http://GridSec.usc.edu/Hwang.html.
Min Cai received the BS and MS degrees incomputer science from Southeast University,China in 1998 and 2001, respectively. In 2006,he received the PhD degree in computer sciencefrom the University of Southern California. Heworked on multimedia networking at IBM Re-search, Beijing, in 2001. His research interestsinclude peer-to-peer and grid computing, net-work security, semantic Web, and Web servicestechnologies. He is a member of the IEEE.
Ying Chen received the BS degree in computerscience from Huazhong University of Scienceand Technology, China, in 2001 and the MEdegree from Oregon Graduate Institute in 2004.She is presently pursuing the PhD degree incomputer engineering at the University of South-ern California. Her research interests includeInternet security and distributed computingsystems. She is a student member of the IEEE.
Min Qin received the BE and ME degrees incomputer science from Shanghai Jiaotong Uni-versity in 1999 and 2002, respectively. He ispresently pursuing the PhD degree in theComputer Science Department at the Universityof Southern California. His current researchinterests include video streaming and multi-media systems.
. For more information on this or any other computing topic,please visit our Digital Library at www.computer.org/publications/dlib.
HWANG ET AL.: HYBRID INTRUSION DETECTION WITH WEIGHTED SIGNATURE GENERATION OVER ANOMALOUS INTERNET EPISODES 15


![IEEE TDSC, VOL. X, NO. X, MONTH YEAR 1 Robust Correlation ...xwangc/Publications/TDSC-IPDWM-final.pdf · generally known as IP traceback [23], [26], [9], [14] have been developed](https://static.fdocuments.us/doc/165x107/5f3a6f925d56a16e0a299008/ieee-tdsc-vol-x-no-x-month-year-1-robust-correlation-xwangcpublicationstdsc-ipdwm-finalpdf.jpg)