IEEE TRANSACTIONS 4. Numerical Modeling Low-Pressure RF ...
8
IEEE TRANSACTIONS ON PLASMA SCIENCE. VOL 18. NO 4. AUGUST 1990 72s Numerical Modeling of Low-Pressure RF Plasmas DAVID VENDER AND ROD W. BOSWELL Abstract-A particle-in-cell simulation is used to model the plasma generated in a parallel plate RF reactor at low pressure. Nonperiodic boundary conditions are used, and the electric field and particle motion are obtained by finite difference methods leading to the self-consistent creation of sheaths on the boundaries. Rate equations are not em- ployed; rather, model cross sections are used to describe collisions be- tween particles. Ionization is included and the plasma is maintained by fast electrons generated in the RF sheaths. Most of the power dissi- pation is due to the acceleration of ions in the time-average sheath fields. At high applied voltage, the power dissipation is well described by the power law P 0: V5’*. Simple scaling laws for the density and plasma potential are obtained. The effect of ion mass and charge-exchange col- lisions on the ion energy spectrum collected by the electrodes is ex- amined. I. INTRODUCTION N RECENT years, plasma processing of thin films has I become an integral part of the micro-electronics indus- try. The most commonly used reactor involves creating a discharge by radio frequency energy coupled to one elec- trode of a parallel plate system at pressures between lo-> and 10 torr. At the higher pressure end of this range, the plasma can be well modeled using fluid equations, where the particle transport is determined by using mean values of the plasma parameters. This often involves specifying the particle velocity distribution functions, in particular the electron velocity distribution function (EVDF), so that a solution to the equations can be obtained. At low pressures the sheath plays a dominant role in accelerating the electrons to ionizing energy, and this has to be included in any realistic model of the low-pressure plasma. The acceleration of electrons by the sheath has been investigated analytically [l] and by Monte Carlo methods [2]. It has been included in fluid models by treat- ing the electrons accelerated in the sheath separately from the low-temperature bulk distribution, an approach known as the two electron group fluid model [3]. We have stud- ied the low-pressure RF plasma using particle-in-cell (PIC) simulations [4], [5] which have the advantage of being self-consistent, and no assumptions regarding the internal electric fields or the EVDF must be made. It is also unnecessary to account for nonlocal effects on an ad hoc basis since these are modeled naturally. For these rea- sons, although particle simulations are rather computa- tionally intensive, they are particularly useful in modeling Manuscript received November 22. 1989; revised February 27, 1990. The authors are with the Plasma Research Laboratory, Research School of Physical Sciences. The Australian National University. Canberra. ACT, 2601, Australia. IEEE Log Number 9036723. low-pressure plasmas. They are practical since a typical run can be made in about an hour on a modern workstation following the system from initial breakdown to the steady state. The time scale for reaching the steady state is given approximately by the drift time for ions to move from the center of the discharge to the electrodes, i.e., about 10 ps or 100 RF oscillations. We have kept the model of the plasma simple so that the characteristics of the fundamental processes occurring in RF plasmas can be studied separately and comparisons to simple analytic models can be made. In particular, it is convenient in the study of the electron sheath interaction to suppress reflected and secondary electrons originating from the electrodes. Although these electrons play a ma- jor role at higher pressures and at low driving frequencies, their effect at low-pressure is mainly to increase the plasma density. We therefore choose to have completely absorbing boundaries with equal ion and electron currents being drawn to the electrodes. The simulation is not in- tended to model a real gas although the ion mass corre- sponds to atomic hydrogen. We do not address specific processing problems and gas phase chemistry is ne- glected. 11. THE PIC MODEL The PIC technique is an efficient and conceptually sim- ple method of solving a wide variety of complex problems involving a large number of particles moving under the action of self-generated and externally imposed forces. It has been used for over two decades in many fields [6] and in particular in plasma physics [7]. Its application to the study of the low-pressure RF plasmas relevant to plasma processing is relatively recent [4]. The defining characteristic of PIC simulations is the method of calculating the force acting on each particle. The simulation region is divided into a number of cells and the resulting grid is used in the solution of a field equation from which the force on each particle can then be determined. We are considering a planar two-electrode system which can be approximated using a one-dimen- sional model of the plasma. Only electrostatic forces are considered since they are dominant in capacitive RF plas- mas. The relevant field equation is then Poisson’s equa- tion in one dimension. The complete algorithm involves four basic steps: 1) Calculate the charge density on the grid from the 2) Solve Poisson’s equation for the potential and dif- present particle positions. ferentiate this to obtain the electric field. 0093-3813/90/0800-0725$01 .OO 0 1990 IEEE Authorized licensed use limited to: IEEE Xplore. Downloaded on November 6, 2008 at 00:20 from IEEE Xplore. Restrictions apply.
Transcript of IEEE TRANSACTIONS 4. Numerical Modeling Low-Pressure RF ...

IEEE TRANSACTIONS ON PLASMA SCIENCE. VOL 18. NO 4. AUGUST 1990 72s
Numerical Modeling of Low-Pressure RF Plasmas DAVID VENDER A N D ROD W. BOSWELL
Abstract-A particle-in-cell simulation is used to model the plasma generated in a parallel plate RF reactor at low pressure. Nonperiodic boundary conditions are used, and the electric field and particle motion are obtained by finite difference methods leading to the self-consistent creation of sheaths on the boundaries. Rate equations are not em- ployed; rather, model cross sections are used to describe collisions be- tween particles. Ionization is included and the plasma is maintained by fast electrons generated in the RF sheaths. Most of the power dissi- pation is due to the acceleration of ions in the time-average sheath fields. At high applied voltage, the power dissipation is well described by the power law P 0: V5’*. Simple scaling laws for the density and plasma potential are obtained. The effect of ion mass and charge-exchange col- lisions on the ion energy spectrum collected by the electrodes is ex- amined.
I. INTRODUCTION N RECENT years, plasma processing of thin films has I become an integral part of the micro-electronics indus-
try. The most commonly used reactor involves creating a discharge by radio frequency energy coupled to one elec- trode of a parallel plate system at pressures between lo-> and 10 torr. At the higher pressure end of this range, the plasma can be well modeled using fluid equations, where the particle transport is determined by using mean values of the plasma parameters. This often involves specifying the particle velocity distribution functions, in particular the electron velocity distribution function (EVDF), so that a solution to the equations can be obtained.
At low pressures the sheath plays a dominant role in accelerating the electrons to ionizing energy, and this has to be included in any realistic model of the low-pressure plasma. The acceleration of electrons by the sheath has been investigated analytically [ l ] and by Monte Carlo methods [2]. It has been included in fluid models by treat- ing the electrons accelerated in the sheath separately from the low-temperature bulk distribution, an approach known as the two electron group fluid model [3]. We have stud- ied the low-pressure RF plasma using particle-in-cell (PIC) simulations [4], [ 5 ] which have the advantage of being self-consistent, and no assumptions regarding the internal electric fields or the EVDF must be made. It is also unnecessary to account for nonlocal effects on an ad hoc basis since these are modeled naturally. For these rea- sons, although particle simulations are rather computa- tionally intensive, they are particularly useful in modeling
Manuscript received November 22. 1989; revised February 27, 1990. The authors are with the Plasma Research Laboratory, Research School
of Physical Sciences. The Australian National University. Canberra. ACT, 2601, Australia.
IEEE Log Number 9036723.
low-pressure plasmas. They are practical since a typical run can be made in about an hour on a modern workstation following the system from initial breakdown to the steady state. The time scale for reaching the steady state is given approximately by the drift time for ions to move from the center of the discharge to the electrodes, i.e., about 10 ps or 100 RF oscillations.
We have kept the model of the plasma simple so that the characteristics of the fundamental processes occurring in RF plasmas can be studied separately and comparisons to simple analytic models can be made. In particular, it is convenient in the study of the electron sheath interaction to suppress reflected and secondary electrons originating from the electrodes. Although these electrons play a ma- jor role at higher pressures and at low driving frequencies, their effect at low-pressure is mainly to increase the plasma density. We therefore choose to have completely absorbing boundaries with equal ion and electron currents being drawn to the electrodes. The simulation is not in- tended to model a real gas although the ion mass corre- sponds to atomic hydrogen. We do not address specific processing problems and gas phase chemistry is ne- glected.
11. THE PIC MODEL The PIC technique is an efficient and conceptually sim-
ple method of solving a wide variety of complex problems involving a large number of particles moving under the action of self-generated and externally imposed forces. It has been used for over two decades in many fields [6] and in particular in plasma physics [7]. Its application to the study of the low-pressure RF plasmas relevant to plasma processing is relatively recent [4].
The defining characteristic of PIC simulations is the method of calculating the force acting on each particle. The simulation region is divided into a number of cells and the resulting grid is used in the solution of a field equation from which the force on each particle can then be determined. We are considering a planar two-electrode system which can be approximated using a one-dimen- sional model of the plasma. Only electrostatic forces are considered since they are dominant in capacitive RF plas- mas. The relevant field equation is then Poisson’s equa- tion in one dimension. The complete algorithm involves four basic steps:
1) Calculate the charge density on the grid from the
2) Solve Poisson’s equation for the potential and dif- present particle positions.
ferentiate this to obtain the electric field.
0093-3813/90/0800-0725$01 .OO 0 1990 IEEE
Authorized licensed use limited to: IEEE Xplore. Downloaded on November 6, 2008 at 00:20 from IEEE Xplore. Restrictions apply.
726 IEEE TRANSACTlONS ON PLASMA SCIENCE, VOL. 18. NO. 4. AUGUST 1990
3) Interpolate the electric field from the grid points to
4) Integrate the equation of motion for each particle to
The method of charge assignment is important in de- termining the computational speed and the accuracy. In our simulation we assign part of the charge to each of the two nearest grid points so that the particles are effectively finite-width sheets of charge. This scheme, known as the cloud-in-cell (CIC) assignment [8] improves accuracy by smoothing the charge density and thus reducing fluctua- tions that arise from the discrete nature of the simulation. The interpolation of the electric field is symmetric with the charge assignment (i.e., linear interpolation from the two nearest values) so that problems due to particle self- force are avoided [6].
Poisson’s equation is solved using the standard finite difference form
the individual particle positions.
obtain the new position and velocity.
(where 4; is the potential at grid point i, pi the charge density, and A, the distance between grid points) by in- version of the resulting tridiagonal matrix with the chosen boundary conditions. The electric field is calculated mid- way between grid points using
so that no loss of resolution results. The field at the boundaries (i.e., extreme grid points) is estimated by lin- ear extrapolation from the two values nearest to the rele- vant boundary.
The equation of motion is integrated using the “leap- frog” method
Uf+( I /2 ) = U,-(I/2) + %A, m.7
&+I = $1 + V,+(1/2)Af
where s and z, are the particle position and E, the field at time t , so that velocity and
velocity and position are
determined at alternate half-integral time steps. Practical simulations must be scaled to eliminate un-
necessary arithmetic operations and, most importantly, to reduce the number of particles in the simulation. The scal- ing is completely internal to our simulation and all output is in SI units. Each simulation “particle” is actually a charge sheet with a typical surface charge density of - 10” electron charges m-’ so that 2 x lo4 simulation particles actually represent about lOI5 electrons and ions in the 0.2-m-long system. The cell width A, and the time step length Af are chosen so that the dependence of the resulting plasma parameters on the scaling is negligible. Typically, we use 1000 spatial cells and a time step A, = 0.1 ns. With these values and an RF voltage with an am- plitude of 1 kV, the changes resulting from halving A I are less than 1% for dissipated power and density and less
than 3 % for average electron energy. Similar changes re- sult from halving A, and the sheet surface charge density. All simulations run with 10-20 particles per cell and 5 5 particles per Debye length.
Ionizing collisions are treated explicitly by examining a suitable subset of the particles at each time step and determining whether a collision should occur in each case. Ionization is included so that the plasma can be main- tained and a steady state reached. An ionizing collision is modeled by loading a new ion and electron pair at the position of the ionizing electron. The ion velocity is cho- sen from a thermal distribution at 300 K and the energies of the two electrons are determined by sharing the energy left after subtracting the ionization energy E ; from the ion- izing electron. All energy partitions are made equiproba- ble since this is close to the behavior observed in light gases near the ionization threshold [9]. It should be em- phasized that the resulting electron distribution is deter- mined by the dynamics, and no attempt is made to influ- ence the distribution by particle loading or by special handling of the collisions. The effective cross section for ionization is given by ai( U ) = 1.83 X lO-I4/v m2 for 8; 2 15eV.
At the pressure we are considering, electron-neutral scattering will have an appreciable effect on the plasma. Elastic collisions will make the electron distribution nearly isotropic, which is assumed in a one-dimensional model, and they will also give rise to collisional ohmic heating in the plasma [ 101. Since we wish to study the sheath pro- cesses in isolation, we do not include elastic collisions in the present study. The mean free path for elastic collisions is of the same order as the sheath length so the sheath itself is only slightly collisional.
The most important collision process for the ions is res- onant charge exchange modeled by choosing a new ve- locity from a 300-K thermal distribution for the ion par- ticle undergoing charge exchange. The velocity dependence of measured charge-exchange cross-sections [ l l ] is quite weak so we use a cross section that is inde- pendent of ion velocity. At low-pressure thermalization of the fast neutrals generated in charge-exchange colli- sions is relatively slow, and a flux of fast neutrals to the walls can be expected.
111. PLASMA PARAMETERS The simulation is initiated by loading 2000 ion and
electron pairs uniformly in the 0.2-m region between the electrodes. A “quiet” velocity distribution [7] is used to minimize initial oscillations, although this has no effect on the long-term behavior of the plasma. The left elec- trode is driven with a voltage VRF( t ) = VRF sin aRFr, and the right electrode is grounded, Unless otherwise stated, the standard conditions used are WRF/271. = 10 MHz, VRF = 1 kV, m,/m, = 1836, and the effective neutral pres- sure is 20 mtorr.
The temporal variation of the plasma potential V,, in the center of the discharge and the electron and ion currents collected by the driven electrode are shown in Fig. 1. It
Authorized licensed use limited to: IEEE Xplore. Downloaded on November 6, 2008 at 00:20 from IEEE Xplore. Restrictions apply.

VENDER A N D BOSWELL: N U M E R I C A L MODELING OF RF PLASMAS 121
L I 5 - 1 0 :- lam
5 \
0 i ,
t I I O c i
0
5 I I 0 ?a 42
Phase
Fig. 1 . Central plasma potential V,, (dashed). driving voltage (dotted) and electron (positive) and ion (negative) currents to live electrode shown for wR,/2x = I O and I MHz. In high-frequency case ion current is plotted ten times enlarged to show modulation within RF cycle.
can be seen that V,, is very close to the electrode potentials twice during the RF cycle, once at the driven electrode just before 0 = a / 2 and once at the grounded electrode just before 0 = 3 a / 2 . At these times the sheath adjacent to the relevant electrode collapses and a burst of electrons is collected by the electrode. The ion transit time through the sheath is roughly 3 X which is the duration of three RF cycles. The resulting ion current to the elec- trodes is modulated by about 15%, and this modulation can be seen in the figure. Also shown in Fig. 1 are results obtained for cdRF/27r = 1 MHz. At the lower frequency, the plasma potential can more accurately follow a half- wave rectified signal and the ions can closely follow the time variation in the applied voltage. As a result, both the ion and electron currents are strongly modulated.
At 10 MHz the impedance of the system is dominated by the sheath capacitance so that the total current (essen- tially the displacement current through the sheath) leads the RF voltage by approximately a / 2 rad. This displace- ment current, which corresponds to the charging and dis- charging of the sheath capacitance, is continued through the plasma by an oscillating convection current effected by a phase-space rotation of the plasma electrons. Since the system is symmetric, the sheaths alternate between the two electrodes so that one sheath expands as the other is contracting. The motion of the sheaths as well as the mo- mentary collapse can be seen in Fig. 2 which shows the spatiotemporal evolution of the electric field.
The ions drift to the sheaths through a presheath which gives them a directed velocity of - 1.5 X lo4 ms-l at the sheath edge. They are then accelerated through the sheath to an energy corresponding to the average plasma poten- tial ( V p > . The spatial variation of the ion and electron densities ( n i and n, in Fig. 3 ) shows the ion density de- creasing toward the electrodes as ions are accelerated in the sheath field. The electron density in the sheaths varies as a function of the sheath voltage V , ( 2 ) from zero when
Field (kV/m)
r 40
Phase 2rr
Fig. 2. Spatiotemporal evolution of electric field averaged over ten RF cycles. Standard conditions (wR,/27r = 10 MHz, VRI = I kV, rn , / rn , = 1836 and neutral pressure of 20 mtorr) apply to all figures except where explicitly stated.
I I
I O
0 10 Position (cm)
20
Fig. 3. Spatial ion density variation (top) shown with electron density when both boundaries are at zero potential (middle) and when right sheath has collapsed (bottom). A nonlinear scale between 0 and 100 has been used to emphasize low density sheath regions. Traces have been displaced vertically so they can be seen clearly.
the sheath is large to a density equal to ni when the sheath collapses.
The spectrum of the central plasma potential (Fig. 4) shows the characteristics typical of laboratory RF plas- mas. It is dominated by the fundamental at 10 MHz with appreciable peaks also occurring at even harmonics, as would be expected from a rectified signal. A broad peak at the electron plasma frequency (wp , /2n = 232 MHz) is due to the excitation of plasma waves. Above the plasma frequency, the spectrum decreases as 1 /f.
The bulk of the electrons is thermal, and the EVDF shown in Fig. 5 can be well fitted with a Maxwellian dis- tribution of - 2 eV. The wings are hotter than the bulk and, on average, can be fitted with another Maxwellian with a temperature of -35 eV. The temporal develop- ment of the EVDF is intimately bound up with the sheath
Authorized licensed use limited to: IEEE Xplore. Downloaded on November 6, 2008 at 00:20 from IEEE Xplore. Restrictions apply.

728 IEEE TRANSACTIONS ON PLASMA SCIENCE. VOL. 18. NO. 4. AUGUST 1990
1000 bounded plasma and, particularly at low pressure, knowl- edge of the sheath processes is required to understand the
nance. In the steady state, the ionization rate must equal the plasma loss rate to the walls, a situation difficult to achieve in both computer and laboratory experiments at low pressures unless high driving voltages are applied.
100 - - mechanisms of power dissipation and plasma mainte-
= : 10
- B I
0.1
I' I The fast electrons in the simulation are generated in the
0 100 200 300 sheath region. The time-varying voltage across the sheath results in a modulation of the sheath length and electrons impinging on this moving sheath gain energy in the inter- action. The fast electrons resulting from the interaction can be seen in the phase space diagrams shown in Fig. 7. When the sheath forms (between 0 = a/2 and a for the left electrode in the figure), electrons are accelerated away from the wall to well above the ionization velocity of 2 .3 X IO6 ms-'. The instantaneous potential is also shown in the figure as well as the average potential seen by the ions and the phase space distribution of the ions.
The simplest conceptual picture of the electron sheath interaction is known as the hard wall model [ 11, in which the sheath is imagined to behave as a rigid moving wall. The velocity of an electron after a collision with such a wall is
Frequency (MHz)
Fig. 4. Fourier spectrum of central plasma potential. Electron plasma fre- quency is indicated with arrow.
10 1 Io:m 10 '
I0 I I
-1.0 -05 0 0 5 1.0
Velocity (xlll'ms I )
S
Fig. 5 . Electron velocity distribution averaged over 20 RF cycles. Dashed lines indicate separate Maxwellian distributions fitted to bulk and to hot tail. U = - U e + 2v,
4T-----12
Fig. 6. Average electron energy (0) and mean speed of ions arriving at sheath ( * ) as function of applied RF voltage. Arrow indicates ion sound speed.
motion and details of this phenomenon will be published later. The average electron energy is close to the bulk en- ergy and Aows only a very weak dependence on VRF as can be seen in Fig. 6. The average ion drift velocity is also essentially independent of VRF with the ions entering the sheath with a velocity within 10% of the ion sound speed ( c , = m) determined from the average elec- tron energy. It should be pointed out that this arises nat- urally due to the self-consistency of the simulation and shows that even in RF produced plasmas with low-colli- sion frequencies, the diffusion is determined by ambipolar processes.
IV. THE SHEATH The sheath that develops on the system's boundaries
has a profound influence on the characteristics of the
where ue is the initial electron velocity and U , is the sheath velocity. The sheath position can be estimated with rea- sonable accuracy by determining the position where the d 2 4 / d x 2 first becomes nonzero. This position is plotted in Fig. 8 as a function of phase within the RF cycle, showing clearly the collapse and spatial modulation. The small fast oscillations on the sheath position are due to plasma waves excited as the sheath expands into the plasma. The maximum sheath velocity as it moves into the plasma is approximately 2 X lo6 ms-I, hence a ther- mal electron with U , - lo6 ms-' colliding with the sheath would be accelerated to about - 5 x IO6 ms-l, i.e., to about 70 eV which is well above the 15-eV ionization threshold.
The spatial and temporal distribution of all ionizing col- lisions occurring over 20 RF cycles is plotted in Fig. 9. The position of the sheath can be seen quite clearly from the white areas adjacent to the electrodes. Darker areas indicate a larger number of ionizing collisions. Regions where the ionization is most intense stretch out from the electrode at the time the sheath starts to move into the plasma ( - 110" for the driven electrode). This is due to the fast electrons accelerated by the sheath as it expands away from the boundary. The behavior of these electrons could be studied spectroscopically in the laboratory as the cross section for excitation is similar to that for ionization and the presence of the fast electrons should be observed as luminous streaks alternately emanating from each elec- trode. Some evidence of this phenomenon has been pre- sented for an RF silane discharge [ 121.
Varying the amplitude of applied signal has little effect on the RF sheath except at low voltage ( VRF 5 200 V) .
Authorized licensed use limited to: IEEE Xplore. Downloaded on November 6, 2008 at 00:20 from IEEE Xplore. Restrictions apply.

VENDER A N D BOSWELL: NUMERICAL MODELING OF RF PLASMAS 729
-0 O B 4 0 10 20
POSltl‘
Vri (kV)
Fig. 10. Maximum sheath length as function of applied RF voltage
0 rn 10 20
,n (Crn)
o s
0
Fig. 7 . Electron phase space distributions (top left) with potential (top right) at four phases during RF cycle. Also shown is ion phase space distribution (bottom left) and time-average potential (bottom right).
’/I (kV)
Fig. 1 1 . Central electron density fitted with power law n, oc VAL’
Phase
Fig. 8. Sheath length variation during RF cycle. Trace is repeated to show whole sheath motion clearly.
4r
0 0 0.1 0.2
Position (m)
Fig. 9 . Spatiotemporal distribution of ionizing collisions collected over 20 RF cycles.
This can be seen in Fig. 10 where the maximum sheath width is plotted as a function of VRF. The almost constant width is due to the density rise that accompanies the in- crease in VRF. While a higher voltage leads to an expan-
sion of the sheath, an increase in the density leads to a contraction, and these effects cancel in our simulation, giving an approximately constant sheath width. The den- sity variation with VRF is shown in Fig. 11. It is interest- ing to note that the scaling of the RF sheath is fairly con- sistent with the Child-Langmuir relation for the dc sheath length
where V, is the maximum voltage across the sheath which is proportional to V R F . In our case d, = constant which implies n, oc V : / * , and an excellent fit to the data in Fig. 11 is obtained using this relation. Note that the RF sheath is thicker than the corresponding dc sheath due to the re- duction of space charge within the sheath caused by a nonzero average electron density [ 11.
V. POWER DISSIPATION Due to the large disparity in electron and ion masses,
the motion of the two species is effectively decoupled: the ions respond only to time-average fields while the elec- trons respond to the time-varying RF fields. This implies that, except for a small modulation of the ion velocity in the sheath (see Section VI), all the power delivered by the RF generator must go initially into accelerating electrons. Most of this circulating power is used in the charging up and discharging of the sheaths. This results in a slight modulation of the EVDF in the plasma corresponding to the current through the plasma but does not lead to elec- tron heating in the absence of collisions.
Average power dissipation results from two processes. The presence of the boundary leads to the rectification of the RF signal in the sheath, resulting in a nonzero average
Authorized licensed use limited to: IEEE Xplore. Downloaded on November 6, 2008 at 00:20 from IEEE Xplore. Restrictions apply.
730 IEEE TRANSACTIONS ON PLASMA SCIENCE. VOL. 18. NO. 4, AUGUST 1990
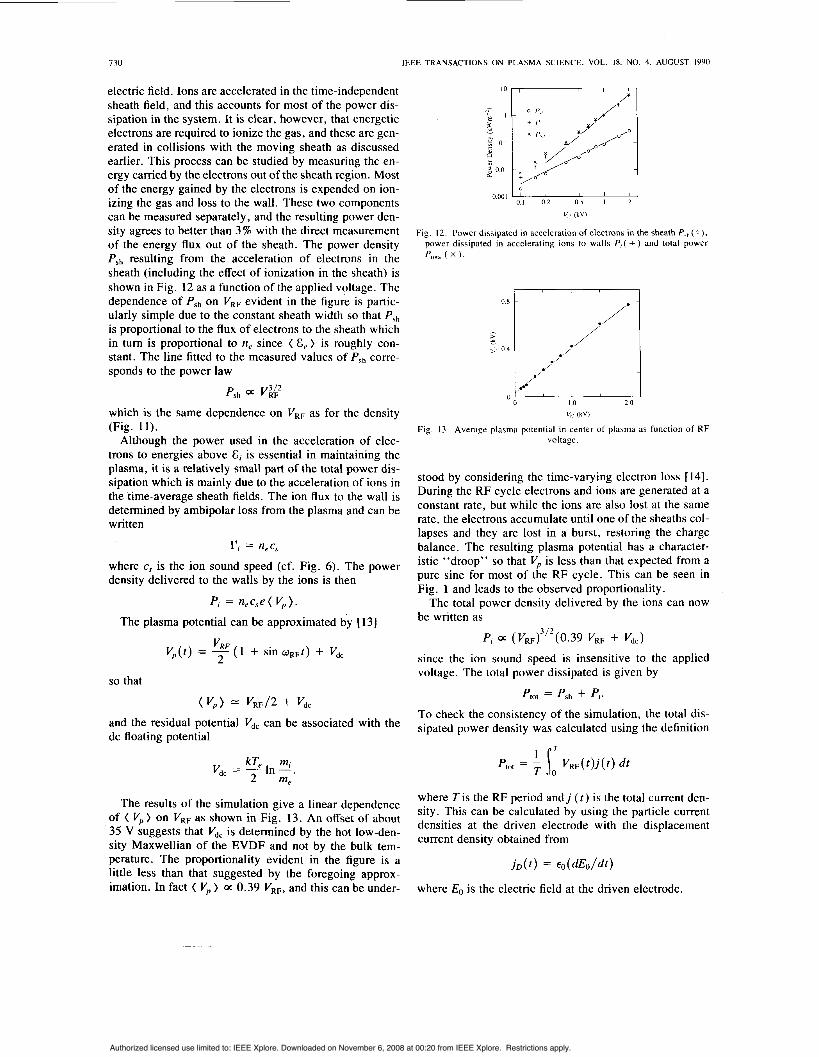
electric field. Ions are accelerated in the time-independent sheath field, and this accounts for most of the power dis- sipation in the system. It is clear, however, that energetic electrons are required to ionize the gas, and these are gen- erated in collisions with the moving sheath as discussed earlier. This process can be studied by measuring the en- ergy camed by the electrons out of the sheath region. Most of the energy gained by the electrons is expended on ion- izing the gas and loss to the wall. These two components can be measured separately, and the resulting power den- sity agrees to better than 3 % with the direct measurement of the energy flux out of the sheath. The power density Psh resulting from the acceleration of electrons in the sheath (including the effect of ionization in the sheath) is shown in Fig. 12 as a function of the applied voltage. The dependence of P,h on VRF evident in the figure is partic- ularly simple due to the constant sheath width so that P,h is proportional to the flux of electrons to the sheath which in turn is proportional to ne since ( E,) is roughly con- stant. The line fitted to the measured values of P5h corre- sponds to the power law
Psh V%z which is the same dependence on VRF as for the density (Fig. 11).
Although the power used in the acceleration of elec- trons to energies above E; is essential in maintaining the plasma, it is a relatively small part of the total power dis- sipation which is mainly due to the acceleration of ions in the time-average sheath fields. The ion flux to the wall is determined by ambipolar loss from the plasma and can be written
r, = n,c,
where c, is the ion sound speed (cf. Fig. 6). The power density delivered to the walls by the ions is then
Pi = n,c,e( V , ) .
The plasma potential can be approximated by [ 131
VRF V,(t) = 7 ( 1 + sin w R F ~ ) + Vd, L.
so that
(V , ) = and the residual potential dc floating potential
VRF/2 + Vdc Vdc can be associated with the
kT, mi -In -.
2 me
The results of the simulation give a linear dependence of ( V p ) on VRF as shown in Fig. 13. An offset of about 35 V suggests that Vd, is determined by the hot low-den- sity Maxwellian of the EVDF and not by the bulk tem- perature. The proportionality evident in the figure is a little less than that suggested by the foregoing approx- imation. In fact ( V , ) a 0.39 VRF, and this can be under-
0 I
0.1 0 2 0.5 1 2 0.001
V., (kV)
Fig. 12. Power dissipated in acceleration of electrons in the sheath P,,,( 0 ) .
power dissipated in accelerating ions to walls P , ( + ) and total power p,,,,,, ( x ).
I I
Vrj (kV)
Fig. 13. Average plasma potential in center of plasma as voltage.
function of RF
stood by considering the time-varying electron loss [ 141. During the RF cycle electrons and ions are generated at a constant rate, but while the ions are also lost at the same rate, the electrons accumulate until one of the sheaths col- lapses and they are lost in a burst, restoring the charge balance. The resulting plasma potential has a character- istic “droop” so that V, is less than that expected from a pure sine for most of the RF cycle. This can be seen in Fig. 1 and leads to the observed proportionality.
The total power density delivered by the ions can now be written as
P; a (V&’*(0.39 VRF + Vdc) since the ion sound speed is insensitive to the applied voltage. The total power dissipated is given by
Ptot = Psh + Pj.
To check the consistency of the simulation, the total dis- sipated power density was calculated using the definition
where Tis the RF period a n d j ( t ) is the total current den- sity. This can be calculated by using the particle current densities at the driven electrode with the displacement current density obtained from
j D G > = d d E o / d t )
where Eo is the electric field at the driven electrode.
Authorized licensed use limited to: IEEE Xplore. Downloaded on November 6, 2008 at 00:20 from IEEE Xplore. Restrictions apply.

VENDER A N D BOSWELL: NUMERICAL MODELING O F RF PLASMAS 73 I
The results are shown in Fig. 12 together with the pre- viously derived results for p,, and Pi. The values of P,o, agree to better than 3 % with the independently measured sum P,, + Pi over the entire range of voltage investigated. At high applied voltage, Psh is a negligible fraction of the total dissipated power, and the residual dc plasma poten- tial V,, can also be ignored. The resulting dependence
Pt,, = P; 0: V g
is fitted to the measured values of P,,, in Fig. 12 showing good agreement for V R F > 0.5 kV.
Since we have neglected electron neutral scattering, and thus collisional ohmic heating, it is of interest to estimate how much power would be dissipated in this process. By assuming a cross section for momentum transfer which is constant at low energy and has a magnitude of cm2, we have estimated the electron neutral collision frequency (veri - 50 MHz) and hence the plasma resistivity R - 2.5 Qm. The added resistance leads to a phase shift in the current but has a negligible effect on its amplitude, and we find that the power density expended on ohmic heating is about 12 Wm-' for V R F = 1 kV. Although this is a small fraction of the total (cf. Fig. 12), the extra ioniza- tion due to ohmic heating will produce ions that must then fall through the time average sheaths leading to further power dissipation.
VI. COLLECTED ION ENERGY DISTRIBUTION At the frequency used for this investigation the ion
transit time through the sheath is longer than the RF pe- riod so that the ions effectively experience an average field. However, the sheath varies both spatially and tem- porally, and to some extent, this motion is imparted to the ions. A simple theory of the ion motion through the sheath [ 151 leads to an expression for the ion energy distribution function (IEDF)
- 1 / 2 4 f ( G ) = [ 1 - 2 ( E - e ( VP$] WRFAG AE
where the energy splitting AE is given by
AE = 3WRFd.s
This analytic form has been plotted in Fig. 14 together with the observed distributions for ion masses corre- sponding to protons and to He+ ions. The theoretical dis- tributions have two singularities (separated by AE ) since the ions entering the sheath are assumed to be monoener- getic. The distributions have been filtered using convo- lution with a narrow Gaussian before plotting. The posi- tions of the peaks derived from the theory agree well with the simulation, although the observed distributions are af- fected by the velocity distribution of the ions entering the sheath which is not included in the simple theory.
The clear double hump distributions will only be ob- served if the mean free paths for collisions are greater than the sheath length. At a pressure of 20 mtorr and a
40
>
c 0" - 0 E d
40
20
I ' , '
0 200 400 600
Energy (ev!
Fig. 14. Energy distributions of ions arriving at live electrode for ion masses corresponding to H + (top) and He' (bottom). Theoretical distri- butions are shown dashed. Vertical scales are arbitrary.
20
10 x
d - 0 E i
0 200 400 600
Energy (eV)
Fig. 15. Energy distributions of ions arriving at live electrode when charge- exchange collisions are included. Ion mass corresponds to H + and cross sections are lo-' ' cm' (top) and 3 x IO- ' ' cm' (bottom).
4
0 01
0 I 1 10 100 Energy (eV)
Fig. 16. Distribution of fast neutrals generated in charge-exchange colli; cm- sions. Cross sections are
(lower trace). Distributions have been normalized. cm' (upper trace) and 3 x
cross section for charge exchange of some cm2 [ l 11, the mean free path is of the order of centimeters, and charge-exchange collisions would be expected to have a major effect on the ion motion. As initial conditions we took the steady-state situation for a simulation without
Authorized licensed use limited to: IEEE Xplore. Downloaded on November 6, 2008 at 00:20 from IEEE Xplore. Restrictions apply.

732 IEEE TRANSACTlONS ON PLASMA SCIENCE. VOL. IS, NO. 4. AUGUST 1990
charge exchange and followed it to the new steady state with charge exchange collisions included. The ion loss rate drops in the presence of charge-exchange collisions, and this leads to an increase in the density. The collisions also markedly alter the IEDF shown in Fig. 15 for two values of the charge-exchange cross section. For the smaller cross section (ucx = cm2), the IEDF has several stable peaks. This resillt is in good qualitative agreement with experimentally observed distributions [ 161 which are, in turn, well explained by including the effects of the collisions when integrating the ion motion through the sheath. When the cross section is increased to U,, = 3 X cm2 the high-energy part of the distribution is highly attenuated and most of the ions arrive at the wall with less than half the maximum expected energy. We are at present comparing our results with the theory and in- tend to present this in a later publication. The distribu- tions of the fast neutral atoms resulting from charge ex- change in Fig. 16 shows the presence of fast neutrals with maximum energy corresponding to ( Vp ). These neutrals can play a significant role in surface processes [ 171, and they represent an additional sour:e of energy to the sur- face that is not easily measured in a laboratory experi- ment.
VII. CONCLUSION In this paper we have emphasized comparison of the
simulation to simple models of the RF plasma so that scal- ing laws useful for understanding laboratory RF plasmas can be obtained. However, the technique is of greatest advantage in the study of the more complex aspects of RF plasmas, when the ability to diagnose the simulated plasma perfectly leads to valuable insight. We are at present studying the details of the dynamics that deter- mine the electron energy distribution and the validity of simple analytic models as the frequency and applied volt- age are varied. Furthermore, it is relatively simple to add ‘ ‘real-world’’ complications such as attachment and dis- sociation when needed in detailed comparison to process- ing plasmas. The effects of pulsing and even dissimilar frequencies driving the two electrodes can easily be in- vestigated. These possibilities make the PIC technique an extremely powerful and practical method of simulating low-pressure plasmas, leading to a better understanding of their complex behavior.
ACKNOWLEDGMENT The authors acknowledge the work of I. J . Morey, the
this paper were performed on the ANU VPlOO supercom- puter, and they thank the supercomputer group for their kind assistance.
REFERENCES M. A. Lieberman, IEEE Trans. Plasma S r i . , vol. 16, p. 638, 1988. M. J . Kushner, IEEE Trans. Plasma Sr i . , vol. PS-14, p. 188, 1986. J . P. Boef and P. Belenguer, Non-Equilibrium Processes in Partially Ionized Gases, M. Capitelli and J . M. Bardsley, Eds., NATO AS1 Series, to be published. R. W. Boswell and I . J . Morey, Appl. Phys. L e f t . , vol. 52, p. 21, 1988. D. Vender and R. W . Boswell, Le Vide, Les Couches Minces, sup- plement to no. 246, p. 3 1 1 , 1989. R. W. Hockney and J . W. Eastwood, Computer Simulation Using Purticles. New York: McGraw-Hill, 1981. C. K. Birdsall and A . B. Langdon, Plu.sma Physics via Computer Simulation. New York: McGraw-Hill, 1985. C. K. Birdsall and D. Fuss, J . Comput. Phys. , vol. 3 , p. 494, 1969. P. Hammond, F. H. Read, S . CvejanoviC, and G. C. King, J . Phys. B; A f . Mol. Phys. , vol. 18, p. L141, 198.5. 0. A. Popov and V. A. Godyak, J . Appl. Phys. , vol. 57, p. 53, 1985. H. Helm, J . Phys. B; At. Mol. Phys. , vol. 10, p. 3683, 1977. G. de Rosny, E. R . Mosburg, Jr . , J . R . Abelson, G. Devaud, and R. C. Kerns, J . Appl. Phys. . vol. 54, p. 2272, 1983. K. Kohler. J . W . Coburn. D. E. Home, and E. Kay, J . Appl . Phys. , vol. 57, p. 59, 198.5. H. S. Butler and G. S. Kino, Phys. fluid^. vol. 6. p. 1346, 1963. P. Benoit-Cattin and L. C. Bernard, J . Appl. Phys. , vol. 39, p. 5723, 1968. Ch. Wild and P. Koidl, Appl. Phys. Lett . , vol. 54, p. 505, 1989. R. W. Boswell and R . K. Porteous, J . Appl. Phps. . vol. 62, p. 3123, 1987
* David Vender was born on August 19, 1958 in Zlin, Czechoslovakia. He received the B.Sc. de- gree in physics from the University of Sydney, Sydney, Australia, in 1980.
He then worked for two years on Tokamak plasma diagnostics before moving to Canberra to work on the LT4 Tokamak at the Australian Na- tional University. Since 1986 he has been working on RF plasmas and plasma processing. He is cur- rently completing the Ph.D. degree on numerical simulations of low pressure RF plasmas.
* Rod W. Boswell was born on May 6, 1944 in Melbourne, Australia. He received the B.Sc. (Hons.) degree in physics from the University of Adelaide in 1966 and the Ph.D. degree from Flin- ders University in 1972.
He spent ten years working on space plasma physics in Europe at the University of Sussex, the European Space Agency and Max Ptanck Institute in Munich. Since 1980 he has lead a group at the Australian National University working on RF ex- cited plasmas, beam plasma interactions, numer-
author of the original code. Some of the calculations for ical simulation, and chaos.
Authorized licensed use limited to: IEEE Xplore. Downloaded on November 6, 2008 at 00:20 from IEEE Xplore. Restrictions apply.


![IEEE TRANSACTIONS ON MOBILE COMPUTING 1 Near-optimal …tianhe/Research/... · 2015-09-14 · IEEE TRANSACTIONS ON MOBILE COMPUTING 3 resonances [29] or radio frequency (RF) signals](https://static.fdocuments.us/doc/165x107/5f96c80a0e50cd126d50d6f3/ieee-transactions-on-mobile-computing-1-near-optimal-tianheresearch-2015-09-14.jpg)