IEEE INTERNET OF THINGS JOURNAL, VOL. XX, NO. YY, …ruizhang/paper/Yao-IoT18.pdf · IEEE INTERNET...
10
2327-4662 (c) 2018 IEEE. Personal use is permitted, but republication/redistribution requires IEEE permission. See http://www.ieee.org/publications_standards/publications/rights/index.html for more information. This article has been accepted for publication in a future issue of this journal, but has not been fully edited. Content may change prior to final publication. Citation information: DOI 10.1109/JIOT.2018.2844218, IEEE Internet of Things Journal IEEE INTERNET OF THINGS JOURNAL, VOL. XX, NO. YY, JANUARY 2018 1 Beware of What You Share: Inferring User Locations in Venmo Xin Yao, Student Member, IEEE, Yimin Chen, Student Member, IEEE, Rui Zhang, Member, IEEE, Yanchao Zhang, Senior Member, IEEE, and Yaping Lin, Member, IEEE Abstract—Mobile payment apps are seeing explosive usage worldwide. This paper focuses on Venmo, a very popular mo- bile person-to-person (P2P) payment service owned by Paypal. Venmo allows money transfers between users with a mandatory transaction note. More than half of transaction records in Venmo are public information. In this paper, we propose a Multi-Layer Location Inference (MLLI) technique to infer user locations from public transaction records in Venmo. MLLI explores two observations. First, many Venmo transaction notes contain implicit location cues. Second, the types and temporal patterns of user transactions have strong ties to their location closeness. With a large dataset of 2.12M users and 20.23M Venmo transaction records, we show that MLLI can identify the top-1, top-3, and top-5 possible locations for a Venmo user with accuracy up to 50%, 80%, and 90%, respectively. Our results highlight the danger of sharing transaction notes on Venmo or similar mobile payment apps. Index Terms—Mobile payment, security, privacy, location in- ference. I. I NTRODUCTION M OBILE payment apps are seeing explosive usage world- wide. According to [1], the volume of mobile payment transactions could rise from $25B in 2016 to nearly $275B by 2021, amounting to an average annual growth rate of 62%. As another example, AliPay and WeChatPay, two popular payment systems in China, have 100M daily active users in December 2016 and 200M users in January 2016, respectively. This paper focuses on Venmo, a very popular mobile person- to-person (P2P) payment service owned by Paypal. Venmo had 203 million active users and processed $6.8 billion in payment volume in Q1 2017 [2]. It is essentially a combination of social and transaction networks. On the one hand, Venmo allows users to befriend each other as in Facebook-like online social networks (OSNs). On the other hand, it allows money transfers between users by phone numbers, Venmo usernames, X. Yao and Y. Lin are with the College of Computer Science and Electronic Engineering, Hunan University, Changsha, Hunan, 410012, China. (E-mail: [email protected], [email protected]) Y. Chen and Y. Zhang are with School of Electrical, Computer and Energy Engineering, Ira A. Fulton Schools of Engineering, Arizona State University, Tempe, AZ 85287, USA. (E-mail: {ymchen, yczhang}@asu.edu) R. Zhang is with the Department of Computer and Information Sciences Department, University of Delaware, Newark, DE 19716, USA. (E-mail: [email protected]) This work was done while X. Yao was a visiting Ph.D. student at Arizona State University. Y. Zhang and Y. Lin are both the corresponding authors. or emails along with a mandatory transaction note in the form of words, emojis, or their combinations. For example, Alice paid Bob $5.1 for pizza or charged Bob $550 for . In Venmo, users can make their transaction records viewable by the public with the default system setting or by selected parties only via privacy control. As reported in [3], almost half of Venmo transaction records are public information. This paper presents the first systematic study to infer the home locations of Venmo users from public transaction records. We follow the convention [4]–[15] to let a home location (or location for short) refer to a permanent and static city-level region where most of the user’s daily activities occur. This study may have significant positive and negative impacts. On the positive side, the knowledge about user locations may benefit many applications such as socioe- conomic studies, local event recommendation, and business promotion. On the other hand, the disclosure of home locations may subject the users to many attacks such as location-based spam campaigns. This study is also very challenging because explicit location clues are relatively sparse and often unreliable in public Venmo transaction records. For example, our large- scale dataset reveals that only 13.34% of public transaction records contain geotagged information (city or state names in USA), most of which are unrelated to the home locations of Venmo users. In this paper, we propose a Multi-Layer Location In- ference (MLLI) technique to infer user locations in Venmo. The design of MLLI is driven by two observations. First, many Venmo transaction notes contain implicit location cues. Second, the types and temporal patterns of user transactions have strong ties to their location closeness. For example, if David and Bob split lunch bills on a daily basis via Venmo, they are in the same city (i.e., have the same location) with overwhelming probability. In contrast, if they split monthly wireless bills via Venmo, there is relatively low confidence that they are in the same location because people far away from each other can still share a wireless plan. MLLI explores the above observations in four steps. First, we use text mining algorithms to obtain the keywords for each transaction note. Since distinct keywords have different location relevance, we further divide the keywords and the corresponding transaction records into four categories, where the lower-numbered category corresponds to higher location relevance. Second, we construct an undirected weighted trans- action graph for each category, in which each edge corresponds to two users with any transaction history in that category, and the edge weight depends on their transaction pattern.
Transcript of IEEE INTERNET OF THINGS JOURNAL, VOL. XX, NO. YY, …ruizhang/paper/Yao-IoT18.pdf · IEEE INTERNET...
2327-4662 (c) 2018 IEEE. Personal use is permitted, but republication/redistribution requires IEEE permission. See http://www.ieee.org/publications_standards/publications/rights/index.html for more information.
This article has been accepted for publication in a future issue of this journal, but has not been fully edited. Content may change prior to final publication. Citation information: DOI 10.1109/JIOT.2018.2844218, IEEE Internet ofThings Journal
IEEE INTERNET OF THINGS JOURNAL, VOL. XX, NO. YY, JANUARY 2018 1
Beware of What You Share:Inferring User Locations in Venmo
Xin Yao, Student Member, IEEE, Yimin Chen, Student Member, IEEE, Rui Zhang, Member, IEEE,Yanchao Zhang, Senior Member, IEEE, and Yaping Lin, Member, IEEE
Abstract—Mobile payment apps are seeing explosive usageworldwide. This paper focuses on Venmo, a very popular mo-bile person-to-person (P2P) payment service owned by Paypal.Venmo allows money transfers between users with a mandatorytransaction note. More than half of transaction records in Venmoare public information. In this paper, we propose a Multi-LayerLocation Inference (MLLI) technique to infer user locationsfrom public transaction records in Venmo. MLLI explorestwo observations. First, many Venmo transaction notes containimplicit location cues. Second, the types and temporal patterns ofuser transactions have strong ties to their location closeness. Witha large dataset of 2.12M users and 20.23M Venmo transactionrecords, we show that MLLI can identify the top-1, top-3, andtop-5 possible locations for a Venmo user with accuracy upto 50%, 80%, and 90%, respectively. Our results highlight thedanger of sharing transaction notes on Venmo or similar mobilepayment apps.
Index Terms—Mobile payment, security, privacy, location in-ference.
I. INTRODUCTION
MOBILE payment apps are seeing explosive usage world-wide. According to [1], the volume of mobile payment
transactions could rise from $25B in 2016 to nearly $275B by2021, amounting to an average annual growth rate of 62%.As another example, AliPay and WeChatPay, two popularpayment systems in China, have 100M daily active users inDecember 2016 and 200M users in January 2016, respectively.
This paper focuses on Venmo, a very popular mobile person-to-person (P2P) payment service owned by Paypal. Venmohad 203 million active users and processed $6.8 billion inpayment volume in Q1 2017 [2]. It is essentially a combinationof social and transaction networks. On the one hand, Venmoallows users to befriend each other as in Facebook-like onlinesocial networks (OSNs). On the other hand, it allows moneytransfers between users by phone numbers, Venmo usernames,
X. Yao and Y. Lin are with the College of Computer Science and ElectronicEngineering, Hunan University, Changsha, Hunan, 410012, China. (E-mail:[email protected], [email protected])
Y. Chen and Y. Zhang are with School of Electrical, Computer andEnergy Engineering, Ira A. Fulton Schools of Engineering, Arizona StateUniversity, Tempe, AZ 85287, USA. (E-mail: {ymchen, yczhang}@asu.edu)
R. Zhang is with the Department of Computer and Information SciencesDepartment, University of Delaware, Newark, DE 19716, USA. (E-mail:[email protected])
This work was done while X. Yao was a visiting Ph.D. student atArizona State University. Y. Zhang and Y. Lin are both the correspondingauthors.
or emails along with a mandatory transaction note in the formof words, emojis, or their combinations. For example, Alicepaid Bob $5.1 for pizza or charged Bob $550 for . InVenmo, users can make their transaction records viewable bythe public with the default system setting or by selected partiesonly via privacy control. As reported in [3], almost half ofVenmo transaction records are public information.
This paper presents the first systematic study to inferthe home locations of Venmo users from public transactionrecords. We follow the convention [4]–[15] to let a homelocation (or location for short) refer to a permanent andstatic city-level region where most of the user’s dailyactivities occur. This study may have significant positive andnegative impacts. On the positive side, the knowledge aboutuser locations may benefit many applications such as socioe-conomic studies, local event recommendation, and businesspromotion. On the other hand, the disclosure of home locationsmay subject the users to many attacks such as location-basedspam campaigns. This study is also very challenging becauseexplicit location clues are relatively sparse and often unreliablein public Venmo transaction records. For example, our large-scale dataset reveals that only 13.34% of public transactionrecords contain geotagged information (city or state names inUSA), most of which are unrelated to the home locations ofVenmo users.
In this paper, we propose a Multi-Layer Location In-ference (MLLI) technique to infer user locations in Venmo.The design of MLLI is driven by two observations. First,many Venmo transaction notes contain implicit location cues.Second, the types and temporal patterns of user transactionshave strong ties to their location closeness. For example, ifDavid and Bob split lunch bills on a daily basis via Venmo,they are in the same city (i.e., have the same location) withoverwhelming probability. In contrast, if they split monthlywireless bills via Venmo, there is relatively low confidencethat they are in the same location because people far awayfrom each other can still share a wireless plan.
MLLI explores the above observations in four steps. First,we use text mining algorithms to obtain the keywords foreach transaction note. Since distinct keywords have differentlocation relevance, we further divide the keywords and thecorresponding transaction records into four categories, wherethe lower-numbered category corresponds to higher locationrelevance. Second, we construct an undirected weighted trans-action graph for each category, in which each edge correspondsto two users with any transaction history in that category,and the edge weight depends on their transaction pattern.
2327-4662 (c) 2018 IEEE. Personal use is permitted, but republication/redistribution requires IEEE permission. See http://www.ieee.org/publications_standards/publications/rights/index.html for more information.
This article has been accepted for publication in a future issue of this journal, but has not been fully edited. Content may change prior to final publication. Citation information: DOI 10.1109/JIOT.2018.2844218, IEEE Internet ofThings Journal
IEEE INTERNET OF THINGS JOURNAL, VOL. XX, NO. YY, JANUARY 2018 2
For example, more intense and consistent transactions shouldtranslate into higher edge weights than occasional ones. Third,we identify a small set of users as seeds whose locations canbe directly obtained from their geotagged Venmo transactionnotes or via external means.1 Then we propose an iterativemulti-layer belief propagation scheme to propagate the loca-tion beliefs to non-seed users in each category. Finally, weperform a weighted combination of the location beliefs foreach user in the four categories and assign the most probablehome location to each user.
We validate the efficacy of MLLI using a large-scaledataset containing 2.12M users and 20.23M Venmo transactionrecords, which was collected through a 3-month period. Ourresults show that MLLI can identify the top-1, top-3, and top-5possible locations for a Venmo user with accuracy up to 50%,80%, and 90%, respectively. Our results highlight the dangerof sharing transaction notes on Venmo.
There have been such efforts as [4]–[15] to infer theuser locations in traditional OSNs such as Facebook andTwitter. Existing techniques can be classified into network-based approaches [4]–[10] or content-based approaches [11]–[15]. The former depend on the assumption that physicallyclose OSN users are more likely to interact with each otherso that a user’s location can be inferred from those of his/herOSN neighbors. In contrast, content-based approaches alwaysutilize geographic hints (e.g., city landmarks) in user posts toinfer hidden locations. Our MLLI technique explores both net-work information (transaction parties) and content information(transaction notes) in the unique Venmo context.
The rest of this paper is outlined as follows. Section IIintroduces Venmo and presents the problem formulation. Sec-tion III discusses how we crawl the dataset and collect theground truth. Section IV details how we construct categorizedtransaction graphs from public transaction records. Section Vpresents the MLLI technique. Section VI analyzes the conver-gence and time complexity of MLLI. Section VII evaluatesMLLI with the real dataset. Section VIII outlines the relatedwork. Section IX concludes this paper.
II. PROBLEM FORMULATION
In this section, we provide a brief introduction to Venmoand then the problem formulation.
Venmo is PayPal’s mobile P2P payment service that hasbeen gaining extreme popularity. It allows direct moneytransfer between registered users via a mobile app or webinterface. Each transaction must have a short note indicatingthe transaction purpose. A transaction note can consist ofwords, emojis, or their combinations. The transaction recordsof each user are public information by default. A user canmake his/her transaction records viewable by selected partiesonly as well. The recent study [3] reveals that almost half ofVenmo transaction records are public information that can beeasily obtained by invoking Venmo APIs.
We explore public Venmo transaction records to constructan undirected weighted transaction graph G = 〈N , E〉, where
1Some Venmo users link their Venmo accounts to Facebook accounts anddisclose their locations on Facebook.
N and E refer to the user set and edge set, respectively.An edge ei,j ∈ E is formed between any users i andj as long as they have historical transactions in Venmo.Who is the payment sender or receiver of any transactionhas no bearing on our scheme design, so we ignore thedirections of Venmo transactions. A set of transaction recordsare associated with each edge ei,j . We use text miningalgorithms to infer a keyword for each transaction record,referred to as its transaction purpose. Then we can groupthe transactions of the same purpose into a time series.For example, we can have {Dinner:{01/14/2017@6:00pm,01/17/2017@5:30pm}; :{02/27/2017@9:00am}} associ-ated with edge ei,j , meaning that users i and j split dinnerexpenses twice and rent once at the corresponding time. LetN ∗ ⊂ N denote the set of users with known home locations(called seed users) and N+ ⊂ N denote the remaining userswith unknown home locations (called non-seed users). So wehave N = N ∗∪N+. We aim to tackle the following problem.hi for each non-seed user i ∈ N+ as close to its true
location hi as possible.Location Inference in Venmo: Given a Venmo transaction
graph G = 〈N , E〉 with an observed location hj for each seeduser j ∈ N ∗, estimate top-κ possible home locations hi foreach non-seed user i ∈ N+. Let N− be the number of non-seed users whose true location hi located at hi. We aim tomake |N−| as close to |N+| as possible.
III. DATA CRAWLING
In this section, we introduce our data crawling process andthe ground-truth dataset.
A. Data Collection
We used the public Venmo v5 API to retrievehistorical transaction records in Venmo. Each retrievalrequest is a URL with a constant field and aUnix timestamp. As an example, the request ishttps://venmo.com/api/v5/public?until=1488369600 when the time is set to 03/01/2017@12:00pm(UTC). Venmo returns the most recent 20 records before thespecified time in each retrieval request. By sweeping throughthe timestamps from December 24, 2016 to March 24, 2017,we obtained 8.2M unique users and 37.46M transactionsin total. For our purpose, each transaction record containsthe transaction initiator and receiver along with their publicprofiles, the transaction time, and the mandatory transactionnote. Other information returned by Venmo is ignored. Ourtechnique applies to the users with sufficient transactions.In this study, we only consider users with more than 10transaction records in the crawled dataset, which correspondto 2.12M users with 20.23M transaction records in total.During the data collection, we limited the query rates to avoiddisruption to Venmo’s services. Although the transactionrecords in our dataset is publicly accessible via the Venmov5 API, we will not share the dataset with others unless awritten consent from Venmo can be obtained.
2327-4662 (c) 2018 IEEE. Personal use is permitted, but republication/redistribution requires IEEE permission. See http://www.ieee.org/publications_standards/publications/rights/index.html for more information.
This article has been accepted for publication in a future issue of this journal, but has not been fully edited. Content may change prior to final publication. Citation information: DOI 10.1109/JIOT.2018.2844218, IEEE Internet ofThings Journal
IEEE INTERNET OF THINGS JOURNAL, VOL. XX, NO. YY, JANUARY 2018 3
100 101 102 1030.6
0.7
0.8
0.9
1.0
C
DF
(a) Purified transaction note length.
100 102 104 1060.7
0.8
0.9
1.0
CD
F
(b) Keyword frequency.
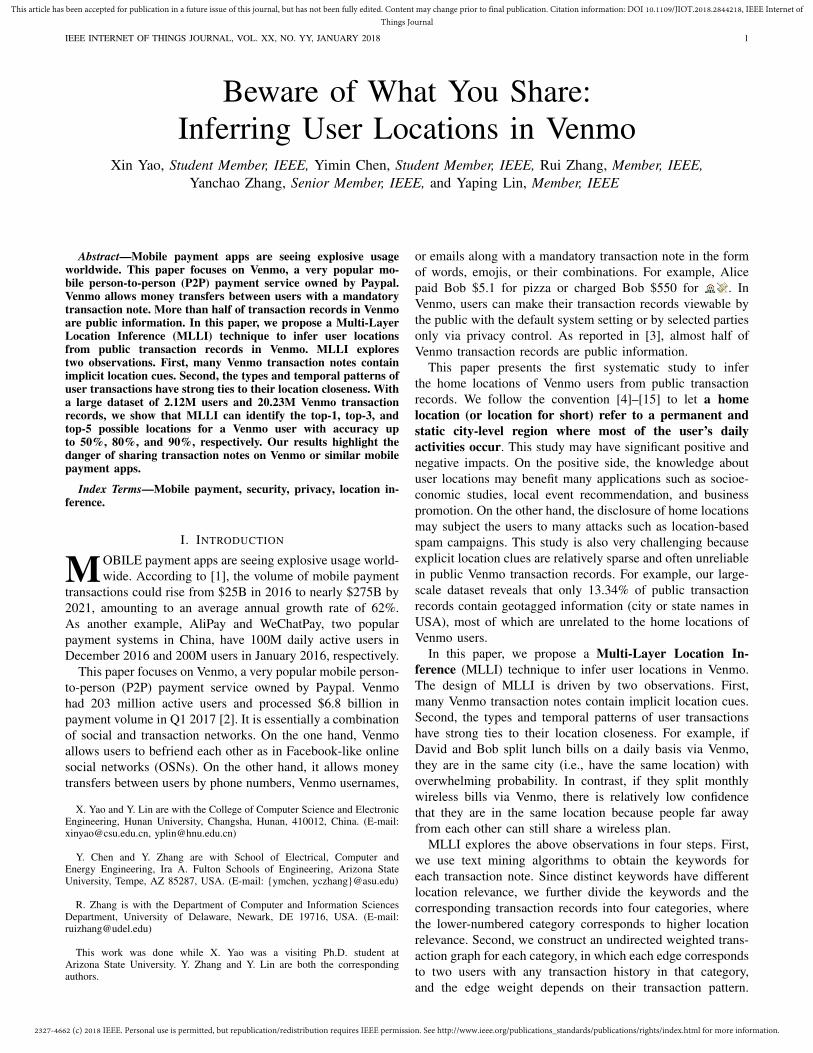
Fig. 1. The distributions of purified note length and keyword frequency.
B. Ground TruthIt is critical to obtain a ground-truth dataset for our al-
gorithm execution and performance evaluation. About 6% ofFacebook users have elected to enter their home addresses intheir public profiles [4]. Since a user can register for Venmowith his/her Facebook credentials, we used the followingprocess to crawl the ground truth. We first identified theusers whose profiles contain firstname+lastname as well asa user image or a friend list from the crawled transactionrecords. Then we searched the firstname+lastname for eachsuch Venmo user on Facebook. Any discovered Facebook useris considered the same person as the Venmo user if theytwo have the same image or a highly similar friend list. Ifthe Facebook user specifies the home location in the profile,the home location of the Venmo user is considered known,corresponding to one piece of ground truth. With this process,we obtained a ground-truth dataset of 1000 users from ouroriginal dataset.
IV. CATEGORIZED TRANSACTION GRAPHS
Our MLLI technique explores the observation that publictransaction notes in Venmo contain implicit cues for accuratelocation inference. In this section, we first extract meaningfulkeywords from the crawled transaction notes. Since differentkeywords vary in location relevance, we further group thekeywords into four categories whereby to construct four cate-gorized transaction graphs for subsequent use. Note that we donot harness explicit location cues in transaction notes, whichare not only rare but also unrelated to home locations.
A. Keyword Extraction
We use text mining techniques to extract meaningful key-words from crawled transaction notes. For the words in eachtransaction note, we first remove the stop words using astop-word list,2 in which such words as “the” and “those”are considered too general and meaningless. People may usedifferent inflected words in their transaction notes. So wefurther conduct stemming [16] to reduce inflected words totheir stemforms. For example, “play”, “playing”, and “played”are all reduced to “play”. Each transaction note is translatedinto its purified version after these two steps. All the wordsor emojis in a purified transaction note are considered itskeywords. Fig. 1(a) shows the length distribution of 20.23M
2http://www.textfixer.com/resources/common-english-words.txt
purified transaction notes involving 2.12M Venmo users. Aswe can see, more than 62% of transaction notes have onekeyword, and about 20% have two keywords. This resultprovides firm evidence that the keywords can well characterizeVenmo transaction notes. Table I shows the frequencies of thetop-10 common keywords. We also draw the distribution ofkeyword frequency in Fig. 1(b), which shows that more than75% of the keywords appeared only once.
TABLE ITOP-10 COMMON KEYWORDS WITH THEIR FREQUENCIES.
Rank Keywords Freq. (%) Rank Keywords Freq. (%)1 food 1.74 6 0.592 uber 1.55 7 0.583 1.11 8 0.544 0.65 9 stuff 0.525 rent 0.62 10 0.51
B. Keyword Categorization
Different transaction keywords vary in relevance to userlocations. For example, “rent” is a more reliable indicator than
that the two users are in the same city (or location). Armedwith this observation, we categorize the transaction keywordsinto four categories such that lower-numbered categories havehigher location relevance than higher-numbered ones.
The keywords in category1 and category2 relate to physicalor social activities that two users must conduct face to face. Forexample, “rent” and “electricity” are the strongest indicatorsthat the two users involved live together and thus have the samelocation, so both belong to category1. In contrast, “movie” and“party” correspond to face-to-face activities as well, but theyare classified into category2 because they are less stronger co-location indicators than “rent”.
The keywords in category3 correspond to the activities thatcan happen face to face or not. For example, a transaction withthe “gift” keyword can involve two users who split the gift costfor a common friend. The two users may live in the same cityor not, so “gift” has weaker co-location relevance than “movie”and is assigned to category3. In contrast, the keywords incategory4 are not explicitly correlated with locations.
We show some examples for each category below to helpunderstand our categorization rule.• Category1: apartment, , rent, electricity, cleaning, etc.• Category2: food, , , party, movie, uber, gas, , etc.• Category3: gifts, clothing, music, medical, etc.• Category4: airfare, game, phone, insurance, etc.
We have obtained 493, 314, 356, and 337 keywords incategory1, category2, category3, and category4, respectively.Recall that our crawled dataset comprises 2.12M users and20.23M transaction records, where each user has at least10 transaction records. We further classify the transactionrecords into four subsets if they have the keywords in thecorresponding categories. A transaction record can belongto multiple subsets if it has multiple keywords in differentcategories. Those without any categorized keyword do notbelong to any subset and will not be further considered inour algorithm. Finally, we have subset1 with 1.83M users
2327-4662 (c) 2018 IEEE. Personal use is permitted, but republication/redistribution requires IEEE permission. See http://www.ieee.org/publications_standards/publications/rights/index.html for more information.
This article has been accepted for publication in a future issue of this journal, but has not been fully edited. Content may change prior to final publication. Citation information: DOI 10.1109/JIOT.2018.2844218, IEEE Internet ofThings Journal
IEEE INTERNET OF THINGS JOURNAL, VOL. XX, NO. YY, JANUARY 2018 4
and 4.48M transaction records, subset2 with 1.82M usersand 4.24M transaction records, subset3 with 1.83M users and4.07M transaction records, and subset4 with 1.83M users and4.11M transaction records. In addition, we have 87.7% of thetransactions in one subset, 11.1% in two subsets, 1% in threesubsets, and only 0.07% in all the four subsets.
One limitation of our method is that involves manual clas-sification. While it is feasible in our case, we left automatingthe process as our future work, which would need incorporateeffective natural language processing techniques. In addition,our categorization method above is empirical and exemplary,and a finer classification of the transaction keywords can beadopted as well.
We also explore the ground-truth dataset to derive a co-location coefficient for each transaction subset. For eachsubset, we count the number of transaction records betweenany two users in the ground-truth dataset as well as thosebetween any two users in the ground-truth dataset and alsothe same city (location). The co-location coefficient for thistransaction subset is the later count divided by the former.Subset1, subset2, subset3, and subset4 have the co-locationcoefficients of 0.823, 0.739, 0.684, and 0.588, respectively.These results validate our assumption that the keywords inlower-numbered keyword categories are more reliable indica-tors that two transaction users are in the same location.
C. Construction of Categorized Transaction GraphsThe same keyword may have very different co-location
relevance to different pair of users. Intuitively speaking, moreconsistent transactions of the same keyword should translateinto stronger location closeness. For example, Tom and Boblive in different cities and split a drink bill occasionally whenthey attend the same conference. In contrast, Tom and Jerry arecolleagues and often split after-hour drink bills. The “drink”keyword is obviously more relevant between Tom and Jerrythan between Tom and Bob.
To capture this observation, we construct an undirectedweighted transaction graph Gz = 〈Nz, Ez〉 for each categoryzbased on the transaction subsetz , ∀z ∈ [1, 4]. The node set Nzincludes all the users in subsetz , and an edge ei,j,z ∈ Ez existsif subsetz contains transaction records between users i and j.Each edge ei,j,z has a weight wi,j,z that models the locationcloseness between users i and j. We use the following methodsto derive the edge weights.• Sum-based. In this method, wi,j,z equals the total num-
ber of transaction records between users i and j in thetransaction subsetz .
• Entropy-based. In this method, we divide time intoepochs of the same length (say, one week). Let d(i,j)
x,z
denote the number of transactions in subsetz betweenusers i and j in epoch x. We define
wi,j,z = (1−∑x
d(i,j)x,z∑x d
(i,j)x,z
· logd
(i,j)x,z∑x d
(i,j)x,z
) ·∑x
d(i,j)x,z .
Neither method above is perfect. In particular, the sum-based method translates more transactions into higher edgeweights (location closeness), but it does not capture the
temporal information in transaction records. Continue with theprevious Tom-Bob-Jerry example. Tom and Bob may have alot of Venmo transactions in a short period (say, one week)while attending the same conference. But Tom and Jerry mayhave one Venmo transaction every week in the past month. Thesum-based method will give a wrong co-location indicationin this scenario. In contrast, the entropy-based method canproduce a much higher edge weight between Tom and Jerrythan between Tom and Bob, but it cannot reflect the transactionvolume.
V. MULTI-LAYER LOCATION INFERENCE (MLLI)In this section, we present our multi-layer location inference
(MLLI) technique to infer the locations of Venmo users fromcategorized transaction graphs {Gz}4z=1.
We use the following key notation. Assume that there isan ordered list of all possible cities (locations). For example,there are 307 cities with more than 100K residents in theUnited States in 2016. Let pi denote a vectorized locationbelief for each user i, where the kth element pi(k) denotesthe probability that user i is in the kth city in a predefined list.pi is inferred from the combination of {Gz}4z=1. We also usepi,z to denote user i’s location belief inferred from Gz alone,whose kth element is denoted by pi,z(k).
MLLI derives pi for each user i in three steps. First, wepartition each transaction graph Gz into communities. Second,we select a few seed users in each community whose locationbeliefs can be known a priori, and then we use the Max-Product Belief Propagation technique to iteratively propagatethe location beliefs inside each community. Finally, we derivepi as a weighted combination of the individual location beliefs{pi,z}4z=1 in an iterative fashion.
A. Community DivisionThe users in the same city can be expected to have more
intense Venmo transactions with each other than with others indifferent cities, leading to a strongly connected community ineach categorized transaction graph Gz . The community struc-ture in a large undirected graph can be inferred by maximizingthe modularity [17]. We adopt the Louvain method [18], [19],a popular modularity-based technique to divide each Gz intocommunities. The Louvain method is a greedy optimizationmethod that attempts to optimize the modularity of a partitionin the graph, which is defined as a value between -1 and 1 thatmeasures the density of links inside communities in contrastto those between communities. In [20], the modularity of eachgraph Gz = 〈Nz, Ez〉 is defined as
Qz =1
2 ·mz·∑i,j
[wi,j,z−∑j wi,j,z ·
∑i wi,j,z
2 ·mz]·δ(ρi,z, ρj,z) ,
where wi,j,z denotes the edge weight between users i and j,mz = 1
2
∑i,j wi,j,z is the total edge weight in Gz ,
∑j wi,j,z
is the total edge weight concerning user i, ρi,z and ρj,z referto the community indexes of nodes i and j, respectively, andδ(ρi,z, ρj,z) is a Kronecker delta function. In particular,
δ(ρi,z, ρj,z) =
{1, ρi,z 6= ρj,z,
0, ρi,z = ρj,z.

2327-4662 (c) 2018 IEEE. Personal use is permitted, but republication/redistribution requires IEEE permission. See http://www.ieee.org/publications_standards/publications/rights/index.html for more information.
This article has been accepted for publication in a future issue of this journal, but has not been fully edited. Content may change prior to final publication. Citation information: DOI 10.1109/JIOT.2018.2844218, IEEE Internet ofThings Journal
IEEE INTERNET OF THINGS JOURNAL, VOL. XX, NO. YY, JANUARY 2018 5
We explain the intuition of the modularity as follows. Con-sidering any two users i and j, we utilize
∑j wi,j,z·
∑i wi,j,z
2·mz
to denote the expectation that they can form an edge in graphGz . If their communities are not the same (i.e., ρi,z 6= ρj,z),they have no contribution to Qz . If i and j belong to the samecommunity (i.e., ρi,z = ρj,z), they have positive impact on Qzif they are neighbors and negative impact otherwise.
With the Louvain method, we obtain a community set Cz
for each graph Gz . Table II lists the number of communitieswith the modularity in each graph Gz . According to [21], anymodularity greater than 0.3 indicates meaningful communitystructures. So our four categorized transaction graphs all havevery meaningful community structures, with 95.51%, 93.79%,94.86%, and 94.59% of the transactions taking place withincommunities, respectively.
TABLE II# OF COMMUNITIES AND MODULARITY
Graphs # of communities ModularityG1 130029 0.95G2 109344 0.93G3 126181 0.94G4 125665 0.93
B. Max-Product Location-Belief Propagation (MP-LBP)Recall our conjecture that user transactions in Venmo ex-
hibit strong geographic locality in the sense that users in thesame area tend to have more intensive transactions with eachother than with those from outside. Therefore, after obtainingthe community set Cz for each graph Gz , we can expect thatthe location of each user can be inferred from those of othersin the same community. The locations of some users may beknown a priori, e.g., by using the same method for constructingthe ground-truth dataset (see Section III-B). These users arereferred to as seed users whose location beliefs are accordinglyknown as well. For example, if seed s is in the kth city,the location belief ps has 1.0 in the kth position and 0s inall the other positions. For each seed user, we apply beliefpropagation techniques to propagate the location beliefs withinits community to evaluate the likelihood that all the other usersin the community are in the same location (city).
We use the classical Max-Product Belief Propagation(MPBP) technique [22], [23] as an example for location-beliefpropagation, and many other belief propagation techniques canbe applied as well. We rename the technique MP-LBP. Toavoid introducing a new set of notation, we assume that graphGz corresponds to a single community where one or moreseeds are in the k city. Each seed s has its kth location-beliefelement (probability) ps,z(k) = 1.0. In contrast, every non-seed user i ∈ Gz has pi,z(k) = 0.5 initially, correspondingto the equal probability that user i is in the kth city or not.We follow [24] to model Gz as a pairwise Markov RandomField (pMRF). Consider any two neighbors i and j in Gz .Let xi(k) be a binary indicator about whether user i livesin the kth city: xi(k) = 1 if so and xi(k) = 0 otherwise.MP-LBP is an iterative process. Let p(t)
i,z(k) denote the resultin iteration t ≥ 0), where p
(0)i,z (k) = 0.5. We also define
gi,z(k) = p(t−1)i,z (k) (∀t ≥ 1), i.e., the prior probability that
user i is in the kth city before iteration t. We further define anode potential for each node i as
θi,z(k) =
{gi,z(k), if xi(k) = 1,
1− gi,z(k), if xi(k) = 0,
and an edge potential for each edge ei,j,z as
ϕi,j,z(k) =
{Ji,j,z, if xi(k) = xj(k),
1− Ji,j,z, if xi(k) 6= xj(k).
Here Ji,j,z = (1 + exp{−wi,j,z
di,z})−1, and di,z =
∑j wi,j,z
denotes the total edge weight concerning user i in graph Gz .Note that the node potential θi,z(k) represents the possibilitythat whether user i lives in the kth city or not, and the edgepotential ϕi,j,z(k) denotes correlations between xi(k) andxj(k) in the graph Gz .
In each iteration of MP-LBP, each node receives messagesfrom its neighbors simultaneously, then updates its locationbelief, and finally sends a new message to each neighbor inthe end of the iteration. For any two neighboring nodes i andj in Gz , we define message m
(t)i,j,z(xj(k)) as the influence that
the state of node j in the kth city (i.e., xj(k)) has on user i’slocation belief in the tth iteration (t ≥ 0). Following the priorwork [25], we set m
(0)i,j,z = 0.5 for any two neighbors i, j.
MPBP iteratively updates each message as
m(t)i,j,z(xj(k)) = max
xi(k)ϕi,j,z(k)·θi,z(k)·
∏u∈Γi/j
m(t−1)u,i,z (xi(k)) ,
(1)where Γi/j means all neighbors of user i except user j.Eq. (1) means that we always select the more likely resultbetween user i’s two possible states for city k, i.e., xi(k) =1 and xi(k) = 0. MPBP repeats until the messages becomenegligible in two consecutive iterations (e.g., the l1 distanceof changes becomes smaller than 10−3), or it reaches thepredefined maximum number of iterations. After convergencein iteration t, we estimate the belief p(t)
i,z(xi(k) = 1) (denotedby p
(t)i,z(k)) as
gi,z(k) ·∏u∈Γi
m(t)u,i,z(k)
gi,z(k) ·∏u∈Γi
m(t)u,i,z(k) + (1− gi,z(k)) ·
∏u∈Γi
(1−m(t)u,i,z(k))
.
(2)The above iterative process is run in every community of
each graph Gz (∀z ∈ [1, 4]) where a seed user exists. If thereare multiple seeds in one community, a single run is doneper each unique seed location, in which all the seeds in thesame location are simultaneously involved. Each user i in Gzbelongs to only one community, and how many of user i’slocation-belief elements are updated from the initial 0.5 equalsthe number of unique seed positions in the same community.
C. Multi-Layer Location-Belief Propagation (ML-LBP)
Recall that user i may belong to multiple categorizedtransaction graphs if he/she has transaction records in differentcategories. This means that user i may have obtained different

2327-4662 (c) 2018 IEEE. Personal use is permitted, but republication/redistribution requires IEEE permission. See http://www.ieee.org/publications_standards/publications/rights/index.html for more information.
This article has been accepted for publication in a future issue of this journal, but has not been fully edited. Content may change prior to final publication. Citation information: DOI 10.1109/JIOT.2018.2844218, IEEE Internet ofThings Journal
IEEE INTERNET OF THINGS JOURNAL, VOL. XX, NO. YY, JANUARY 2018 6
Algorithm 1: Multi-Layer Location-Belief Propaga-tion
Input: Community set {Cz}4z=1, LOutput: Location belief pi for each user i
1 Initialize p(0)i,z for each user i, ∀z ∈ [1, 4];
2 p(0)i ←
∑z∈[1,4] βz · p
(0)i,z ;
3 l← 1;4 while l ≤ L do5 for each community set Cz do6 Compute p
(l)i,z by MP-LBP with p
(l−1)i,z as the
input for each community in Cz;
7 p(l)i ←
∑z∈[1,4] βz · p
(l)i,z,∀i;
8 if ||p(l)i −p
(l−1)i ||1
||p(l−1)i ||
< 10−3,∀i then
9 return p(l)i ,∀i
10 l← l + 1;
11 return p(l)i ,∀i
location-belief values at the same location, say k, in differentcategories (layers). We thus design a Multi-Layer Location-Belief Propagation (ML-LBP) scheme to propagate locationbeliefs across different categories.
ML-LBP is also an iterative process, and the pseudocodeis summarized in Algorithm 1. Each iteration starts after MP-LBP has terminated in each graph Gz . Consider any iterationl ≥ 1. We abuse the notation by letting p
(l)i,z(k) denote user i’s
current location-belief value at position k in category z. Thenwe compute p
(l)i (k) =
∑4z=1 βzp
(l)i,z(k) for every node i in
each graph Gz , where βz refers to the normalized co-locationcoefficient for categoryz defined in Section IV-B. Next, MP-LBP is executed again in each graph Gz with the updatedlocation beliefs at each node. ML-LBP halts until there is nomore significant change in each user’s location belief betweentwo consecutive iterations, or a maximum tolerable number ofiterations are reached. The final p(l)
i (k) values for all possiblek compose user i’s location belief pi.
Finally, we can identify top-κ possible locations for eachnon-seed user i with the associated probabilities from its finallocation belief pi. Any position with probability no larger than0.5 is considered unlikely.
D. Seed Selection
A remaining issue is how to select seed users for multi-layerlocation-belief propagation. We say that a user is profiled aslong as he/she is in the same community of at least one seeduser in any category graph. Each seed user is profiled as wellbased on this definition. Intuitively, the more seeds we have,the more distributed the seeds are to different communities,the more non-seed users that can be profiled. In practice, itinvolves nontrivial effort to discover trustworthy seed userswith the same method for constructing the ground-truth dataset(see Section III-B). So we are interested in the minimum ofseeds needed to reach the given coverage-ratio λ such that thepercentage of profiled users is no smaller than γ. Alternatively,
0 20 40 60 80 1000306090
120150180
# of
See
ds
Inference Coverage ratio (%)
(a) Coverage ratio λ.
0 20 40 60 80 10080
85
90
95
100
Perc
enta
ge (%
)
Inference Coverage Ratio (%)
(b) Percentage of subsets with seeds
Fig. 2. Seed selection.
given a budget on the number of seeds, how should we selectthe seeds to maximize the coverage-ratio?
Seed selection can translate into the conventional max-imum coverage problem (MCP). In particular, recall that{C1,C2,C3,C4} denote all the possible communities in thefour categories, and the communities at different categoriesmay include the same user who has transaction records inmultiple categories. We abuse the notation by letting eachCz (∀z ∈ [1, 4]) denote the set of users there as well.So we have
⋃4z=1 Cz equivalent to the node set N in
the original transaction graph G = 〈N , E〉. Let C′ denotean arbitrary set of communities in {C1,C2,C3,C4}, i.e.,C′ ⊆ {C1,C2,C3,C4}. Seed selection can be casted as thefollowing problem.
Definition 1. [Seed Selection]: Given a coverage ratio λ anda set family {C1,C2,C3,C4}, find a minimum-size subsetC′ ⊆ {C1,C2,C3,C4} such that |
⋃C∈C′ C|
|⋃4
z=1 Cz|≥ λ.
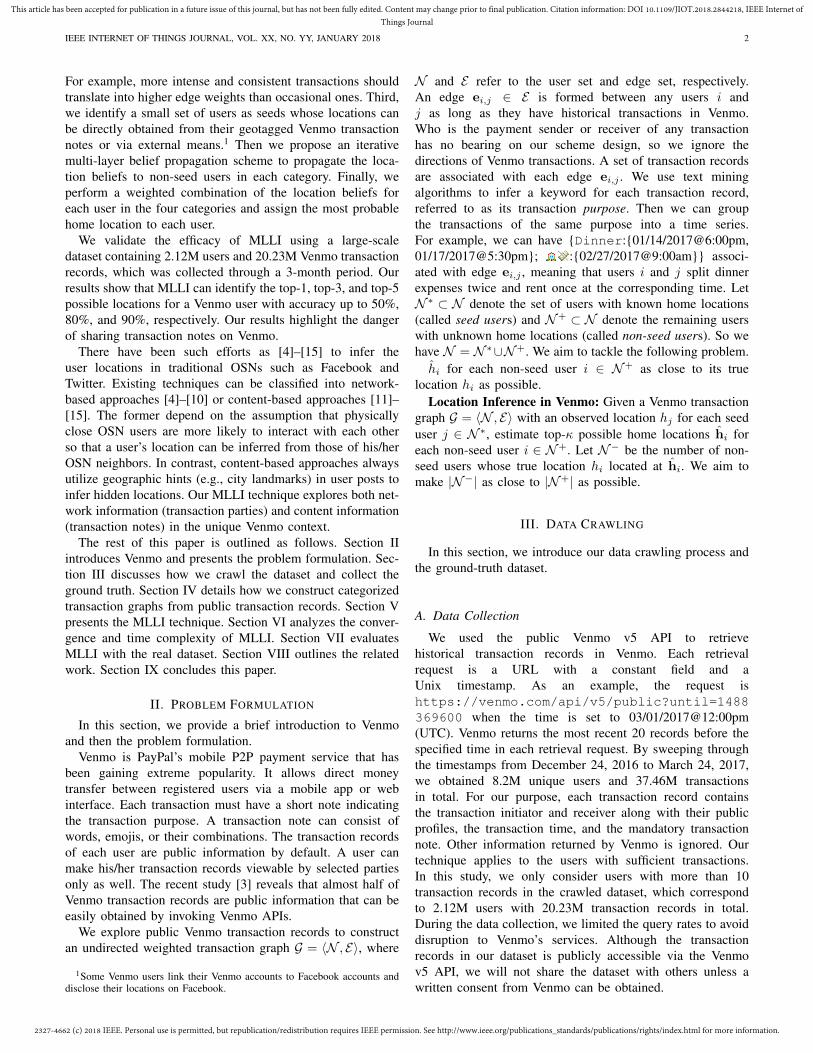
The above definition assumes that no more than one seed ischosen in each community to maximize the coverage ratio fora given number of seeds. Seed selection is equivalent to theclassical MCP which is known to be NP-hard. We address seedselection with the generic greedy algorithm [26], [27] whichcan approximate MCP in the best-possible polynomial time.Figure 2(a) depicts the number of seeds versus the coverageratio λ.
The generic greedy algorithm only outputs the communitiesfor a given λ, but we may not be able to discover a seeduser in each such community. If this happens, we consider thecorresponding community non-profitable and run the genericgreedy algorithm again by ignoring it. Our experiments indi-cate that this situation is rare. Fig. 2(b) depicts the percentageof communities with at least one seed, which is over 90% fordifferent coverage ratios.
VI. THEORETICAL ANALYSIS
A. Convergence AnalysisIn this section, we analyze the convergence of MP-LBP
and ML-LBP. MP-LBP is a linearized MPBP scheme over apMRF. Following the work in [25], [28], we linearize Eq. (2)with two steps. In the first step, when user i sends a messageto his/her neighbor j, we need to consider the message thathis/her neighbor j sends to i instead of excluding this message.In this case, we have the following equation
m(t)i,j,z(xj(k)) ∝ max
xi(k)ϕi,j,z(k) · p(t−1)(xi(k)) . (3)
2327-4662 (c) 2018 IEEE. Personal use is permitted, but republication/redistribution requires IEEE permission. See http://www.ieee.org/publications_standards/publications/rights/index.html for more information.
This article has been accepted for publication in a future issue of this journal, but has not been fully edited. Content may change prior to final publication. Citation information: DOI 10.1109/JIOT.2018.2844218, IEEE Internet ofThings Journal
IEEE INTERNET OF THINGS JOURNAL, VOL. XX, NO. YY, JANUARY 2018 7
In the second step, we define the residual values p(t)i,z(k) and
gi,z(k) as p(t)i,z(k)−0.5 and g
(t)i,z(k)−0.5, respectively. Based
on these notation, we replace Eq. (2) by
p(t)i,z(k) = gi,z(k) +
∑u∈Γi
m(t)u,i,z(k) . (4)
The proof can be found in Appendix A of [25]. Incorpo-rating Eq. (4) into Eq. (3) yields two cases: if xi(k) = 1,p
(t)i,z(k) = gi,z(k) + Vi · (ϕi,j,z(k) · (p(t−1)
i,z (k) + 0.5)− 0.5);if xi(k) = 0, p
(t)i,z(k) = gi,z(k) + Vi · ((1 − ϕi,j,z(k)) ·
(0.5 − p(t−1)i,z (k)) − 0.5). Note that Vi denotes the ith row
in the adjacency matrix Mz of the graph Gz . To simplifythe analysis, we set ϕi,j,z(k) as J for any two users [25].According to [29], the convergence condition for an iterativelinear process y(t) ← c + My(t−1) is that the spectral radiusof the matrix M (i.e., %(M)) is no larger than 1. Therefore,the sufficient and necessary condition that the linearized MP-LBP converges is J < 1
%(Mz) . ML-LBP is more complicatedand involves many calls of MP-LBP. We could not guaranteewhether ML-LBP will converge. When applying ML-LBP inpractice, we terminate it empirically until there is no moresignificant change in the location beliefs in two consecutiveiterations, or a maximum tolerable number of iterations arereached.
B. Complexity AnalysisIn this paper, the computational time of MLLI includes the
time for community division and time for ML-LBP. For agraph G = 〈N , E〉, the exact time complexity of communitydivision is unknown, but we can run the Louvain methodin time O(|N | log |N |) [20]. Since we deploy the Louvainmethod to four graphs and obtain their corresponding com-munities, the time complexity of community division in ourscheme is O(|N | log |N |). As discussed in [23], the compu-tation complexity of MP-LBP for the graph G is O(t · |E| ·σ),where t is the number of iterations in MP-LBP, and σ is thenumber of unique locations. In ML-LBP, MP-LBP is applied toall the graphs in the community set {C1,C2,C3,C4} in eachiteration, so the time complexity of ML-LBP is O(l·ν ·t·|E|·σ).Here, l denotes the number of iterations in ML-LBP, and νdenotes the total number of communities in {C1,C2,C3,C4}.
Each step in MLLI can be easily parallelized to reduce itscomplexity. Specifically, in the step of community division, thegraphs in {G1,G2,G3,G3} are independent, so we can deploythe Louvain method for graphs in parallel and thus reducethe computation time 75%. As in parallel MP-BP [30], [31],we can also parallelize MP-LBP by calculating the followingequation at the beginning of each iteration,
m(t−1)i,z (xi(k)) =
∏u∈Γi
m(t−1)u,i,z (xi(k)) .
Then we replace Eq. (1) by
m(t)i,j,z(xi(k)) = max
xi(k)ϕi,j,z(k) · θi,z(k) ·
m(t−1)i,z (xi(k))
m(t−1)j,i,z (xi(k))
.
Besides, each iteration in ML-LBP can be viewed as applyingMP-LBP to the corresponding graphs of all independent
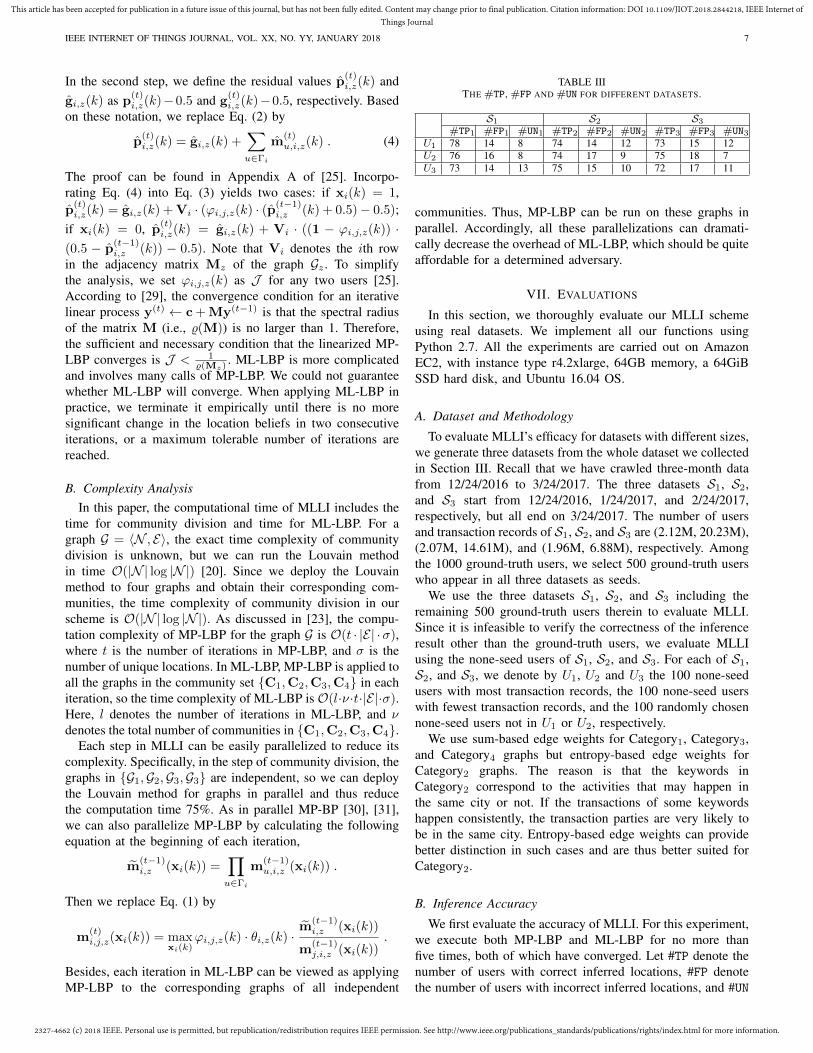
TABLE IIITHE #TP, #FP AND #UN FOR DIFFERENT DATASETS.
S1 S2 S3
#TP1 #FP1 #UN1 #TP2 #FP2 #UN2 #TP3 #FP3 #UN3U1 78 14 8 74 14 12 73 15 12U2 76 16 8 74 17 9 75 18 7U3 73 14 13 75 15 10 72 17 11
communities. Thus, MP-LBP can be run on these graphs inparallel. Accordingly, all these parallelizations can dramati-cally decrease the overhead of ML-LBP, which should be quiteaffordable for a determined adversary.
VII. EVALUATIONS
In this section, we thoroughly evaluate our MLLI schemeusing real datasets. We implement all our functions usingPython 2.7. All the experiments are carried out on AmazonEC2, with instance type r4.2xlarge, 64GB memory, a 64GiBSSD hard disk, and Ubuntu 16.04 OS.
A. Dataset and Methodology
To evaluate MLLI’s efficacy for datasets with different sizes,we generate three datasets from the whole dataset we collectedin Section III. Recall that we have crawled three-month datafrom 12/24/2016 to 3/24/2017. The three datasets S1, S2,and S3 start from 12/24/2016, 1/24/2017, and 2/24/2017,respectively, but all end on 3/24/2017. The number of usersand transaction records of S1, S2, and S3 are (2.12M, 20.23M),(2.07M, 14.61M), and (1.96M, 6.88M), respectively. Amongthe 1000 ground-truth users, we select 500 ground-truth userswho appear in all three datasets as seeds.
We use the three datasets S1, S2, and S3 including theremaining 500 ground-truth users therein to evaluate MLLI.Since it is infeasible to verify the correctness of the inferenceresult other than the ground-truth users, we evaluate MLLIusing the none-seed users of S1, S2, and S3. For each of S1,S2, and S3, we denote by U1, U2 and U3 the 100 none-seedusers with most transaction records, the 100 none-seed userswith fewest transaction records, and the 100 randomly chosennone-seed users not in U1 or U2, respectively.
We use sum-based edge weights for Category1, Category3,and Category4 graphs but entropy-based edge weights forCategory2 graphs. The reason is that the keywords inCategory2 correspond to the activities that may happen inthe same city or not. If the transactions of some keywordshappen consistently, the transaction parties are very likely tobe in the same city. Entropy-based edge weights can providebetter distinction in such cases and are thus better suited forCategory2.
B. Inference Accuracy
We first evaluate the accuracy of MLLI. For this experiment,we execute both MP-LBP and ML-LBP for no more thanfive times, both of which have converged. Let #TP denote thenumber of users with correct inferred locations, #FP denotethe number of users with incorrect inferred locations, and #UN
2327-4662 (c) 2018 IEEE. Personal use is permitted, but republication/redistribution requires IEEE permission. See http://www.ieee.org/publications_standards/publications/rights/index.html for more information.
This article has been accepted for publication in a future issue of this journal, but has not been fully edited. Content may change prior to final publication. Citation information: DOI 10.1109/JIOT.2018.2844218, IEEE Internet ofThings Journal
IEEE INTERNET OF THINGS JOURNAL, VOL. XX, NO. YY, JANUARY 2018 8
1 2 3 4 50.0
0.2
0.4
0.6
0.8
1.0
# of iterations
(a) Impact of t on η.
10-310-2
1
ξ(l)−
(l−1)
2
10-1
(1)-(0) t
3 (2)-(1)
100
(3)-(2)4 (4)-(3)
5 (5)-(4)
(b) Impact of l and t on ξ.
1 2 3 4 5 60.5
0.6
0.7
0.8
0.9
1.0
Infe
renc
e Ac
cura
cy
# of iterations
U1 U2 U3
(c) Impact of l on accuracy.
1 2 3 4 50.5
0.6
0.7
0.8
0.9
1.0
Infe
renc
e Ac
cura
cy
U1 U2 U3
(d) Impact of κ on accuracy.
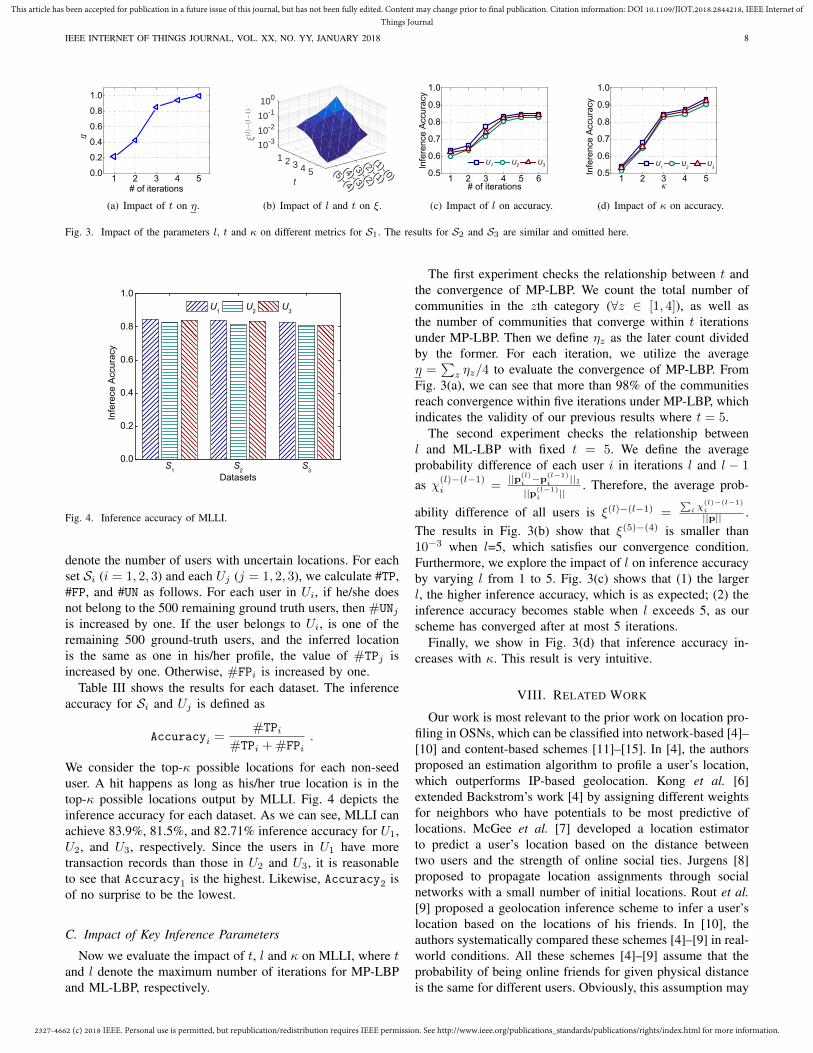
Fig. 3. Impact of the parameters l, t and κ on different metrics for S1. The results for S2 and S3 are similar and omitted here.
S1 S2 S3
0.0
0.2
0.4
0.6
0.8
1.0
Infe
rece
Acc
urac
y
Datasets
U1 U2 U3
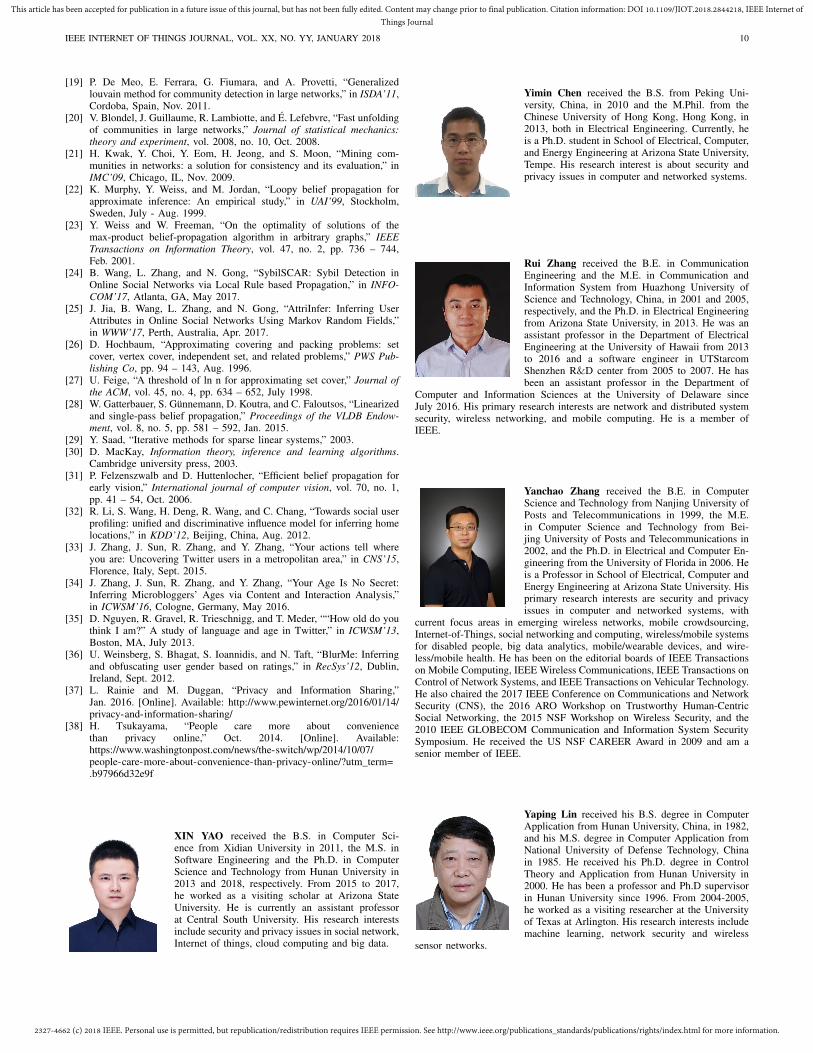
Fig. 4. Inference accuracy of MLLI.
denote the number of users with uncertain locations. For eachset Si (i = 1, 2, 3) and each Uj (j = 1, 2, 3), we calculate #TP,#FP, and #UN as follows. For each user in Ui, if he/she doesnot belong to the 500 remaining ground truth users, then #UNjis increased by one. If the user belongs to Ui, is one of theremaining 500 ground-truth users, and the inferred locationis the same as one in his/her profile, the value of #TPj isincreased by one. Otherwise, #FPi is increased by one.
Table III shows the results for each dataset. The inferenceaccuracy for Si and Uj is defined as
Accuracyi =#TPi
#TPi + #FPi.
We consider the top-κ possible locations for each non-seeduser. A hit happens as long as his/her true location is in thetop-κ possible locations output by MLLI. Fig. 4 depicts theinference accuracy for each dataset. As we can see, MLLI canachieve 83.9%, 81.5%, and 82.71% inference accuracy for U1,U2, and U3, respectively. Since the users in U1 have moretransaction records than those in U2 and U3, it is reasonableto see that Accuracy1 is the highest. Likewise, Accuracy2 isof no surprise to be the lowest.
C. Impact of Key Inference Parameters
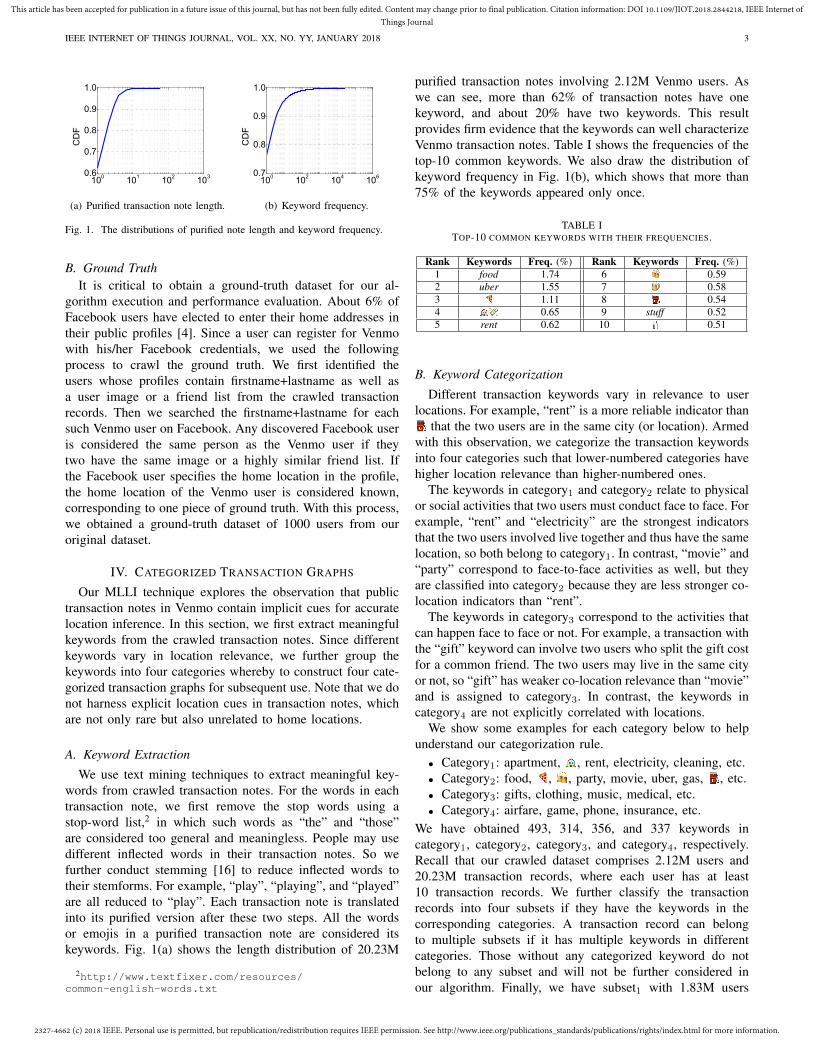
Now we evaluate the impact of t, l and κ on MLLI, where tand l denote the maximum number of iterations for MP-LBPand ML-LBP, respectively.
The first experiment checks the relationship between t andthe convergence of MP-LBP. We count the total number ofcommunities in the zth category (∀z ∈ [1, 4]), as well asthe number of communities that converge within t iterationsunder MP-LBP. Then we define ηz as the later count dividedby the former. For each iteration, we utilize the averageη =
∑z ηz/4 to evaluate the convergence of MP-LBP. From
Fig. 3(a), we can see that more than 98% of the communitiesreach convergence within five iterations under MP-LBP, whichindicates the validity of our previous results where t = 5.
The second experiment checks the relationship betweenl and ML-LBP with fixed t = 5. We define the averageprobability difference of each user i in iterations l and l − 1
as χ(l)−(l−1)i =
||p(l)i −p
(l−1)i ||1
||p(l−1)i ||
. Therefore, the average prob-
ability difference of all users is ξ(l)−(l−1) =∑
i χ(l)−(l−1)i
||p|| .The results in Fig. 3(b) show that ξ(5)−(4) is smaller than10−3 when l=5, which satisfies our convergence condition.Furthermore, we explore the impact of l on inference accuracyby varying l from 1 to 5. Fig. 3(c) shows that (1) the largerl, the higher inference accuracy, which is as expected; (2) theinference accuracy becomes stable when l exceeds 5, as ourscheme has converged after at most 5 iterations.
Finally, we show in Fig. 3(d) that inference accuracy in-creases with κ. This result is very intuitive.
VIII. RELATED WORK
Our work is most relevant to the prior work on location pro-filing in OSNs, which can be classified into network-based [4]–[10] and content-based schemes [11]–[15]. In [4], the authorsproposed an estimation algorithm to profile a user’s location,which outperforms IP-based geolocation. Kong et al. [6]extended Backstrom’s work [4] by assigning different weightsfor neighbors who have potentials to be most predictive oflocations. McGee et al. [7] developed a location estimatorto predict a user’s location based on the distance betweentwo users and the strength of online social ties. Jurgens [8]proposed to propagate location assignments through socialnetworks with a small number of initial locations. Rout et al.[9] proposed a geolocation inference scheme to infer a user’slocation based on the locations of his friends. In [10], theauthors systematically compared these schemes [4]–[9] in real-world conditions. All these schemes [4]–[9] assume that theprobability of being online friends for given physical distanceis the same for different users. Obviously, this assumption may

2327-4662 (c) 2018 IEEE. Personal use is permitted, but republication/redistribution requires IEEE permission. See http://www.ieee.org/publications_standards/publications/rights/index.html for more information.
This article has been accepted for publication in a future issue of this journal, but has not been fully edited. Content may change prior to final publication. Citation information: DOI 10.1109/JIOT.2018.2844218, IEEE Internet ofThings Journal
IEEE INTERNET OF THINGS JOURNAL, VOL. XX, NO. YY, JANUARY 2018 9
not hold in practice; e.g., a famous user is more likely to havea follower far away than a regular user. In addition, Chenget al. [11] predicted a user’s location based on the content oftweets, where they identified a set of geographic hints (e.g.,“New York”) and utilized them to associate the user with somelocations. In [12], the authors proposed an improvement over[11] by associating a user’s original tweets to himself and hisretweets to the initial users. Furthermore, Mahmud et al. [13],[14] utilized an ensemble of statistical and heuristic classifiersto predict locations, but these schemes treat geographic hintsand locations as discrete labels and overlook their explicitrelations. Later on, Li et al. [32] explored a probabilistic modelto profile users’ locations, which utilizes OSN connectionsand tweets in a unified and discriminative manner. Finally,Zhang et al. [33] proposed a novel and lightweight system tofind the majority of the users in a specific geographical areawithout scanning the whole Twittersphere. Public transactionrecords in Venmo do not have sufficient geographic cues. Sothis technique [33] is not directly applicable to our context.
There is also significant research on inferring sensitive userinformation other than locations. For example, Zhang et al.[34] proposed a new framework to profile the hidden agesof microbloggers by exploring public content and interactioninformation. In [35], the authors explored the relation betweenage and language use for inferring age categories, life stages,and exact ages. Besides, Weinsberg et al. [36] proposed toinfer gender by considering the rating scores for differentmovies. Jia et al. [25] explored user behaviors to learn abinary classifier and then used it to predict the prior probabilitythat each target user has a specific attribute value. Then theyused a binary random variable to characterize each user andmodeled the joint probability distribution of all binary randomvariables as a pairwise Markov Random Field based on theOSN structure. Given the training dataset and prior probability,they used Loopy Belief Propagation (LBP) to propagate labelinformation and obtained the posterior probability to predictwhether a target user has the attribute or not. This work [25]motivates us to use a pairwise Markov Random Field for max-product location-belief propagation (MP-LBP).
IX. CONCLUSION AND DISCUSSION
In this paper, we studied the implicit leakage of personallocation information in Venmo, a popular mobile P2P system.We developed MLLI, a novel multi-layer location inferencealgorithm to infer hidden user locations from public transac-tion records in Venmo. Based on a real dataset consisting of2.12M users and 20.23M transaction records, we showed thatMLLI can identify the top-3 possible locations for a Venmouser with accuracy up to 80%.
Our experimental results show that the attackers can inferVenmo users’ home locations with high accuracy. Here webriefly discuss two potential countermeasures. First, VenmoApp may change its default system setting for users’ transac-tions. In particular, the current default system setting is thatuser’s transactions are public, and we recommend to changeit to non-public. As reported by the Rainie and Duggan’sreports [37], most people are not aware of potential privacyrisks, even giving up privacy for convenience [38]. Since users
seldom change system default settings, doing so can effectivelyprevent the attacker from learning the temporal patterns ofuser transactions and thus thwart location inferrence. Second,Venmo APP can reduce the number of public transactionrecords and thus dilute the weights among users. This candecrease the inference accuracy as the belief propagationprocesses in the MLBP technique mainly depend on theweights among users.
ACKNOWLEDGMENT
This work was partially supported by US Army ResearchOffice through grant W911NF-15-1-0328, US National Sci-ence Foundation through grants CNS-1700032, CNS-1700039,CNS-1651954 (CAREER), and CNS-1718078, and NationalNatural Science Foundation of China through grant 61472125.
REFERENCES
[1] F. Richter, “Mobile Payment Volume to Increase Tenfold by 2021,”Jan. 2017. [Online]. Available: https://www.statista.com/chart/7793/mobile-payment-transaction-volume/
[2] N. Gagliordi, “Paypal delivers solid Q1, payment volume reaches $99billion,” Apr. 2017. [Online]. Available: http://www.zdnet.com/article/paypal-delivers-solid-q1-payment-volume-reaches-99-billion/
[3] X. Zhang, S. Tang, Y. Zhao, G. Wang, H. Zheng, and B. Zhao, “ColdHard E-Cash: Friends and Vendors in the Venmo Digital PaymentsSystem,” in ICWSM’17, Montreal, Canada, May 2017.
[4] L. Backstrom, E. Sun, and C. Marlow, “Find me if you can: improvinggeographical prediction with social and spatial proximity,” in WWW’10,Raleigh, NC, Apr. 2010.
[5] Q. Liu, G. Wang, F. Li, S. Yang, and J. Wu, “Preserving Privacy withProbabilistic Indistinguishability in Weighted Social Networks,” IEEETransactions on Parallel and Distributed Systems, vol. 28, no. 5, pp.1417 – 1429, May 2017.
[6] L. Kong, Z. Liu, and Y. Huang, “Spot: Locating social media users basedon social network context,” Proceedings of the VLDB Endowment, vol. 7,no. 13, pp. 1681 – 1684, Aug. 2014.
[7] J. McGee, J. Caverlee, and Z. Cheng, “Location prediction in socialmedia based on tie strength,” in CIKM’13, San Francisco, CA, Oct.2013.
[8] D. Jurgens, “That’s What Friends Are For: Inferring Location in OnlineSocial Media Platforms Based on Social Relationships,” in ICWSM’13,Boston, MA, July 2013.
[9] D. Rout, K. Bontcheva, D. Preotiuc-Pietro, and T. Cohn, “Where’s@wally?: a classification approach to geolocating users based on theirsocial ties,” in HT’13, Paris, France, May 2013.
[10] D. Jurgens, T. Finethy, J. McCorriston, Y. Xu, and D. Ruths, “Geoloca-tion Prediction in Twitter Using Social Networks: A Critical Analysisand Review of Current Practice,” in ICWSM’15, Oxford, UK, May 2015.
[11] Z. Cheng, J. Caverlee, and K. Lee, “You are where you tweet: a content-based approach to geo-locating twitter users,” in CIKM’10, Toronto,Canada, Oct. 2010.
[12] S. Chandra, L. Khan, and F. Muhaya, “Estimating twitter user locationusing social interactions–a content based approach,” in SocialCom’11,Boston, MA, Oct. 2011.
[13] J. Mahmud, J. Nichols, and C. Drews, “Where Is This Tweet From?Inferring Home Locations of Twitter Users,” in ICWSM’12, Dublin,Ireland, June 2012.
[14] J. Mahmud, J. Nichols, and C. Drews, “Home location identification oftwitter users,” ACM Transactions on Intelligent Systems and Technology,vol. 5, no. 3, p. 47, Oct. 2014.
[15] A. Olteanu, K. Huguenin, R. Shokri, M. Humbert, and J. Hubaux,“Quantifying interdependent privacy risks with location data,” IEEETransactions on Mobile Computing, vol. 16, no. 3, pp. 829 – 842, 2017.
[16] M. Porter, Readings in information retrieval. Morgan KaufmannPublishers Inc., 1997.
[17] M. Newman and M. Girvan, “Finding and evaluating community struc-ture in networks,” Physical review E, vol. 69, no. 2, p. 026113, Feb.2004.
[18] V. Blondel, J. Guillaume, R. Lambiotte, and É. Lefebvre, “The Lou-vain method for community detection in large networks,” Journal ofstatistical mechanics: theory and experiment, vol. 10, Mar. 2011.
2327-4662 (c) 2018 IEEE. Personal use is permitted, but republication/redistribution requires IEEE permission. See http://www.ieee.org/publications_standards/publications/rights/index.html for more information.
This article has been accepted for publication in a future issue of this journal, but has not been fully edited. Content may change prior to final publication. Citation information: DOI 10.1109/JIOT.2018.2844218, IEEE Internet ofThings Journal
IEEE INTERNET OF THINGS JOURNAL, VOL. XX, NO. YY, JANUARY 2018 10
[19] P. De Meo, E. Ferrara, G. Fiumara, and A. Provetti, “Generalizedlouvain method for community detection in large networks,” in ISDA’11,Cordoba, Spain, Nov. 2011.
[20] V. Blondel, J. Guillaume, R. Lambiotte, and É. Lefebvre, “Fast unfoldingof communities in large networks,” Journal of statistical mechanics:theory and experiment, vol. 2008, no. 10, Oct. 2008.
[21] H. Kwak, Y. Choi, Y. Eom, H. Jeong, and S. Moon, “Mining com-munities in networks: a solution for consistency and its evaluation,” inIMC’09, Chicago, IL, Nov. 2009.
[22] K. Murphy, Y. Weiss, and M. Jordan, “Loopy belief propagation forapproximate inference: An empirical study,” in UAI’99, Stockholm,Sweden, July - Aug. 1999.
[23] Y. Weiss and W. Freeman, “On the optimality of solutions of themax-product belief-propagation algorithm in arbitrary graphs,” IEEETransactions on Information Theory, vol. 47, no. 2, pp. 736 – 744,Feb. 2001.
[24] B. Wang, L. Zhang, and N. Gong, “SybilSCAR: Sybil Detection inOnline Social Networks via Local Rule based Propagation,” in INFO-COM’17, Atlanta, GA, May 2017.
[25] J. Jia, B. Wang, L. Zhang, and N. Gong, “AttriInfer: Inferring UserAttributes in Online Social Networks Using Markov Random Fields,”in WWW’17, Perth, Australia, Apr. 2017.
[26] D. Hochbaum, “Approximating covering and packing problems: setcover, vertex cover, independent set, and related problems,” PWS Pub-lishing Co, pp. 94 – 143, Aug. 1996.
[27] U. Feige, “A threshold of ln n for approximating set cover,” Journal ofthe ACM, vol. 45, no. 4, pp. 634 – 652, July 1998.
[28] W. Gatterbauer, S. Günnemann, D. Koutra, and C. Faloutsos, “Linearizedand single-pass belief propagation,” Proceedings of the VLDB Endow-ment, vol. 8, no. 5, pp. 581 – 592, Jan. 2015.
[29] Y. Saad, “Iterative methods for sparse linear systems,” 2003.[30] D. MacKay, Information theory, inference and learning algorithms.
Cambridge university press, 2003.[31] P. Felzenszwalb and D. Huttenlocher, “Efficient belief propagation for
early vision,” International journal of computer vision, vol. 70, no. 1,pp. 41 – 54, Oct. 2006.
[32] R. Li, S. Wang, H. Deng, R. Wang, and C. Chang, “Towards social userprofiling: unified and discriminative influence model for inferring homelocations,” in KDD’12, Beijing, China, Aug. 2012.
[33] J. Zhang, J. Sun, R. Zhang, and Y. Zhang, “Your actions tell whereyou are: Uncovering Twitter users in a metropolitan area,” in CNS’15,Florence, Italy, Sept. 2015.
[34] J. Zhang, J. Sun, R. Zhang, and Y. Zhang, “Your Age Is No Secret:Inferring Microbloggers’ Ages via Content and Interaction Analysis,”in ICWSM’16, Cologne, Germany, May 2016.
[35] D. Nguyen, R. Gravel, R. Trieschnigg, and T. Meder, ““How old do youthink I am?” A study of language and age in Twitter,” in ICWSM’13,Boston, MA, July 2013.
[36] U. Weinsberg, S. Bhagat, S. Ioannidis, and N. Taft, “BlurMe: Inferringand obfuscating user gender based on ratings,” in RecSys’12, Dublin,Ireland, Sept. 2012.
[37] L. Rainie and M. Duggan, “Privacy and Information Sharing,”Jan. 2016. [Online]. Available: http://www.pewinternet.org/2016/01/14/privacy-and-information-sharing/
[38] H. Tsukayama, “People care more about conveniencethan privacy online,” Oct. 2014. [Online]. Available:https://www.washingtonpost.com/news/the-switch/wp/2014/10/07/people-care-more-about-convenience-than-privacy-online/?utm_term=.b97966d32e9f
XIN YAO received the B.S. in Computer Sci-ence from Xidian University in 2011, the M.S. inSoftware Engineering and the Ph.D. in ComputerScience and Technology from Hunan University in2013 and 2018, respectively. From 2015 to 2017,he worked as a visiting scholar at Arizona StateUniversity. He is currently an assistant professorat Central South University. His research interestsinclude security and privacy issues in social network,Internet of things, cloud computing and big data.
Yimin Chen received the B.S. from Peking Uni-versity, China, in 2010 and the M.Phil. from theChinese University of Hong Kong, Hong Kong, in2013, both in Electrical Engineering. Currently, heis a Ph.D. student in School of Electrical, Computer,and Energy Engineering at Arizona State University,Tempe. His research interest is about security andprivacy issues in computer and networked systems.
Rui Zhang received the B.E. in CommunicationEngineering and the M.E. in Communication andInformation System from Huazhong University ofScience and Technology, China, in 2001 and 2005,respectively, and the Ph.D. in Electrical Engineeringfrom Arizona State University, in 2013. He was anassistant professor in the Department of ElectricalEngineering at the University of Hawaii from 2013to 2016 and a software engineer in UTStarcomShenzhen R&D center from 2005 to 2007. He hasbeen an assistant professor in the Department of
Computer and Information Sciences at the University of Delaware sinceJuly 2016. His primary research interests are network and distributed systemsecurity, wireless networking, and mobile computing. He is a member ofIEEE.
Yanchao Zhang received the B.E. in ComputerScience and Technology from Nanjing University ofPosts and Telecommunications in 1999, the M.E.in Computer Science and Technology from Bei-jing University of Posts and Telecommunications in2002, and the Ph.D. in Electrical and Computer En-gineering from the University of Florida in 2006. Heis a Professor in School of Electrical, Computer andEnergy Engineering at Arizona State University. Hisprimary research interests are security and privacyissues in computer and networked systems, with
current focus areas in emerging wireless networks, mobile crowdsourcing,Internet-of-Things, social networking and computing, wireless/mobile systemsfor disabled people, big data analytics, mobile/wearable devices, and wire-less/mobile health. He has been on the editorial boards of IEEE Transactionson Mobile Computing, IEEE Wireless Communications, IEEE Transactions onControl of Network Systems, and IEEE Transactions on Vehicular Technology.He also chaired the 2017 IEEE Conference on Communications and NetworkSecurity (CNS), the 2016 ARO Workshop on Trustworthy Human-CentricSocial Networking, the 2015 NSF Workshop on Wireless Security, and the2010 IEEE GLOBECOM Communication and Information System SecuritySymposium. He received the US NSF CAREER Award in 2009 and am asenior member of IEEE.
Yaping Lin received his B.S. degree in ComputerApplication from Hunan University, China, in 1982,and his M.S. degree in Computer Application fromNational University of Defense Technology, Chinain 1985. He received his Ph.D. degree in ControlTheory and Application from Hunan University in2000. He has been a professor and Ph.D supervisorin Hunan University since 1996. From 2004-2005,he worked as a visiting researcher at the Universityof Texas at Arlington. His research interests includemachine learning, network security and wireless
sensor networks.