IEC, 86B Collaboration project
33
Sensitivity of 40G NRZ optic link to connector quality: BER and Eye Diagram data Melbourne, Oct 2011 IEC, 86B Collaboration project
Transcript of IEC, 86B Collaboration project

Sensitivity of 40G NRZ optic link to connector quality:
BER and Eye Diagram data
Melbourne, Oct 2011
IEC, 86B Collaboration project

2 Celestica | Regional Optoelectronics Laboratory
Project Contributors
Celestica International Inc
Vittawat Phunnarungsi, Rutsuda Thongdaeng,
Tatiana Berdinskikh, Robert Suurmann and George Lim
Orange Labs, Polish Telecom
Andrzej Tymecki
TE Connectivity
Mike Gurreri and Joshua Webb
EXFO
Gwennael Amice
Agilent Technologies
John Dorighi
JDSU
Matt Brown and Matt Adams
Giorgio Friedrich
3 Celestica | Regional Optoelectronics Laboratory
Agenda
Introduction
Project Objectives
Sample preparation
Experimental Methodology & Test Setup
Experimental data
Bit Error Rate
Eye Diagram
Jitter, Q-factor
Conclusions
Next steps
4 Celestica | Regional Optoelectronics Laboratory
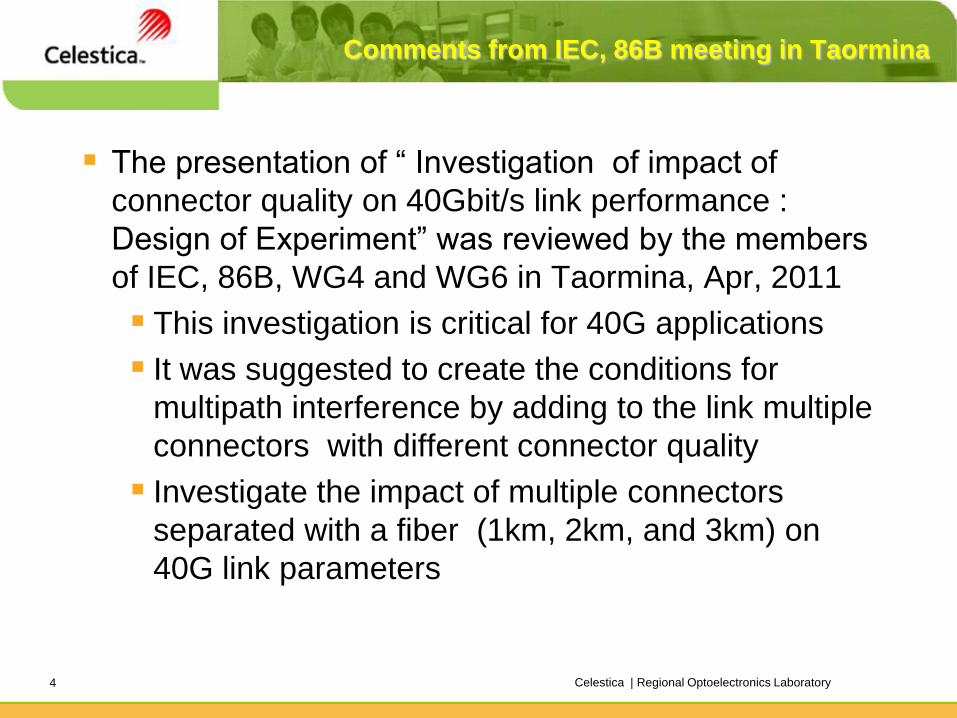
The presentation of “ Investigation of impact of
connector quality on 40Gbit/s link performance :
Design of Experiment” was reviewed by the members
of IEC, 86B, WG4 and WG6 in Taormina, Apr, 2011
This investigation is critical for 40G applications
It was suggested to create the conditions for
multipath interference by adding to the link multiple
connectors with different connector quality
Investigate the impact of multiple connectors
separated with a fiber (1km, 2km, and 3km) on
40G link parameters
Comments from IEC, 86B meeting in Taormina

5 Celestica | Regional Optoelectronics Laboratory
Objectives
Investigate the impact of multiple connectors with
different connector quality endface ( with scratches
and pristine) on 40G NRZ Optical link transmission
Investigate the impact of multiple connectors
separated with a fiber (1, 2 and 3km) on 40G NRZ
Optical link transmission
Understand if industry standards on connector quality
and cleanliness are sufficient for 40G applications

6 Celestica | Regional Optoelectronics Laboratory
Sample Layout
DUT SC
SCA SCU SCA SCA SCA
0.5 m
250 m
10 m 10 m 1 m
2 mm
jacket
2 mm
jacket 2 mm
jacket
QTY: 1 QTY: 1 QTY: 2 per group QTY: 2 per group
Experimental Cables ( DUTs) and Reference
cables were prepared by TE Connectivity
DUT Assembly
Reference
cable Pigtail will be
spliced to fiber spool

7 Celestica | Regional Optoelectronics Laboratory
Sample characterization by TE Connectivity
Experimental Groups 1-6
RL of mated connector pair was in a range (26.8-28.9)dB for Group 1, in a
range of (40-42.7)dB for Group 2 and in a range of (60.3-63.3)dB for Group3
All connectors have low attenuation (<0.1dB) and low PDL (≤0.012dB)
Group # RL Qty Connector Type
1 20-30 2 LC/UPC
2 40-50 2 LC/UPC
3 60-70 2 LC/UPC
4 60-70 2 SC/UPC
5 60-70 2 SC/APC
6 >80 2 SC/APC

8 Celestica | Regional Optoelectronics Laboratory
Connector Endface, IL & RL Data
Group 1, Sample1A,
IL=0.07dB, RL=28.9dB
Group 2, Sample1B
IL=0.08dB, RL=40dB
Group 3, Sample1A
IL=0.07dB, RL=61.3dB
Group 4, Sample1A
UL=0.02dB, RL=61.9dB
Group 5, Sample1B
IL=0.12dB, RL=60.57dB Group 6, Sample1A
IL=0.01dB, RL=80.6dB
IL and RL data @1310 nm

9 Celestica | Regional Optoelectronics Laboratory
Compare BERT, Eye Diagram, Jitter and Q-factor performance
Setup #1: 2 DUTs , same group. No fiber spool between DUT( Test Setup1)
Setup#2: 2 DUTs , same group . Separate DUT1 and DUT2 with fiber spool 1km, 2km, and 3 km (Test Setup 2)
Setup#3: No DUT. Fiber spool 1km, 2km, and 3 km (Test Setup 3)
Setup#4: (Test setup 4)
4 DUTs from Group 1 &2 in serial
4 DUTs from Group 3 &4 in serial and
4 DUTs from Group 5 &6 in serial
Setup#5: separate DUT1 and DUT2 with fiber spool 1 km and DUT3 and DUT 4 with fiber spool 2 km (Test Setup 5)
4 DUTs from Group 1 &2 in serial
4 DUTs from Group 3 &4 in serial and
4 DUTs from Group 5 &6 in serial
Eye Diagram, Jitter and Q-factor
measurements

10 Celestica | Regional Optoelectronics Laboratory
Test Setup Summary
Setup#1
Setup#2
Setup#3
Setup#4
Setup#5
Group1
Group2
Group3
Group4
Group5
Group6
Sample1 Sample2
1km
2km
3km
Initial setup Repeat setup
2
3
4
5
6
1
1
1
1
2
3
2
3
2 4 No Fiber 3
1
2
3
4
5
6
7
8
9
10
11
12
13
14
15
16
17
18

11 Celestica | Regional Optoelectronics Laboratory
SCA
4 SCA
3 SCA
ATTEN#1 Power Controller
FCA FCA
DCA-J Eye / Jitter
2.4GHz CLK
ILX Optical Power Meter
OSA OSNR Monitor
1
2
Tx
Rx
BER Analyzer
Yokogawa
NX4000
NX4000 40/43G BERT
SCU
SCU
EDFA Optical Amplifier
SCA SCA
SCA
SCA
SCU
DUT1 LC/UPC
SCA SCA
•Investigate the impact of 2 DUTs from the same Group
on optical performance[ BERT, Eye diagram, Jitter, etc]
•DUT1 is Group N sample 1
•DUT2 is Group N sample 2 N = 1, 2, …,6
DUT2 LC/UPC
SCA SCA
Setup#1
Investigation of multipath interference
Setup#1

12 Celestica | Regional Optoelectronics Laboratory
SCA
4 SCA
3 SCA
ATTEN#1 Power Controller
FCA FCA
DCA-J Eye / Jitter
2.4GHz CLK
ILX Optical Power Meter
OSA OSNR Monitor
1
2
Tx
Rx
BER Analyzer
Yokogawa
NX4000
NX4000 40/43G BERT
SCU
SCU
EDFA Optical Amplifier
SCA SCA
SCA
SCA
SCU
Fiber Spool CD
SCA SCA
DUT1 LC/UPC
SCA SCA
With 1km Fiber spool in the middle
DUT1 is Group N sample 1
DUT2 is Group N sample 2 N = 1, 2, …,6
Repeat 1km Fiber Spool with 2km, and 3 km
DUT2 LC/UPC
SCA SCA
Setup#2
Investigation of multipath interference
Setup#2

13 Celestica | Regional Optoelectronics Laboratory
SCA
4 SCA
3 SCA
ATTEN#1 Power Controller
FCA FCA
DCA-J Eye / Jitter
2.4GHz CLK
ILX Optical Power Meter
OSA OSNR Monitor
1
2
Tx
Rx
BER Analyzer
Yokogawa
NX4000
NX4000 40/43G BERT
SCU
SCU
EDFA Optical Amplifier
SCA SCA
SCA
SCA
SCU
Fiber Spool CD
SCA SCA
Setup#3
•No DUT
•Fiber Spool 1 km, 2 km, and 3 km
Investigation of multipath interference
Setup#3

14 Celestica | Regional Optoelectronics Laboratory
SCA
4 SCA
3 SCA
ATTEN#1 Power Controller
FCA FCA
DCA-J Eye / Jitter
2.4GHz CLK
ILX Optical Power Meter
OSA OSNR Monitor
1
2
Tx
Rx
BER Analyzer
Yokogawa
NX4000
NX4000 40/43G BERT
SCU
SCU
EDFA Optical Amplifier
SCA SCA
SCA
SCA
SCU
Setup#4
•Modified Setup for the investigation of multipath
interference 4 DUTs
•Setup4A: Group 1Sample1&2 and Group 2 Sample 1&2
•Setup4B: Group 3Sample1&2 and Group 4 Sample 1&2
•Setup4C: Group 5Sample1&2 and Group 6 Sample 1&2
DUT1 LC/UPC
SCA SCA
DUT2 LC/UPC
SCA SCA
DUT3 LC/UPC
SCA SCA
DUT4 LC/UPC
SCA SCA
Investigation of multipath interference
Setup#4

15 Celestica | Regional Optoelectronics Laboratory
SCA
4 SCA
3 SCA
ATTEN#1 Power Controller
FCA FCA
DCA-J Eye / Jitter
2.4GHz CLK
ILX Optical Power Meter
OSA OSNR Monitor
1
2
Tx
Rx
BER Analyzer
Yokogawa
NX4000
NX4000 40/43G BERT
SCU
SCU
EDFA Optical Amplifier
SCA SCA
SCA
SCA
SCU
Setup#5
Setup for the investigation of multipath interference 4 DUTs
DUT1 is Group N Sample1 DUT2 is Group N Sample 2
N is 1,3 and 5
DUT3 is Group M sample 1 DUT 2 is Group M sample 2
M is 2, 4,and 6
Separate DUT1 and DUT2 with fiber spool 1 km
Separate DUT3 and DUT4 with fiber spool 2 km
Fiber Spool CD
Fiber Spool CD
DUT LC/UPC
SCA SCA
DUT LC/UPC
SCA SCA
DUT LC/UPC
SCA SCA
DUT LC/UPC
SCA SCA SCA SCA SCA SCA
1km 2km
Investigation of multipath interference
Setup#5

16 Celestica | Regional Optoelectronics Laboratory
BERT & Eye Diagram Measurement
BERT Setup
40Gbps NRZ
PRBS15
3 mins measurements, 3 times
1dB step
DCA Setup
Receiver = 8dBm (at ILX power meter)
500 waveforms
3 patterns for jitter measurement, 3 times

17 Celestica | Regional Optoelectronics Laboratory
BER Result
Result from setup 1
Setup1 : two connectors from the same group. Example: Group1 sample1 connect to group1 sample 2, No
additional fiber in between.
No significant impact of connector Group to the BER curve was observed.
BER
Setup 1 : DUT-DUT
1.E-11
1.E-10
1.E-09
1.E-08
1.E-07
1.E-06
1.E-05
1.E-04
1.E-03
1.E-02
1.E-01
1.E+00
-17.0 -16.0 -15.0 -14.0 -13.0 -12.0 -11.0 -10.0 -9.0
power
(dBm)
BER
Group1
Group2
Group3
Group4
Group5
Group6

18 Celestica | Regional Optoelectronics Laboratory
BER Result
Setup#2
Result from setup 2
Setup2-1km : Group1 sample1 connect to group1 sample 2, with additional 1km fiber in the middle
Setup2-2km : Group1 sample1 connect to group1 sample 2, with additional 2km fiber in the middle
Setup2-3km : Group1 sample1 connect to group1 sample 2, with additional 3km fiber in the middle
No significant impact of connector quality on BER curve was observed
BER
Setup 2-(1km) : DUT - 1km - DUT
1.E-12
1.E-11
1.E-10
1.E-09
1.E-08
1.E-07
1.E-06
1.E-05
1.E-04
1.E-03
1.E-02
1.E-01
1.E+00
-17.0 -16.0 -15.0 -14.0 -13.0 -12.0 -11.0 -10.0 -9.0
power
(dBm)
BER
Group1
Group2
Group3
Group4
Group5
Group6
BER
Setup 2-(2km) : DUT - 2km - DUT
1.E-10
1.E-09
1.E-08
1.E-07
1.E-06
1.E-05
1.E-04
1.E-03
1.E-02
1.E-01
1.E+00
-17.0 -16.0 -15.0 -14.0 -13.0 -12.0 -11.0 -10.0 -9.0
power
(dBm)
BER
Group1
Group2
Group3
Group4
Group5
Group6
BER
Setup 2-(3km) : DUT - 3km - DUT
1.E-13
1.E-12
1.E-11
1.E-10
1.E-09
1.E-08
1.E-07
1.E-06
1.E-05
1.E-04
1.E-03
1.E-02
1.E-01
1.E+00
-17.0 -16.0 -15.0 -14.0 -13.0 -12.0 -11.0 -10.0 -9.0
power
(dBm)
BER
Group1
Group2
Group3
Group4
Group5
Group6

19 Celestica | Regional Optoelectronics Laboratory
BER Result
Setup#2
When a fiber length increased from no fiber to 1km, 2km, and 3km, the BER curve was shifted up.
There is no difference between BER curves for setups with different Groups but with similar fiber
length.
BER
DUT - Fiber - DUT
1.E-13
1.E-12
1.E-11
1.E-10
1.E-09
1.E-08
1.E-07
1.E-06
1.E-05
1.E-04
1.E-03
1.E-02
1.E-01
1.E+00
-17.0 -16.0 -15.0 -14.0 -13.0 -12.0 -11.0 -10.0 -9.0
power
(dBm)
BER
DUT+0km
DUT+1km
DUT+2km
DUT+3km

20 Celestica | Regional Optoelectronics Laboratory
BER
NO DUT: No Fiber, 1km, 2km, and 3km
1.E-13
1.E-12
1.E-11
1.E-10
1.E-09
1.E-08
1.E-07
1.E-06
1.E-05
1.E-04
1.E-03
1.E-02
1.E-01
1.E+00
-17.0 -16.0 -15.0 -14.0 -13.0 -12.0 -11.0 -10.0 -9.0
power
(dBm)
BER
No Fiber
1km
2km
3km
Setup#3
Only fiber No DUT
BER data were increased when a fiber length was increased from 0 km up to 3 km.
BERT data for optical link with
different fiber length

21 Celestica | Regional Optoelectronics Laboratory
Setup#4
Setup4-A: Group1 Sample1&2 and
Group2 Sample 1&2
Setup4-B: Group3 Sample1&2 and
Group4 Sample 1&2
Setup4-C: Group5 Sample1&2 and
Group6 Sample 1&2
Setup#5
4 DUT connected in serial, with 1 and 2km
fibers.
No difference of BER between each group
BER
Setup 4 : 4xDUT in serial
1.E-11
1.E-10
1.E-09
1.E-08
1.E-07
1.E-06
1.E-05
1.E-04
1.E-03
1.E-02
1.E-01
1.E+00
-17.0 -16.0 -15.0 -14.0 -13.0 -12.0 -11.0 -10.0 -9.0
power
(dBm)
BER
Setup4-A
Setup4-B
Setup4-C
BER
Setup 5 : 4xDUT with 1 and 2 km Fiiber
1.E-11
1.E-10
1.E-09
1.E-08
1.E-07
1.E-06
1.E-05
1.E-04
1.E-03
1.E-02
1.E-01
1.E+00
-17.0 -16.0 -15.0 -14.0 -13.0 -12.0 -11.0 -10.0 -9.0
power
(dBm)
BER
Setup5-A
Setup5-B
Setup5-C
BERT data for optical link with
different fiber length
There is no difference of BER curves for the links with different connector groups
but with the same fiber length
22 Celestica | Regional Optoelectronics Laboratory
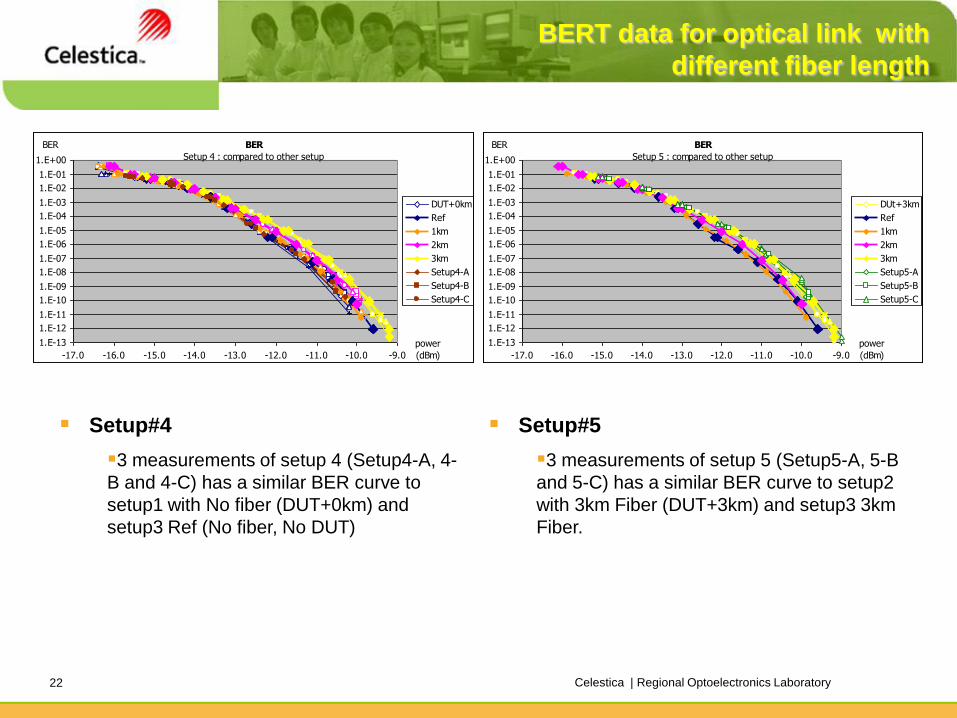
Setup#4
3 measurements of setup 4 (Setup4-A, 4-
B and 4-C) has a similar BER curve to
setup1 with No fiber (DUT+0km) and
setup3 Ref (No fiber, No DUT)
Setup#5
3 measurements of setup 5 (Setup5-A, 5-B
and 5-C) has a similar BER curve to setup2
with 3km Fiber (DUT+3km) and setup3 3km
Fiber.
BER
Setup 4 : compared to other setup
1.E-13
1.E-12
1.E-11
1.E-10
1.E-09
1.E-08
1.E-07
1.E-06
1.E-05
1.E-04
1.E-03
1.E-02
1.E-01
1.E+00
-17.0 -16.0 -15.0 -14.0 -13.0 -12.0 -11.0 -10.0 -9.0
power
(dBm)
BER
DUT+0km
Ref
1km
2km
3km
Setup4-A
Setup4-B
Setup4-C
BER
Setup 5 : compared to other setup
1.E-13
1.E-12
1.E-11
1.E-10
1.E-09
1.E-08
1.E-07
1.E-06
1.E-05
1.E-04
1.E-03
1.E-02
1.E-01
1.E+00
-17.0 -16.0 -15.0 -14.0 -13.0 -12.0 -11.0 -10.0 -9.0
power
(dBm)
BER
DUt+3km
Ref
1km
2km
3km
Setup5-A
Setup5-B
Setup5-C
BERT data for optical link with
different fiber length

23 Celestica | Regional Optoelectronics Laboratory
Eye Diagram
Setup1: DUT to DUT
Group 1 Group 2 Group 3
Group 4 Group 5 Group 6
There is no significant change in Eye diagram for the links with different connector
assembly.

24 Celestica | Regional Optoelectronics Laboratory
Eye Diagram
Setup2: DUT-2km-DUT
Group 3 Group 4 Group 6
Group 3 Group 4 Group 6
With 2km Fiber in the middle between 2 DUT of the same group.
There is No significant change between each group, example group 3 and group 6.

25 Celestica | Regional Optoelectronics Laboratory
Eye Diagram
Setup3: only Fiber, No DUT
No Fiber 1km
2km 3km
The increasing of the fiber length from 0km to 3km was resulted in eye degradation

26 Celestica | Regional Optoelectronics Laboratory
Eye Diagram
Setup4: 4xDUT
Group 1&2 Group 3&4 Group 5&6
Group 1&2 Group 3&4 Group 5&6
No significant change on eye for the links with different connectors Groups, eye is
still clean.

27 Celestica | Regional Optoelectronics Laboratory
Eye Diagram
Setup5: DUT+1km+DUT+DUT+2km+DUT
Group 1&2 Group 3&4 Group 5&6
Group 1&2 Group 3&4 Group 5&6
There is 1km and 2km fiber between DUT for this setup, the total fiber is 3km.
Eye is degrading, but no significant difference between the optical links with different
connector groups.

28 Celestica | Regional Optoelectronics Laboratory
Fiber length effects to Jitter
Q-Factor
0.0
10.0
20.0
30.0
40.0
50.0
60.0
70.0
80.0
1 2 3 4 5 6 Group
Q
DUT-DUT
DUT+1km
DUT+2km
DUT+3km
RJ
3.5E-133.6E-13
3.7E-133.8E-133.9E-134.0E-13
4.1E-134.2E-134.3E-134.4E-13
4.5E-134.6E-13
1 2 3 4 5 6 Group
sec
DUT-DUT
DUT+1km
DUT+2km
DUT+3km
There is no significant difference in Q-factor and Random Jitter (RJ) for the
links with different connector Groups ( Test setup 1 &2).
The insertion of 3km fiber resulted into decrease of Q-factor from ~60dB down
to ~ 30dB. RJ increased from ~0.39 ps (no fiber) to ~0.43ps for a link with 3km
fiber

29 Celestica | Regional Optoelectronics Laboratory
Other Jitter
Total Jitter (TJ)
6.0E-12
8.0E-12
1.0E-11
1.2E-11
1.4E-11
1.6E-11
1.8E-11
1 2 3 4 5 6 Group
sec
DUT-DUT
DUT+1km
DUT+2km
DUT+3km
Periodic Jitter (PJ)
5.0E-13
1.0E-12
1.5E-12
2.0E-12
2.5E-12
3.0E-12
3.5E-12
1 2 3 4 5 6 Group
sec
DUT-DUT
DUT+1km
DUT+2km
DUT+3km
Periodic Jitter (PJrms)
0.0E+00
2.0E-13
4.0E-13
6.0E-13
8.0E-13
1.0E-12
1.2E-12
1 2 3 4 5 6 Group
sec
DUT-DUT
DUT+1km
DUT+2km
DUT+3km
Deterministic Jitter (DJ)
0.0E+00
2.0E-12
4.0E-12
6.0E-12
8.0E-12
1.0E-11
1.2E-11
1 2 3 4 5 6 Group
sec
DUT-DUT
DUT+1km
DUT+2km
DUT+3km
No significant impact of connectors from different groups on
Jitter ( TJ, DJ) was observed
High variability of Periodic Jitter has been observed

30 Celestica | Regional Optoelectronics Laboratory
Setups 4 & 5: Q-Factor and Jitter
Q-Factor
0.00
10.00
20.00
30.00
40.00
50.00
60.00
70.00
80.00
1-2 3-4 5-6 Group
Q
Setup 4
Setup 5
RJ
3.90E-13
4.00E-13
4.10E-13
4.20E-13
4.30E-13
4.40E-13
4.50E-13
4.60E-13
4.70E-13
4.80E-13
1-2 3-4 5-6 Group
sec
Setup 4
Setup 5
•Q-factor for the links with 4 DUTs ( test setup 4) was ~60dB, RJ~0.42ps. No
significant impact of connector Group on Q-factor and RJ performance was found.
•Q-factor was reduced down to 30dB and RJ increased up to ~0.47ps when 3km fiber
was added to the link ( test setup #5)

31 Celestica | Regional Optoelectronics Laboratory
Conclusions
The impact of multiple connectors with different connector quality
on optical performance of 40G NRZ link was investigated ( BER,
Eye diagram, Jitter, Q-factor)
It was no significant change in BER performance, Eye diagram,
Q-factor, Jitter (Total Jitter, Random Jitter and Deterministic
Jitter) for the links with different connector assemblies but with
the same fiber length of optical link.
The insertion of fiber ( up to 3km) resulted in degradation of BER
curve, Eye diagram, Q-factor and Random Jitter.
The 40G NRZ link with multiple cables assemblies (2-4
assemblies) and a fiber ( up to 3 km) fiber demonstrated
significant tolerance to polishing scratches ( no multipath
interference was observed)
32 Celestica | Regional Optoelectronics Laboratory
Conclusions & Next steps
No significant difference in performance of 40G NRZ link with
different connector types ( SC/UPC, SC/APC and LC/UPC) was
identified.
Next Steps:
Investigate the impact of contaminated connectors on 40G NRZ
link optical performance
Investigate the impact of CD, PMD and OSNR on BER, Eye
diagram, Jitter and Q-factor of 40G NRZ link with multiple
experimental connectors
Investigate the impact of scratched/contaminated connectors on
40G DP-QPSK performance ( BER performance)

33 Celestica | Regional Optoelectronics Laboratory
Thank you