IDP review 2013 Draft 1 - matjhabeng.fs.gov.za
236
_________________________________________ IDP REVIEW (INTEGRATED DEVELOPMENT PLAN) 2013 – 2014 _________________________________________ MATJHABENG LOCAL MUNICIPALITY
Transcript of IDP review 2013 Draft 1 - matjhabeng.fs.gov.za

_________________________________________
IDP REVIEW (INTEGRATED DEVELOPMENT PLAN)
2013 – 2014
_________________________________________
MATJHABENG LOCAL MUNICIPALITY

1
TABLE OF CONTENTS
Chapter
Details
Chapter 1 Introduction
Chapter 2 Institutional Analysis
Chapter 3 Developmental Strategies
Chapter 4 Institutional Overview and Organizational Structure
Chapter 5 Financial Plan
Chapter 6 Capital Investment Framework
Chapter 7 Implementation
Chapter 8 High Level Spatial Development Framework
Chapter 9
Framework for the Performance Management System
Stakeholder Inputs

2
CHAPTER ONE (1) INTRODUCTION Background and overview
Integrated Development Planning is a process that has become central to local government in driving processes
to ensure delivery to residents of a municipality. Integrated Development Planning has been developed as a
consolidated municipal-wide planning process that provides a framework for the planning of future development
in a municipality.
It ensures horizontal and vertical coordination and integration across the three spheres of government: national,
provincial and local. In addition, Integrated Development Planning drives community participation in local
planning processes.
The Integrated Development Planning process is therefore critical to the success of every South African
municipality’s endeavors to bring about responsive, developmental local government and poverty alleviation.
The focus of this five-year IDP is within a context of a seamless, integrated strategic planning process. The
municipality through this IDP will develop a set of long-term goals and five-year objectives that will form the basis
of the annual business planning and budgeting carried out by the different departments on an ongoing basis.
The five-year IDP will also be further molded by inputs from communities and civil society, as well as direction
from the new political leadership. A five-year IDP supports a single, integrated planning process, with clear
demarcation between long-term, medium-term and short-term planning. Parallel to the medium-term planning,
the Free State province’s Growth and Development Strategy outlines long-term perspectives based on a long-
term vision for the Province and a wide-ranging developmental paradigm.
The five year IDP should therefore be understood as an interpretation of strategy and political priorities into a
detailed Mayoral plan that is to become the basis for budget choices and actual outcomes for residents. Short-
term business plans, in this context, will be seen as implementation tools.
The main objective of the IDP is therefore to ensure alignment between the Free State GDS, the District GDS,
Mayoral priorities, and the departmental strategic plans. Executed well, this will ensure that no strategy
implementation plan falls outside of the IDP. The IDP content will inform other planning processes and especially
strategic planning and the municipality’s goals that represent a “results framework” to monitor progress, with
individual and organisational performance measured against long-term, five-year and annual municipality
outcomes rather than individual achievements.
Over the last few years there have been changes in national and provincial policy that reshape the strategic
environment. For example, there is now a commitment to ensuring harmony and alignment between the three
spheres of government.

3
LEGISLATIVE CONTEXT
The Constitution of the Republic of South Africa, 1996 stipulates that the local sphere of government consists of
municipalities which were established for the whole of the territory of South Africa - the so-called wall-to-wall
municipalities.
a) The objectives of local government are set out in Section 152 of the Constitution. They are -;
b) to provide democratic and accountable government for local communities;
c) to ensure the provision of services to communities in a sustainable manner;
d) to promote social and economic development;
e) to promote a safe and healthy environment; and
To encourage the involvement of communities and community organisations in the matters of local government.
The Constitution commits government to take reasonable measures, within its available resources, to ensure that
all South Africans have access to adequate housing, health care, education, food, water and social security.
In order to realise the above, the Local Government: Municipal Systems Act, 2000 (MSA) was enacted. Chapter
5 of the MSA states that a municipality must undertake developmentally oriented planning, in the form of
integrated development planning, to ensure that it achieves the objects of local government as set out in the
Constitution. It must further give effect to its developmental duties as required by Section 153 of the Constitution.
According to Section 25 of the MSA each municipal council must, after the start of its elected term, adopt a
single, inclusive and strategic plan (Integrated Development Plan) (IDP) for the development of the municipality
which links, integrates and co-ordinates plans and takes into account proposals for the development of the
municipality and which aligns the resources and capacity of the municipality with the implementation of the said
plan. The IDP should form the policy framework and general basis on which annual budgets be based and should
be compatible with national and provincial development plans and planning requirements.
In terms of the MSA, the Municipality is required to formulate an IDP made up of the following components:
A vision of the long-term development of the Municipality;
An assessment of the existing level of development in the Municipality which must include an
identification of the need for basic municipal services;
The Municipality’s development priorities and objectives for its elected term;
The Municipality’s development strategies which must be aligned with any national or provincial
sectoral plans and planning requirements;

4
A spatial development framework which must include the provision of basic guidelines for a land use
management system;
The Municipality’s operational strategies;
A disaster management plan;
A financial plan, which must include a budget projection for at least the next three years; and Key
performance indicators and performance targets.
The Municipal Planning and Performance Management Regulations (2001) set out the following further
requirements for an IDP:
An institutional framework for implementation of the IDP and to address the municipality’s internal
transformation;
Investment initiatives should be clarified;
Development initiatives including infrastructure, physical, social and institutional development and
All known projects, plans and programmes to be implemented within the municipality by any organ of
state.
In addition, the Municipal Finance Management Act (MFMA) (2003) provides for
Closer alignment between the Annual Budget and the compilation of the IDP, this can be understood as a
response to the critique that IDP formulation took place in isolation from financial planning and IDPs were rarely
implemented in full as a result. Specifically, Section 21(1) of the MFMA requires that the Municipality coordinates
the process of preparing the Annual Budget and the revised IDP to ensure that both the budget and IDP are
mutually consistent. Key to ensuring the co-ordination of the IDP and Annual Budget is the development of the
Service Delivery and Budget Implementation Plan (SDBIP).
The SDBIP is a detailed plan approved by the Executive Mayor of the Municipality for the implementation of
service delivery and the Annual Budget. The SDBIP should include monthly revenue and expenditure projections,
quarterly service delivery targets and performance indicators. The MSA states that key performance indicators
must be part of the IDP.
Lastly, the Municipal Systems Act says clearly that the IDP must include, “A vision for the long-term development
of the municipality”. It must also include, “The development strategies which must be aligned with any national or
provincial sectoral plans and planning requirements.
INTER-GOVERNMENTAL PLANNING
Section 41(1) of the Constitution contains the principles of co-operative government and inter-governmental
relations. Accordingly Section 41(1) determines that:
1. All spheres of government and all organs of state within each sphere must -
a) preserve the peace, national unity and the indivisibility of the Republic;

5
b) secure the well-being of the people of the Republic
c) provide effective, transparent, accountable and coherent government for the Republic as a whole;
d) be loyal to the Constitution, the Republic and its people;
e) respect the constitutional status, institutions, powers and functions of government in the other spheres;
f) not assume any power or function except those conferred on them in terms of the Constitution;
g) exercise their powers and perform their functions in a manner that does not encroach on the
geographical, functional or institutional integrity of government in another sphere; and
h) co-operate with one another in mutual trust and good faith by –
I. fostering friendly relations;
II. ii. assisting and supporting one another;
III. iii. informing one another of, and consulting one another on, matters of common interest;
IV. iv. coordinating their actions and legislation with one another;
V. v. adhering to agreed procedures; and
VI. vi. Avoiding legal proceedings against one another
Inter-governmental relations in our context mean the relationships between national, provincial and local
government. The Constitution states that the three spheres of government are distinctive, inter-dependent and
inter-related. They are autonomous, but exist in a unitary South Africa and have to cooperate on decision-making
and must co-ordinate budgets, policies and activities, particularly for those functions that cut across the spheres.
Cooperative governance means that national, provincial and local government should work together to provide
citizens with a comprehensive package of services. They have to assist and support each other, share
information and coordinate their efforts. Implementation of policies and government programmes particularly
require close cooperation between the three spheres of government.
A number of policies, strategies and development indicators have been developed in line with the prescriptions of
legislation to ensure that all government activities are aimed at meeting the developmental needs expressed at
the local government level.
This section outline the national and provincial policy directives, sector plans and legislation that set the strategic
direction and with which local government must align to ensure that government spending is aligned to the more
pressing needs of communities and those that make the economy to grow.
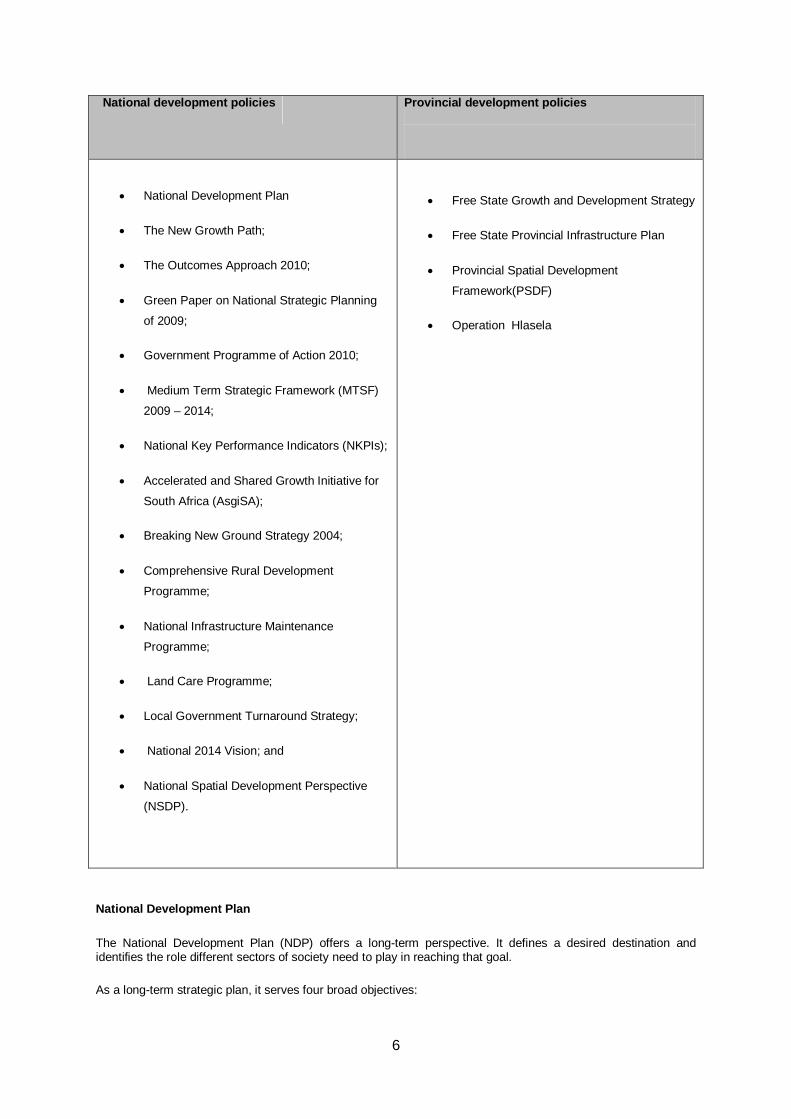
National and provincial development principles and objectives or outcomes are derived amongst others from:
6
National development policies
Provincial development policies
National Development Plan
The New Growth Path;
The Outcomes Approach 2010;
Green Paper on National Strategic Planning
of 2009;
Government Programme of Action 2010;
Medium Term Strategic Framework (MTSF)
2009 – 2014;
National Key Performance Indicators (NKPIs);
Accelerated and Shared Growth Initiative for
South Africa (AsgiSA);
Breaking New Ground Strategy 2004;
Comprehensive Rural Development
Programme;
National Infrastructure Maintenance
Programme;
Land Care Programme;
Local Government Turnaround Strategy;
National 2014 Vision; and
National Spatial Development Perspective
(NSDP).
Free State Growth and Development Strategy
Free State Provincial Infrastructure Plan
Provincial Spatial Development
Framework(PSDF)
Operation Hlasela
National Development Plan
The National Development Plan (NDP) offers a long-term perspective. It defines a desired destination and identifies the role different sectors of society need to play in reaching that goal.
As a long-term strategic plan, it serves four broad objectives:

7
1. Providing overarching goals for what we want to achieve by 2030. 2. Building consensus on the key obstacles to us achieving these goals and what needs to be done to
overcome those obstacles. 3. Providing a shared long-term strategic framework within which more detailed planning can take place in
order to advance the long-term goals set out in the NDP. 4. Creating a basis for making choices about how best to use limited resources.
The Plan aims to ensure that all South Africans attain a decent standard of living through the elimination of poverty and reduction of inequality. The core elements of a decent standard of living identified in the Plan are:
Housing, water, electricity and sanitation Safe and reliable public transport Quality education and skills development Safety and security Quality health care Social protection Employment Recreation and leisure Clean environment Adequate nutrition
The NDP has been approved and adopted by government and has received strong endorsement from the broader society. The focus now shifts to how the NDP will be implemented.
National Development Plan with Local Government Context
The Plan highlights the need to strengthen the ability of local government to fulfil its developmental role. Municipal Integrated Development Plans (IDPs) need to be used more strategically to focus attention on critical priorities in the NDP that relate to the mandate of local government such as spatial planning, infrastructure and basic services.
Like provincial planning processes, municipal IDPs should be used to focus on aspects of the NDP that fit within a municipality’s core responsibilities. This would allow the IDP process to become more manageable and the participation process more meaningful, thus helping to narrow the gap between the aspirations contained in these documents and what can actually be achieved.
To do this effectively, the IDP process needs to be led by municipal staff, not outsourced to consultants.
As for provinces, there are also many areas where municipalities could start implementation immediately by engaging with aspects of the Plan that speak to their core competencies and identifying how they can action proposals for improving implementation.
LOCAL GOVERNMENT TURNAROUND STRATEGY
There has been an extended focus on local government performance since the 2009 national government
elections. In 2009, the Department of Cooperative Government and Traditional Affairs (COGTA) undertook a
nationwide assessment of the state of local government. The concluding State of Local Government report
identified key priority areas to focus on in order to ensure that government restores the confidence of its citizenry
in municipalities. These include:
Huge service delivery and backlog challenges, e.g. housing, water and sanitation;
Poor communication and accountability relationships with communities;
Problems with the political administrative interface;
Corruption and fraud;

8
Poor financial management, e.g. negative audit opinions;
Number of (violent) service delivery protests;
Weak civil society formations;
Intra and inter-political party issues negatively affecting governance and delivery; and
Insufficient municipal capacity due to lack of scarce skills areas.
The Local Government Turnaround Strategy (LGTAS), approved by Cabinet in December 2009, further identifies
steps to be taken by each sphere of government in ensuring that municipalities meet the basic service needs of
communities. These include:
Building clean, effective, efficient responsive and accountable local government;
Improving performance and professionalism in municipalities;
Improving national and provincial policy, oversight and support; and
Strengthening partnerships between communities, civil society and local government.
Provincial EXCO approved implementation of the LGTAS in February 2010, following which the Municipality
developed its own Municipal Turnaround Strategy (MTAS) with assistance from provincial Department of
Corporate Governance. In preparing this MTAS the Municipality focused attention on strategies to address the
key priority areas included in the State of Local Government report. Issues included the following:
Service delivery and backlogs
o Bulk services challenges
o Basic services
o Housing
o Formalisation of informal settlements
o Urban Regeneration
o Marginalised areas
o Conservation and demand side management
o Getting the basics right
Communication and accountability
o Making participation relevant and communication
o Facilitating a responsive administration
Political-administrative interface
Corruption and fraud
Financial management
o Financial strategy
Violent service delivery protests
Civil society formations
Insufficient municipal capacity.
The Municipality has committed itself to make a contribution to re-build and improve the basic requirements for a
functional, responsive, accountable, effective, and efficient developmental local government. Furthermore, the

9
Municipal Turnaround Strategy will help it to restore the confidence of the majority of people in the municipality,
as the primary delivery machine of service delivery
The Municipality focus on improving the basics and prioritising basic service delivery continues in the
programmes various sectors have developed and that are detailed in this IDP. Other aspects of the Municipality
Turnaround Strategy remain relevant and are key strategic focus areas for this term of office. These include the
financial turnaround strategy, stepping up the basics, the focus on urban regeneration and marginalised areas as
well as the attention given to rooting out corruption and fraud in the Municipality.
OUTCOME BASED APPROACHED
To give effect to the above priorities, government has embarked on an outcomes-based approach to ensure the
delivery / implementation these priorities. In line with this approach, government has formulated and agreed on
twelve key Outcomes, based on the ten MTSF priorities. These Outcomes have been expanded into high-level
outputs and activities, which in turn formed the basis of a series of performance agreements between the
President and relevant Ministers.
While all of the Outcomes can to some extent be supported through the work of local government, Outcome 9 is
specifically directed at local government:
1. Improved quality of basic education.
2. A long and healthy life for all South Africans.
3. All people in South Africa are and feel safe.
4. Decent employment through inclusive economic growth.
5. A skilled and capable workforce to support an inclusive growth path.
6. An efficient, competitive and responsive economic infrastructure network.
7. Vibrant, equitable and sustainable rural communities with food security for all.
8. Sustainable human settlements and improved quality of household life.
9. A responsive, accountable, effective and efficient local government system:
Output 1: Implement a differentiated approach to municipal financing, planning and support;
Output 2: Improving access to basic services;
Output 3: Implementation of the Community Work Programme;
Output 4: Actions supportive of the human settlement outcome;
Output 5: Deepen democracy through a refined Ward Committee model;

10
Output 6: Administrative and financial capability; and
Output 7: Single window of coordination.
10. Environmental assets and natural resources that is well protected and continually enhanced.
11. Create a better South Africa and contribute to a better and safer Africa and World.
12. An efficient, effective and development oriented public service and an empowered, fair and inclusive citizenship.
CONCLUSION
As far as possible the intention of this Integrated Development Plan is to link, integrate and co-ordinate
development for the municipality. We have also ensured that the IDP is compatible with national development
plans and planning requirements binding on the municipality in terms of legislation.
However, there are some areas which are very weak due number of reasons inter-alia;
the difficulties experienced in obtaining all necessary inputs from all stakeholders,
the shabby and lack of culture of planning in the municipality
Lack of sector plans to direct long term planning in critical sectors of the municipality
It is important to note that there are intentions to further refine and enhance this IDP in the first review process.

11
CHAPTER TWO (2) SITUATIONAL ANALYSIS
1. Introduction
Matjhabeng Local Municipality (MLM) is a category B Municipality established in terms of section 12 of the
Municipal Structures Act (117 of 1998) the municipality encapsulates an area of 514.4 km2 consisting of Welkom,
Odendaalsrus, Allanridge, Hennenman, Virginia and Ventersburg. The rural areas of MLM cover an area of
approximately 2500 farms.
Matjhabeng Local municipality came in to existence as result of demarcation of municipalities in 2000. This
process saw the end of Local Government Transitional councils and advent of new dispensation of democratic
local government.
2. Demographic Profile and Statistical Data
A comparative analysis of official statistics by Stats SA Census 2001, community Survey 2007 and Census 2011
(See table 1 and 2) demonstrate that MLM is growing in terms of number of households and on population. There
is an important observation increase in number of household came as result of division of families. This
significant increase on the number of households poses service delivery and expansion challenges.
Census 2001 Community
survey 2007
Census 2011
Population 408 170 405 031 406,461
Households 120 289 131 622 123,195
..........TABLE 1 Source: Stats SA
Male Female Total Percentage
Black 180 913 182 467 363 380
Coloured 2 623 2729 5 352
Indian or Asian 766 470 1 236
White 17 613 17 451 35 064
Total 201 915 203 117 406 461 100%
..........TABLE 2 , Source: Stats SA
3. ECONOMY ENVIRONMENT
3.1. EMPLOYMENT STATUS It is important to note that since 2011 (See Table 3) the number of people employed has decreased. The figure
indicated shows that since 2007 we have lost number of jobs in Matjhabeng and this can be attributed to number
of factors, amongst others is the recent Recession( World Economic Meltdown). It should be noted that since the
recent Recession our local employment figure are sitting at 37.00% according to recent census

12
Economic Status Census 2001 Community Survey
2007
Census 2011
Employed 95 685 120 959 99 650
Unemployed 83 181 65 387 58 524
..........TABLE 3 Source: Stats SA
3.2. EMPLOYMENT BY SECTOR In general employment levels (See Table 8) within MLM in all economic sectors has demonstrated both growth
and decline from one sector to the other and in varying degree. Of significant noting is a decline of mining and
quarrying sector and agriculture while other sectors has registered growth.
Industry Type 2007 2011
Agriculture , Hunting , forestry and fishing 5 035 4943
Mining and Quarrying 30 581 30144
Manufacturing 4 133 9556
Electricity , gas and water supply 465 573
Construction 2778 5260
Wholesale and trade, repairs, hotels and restaurants 11795 17813
Transport storage and communication 3262 3581
Financial intermediation, insurance, real estate and business service 4793 7330
Community, social and personal service 14313 17991
..........TABLE 4 Source: Stats SA
3.3. INCOME LEVEL MLM display a positive upward migration of residents from low income levels to middle to middle income levels.
As exhibited in the table 9 below, the number of low income earners between no income and R 1600 has
significantly decrease between 2001 and 2007. Most importantly the number of residents with no income has
reduced by more than 40%. This is indication of the improvement of socio-economic condition of our people.
Income Category 2007 2011
No income 281 833 185 981
R 1- R 400 24 238 61 240
R 401- R 800 32 775 27 750
R 801- R 1 600 27 506 49 116
R 1601-R 3 200 21 553 28 295
R 3 201-R 6 400 11 903 21 015
R 6 401- R 12 800 5 911 11 466
R 12 801- R25 600 1 548 4 530
R 25 601- R 51 200 440 972
R 51 201-R102 400 219 171

13
R 102 401- R 204 800 173 189
R 204801 or more 73 80
..........TABLE 5 Source: Stats SA
3.4. PRODUCTION PROFILE The economy of MLM can be divided into three main categories i.e. primary, secondary and tertiary sectors. The
current statistics shows that the economies of Welkom 53%, Odendaalsrus 38% and Virginia 78% are dominated
by mining, whilst Hennenman is dominated by manufacturing 41%, agriculture 17%, trade 10% and finance 10%.
The total area percentages show a combined figure of 58% dominance by the mining sector.

14
3.6. RELATIVE CONTRIBUTION TO THE ECONOMY The relative contribution of each municipality per sector in the Lejweleputswa District, 2004 (See Table 6)
Mun
icip
ality
Agr
icul
ture
Min
ing
Man
ufac
turin
g
Elec
tric
ity
Con
stru
ctio
n
Trad
e
Tran
spor
t
Fina
nce
Com
mun
ity
Serv
ices
Tokologo 6.3 0.2 1.4 1.5 1.9 0.9 1.0 1.2 2.1
Tswelopele 39.9 0.0 3.7 4.6 1.4 3.7 3.7 4.2 5.2
Nala 25.7 1.3 6.6 8.1 11.8 8.8 11.4 5.2 9.3
MLM 17.6 79.6 84.8 77.1 75.9 81.7 79.2 84.7 76.1
Masilonyana 10.5 18.9 3.5 8.7 9.0 4.8 4.7 4.7 7.3
..........TABLE 6 – (Source: Global Insight, 2004)
In relation to MLM the following must be noted:
About 72% of the district’s economic output is generated in MLM.
The relative contributions from MLM and Masilonyana have decreased since 1996.
The main reason for the decreases in these two municipalities is the overall decline of the mining
industry.
The relative contributions from the other three municipalities have increased considerably between 1996
and 2004.
These increases however do are only because of the declining mining economies in MLM and
Masilonyana.
Regarding the sectoral contributions, the following must be noted:
More than 98% of mining takes place in MLM and Masilonyana
Over 65% of agricultural output in the District comes from Tswelopele and Nala.
Nearly 85% of all manufacturing output is produced in MLM. .
MLM is also the main contributing area to the economic output for the other sectors – ranging between
75% and 85% of the economic output.
3.6.2 ECONOMIC GROWTH

15
Economic growth per annum in Lejweleputswa, 1997 – 2004 – (See Figure 2
(Source: Global Insight, 2004)
The following must be noted:
The economic growth rate in Lejweleputswa is considerably lower than the rate for the Free State
between 1996 and 2004.
There is a strong link between the up and down curves of the Free State and Lejweleputswa.
The rise in economic growth rates in Lejweleputswa between 1999 and 2000 can be attributed to the
weakening of the Rand against the Dollar during that period that had a positive effect on mining output
since the mines earn in dollars.
Overview of the decline in the GDP per capita in Lejweleputswa between 1996 and 2004.
(See Table 8)
..........TABLE 8
In this regard the following must be noted:
In 2004, the GDP per capita in Lejweleputswa was considerably lower than in the Free State.
Overall, the GDP per capita has decreased since 1996 (constant figures).
The image part with relationship ID rId10 was not found in the file.
Municipality 1996 2004
GDP As % of province per capita
GDP As % of province per capita
Tokologo 5575.80 33.523 5346.60 32.941
MLM 18959.03 113.984 13451.43 82.875
Nala 8054.78 48.427 8234.79 50.735
Tswelopele 9771.25 58.746 9681.66 59.649
Masilonyana 18375.41 110.476 12568.82 77.437
Lejweleputswa 15857.02 95.335 11876.18 73.170
Free State 16 633.00 16 231.00
..........FIGURE 2

16
Large-scale decreases have taken place in MLM and Masilonyana with small decreases in Tokologo
and Tswelopele.
The per capita GDP decrease in the LDM was severe. In 1996 it was still at 95% of the provincial figure,
but by 2004 it has dropped to 73.1%.
The decrease was the severest in the local municipalities of MLM and Masilonyana where it declined from 114%
to 83% and from 110% to 77% respectively. The decline of the mining industry was very severe.-(See Figures 3-
5)
Gross geographic product of the Free State, 1998Category Total
(R)bnGovernment 6.7Mining (R)bn 6Community, social, & personal 5.8Manufacturing 4.9Finance 4.8Agriculture 3.8Trade 3.6Transport 3.1Electricity 1.7Construction 1.1Other 2.6Total 44.1
Government15%
Mining (R)bn14%
Community, social, & personal
services13%
Manufacturing11%
Finance11%
Agriculture9%
Trade8%
Transport7%
Other6%
Construction2%Electricity
4%
Source: South African Institute of Race Relations, 2001 ..........FIGURE 3
PROVINCIAL PROFILEECONOMIC - Gross geographic product contributions
0100000020000003000000400000050000006000000700000080000009000000
XRP MOT TMF LEJ NFS
2.46%
25.85%
13.36%
33.03%
25.30%
Source: Stats SA, 1998

17
..........FIGURE 4
TOTAL MATJHABENG AREA GGP DISTRIBUTION, 1997
Mining58%
Manufacturing7%
Construction3%
Electricity1%
Trade12%
Transport3%
Finance7%
Community Services1%
Government6%
Other1% Agriculture
1%
..........FIGURE 5 3.7. AGRICULTURE AND RURAL DEVELOPMENT
Agriculture is a primary economic activity within the municipal region and is ranging from farming, hunting and
fishing. The agricultural sector plays an important role in job creation and self employment of local residents It
covers all activities within MLM involving the utilisation of Agricultural resources, and including at the production,
handling, processing, marketing and retailing of agricultural products, inputs and implements.

18
Main Agricultural products in MLM are the following:-
Crops: Wheat, maize, Sorghum, groundnuts, Sunflower, soy
Livestock :Cattle, sheep, horses
Vegetables: Potatoes, asparagus et.al
H
orticulture: Cherries, other fruit
G
ame Farming
A
gri-tourism
Agricultural equipment, agric-professional
services
Agricultural processing (incl. meat, wheat,
vegetables, etc.)
4. OVERVIEW OF SPATIAL LOCATION OF MATJHABENG LOCAL MUNICIPALITY IN THE FREE
STATE PROVINCE
4.1. Free State Province The Free State Province is one of nine provinces in South Africa and is centrally located in terms of the
geographic distribution of South Africa. The Free State represents 10.6% of the total land area of South Africa
(Census 2001). The province covers an area of 129 464 km2, and had a population of 2.7 million in 2001. The
Free State Province is divided into 5 district municipalities (districts). These are again subdivided into three to five
local municipalities each, for a total of 20 local municipalities.
The five districts are: Fezile Dabi in the north Thabo Mofutsanyane in the east
The image part with relationship ID rId10 was not found in the file.

19
Motheo in the south-east Xhariep in the south Lejweleputswa in the north-west
4.2. Lejweleputswa District Municipality The area of jurisdiction of Lejweleputswa District Municipality is situated in the north western part of the Free State and borders North West Province to the north; Fezile Dabi and Thabo Mofutsanyane Districts to the north east and east; Motheo and Xhariep Districts to the south; and the Northern Cape Province to the west.

20
The Lejweleputswa District is situated north of Mangaung Municipality in the Free State Province. It is accessible from Johannesburg, Cape Town, Klerksdorp and Kimberley (Lejweleputswa District Economic Development Strategy).
Lejweleputswa District comprises the following 5 municipalities and covers an area of 31686 square kilometres:
Masilonyana Local Municipality consisting of the following towns: Theunissen, Brandfort, Winburg, Soutpan and Verkeerdevlei.
Matjhabeng Local Municipality consisting of the following towns: Welkom, Virginia, Odendaalsrus, Hennenman, Ventersburg and Allanridge.
Nala Local Municipality consisting of the following towns: Bothaville and Wesselsbron. Tokologo Local Municipality consisting of the following towns: Boshof, Dealesville and Hertzogville. Tswelopele Local Municipality consisting of the following towns: Bultfontein and Hoopstad.
4.3. Matjhabeng Municipal Area The Matjhabeng municipal area, previously known as the Free State Goldfields, consists of the following: Welkom/Thabong/Bronville Allanridge/Nyakallong Odendaalsrus/Kutlwanong Hennenman/Phomolong Ventersburg/Mmamahabane Virginia/Meloding The area is favourably located in the north-eastern Free State about 250 km south of Johannesburg and 160 km north of Bloemfontein. The nearest harbour is Durban, approximately 565 km from Matjhabeng by road.
The image part with relationship ID rId10 was not found in the file.

21
(Source: Matjhabeng Local Municipality)
1. INFRASTRUCTURE
The post 1994 democratic dispensation ushered in developmental local government tasked with the extension of
quality, affordable and sustainable basic services to all. As illustrated in the above section, the demographics of
Matjhabeng has undergone significant change over the years. Like in all growing SA municipalities, this brings
forth the dual developmental challenge of addressing past apartheid development inequities (backlogs) and
expansion of services to new areas. A strategic delicate balance need to be maintained in order that all residents
can experience appropriate fair and just service delivery.
1.1. Energy
The bulk electrical network is well established around the Matjhabeng area. Eskom serves all mines and all
townships in the municipal area and thus there is sufficient bulk infrastructure available to serve the whole area.
Main challenge however remains a aging electrical infrastructure in particular in towns where the municipality is
provider. However a change in cost recovery and their subsidization policy has made it very expensive to electrify
the rural areas, and these include farms and farming communities who need such basic power support.
Government’s plan is to electrify all areas by the end of 2014 and Matjhabeng is well positioned to meet is plan.
Matjhabeng Local Municipality will develop the Energy Resource Plan to guide and address energy needs and
that will be aligned with the national plan. The Municipality is trying level best to decrease its carbon footprint thus
moving towards green economy.
The image part with relationship ID rId10 was not found in the file.

22
1.2. Household Energy/ Fuel Sources The recent national electricity crises and the resultant effects on South African residents and the economy has
highlighted how highly reliant we are on electricity as a source of energy. Government has committed to
developing measures to promote energy saving, reduce energy costs to the economy, and reduce the negative
impact of energy use on the environment. The National Energy Efficiency Strategy has set target of national
target of 12% for energy saving by 2015.
The tables below illustrate that as a locality we are overly dependant on electricity as a source of energy for
lighting, cooking and heating. In fact, the statistics reflect an increase of electricity as energy source in that the
use electricity for lighting has increased from 84.98 to 8702; for cooking from 60 % to 80% and heating from 54%
to 57%. In part this can be attributed to the fact that with the gradual eradication of electrification backlogs
through the household electrification programme, the number of people in our electricity network has increased.
On the other hand, this display the lack of usage of alternative source of energy to fulfil our energy needs.
1.3. Energy source for cooking
Source Census 2001 Community Survey 2007 % Electricity
69 806 101 399 77.1
Gas 2 687 2 046 1.5
Paraffin
51 081 26 911 20.5
Coal 966 214 0.2 Wood
2 733 752 0.6
Solar
322 64 0.05
Animal dung 864 66 0.05
Total
128 7171 131 453 100%
Energy source for Heating Source Census 2001 Community Survey 2007 % Electricity
89 956 115 486 87.7
Gas 247 272 0.2
Paraffin
13 157 5 509 4.2
Candles
24 943 9 966 7.6
Solar
263 0 0
Other
148 389 0.3
Total
128 714 131 622 100%

23
Energy source for heating Source Census 2001 Community Survey 2007 % Electricity
65 916 83 025 63.1
Gas 1 379 2 193 1.7
Paraffin
41 750 33 629 25.5
Wood 8 535 5 295 4.0 Coal 5 248 3761 2.0 Solar
213 127 0.1
Others 4 989 4 698 3.6 Total
128 718 131 623 100%
1.4. Access to Water Water infrastructure consists mostly of reservoirs (18) and 99 Km of bulk pipelines of Sedibeng Water, 29 pump
stations, 1 water treatment plant and 12 waste water treatment plants. Sedibeng Water is the water service
provider in terms of Water Service Act, and supplies mainly the Goldfields region and the mines with water from
the Vaal River, Bulkfontein near Bothaville and to a lesser extent from the Sand River. Main reservoirs are east of
Allanridge, in Welkom, north and south of Virginia. Pump stations are east of Allanridge and at Virginia where
purification plant exist. Other water infrastructure resources were constructed by the Department of Water Affairs
including dams in Allemanskraal and canals serving the Sand – Vet irrigation scheme.
Matjhabeng Local Municipality is confronted by numerous challenges that relate to the provision this service.
They range from planning, coordination, financing, execution and reporting. The municipality is currently
undergoing a process of developing comprehensive Water Services Development Plan (WSDP) .This important
planning tool will go a long way in providing a comprehensive approach to water and sanitation issues.
The table below illustrate that Matjhabeng has over the years incrementally reduced the level of no access to
water and at the same time expanded household access to both RDP water standard and higher level of water
access (piped tap water inside yard and dwelling).
Over the years the quality of drinking water provided to citizens has improved. This is reflected in our Blue-drop
report as compiled by the Department of Water Affairs (DWA). According to DWA BlueDrop Certification ratings
Matjhabeng scored 79.91% in 2010 assessment.
Census 2001 Community Survey 2007
Piped water inside the dwelling 43 384 79 276
Piped water inside the yard 58 548 40 406 Piped water from access point outside the yard 12 815 9 190 Borehole 2014 1 642 Spring 8 0 Dam/pool 287 103

24
River/stream 105 62 Water vendor 5 977 378 Rain water tank 1287 7 Other 11 557 Total 128 715 131 621 StatsSA
1.5. Sanitation The second generation of democratic local government was mandated to among others to improve levels of
sanitation and eradicate bucket system as form of sanitation. In this regard this mandates was fulfilled. However
challenges were identified, among others were poor project planning, execution and reporting. This has led to a
particular number of households still not able to use proper sanitation thus reverting back to old system.
The other challenge that came with expansion of service has been the capacity of waste water Treatment plants
and pump stations. As indicated above there are 12 treatment plants and all of them require major upgrade and
refurbishment. The backlog amount to R0,5 Billion.
Census 2001 Community Survey 2007 Flush toilet (connected to sewerage system)
72 268
103 172
Flush toilet (with septic tank) 898 1 718 Chemical toilet 568 0 Pit latrine with ventilation (VIP) 1 019 244 Pit latrine without ventilation 13 108 8 922 Bucket latrine 20 746 14 600 None 11 680 2 792 Total 120 287 131 622 StatsSA .
1.6. Waste Management
2. REFUSE REMOVAL A similar positive trend can also be observed with the provision of refuse removal services to our residents. The
number of residents with no basic refuse has significantly reduced and therefore confirming the progressive
reduction of refuse removal service backlog. The number of communal refusal is steadily reducing whilst the
number household weekly refusal removal by MLM has increased significantly.
Census 2001 Community Survey 2007 Removed by local authority/private company at least once a week
92 904
117 284
Removed by local authority/private company less often 1 542 176 Communal refuse dump 4 539 1 528 Own refuse dump 14 561 10 313 No rubbish disposal 6 744 2 204 Other 0 117 Total 120 290 131 622 StatsSA

25
2. ROADS AND TRANSPORTATION The municipality has well established road and transportation infrastructure. The main challenge for over the
years has been maintenance of such infrastructure due to escalating cost due to its age. This has major
implication to the budget of the municipality as whole. Our Municipality consist of the following types of roads:
gravel and surfaced (tar and paved roads). The municipality has a total length of 1618km of roads of which
550km is gravel and 970km is surfaced. Mostly in our Towns roads are surfaced and in townships roads are
gravel but gradually township roads are now being given attention by upgrading from gravel to surfaced road
using internal and external resources (i.e. MIG and Public Works funds).
The public transport system operating in Matjhabeng is privately owned taxis. The rail network that passes
through Hennenman, and Virginia is mainline service linking the Municipality with Gauteng, Kwazulu Natal,
Eastern Cape and the Western Cape. However there is are local railway network mainly servicing mines. The
local railway network remains property of the municipality. Matjhabeng remains the main route of national bus
services, however there are no bus service operating local in Matjhabeng Municipality except mine workers
dedicated transport.
.
3. CEMETERIES
There are 14 cemeteries around Matjhabeng with are responsibility of the Municipality. The municipality provides
graves and proper keeping of the cemeteries. The recent developments have been that this has to be the
responsibility of the district municipality to perform. The high rate of HIV and AIDS in the region is reaching
alarming proportions and needs to be considered in the planning for cemeteries. There must be an alignment
between HIV/AIDS prevalence in the district and the budget for availing land for cemeteries.
4. PUBLIC SAFETY The current level of crime is of concern and is not bound to a specific area or person. There is also an increase in
the number of housebreaking and violence against women and children, who are the most vulnerable, is
unacceptably high, some contributing factors are as follows:
High unemployment rate and migration from rural to urban areas.
Lack of resources within the police service (transport, manpower).
Ineffective functioning of neighbourhood watch organization and community police forums.
Lack of visible policing.
Lack of accessibility to police stations
More facilities such as mobile police stations, available transport and accessible communication systems are
required to improve crime prevention and emergency response.
Crime
It needs to be mentioned that specific statistics for Matjhabeng is not available and therefore statistics for the
Free State Province will be used to track the trend of crime in and around Matjhabeng. The types of crimes
imposing on the safety of the people of the district are as follow:

26
Types of crimes Statistics on %
All theft not specified 19.8
Common assault 15.5
Assault with intent to inflict grievous bodily Harm 11.2
Burglary at residential premises 11.1
Malicious damage to property
5.5
Crimen injuria 4.7
Theft out from vehicles 4.5
Common robbery 3.0
Stock theft 2.9
Robbery with aggravating circumstances 2.8
Attempted murder
2.8
Rape 2.5
Burglary at business premises 2.5
Drug-related crimes 2.5
Shoplifting 2
Theft of motor vehicle of motor cycle 2
Commercial crime 1.5
Driving under the influence of alcohol or drugs 0.7
Murder 0.5

27
CHAPTER THREE (3) DEVELOPMENTAL STRATEGIES
Our Vision By being a benchmark developmental municipality in service delivery excellence.
Mission statement of Matjhabeng Local Municipality By being a united, non racial, non sexist, transparent, responsible municipality.
By providing municipal services in an economic, efficient and effective way.
By promoting a self-reliant community through the promotion of a culture of entrepreneurship.
By creating a conducive environment for growth and development.
Planning for Long term: Vision 2030
Background and Context
Vision 2030 is a Locality’s statement which describes the direction and strategic plan of the Locality.
Thus 2030 vision is a strategic plan of Matjhabeng which sets a new foundation for the entire Locality.
Logically, it is created to map out how the Locality will reach its goals and provides steps on how the
Locality will achieve its stated vision. The 2030 Vision or strategic plan also serves as a future-oriented
systematic and management tool for the entire Locality. The goal of 2030 Vision is to integrate all
aspects of the Locality’s activities into a mutually supportive system. The strategic planning process
explored the essential questions about the purpose and business of the Locality. Typically, the strategic
planning process explored a number of critical questions amongst them: What is our vision as a
Locality? What is our business? What kind if image do we want to portray? What do we want to be
known for? What is the nature and form of the constituents that we serve? What is our philosophy,
values, ethical and social responsibilities? Where do we want to be in 2030?
From the vision statement, the mission statement was derived. It describes the capabilities of the
Locality with regards to the challenges of service delivery which are based on the identified needs of the
inhabitants of the Locality. The mission statement has several strategic objectives and strategic themes
which together form the City’s Strategic Framework.
The mission statement becomes the yardstick through which the Locality could measure its success and
progress. Critical success factors include:

28
Achieving credibility
Maintaining quality service delivery
Finding needed resources
Performing satisfaction research on local inhabitants regarding service delivery and its quality
Creating an image of a listening and caring Municipality
Maintaining effective internal and external communication
Maintaining continuous improvements regarding policy reviews and evaluating progress
Maintaining a learning organization by documenting processes so that others could learn
A financial plan to grow the Locality’s revenue
A plan to deal with downturns should they occur
Maintain systems and administrative policies to enhance capabilities of all employees to do
their jobs effectively
Maintaining interactions to create an innovative Locality
Through continuous interactions, a room has been created to review these critical factors for practicality
and achievability. Consequently, they have been incorporated into the scope of work of various units in
the Locality.
An Overview of Vision 2030 Strategic Framework
Matjhabeng long-term plan consists of vision, strategic goals and strategic objectives. As a package,
they consist of:
City long-term plan which is a long-term strategic perspective of the Locality. It is an analysis of
development trends and city dynamics. Overall, it describes the future of the Locality.
The city value statement which is described as a Locality’s new paradigm for development. It
consists of a set of new principles on how to approach development in the Locality.
City vision is a City’s statement which describes the strategic direction and the strategic plan of the
Locality. It sets a new foundation for the entire Locality. City Strategic Plan consists of a clear set of
long-term goals and strategic interventions through which these goals will be achieved as set out in the
IDP document of the Locality.

29
In addressing the question of how the future City of Matjhabeng should look like, some strategic choices
were made and are organized into 13 strategic sectors, namely:
Economic Development
Human Development
Environment
Safety
Human Settlement
Infrastructure
Spatial Development
Transport
Health
Finance
Governance
Corporate Services
Institutions and institutional development
Vision Values and Development Principals Linked to these strategic sectors is the 2030 Vision of the City which addresses a number of strategic
areas of policy concern. First, the City will be well governed, developmental and pro-poor in its nature
and form. This City will be more responsive to its inhabitants regarding, among others; safe water,
health, air quality, decent and sustainable human settlements. The City will eradicate poverty and create
a poverty-free society through addressing obstacles to rapid social mobility; create decent jobs that will
pay decent incomes; improve and create further equal access to proper income-earning opportunities;
and, will improve social conditions of those living in peri-urban areas.
The City will be productive, balanced and characterized by shared growth. This will be achieved by
efficient and effective utilization of land; focus investments on catalytic projects such as infrastructure to
accelerate shared growth and create a globally competitive economy. The City will endeavour to unlock
fully its economic potential in primary, secondary and tertiary sectors. It will improve industrial and

30
economic competitiveness and sustainability of local businesses and continue to modernize its
administration for improved service delivery. Well connected City; Credible and safe City; Sustainability
and environmental justice; Competent and innovative workforce. The long-term goals have been
translated into long-term strategic interventions. In turn, the latter are bridged into Five-Year objectives
and Five-Year Programs as addressed in the IDP document of the City.
A well connected city means that the city will promote the internal connectivity of the city as well as
connectivity with its neighbors and the rest of the world through advanced transport networks and use
and applications of ICT. This implies that high quality modes of transport will be used in the city. It will
further promote an enabling telecommunication and broadband infrastructure as a critical mode of
communication. More importantly, in order keep the high standard of infrastructure, the city will invest in
quality road construction and maintenance.
A credible and safe city implies that the city will create a conducive environment for economic
development and investment by promoting partnerships with the private sector. More importantly, the
financial sustainability of the city and the achievement of clean audits remain important for the city. The
financial sustainability will be achieved by the applications of well structured, transparent and focused
public investment pattern. This will make the city attractive for people to come and work, live, and enjoy
their leisure time in the city. More importantly, the city will have zero tolerance to crime in general and to
violent crime in particular as well as to corruption and corrupt activities.
The sustainability and environmental justice will be achieved by promoting environmental consciousness
both in theory and in practice through effective management of risks of disasters and pollution. The city
will promote the development of its urban environment in a way that ensures that the poor communities
are protected from urban environmental risks and associated urban disasters.
Competent and innovative workforce is a critical element in the success of the city and its new vision.
Consequently, the city will, together with other relevant stakeholders ensure that proper investments
occur in the higher education and research institutions in ways that will generate knowledge and skills of
the local workforce. More importantly, the city will play a critical role in promoting the integration and
cohesion across the professional circles. Logically, the city will promote the development of knowledge
economy through proactive planning and through research and development (R&D) and its associated
activities. Continuous capacity building and human capital development will be ensured for the
sustainable development of the city. Further, the city will encourage the formation and enhancement of
partnerships for the fight against the HIV/AIDS.
This well governed city will be pro-poor in its focus and will emerge as a leading agricultural, commercial
and industrial based Metropolitan City in the Province of the Free State. In order to achieve this goal, the

31
city will plan and invest for economic development through sustainable use of resources in land,
infrastructure, and service delivery. These focus areas will be crucial in addressing the needs of the
community and in giving direction to those growth trends that can be anticipated and by finding effective
solutions to the immediate challenges that are facing the community.
The City of Matjhabeng will be a city of neighborhoods that will boast of a balanced wealth distribution
system, affordable housing, efficient transportation and health system. It will establish positive
connections between different uses of land in terms of location and mix; encourage economic and
environmental health as well as innovation, education and learning.
The city’s new pathway will be guided by how current experiences are reviewed in terms of key
achievements and challenges as we explore tomorrow’s possibilities. This will enhance the building of
this future city and a business hub that integrates strategic towns closer through transport nodes that will
continue to feed in and out of the Free State Province.
The sub-visions by each sector show that, One, the city will be transformed into a well established
community, with citizens and neighborhoods as well as businesses sharing a sense of one identity and
purpose as inhabitants of the city. Two, the city will be a caring one bent on fulfillment of human needs
and peace, clean air, water, food security, creativity in arts and culture, education and a fair sharing of
limited resources between the current generation and that of our descendants. Three, the city will
promote sharing of environmental and development information with the outside world to ensure the
leveraging of resources and risks for achieving sustainable development. Forth, the city will further
promote a safer city for all its inhabitants with adequate capacity to address urban insecurity from
environmental risks and natural disasters and will root out the culture of crime and replace it with
prevention of crime and corruption. Fifth, in terms of housing, the city is and will be committed to
expanding the low income housing developments and opportunities to ensure dignity and a path to
stable housing for the homeless people. Sixth, the city will be driven by continuous improvement of
shared basic service infrastructure that is driven by advanced technology to ensure a safe, reliable and
efficient public service delivery to all its citizens at affordable rates. Seven, the new city will have its
planning architecture built on a set of seamless principles of integration and coordination of its
infrastructure and services for the purposes of achieving current and future sustainable socio-economic
development. Eight, in terms of its infrastructure and basic services, the city will be driven by continuous
improvement of basic service infrastructure that is driven by advanced technology to ensure a safe,
reliable and efficient public service delivery to all its citizens at affordable rates. Nine, with regards to its
spatial form and urban management, the city’s planning architecture will be built on a set of seamless
principles of integration and coordination of its infrastructure and services for purposes of achieving
current and future sustainable socio-economic development. Ten, its transportation will be safe, reliable,
cordial, high-quality transport service that is affordable to boost quality of life for its citizens by setting up
its benchmarking learning channels from all around best practices and will be dedicated to achieve zero
accidents. Eleven, the city’s health system will ensure access to world standard and high quality health
care services for all its citizens, integrated and comprehensive team care that is patient-centered at

32
affordable rates. Twelve, the city will always seek to consider its operational, financial environmental
and social costs in order to ensure decisions are fair and equitable to ratepayers and sustainable
through development and maintenance of sound financial systems, zero tolerance to wastage and
revenue enhancement. Thirteen, regarding governance, the city will promote transparency and
accountability by those at all levels of leadership through setting measurable sector performance goals
which support the priorities of the City and building partnerships with members of the community to
assure their needs are understood and that the City delivers services they desire in a cost effective
manner. Fourteen, the City will ensure corporate and shared services as the City will always want to
improve the quality of life for all its citizens through sustainable development, provision and
maintenance of effective services and creation of new employment opportunities. Finally, the
institutional services of the City will be run by a community-oriented government whose objective is to
build and sustain vital neighborhoods through innovative partnerships with the private sector to
maximize increased workforce diversity of all City employees and citizens.
The City`s Long-Term Perspective: Vision Strategic Goals and Objectives
The City’s long-term perspective is a package that is made up of:
City long-term plan which is an analysis of development trends and dynamics. This informs us
about what is likely to happen in the future. This is referred to as the long-term strategic
perspective.
The City value statement which is a new paradigm for the City’s development and is composed
of a set of core principles on how to approach development.
A City vision for the City.
A City strategic plan which is a clear set of long-term goals and long-term strategic
interventions through which goals can be reached (these relate directly to a clear set of 5-year
objectives and 5-year IDP programs that are set out clearly in the IDP).
Long Term Goals and Strategic Objectives
The City has identified a number of long-term goals and strategic objectives. These strategic
interventions relate to:
Financial sustainability
Economic development
Infrastructure services
Human Settlements

33
Environment
Safety and Security
Healthcare
Transportation
Governance
Land, spatial form and urban management
Institutional transformation
The strategic interventions outlined in this section have two characteristics. First is the number of long-
term goals. These goals are set to be achieved in the future. It is by striving to reach and achieve all of
these goals in each of the specific areas that the Vision of a future Matjhabeng will be realized. Second,
there are a number of long-term strategic interventions associated with each goal. These goals need to
be achieved as they will contribute to national development and delivery commitments.
a. Financial Sustainability The goal of financial sustainability specifies that the City should be able to finance affordable and
equitable delivery and development. It should continue to maintain financial stability and sustainability
through cautious expenditure, sound financial systems and a range of revenue and funding sources.
The specific objectives of financial sustainability relate to the following:
Sound financial management permitting the fulfillment of the future Metro developmental
objectives
Empowered customers that are enjoying the highest standards of customer care and
responsiveness
A future Metro with a stable and growing revenue streams
Expanding range of capital funding options that are supported by a strong capital finance risk
management
Sustained excellence in financial management
A future Metro that creatively evolves its resourcing and/or expenditure system to ensure
long-term fiscal stability and growth as well as optimal spending to support accelerated and
sustainable development.

34
According to the Centre for Local Government, University of New England, financial sustainability in
local government has been summarised as follows:
A council’s long term financial performance and position is sustainable where:
(i) Continuation of the council’s present spending and funding policies
(ii) Likely development in the council’s revenue-raising capacity and demand for and costs of its
services and infrastructure
(iii) Normal financial risks and financial shocks, altogether are unlikely to necessitate substantial
increases in council rates (or, alternatively, disruptive service cuts).
Key financial indicators Below is a set of key financial indicators for assessing council financial sustainability:
Net financial liabilities as the key indicator of the council’s indebtedness to other sectors of the
economy
Operating surplus or deficit as the key indicator of the intergenerational equity of the funding of
the council’s operations
Net outlays on the renewal or replacement of existing assets as the key indicator of the
intergenerational equity of the funding of the council’s infrastructure renewal or replacement
activities
Net borrowing or lending as the key indicator of the impact of the council’s annual transactions
– both operating and capital – upon the council’s indebtedness to other sectors of the
economy.
Key financial sustainability indicators are founded on the following 6 ingredients:
1. A local council is financially sustainable if its net financial liabilities are at levels at which the
associated interest payments (less interest income) can be met comfortably from a council’s
annual income (i.e. by current ratepayers) without the prospects of rates increases which
ratepayers would find unacceptable (or disruptive service cuts)
2. The net financial liabilities of a specified local authority can be too low where there are:
(a) Associated with current ratepayers being asked to bear an inequitable proportion of the
cost of future service potential or,
(b) Below levels that include more than enough room to absorb unexpected financial risks or
financial shocks
3. Annual operating financial performance of a local council is sustainable if operating deficits will
be avoided over the medium- to long-term, because such deficits inevitably involve services
consumed by current ratepayers being paid for either:
(a) By borrowing and so by future ratepayers or
(b) By deferring funding responsibility for the renewal or replacement of existing assets onto
future ratepayers
4. A local authority’s operating surplus can be too high where it:
(a) Is associated with current ratepayers being asked to bear an inequitable proportion of the
cost of the council’s future service potential or
(b) Is above a level that includes more than enough room to absorb unexpected financial
risks or financial shocks

35
5. The annual capital financial performance of a municipality is sustainable if capital expenditure
on the renewal or replacement of existing assets on average approximates the level of the
council’s annual depreciation expense because any shortfall of such capital expenditure
against depreciation expense would involve future ratepayers being left with an excessive
burden when it comes to replacing or renewing the council’s non-financial assets
6. Finally, net borrowing of the local council can be too low where, over that planning period, it
results in the council’s net financial liabilities as a ratio of non-financial assets falling well below
the targeted ratio.
Pre-conditions to Financial sustainability Best practices to making sustainability work require that the following are pre-conditions must
happen before implementing any adopted sustainability model:
1) Sustainability must be an integral component of the overall strategy
2) Leadership must be committed to sustainability and build additional organisational capacity
3) Sustainability strategies should be supported with management control, performance
measurement and reward systems as appropriate
4) Sustainability strategies should be supported with mission, culture and people as appropriate
5) Managers must integrate sustainability into all strategic and operational decisions. Then,
additional systems and rewards can be introduced for formalise and support.
6) Managing sustainability performance should be viewed not only as risk avoidance and
compliance but also as an opportunity for innovation and competitive advantage.
b. Economic Development Matjhabeng Vision 2030 will develop efficient, accountable, transparent and participatory governance,
establish a competitive business environment characterized by sustained macro-economic
sustainability. It would also promote the development of sufficient and efficient infrastructure to support
sustained economic growth and preserve the environment for sustainable economic development.
The economic development goal of the future Matjhabeng is a diversified economy that is able to meet
local needs in terms of job creations, increased incomes, wealth distribution, and challenges of
inequality. It is an economy that will play an enhanced role as the key economic hub in the Province of
the Free State, and a national economic-growth leader by ensuring sustainable development and
adapting to changes and promoting effective and sustainable shared growth that will benefit all. The
diversification of the local economy will have to rest on a broad base of economic sectors which in their
nature and form are part of the emerging industries and continuously regenerate older industries. This
local economy will further be characterized by strong links to the national, regional, and global economy.
It will be characterized by a robust and growing market for locally produced goods and services. More
importantly, it will be characterized by equitable sharing of the value of gains from economic growth and
geographic spread of both the economic activities and economic benefits. Finally, it will be characterized
by continuous improvements in the general business environment.
In order to build a diversified, competitive and developmental economy in Matjhabeng, a number of
sectors have been assessed for potential focus and investment. Arising from this assessment, tourism
has emerged as a crucial sector for the further growth and development Matjhabeng’s economy.
The following are some key strategies that Matjhabeng can put in place to meet its goals:
Developing the infrastructure of the municipality to make it easier for businesses to operate
(i.e. houses, transport, roads, water and electricity etc). This is mainly addressed in the IDP of

36
the municipality. Whilst it contributes to providing better living conditions it also creates an
environment that promotes economic growth.
As indicated previously, promoting tourism, which currently is one of the biggest growth
industries in South Africa. This includes developing local tourist sites and facilities, improving
security and ensuring that all residents are welcoming of tourists.
The municipalities tender and procurement policies must favour small contractors and
emerging businesses. Where these companies cannot provide the required services, steps
must be taken to get larger companies to enter into joint ventures with smaller partners.
Marketing the municipality, its infrastructure and people to local and international businesses.
This can be combined with service centres that provide assistance and information to
businesses that wants to start operations in the municipality.
i. SMME Development
Entrepreneurship has been acknowledged over and over again in the world as the engine of economic
growth. Without small business development, the economy stagnates, employment declines and
ultimately the general standard of living deteriorates.
SMME development has been recognized as an economic opportunity but also realised that it comes
with key support and implementation challenges.
To tackle this particular challenge, 5 core areas need to be addressed in order to achieve viable and
successful SMME Development:
Entrepreneurs need to be able to access business support services in close to where
they are situated therefore it is spatially located,
Entrepreneurs need to have a tight and reliable community of business support service
providers who can assist them,
Entrepreneurs need to be able to access work opportunities, be it through procurement
opportunities or links with big business,
Entrepreneurs may require assistance to develop their assets and access resources,
and,
Entrepreneurs need to be skilled and human resource development needs to occur. HRD
will occur not only at school level but also amongst the unemployed.
It is believed that once these support mechanisms are in place, small businesses will thrive.
Matjhabeng had identified several major problems for SMMEs is that a proper continuum of service
providers does not exist because:
They are not adequately equipped, managed and resourced
They do not cater for all types of advice leaving many gaps sin the market.
They are sporadic and unevenly spread geographically
They are uncoordinated, erratic and do not communicate with each other effectively.

37
They do not cater effectively with the different language and education levels - from
unsophisticated business to highly sophisticated businesses.
In order to alleviate these ricks Matjhabeng will offer wide-ranging support structures for SMMEs to cater
for the entire spectrum of needs. It will mobilise and harness the various advice and services available
(be it government or private sector) to create a continuum of support.
The range of services required by SMME spans:
Business idea development
Business plan development
Financing (loans and incentives)
Grants and investment recruitment
Technology
Sourcing and procuring inputs
Operational skills
Management skills and HRD
Quality management
Packaging logistics
Export and import processes
Tender application skills
Legal advice
IT advice
Accountable advice
Marketing (domestic and global export)
Client care
Matjhabeng will have to consider direct assistance for this concept through:
Co-funding unique and rare services
Funding training courses provision
Purchasing services for selected individuals
Funding monitoring and evaluation of the quality of services
The concept involves the one-stop-shop idea where SMMEs are able to access a single point
to seek assistance.
The entrepreneur will be guided (hand-held) through his/her business journey ensuring that
optimum success is achieved. This will further be enhanced by providing internet access at
these centre’s.
Matjhabeng will offer intensive training assistance programme to SMMEs, which will be
affordable and relevant.
Matjhabeng will monitor and evaluate these interventions for quality and performance.
With the decline in the mining sector of Matjhabeng, it is imperative to consider other avenues for
effective job creation. SMME development is one of them, and the focus will now be on, tourism. Listed

38
below is the process of SMME development through tourism, especially mine tourism and agricultural
tourism.
ii. Tourism as a Key Economic Sector
According to the World Tourism Organisation, tourism is the world's largest economic
sector generating almost $500 billion per year and providing direct and indirect
employment to some 340 million people. Globally, tourism accounts for roughly 35 %
of exports of services and over 8 % of exports of goods.
Tourism has also earned the accolade of being one of the fastest growing sectors in the
world economy, and is predicted to grow its volume of arrivals to 1,56 billion in 2020.
Driving this exponential growth over the last five decades has been a number of key
trends:
Rising incomes and disposable incomes in the leading tourism-generating markets of North
America, Western Europe and Japan
Increased leisure time available for travel
Economic globalisation, including innovations in transport and information and communication
technologies, which have made travel cheaper and more accessible.
These trends have created important opportunities for many countries, particularly those
in the developing world. For 83% of countries in the world, tourism is one of the top five
sources of foreign exchange. Caribbean countries, for example, derive half their GDP
from tourism. For governments in developing nations, tourism has the added attraction
of being labour intensive with comparatively low barriers to entry for entrepreneurs. It
also has relatively high employment multipliers and can create many jobs in a
comparatively short time.
Outside of the core tourism value chain, the employment multipliers are strong as jobs
are created in supporting industries, such as financial services, construction, cleaning,
security, laundry, arts and crafts, food and beverages, etc.
Tourism also offers the opportunity of bringing development to rural areas, and can allow
for the sustainable utilization of the natural environment. It is also a force in building the
global identity of a country or city (i.e. its brand identity). International travel patterns are
changing. In 1950, 97 per cent of international tourists went to Europe or North America.
By 1999 this had fallen to around 75 per cent. In recent years, domestic and
intra-regional tourism in the developing world has grown rapidly, especially in emerging
economies such as South Africa, Brazil, Thailand, India, Korea, China and Mexico.
Over 80 per cent of all international tourists come from just 20 countries in the North –
17 in Europe plus the USA, Canada and Japan. Five nations (the US, Japan, Germany,
France and the UK) account foralmost half of all tourism spending.
It is estimated that there will be 77.3 million international arrivals to Africa by 2020; this
represents an annual growth rate of 5.5% from 1995 to 2020. Africa’s overall share will
increase to 5% of total by 2020.

39
Following its transition to democracy and entry into the global economy, South Africa is fast becoming
one of the world’s leading new tourism destinations. The development of South Africa as a tourism
destination has mainly been a result of tourism development initiatives that have been undertaken by
government subsequent to the elections in 1994.
The isolationism of old apartheid system has delayed South Africa’s entry onto the world stage in many
areas, including travel and tourism. This limited the benefits that the industry could deliver both
economically and socially. The tourism industry was not regarded as a key component of economic
growth and development prior to 1994. In 1994, at the end of the Apartheid era, the South African
Government announced an ambitious campaign to make tourism one of the country’s key industries in
the creation of new jobs and generation of foreign earnings. The vision was to develop the tourism
industry as a national priority in a sustainable and acceptable manner, in order for it to contribute
significantly to the improvement of the quality of life of all South Africans. Government accepted tourism
as one of its main interventions to reverse a sluggish economy, high unemployment rate, weak domestic
and foreign investment, and to mobilize SMME capacity.
The result is that tourism is now a significant industry in South Africa, employing by various estimates
somewhere between 700,000 and 1,1 million people, directly and indirectly. The industry is served by
approximately 46 international air1ines, 6 domestic airlines, 4 principal vehicle hire companies, 3
principal coach companies, an estimated 13,000 direct contact service enterprises and a multitude of
supply industries to the aforementioned. . In the domestic economy, tourism accounts for over 7.1% of
GDP and 6.9% of total employment.
Tourism therefore has enormous potential to accelerate the growth of Mathabeng’s economy, and to
create local jobs, particularly within the context of a declining mining sector. In this regard, a concerted
focus on two niched tourism sub-sectors are proposed, namely:
Mining Tourism
Agricultural Tourism
These are oulined further below.
(a) Mining Tourism:
Many former mining areas globally, including in the USA, UK and South America have now lost
their industrial function and are now turning to tourism for regional revitalization and community
economic development. The transformation process of these industrial, and in some cases derelict,
mining sites and landscapes into an area of interest for tourists is offers a unique opportunity to
achieve sustainable economic growth and job creation.
Both international and local tourists could be targeted to learn more about Matjhabeng’s mining
history through visiting mine museums (including underground museums), and taking guided mining
tours. Mines that are no longer operational could therefore be leveraged in order to serve as income
generating and job creating assets.
(b) Agri-tourism
Matjhabeng has a strong agricultural base, which consequently provides a powerful tourism asset.
Within the context of poor agricultural commodity prices coupled with rising input costs which are

40
substantially eroding small farm incomes, there is also an increasing international and local demand
for agri-tourism products and tourist activities. More and more city dwellers are seeking refuge away
from dense urban areas during week-ends and holidays.
This provides an opportunity for Matjhabeng to develop agri-tourism as an economic sub-sector. In
general, agri-tourism is the practice of attracting tourists or visitors to an area or areas used
primarily for agricultural purposes. Agri-tourism provides the opportunity for a range of tourist
activities to be developed, including bed and breakfasts, guesthouses, lodges, hiking trails, horse-
back riding trails, etc.
The development of these two tourism sub-sectors will require detailed planning and aligned investment.
iii. Free State Provincial Intervention to support SMME Development – Free State Department of Economic Development, Tourism and Environmental Affairs (DETEA)
In order to support the process of Economic Development DETEA has embarked on a Provincial rollout
showing casing the concept of the Techno-Parks
The term “Technopark” means a designated area developed to accommodate individuals, academics,
corporate organisations and government institutions in an effort to promote synergy in the fields of
research and industrial development, with a common goal of discovering and/ or improving
performances by the industrialists as well as their products. Technoparks are mainly regionally based,
their main thrust being that of optimising the balance of using locally available resources (human,
knowledge and materials) to improve the performance and/ or products being produced by local
companies. Whilst utilising local resources, the Technoparks clientele extends to beyond the borders of
the region and to the whole world.
To achieve all this, the main businesses of the Technoparks are:
1. Business Incubation
This is the support given to individuals and SMMEs by providing space, equipment, start up skills,
finance, tax and marketing strategies, and general mentorship. Additional support such as regulatory
compliance, patent and intellectual property management will also be given. Organisations such as
SEDA, FASA, FDC and CSIR etc will be expected to take advantage of such a setup and reach out to
the young graduates who may want to pursue their studies in the technological field.
2. Business Networking
An opportunity is presented where businesses and researches can complement each other given the
clause proximity and the diversity of the research subjects at the complex. Possible partnerships can be
formed and long term mutual agreements can be reached. Opportunities will also be availed to local
researchers to network with regional and international researchers from research centers and
universities that have partnership with the center.
3. Regional Economic Growth
The Technopark enables the local economy to grow through enhanced innovative culture and improved
technologies. A healthy competition also prevails between companies resulting with improved products
and value for money. Examples are:
3.1 Improved farming techniques and/ or yield

41
Researches can result in better farming methods or applications being applied by the local farmers
resulting in better yields. The better techniques reduce losses whilst better products mean a bigger
demand of the product thus improving on the sales and profits.
3.2 Increased utilisation of by products
Continued research into making the most of any by product can make a breakthrough that can change
lives of many. The usage of bio-fuel is one such example and more can be achieved if opportunities are
availed to the scientists. Free State Innova Technopark will include research centers in the field of
agriculture.
In mining, uranium comes as a by product of gold mining. Increased efforts can discover some minerals
that could otherwise be discarded together with the mine waste.
3.3 Improved treatment or prevention of diseases in crops and livestock
Throughout the world, the farming industry has suffered major setbacks due to outbreaks of some
diseases. Other than the direct loss of livestock or crop, customer confidence will be heavily dented.
Control or prevention of such outbreaks therefore gives the farmers a leverage over their competitors
and assure their customers of healthy products.
Increase sales will follow as everyone will be happy with the products, resulting in an economic boost.
3.4 Improved Mining Techniques
With th dwindling resources, improvements in the mining techniques will allow miners to execute their
business viably and optimally. Introduction of new improvement methods and well as technology will
enable miners to extract precious metal from the ground with easr and more affordably
4. Research Promotion
The grouping of academics, scientists and industry heads coupled with the intervention of Government
makes to Techno-parks an ideal place for the advancement of technology in the country. Most
Universities and colleges do not have the resource and capacity to carry out extensive research,
therefore the introduction of the Tech-park would complement these institutions on this basis.
5. Education and Training
The Techno-parks will offer education and training accros the following areas:
Primary Education
Secondary Education
Tertiary Education
6. The Techno-Park Concept and Matjhabeng
The Free State Province lies in the middle of South Africa, making it an ideal business venture. The
economic corridor of the country passes through the province, hundreds of tonnes of goods are ferried
everyday from KwaZulu Natal and the Western Cape by rail and road.
With a total area 19825 square kilometres, the Free State takes up 10.6% of South Africa’s land area. It
is the third largest in the country. The towns of Welkom and Kroonstad are the second and third largest
towns in the Province. Welkom is predominantly a mining town after the discovery o gold and Kroonstad
an agricultural town.
The area identified for the Techno-park is in the farmlands between the towns of Virginia, Ventersburg
and Hennenman. The area is bordered by the R70 road to the east, R73 to the south and west. A
railway line runs along the S181 from Kroonstad through Hennenman and Virginia to lonk the Province

42
of the Free State and Johannesburg. The area id flat and receives satisfactory rainfall. There is an
approximate population of 500 000 people residing in the town surrounding the proposed Techno-Park.
There is a good supply of electricity and piped water is supplied by Sedibeng Water. The N1 is in close
proximity to the proposed site as well as several airstrips servicing the mines in the area. The identified
land covers an area of 53 square kilometres Other services like, a sewer treatment plant, roads and
other strategic services can be identified, developed or upgraded into the designs of the Techno-Park.
There are also plans to incorporate a Techno-City ion the Techno-Park concept. The idea behind the
Techno-City is to provide full residential accommodation, sports facilities, medical centres and
entertainment areas to people working in the techno-Park.
c. Infrastructure and Basic Services The infrastructure and basic services goals relate to a high and well maintained infrastructure services
throughout the future Metro leading to a better quality of life for all, and making sure that there is
substantive progress made to meeting and providing the basic services, such as:
Water and sanitation
Power
Waste removal
In accordance with national policy commitments and an agreed local definition of appropriate levels of
services, extension of a differentiated package of service that is fit for purpose, affordable, and reliable
to all households. It has to do with eradicating backlogs linked to the supply of water, electricity, waste
removal, and bucket system. It is worth noting that the extension and maintenance of reliable and
competitively priced services will be required to service commercial and institutional customers. The
service delivery will continue to be secured through a well-designed, well-integrated and well maintained
generation, supply, processing, and distribution networks. Leadership in sponsoring and adopting
innovative, yet locally relevant technologies and delivery capabilities will continue to be needed in order
to enable the generation of new service offerings and ongoing efficiency improvements across all
service areas. Finally, a regime of effective service delivery regulation and stakeholder interaction will be
of critical importance.
d. Human Settlement It is envisaged that in a future Metro, all people would be housed and accommodated in integrated and
functional sustainable human settlements. These will be well located, good quality, adequately serviced,
safe and affordable. On a progressive basis and over a long-term, all residents in inadequate housing
will be able to access affordable, safe and decent accommodation. The housing needs at all levels of
the housing ladder will be met through accelerated facilitation and supply as well as effective
management of a diverse range of products for both purchase and rental. A fully functional secondary
housing or property market will be available in all parts of the Metro so that all households can realize
economic value from investing in their residential assets. The quality of existing and future housing stock
will be enhanced and maintained. More importantly, there will be increased livability and sustainability of

43
all residential communities with equitable access to green spaces, social and cultural facilities,
transportation and economic opportunities and adoption of green-housing practices and technologies.
e. Environmental Sustainability An environmentally sustainable future Metro will in its form and nature be able to anticipate, manage,
and reduce the impact of its own built environment and urban processes on the broader envelope of
natural resources. In this regard, environmental sustainability objectives relate to:
Sustainable management of the future Metro’s waste streams through waste avoidance,
reduction, recycling and reduced disposal
Protection of river ecosystems, water conversation, and preservation of the ecological reserve
Biodiversity and environmental heritage protected to enhance ecosystem goods and services
Diversification of the energy sources on which the future Metro will rely and proactive
management of energy demand and,
Reduction in land, air, water, noise, and light pollution
f. Safety and Security The safety and security goals relate to a Metro with a reduced crime rate where life, property and
lifestyle are safe and secure and where a high level of safety and security is maintained. The safety and
security objectives of the future Metro are:
A safe and secure urban environment
A Metro free of fears of crime and violence
Effective regulation of road-traffic in the interests of road safety across the Metro
A proactive and effective emergency response and disaster management capacity.
g. Health Care The future Metro will be a Metro with a high-quality, efficient, accessible and equitable healthcare across
all sectors that has adequate and flexible capacity to meet the changing health challenges of the
population. The objectives of the future healthcare system are:
Systematic improvement in environmental health conditions
Within a broader disaster management response capacity, maintenance of ability to respond
to any and all public health threats
Massive reduction in HIV/AIDS prevalence or incidence rates and reduced impact of HIV/AIDS
on communities and,
All citizens to have access to a comprehensive basket of health services, especially primary
health care.

44
h. Transportation The transportation goals of a future Metro are a Metro with safe and efficient transportation system with
a public transport focus, and a well-developed and well-maintained roads and storm water infrastructure
which is able to connect businesses, people and places in a sustainable and cost effective manner, and
thereby enhance the standard of living and quality of life for all inhabitants as well as the overall
competitiveness and growth of the local economy. Typically, the transportation objectives of a future
Metro have to do with:
A community of road and public transport users who are aware of and committed to a core set
of values
Improved access for residents to employment, education, recreation and market opportunities
through strategic transport infrastructure and operations which are well aligned with the Future
Metro’s Spatial Development Framework
Development and maintenance of a world-class road traffic signaling and storm water
infrastructure network across the future Metro and,
Improved safety, affordability, convenience and comfort on all transport infrastructure and
services.
i. Governance The future Metro will be a citizen-focused Metro that continuously improves its governance. It will have
capabilities to continuously evolve techniques and capacities to govern effectively in order to
dramatically improve its position in the national, regional, and global space economy. It will ensure good
governance and work with other spheres of government, business, civil society and international
partners to meet the emerging development challenges. Consequently, the future Metro will be
evaluated through a number of governance objectives which will act as indicators of its success in this
developmental goal. These are:
Develop strong institutions to support representative and participative local governance
Empowered citizens, well-represented through an effective system of ward representation
thus able to participate actively in the affairs of the municipality through a range of
participatory governance mechanisms
Empowered customers that will be enjoying the highest standards of customer care and
responsiveness
A future Metro that works in active partnership with business, civil society and community
groupings to bring more resources to bear on changing development challenges, and to
ensure knowledgeable stakeholders that are well versed in the functioning of the future Metro
Maintenance of a record of good governance

45
Institutional systems and structures enabling and encouraging continuous innovation,
performance and efficiency improvements
The establishment of the following Municipal owned Entities (MoE):
o Matjhabeng Water
o Matjhabeng Waste
o Matjhabeng Power
o Matjhabeng Property Company
j. Land Spatial Development and Urban Management The future Metro will have a spatial form that embraces the principles of integration, efficiency and
sustainability, and will realize tangible increases in accessibility, amenity, opportunities, and quality of
life for all communities and citizens. Land is one of the four factors of production which is passive and
distinct from other factors. According to the classical view, unlike other factors of production, land is
considered as a scarce resource in a long-term. This means that social and economic goals cannot be
pursued all at the same time as some trade-offs may be needed. As a result, the demand for land
escalates exponentially if the land supply is limited and there are various needs that compete for its
access. A future Metro will be characterized by the following land, spatial development and urban
management objectives:
A future Metro that identifies land as one of the four factors of production which is passive
and distinct from other factors
A future Metro that understands that unlike other factors of production, land is considered as
a scarce resource especially in the long-term
A future Metro that realizes that the demand for land escalates exponentially if the supply is
limited and that there are various needs that compete for its access
A future Metro with an urban form that is efficient, sustainable and accessible
A future Metro with a quality built environment providing for integrated and sustainable
settlements and well designed urban spaces
An appropriate and efficient land use management system that facilitates investment and
continuous regeneration
Effective urban management to maintain appropriate standards of safety, cleanliness and
orderliness across the built environment
An efficient and effective spatial information service that meets the standards of a future
Metro.

46
k. Institutional Transformation The institutional transformation goals of Matjhabeng are viewed in light of improving the organizational
efficiency and effectiveness in terms of meeting the basic needs of the community. The key objectives
that relate to institutional transformation can be viewed in the following categories.
i. Category A This category of objectives relate to the following:
1. responsive, accountable, effective, and efficient Metro that is capacitated to:
a. Deliver TAS and plan a carefully crafted funding plan, core personnel skills and plan
to be a fully compliant entity that is able to meet all its reporting requirements
b. Deliver a Metro Readiness Status
c. Effect the Metro Transformation
ii. Category B 1. Category B transformation objectives are:
a. Monitoring and evaluating all projects and programs to ensure integrated and
sustainable institutional transformation
b. Monitoring and reviewing action plans and evaluating progress on all strategic thrusts
and projects and making recommendations in respect of any amendment or
realignment required from time to time
c. Monitoring and evaluating service delivery as well as strategies for efficient and
equitable service delivery
d. Fostering cooperative governance between various departments with relation to
functions
e. Facilitating and monitoring the strategic planning processes
f. Monitoring the establishment mechanisms, structures, procedures, and processes on
partnerships with the private sector for the promotion of institutional transformation
III. Classification of Interventions For prioritization purposes, the strategic interventions will be categorized in terms of the following project
categories:
Catalytic projects

47
General supporting projects
Investment support projects
Identified need projects
First, a catalytic project is one that provides considerable benefits and has a large multiplier effect
resulting in the transformation of the living environment and growth of the economy. The major
characteristics of a catalytic project include:
a. Require considerable financial injections
b. Has a widespread impact in Matjhabeng and/or outside Matjhabeng, i.e. Not localized
in its impact
c. Affects the way people live, work, recreate or impact on the way businesses operate
and result in increase of their productivity
The institutional building interventions of Matjhabeng are:
Strategy
o Vision 2030
o Metro Readiness
Financial Sustainability
o Revenue Enhancement
o Clean Audit
o Supply Chain
Infrastructure Services
o Funding the Master Plan
o PMU
Transportation
o Transport Nodes
o Improvement Projects

48
Supporting project is a project that optimizes operations of catalytic projects or existing infrastructure
assets and/ or improves their efficiency. In dealing with infrastructure and basic services, the focus is on
water, waste, and energy. In terms of categorizing these interventions, the specific focus should be on
backlogs, maintenance, and new projects. The interventions should also focus on governance and
institutional transformation.
Investment support project is one whose primary goal is to attract investors or tourists to Matjhabng. Its
main characteristics include:
a. Increases investors’ confidence
b. Attracts investors through the provision of quality services and facilities
c. Lowers costs of doing business in Matjhabeng
d. Provides conducive environment for business
The supporting projects will include the following:
a. Economic Infrastructure Interventions
b. Economic Development
i. Shifting from predominantly mining economy to a more diverse economy
Identified need project is a project that is aimed at improving the quality of life of the population and is
entirely driven by increase in population. The project may be aimed at satisfying the basic needs of the
population. These projects form a critical part of Matjhabeng’s Strategic Focus Area and include:
a. Social infrastructure Interventions
b. Human Settlements
c. Safety and Security
d. Healthcare
e. Environmental Infrastructure Interventions
i. Environment
ii. Land, Spatial form and Urban Management

49
Matjhabeng Metro Vision and Values 2030 Statement
“By 2030, Matjhabeng envisions to emerge as a leading agricultural, commercial and industrial based Metropolitan City in the Free State.
To achieve this, we must invest and plan for economic development through sustainable use of resources: land, infrastructure and service capacity towards addressing our community needs and
giving direction to those growth trends we can anticipate and finding effective solutions to our immediate
challenges.
This will be a city of neighbourhoods that boasts of a balanced wealth distribution system, affordable
housing, efficient transportation and health system, establishes positive connections between different
use of land in terms of location and mix, encourages economic and environmental health, innovation
and education.
Our path will remain guided by reviews of today’s experiences in terms of achievements and challenges as we explore tomorrow’s possibilities. A New City and business hub that integrates
strategic towns close to the transport nodes that feed in and out of the Free State”’
Values and Developmental Principles which shaped and defined the above Vision 2030 Statement
1. Well governed city that is pro-poor
2. A City that is productive, balanced & enjoys shared growth
3. Well connected City
4. Credible and safe City
5. A City that ensures sustainability of resources & promotes environmental justice
6. A City with competent and innovative workforce

50
CHAPTER FOUR (4) IINNSSTTIITTUUTTIIOONNAALL OOVVEERRVVIIEEWW AANNDD OORRGGAANNIIZZAATTIIOONNAALL SSTTRRUUCCTTUURREE The institutional analysis and structure of the Matjhabeng Local Municipality are stated below. The structure provides for accountability and transparent governance, in addition to enhancing legislative compliance.
POLITICAL GOVERNANCE
Council
The Council has 72 seats (36 Proportional Representative (PR) Councillors and 36 Ward Councillors). The Speaker is the Chairperson of Council. The party-political and demographic representation of Councilors is reflected in the table below:
POLITICAL PARTY ALLOCATION OF SEATS
GENDER DISTRIBUTION MALE FEMELE
African National Congress 52 35 17 Democratic Alliance 16 10 6 Congress of the People 3 2 1 Freedom Front plus 1 0 1
The Municipality has 203, 594 registered voters, 54, 78% of whom cast their vote in the May 2011 local government elections.
Executive Mayoral System
The Executive Mayor is assisted by a team of nine (10) Chairpersons of Portfolio Committees within an Executive Mayoral Committee system. The Standing Committees are outlined below:
1. Finance 2. Policy, Strategy and Monitoring 3. Corporate Services 4. Local Economic Development 5. Human Settlements 6. Infrastructure 7. Public Safety 8. Community Services 9. Mayoral Special Programme 10. Social Services
Municipal Public Accounts Committee (MPAC)
The Municipality has a functional Public Accounts Committee in place, which fulfils an oversight role in respect of the institution’s Executive and administration. The MPAC consists of members from the ANC, DA and COPE .The Committee is made up as follows:
• African National Congress – 5 members
• Democratic Alliance – 3 members
• Congress of the People – 1 member
OTHER IMPORTANT COUNCIL COMMITTEE

51
Audit Committee
The Municipality has a functional Audit Committee. The Audit Committee is made up of four members and meets quarterly to advise Council on internal control, financial management and compliance issues. The Municipality has an approved Audit Committee Charter, which provides the responsibility and authority to the Audit Committee members to audit the risk management, controls and governance processes, which include the IDP framework, internal controls, financial management controls, and procurement and performance management. The Audit Committee Charter outlines the objectives of the Audit Committee; broad powers of the Audit Committee; authority of the Audit Committee; duties and responsibilities of the Audit Committee; structure and composition of the Audit Committee; remuneration; term of members and requisite skills; and the functioning of the Audit Committee.
The Municipality has an Anti-Fraud and Anti-Corruption Strategy and Plan in place to address fraud and corruption. The Anti-fraud and Anti-Corruption Strategy and Plan will be revised during the 2013/2014 financial year.
ADMINISTRATION
The Municipal Manager is the head of the administration and Accounting Officer, supported by the Chief Financial Officer, and the Executive Directors. The political leadership and the administration complement each other to achieve the objectives of the IDP.
The diagram below reflects the macro structure (administrative) of the institution.

52
MATJHABENG LOCAL MUNICIPALITY
DRAFT PROPOSAL MICRO ORGANISATIONAL STRUCTURE OFFICE OF THE MUNICIPAL MANAGER
OFFICE OF THE MUNICIPAL MANAGER – MUNICIPAL MANAGER –
SECTION 57
OFFICE OF THE EXECUTIVE MAYOR –
EXECUTIVE MAYOR
OFFICE OF THE SPEAKER
SPEAKER
OFFICE OF THE MUNICIPAL MANAGER – MUNICIPAL MANAGER
OFFICE SUPPORT – PERSONAL ASSISTANT –
05/04
DIRECTORATE SPATIAL PLANNING, HUMAN SETTLEMENTS & ECENOMIC
DEVELOPMENT EXECUTIVE DIRECTOR
SECTION 57
DIRECTORATE INFRASTRUCTURE –
EXECUTIVE DIRECTOR INFRASTRUCTURE SERVICES –
SECTION 57
DIRECTORATE COMMUNITY SERVICES –
EXECUTIVE DIRECTOR COMMUNITY SERVICES –
SECTION 57
DIRECTORATE FINANCIAL SERVICES –
CHIEF FINANCIAL OFFICER – SECTION 57
DIRECTORATE CORPORATE SERVICE –
EXECUTIVE DIRECTOR CORPORATE SERVICES –
SECTION 57
DIRECTORATE STRATEGIC SUPPORT SERVICES –
EXECUTIVE DIRECTOR STRATEGIC SUPPORT SERVICES –
SECTION 57
COUNCIL

53
The organisational structure above, which is currently under review, reflects the current status quo. It is imperative that the organisational structure is periodically reviewed through formalised processes, in line with Council policies and legislation. The Systems Act stipulates that the relevant labour legislation should be adhered to during organisational reviews. This implies that trade unions, employees and Councillors should be consulted and involved in the review process. In this regard, it should be noted that a formal agreement in respect of organisational reviews should exists between Council and trade unions to promote and maintain labour peace and prevent strike-related service delivery disruptions. The terms and conditions of this agreement must be respected. Whilst various ad hoc attempts were made and various structures were drafted, it must be noted that the above process and legislative prescripts were not followed. This necessitated the initiation of a new organisational review process, which is currently in progress. The development and review of the organisational structure and staff complement are underpinned by the organisational strategies. The review of the institution’s shared vision, mission and long-term development strategy is currently underway and is expected to be completed by March 2013. The organisational review is running concurrently with the review of the institution’s shared vision, mission and long-term development strategy. Any urgent issues that need to be addressed from an organisational review point of view will follow a formalised process.
The staff complement of the Matjhabeng Local Municipality 2136 of post filled. The total number of funded vacancies as at May 2012 was approximately 3573. Total number of casual employees is 696. And temporary employees (Month-to Month) is 306.
POWERS AND FUNCTIONS Departments are structured in such a way that there is a responsible Executive Director at appointed under section 56 of MSA for each core function. These functions are aligned to meet our strategic and operational mandates. EMPLOYMENT EQUITY PLAN Chapter 3 of the Municipal Systems Act, Act 32 of 2000 requires certain affirmative action measures to achieve employment equity. These are set out in the Employment Equity Plan. Council has committed the Municipality to achieve the employment equity goals and objectives stated in the Employment Equity Plan, not only as required by legislation but also to maximize the benefits of diversity, equal opportunity and fair treatment of employees, for the purpose of maximizing the capacity to serve the community of Matjhabeng. SKILLS DEVELOPMENT PLAN The Skills Development Act of 1998 requires employers to plan and implement learning programmes that will enable employees to acquire skills and qualifications that will enhance their performance and contribute to organization’ s optimum functioning.
Chapter Five (5)

54
FINANCIAL PLAN INTRODUCTION This chapter reflects the three year financial plan for Matjhabeng Local Municipality as per the requirements of
section 26(h) of the Municipal Systems Act 32 of 2000 read with Regulation 2(3) of the Local Government:
Planning and Performance Regulations, 2001.
The Financial Plan will reflect the budget projection for the MTREF, financial resources available for capital
project developments and operational expenditure, a financial strategy that defines sound financial management
and expenditure control, as well as ways and means of increasing revenues and external funding for the
municipality and its development priorities and objectives. The aforementioned plan and strategies will contribute
and ensure the achievement of financial viability.
MEDIUM-TERM REVENUE AND EXPENDITURE FRAMEWORK
The budget is prepared and compiled within the MTREF. MTREF sets out the economic context and assumptions
that inform the compilation of the budget for the next three years. However it is reviewed annually to ensure that
each year’s budget is affordable and sustainable over at least the medium term.
The National Treasury Circular 66 states that municipal revenues and cash flows are expected to remain under
pressure in 2013/14 and so municipalities must adopt a conservative approach when projecting their expected
revenues and cash receipts. Municipalities will have to carefully consider affordability of tariff increases especially
as it relates to domestic consumers while considering the level of services versus the associated cost.
The main challenges experienced during the compilation of the MTREF can be summarised as follows:
The ongoing difficulties in the national and local economy;
Aging and poorly maintained water, roads and electricity infrastructure;
The need to reprioritise projects and expenditure within the existing resource envelope given the cash
flow realities and declining cash position of the municipality;
The increased cost of bulk water and electricity (due to tariff increases from Sedibeng Water and
Eskom), which is placing upward pressure on service tariffs to residents. Continuous high tariff
increases are not sustainable - as there will be point where services will no-longer be affordable;
Wage increases for municipal staff that continue to exceed consumer inflation, as well as the need to fill
critical vacancies;
Affordability of capital projects – original allocations had to be reduced and the operational expenditure
associated with prior year’s capital investments needed to be factored into the budget as part of the
2011/12 MTREF process; and
Availability of affordable capital/borrowing.
Budget Assumptions
The following assumptions and parameters were considered in setting out the MTREF:
CPI inflation of approximately 5.5%
Increase in Sedibeng Water tariffs by 8%

55
Increase in Eskom tariffs by 8% and NERSA 7.5%
Salary increase of approximately 8%
Government grants for the 2013/2014 to 2014/2015 as per the Division of Revenue Act.
The CPI is forecast at 5.6%, 5.4% and 5.4% for the 2013/14 MTREF period. These levels are within the South
African Reserve bank inflation target range of 3% - 6%.
Operating Budget Projections
The 2012/13 multi-year operating budget of the municipality provided for an increase of 5.5% for the 2013/14
financial year. The 2013/14 budget of R1 687 706 368 is based on a collection rate of 72%, which is informed by
past collection trends. The projected revenue recovery of the municipality is based on realistic and sustainable
trends. The proposed income for the 2013/14 financial year is R1 364 011 925 and the provision for bad debts is
R323 694 443.
Table 1 gives an indication of the Operating Budget projections for the period 1 July 2013 to 30 June 2016.
TABLE 1: OPERATING BUDGET 1 JULY 2013 TO 30 JUNE 2016 2013/2014
BUDGET 2014/2015
BUDGET 2015/2016
BUDGET Revenue Per Source (Billed amount) Assessment Rates Water Electricity Sanitation Refuse Removal Grants & Subsidies Other income Interest Income & Bad debt income Total Income as per billing Less: Contribution to reserves (Bad Debts) Total realistically anticipated revenue collected Expenditure Per Category Salaries, wages and allowances General expenses Electricity bulk purchases Water bulk purchases Repairs and maintenance Contribution to capital expenditure Total Expenditure (Surplus)/ Deficit
162,236,334 188,507,087 619,150,771 109,332,496 61,527,541
427,360,000 37,963,214 81,628,924
1,687,706,369 323,694,443
1,364,011,925
524,559,236 148,351,938 281,326,595 231,448,491 158,325,666
20,000,000
1,364,011,925
175,215,241 188,507,087 693,448,864 118,079,096 66,449,744
408,097,000 43,305,745 86,012,612
1,779,115,390 290,053,913
1,489,061,477
577,015,160 160,769,535 300,525,444 249,964,370 178,786,969 22,000,000
1,779,115,390
189,232,460 203,587,654 748,924,773 127,525,424 71,765,724
449,844,000 46,770,205 88,257,083
1,925,907,323 318,380,928
1,607,526,395
632,176,372 173,631,098 324,567,479 269,961,519 193,089,926 23,100,000
1,607,526,395

56
Revenue Framework
The sources of revenue are property rates, service charges (electricity, water, refuse and sanitation), grants and
subsidies, interest and investment income and other revenue such as rental income of halls and hostels. The
total operating revenue increased with 5.5%. The following graph depicts the revenue tariff increases applied for
the 2013/14 MTREF period.
Revenue tariff increases for the 2013/14 MTREF
Rates: The rates revenue increase is 5.5%. This increase is in line with the CPI which is required to achieve an
affordable and balanced rates budget without impending on service delivery.
Water: The water revenue increase is 3%. This increase is below the CPI of 5.5%. The increase is required to
achieve an affordable and balanced water budget. This increase will ensure the maintenance of water
infrastructure and ultimately reduce water losses.
Electricity: Electricity tariffs are linked to the Eskom tariffs for bulk electricity purchases, which are proposed by
NERSA to be 8% for the 2013/14 financial year. To ensure affordability to its clients the municipality increased its
tariff with 7.5% which is below the proposed Eskom increase and the increase is in line with the NERSA guideline
which is between 7.5% and 8%.
Sewerage & Refuse: The tariff increase for sewerage is 5.5% for the 2013/1 financial year. This CPI increase will
afford the municipality the means to ensure that current infrastructure is sufficiently maintained.
2013/14 revenue based on tariff increases Revenue category Budget 2012/13
R Average tariff
increases 2013/14 budgeted
revenue Rates 148 379 657 5.5% 162 236 334 Water 183 016 590 3% 188 507 087
Rates Water Electricity Sewerage Refuse12/13 5.50% 0.00% 11.03% 5.50% 5.50%13/14 5.50% 5.50% 7.50% 5.50% 5.50%14/15 8.00% 0.00% 12.00% 8.00% 8.00%15/16 8.00% 8.00% 8.00% 8.00% 8.00%
0.00%2.00%4.00%6.00%8.00%
10.00%12.00%14.00%
% in
crea
se
Tariff increases

57
Electricity 575 954 206 7.5% 619 150 771 Sewerage 103 632 698 5.5% 109 332 496
Refuse 58 319 944 5.5% 61 527 541 The revenue on other income will be increased with 5.5%. Other income consists of rental income, interest on
investments and market income. The total operating grants (equitable share, finance management, municipal
systems improvement grant) decreased from R434 657 000 to R427 360 000, this is a 1.68% decrease. The
Equitable share allocation is a grant which supplement the municipality’s own revenue for the provision of the
necessary basic level of services to each poor household within their jurisdiction. The annual DORA publishes
the equitable share allocation.
Expenditure Framework Salaries, wages & related staff cost: The salary figure is 37.71% (R524 559 236) of the total expenditure.
However, not all vacancies have been filled. This has an adverse impact on service delivery. If all positions were
to be filled, the salary figure would be closer to 50% of total expenditure. This would clearly be unaffordable to the
municipality. However, there are critical positions that would have to be filled. Provision is made for an 8% salary
increase and then only emergency vacancies are budgeted for. The multi-year Salary and Wage Collective
Agreement for the period 1 July 2012 to 30 June 2015 was taken into account. The agreement provides for a
wage increase based on the average CPI for the period 1 February 2012 until 31 January 2013, plus 1.25% for
the 2013/14 financial year. The municipality however made provision for the unforeseen and provided for an 8%
increase.
Bulk purchases: The supply of bulk services makes 47.53% (R512 775 086) of the total budget. The following
table depicts the projected cost for bulk services. Bulk services suppliers Eskom and Sedibeng will increase their
tariffs with 8% respectively. These increases were incorporated in the projections for bulk services expenditure.
Bulk service 2012/13 Budget 2013/14 Budget 2014/15
budget Water 214 304 158 231 448 491 249 964 370
Electricity 260 487 588 281 326 595 300 525 444 General expenditure: General Expenses relate to operational costs and are therefore inevitable. This makes up
10.67% of total expenditure.
Repairs & maintenance: The municipality must ensure the health of our asset base by increasing spending on
repairs and maintenance. Repairs and Maintenance relates to service backlogs and upgrading of infrastructure
11.38 % of total expenditure has been allocated to repair and maintenance.
Capital Budget Projections
The total Capital Budget Projection for the financial year 2013/2014 is R212 482 000. The Municipal
Infrastructure Grant allocation for the respective financial years are, 2013/2014 R189 907 000; 2014/2015
R156 246 000 and 2015/2013 R118 586 000. The other grant funding consists of allocations for the Expanded
Public Works Grant and the Integrated National Electrification Programme. The projected allocation from the
contribution from Operating budget is R20 000 000 for 2013/14 and R22 000 000 for 2014/15.

58
Table 2 gives an indication of the Capital Budget projections for the period 1 July 2013 to 30 June 2014
TABLE 2: CAPITAL BUDGET 1 JULY 2013 TO 30 JUNE 2014 2012/2013
BUDGET 2013/2014
BUDGET Own Funding Capital Replacement Reserve Total Grant Funding Municipal infrastructure grant Other Grant Funding Total Total funding
35 000 000 35,000,000
200,030,000 11 597 000
211 627 000
246 627 000
20, 000 000 20,000,000
189,907,000 2,575,000
192,482,000
212,482,000 **Source: Division of Revenue Act The total estimated budget of the municipality for the 2013/2014 financial year is R1 900 188 369 of which the operating budget consist of 88.82% and the capital budget of 11.18%. Table 3 gives an indication of the total budget estimates for the period 1 July 2013 to 30 June 2015
TABLE 3: TOTAL MUNICIPAL BUDGET (CAPITAL VERSUS OPERATIONAL) 2013/2014
BUDGET Operating Budget Capital Budget Total Budget
1,687,706,368
212,482,000 1,900,188,36
9 Figure 1 gives an indication of the Operating budget versus the Capital budget for the 2013/2014 financial year.
FIGURE 1: CAPITAL VERSUS OPERATIONAL BUDGET

59
Financial Resources for Capital Projects and Operating Expenditure
Section 18 (1) of the Municipal Finance Management Act 56 of 2003 states that an annual budget may only be
funded from realistically anticipated revenues to be collected; cash-backed accumulated funds from previous
years’ surpluses not committed for other purposes; borrowed funds, but only for the capital budget.
The capital projects are funded from grants and contributions from the operating budget. The main source of
funding are grants such as the Municipal Infrastructure grant. The capital funding consists of 90.59% from grants
and 9.41% of contributions to capital expenditure. The municipality’s capital replacement reserve must reflect the
accumulated provision of internally generated funds designated to replace aging assets.
The operating expenditure is funded form operating income which consist of assessment rates, trading services,
grant income and other income e.g. rental income and fines.
Investments and External Loans
The Matjhabeng Local Municipality had investments totalling R38 789 418 at the end of the 2011/12 financial
year.
The balance as at 30 June 2012 for external loans was R19 275 605.
FINANCIAL STRATEGY
The revenue collection rate of the municipality for the past financial years varied between 55% and 70% which
resulted in a negative cash flow position. The current ratio of the municipality is presently at 0.92:1, which
indicates that the current assets of the municipality are insufficient to cover its current liabilities. A current ratio in
the excess of 2:1 is considered healthy.
89%
11%
CAPITAL VS OPERATING Operating budget Capital budget

60
During the 2011/2012 financial year the municipality received a disclaimer audit opinion. The municipality
developed an audit query action plan to address the issues raised in the audit report and to also ensure that the
issues do not re-occur in the future.
The following strategies have been employed to improve the financial management efficiency and the financial
position of the municipality.
Revenue Raising Strategy
In order for Matjhabeng Local Municipality to improve the quality of the services provided it will have to generate
the required revenue. The municipality’s anticipated revenue was based on a collection rate of 72%. The
municipality aspires to improve their collection rate to 75% - 85%. A revenue strategy has been developed to
ensure the improved collection rate is achieved.
The municipality’s revenue strategy is built around the following key components:
• National Treasury’s guidelines and macroeconomic policy;
• Growth in the municipality and continued economic development;
• Efficient revenue management, which aims to ensure a 75 - 85 per cent annual collection rate for
property rates and other key service charges;
• Electricity tariff increases as approved by the National Electricity Regulator of South Africa (NERSA);
• Achievement of full cost recovery of specific user charges especially in relation to trading services;
• Determining the tariff escalation rate by establishing/calculating the revenue requirement of each
service;
• The municipality’s Property Rates Policy approved in terms of the Municipal Property Rates Act, 2004
(Act 6 of 2004) (MPRA);
• Increase ability to extend new services and recover costs;
• The municipality’s Indigent Policy and rendering of free basic services; and
• Tariff policies of the municipality.
Asset Management Strategy
During the 2011/2012 financial year the municipality received a qualification on assets. An asset management
strategy was identified to address the aforementioned. The strategy will involve the identification and verification
of all assets, capturing of all the assets onto an integrated asset management system, maintenance of the
system and the production of an asset register which is GAMAP/ GRAP compliant.
Financial Management Strategy
The following are more of the significant programmes identified to address the financial management strategy.
Develop and implement budget as per legislative framework
Review finance policies
Review of finance structure
Training and development of finance staff as well as the rest of the municipality
Unqualified audit report

61
Ratio Analysis/ Benchmark
Table 5 details the financial ratios/benchmarks. The information is the actual position for the 2011/2012
financial year.
TABLE 5 – RATIOS/BENCHMARKS FINANCIAL BENCHMARKS BASIS OF
CALCULATION 2010/2011
2011/2012
Liquidity ratio Quick ration Revenue Management Annual debtors collection rate Outstanding debtors to revenue Efficiency Personnel cost to operating expenditure Creditors Management Creditors days
Current assets – Inventories/ Current liabilities Last 12 months receipts/ last 12 months billing Outstanding debtors(net)/ Ann rev(total inc) Personnel costs/ operating expenditure Outstanding creditors/ credit purchases x 365
23% 93% 42% 24% 341
19% 83% 55% 23%
Free Basic Services

62
Chapter Six (6) Capital Investment Framework The Capital Investment Framework (CIF) is a response to ensure that capital budget and related operational funds are structured according to the strategic objectives and related outputs as discussed above. Secondly that it’s funding allocation responds to national and provincial directives within the context of the Municipal developmental realities.
0
500000
1000000
1500000
2000000
2500000
July Aug Sep Oct Nov Dec Jan Feb March April May June
Amou
nt
Month
Monthly Indigent Subsidy for the 2012/2013 financial year
0
5000
10000
15000
20000
25000
July Aug Sep Oct Nov Dec Jan Feb March April May June
Number of registered indigent for the 2012/2013 financial year

63
The Capital Investment Framework (CIF) is the means through which capital projects are identified and prioritised for implementation in the following financial year and medium term period (3 years). The objectives of the CIF are to:
Contribute towards the eradication of service delivery backlogs, especially in poor and marginalised areas by prioritising projects in these locations;
Ensure the improved management of the existing infrastructure;
Improve service delivery through infrastructure and services that are planned, delivered, and managed
in an objective and structured manner;
Direct future public and private investment, by aligning capital budget requirements of departments as defined in the IDP sector plans.
2012/13 Capital Budget The total 2012/13 capital budget of Matjhabeng Local Municipality is R 321, 377,807.The majority of the funding comes from national grants(189,907,000).The municipality contributes R 20,000,000 to the total capital budget. MUNICIPAL INFRASTRUCTURE BUDGET
REVISED MIG IMPLEMENTATION PLAN 2013/2014
189,907,000 156,246,000 118,586,000
189,907,000 156,246,000 118,586,000
MIG Reference Nr Project Description Total Planned Expenditure for 2013/2014
Total Planned Expenditure for 2014/2015
Total Planned Expenditure for 2015/2016
15/4/1/3/1/2 PMU contribution 10,020,000 10,521,000 11,047,050
MIG/FS0037/S/06/07 Kutlwanong:Upgrading of sewerage works phase 2
12,000,000 7,000,000
-
MIG/FS0331/CF(SP)/05/07
Nyakallong / Mmamahabane / Phomolong: New sports and recreation facilities
1,500,000
-
-
MIG/FS0377/STR/10/11 Hennenman: Upgrading and Provision of new fasilities for street traders.
93,344
-
-
MIG/FS0491/S/08/10 Allanridge/Nyakallong: Upgrading of main sewerage pump stations and new outfall sewers (MIS:165350)
850,000
-
-
MIG/FS0532/St/10/11 Mmamahabane Provision of 3.72km stormwater drainage
1,500,000
-
-
MIG/FS0533/St/10/11 Meloding: Provision of 3.5km stormwater drainage
500,000
-
-
MIG/FS0535/St/10/11 Phomolong: Provision of 3.9km stormwater drainage
500,000
-
-

64
MIG/FS0626/R,ST/07/09 Hani Park: Construction of 8.2km Road network and storm water drainage (MIS:159992)
500,000
-
-
MIG/FS0834/R,ST/11/12 Openheimer Park: Roads and Stormwater drainage (Ward12)
650,000
-
-
MIG/FS0838/R,ST/11/13 Thabong T14: Investigate Runoff and Upgrading Existing System
14,500,000 2,000,000
-
MIG/FS0844/C/10/11 Kutlwanong: Creation and Upgrading of Cemeteries
3,000,000
5,000,000
5,400,000
MIG/FS0845/R,ST/10/12 Mmamahabane: Upgrading of Ring Road Phase3
442,972
-
-
MIG/FS0846/R,ST/11/12 Thabong:Road 142 and 295 240,278
-
-
MIG/FS0847/M/10/11 Virginia: Upgrading & Provision of New Facilities for Streets Traders
98,000
-
-
MIG/FS0849/ST/10/12 Kutlwanong: Construction of Stormwater and Pedestrian Bridges for section K2
7,700,000
4,000,000
-
MIG/FS0850/CF/10/11 Meloding:Creation and Upgrading of Cemeteries
3,000,000
5,000,000
5,000,000
MIG/FS0851/CF/10/11 Phomolong: Creation and Upgrading of Cemeteries
3,000,000
5,000,000
6,000,000
MIG/FS0852/M/10/11 Welkom: Upgrading & Provision of New Facilities for Streets Traders
150,000
-
-
MIG/FS0853/C/10/11 Virginia: Creation and Upgrading of Cemeteries
3,000,000
5,000,000
4,000,000
MIG/FS0854/C/10/11 Bronville: Creation and Upgrading of Cemeteries
4,000,000
5,000,000
4,000,000
MIG/FS0893/R,ST/11/13 Thabong: Construction of road 300 and storm water in T14 & T16
18,000,000 10,000,000 1,000,000
MIG/FS0894/S/12/14 Nyakalong:WWTP upgrade 12,000,000 6,000,000
1,000,000
MIG/FS0895/LA/11/12 Welkom:Industrial park SMME zone Fencing/ paving & shelter
7,700,000
5,000,000
7,000,000
MIG/FS0896/S/11/12 Meloding: Upgrade 7 Electric pannels
200,000
-
-
MIG/FS0904/R,ST/12/13 Welkom: Connecting Nkoane Road to Pambili Road
1,000,000
-
-
MIG/FS0906/CF/(TR)12/13
Meloding: Taxi Centre 10,000,000 9,000,000
1,000,000
MIG/FS0907/CF/(TR)12/13
Phomolong: Taxi Centre 7,600,000
10,000,000 1,000,000
MIG/FS0908/R,ST/12/13 Kutlwanong: Provision of roads (2.7 km)
9,600,000
5,000,000
3,000,000
MIG/FS0909/R,ST/12/13 Thabong: provision of roads 3.6 km
14,000,000 8,000,000
1,000,000

65
MIG/FS0910/S/12/13 Mmamahabane: Sewer house connections
100,000
-
-
MIG/FS0911/R,ST/12/13 Phomolong: provision of roads 1.0km
4,000,000
-
-
MIG/FS0927/S/12/13 Whites: septic tank system 50,000
-
-
MIG/FS0924/CF(TR)13/14 Hani Park / Bronville: Public transport facilities including Taxi Ranks
6,800,000
-
-
MIG/FS0923/CF(TR)/13/14
Nyakallong: Public transport facilities including Taxi Ranks
-
4,000,000
200,000
MIG/FS0922/CF(TR)/13/14
Mmamahabane: Public transport facilities including Taxi Ranks
-
6,000,000
500,000
MIG/FS0926/CF/12/13 Upgrade and create new sports and recreation facilities Phase 3 Thabong Stadium, Zuka Baloi Stadium & Kopano indoor Centre
14,500,000 10,750,000 10,750,000
MIG/FS0925/CF/12/13 Upgrade and create new sports and recreation facilities Phase 3 Bronville Stadium
4,000,000
7,450,000
1,000,000
MIG/FS0924/CF/12/14 Upgrade and create new sports and recreation facilities Phase 3 Phomolong
4,000,000
7,525,000
1,000,000
MIG/FS0912/S/12/13 Meloding X10 sewer network (34 stands)
85,000
-
-
MIG/FS0962/W/12/13 Meloding: X10 water network 30,000
-
-
MIG/FS0961/R,ST/13/14 Bronville: 2,56km paved roads
-
8,000,000
4,000,000
MIG/FS0963/W/12/13 Thabong: Losabe storm water canal
3,000,000
-
-
MIG/FS0960/W/13/14 Kutlwanong: Stadion Area Water network
3,000,000
-
-
Thabong T12: Water network PHASE 4 (171 stands)
60,000
-
-
Mmamahabane: Water reticulation for 53 stands
30,000
-
-
Meloding: Sport Centre 2,767,406
6,000,000
6,000,000
Welkom (Thabong) T16: Construction waterborne sanitation for 1300 stands
-
5,000,000
500,000
Thabong T12 PHASE 4: Sewer Network (Jerusalem park)
140,000
-
-
Mmamahabane: new WWTW
-
-
16,000,000
Virginia: WWTP sludge management
-
-
18,000,000
MmamahabaneEstablishment of satilite Fire Station
-
10,188,950
189,907,000 156,246,000 118,586,000

66

67
NEW PROJECTS (MIG)
WARD PROJECT DESCRIPTION
TOTAL PROJECT
COST
MIG BUDGET 2012/2013 2013/2014 2014/2015
SEWER
2, 3, 6, 7, 11
Sewer connections houses to main lines (Latitude)
6,000,000 - - 3,000,00.00 3,000,000.00
4, 5
Meloding: Calabria and stilte 540 sites without sewer system
1,400,000 - - 1,400,000,.00 -
17
Thabong X13 (T16): Construction waterborne sanitation for 1300 stands
6,871,073 - 3,055,541 3,815,532.00 -
25 Thabong T12 Phase 4 Sewer Network (Jerusalem Park)
2,144,460 - 944,460 800,000.00 -
18, 21 Kutlwanong Upgrade K5 & K6 17,000,000 - - 7,000,000.00 10,000,000.00
18 Kutlwanong Stadion Area Sewer network
1,600,000 - 1,100,000 - -
33, 35
Sewer Rising Main 450 dia: Major Pumpstation Theronia WWTP (DWA funded)
- - - -
16, 15, 12, 23
Thabong and Bronville outfall sewer upgrading
35,954,072 - - 15,000,000.00 10,000,000.00
1 Mmamahabane: Sewer house connections
995,231 - - 995,231.40 -
25 Servicing of stands with sewer in Thabong T4
70,000 - - 70,000.00 -
#N/A Thabong sewer 500,000 - - 500,000.00 - 2, 3, 5, 6, 7, 10, 18, 20, 21, 22
Finalization of bucket eradication projects
5,000,000 - - 5,000,000.00 -
WWTP
33 Theronia WWTP upgrade 25,000,00 - - 15,000,000.00 10,000,000.00
23 Thabong WWTP Extension 110,500,000 110,500,000 18,000,000 55,500,000.00 30,000,000.00
1 Mmamahabane nw WWTP 16,000,000 - - 6,000,000.00 10,000,000.00
3 Hennenman WWTP Civil works and aeration
16,900,000 16,900,000 - 10,000,000.00 6,900,000.00
9 Virginia WWTP sludge management 31,998,152 28,066,800 - 8,000,000.00 23,998,152.00
3 Whites: Septic tank system 4,350,139 450,350,139 - 4,350,138.54 -
All Fencing at pumpstations and purification
6,000,000 - - 2,000,000.00 4,000,000.00

68
PUMP STATIONS UPGRADING
5, 9 Meloding Upgrade 7 Electric panels 1,905,458 - 1,205,458 - 366,668.00
3 Phomolong Civil Upgrade (Basil Read and Phom Main)
2,000,000 1,000,000 - 1,000,000.00
WATER
25 Thabong T12 Water network Phase 4 (171 stands)
762,974 - 180,000 - 442,974.00
All
Replace worn-out waterlines (Asbestos and steel) 8km 1st year, 24 km per year thereafter to reduce water loss
12,400,000 - - 2,000,000 10,400,000.00
All Matjhabeng Installation of water meters in phases
12, 00,000 - - 5,000,000 7,000,000.00
All
Replace defective valves and hydrants to reduce water loss and improve service delivery
12,000,000 - - 5,600,000 6,400,000.00
18 Kutlwanong stadion area water network 1,600,000 - 1,100,000 - -
12
Thabong X20 (Hani Park) Extension of network (180 stands)
1,300,000 - - 1,300,000 -
10, 18, 22
Servicing of 500 stands with water connections and meters in Kutlwanong X9, K2, Block 5
1,000,000 - 1,000,000 - -
25
Thabong Construction of water reticulation and installation of erf connection including water meter for 1340 stands
14,021,847 - - - 14,021,847.24
4, 5, 6, 7
Analyze and upgrade of Meloding water pressure is maintained throughout the day
30,000,000 - - 5,000,000 15,000,000
20, 21
Analyze and upgrade of Kutlwanong K6 water network to ensure that minimum water pressure is maintained throughout the day
9,000,000 - - 3,000,000 3,000,000
ROADS
13, 17 Road 300 in T14/2 (integrated with SW) 34,358,634 - 2,100,000 5,000,000 26,623,929.92
27, 28, 30
Connecting Nkoane Road to Pambili Road
8, 000,000 - - 4, 000,000 3, 300,000.00
All Main Roads 15, 000,000 - - 5, 000,000 10, 000,000.00 All Access Roads 15, 000,000 - - 5, 000,000 10, 000,000.00

69

70
Kutlwanong Provision of roads (2.7)
15, 760, 985 15, 760,985 11,000,000 2,760,985 -
Thabong Provision of roads (3.6km) 21,114,000 21,114,000 15,000,000 4,114,000 -
Phomolong provision of roads (1.0km)
5,865,000 5,865,000 3,000,000 1,152,219 -
Nyakallong provision of roads 1.0km
5,865,000 5,865,000 3,000,000 706,258 -
All PMS implementation 30,000,000 - - 5,000,000 25,000,000.00 STORM WATER
19, 36 Nyakallong stormwater system construction
4, 500,000 - - 4, 000, 000 500, 000.00
12
Hani Park storm water system drains to enable construction of roads and prevent flooding of stands
5, 5000,000 - - 5, 000, 000 -
13, 15, 17
Main channel to drain Thabong T16 South to retention area
4, 000, 000 - - 4, 000, 000 -
26, 31 Upgrade Losba channel to a closed pipe system
2, 000, 000 - - 2, 000, 000 -
28 Extend Xaluva channel north of Nkoane Road
1, 000, 000 - - 1, 000, 000 -
11 Extend Bronville X9Channelto Blesbokpan
1, 000, 000 - - - 1, 000, 000.00
24, 34, 31, 10
Construct pedestrian bridges over main stormwater channels to ensure safe crossing thereof Stateway (2), Togo Drive (1), Moshoeshoe railway (1) Kutlwanong (K1 – Geneva)
600, 000 - - 600, 000 -
10, 18, 20, 21, 22
Upgrade main storm water system in Kutlwanong
10, 000, 000 - - - 10, 000, 000.00
19, 36 Upgrade main storm water system in Nyakallong
10, 000, 000 - - - 10, 000, 000.00
3
Phomolong: Construction of new canal from WWTP to spruit
3, 000, 000 - - - 3, 000, 000.00
36 Nyakallong entrance: stormwater upgrade
1, 000, 000 - - - 1, 000,000.00
All Concrete Lining existing canals at 5km per annum
15, 000, 000 - 5,000,000 5,000,000 5,000,000
29 Finalization of Uitsig canal retention dam Stand 8083 Thabong
5, 000, 000 - - 5,000,000 -
16 Formalizing sotrmwater canal at school in T15
500, 000 - - - 500,000.00

71
26, 29
Formalizing stormwater canal in Thulwane str: Thabong
5, 000, 000 - - - 5,000,000.00
16, 25
Formalizing stormwater canal at Phakati near Nkoane road
300, 000 - - - 300, 000.00
CREATING AND UPGRADING OF CEMETRIES
25 Landfill sites, relay stations and wastemanagement
8, 000, 000 - 1, 500,000 1,500,000 5,000,000
36
Nyakallong: Upgrading and Extention of Cemetery
7,681,839 - 1,000,000 - 6,681,839
ELECTRICAL
5, 11 Meloding, Bronville 23 High mast lights 7,203,070 - - 7,203,070 -
SMME / LED PROJECTS
All
Public transport facilities including Taxi Ranks Reginal, Thabong, Bronville, Hani Park, Mmamahabane, Nyakallong
40,000,000.00 35,000,000 - 4,288,732 35,711,268
Meloding Taxi Centre 30,000,000.00 25,000,000 4,000,000 15,822,774 8,677,226
Phomolong Taxi Cent 18,000,000.00 15,000,000 - 15,822,774 1,277,226
32 Upgrading / Rehab Welkom Showgrounds
500,000 - - - 500,000
Commonage Services 1,119,126 546,622 - 2,161,241 -
Historical building upgrade 2,161,241 - - 2,161,241 -
PARKS, SPORT, RECREATION AND HEALTH SYSTEMS
Upgrade & create new sports & recreation facilities Phase 3
4, 000,000 - - 2, 000,000 2, 000,000.00
6 Meloding Sport Centre 12, 000,000 - - 2, 000,000 10,000,000.00
All Paved sidewalks on main roads & near schools
6, 120,000 - - 2, 000,000 4,120,000.00
TOTAL 741,922,302 283,968,546 73,185,459 274,624,196 350,721,130 206,556,933 315,578,752 414,312,548

72
HUMAN SETTLEMENT
36 Odendaalsrus outfall serwer 7,994,212 7,994,212 - -
12
Thabong X18: Infrastructure installation for 300 erven
8,871,583 8,871,583 - -
10
Kutlwanong serwer treatment plant Rehabilitation and upgrade
22,256,059 22,256,059 - -
4
Meloding (Calabria, Stilte): Infrastructure installation for 200 erven
8,800,000 8,800,000 - -
18, 20, 21, 22
Kutlwanong sewer project Phase 1 Cleaning and operationalisation of network
500,019 500,019 - -
18, 20, 21, 22
Kutlwanong sewer project Phase 2: Mirror and camera inspection and remedial actions to ensure functionality of sewer
8,399,000 8,399,000 - -
2 Phomolong School stand (100) 2,000,000 2,000,000 - -
4, 7, 9
Meloding cemetery circle and clinic area, Sewer network for 350 stands
6,000,000 6,000,000 - -
25 Thabong Thandanami (2010) 1500 stands
24,000,000 - 12,000,000 12,000,000
3
Phomolong Water network for new development on Gliding Club area / Ventersvlakte
5,000,000 - - 5,000,000
1 Mmamahabane Development on Groenepunt 96 Farm
5,000,000 - - 5,000,000
25 Water network for Thabong T6 & T12 1200 stands
8,400,000 - 4,200,000 4,200,000
18, 20, 4, 5, 7, 3
Finalization of Hlasela roads in Kutlwanong, Meloding & Phomolong
15,000,000 15,000,000 - -
TOTAL 122,220,874 79,820,874 16,200,000 26,200,000

73

74

75
The image part with relationship ID rId10 was not found in the file.
The image part with relationship ID rId10 was not found in the file.

76
The image part with relationship ID rId10 was not found in the file.
The image part with relationship ID rId10 was not found in the file.

77
The image part with relationship ID rId10 was not found in the file.
The image part with relationship ID rId10 was not found in the file.

78
The image part with relationship ID rId10 was not found in the file.
The image part with relationship ID rId10 was not found in the file.

79
The image part with relationship ID rId10 was not found in the file.
The image part with relationship ID rId10 was not found in the file.

80
CHAPTER SEVEN (7) IMPLEMENTATION
1. Introduction The rationale behind this chapter is to the following:
Our tagerts for the FY 2013/14
Our targerts for the term 2012/16
Project to be implemented
Projects to be implemented by other spheres of government
This chapter presents the IDP implementation framework in line with the following key performance areas;
1. Service delivery and infrastructure development
2. Municipal transformation and organizational development
3. Good governance and public participation
4. Financial Sustainability and Viability
5. Local Economic Development
As indicated in Chapter 1, this IDP has certain gaps, which we intend to address once we go into the first review
of the IDP
2. Institutional Score Card
The image part with relationship ID rId10 was not found in the file.

81
The indicators contained in the Scorecard help us determine five year impacts and outcomes we aim to achieve
through the implementation of our objectives. The targets and indicators on the Scorecard below are generally
impact and outcome indicators and targets, i.e. the measure of the overall developmental impact, and the extent
of benefit to beneficiaries. The required SDBIP indicators, definition of indicators and reporting requirements are
addressed in chapter -9 Performance management
1. SERVICE DELIVERY AND INFRASTRUCTURE DEVELOPMENT 1.1 COMMUNITY SERVICES DEPARTMENT
1.1.1. Waste management Services The objective of Waste Management Service is to provide quality sustainable waste management service to the
residents of Matjhabeng Local Municipality so as to ensure a clean and healthy environment by:
Rendering refuse collection service to all residents and business in terms of the Waste management
Act.
Providing a sufficient number of waste disposal facilities that are well managed and maintained to
international acceptable level.
Drafting and implementing a Integrated waste management plan for the municipality with focus on waste
avoidance, re-use, reduction and recycle.
Develop and Implement Integrated Air Quality Management Plan ( IAQMP)
Develop and implement a strategy that will focus on eradication of illegal dumping
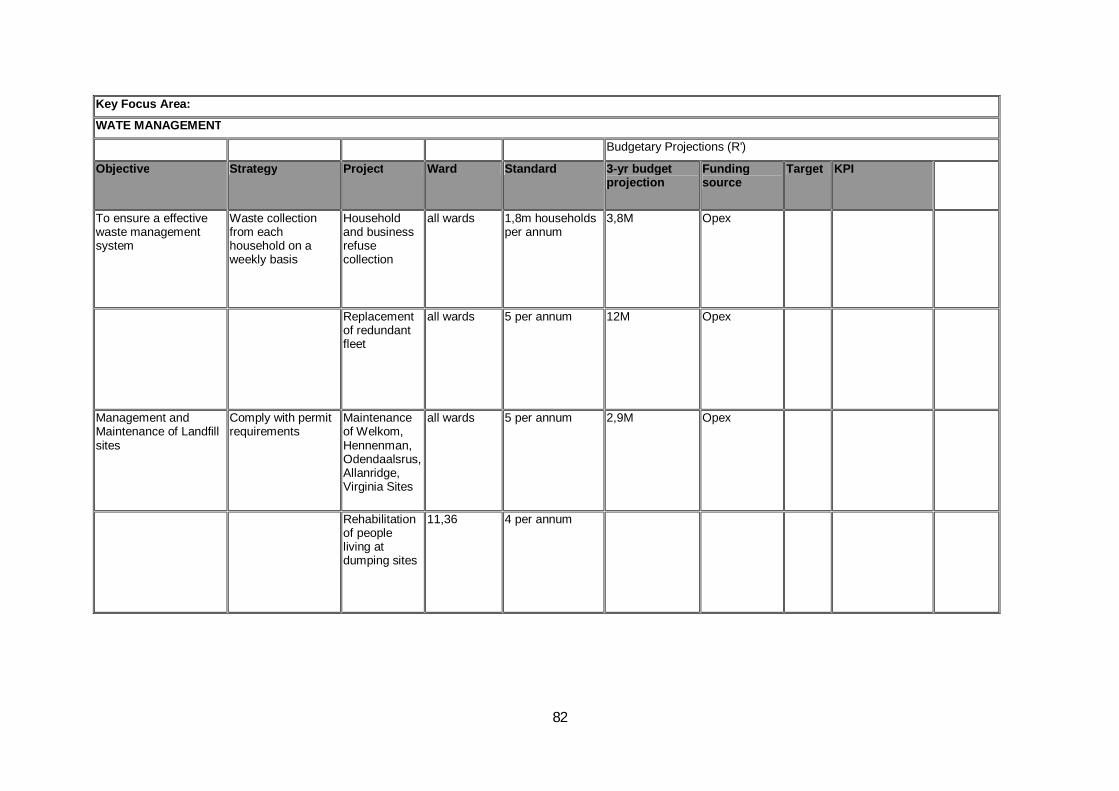
82
Key Focus Area:
WATE MANAGEMENT
Budgetary Projections (R')
Objective Strategy Project Ward Standard 3-yr budget projection
Funding source
Target KPI
To ensure a effective waste management system
Waste collection from each household on a weekly basis
Household and business refuse collection
all wards 1,8m households per annum
3,8M Opex
Replacement of redundant fleet
all wards 5 per annum 12M Opex
Management and Maintenance of Landfill sites
Comply with permit requirements
Maintenance of Welkom, Hennenman, Odendaalsrus, Allanridge, Virginia Sites
all wards 5 per annum 2,9M Opex
Rehabilitation of people living at dumping sites
11,36 4 per annum

83
Key Focus Area:
RECREATION
Budgetary Projections (R')
Objective Strategy Project Ward Standard
3-yr budget projection
Funding source Target KPI
To provide adequet burial space for the community
Timorously develop new & extend current cemeteries
Develop New Cemeteries: Bronville, Phomolong, Mmamahabane
All wards
3 10M Copex
Extent current Cemeteries:Kutlwanong, Meloding
2 3M Copex
Upgrading of Cemeteries 18 4,7M Opel
Maintenance of all Cemeteries 18 4,7M Internal
Recording of interments, niches & memorial works to meet legal standards
Develop an integrated electronic database (GIS recording system
4,7M Internal
Ensure that basic sport & Recreation facilities are available to all communities
To upgrade & maintain existing & build new municipal sport & recreation facilities
Stadiums, Nyakallong, Thabong, Zuka Baloyi, Meloding, North West, Hennenman
30M Copex

84
Ensure that basic sport & Recreation facilities are available to all communities
To upgrade & maintain existing & build new municipal sport & recreation facilities
Sport Complex: Mmamahabane, Kutlwanong, Phomolong, Bronville, Goldfields Regional Complex, Harvinia, Riebeeckstad, Welkom Club
5,2M Copex
Swimming Pools and Recreation Resorts: Mimosa, Riebeeckstad, Kopano, Bronville, Flamingo Lake
7,2M Copex
Indoor Centres: Kopano 10M Copex
Multi purpose Sport &culture centre: (centre of Meloding)
30M Copex
Build new sport & recreation facilities
Construction of a Multipurpose sport stadium with a capacity of 40000 spectators
240M Copex
Construction of new swimming pool: Phomolong
7M Copex
Building of Public amenities in historical Disenfranchised communities
Construction of new community Hall in Thabong far-east and Meloding
13, 6 New 10M Copex New Halls
Ensure that basic sport & Recreation facilities are available to all communities
Build new sport & recreation facilities
Build new facility where festivals can take place
150M Copex

85
Implement maintenance plan for sport & recreation facilities
Stadium, Sport complexes, Swimming pools, Indoor Centres, Informal sport fields
241000 Copexl
To ensure the existence of programs that develop the human potential through sport and recreation
Align the local sport program with the national program
Oliver Thabo Games, Idigenous games, Mayoral Games, Woman’s Games, Youth Games, School Holidays Program, Golden/Disability Games
241000 Opexl
To Affiliate every recognized sport &recreational body to the Sport & Recreational Council Creating possible partnership with schools and sport federations with memorandum of agreement with school to use sport ground for the community

86
Key Focus Area:
PARKS
Budgetary Projections (R')
Objective Strategy Project Ward Standard 3-yr budget projection
Funding source Target KPI
To ensure an effective urban & environmental greening program
Provision of green public open space
Establish one nursery in Welkom
All wards 1 1,8M Copex
Planting of trees 300000 Opex 1000 per annum
Establish new parks Nayakalong Stand Kutlwanong Stand Thabong Stand Bronville Stand Meloding Stand Phomolong Stand Mmamahabane Stand
600000 900000 1,2M 600000 900000 600000
Opex
1 per annum 1 per Annum 1 per annum 1 per annum 1 per annum 1 per annum

87
One park per ward in partnership with EWP
All Wards
600000 12,6M
1 per annum 14 per annum
Maintenance of public open space
Maintenance of develop parks
1675970 OPex 648 per annum
Up grading of CBDS Hennenman Ventersburg Allanridge
1500000 1000000 1000000
Opex
1 1 1
Maintenance of undeveloped parks and public open spaces
1,6M Opex 3138 per annum
To ensure an effective urban & environmental greening program
Maintenance of public open space
Remove decrepit dangerous & unwanted trees
All Wards 165000 Opex 400 per annum
Pruning of trees 450000 Opex 8000 per annum

88
Sports and Recreation
Provision of burial land and burial services
Upgrading and maintenance of cemeteries
Planning, development, maintain and up-keeping of sports facilities.
Planning and execution of sport and recreational programmes that seeks to build healthy and cohesive nation.

89
Budgetary Projections (R')
Objective Strategy Project Ward Standard 3-yr budget projection
Funding source Target KPI
To provide adequet burial space for the community
Timorously develop new & extend current cemeteries
Develop New Cemeteries: Bronville, Phomolong, Mmamahabane
1,3,11 New 10000000 MIG Copex
Extent current Cemeteries:Kutlwanong, Meloding
21,9 Existing 3000000 MIG Copex
Upgrading of Cemeteries
All Ongoing 4703138 Opex
Maintenance of all Cemeteries
All ongoing 4703138 Opex
Recording of interments, niches & memorial works to meet legal standards
Develop an integrated electronic database (GIS recording system
4703138 opex
Ensure that basic sport & Recreation facilities are available to all communities
To upgrade & maintain existing & build new municipal sport & recreation facilities
Stadiums, Nyakallong, Thabong, Zuka Baloyi, Meloding, North West, Hennenman
19,31,29,4,34,2
5213707 Opex

90
Ensure that basic sport & Recreation facilities are available to all communities
To upgrade & maintain existing & build new municipal sport & recreation facilities
Sport Complex: Mmamahabane, Kutlwanong, Phomolong, Bronville, Goldfields Regional Complex, Harvinia, Riebeeckstad, Welkom Club
19,31,29,4,34,2,9,21,27
5213707 Copex
Swimming Pools and Recreation Resorts: Mimosa, Riebeeckstad, Kopano, Bronville, Flamingo Lake
35,21,11,35
7288438 Opex
Indoor Centres: Kopano
10140088
Multi purpose Sport &culture centre: (centre of Meloding)
3000000 Copex
Build new sport & recreation facilities
Construction of a Multi purpose sport stadium with a capacity of 40000 spectators
24000000 Copex
Construction of new swimming pool: Phomolong
7000000 Copex
Ensure that basic sport & Recreation facilities are available to all communities
Build new sport & recreation facilities
Build new facility where festivals can take place
15000000 Copex

91
Implement maintenance plan for sport & recreation facilities
Stadium, Sport complexes, Swimming pools, Indoor Centres, Informal sport fields
241000 Opex
Building of Public amenities in historical Disenfranchised communities
Construction of new community Hall in Thabong far-east and Meloding
13, 6 New 10M Copex New Halls
To ensure the existence of programs that develop the human potential through sport and recreation
Align the local sport program with the national program
Oliver Thabo Games, Idigenous games, Mayoral Games, Woman’s Games, Youth Games, School Holidays Program, Golden/Disability Games
241000 Opex
To Affiliate every recognized sport &recreational body to the Sport & Recreational Council Creating possible partnership with schools and sport federations with memorandum of agreement with school to use sport ground for the community
N/A
To facilitate the Municipality’s contribution and participation in
Finalise the LAA agreem
Development of a Multi Purpose Sport Stadium in Matjhabeng in
Matjha

92
the development of a multipurpose sport stadium in Matjhabeng
ent
Finalise NGOP partnership agreement with Trust
Facilitate the flow of external funding towards the feasibility study
partnership with the NFS Lejweleputswa Community Partnership Trust
a) Multi Purpose sport stadium –
Trust operational fees
28 Ex
200000 Opex H
b)Multi purpose sport stadium –
Township Establishment
28 New 150000
Opex H

93
Parks and Horticultural Service
The municipality is committed to create and maintain landscaped, public open-spaces within the urban area in a
sustainable, aesthetics, eco-friendly and safe environment to enhance marketability of our area and improve
quality of life of all the people.
This includes:
Conceptualization, planning and implementation of landscaping projects
Planning, development and maintenance of parks, flowerbeds playground and playground equipment.
Develop and implement the public open space master plan
Develop and implement greening programmes which includes, vegetation and tree planting
Implement and maintain street trees in line with municipal tree policy
Provide specialized vegetation management and control( alien plants, weed control and biological
control)

94
Budgetary Projections (R')
Objective Strategy Project Ward Standard 3-yr budget projection
Funding source Target KPI
To ensure an effective urban & environmental greening program
Provision of green public open space
Establish one nursery in Welkom
All wards
1 R3 m Opex
Planting of trees 300 000 Internal 1000 per annum Establish new parks 3 m Internal 3 per annum
Encourage communities to adopt parks
15 per annum
Develop Master Plan for rezoning of parks for residential purposes
1 R 1,5m 0,5m 50000 50000
Maintenance of public open space
Maintenance of develop parks
648 per annum
4m Opex Number of parks
Maintenance of undeveloped parks and public open spaces
3138 per annum
Opex
To ensure an effective urban & environmental greening program
Maintenance of public open space
Remove decrepit dangerous & unwanted trees
All Wards
400 per annum
Opex
Pruning of trees 8000 per annum
Opex Number of tree

95
1.1.2. Safety, Security and Transport The safety and security of all residents, the business community, tourists and property is a key focus of this
municipality. In this regards, the municipality focuses on crime prevention, disaster management, roads and
traffic safety, fire and emergency services and internal security services.
To create a safe and secure environment in Matjhabeng Municiplaity , the full and maximum participation of all
stakeholders , including our residents, mines and business community is required in addressing the following
challenges;
a) Prevention and reduction of crime
b) Reducing the risk of disaster
c) Reducing the risk of fire and other related emergency related risks
d) Maintaining acceptable levels of response to emergencies
e) By-force enforcement
f) Fleet Management service
g) Protection of municipal employees and assets

96
FIRE & RESCUE SERVICES Budget
projections(R‘)
Objective Strategy Project Ward Standard Priority Total Budget Funding
source Target Year KPI
Facilitate the development of safer communities through better planning & enforcement.
Establishment of six satellite fire stations in suburban areas.
Set-up satellite fire stations for accessibility to fire incidents according to SANS 10090:2003.
Existing Project High 100m Opex
1 Station per FY due to
high cost
Monthly report indications (PMU to appoint consultant in March 2012).

97
Key Focus Area: FLEET MANAGEMENT
Budgetary projections(R)
Objective Strategy Project Ward Standard Priority Total Budget Funding source
Target Year KPI
Reduction on inoperative fleet.
Auctioning of high maintenance & weary fleet.
Continue 2nd Phase Auction on high cost & weary fleet to reduce repair & maintenance costs in line with asset register.
Existing High 20,000 Opex End of 2nd Quarter
Dec 2012
Progress Reports &
tender processin
g Upgrade fleet size for different business units.
Add to current priority vehicles required.
Prioritize & acquire additional vehicles, plant & equipment. Existing High 50 000 000 Capex
End of 1st Quarter
Sept 2012
Tender processin
g Improvement labour compliance of Mechanical Workshops.
Upgrading of the Wash Bay.
Fully functional Wash Bay for all directorates in extending vehicle image & lifespan.
New project Medium 150 000 Opex
End of 2nd Quarter
Dec 2012
Monthly Progress Reports
Identification of equipment, floor markings & working areas in line with the OHS Act 85/1993.
Compliance to and visibility of equipment as well as ease of access to all working areas.
New project Medium 100 000 Opex
End of 2nd Quarter
Dec 2012
Risk Assessme
nts
Replacement of hazardous asbestos roof & poor illumination.
Replace/refurbish extreme leaking roof & lights well as roller doors at Welkom, Virginia & OD Workshops.
New project High 1 000 000 End FY
2011/2012
Risk Assessme
nts (Insurance claim)
Maintenance of vehicles, plant & equipment
Re-opening of Mechanical Stores.
Fully stock and run minimum parts & spares in tandem with SCM for availability of parts & spares including tyres & batteries on an in-house basis.
New project Medium 1 000 000 Opex End FY
2012/2013
Monthly Progress Reports
Use outsourcing procedures to assist on
Implement outsourcing of repairs & assessments in line with
Existing project High 22 000 000 Opex End FY
2011/2012 Monthly Reports/

98
maintenance & repairs of fleet.
operational budget. (Ongoing) assessments via tender
processing.
Conduct needs assessment for all technical support programmes to boost employee skill & performance.
Develop training programme/s for staff on operational level.
New Project Medium 200 000 Skills
Development Levy
Aug 2012
Arrange apprenticeships etc via Skills
Development. & sign
SLA’s for Artisans such as
Mechanics,
Millwrights, etc.
Acquire computerized design & support software with a global tracking system.
Follow tender process for necessary SLA with supplier/s to manage & control data.
Existing project High 2 000 000 Capex Sept 2012
1st 100x fleet
installed End Jan
2012. 2nd
Phase to follow with
100x installatio
ns for better
control & managem
ent.

99
Key Focus Area: TRAFFIC MANAGEMENT AND SECURITY SERVICES
Budgetary
projections(R‘)
Objective Strategy Project Ward Standard Priority Total Budget
Funding source Target Year KPI
Direct the traffic control function towards policing high risk violations – rather than revenue collection.
Intensify the Road safety Awareness projects / campaigns.
1. Intensify Pedestrian awareness
2. Road Safety Education (Scholar Patrol and Child in Traffic)
3. Easter Holiday (AA) 4. Intensify Summer Holiday
Programme (AA) 5. Celebrate Ipoloke project 6. Celebrate Khanya Project.
Existing Project High 60 000 PST Ongoing
each year Quarterly Reports
Upgrading of Traffic Administration System (Back Up Office).
Tender to improve the current system to accommodate new legislation (AARTO implementation), Traffic fines and Accident capturing, Call Centre and Pay points. Installation of e NATIS System.
New Project High 1 000 000 MIG End March
2013
National Task Team
Meeting response
s
Procurement of Speed, Alcohol Apparatus & K78 Road Block Trailer with Equipments.
To Purchase three (3)speed machines, two (2) Dragger Alcohol testing machines and K78 Road Block Trailer with full Equipment for effective Traffic Law Enforcement in Matjhabeng.
New Project High 1 500 000 PST July 2013 Quarterly
Reports

100
Maintain the Accreditation Credentials of Matjhabeng Traffic Training Academy.
Further Refurbishing the College Building, Parade Ground Construction, Fencing the Premises, Shooting Range. Attending the workshops and meetings, Purchasing the Books and upgrading the study materials. Development of the Data System for compliance with the National Training Policy and relevant legislations. Extension of training by including EOV and EDL Training.
New Project High 5 000 000 MIG July 2013
Monthly Reports
& Evaluation reports
from RTMC
Capacity Building of Traffic Personnel (Training and Re- Training for the compliance with the legislation).
Training of new Traffic Trainees at least 50 per year, Training of employees on short courses and on refresher courses as per the legislation.
New Project High
500 000
PST July 2013 Quarterly
Report
Establishment of the Matjhabeng Municipal Branch Court.
To finalized the draft Business Plan and submit it to council for Approval, to liaise with NPA and to indentify the Building and to attend to issues of the resources so as to ensure that the fines issued complete their circle and to address the challenge of treating Traffic fines and By-Law enforcement cases as miner cases and to ensure that they receive the priority in prosecution and administration.
Existing Project High 6 300 000 MIG FY 2012/13
Monthly Progress Reports

101
To ensure Sustainable Traffic Control.
Painting of Road Markings and the erecting or replacement of road signs.
Regular painting of road markings and the replacement of signs (at least to cover 100 km per year and 900 signs per year) will not only help to ensure the safety of our roads and to alleviate litigation but will ensure that the whole traffic endeavours becomes a success.
Existing Project High 2 400 000 PST
E.g. Used 1200 litres of paint for 1st Q. 1200L/5L = 240 (5 litres). 1x 5L = 75.6m. So 240x 75.6m = 18144m/1000= 18.144km
Reduction of crime.
Implementation of the Safety Strategy.
To ensure the implementation of the plan.
Existing Project High 1 500 000 PST End June
2013
Senior manage
ment interventi
on
Community Participation. To Establish crime prevention coordinating committee.
Existing Project High 600 000 PST Sept 2013
In draft stage -
Conclusion from Senior
Management
To protect Council Assets and & employees (Install and activate Electronic Security systems on identified Municipal Buildings/ premises).
Upgrade and Expand the existing security and access function to all municipal buildings (Through tender procedures all identified buildings and premises be installed with electronic security to safeguard all property & employees of the municipality).
Existing Project High 10 000
000 MIG Dec 2013
Senior manage
ment interventi
on
Effective By-Law Enforcement.
To enhance the unit that is established by more training,
Existing Project High 3 000 000 MIG Dec 2013 Manage
ment &

102
workshops and increase required resources.
Political interventi
on
Screening of all employees & Service Providers.
Verification of good standing on Service Providers & assessing employee credentials.
New Project High 50 000 PST July 2013
Complete draft
document &
approval from
Senior Manage
ment
103
INFRASTRUCTURE DEVELOPMENT Provision of basic services Improving service delivery through the provision of basic services is an integral part of the Municipality’s mandate. The Municipality is acutely aware of the many service
delivery challenges confronting it, and has developed a number of plans to address these challenges. These plans will be implemented, as reflected in this IDP.
Water services
With the advent of the Water Services Act (Act 108 of 1997), all South African water services authorities were required to prepare a Water Services Development Plan
(WSDP). The WSDP is a strategic plan setting out the way in which a Water Services Authority delivers water services to individuals and businesses in its area of jurisdiction. It
also describes the current and future consumer profile, the types of services that are provided, the infrastructure requirements, the water balance, organisational and financial
arrangements to be used, an assessment of the viability of the approach, and an overview of environmental issues. Based on these analyses, important issues that may impact
on the provision of effective and sustainable water and sanitation services need to be identified and strategies need to be formulated to improve service provision.
The Municipality compiled modules 1 and 2 and must address modules 3, 4 and Reporting of the WSDP as matter of extreme urgency. The outcome will give guidance in the
IDP and Capital budget. A longer-term analysis and the integration of future water demand and infrastructure are necessary in this regard. In order to address the latter, a
Water Master Plan (WMP) has to be developed and should be informed by the SDF and the recent study on Water Loss done by Latitude.
The WMP is a plan that identifies the gaps in the provision of water to meet the needs set out in the WSDP. The WMP is a longer-term plan that covers the period up to 2030,
far extending beyond the five-year period covered by the WSDP, in order to meet the long-term water requirements of Matjhabeng.
Key strategic goals
In addition to the Water Services Act, the Municipality’s WSDP should be informed by the National Strategic Framework for Water Services (September 2003), which is a
critical policy document that sets out the future national approach to the provision of water services. Key focus areas of the Water Services Delivery Plan include the following:
a) Provision of a sustainable water supply.
b) Development of a comprehensive Water Management Strategy.

104
c) Transformation of the Municipality into a world-class water service provider.
d) Financial accountability and sustainability.
e) Establishment of a comprehensive Customer Care and Management Strategy.
f) Ensuring quality (regular testing of water to ensure that it meets the required standard, as depicted in the Blue Drop and Green Drop systems), sustainable and
affordable services to all.
Critical challenges
1. Provision of at least basic water service to all communities.
2. High non-revenue water (high levels of loss /unaccounted for water impact on income of the municipality).
3. Rapid aging and decaying water network infrastructure
4. Timeous provision of infrastructure to meet developmental growth needs.
5. Maintenance of infrastructure to ensure effective operation thereof.
6. Limited financial and human resources.
Sanitation
Access to sanitation is a vital prerequisite for a healthy environment and restoring the dignity of local communities. In addition to the provision of water, sanitation is therefore a
key focus area of the Municipality. A government programme to eradicate the bucket system by the 2007, could not be fully achieved by Matjhabeng Municipality, resulting in
certain areas of Matjhabeng still compelled to use buckets as form of sanitation. The existence of back yard dwellings increase the number of stands to be serviced with
bucket systems. Over and above the failure to complete the Bucket Eradication Program, there are informal settlements that do not have access to a basic level of sanitation.
Most formal settlements are provided with waterborne sanitation.
Key strategic goals and challenges
In addition to the Water Services Act, the Municipality’s WSDP is informed by the National Strategic Framework for Water Services (September 2003), which identifies the
sanitation needs. A sewer master plan was done for approximately 50% of the Municipality. This master plan should be extended to cover all the residential areas.

105
Key supporting objectives of the Sanitation Master Plan should include the following:
1. Provision of at least basic sanitation to all communities by 2014.
2. Address and rectify directives issued by Environmental Minister.
3. Transformation of the Municipality into a world-class sanitation service provider.
4. Address the aging infrastructure challenge
5. Ensuring that purified effluent complies to National standards and a sustainable and affordable services be delivered to all.
Critical challenges
1. Meeting the national target for the provision of basic sanitation services to all by 2014.
2. Completing the development of the Sanitation Master Plan (SMP) as matter of extreme urgency.
3. Rehabilitate and upgrade all substandard waste water treatment plants.
4. Fix and complete sanitation problems emanating from bucket eradication program
5. Timeous provision of infrastructure to meet developmental growth needs.
6. Maintenance of sewer infrastructure to ensure effective operation.
Roads and Storm Water Municipalities in the Republic of South Africa are required, in terms of Section 36(1) of the National Land Transport Act, 2009 (Act No. 5 of 2009), to prepare a Comprehensive
Integrated Transport Plan (CITP) every five years. The CITP must be updated annually. However, Matjhabeng Municipality has not produced one since its inception. Such a
plan was however compiled for this area by Lejweleputswa District Municipality. It is envisaged to update this plan in the IDP time frame.
Key Challenges:
Roads and stormwater maintenance, backlog of approximately R4 billion exist and the construction of new roads backlog exist to the value of approximately R1,9
billion, which increases annually as new residential areas are established and developed.

106
Insufficient financial support from the Provincial Departments to eradicate these backlogs.
Risk of flooding and damage to properties and community health and safety hazards due to poor stormwater infrastructure maintenance and upgrade and construction
of new systems (estimated storm water infrastructure backlog is R850 million).
Poor storm water infrastructure maintenance, upgrade and construction of new systems(estimated backlog of R850million) increase the risk of flooding, damage to
property and community and safety hazards
Objectives Strategies Project/Program Ward no
Standard
Ex/New
4 Year Budget Allocation
Funding Source
Priority
H/M/L
Target
To develop roads, water, sewerage, electricity and stormwater infrastructure
Deliver new infrastructure for 2000 stands every financial year.
Service 1000 new stands per year All New R 15m Human Settlement/ MIG
H 2016
Service1000 existing stands per year.
All New R 16m Human Settlement/ MIG
H 2016
Phomolong School stands (100) 2 New R2m Human Settlement
H 2013
Meloding: Cemetery, Circle & Clinic area, Sewer network for 350 stands
4,7,9
New R6m Human Settlement/ MIG
H 2013
Kutlwanong Stadium area (K2)216 stands
18 New R3.5m MIG H 2013
Kutlwanong Leeubosh area (after formalisation of the area)
22 New R32m Human Settlement
M 2015
Thabong Thandanani(2010) 1500 25 New R24m Human M 2015

107
Objectives Strategies Project/Program Ward no
Standard
Ex/New
4 Year Budget Allocation
Funding Source
Priority
H/M/L
Target
stands Settlement
Phomolong: Water network for new development on Gliding Club area/ Ventersvlakte
3 New R5m Human Settlement
L 2016
Mmamahabane Development on Groenepunt 96 farm
1 New R5m Human Settlement
L 2016
Conversion of hostels: bulk services
Supply bulk services to areas where private developers convert existing hostels to family units with housing subsidies
All New R2m Human Settlement/ Municipal
M 2016
Develop and service business stands to stimulate growth
Service new stands 9520, Welkom 32 R0.3m Municipal M 2016
Develop and service new industrial stands to stimulate growth
Service stands in X39, Welkom 32 R 3m Municipal M 2016
To develop infrastructure – e.g. roads, water, sewerage, electricity and stormwater.
Upgrade bulk and internal sewerage reticulation
Construct new sewer lines and services in new or underdeveloped areas.
All New
Construct a sewer network for Thabong X13.
17 New R 9m MIG H 2014
Alma sewer reticulation and Bulk services study.
27,35 New R 3 m Human Settlement/
L 2016

108
Objectives Strategies Project/Program Ward no
Standard
Ex/New
4 Year Budget Allocation
Funding Source
Priority
H/M/L
Target
Municipal
Install water meters in conjunction with the installation of sewer connections.
All New R 6m MIG/Municipal
M 2014
To develop infrastructure roads, water, sewerage, electricity, stormwater.
Install bulk and internal water reticulation.
Install Bulk, internal water reticulation and water meters in new areas and existing under-developed areas.
All New MIG/Municipal / Human Settlement
2016
Thabong X20 (Hani Park): Extension of network (180 stands)
12 New R 1.3m MIG H
Water network for Thabong T6 &T12 1200 stands
25 New R 8.4m MIG/Municipal / Human Settlement
H 2014
Create Section 78 for water All Existing R 6m Municipal L 2016
Servicing of 500 stands with water connections and meters in Kutlwanong X9, K2, Block 5
10,18, 22
Existing R1m MIG/Municipal
M
To develop infrastructure roads, water, sewerage, electricity,
Develop Service Master plan and Planning designs where applicable for Stormwater, Sewer and Water services
Develop Stormwater Master plan for all towns and prioritise identified projects.
All Existing R 6m Municipal/ DBSA
M 2014
Develop bulk Sewerage Master plan and capacity analysis for all towns and prioritise identified projects
All Existing R 4m Municipal/ DBSA
M 2015

109
Objectives Strategies Project/Program Ward no
Standard
Ex/New
4 Year Budget Allocation
Funding Source
Priority
H/M/L
Target
stormwater by Analyzing existing networks and do planning designs for future projects
Develop Water reticulation Master plan (including meters and standpipes) for all towns and prioritise identified projects
All Existing R5m Municipal/ DBSA
H 2014
Develop Rural area sewer development plan
All New R 1m Municipal/ DBSA
L 2016
Develop database for master plans, populate with information and link to GIS
All Existing R 1m Municipal/ DBSA
M 2014
Development of a Gravel Pit master plan and management system
All Existing R 1m Municipal/ DBSA
H 2014
Compilation of Waste Water Treatment Plants master plan
All Existing R 1m Municipal/ DBSA
L 2016
Compilation of WSDP documents and action plan
All Existing R3m Municipal/ DBSA
H Annually to 2016
Compile and update immovable asset management system
All Existing R3m Municipal/ DBSA
M
To develop infrastructure roads, water, sewerage, electricity, stormwater
Construction and upgrading of National and Provincial Roads in Matjhabeng:
Extension of Jan Hofmeyr Rd north of Hani Park (Province)
12 New R 20M Province Roads Department
H 2016
Road Lighting Provincial Roads Hani Park area (SANRAL)
12,23 New R10m SANRAL H

110
Objectives Strategies Project/Program Ward no
Standard
Ex/New
4 Year Budget Allocation
Funding Source
Priority
H/M/L
Target
To develop infrastructure –e.g. roads, water, sewerage, electricity, stormwater.
Construction of new roads.
Construct roads in new areas and under-developed areas
All New R 20/a MIG/Municipal H 2016
Construct 50km new distributor roads/ bus/ taxi roads to improve traffic flow and improve stormwater management.
All New R280m
MIG/Municipal H,M,L 2016
Construct 36 Km roads to address stormwater problems and enhance accessibility to stands
All New R180m MIG/Municipal H,M,L 2016
Virginia Way Service lanes 9 New R 3m Municipal M 2016
Thabong road 142 (G-hostel) 26,31 New R 1.5m MIG/Municipal H 2016
Finalization of Hlasela roads in Kutlwanong, Meloding and Phomolong
18,20, 4,5,7,3
Existing R15m Human Settlement
H
Upgrading of intersections on main roads where high accident occurrences are encountered and to enhance traffic flow.
All New R20m Municipal H,M,L
To develop infrastructure –e.g. roads, water, sewerage, electricity, stormwater.
Compile a pavement management system.
Resurfacing of 13% of all streets every year.
All Existing R 30m/a MIG/Municipal H,M 2016
Maintenance of streets and associated infrastructure.
All Existing Generic H,M,L
Crack sealing of roads and repair potholes
All Existing R 7m/a Municipal H,M,L 2016

111
Objectives Strategies Project/Program Ward no
Standard
Ex/New
4 Year Budget Allocation
Funding Source
Priority
H/M/L
Target
Sealing of existing dump rock roads at 5km/a
All Existing R 12M/a MIG/Municipal H,M,L 2016
To reconstruct the roads that are beyond repair
Reconstruct roads that do not function safely and can not be repaired economically.
6.3.1.1. Rebuild Alma road 27 Existing R 10m Municipal M 2016
6.3.1.2. Rebuild Stateway service lanes 27,32,34
Existing R 15m Municipal M 2014
Rebuild Second street between Stateway and Half street and address stormwater problems.
32 Existing R 5m Municipal M 2016
Rebuild Valley Drive North (Virginia) 5,9 Existing R 12m Municipal M 2014
Construction of the storm water canals and develop borrow bits
Construction of new storm water canals
Construct new Storm water canals in new developed or underdeveloped areas.
All 2016
Hani Park storm-water system drains to enable construction of roads and prevent flooding of stands
12 New R 5m MIG/ Municipal
H,M 2013
Main channel to drain Thabong T16 south to retention area
13,15,17
New R4m MIG/ Municipal
H,M 2014
Upgrade Losaba channel to a closed pipe system
26,31 New R2m MIG H 2013
Extend Xaluva channel north of Nkoane Road
28 New R1m MIG M 2015

112
Objectives Strategies Project/Program Ward no
Standard
Ex/New
4 Year Budget Allocation
Funding Source
Priority
H/M/L
Target
Extend Bronville X9 channel to Blesbokpan
11 New R1m MIG L 2016
Construct pedestrian bridges over main stormwater channels to ensure safe crossing thereof
Stateway (2),
Togo Drive (1),
Moshoeshoe railway(1)
Kutlwanong (K1 – Geneva)
24,34,31,10
New R0.6m MIG/ Municipal
H,M 2014
Upgrade main storm water system in Phomolong
2,3 Existing and New
R4m MIG H,M 2015
Upgrade main storm water system in Mmamahabane
1 Existing and New
R5m MIG H,M 2015
Upgrade main storm water system in Meloding
4,5,6,7,9
Existing and New
R7m MIG H,M 2015
Upgrade main storm water system in Kutlwanong
10,18,20,21,22
Existing and New
R10m MIG H,M 2015
Upgrade main storm water system in Nyakallong
19,36 Existing and
R10m MIG H,M 2015

113
Objectives Strategies Project/Program Ward no
Standard
Ex/New
4 Year Budget Allocation
Funding Source
Priority
H/M/L
Target
New
Phomolong: construction of new canal from WWTP to spruit
3 Existing and New
R3m MIG/DWA/ Municipality
H,M 2015
Nyakallong entrance: stormwater upgrade
36 New R1m MIG H,M 2015
Construction of retention dams to reduce occurrence of flooding of properties
Retention dams for flooding of Tana Street
27 R6m Municipal H 2014
Retention dams at Meloding (Albany) 5,9 R3m MIG H 2014
To develop gravel roads
Draw up a gravel road construction program that will yield 15km per annum.
Construct sealed gravel roads at 15Km per annum.
All New R25m MIG H,M,L 2016
Construct un-designed Gravel roads to give residents access to stands in rainy season at 15Km per annum
All New R15m MIG H,M,L 2016
To improve the street naming and signage
Allocate street names and numbers.
Complete the Street identification program.
R100,000 2013
Identify and set a priority list for the replacement and repair of road signs.
Create a street sign management system, survey existing indicators and update system.
R2,500,000 2013

114
Objectives Strategies Project/Program Ward no
Standard
Ex/New
4 Year Budget Allocation
Funding Source
Priority
H/M/L
Target
Implement a road sign posting program
Installation/construction/upgrading of road sign posting
R500,000 2014
To compile and implement a maintenance and upgrading plan for storm water canals.
Clean and upgrade all stormwater Canals.
Cleaning of lined storm water canals in the whole of Matjhabeng once a year.
All Existing R4m/a Municipal H,M,L 2016
Cleaning of unlined storm water canals in Matjhabeng twice a year.
All Existing R6m/a Municipal H,M,L 2016
Concrete Lining existing canals at 5km per annum.
All Existing R5m/a MIG/Municipal H,M,L 2016
Refurbish Odendaalsrus Main stormwater channel and Brain Avenue
35,36
Existing R4m Municipal H
Finalization of Uitsig canal retention dam (Stand 8083 Thabong).
29 Existing/New
R5m MIG/Municipal M,L 2014
Cleaning and maintenance of existing storm water drainage pipes.(Operational)
All Existing R13m Municipal H 2016
Formalizing stormwater canal at school in T15
16 Existing R0.5m MIG/Municipal H 2009
Formalizing stormwater canal in Thulwane street: Thabong
26,29
Existing R5m MIG/Municipal M 2014
Formalizing stormwater canal at Phakati near Nkoane road
16,25
New R0.3m MIG/Municipal H 2008

115
Objectives Strategies Project/Program Ward no
Standard
Ex/New
4 Year Budget Allocation
Funding Source
Priority
H/M/L
Target
Upgrade storm water Jan Hofmeyr/Power roads near circle
30,32
New R5m Municipal H 2016
Relining of Stateway Canal Lindsey to Anthony
24 Existing R4m Municipal M,L 2016
To replace 15% of worn out water pipelines in a five-year cycle.
To replace 15% of worn out water pipelines in a five-year cycle.
Compile a replacement plan for worn out water pipes to reduce water loss.
Replace worn out water pipes to minimize water loss.
All Existing R70m MIG/Municipal H,M,L 2016
Refurbish Allanridge main steel water network pipe.
36 Existing R1.3m Municipal H 2014
Service all hydrants and Valves once a year and replace that cannot be repaired.
All Existing R15m Municipal H,M,L 2016
Analyze and upgrade of Meloding water network to ensure that minimum water pressure is maintained throughout the day
4,5,6,7 Existing R30m MIG/Municipal H,M,L 2016
Analyze and upgrade of Kutlwanong K6 water network to ensure that minimum water pressure is maintained throughout the day
20,21
Existing R9m MIG/Municipal H,M,L 2016
Repair and maintenance of water related infrastructure
All Existing R13m Municipal H,M,L 2016
Compile a replacement plan for
Replace 440 km of asbestos water pipes All Existing R154,000,000 Municipal H,M,L 2016

116
Objectives Strategies Project/Program Ward no
Standard
Ex/New
4 Year Budget Allocation
Funding Source
Priority
H/M/L
Target
Asbestos water pipelines to comply to asbestos legislation
in phases
Implement a Water Demand Management and Monitoring plan.
Add valves where areas cannot be shutoff in manageable chunks to limit unnecessary water loss occur during maintenance actions.
All Existing R5m MIG/Municipal H,M 2015
Implement a water pressure reduction system to reduce the occurrence of burst pipes.
11-17, 25-34
New R9m MIG/Municipal H,M,L 2016
Conducting analysis to do leak detection investigation
All Existing R4m Municipal H,M,L 2014
Implement Leak detection system and equipment
All Existing R2m/a Municipal H,M,L 2014
Develop water loss monitoring database All Existing R400,000 Municipal M 2014
Data logging of bulk meters to monitor consumption trends, trigger alarms and calculate losses due to pipe bursts.
All Existing R1.5m/a Municipal H,M,L 2014
Identification of consumers with water connections who are not billed
All Existing R1m Municipal H 2013
Repair all faulty Compile a repair Implement the water meter repair All Existing R2m/a Municipal H,M,L 2009

117
Objectives Strategies Project/Program Ward no
Standard
Ex/New
4 Year Budget Allocation
Funding Source
Priority
H/M/L
Target
water meters and replacement program of faulty water meters.
program.
Replace worn-out water meters with Pre-Paid meters at a rate of R20m/a for 3 years to reduce water loss and increase revenue collection
All Existing R20m/a Municipal H,M 2015
Enhance the implementation of the Water Revenue Protection unit
All Existing R1,5m Municipal H,M 2008
Construction and Extension of purified Water sewerage network
Construction of a new Water Purification Plant
Build water purification plant for the purpose of irrigation
All New R 50 000 000 Municipal L 2016
Ring fence revenue from sales of purified water.
Use 50% of purified water sales to extend the purified sewer effluent network each year to reduce the usage of potable water for irrigation purposes.
All Existing R5,000,000 Municipal H,M,L 2016
To ensure long-term cost effective bulk Water supply to Matjhabeng sewerage
Comply with the Water Services Authority legislative requirements.
Develop the Matjhabeng Water Services development plan (WSDP)
All Existing R2m/a Municipal H,M,L 2016
To upgrade the bulk sewer network and WWTP to 100% functionality
Employ personnel dedicated for the repair and maintenance at the sewerage works(WWTP) and pump-stations.
Upgrade Mmamahabane sewer works. 1 Existing R35m MIG M 2015
Upgrade Theronia sewer works. 24 Existing R90m MIG/Municipal / DWA
M 2015
Upgrade Odendaalsrus sewer works (Cleaning and upgrading of Maturation
36 Existing R2m Municipal / DWA
M 2015

118
Objectives Strategies Project/Program Ward no
Standard
Ex/New
4 Year Budget Allocation
Funding Source
Priority
H/M/L
Target
Phase upgrades over five year periods.
ponds, health and hygiene, etc).
Upgrade of Kutlwanong sewer works. 10 Existing R50m MIG M 2016
Extend Thabong sewer works to accommodate sewerage from Witpan works and new developing areas including first phase of Phakisa development
31 New R160m MIG/Municipal H,M 2015
Upgrade of Hennenman sewer works. 3 Existing R40m Municipal / DWA
M 2015
Upgrade and maintenance of dysfunctional and pump stations not on standard in Matjhabeng.
All Existing R40m MIG/Municipal H,M,L 2016
Move and upgrade T8 pump station to minimize effect on households when dysfunctional
14 Existing R8m MIG/Municipal M,L 2016
Refurbish Witpan Sewerage works 32 Existing R40m MIG/Municipal H 2008
Upgrade Whites sewerage works 3 Existing R3m MIG H,M 2009
Upgrade Nyakallong sewerage works. 36 Existing R35m MIG/Municipal H,M 2015
Clean sumps of pump stations once in 2 years
All Existing R5/a Municipal H,M,L 2016
Develop a pump station master plan with focus on effective functionality and electrical cost reduction. (Investigate to
All New R3m MIG/Municipal / Eskom
M,L 2016

119
Objectives Strategies Project/Program Ward no
Standard
Ex/New
4 Year Budget Allocation
Funding Source
Priority
H/M/L
Target
be research in collaboration with and support of a University and Eskom)
Construct and upgrade security and alarm systems at pump stations and sewerage works to reduce theft and damage to infrastructure
R3m/a Municipal H,M,L 2016
Upgrade, maintenance and operation of Sewerage works in Matjhabeng.
All Existing R21m/a Municipal H,M,L 2016
Refurbish Virginia WWTP 24 Existing R40m MIG/Municipal H,M,L 2016
To replace 25% of worn out sewer pipelines in a five-year cycle.
Identify sewer pipelines that have suspected problems.
Replace 5% of worn out sewer pipelines annually.
All Existing R25m MIG/Municipal H,M,L 2016
Apply Protective lining to sewer pipes Virginia and OD.
9,36 Existing R8m MIG/Municipal H 2013
Replace 450mm rising main line between Major pump station and Theronia sewerage works and enlarge sump of Major pump station.
33 Existing R4m Municipal, DWA
M 2014
Relining of rising main from Power Road Pump station to Rovers club.
32 Existing R3m MIG/Municipal/ DWA
M,L 2016
Replace 300mm sewer in Brain street Odendaalsrus (Finalise project)
35 Existing R0.3m Municipal H 2013
Maintenance of sewer related infrastructure.
All Existing General 2016

120
Objectives Strategies Project/Program Ward no
Standard
Ex/New
4 Year Budget Allocation
Funding Source
Priority
H/M/L
Target
Compile a replacement plan for worn out sewer pipelines.
Purchase TV inspections equipment and create unit to do inspections of all sewer lines to identify problematic lines and prioritise replacement thereof
All New R1m Municipal H 2013
To replace iron manhole covers with lockable covers without resale value
Identify dangerous open manholes to be covered
Replacement of 2000 iron covering of open manhole’s covers with lockable covers annually.
All Existing R3m/a Municipal H,M,L 2016
To replace the bucket system with water borne sewer
Provide bulk and internal sewer network and toilet structures in existing developed areas serviced by buckets and without a network
Finalization of bucket eradication projects
1,2,3,5,6,7,10,18, 20, 21,22,36
Existing R80 m MIG/Municipal/ DWA
H,M 2014
Upgrade of outfall sewer between Meloding and Virginia to accommodate flow of bucket eradication. (Finalise outstanding problems)
5,9 Existing R2m MIG/Municipal/ DWA
H 2013
Repair and maintenance of Municipal Buildings.
Compile a priority list in respect of repairs / renovation to Municipal Buildings.
Repair and Maintain municipal buildings to comply with Operational Health and Safety Act.
All Existing R25m Municipal H,M,L 2016
Renovate Airport buildings and infrastructure
24 Existing R3m Municipal H 2014
Upgrading of Nyakallong, Allanridge, Odendaalsrus and Virginia Municipal offices
36,9 Existing R6m Municipal H 2014

121
Objectives Strategies Project/Program Ward no
Standard
Ex/New
4 Year Budget Allocation
Funding Source
Priority
H/M/L
Target
Upgrading of Old Public Safety Building 27 Existing R3m Municipal H 2014
To investigate the utilization of the municipal railway sidings in partnership with other stakeholders
Invite Stakeholders and develop a Public Private Partnership.
Repair and maintenance of in use railway sidings in partnership with private users.
32,35,3,9
Existing R50 000 2016
To ensure that the farming community has access to services
Implement a program of access to hygienic toilet facilities for the farming community.
To supply / install appropriate sanitation for the farming community per annum in partnership with DWAF.
All New R3,500,000 Human Settlement
L 2014
Facilitate the maintenance of rural roads to commonage farms.
Upgrade and blading of access roads to commonage farms
All Existing R2,000,000 Municipal H,M,L 2016

122
Provision of Energy (Electricity)
Since 2008, South Africa experienced a marked reduction in the National Generation reserve margin. As such, the country is faced with having to save energy through energy
reduction campaigns (Demand Side Management Renewable Energy and Energy Efficiency). Through this programme, carbon emission reduction and climate change
mitigation have become local priorities.
To this end, the Matjhabeng is striving to becoming a leader in the field of climate change mitigation, the reduction of harmful greenhouse gases and the identification and
implementation of alternative fuel sources. Renewable energy, proper energy efficient measures and the successful institutionalisation of climate change mitigation in all
spheres of business form part of this commitment.
In order to ensure a balance to achieve savings while promoting business growth sustainable development in all sectors, and the concept of job creation, maintaining a safe,
reliable and affordable electricity supply must prevail. Good governance is a prerequisite for energy regimes that are economically and environmentally sound and socially
responsible.
Objectives Strategies Project/Program Required budget Funding Source
Priority
Ward no
Standard 4 Year Budget
Allocation
2012/2013
2013/2014
2014/2015
2015/2016
Target
132KV DISTRIBUTION
To ensure an effective and safe 132kV Distribution
network
Ensuring a sound and safe
high voltage (132kV)
distribution
WELKOM Upgrading breakers and isolators 132KV
reticulation
32 Old Project Awaiting Funding
1 035 426
621 500 413 926
Council funding
2013
WELKOM Main intake test,
upgrade and repairs to 132KV
32 Old Project Awaiting Funding
713 664 452 000 261 664
Council funding
2013
Ensure control over remote
WELKOM Upgrade of SCADA
32 New Project Awaiting
5 600 1 600 2 000 1 000 1 000 Council 2015

123
Objectives Strategies Project/Program Required budget Funding Source
Priority
substations system Funding 000 000 000 000 000 funding
To ensure an effective and safe 132kV Distribution
network
Ensuring a sound and safe
high voltage (132kV)
distribution
WELKOM Repair r and
recomision of 20 MVA 132kV Transformer at Industries Substation
32 Old Project Awaiting Funding
2 600 000
2 000 000
600 000
Council funding
2013
WELKOM Provision and
installation 20MVA 132KV transformer at
Urania Substation
32 Old Project Awaiting Funding
9 944 000
9 944 000
Council funding
2013
19 893 090
14 617 500
3 275 590
1 000 000
1 000 000
ADMINISTRATION AND STRATEGIC PLANNING
Council benefiting from the time of use
tariffs
To upgrade and replace worn - out electrical
infrastructure
HENNENMAN Upgrading of load control
3 Old Project Awaiting Funding
932 250 932 250 0 0 0% Council funding
2013
Matjhabeng Energy Efficiency residential load management
Matjhabeng
Old Project Awaiting Funding
2 300 000
2 300 000
0 0 0 DOE and Council Funding
2013
ODENDAALSRUS
Upgrading of load control
1 Old Project Awaiting Funding
124 300 124 300 0 0 Council funding
2013
VIRGINIA Upgrading of
9 Old Project Awaiting
248 600 248 600 0 0 Eskom/ Council
2013

124
Objectives Strategies Project/Program Required budget Funding Source
Priority
load control system Virginia
Funding Funding
WELKOM Upgrading load control Welkom
32,33, Old Project Awaiting Funding
497 200 497 200 0 0 2013
Ensuring that use is made of the saving that
will be obtained with
the implementation of the time of
use tariffs that was approved by the NERSA
MATJHABENG Upgrading of remote meter
reading software for the
Matjhabeng Electrical
Engineering Services
Department
Matjhabeng
Old Project Awaiting Funding
22 600 22 600 0 0 Council funding
2013
To ensure a safe working environment
for the Electrical
Engineering Services
Department
Adherence to the
NERSA licensing
requirements in terms of adhering to the Quality of supply
regulations
MATJHABENG Conduct a Risk assessment for the Electrical Engineering
Services in terms of the OHS Act
85/1993
Matjhabeng
Old Project Awaiting Funding
186 450 186 450 0 0 Council funding
2013
To ensure that a good quality
of supply is provided to the
community
To ensure that the
Electrical Engineering
Services Department
WELKOM Quality of supply
Matjhabeng
Old Project Awaiting Funding
3,1M 1,9M 870 100
372 900
Council funding
2015

125
Objectives Strategies Project/Program Required budget Funding Source
Priority
adhere to all statutory
and machinery
requirements of the OHS
act
DISTRIBUTION LOW AND MEDIUM VOLTAGE
To ensure the effectiveness of the medium
voltage distribution networks
Ensuring sound low
and medium voltage
networks
VENTERSBURG Electrification 75
stands X1
1 New Project Awaiting Funding
9 132 046
9 132 046
0 0 Council funding
2013
HENNENMAN Electrification 11
Stands X12
3 New Project Awaiting Funding
8 978 073
8 579 374
0 398 699
Council funding
2015
Welkom Re Electrification
of Phomolong Rheeders Park X2 583 stands
35 New Project Awaiting Funding
8m 8m 0 0 Council funding
2013
WELKOM Alma
development
27,10 Old Project Awaiting Funding
13 m 4,5m 4,5m 4,5m 0 Council funding
2014
WELKOM Reyrole switch replacement
32 Old Project Awaiting Funding
124 300 124 300 0 0 Council funding
2012
VENTERSBURG 1 Old Project 202 609 202 609 0 0 Council 2012

126
Objectives Strategies Project/Program Required budget Funding Source
Priority
Replace High voltage ring feed
to Hamilton Substation
Awaiting Funding
funding
HENNENMAN Ring electrical supply 11kV Atlass Street
3 Old Project Awaiting Funding
398 699 0 0 398 699
Council funding
2014
HENNENMAN Ring electrical supply 11kV Goud Street
3 Old Project Awaiting Funding
474 713 474 713 0 0 Council funding
2013
ODENDAALSRUS
Provision and installation of a 11kV electrical
ring feed between
Hospitalpark and Eldorie
36 Old Project Awaiting Funding
847 500 847 500 0 0 Council funding
2013
ODENDAALSRUS
Upgrade electrical supply
to Du Plessis Single
36 Old Project Awaiting Funding
149 160 149 160 0 0 Council funding
2013
ODENDAALSRUS
Complete 11kV
36 Old Project Awaiting
167 805 167 805 0 0 Council funding
2013

127
Objectives Strategies Project/Program Required budget Funding Source
Priority
electrical ring feed in CBD Area (Odendaalstreet)
Funding
ODENDAALSRUS
Replace stolen 11kV Medium
Voltage Supply cable between Sub 8 and Mini Substation MS 17B Industrial
Area
35 Old Project Awaiting Funding
853 150 853 150 0 0 Council funding
2013
ODENDAALSRUS
Replace stolen 11kV Medium
Voltage Supply cable between
Sub 1A and Mini Substation MS5
36 Old Project Awaiting Funding
508 500 508 500 0 0 Council funding
2013
ODENDAALSRUS
Upgrading of overhead electrical
networks that was damaged due theft and
35,36 Old Project Awaiting Funding
2 825 000
1 356 000
1 469 000
0 Council funding
2013

128
Objectives Strategies Project/Program Required budget Funding Source
Priority
vandalism
WELKOM Ring feed Vista & Bongani Hospital
28 Old Project Awaiting Funding
2 406 448
0 0 2 406 448
Council funding
2013
WELKOM ST Helena
upgrading of cable distribution
network
32 Old Project Awaiting Funding
1 988 800
745 800 745 800
497 200
Council funding
2013
VIRGINIA Upgrading of electrical ring feed 11kV to Fauna Park
9 Old Project Awaiting Funding
1 559 965
745 800 814 165
0 Council funding
2013
VIRGINIA Upgrading of electrical ring feed 11kV to Boabab Str
9 Old Project Awaiting Funding
248 600 24 860 223 740
0 Council funding
2013
VIRGINIA Upgrading of electrical ring feed 11kV to Virginia and
Harmony
8 Old Project Awaiting Funding
775 632 372 900 402 732
0 Council funding
2013
WELKOM Upgrading of the
St Helena Electrical
distribution
32 Old Project Awaiting Funding
6 109 000
4 866 000
745 800
497 200
Council Funding
2014

129
Objectives Strategies Project/Program Required budget Funding Source
Priority
network
WELKOM DOE Electrification Extension X15
X9 Thabong Bronville Phase 5
12 New Project Awaiting
Funding Multi Year Project
5 186 000
3 943 000
1 243 000
0 DOE and Council funding
2013
WELKOM Bulk supply
Extension 15 Thabong
12 Old Project Awaiting Funding
2 486 000
1 243 000
1 243 000
0 DOE Council funding
2013
WELKOM Upgrading
medium voltage network
Flamingo park
34 Old Project Awaiting Funding
1 491 600
745 800 745 800
0 Council funding
2013
WELKOM Upgrading
medium voltage network
Stateway new Businesses
32,33 Old Project Awaiting Funding
8 136 000
3 955 000
2 825 000
1 356 000
Council funding
2014
WELKOM Upgrading
medium voltage network EXT 9
&15
12 Old Project Awaiting Funding
1 491 600
0 745 800
745 800
DOE and Council funding
2014
WELKOM Upgrading
medium voltage network Civic
32 Old Project Awaiting Funding
5 445 759
5 445 759
0 0 Council funding
2013

130
Objectives Strategies Project/Program Required budget Funding Source
Priority
Centre
WELKOM Upgrading
medium voltage network
Industrial Area
27 Old Project Awaiting Funding
3 616 000
3 616 000
0 0 Council funding
2013
HENNENMAN Replace overhead
transmission lines in Fabriek
street
3 Old Project Awaiting Funding
273 460 0 0 273 460
Council funding
2014
ODENDAALSRUS
Upgrade electrical
distribution boxes
35,36 Old Project Awaiting Funding
149 160 99 440 49 720 0 Council funding
2013
WELKOM Rehabilitation of
low voltage reticulation
Phase 1 Bedelia
33 Old Project Awaiting Funding
2 050 950
807 950 1 243 000
0 Council funding
2013
WELKOM Ext 19 LT electrical
reticulation upgrade
12 Old Project Awaiting Funding
819 117 372 900 446 217
0 Council funding
2013
ODENDAALSRUS
Upgrading of low
35 Old Project Awaiting
1 028 583
652 575 376 008
0 Council funding
2013

131
Objectives Strategies Project/Program Required budget Funding Source
Priority
voltage overhead distribution lines
Funding
WELKOM Flamingo park LT
Electrical distribution
upgrade
34 Old Project Awaiting Funding
1 225 129
621 500 603 629
0 Council funding
2013
VENTERSBURG Provision and
installation protection relays
1 Old Project Awaiting Funding
93 225 93 225 0 0 Council funding
2013
HENNENMAN Provision and
installation protection relays
3 Old Project Awaiting Funding
300 806 0 124 300
176 506
Council funding
2014
VIRGINIA Upgrading of
protection relays
4,8,9 Old Project Awaiting Funding
604 098 106 898 248 600
248 600
Council funding
2014
ODENDAALSRUS
Upgrading of protection relays
35,36 Old Project Awaiting Funding
602 855 372 900 229 955
0 Council funding
2013
WELKOM Upgrading of
protection relays
27,32,33,34,35
Old Project Awaiting Funding
1 323 439
441 146 441 146
441 146
Council funding
2014
VIRGINIA Provision and installation of
remote Electrical
8,9 Old Project Awaiting Funding
223 740 37 290 186 450
0 Council funding
2013

132
Objectives Strategies Project/Program Required budget Funding Source
Priority
metering systems
ODENDAALSRUS
Provision and installation of
remote Electrical metering systems
35,36 Old Project Awaiting Funding
362 061 229 706 132 355
0 Council funding
2013
WELKOM Provision and installation of
remote Electrical metering systems
27,32,33,34,35
Old Project Awaiting Funding
2 361 698
787 233 787 233
787 233
Council funding
2014
MATJHABENG Testing and
verification of all large electrical
consumer connections to the NRS 058
regulations in all towns by a
SANAS approved authority
Old Project Awaiting Funding
4 651 928
1 550 643
1 550 643
1 550 643
Council funding
2014
WELKOM Upgrade of
SCADA system an d the Control Room at CBD
27,32,33,34,35
Old Project Awaiting Funding
13 000 000
7 000 000
2 000 000
2 000 000
2 000 000
Council funding
2015

133
Objectives Strategies Project/Program Required budget Funding Source
Priority
Substation
90 123 088
48 081 062
24 143 091
15 898 934
2 000 000
REVENUE PROTECTION
To ensure that an effective and efficient
service is rendered
Ensuring an effective Revenue
Protection Service
VENTERSBURG Provision and
installation of a STS pre-paid
electrical meters
1 Old Project Awaiting Funding
136 730 136 730 0 Council funding
2012
HENNENMAN Provision and
installation of a STS pre-paid
electrical meters
3 Old Project Awaiting Funding
136 730 136 730 0 Council funding
2012
VIRGINIA Upgrading of STS pre-paid
electrical metering system
4,8,9 Old Project Awaiting Funding
149 160 149 160 0 Council funding
2012
ODENDAALSRUS
Upgrading of STS pre-paid
electrical metering system
35,36 Old Project Awaiting Funding
261 030 111 870 149 160
Council funding
2013
ALLANRIDGE Provision and
36 Old Project Awaiting
136 730 105 655 31 075 Council funding
2013

134
Objectives Strategies Project/Program Required budget Funding Source
Priority
installation of STS pre-paid
electrical metering system
Funding
WELKOM Pre-paid metering upgrade
27,32,33,34,35
Old Project Awaiting Funding
231 944 231 944 0 Council funding
2012
1 052 324
872 089 180 235
0 0
STREETLIGHTS
To ensure an
effective service and
adhere to road ordinances as
well SANS regulations
To ensure a sound high mast and streetlight installation
PHOMOLONG Provision and installation of
Street Lighting for main entrance
road 6013.29 meters
2,3 Old Project Awaiting Funding
1 391 466
463 822 463 822
463 822
CMIP/DC/Council Funding
2014
NYAKALONG Provision and installation of
Street Lighting for main
entrance road 1416.16 meters
36,19 Old Project Awaiting Funding
327 698 327 698 0 0 CMIP/DC/Council Funding
2013
MMAMAHABANE
Provision and installation of
1 Old Project Awaiting Funding
946 288 315 429 315 429
315 429
CMIP/DC/Council Funding
2014

135
Objectives Strategies Project/Program Required budget Funding Source
Priority
Street Lighting for main entrance
road 4089.42 meters
MELODING Provision and installation of
Street Lighting for main entrance
road 5882.04 meters
4,5,6,7,9
Old Project Awaiting Funding
1 246 303
415 434 415 434
415 434
CMIP/DC/Council Funding
2014
KUTLWANONG Provision and installation of
Street Lighting for main entrance
road 1128.54 meters
18,20,22,10
Old Project Awaiting Funding
261 143 0 0 261 143
CMIP/DC/Council Funding
2014
THABONG: NKOANE ROAD
Provision and installation of
Street Lighting for main entrance
road 6294.79 meters
16,17,26,29
Old Project Awaiting Funding
1 456 610
0 1 456 610
0 CMIP/DC/Council Funding
2013
THABONG: MANGOSUTHU
BUTHELEZI ROAD
Provision and installation of
14 Old Project Awaiting Funding
448 081 0 448 081
0 CMIP/DC/Council Funding
2013

136
Objectives Strategies Project/Program Required budget Funding Source
Priority
Street Lighting for main entrance
road 1936.4 meters
THABONG: PHAKATI ROAD
Provision and installation of
Street Lighting for main entrance
road 1959.05 meters
28 Old Project Awaiting Funding
453 322 0 0 453 322
CMIP/DC/Council Funding
2014
THABONG: NDAKI ROAD Provision and installation of
Street Lighting for main entrance
road 7225.81 meters
26 Old Project Awaiting Funding
1 672 060
0 0 1 672 060
CMIP/DC/Council Funding
2014
THABONG: MOTHUSI
ROAD Provision and installation of
Street Lighting for main entrance
road 2124.26 meters
29,31 Old Project Awaiting Funding
491 552 491 552 0 0 MIG/DC 2012
THABONG: CONSTANTIA
ROAD
30,12,14,31
Old Project Awaiting
1 329 421
1 329 421
0 0 MIG/DC 2013

137
Objectives Strategies Project/Program Required budget Funding Source
Priority
Provision and installation of
Street Lighting for main entrance
road 2124.26 meters
Funding
To ensure a safe living
environment in the previous disadvantage
areas
HENNENMAN Provision and installation of
two(2) high mast lights for
Phomolong
2,3 Old Project Awaiting Funding
900 000 450 000 450 000
0 MIG/DC 2013
VIRGINIA Provisioning and
installation of Two(2) high mast
lights in Saaiplaas
8 Old Project Awaiting Funding
900 000 450 000 450 000
0 MIG/DC 2013
VIRGINIA Provision and installation of
High mast and streetlights in
Virginia
4,8,9 Old Project Awaiting Funding
852 077 0 372 900
479 177
Council funding
2014
VIRGINIA Provisioning and
installation of Two(2) high mast lights Meloding
4,5,6,7,9
Old Project Awaiting Funding
900 000 450 000 450 000
0 MIG/DC 2013
VIRGINIA Provisioning and
7 Old Project Awaiting
4 500 1 125 1 125 1 125 1 125 MIG/DC 2015

138
Objectives Strategies Project/Program Required budget Funding Source
Priority
installation of Ten(10) high mast lights
Meloding Albany
Funding 000 000 000 000 000
ODENDAALSRUS
Provision and installation of Tenn(10) high mast lights in Odendaalsrus
Ward 35
35 Old Project Awaiting Funding
4 500 000
1 125 000
1 125 000
1 125 000
1 125 000
Council funding
2015
ODENDAALSRUS
Provision and installation of
Thirteen(13) high mast lights in Kutlwanong
10,18,20,21,22
Old Project Awaiting Funding
5 850 000
1 462 500
1 462 500
1 462 500
1 462 500
MIG/DC 2015
ALLANRIDGE Provision and installation of
Six(6) high mast lights in
Nayakalong
36 Old Project Awaiting Funding
2 700 000
675 000 675 000
675 000
675 000
MIG/DC 2015
WELKOM Five (5) High
mast lights Hani Park, Bronville
11,12 Old Project Awaiting Funding
2 250 000
562 500 562 500
562 500
562 500
MIG/DC 2015
WELKOM One (1) High
35 Old Project Awaiting
450 000 0 0 450 MIG/DC 2014

139
Objectives Strategies Project/Program Required budget Funding Source
Priority
mast lights Phomolong Ext2
Funding 000
WELKOM Seven (7 ) High
mast lights Welkom Reitz Park Ward 27
27 Old Project Awaiting Funding
3 150 000
787 500 787 500
787 500
787 500
Council funding
2015
WELKOM 26 High mast
lights Thabong
11,13,12,14,15,16,17,25,26,29,30,31
,27
Old Project Awaiting Funding
11 700 000
2 925 000
2 925 000
2 925 000
2 925 000
MIG/DC 2015
VENTERSBURG Three(3) High Mast Lights in
Mmamahabane
1 Old Project Awaiting Funding
1 350 000
337 500 337 500
337 500
337 500
MIG/DC 2015
VENTERSBURG Upgrading of streetlights
1 Old Project Awaiting Funding
150 403 0 150 403
0 Council funding
2013
HENNENMAN Upgrading of streetlights in Hennenman
Town
3 Old Project Awaiting Funding
164 076 0 164 076
0 Council funding
2013
ODENDAALSRUS
Provision and installation of streetlights
36 Old Project Awaiting Funding
248 600 248 600 0 0 Council funding
2012

140
Objectives Strategies Project/Program Required budget Funding Source
Priority
Mimosa Way
WELKOM Central park
lighting
32 Old Project Awaiting Funding
149 160 149 160 0 0 Council funding
2013
MATJHABNG Upgrading
lighting Othello Road
32 Old Project Awaiting Funding
62 150 62 150 0 0 Council funding
2013
50 800 410
14 153 267
14 136 755
13 510 387
9 000 000
ELECTRICAL WORKSHOP
To ensure that
electrical installation of
Council buildings
adhere to the SANS 10142 regulations
Testing and repair
of electrical building
installations
MATJHABENG Testing and repair
all Electrical Installation that is
property of the Matjhabeng
Municipality in terms to the
SANS10142-1 regulations
Old Project Awaiting Funding
870 100 372 900 248 600
248 600
Council funding
2014
To safeguard Council from
theft and vandalism of
property
To ensure an
effective and
efficient Electrical
HENNENMAN Provision and installation of
security systems at electrical
Substations
3 Old Project Awaiting Funding
62 150 62 150 0 0 Council funding
2012

141
Objectives Strategies Project/Program Required budget Funding Source
Priority
workshop VENTERSBURG Provision and installation of
security systems at electrical
Substations
1 Old Project Awaiting Funding
55 935 55 935 0 0 Council funding
2013
ALLANRIDGE Provision and installation of
security systems at electrical
Substations
36 Old Project Awaiting Funding
62 150 62 150 0 0 Council funding
2013
VIRGINIA Provision and installation of
security systems at electrical
Substations
4,8,9 Old Project Awaiting Funding
126 786 99 440 27 346 0 Council funding
2013
ODENDAALSRUS Provision and installation of
security systems at electrical
Substations
35,36 Old Project Awaiting Funding
131 659 83 530 48 129 0 Council funding
2013
WELKOM Substation security and remote control
system
27,32,33,34,35
Old Project Awaiting Funding
10 689 795
3 563 265
3 563 265
3 563 265
Council funding
2014
Ensure sustainable
HENNENMAN Upgrading of
3 Old Project Awaiting
310 750 62 150 248 600
0 Council funding
2013

142
Objectives Strategies Project/Program Required budget Funding Source
Priority
infrastructure substation buildings Funding
VIRGINIA Upgrading of
substation buildings
4,8,9 Old Project Awaiting Funding
932 250 186 450 372 900
372 900
Council funding
2014
ODENDAALSRUS Upgrading Main
substation
36 Old Project Awaiting Funding
124 300 124 300 0 0 Council funding
2013
ALLANRIDGE Upgrading Main
substation
36 Old Project Awaiting Funding
1 397 760
1 397 760
0 0 Council funding
2013
ALLANRIDGE Emergency work to
be done on all substation in
Allanridge
36 Old Project Awaiting Funding
248 600 248 600 0 0 Council funding
2013
WELKOM Mini-Substation Replacement
12,32 Old Project Awaiting Funding
1 357 729
452 576 452 576
452 576
Council funding
2014
WELKOM Revamp main sub
structures
32 Old Project Awaiting Funding
186 450 93 225 93 225 0 Council funding
2013
VENTERSBURG Upgrading of OCB
in distribution network
1 Old Project Awaiting Funding
1 760 000
1 200 000
560 000
Council funding
2013

143
Integrated Human Settlement The South African Government has moved its focus from simply providing shelter to establishing integrated, sustainable human settlements and providing quality housing.
Central to the provision of integrated and sustainable human settlements are the following
Outcome 8 outputs:
• Output 1 – Upgrading of informal settlements
• Output 2 – Improving access to basic services
• Output 3 – Facilitating the provision of Gap Market Units
• Output 4 – Mobilising well located public land for low- income and affordable housing
In the establishment of integrated human settlements, the Municipality will focus on the following supporting objectives:
(a) Elimination of the housing delivery backlog of units (13 931 backyard shacks and 5 6 95 informal settlements) through the provision of quality housing and the structured
upgrading of informal settlements by 2016.
(b) Addressing the fragmented spatial patterns of the past by:
b1. Revising the spatial development framework annually
b2. Prioritising social housing
b3. Acquiring strategic land
(c) Upgrading 17 informal settlements and 17 Greenfield developments by 2016.
(d) Prioritise land alienation for housing development for meddle and Higher income market segment

144
OBJECTIVE STRATEGY PROJECT/ PROGRAM
WARD STANDARD 3-YR BUDGET PROJECTION
FUNDING SOURCE
TARGET Year
PRIORITY KPI
Addressing Housing Backlog (informed by allocation from Province and Land Readiness from Matjhabeng Municipality
Facilitate the building 2000 BNG Houses per year in Matjhabeng
- To ensure that a minimum of 2000 serviced sites for low income earners (BNG) are available.
-To ensure that allocation process is evenly distributed to all units
BNG
All Existing R300 000 -Provincial Human Settlement
2016 H Progress reports from PSC
To ensure delivery of Low to Short term housing development 7000 sites – Leeubosh area
Kutlwanong Leeubosh area (after formalization of the area
22 New Project -Provincial Human Settlement
2015 M Quarterly reports
Identification of all dilapidated Council houses in Matjhabeng Units
Minimum of 100 houses to be serviced through EEDBS
All Existing Project -Provincial Human Settlement
2016

145
Minimum of 10 houses per year will be serviced through Emergency Housing Program in Matjhabeng
All Existing Project -Provincial Human Settlement
2016
To ensure that the development of Racial Integration Project in Ventersburg is sustained.
Minimum of 50 houses to be build through Racial Integration Project
Ventersburg New Project -Provincial Human Settlement
2012/13
Expedite the process of Land Restitution by engaging Provincial Human Settlement Effectively
-355 identified beneficiaries in Henneman will be serviced.
-455 identified beneficiaries at Eldori will be serviced.
-5 Incomplete structures in
2,
36,
1,
New Project
New Project
New Project
-Provincial Human Settlement
2016

146
Mmamahabane must be completed
Obtain Accreditation
Capacity Building of Housing Personnel(Training and Re-training for the compliance with the Housing Sector Plan and relevant legislation
MLM be appointed as a Custodian for capturing, verifications & approvals of beneficiaries.
All New Project -Provincial Human Settlement & National
2016
Release Serviced Land
To ensure delivery of 3000 serviced sites middle / high income areas in every financial year for the whole of Matjhabeng.
-1100 Middle / High income serviced sites will be issued in T16 (Jerusalem Park)
-65 sites –Middle to High income area will be developed. Virginia Village Remainder
25,
9
New Project
New Project
Housing Institutions, PPP & Human Settlement.

147
Erf 5542 portions of subdivision 3 & 3 of Farm Harmony 222
Avail a minimum of 20 sites for , Commercial & Social purposes
Naudeville X2 (318),Rheederpark X1 (34) &,Flamingo Park X2(488) & Flamingo Park (52) , Bronville X9 (90)
32,34,11 Existing Project -Housing Institutions, PPP
2016 H
Management of Rental Stock
Purification of rental data for every financial year.
-To verify tenants information by physical visits to all the rental dwellings,
4, 14,15 29,30,31,
Existing Projects 100 000 MLM 2016
-Refurbishment of Community Residential Units.(CRU)
-144 units D Hostel Thabong to be renovated
- Moeletsi Hostel
30
31
Existing Project
Existing Project
-Provincial Human Settlement
-Provincial Human
2016
2016

148
Sewer System to be upgraded and maintained.
-re-build new hostels that were demolished in 2006 Meloding
4
Existing Project
Settlement
-Provincial Human Settlement
2016
--infill and use of surrounding unmaintained area for further additional units of blocks or semi-detached units.
-Long Road erf (8141),
Concor Brn (erf 12)
& F hostel (8172)
32,11,31 Existing Project -Provincial Human Settlement
2016
To ensure that Buildings that are not specifically used for residential purposes within the CRU be developed and used for social and commercial activities
Unused buildings in A,B,C, Moeletsi, Rathaba and Meloding be developed by interested members of the Community
30,31,4 Existing Project R200 000 MLM 2014

149
.
Identify and transfer of Municipal Economic houses
10 Municipal Economic Houses be transferred to current occupants in Rieebeckstad
10, Existing Project -MLM 2016
Selling of personnel houses
32 personnel houses to be sold
27,32,33, Existing Project MLM 2013
To manage, monitor and evaluate the implementation of all housing administrative issues (Security of Tenure)
To identify and ensure that all Council houses in Matjhabeng units are transferred to current occupants.
Minimum of 500 houses are being transferred through Enhanced Extended Discount Benefit Scheme (EEDBS)
All Existing Project -Provincial Human Settlement
2016

150
GOOD GOVERNANCE AND PUBLIC PARTICIPATION
Good corporate governance underpins all the programmes and projects presented in this IDP. Good governance dictates that the Municipality should conduct its business in an
open, transparent and accountable manner. For this to be realised, community participation is essential. The establishment of a caring environment requires emphasis not only
on community participation, but also on customer care and responsiveness. With regard to customer care, the Municipality has embarked on a programme to engage
customers with regard to their level of satisfaction with municipal services and the development of a new Customer Care Framework. In the current IDP review period,
foundational work has to be done in terms of the completion of a comprehensive survey of all types of customers. Soon thereafter, the focus will shift to embedding a robust
system of customer relations management, anchored in clear service standards, customer responsiveness, and the monitoring and evaluation of ongoing customer perceptions
and feedback. The revival of the Batho Pele Campaign will complement this effort and galvanise the institution in embracing a culture of putting people first.
Information and Communications Technology ICT plays an important role in supporting service delivery. In this regard, it is vital that the Municipality bridge the so-called digital divide, so that residents will have access to
digital technology, affordable high speed internet and voice services. This will enhance the competitiveness of the Municipality. The ICT focus will remain on strengthening the
ICT governance framework, including paying attention to protecting the institution’s ICT network in the face of growing and sophisticated security threats, extending the reach
of ICT services offered by the Municipality to communities to better enhance access to municipal services and, in the process, building on continuing efforts to bridge the digital
divide and laying the foundation for a knowledge economy in the city. Other areas of focus are the development of ICT Disaster Recovery Plans and Business Continuity Plans
to ensure the uninterrupted supply of services during disasters and operational down-times.
Key supporting objective of this section is to maintain and develop ICT infrastructure which is up-to-date and capable of supporting our service delivery mandate.

151
Legislative compliance and corporative governance Local government operates in a legislative environment, which highlights the importance of compliance. In this regard, the Municipality’s Legal and Internal Audit Services
business units play a central role. In addition to this units, the
Municipality has a functional Audit Committee. The challenges that confront the Municipality require a co-operative approach with other spheres of government, parastatals,
institutions of higher learning and other relevant stakeholders. Furthermore, inter-municipal and international linkages provide the Municipality with an opportunity to share
knowledge, experiences and best practices.
Public participation
Community participation in planning and decision making is a key priority of the Matjhabeng Local Municipality. This involves among others:
Creating an enabling environment for public participation in the planning and decision-making processes of the Municipality.
Promoting Ward Committee involvement in municipal governance
Special Programmes
The Municipality should develop an institutional framework to coordinate the special programes (Gender, Youth and Disability). In addition, it is the responsibility of all
directorates to ensure that special programmes are central to planning, budgeting and implementation of projects and programmes. The empowerment of youth, women and
people with disabilities is imperative. This is achieved through a number of initiatives, which include the following:
Supply Chain Management processes
Entrepreneurial support and skills development (youth, women and people with disabilities)
Learnership and Internship Programmes
Early childhood development
HIV and AIDS programmes

152
Programmes assisting vulnerable groups, e.g. orphans
Youth development
Youth development is one of the key strategic priority areas of the Municipality. Issues of poverty and unemployment affect the youth of our country, and Matjhabeng in
particular remain central to our developmental agenda .
Key interventions in this regard include the following:
Establishment of a Youth Unit in the first quarter of the 2012/13 financial year
Providing support in hosting a Youth Summit by August 2012
Review of youth policies to ensure that they promote youth development
Increasing the number of youth participating in job creation and Development
Youth economic participation

153
OBJECTIVE STRATEGY PROJECT WARD STANDARD 3-YR BUDGET PROJECTION
FUNDING SOURCE KPI
Implementation, Monitoring and Evaluation
Monitor compliance with the provision of bill of Rights and other legislations
Policy and Strategy formulation for all Five Focal Points
New project 2M Copex On – going
Youth and Local Economic Development
Undertake SMME’s ,Agricultural, Tourism, Capital projects and Skills Development
Youth Empowerment
All New Project 15M Copex On- going
Provision of the establishment of MLM Youth Development Forum
Create a conducive platform for youth to participate in MLM Youth Development Programmes
Establishment of MLM Youth Development Forum
all New Project 3M Copex On-going
Promote inter-cultural and social cohesion activities
Engagements with Arts and Cultural groups to host an annual arts and culture event
Matjhabeng Arts and Culture Festival
New Project 3M Copex On-going
Implementation of AIDS Strategy in MLM
Roll out of National and Provincial AIDS Strategy
Operational Activities of AIDS Council
On –Going 3M Copex and other Stakeholders
-

154
Lobbying and advocacy
Mobilize for the plight of the focal points and commorate the national days of those groups(children, disability ,erderly and gender)
National Days Celebrations
On –Going 5M Opex
Special Programme
Assist the destitute People within the MLM
Mayoral Social Responsibility
On – Going 3M Opex -
Upgrade and maintain ICT infrastructure
Liaise with SITA on implementation of government wide webpage development
Website development, disaster recovery centre
High 2 M Opex
Functional website and a functioning disaster recovery centre
Commission an IT audit to determine the requirement
Upgrading of main servers and network infrastructure
High 8 M Copex
Audit report and installation of main servers
Provision of effective Council admin services
Schedule of council and its committee meetings,
Proper institutional records management
Ongoing High
Opex
Opex
Schedule of council meetings
100% Compliance with National Archives standards

155
KPA
Building effective municipal communications, marketing and branding strategy
Outcome: Effective, efficient and responsive communication tools
Key Focus Area: COMMUNICATIONS, BRANDING AND MARKETING
Budgetary projections(R‘)
Objective Strategy Project Ward/ BUSINESS UNITS
Standard budget projection
Funding source
Target KPI
Building effective municipal communications, marketing and branding strategy
Collate municipal information and build it into an all-accessible 24/7 portal updated on daily basis
Build a comprehensive online depository municipal information
All New project
2 M MLM 01 July 2012 Satisfies GCIS conditions & guidelines and have website starting to run the 1st of July 2011
Effective involvement of all sectors and public participation drive for adoption
Municipal Communications Policy and Communications Strategy Implementation
All Complimentary project
500,000
MLM Beginning of July 2012
All milestone as outlined in the communications implementation plan achieved
Comprehensive campaign plan for each of the municipal campaigns per departmental programmes
Implementation and management of campaigns
all New projects 2M MLM On-going per departmental quarterly submission
Campaign reach and impact analysis report and results of study undertaken

156
Effective management and use of appropriate communication channels
Development of appropriate communicational channels to raise awareness of and support for all layers of government in particular municipal department’s campaigns and objectives
All New project 5M MLM 100% implementation of the municipal media relations programme including creative and cost effective deployment of a variety of marketing channels
Quality and quantity of media coverage and engagement including samples of communication collateral developed, produced and distributed.
Internal and external communication plane developed and implemented
Establishment of an internal newsletter to build and sustain a positive image of the municipality and boost employees morale
All New and on-going
1,M MLM 4 Annually one per quarter
Information provided on the website; report on public participation programmes; samples of communication material developed and produced
Provision of adequate office and operational infrastructure to the Matjhabeng Local Municipality
Make a determination of office accommodation needs of Political arm of the municipality
Building of new Council Chambers and office block
New 8 M Copex 2015 New building

157
MUNICIPAL TRANSFORMATION AND ORGANISATIONAL DEVELOPMENT People-focused municipal transformation and organisational development is central to service delivery, hence the emphasis on the implementation of Batho Pele principles in
all municipal structures, systems, procedures, policies and strategies.
The continuous development of the Municipality’s human resources is key in this regard. Furthermore, the Municipality needs to constantly review and improve the way in
which it delivers services and develops appropriate methods and
mechanisms. Important, the Municipality is entrenching itself as a learning organisation, with the emphasis on knowledge management. During the 2010/11 financial year, the
Municipality took stock of its current level of service delivery and performance and identified the challenges facing the institution. This culminated in the development of a
Municipal Turnaround Strategy, with the following objectives:
The restoration of confidence in the Matjhabeng Local Municipality as the primary service delivery arm of government that is effectively addressing community
concerns.
The provision universal service delivery to all communities of Matjhabeng.
Addressing the key socio-economic challenges in Matjhabeng, especially unemployment and poverty.
Developing a shared agenda for the growth and development of Matjhabeng.
Understanding and managing institutional risks.
Ensuring a fraud- and corruption-free Municipality.
Ensuring good corporate governance and an accountable and performance driven institution, which is focused on service delivery?
Ensuring that all municipal planning, budgeting and decision-making processes are embedded in public participation and community involvement.
Restoring the human dignity of the residents of Matjhabeng, especially in the disadvantaged areas/wards.
Ensuring sound financial management and sustainability.

158
Ensuring a joint intergovernmental approach to implementing this Turnaround Strategy.
In the 2012/13 financial year and beyond, the implementation of the Strategy will be prioritized, monitored and reported. Strategic planning and integration As reflected in the introductory chapter, the IDP is one of the key strategic tools for integration in the Municipality. This integration and co-ordination should be clearly evident
during the implementation of the IDP and during service delivery. Key tools to achieve integration and co-ordination include the Integrated Human Settlements Plan,
sustainable community planning methodology, City Development Plan and other plans.
Underpinning all activities of the IDP and other integration and co-ordination tools is a longer-term City-wide Development Vision (2030). The formulation of such a Strategy
has commenced and will provide strategic direction for a period of up to 20 years.
One of major programmes in this 3rd Generations of Democratic Local Government is establishment of functional Performance Monitoring, Evaluation and Reporting as well as
Knowledge Management to improve and encourage innovation.

159
Strategic Support Services
Key Focus Area: MUNICIPAL TRANSFORMATION AND ORGANISATIONAL DEVELOPMENT
Budgetary projections(R‘)
Objective Strategy Project Ward Standard Priority Total Budget Funding source
Target Year KPI
To develop a people-centred IDP that meets legislative requirements and promote integration
Develop annual IDP review process plan
Annual review of the IDP
All On going high 500 000 Opex 2013
Develop and implement an IDP Process Plan
Development of socioeconomic ward profiles and ward plans for all 60 wards, including an audit of social infrastructure backlogs in disadvantaged areas
Social Study All New High 100 000 Opex 2013 36 profile complete

160
Performance Monitoring, Evaluation and Reporting as well as Knowledge Management to improve and encourage innovation.
Establishment of Performance Monitoring, Evaluation unit located in the office of the Municipal Manager
Performance Monitoring, Evaluation unit
New High 20000 Opex 2013
Appointment of personnel
Innovation and knowledge management
Research, innovation and knowledge management,
New High 20000 Opex 2013
Appointment of personnel
To monitor and evaluate the implementation of the Integrated Development Plan (IDP) and Budget, in line with municipal goals and five year Local Government Strategic Agenda implementation plan
Development of SDBIP
ongoing high N/A N/A 2013 Timely approval of SDBIP

161
Key Focus Area: MUNICIPAL TRANSFORMATION AND ORANISATIONAL DEVELOPMENT
Corporate Services
Objective Strategy Project// Programmes Ward Standard/Baseline Priority Total
Budget Funding source
Target Year KPI
Individual PMS Develop IPMS policy nil High I/F 2013 Approved policy
Skills Development Develop WSP Review current WSP
High Operational I/F 2013 Approved annual WSP
Provide Legal Support Services
Provide Legal advice, Contract Management and Minimise litigations
Ongoing High R5m I/F 2013
Legal Opinions and 20% reduction on litigations
Ensure Human Resource Management
Development and implementation of Job Description Policy,
Finalisation of organisational structure
Improve staff morale
Draft policy in place, Review organisational
Structure, LOW
High Operational
R2m I/F 2013
Approved job Description Policy, Approved Organisational Structure,
Team building sessions
Municipal Transformation
Policy reviewal and promulgation of by-laws
Ongoing High Operational;
I/F 2013
Approved Policies and

162
R500 000. Promulgated by-laws
Render effective customer care
Customer satisfaction survey and Develop Customer Care policy
nil High Operational I/F 2013
Customer care survey and approved customer care policy
Maintain sound labour relation Revive LLF Ongoing High Operational I/F 2013
Number of LLF meetings held.
Compliance with OHS legislation
Comply with OHS regulations and procedures
Ongoing High Operational I/F 2013
Functional OHS committees

163
Financial Sustainability and Viability
The fact is Matjhabeng Municipality is currently faced with serious challenge of addressing service delivery backlog, it is also faced with financial challenges. Financial woes of
Matjhabeng are exacerbated by poor revenue and high levels of debts by clients. MLM has been under-collecting on revenue in the last five financial years. At the same time,
the Municipality has a huge debtor’s book of more than R1.1bn. Of this debt half-a-billion (R500 million) is older than 30 days. It has been noted that plans for financial
sustainability are frustrated by poorly defined and ineffective municipal management; lack of internal controls and systems, and declining financial resources . The lack of
effective internal controls has also led to underspending of Grant Funding meant for service delivery.
Objective Strategy Project Ward Standard 3-yr budget projection
Funding source Target KPI
Improve employee morale
Recognition of outstanding performances
Developing a recognition system which is aligned with the HR policies
All New Project 0 NA Ongoing Number of recognition
and rewards issued
Training and coaching
Perform a skills audit/ evaluation, identification of relevant training, in house coaching, Appointing accredited training providers
All New Project 150 000 MLM, NT Ongoing Number of training and
couching attended
To obtain a clean audit
Implementation and adherence to policies and procedures
Review, develop and implementation of policies and procedure manual for all finance policies and work shopping thereof. Implementation of Audit Query Action Plan
All New Project 150 000 MLM 2014
Monthly progress report on Audit Query Action Plan & Audit outcome.
To practice sound and sustainable financial management
Increase awareness on finance policies Implementation of
Work shop departments on finance policies to ensure compliance, develop an AFS action plan, Budget
All Annual Projects 0 NA Ongoing
Timeous submission of budget, AFS and audit outcome.

164
Objective Strategy Project Ward Standard 3-yr budget projection
Funding source Target KPI
action plans, financial accounting and internal controls as per professional standards, financial management to form part of strategic communication
time table, audit query action plan, review and update financial accounting and internal controls, monthly publicising of financial reports on share drive.
To plan, prepare and approve a credible municipal budget timeously
Strict adherence to IDP/ budget time table Timely consultation with internal and external stakeholders
Develop budget timetable as per National Treasury requirements. Conduct internal and external stakeholders
All Annual 0 NA 31 Aug 31 May
Approval of time table and budget by Council.
To practice sound and sustainable financial management
Calculating of financial ratio’s on a monthly basis, comparison of baseline and report deviations with recommendations. Compiling monthly age analysis Monthly clearing of suspense accounts Review all budget related policies, Implementation and adherence to budget time table,
Review and establishing of reporting framework in line with legislation
All Annual project 3 ,6M MLM Ongoing
AFS,Audit Report, Budget, Section 71,52,72 reports

165
Objective Strategy Project Ward Standard 3-yr budget projection
Funding source Target KPI
AFS action plan, Audit query action plan.
Ensure timely procurement of supplies
Departmental needs analysis
Constant interaction with all departments and units, adherence to SCM policy and regulations
All Annual project 900 000 MLM Ongoing
Monthly reports, minutes of bid committee meetings
Obtaining value for money
Performance appraisals on all tenders awarded. Payment on actual work performed
Physical verification of work done by requesting departments. Determine adherence to specifications and quality of work done. Payments made on progress reports, with supporting documentation.
All New project 0 NA Ongoing Monthly reports, Audit outcome
To ensure safe keeping of documents.
Storage and safekeeping of supporting documentation Monthly voucher audits
Archiving function
All Annual Projects 1 M Opex Ongoing Monthly document
audit
GRAP Municipal Asset Register
Developing and monthly updating of asset register
Monthly asset verification All Annual
Project 500 000 Opex Ongoing Monthly reports & audit outcome
Timely submission of annual financial statements
Ensure accurate and timely monthly and quarterly reporting
Implementation and adherence to AFS action plan Training of relevant staff on AFS.
All Annual project 3, 6M Opex Ongoing Monthly reports and
AFS
Effective and efficient
Encourage suppliers to submit
Perform monthly reconciliations,
All Annual 0 NA Ongoing Monthly
reconciliation,Age

166
Objective Strategy Project Ward Standard 3-yr budget projection
Funding source Target KPI
expenditure control
relevant documentation on time
reprioritization of all expenditure in line with MFMA, Perform monthly outstanding order audit
analysis
To increase our revenue earning capacity and collection
To increase the Revenue base of the municipality through the valuation of all properties. Adjustment of all rentals on municipal properties to market related Quarterly unit visits
Performance and updating of Valuation on all municipal properties Revaluation of municipal rental properties Funding of consumer education: 1. Educate indigent in
responsible consumption.
2. Educate and encourage consumers to pay for services.
Identification and registration of reposed properties into municipality’s name. Disposal of assets which
All
New project/ annual project
R500 000 Opex
Ongoing/ 31 June 2013
Monthly reports % billing queries Monthly Pay rate

167
Objective Strategy Project Ward Standard 3-yr budget projection
Funding source Target KPI
Perform a cost benefit analysis of all properties repossessed by the municipality
are costly to maintain and derive no value.
To practice sound and sustainable revenue management
Accurate consumer data base and valuation roll. Daily and monthly debtors balancing, reconciliations
Data purification Implementation of internal controls and key control matrix
All Annual project 1 M Opex
31 June 2013 and ongoing
% billing queries Pay rate
Recovery of a portion revenue from bad debt
To identify a reliable and competent debt book buyer
Selling of Debt book
All New project 31 June 2013
Age analysis Recovery rate
Reducing the risk of non collection of revenue from billing
Ensuring accurate and reliable billing
Debt Factoring
All New project 31 June 2014 Pay rate
To increase payment levels to 75%
Register all indigent households
Compile a comprehensive register which is updated monthly
All New project 1 ,5M Opex 31 June 2013 Pay rate
Deliver accurate bills timely
Upgrade and maintain an effective financial system All New project 2 M Opex 31 June
2014 Pay rate
Improve financial enquiry desk
Training of enquiry staff and improve the front offices
All New project 1, 5M Opex 31 June 2014
% billing queries
Strict adherence to Credit Control
Work shopping of credit control policy amongst All Annual
project 500 000 Opex 31 June 2014 Pay rate

168
Objective Strategy Project Ward Standard 3-yr budget projection
Funding source Target KPI
Policy Develop debt collection strategy
credit control and revenue staff Taking legal action against defaulters Operation betaal
To increase the revenue generated by the FPM
Developing a financial management strategy and a turnaround strategy for transformation
Consultation with stakeholders Renting out of space and equipment to full capacity. Improve access control Limiting losses Create a safe environment Monthly meetings
All New project 1 ,2M Copex 2015 Market income
Local Economic Development
Local economic development is a dynamic and sustainable process, which creates wealth and raises living standards. This
has a number of implications, including increased entrepreneurial and business activity, as well as the improved material
status of citizens through access to resources and basic services. The Municipality’s Economic Development Framework seeks
to improve the our global competitiveness and simultaneously eradicate poverty. Effectively, this Framework should
recognises that Matjhabeng is part of the global economy and also needs to ensure that it creates a safety net for the poor.

169
FACILITIES MANAGEMENT DIVISION
OBJECTIVE STRATEGY PROJECT/PROGRAMME WARD STANDARD 4-YR BUDGET PROJECTION
FUNDING SOURCE
PRIORITY
L/M/H
TARGET
Optimise efficient and effective utilization of all Municipal Facilities.
Upgrading of all Municipal Facilities.
Upgrading and refurbishment of Welkom Airport
24 Existing 3,000,000 MLM H Project to be completed by end of FY 2012/2014
1.Upgrading of infrastructure for SMME Incubation Hub (Industrial Park SMME Zone Fencing/paving & shelter)
2.Upgrading of SMMEs facilities
(Renovation of old stalls and establishment of new ones in Welkom, Henenman and Virginia)
32
3,11,24,35
Existing 8,000,000 MIG H Project to be completed by end of FY 2012/2014
Marketing & Branding Municipal Facilities
Municipal Taxi Ranks, SMME Kiosks, Welkom Show ground, Welkom Aerodrome
Matjhabeng
New Project 3,000,000
MLM M Project to be completed by end of FY 2012/2015

170
TOURISM
OBJECTIVE STRATEGY PROJECT WARD STANDARD 4-YR BUDGET PROJECTION
FUNDING SOURCE
PRIORITY
L/M/H
TARGET
Positioning of Matjhabeng as destination of choice
1.Marketing of Tourism Products 1. 1 Tourism Route Development
1.2 Destination Branding
1.3. Develop tourism strategy
All Existing 2 000 000
MLM H 2017
2. Development of Tourism Sites and Products
2.1 Redevelopment of Welkom Showgrounds
All 10 000 000
External Funding
H 2013 to 2018
3. Development of Heritage Sites 3.1 Upgrading of historical sites
All New Project 2 161 241
MIG H 2013 to 2014
4. Strengthening partnership with relevant stakeholders
4.1Collaborative initiative
4.2 Cooperation with partner institution
e.g. ILO and TEP partnerships
N/A
Promoting Agri-Tourism initiatives Partnering with external stakeholders and funders

171
PROJECT MANAGEMENT SECTOR
Objectives
Strategies
Project/Program
Ward no
Standard
Ex/New
4 Year Budget Allocation
Funding Source
Priority
H/M/L
Target
Identify maintain existing and develop new infrastructure/property of Matjhabeng Local Municipality which will add value to the economic development in the region
Establishment of Livestock Pound Facility and availing an auction centre for local farmers
Building of a Livestock Pound
23 New project
R1,9 million
Matjhabeng Municipality
H 2012
Upgrading of infrastructure for emerging farmers
Commonage infrastructure development (water, toilets and roads)
3,11,24,35
R1 191 026 MIG L 2013 to 2014

172
Objectives Strategies Project/Program Ward Standard
Ex/New
4 Year Budget Allocation
Funding Source
Priority
H/M/L
Target
AGRICULTURE
Creation of suitable environment for sustainable agricultural production.
Acquire suitable grazing and arable agricultural land
Promoting land reform programmes (Welkom, Allanridge and Odendaalsrus)
3,11,24,35
Existing N/A External H 2014
Identification and facilitation of agro-processing and value adding projects.
Promoting value adding/agro processing initiatives
4 Existing 1800 000 Operational
M 2017
Empowering farmers with skills
Facilitate workshops, sourcing allocation of land
Identify and provide suitable land for agricultural projects
All Existing 200 000 Operational M 2015
TRADE AND INVESTMENT SECTOR
OBJECTIVE STRATEGY PROJECT/ PROGRAM WARD STANDARD EX/NEW
4 Year Budget Allocation
Priority
H/M/L
FUNDING SOURCE
TARGET
Create an enabling environment for booking trade and investment in Matjhabeng Local Municipality
Conduct research on mechanism for retaining existing investors
Develop the trade and investment strategy
All New R15m H MLM 2017
Develop requisite policy and regulatory instruments for attracting
Identify and acquire requisite land parcels for potential investors
All New R1.5m H MLM 2013

173
and retaining investment
Develop industrial strategy to include industrial parks in townships
New 300 000 H MLM 2013
MINERALS AND ENERGY SECTOR
Stimulate and promote small scale mining within Matjhabeng Local Municipality
To facilitate the planning and the implementation of the Mining Social Plans
Revival of commitments within the social labour plan. 1. Showground 2. Virginia Farm
9,23. Existing
N/A MLM H 2013
To facilitate the development of identified Small Scale Miners
Capacitating Small Scale miners.
Matjhabeng.
Existing
R200 000 MLM H 2013
Promote Gold jewelry manufacturing in Matjhabeng.
(Virginia jewelry School)
Economic development in mining and job creation
Matjhabeng
Existing
N/A. MLM M 2013
Develop community infrastructure (Projects) and create a platform for private investment in order to improve quality life in townships.
To stimulate the economic growth of previously disadvantaged townships.
Development of Township Regeneration Strategy (NDPG)
Matjhabeng
New Project R14.5 M (R0,500m for 12/13 FY)
National treasury
H/M On going

174
To contribute to the creation of decent employment opportunities for historically disadvantaged population groups in Free State Province.
To nurture a stronger culture of entrepreneurship among the population of the Free State Province.
To create a more conducive policy, legal and regulatory framework (PLRF) for the start-up and operations os SMEs in the Free State Province.
To strengthen the capacity of local organization to provide sector-specific business development services (BDS) geared towards SMEs at community level.
To stimulate BDS uptake among prospective and emerging entrepreneurs and their employees living and working in these communities.
Free State SME Development Initiative
Matjhabeng
3 year programe, Initial funding in terms of euro’s 4’498’000. The budget allocated for two Municipalities (Mangaung & Matjhabeng) and will be linked to a specific activity.
Flanders International Cooperation agency (FICA)
High 2011-2014. Historically Disadvantaged Population in Free State , targeting the following sectors: - Construction - Tourism - Agri Business - Social Services (Waste) - Education (recent)
Facilitate the establishment, development and suport of corporatives in Matjhabeng Area
Adopt coparetives as part of Mayoral Projects
New project 50,000 High Opex 3 Corparattives per annum

175
DEVELOPMENT PLANNING
To monitor and promote economic growth in Matjhabeng
Determine terms of reference
Advertise tenders for the appointment of a consultant
Adjudicate tenders
Appointment of consultant
Analysis and report
Growth and Development Strategy for Matjhabeng
Matjhabeng New 1000000
Operational H
To foster and promote the integrated spatial development of Matjhabeng
Development of a legal and policy framework to guide the compilation of the integrated spatial development framework
Adjudicate tenders
Define terms of reference.
Appointment of consultant.
Spatial Development Framework Phase 1, 2 and 3
Matjhabeng Ex 1000000 Operational H
To coordinate harmonious spatial development
Analyze spatial needs for all land uses in Matjhabeng
Development of Strategies for Land Use

176
a) Re- evaluation of the CBD Strategy
32 New 500000 Operational H
To ensure the effective establishment of alienable erven in Matjhabeng
Oversee Township establishment applications in various areas of Matjhabeng
Planning and pegging of erven
a) Residential (7000 erven) – 10 areas
1,3,4,22,25 Ex
10000000 COGTA H
b) Commercial (6 areas 100 erven)
Matjhabeng Ex 1400000 Operational H

177
CHAPTER EIGHT (8) HIGH LEVEL SPATIAL DEVELOPMENT FRAMEWORK MATJHABENG IN SPATIAL CONTEXT 1.1 THE FREE STATE PROVINCE The Free State Province is one of nine provinces in South Africa and is centrally located in terms of the geographic distribution
of South Africa. The Free State represents 10.6% of the total land area of South Africa (Census 2001). The province covers an
area of 129 464 km2, and had a population of 2.7 million in 2001.

178
(Source: Free State Provincial Growth and Development Strategy; 2005 to 2014)


180
and the Northern Cape to the west (IDP Review, 2004/2005).The Lejweleputswa District, the Goldfields, is situated north of
Mangaung Municipality in the Free State Province. It is accessible from Johannesburg, Cape Town, Klerksdorp and Kimberley
(Lejweleputswa District Economic Development Strategy).
(Source: Leweleputswa District Economic Development Strategy, p10) Lejweleputswa is surrounded by:
Dr Kenneth Kaunda District in North West to the north (DC40)
Fezile Dabi to the north-east (DC20)
Thabo Mofutsanyane to the south-east(DC19)
Mangaung Metropolitan to the south
Xhariep to the south-west (DC16)
Frances Baard in Northern Cape to the west(DC9)
Bophirima in North West to the north-west(DC39)
Coordinates: 27°58′S, 26°44′E (Source: Draft Leweleputswa GDS 2006, p6)
The image part with relationship ID rId10 was not found in the file.

181
The district comprises the following 5 municipalities and covers an area of 31686 square kilometres:
Masilonyana Local Municipality consisting of the following towns: Theunissen, Brandfort, Winburg, Soutpan and
Verkeedevlei
Matjhabeng Local Municipality consisting of the following towns: Welkom, Virginia, Odendaalsrus, Hennenman,
Ventersburg and Allanridge
Nala Local Municipality consisting of the following towns: Bothaville and Wesselsbron
Tokologo Local Municipality consisting of the following towns: Boshof, Dealesville and Hertzogville
Tswelopele Local Municipality consisting of the following towns: Bultfontein and Hoopstad.
1.3 MATJHABENG MUNICIPAL AREA
The Matjhabeng Municipal area, previously known as the Free State Goldfields, consists of the following towns:
Welkom/Thabong Allanridge/Nyakalong Odendaalsrus/Kutlwanong Hennenman/Phomelong Ventersburg/Mmamahbane Virginia/Meloding

182
The area is favourably located in the north-eastern Free State about 250 km south of Johannesburg and 160 km north of
Bloemfontein. The nearest harbour is Durban approximately 565 km from Matjhabeng by road.
(Source: Matjhabeng Municipality)
2. THE LEGISLATIVE ENVIRONMENT FOR SPATIAL DEVELOPMENT
There are various legislative frameworks at national, provincial and local government level that influences spatial development.
These include over arching legislation e.g. the Constitution to more sector specific legislation e.g. the National Land and
Transport Transition Act and National Environmental Management Act. In the context of this document the following are
important:
2.1 Development Facilitation Act 67/1995

183
The Development Facilitation Act set the tone for subsequent legislation concerning land development.
The principles set in Section 3 are:
3. (1) The following general principles apply, on the basis set out in section 2, to all land development:
(a) Policy, administrative practice and laws should provide for urban and rural land development and should facilitate
the development of formal and informal, existing and new settlements.
(b) Policy, administrative practices and laws should discourage the illegal occupation of land, with due recognition of
informal land development processes.
(c) Policy, administrative practice and laws should promote efficient and integrated land development in that they-
(i) promote the integration of the social, economic, institutional and physical aspects of land development;
(ii) promote integrated land development in rural and urban areas in support of each other;
(iii) promote the availability of residential and employment opportunities in close proximity to or integrated with each
other;
(iv) optimise the use of existing resources including such resources relating to agriculture, land, minerals, bulk
infrastructure, roads, transportation and social facilities;
(v) promote a diverse combination of land uses, also at the level of individual erven or subdivisions of land;
(vi) discourage the phenomenon of "urban sprawl" in urban areas and contribute to the development of more
compact towns and cities;
(vii) contribute to the correction of the historically distorted spatial patterns of settlement in the Republic and to the
optimum use of existing infrastructure in excess of current needs; and
(viii) encourage environmentally sustainable land development practices and processes.
(d) Members of communities affected by land development should actively participate in the process of land
development.
(e) The skills and capacities of disadvantaged persons involved in land development should be developed.
(f) Policy, administrative practice and laws should encourage and optimise the contributions of all sectors of the
economy (government and non-government) to land development so as to maximise the Republic's capacity to
undertake land development and to this end, and without derogating from the generality of this principle-
(i) national, provincial and local governments should strive clearly to define and make known the required
functions and responsibilities of all sectors of the economy in relation to land development as well as the
desired relationship between such sectors; and

184
(ii) a competent authority in national, provincial or local government responsible for the administration of any law
relating to land development shall provide particulars of the identity of legislation administered by it, the posts
and names of persons responsible for the administration of such legislation and the addresses and locality of
the offices of such persons to any person who requires such information.
(g) Laws, procedures and administrative practice relating to land development should-
(i) be clear and generally available to those likely to be affected thereby;
(ii) in addition to serving as regulatory measures, also provide guidance and information to those affected thereby;
(iii) be calculated to promote trust and acceptance on the part of those likely to be affected thereby; and
(iv) give further content to the fundamental rights set out in the Constitution.
(h) Policy, administrative practice and laws should promote sustainable land development at the required scale in that
they should-
(i) promote land development which is within the fiscal, institutional and administrative means of the Republic;
(ii) promote the establishment of viable communities;
(iii) promote sustained protection of the environment;
(iv) meet the basic needs of all citizens in an affordable way; and
(v) ensure the safe utilisation of land by taking into consideration factors such as geological formations and
hazardous undermined areas.
(i) Policy, administrative practice and laws should promote speedy land development.
(j) Each proposed land development area should be judged on its own merits and no particular use of land, such as
residential, commercial, conservational, industrial, community facility, mining, agricultural or public use, should in
advance or in general be regarded as being less important or desirable than any other use of land.
(k) Land development should result in security of tenure, provide for the widest possible range of tenure alternatives,
including individual and communal tenure, and in cases where land development takes the form of upgrading an
existing settlement, not deprive beneficial occupiers of homes or land or, where it is necessary for land or homes
occupied by them to be utilised for other purposes, their interests in such land or homes should be reasonably
accommodated in some other manner.
(l) A competent authority at national, provincial and local government level should co-ordinate the interests of the
various sectors involved in or affected by land development so as to minimize conflicting demands on scarce
resources.
(m) Policy, administrative practice and laws relating to land development should stimulate the effective functioning of a
land development market based on open competition between suppliers of goods and services.

185
2.2 Municipal Systems Act, 32/2000.
The Municipal Systems Act, (Act 32, 2000) obligates all municipalities to prepare an Integrated Development Plan (lDP) as
the primary and overriding management tool.
As an integral component of the lDP the SDF must also adhere to the requirements of the Local Government: Municipal
Planning and Performance Management Regulations, 2001.
The content of a Spatial Development Framework is spelled out in terms of the Local Government: Municipal Planning and
Performance Management Regulations, 2001 (Government Notice 22605, 24 August 2001) which stated in regulation 2 (4)
that:
2(4) A spatial development framework reflected in a municipality’s Integrated Development Plan must
(a) give effect to the principles contained in Chapter 1 of the Development Facilitation Act, 1995 (Act No. 67 of
1995);
(b) set out objectives that reflect the desired spatial form of the municipality;
(c) contain strategies and policies regarding the manner in which to achieve the
objectives referred to in paragraph (b), which strategies and policies must-
(i) indicate desired patterns of land use within the municipality;
(ii) address the spatial reconstruction of the municipality; and
(iii) provide strategic guidance in respect of the location and nature of development within the municipality;
(d) set out basic guidelines for a land use management system in the municipality;
(e) set out a capital investment framework for the municipality’s development programs;
(f) contain a strategic assessment of the environmental impact of the spatial development framework;
(g) identify programs and projects for the development of land within the municipality;
(h) be aligned with the spatial development frameworks reflected in the integrated development plans of
neighbouring municipalities; and
(i) provide a visual representation of the desired spatial form of the municipality, which representation –
(i) must indicate where public and private land development and infrastructure investment should take place;
(ii) must indicate desired or undesired utilisation of space in a particular area;
(iii) may delineate the urban edge;

186
(iv) must identify areas where strategic intervention is required; and
(v) must indicate areas where priority spending is required.
2.3 Land Use Management Bill
The Land use management bill aims to normalise land use management through out the whole country by
setting further principles in Section 4.
4. (1) The general principle is that spatial planning, land development and land use management must promote and
enhance –
(a) equality
(b) efficiency;
(c) integration;
(d) sustainability; and
(e) fair and good governance
Principle of equality
5. (1) Everyone affected by a decision or process on spatial planning, land development and land use management has the
right -
(a) to be treated equally by the law;
(b) to equal protection and benefit of the law; and
(c) not to be unfairly discriminated against except as permitted in terms of the Constitution.
(2) No provision of this Act shall prevent the introduction or implementation of policies and other measures designed to
protect or advance persons, or categories of persons, disadvantaged by unfair discrimination.
Principle of efficiency
6. Policies and other measures on spatial planning, land development and land use management must -
(a) ensure the best use of available resources;
(b) develop and promote compact human settlements and discourage low density urban sprawl; and
(c) secure proximity between residential and work places taking into account the health and well-being of affected
persons.
Principle of integration

187
7. Policies and other measures on spatial planning, land development and land use management must -
(a) promote efficient, optimally functional and integrated settlement patterns;
(b) be functionally co-ordinated, aligned with, and take into account related policies and programmes, including
transportation systems;
(c) promote integration of communities from diverse backgrounds, including race and class; and
(d) facilitate appropriate mixed land use.
Principle of sustainability
8. In order to ensure the sustainable management and use of the resources making up the natural and built environment,
policies and other measures on spatial planning, land development and land use management must -
(a) ensure that land is used or developed only in accordance with the law;
(b) create synergy between economic, social and environmental concerns;
(c) protect natural, environmental and cultural resources in a manner consistent with applicable environmental
management legislation;
(d) preserve the use of prime and unique agricultural land; and
(e) take into account disaster management.
Principle of fair and good governance
9. (1) Policies and other measures on spatial planning, land development and land use management must be democratic,
participatory and lawful.
(2) A process or decision on spatial planning, land development and land use management must -
(a) be lawful, reasonable and procedurally fair;
(b) comply with the rig ht to just administrative action;
(c) take into account and promote the need of affected persons to understand its nature and effect; and
(d) Promote efficient administration, including -
(i) The provision of adequate notice of details of officials who may assist the public;
(ii) inviting affected persons to forums at which spatial planning, land development and land use management
decisions are taken ; and
(iii) Taking decisions within prescribed time-frames.
The Land Use Management Bill then further defines Spatial Development Frameworks on a National,
Provincial, Regional and a Municipal level. Section 17 of the Land use management Bill states:

188
17. (1) The spatial development framework of a municipality …….. must –
(a) give effect to the directive principles;
(b) be consistent with the national spatial development framework;
(c) be consistent with the provincial spatial development framework of the province in which the municipality is
located;
(d) be consistent with any applicable national and provincial legislation on environmental management; and
(e) give effect to any national and provincial plans and planning legislation.
(2) A municipal spatial development framework must reflect at least –
(a) the current state of affairs report on land use in the municipality, including any spatial dysfunctionality that
exists;
(b) a conceptual framework of the desired spatial growth patterns in the municipality;
(c) a multi-sector based spatial plan, at an appropriate scale, sufficiently formulated to achieve the desired spatial
development goals, including -
(i) the correction of past spatial imbalances and the integration of disadvantaged persons;
(ii) linkage between settlement development and appropriate transport infrastructure and systems;
(iii) vacant land analysis of strategically located land comprising -
(aa) location and size;
(bb) ownership;
(cc) current zoning;
(dd) value;
(ee) surrounding land use;
(ff) geotechnical conditions; and
(gg) most suitable use (suitability index)
(d) a multi-sector driven resource plan for implementation of the spatial development framework.
1. SPATIAL EDVELOPMENT STRUCTURE OF MATJHABENG
3.1 Current spatial structure

189
The current spatial development structure of Matjhabeng is depicted on the attached Map 1. In this
regard the different land uses and all physical constraints on future development must be noted.

190

191
3.2 Current land uses in Matjhabeng
The following table depicts the current land uses in Matjhabeng:
TOWN TOTAL ERVEN
BUS
INES
S
CE
MET
ER
Y
EDU
CAT
ION
AL
GO
VER
NM
ENT
IND
UST
RIA
L
INST
ITU
TIO
NAL
PAR
KS
RES
IDE
NTI
AL
WELKOM
WELKOM 9148 366
43 27 427 66 396 7821
NAUDEVILLE 1044 4
1 2
7 15 1015
RHEEDERPARK 1379 6
4
9 24 1336
FLAMINGO PARK 1634 4
6 3
7 50 1564
THABONG 29871 288 1 245
102 20 227 28986
BRONVILLE 2368 15
5 2 16 20 19 2291
RIEBEECKSTAD 5618 154
21 16 108 25 95 5191
SUBTOTAL 51062 837 1 325 50 653 154 826 48204
VIRGINIA
VIRGINIA 6431 306 1 19 11 184 32 168 5710
MELODING 10774 100 4 80
62 10528
SUBTOTAL 17205 406 5 99 11 184 32 230 16238
HENNENMAN
HENNENMAN 1695 122 1 34 10 139 2 88 1299
HAVENGAVILLE 51 27
3 1 1 19
PHOMELONG 4983 29 2 48
33 4871
117 2
8 107
DAGBREEK HOLDINGS 25
25
CONFIDO HOLDINGS 23
23
SUBTOTAL 6895 180 3 82 10 142 3 130 6345
VENTERSBURG
VENTERSBURG 658 65
9 5 35 7 5 532

192
TOWN TOTAL ERVEN
BU
SIN
ESS
CEM
ETE
RY
ED
UC
ATI
ON
AL
GO
VER
NM
ENT
IND
US
TRIA
L
INS
TITU
TIO
NA
L
PAR
KS
RE
SID
ENTI
AL
MMAMAHABANE 1875 18 1 10 1 5
15 1825
TSWELANGPELE 636 6 2 15
5 608
SUBTOTAL 3169 89 3 34 6 40 7 25 2965
ALLANRIDGE
ALLANRIDGE 1627 27 1 18 5 9
64 1503
NYAKALLONG 4114 21 1 41
24 4027
SUBTOTAL 5741 48 2 59 5 9
88 5530
ODENDAALSRUS
ODENDAALSRUS 3511 211 2 18 27 82 26 90 3055
KUTLWANONG 12296 116 1 117 90 11971
SUBTOTAL 15807 327 3 135 27 82 26 180 15026
TOTAL 99879 1887 17 734 109 1110 222 1479 94308
4. THE MATJHABENG SPATIAL DEVELOPMENT FRAMEWORK PLAN
4.1 THE SPATIAL DEVELOPMENT FRAMEWORK
The Spatial Development Framework is a multi-year plan that shows general future spatial direction aiming at
the creation of integrated and habitable cities, towns and rural areas. From a town planning perspective this
plan should direct and arrange the development activities and the built form in such a way that it can
accommodate ideas and desires of people without compromising the natural environment and the way services
are rendered.

193
4.2 CURRENT STATUS
The compilation of the Spatial Development Framework for Matjhabeng is in progress and will be completed in
phases in order to comply with the applicable legislative requirements. The plan will be completed as follows:
Phase 1 is an analyses phase. During this phase data is collected both cadastral and physical. From this information a base map is compiled indicating: (See Map 1):
- Status quo information.
- Development constraints and restrictions.
- Existing spatial trends.
- Available land on account of it’s strategic location, ownership, current use, physical conditions etc.
Phase 2 is a strategic phase where the following is proposed: (Municipal Policy)
-The identification of areas for the conservation of the natural and build environment, including environmentally sensitive
areas, river corridors, areas of biodiversity or with unique ecological processes, heritage resources, high potential
agricultural land etc.
- The identification of areas of future growth and development, that includes the development of the necessary urban
development policies to address:
a) The desired spatial structure, as well as patterns and directions of future growth.
b) The desired land-uses for each area, as well as areas where certain land-uses should be encouraged or
discouraged, or the intensity of certain uses be increased or decreased.
c) Development corridors and development nodes.
d) Transport routes to facilitate future traffic demands and mobility requirements.
e) Areas where infrastructural investment is required.
f) The spatial reconstruction of the Municipal area and the correction of past imbalances and integration.
g) Proposed areas for noxious activities, social services, cemeteries, waste disposal and the like.
h) The spatial implications of HIV/AIDS, for example the positioning of future clinics and care centres for orphans.
i) The spatial findings of the strategic environmental assessment.
j) The location of IDP projects and strategies.
Phase 3 is the detail phase. This phase must be done if and when specific circumstances demand further
investigation and more detailed interventions in a specific area. The terms of reference of this phase shall
only become clear as the SDF process unfolds. This phase comprises the following actions:

194
- A detail assessment of priority and unique areas, and areas that require a higher level of management.
- Compilation of detail RSDP’s (Regional Spatial Development Plans) for these areas.
- The establishment of regional policies in line with the parent policy.
The Public Participation Process is critical in order to establish legitimacy and the “buy-in” of all
stakeholders into the Spatial Development Framework. The deliverables of the process shall be the
creation of the Spatial Development Framework document consisting of maps and policies encompassing:
- Spatial development plan – (on a strategic level).
- Urban development boundary and policies.
- Transportation and movement policy.
- Nodal development policy.
- Environmental policy.
- Corridor development policy.
- Sustainable neighbourhood policy for inter alia previously disadvantaged communities.
- Land use management policy.
1.3 GENERAL DIRECTION, PRINCIPLES AND NORMS ADOPTED
During the Integrated Development Planning process the principles and Plan of the Free State Goldfields Structure
Plan Phase One was adopted. In order to direct development the following objectives must guide the Spatial
Development Framework: efficiency, sustainability and accessibility. To further enhance the development and
implementation of the Spatial Development Framework the following underlying principles are as important when
developing and applying the Spatial Development Framework: integration, equality and good governance.
The general principles and norms in relation to the spatial development of Matjhabeng as discussed in this section
are depicted in the attached Map 2 and Map 3:

195

196

197
4.3.1 Spatial Development Trends
The physical integration of Matjhabeng into one Town is at present restricted due to the physical distance between the
towns as well as mining activities forming physical restrictions. (Ventersburg Virginia 20Km, Allanridge Odendaalsrus
15 Km, Hennenman Welkom 25 Km etc.)
The integration of existing towns should optimally utilise existing infrastructure and increase the density of established
towns.
Where a new development extends the present town limits, it must form a homogeneous extension of the town.
Integration between Ventersburg and Mmamahabane is almost complete and further development direction should be
given in the Matjhabeng Structure Plan.
Integration between Hennenman and Phomolong should be persued but will be be difficult due to some physical
restrictions like a spruit, sewerage works and a dumping site.
Virginia and Meloding can to some extent be integrated via a southern link over the farm Schoonheid. The Land use
plan for Mining Land would assist in clarifying this and other opportunities for integration.
Allanridge and Nyakallong also have physical restrictions of a pan, a sewerage works and a major provincial road
separating them, but the Matjhabeng Structure Plan should give clear direction.
Bronville Thabong Riebeeckstad Kutlwanong Odendaalsrus and Welkom can be integrated over the longer term and
should develop in line with the proposals of the Goldfields Structure Plan Phase 1.
4.3.2 Localised General Spatial Development Principles
The following aspects are key to the future spatial development of Matjhabeng:
Optimal utilisation of natural and infrastructural resources, and integrated planning principles should drive all development.
Effective and efficient procedures and processes for applications and consents should be pursued to facilitate
development initiatives.
Future trends with a spatial impact, for example HIV/AIDS, needs to be carefully monitored and planning should take
place accordingly in a pro-active and holistic manner.
The core areas of the Goldfields including Welkom/Thabong, Odendaalsrus/Kutlwanong, and Virginia/Meloding should be encouraged to develop as a compact integrated sub-region.
Development in towns must be channelled to develop towards each other as indicated by the Goldfields Guide Plan. Defunct or undeveloped mining land including infrastructure should be reclaimed for urban functions to create the ideal
compact sub-regional urban structure. The location of residential and employment opportunities should be in close proximity to or integrated with each other. The densification of urban uses to optimise civil engineering services, opportunities and facilities.

198
4.3.2.1 Land development for residential purposes will be guided by the following principles:
All open land in the different urban areas previously earmarked for residential development should be developed as a first priority.
All defunct or undeveloped mining land and open spaces between urban areas should be developed as a second priority or simultaneously with developments highlighted as a first priority.
The existence of well established residential areas with high land values should be protected against urban decay. Transitional zones between low and high residential income areas can be planned to assume the projection of well established residential areas. These transitional zones must be planned to the satisfaction of the Municipality and these zones can include any land use providing for the desirable transition.
Areas indicated for residential development should make provision for the different income levels of the population and different tenure options should be made available.
The minimum size of a residential stand shall be 500m² in any new residential layout. Mining hostels in the past offer housing to mainly heads of households and could be utilised for high density family
based residential development and or education facilities, community facilities, commercial hive development on ground floor with residential development on top floors.
Private hostels should be upgraded to high-density family or single dweller units and ownership of land should be promoted.
4.3.2.2 Defunct or undeveloped mining areas It is further important to realise that mining land is to be released in terms of the Minerals Act, Act 50/1991 as amended before mining land could be used for urban purposes.
Land development of defunct or undeveloped mining areas, when needed for urban development (rehabilitation through urban development), should be guided by the following:
(i) Land uses
(a) Residential
Detail studies concerning the feasibility to convert hostel buildings to high density units, education facilities, community facilities or commercial hives at ground level with residential development on top level should, be carried out before any decision regarding the utilisation of land is taken. Existing mining villages and open areas around these villages should be planned to form balanced township extensions.
(b) Shaft areas and reduction plants
Defunct shaft areas should be utilised for non-noxious industrial and commercial land uses and should be planned as a unit to surrounding neighbourhoods.
(c) Rock and refuse dumps
Rock and refuse dumps in the area should be rehabilitated and township development can only proceed when dumps are removed.

199
(d) Existing industrial areas
Existing industrial areas should be incorporated into any future detail town planning as industrial areas.
(e) Explosive magazines
Defunct explosive magazines should be rehabilitated when development is considered. Note must be taken regarding the limitations for residential development when explosive magazines are still in operation.
(f) Concession stores, mining offices and security training areas
Concession stores should be incorporated as local business areas in proposed development areas. Mining offices should be used as office/park - commercial/park facilities and the high quality of gardening should be continued to enhance the tranquillity of the area. Existing security training areas should be used as community facilities for example a school, orphanage, old age home, etc.
(g) Sports facilities
Existing mining sport facilities should be re-utilised in future urban developments as sport zones. Adjacent hostels to these facilities should be converted for indoor sport such as karate, wrestling, boxing, etc.
(h) Mine water canals
Mine water canals still in operation when township development proceeds in earmarked mining areas should be incorporated and safeguarded in respect to pollution and health within the guidelines of the National Department of Health, Department of Water Affairs and Forestry and Department of Environmental Affairs.
(i) Excavation areas
These areas need to be rehabilitated before or during urban development processes.
(j) Existing mining road networks These roads are assets and should be incorporated in future development plans as internal/external
linkages. (k) Railway network systems If development in a mining area proceeds, investigations should be done to establish the feasibility
of re-using existing railway lines for alternative uses such as industrial, commercial or rail based transportation systems.
(l) Slimes dam

200
Due to radiation levels no slimes dams can be re-used for urban development purposes.
(m) Trees
Existing plantations should be incorporated into any development plans.
(ii) Infrastructure
- Mining services: Future development teams should liase closely with mining officials in order to determine which
mining services can be removed or should be accommodated in development plan proposals. - Civil engineering: Before development can proceed on undeveloped/defunct mining land the following investigations
must be done: - the capacities of bulk services supply to development areas should be determined. - existing sewerage and water reticulation networks, which may be utilised in developments, should
be evaluated for compliance with municipal requirements. - the general conditions of existing roads should be verified to determine whether these roads
comply with geometric standards and municipal requirements. (iii) Environmental issues
It is important that mining houses clarify environmental restrictions such as radiation, acid mine drainage, subterranean water quality, general contamination and geotechnical restrictions before land is to be developed for urban land usage.
4.3.2.3 Business (i) The retail component The Central Business District of Welkom should maintain its dominant status as first order business centre in Matjhabeng.
Decentralised suburban business areas should be planned and managed on a co-ordinated basis taking the existence of other areas into account.
In Welkom rezoning along Stateway, between the CBD and the industrial area, should be allowed subject to the conditions as proposed by the Matjhabeng municipality.
Business areas in the municipal Area are planned in a hierarchical pattern. Future development of business areas should accommodate these planned areas and these hierarchical settlement patterns of business should be extended. The retail hierarchy as proposed in Table 15 should be applied in a flexible manner to identify retail opportunities for the Municipal area.
(ii) Mixed land use nodes Certain areas in the Matjhabeng should be earmarked as mixed land use nodes to encourage developers to make
investments in these areas that in turn will create work opportunities that are greatly needed to the Matjhabeng area.

201
4.3.2.4 The Industrial component (i) Industries Approximately 446 ha additional land will be needed by the year 2010. The following areas are proposed as industrial areas to
make up the need:
- Hennenman Industrial Area
- the portion of land to the east of the market (about 7 ha)
- the land to the south and south-east of Voorspoed-Oos Extension 12 industrial areas (about 460 ha).
- the land between Arrarat Street, Alma Drive and Western Holdings shaft for light industries, commercial development
and industrial parks (about 86 ha).
- The following areas could be used for industrial development. These areas include mining land that could become
defunct in the next 15 years and are as follows:
mining land at Western Holdings 5 shaft: approximately 160 ha mining land at Western Holdings 8 shaft: approximately 200 ha mining land at Western Holdings 1 shaft: approximately 168 ha mining land at Western Holdings 2 shaft: approximately 68 ha
(ii) Light industrial and commercial corridor Give Map
- The existing corridor of mixed land uses along Provincial Road (P1/2) between Welkom and Odendaalsrus as a given situation should be supported and extended to accommodate different zones of land uses including mining, residential, commercial, recreation areas, etc.
(iii) Heavy industries
- Heavy industries that are classified as noxious industries in terms of noise, smoke or other pollution activities should be encouraged to settle at locations south of Welkom and towards Virginia. Since no residential areas can be developed here due to constraints associated with mining activities. Noxious industries should have the lowest impact on the environment in this area.
4.3.2.5 Education and community facilities (i) Primary and Secondary Education
- The existing standards prescribed by the National Department of Education will be used during future developments to determine the number of education facilities required. These school sites will be located according to population distribution, road network and the availability of existing buildings or suitable land.
- Land not needed by the Education Department should revert back to the municipality to utilize for other purposes.
(ii) Tertiary education
- Tertiary Education is currently only located in Welkom. Open land to the north of the existing tertiary education component should be reserved for future extensions or additional facilities.

202
- Detail studies concerning the feasibility to convert defunct mining infrastructure (buildings) to education facilities
should be done especially in areas reserved as mixed land use nodes. (iii) Community facilities
- Community facilities comprise a whole range of facilities from crèches, libraries and community halls to churches. Land for Community facilities are provided according to the norms and standards of the Provincial Government. The development of the facilities itself is governed by the need and the availability of funds and institutions.
4.3.2.6 Open space (i) Informal
- An integrated network of open spaces should be designed to link natural areas and community facilities with residential areas. This is particularly important in low income areas where pedestrian movement is high due to lower vehicle ownership levels.
- Existing drainage areas, lake areas, exotic and indigenous plantations as well as Thorn veld areas should form part of
the network of open spaces and retention facilities should be planned in advance in these areas to prevent storm water hazards.
- An Open Space Master Plan should be compiled to determine the future use of all open spaces.
(ii) Formal
- Community recreation parks should be identified in future developments. One community recreation area per population of 60 000 should be provided to serve local recreational needs.
- Multi-purpose neighbourhood parks, mini parks and space for aesthetic parks should be provided according to needs at a local level when development plans are prepared.
4.3.2.7 Urban agriculture
- The principle of urban agriculture as an urban land use is accepted and the proposals are as such that continuity of normal urban development will not be disrupted. There is a need for agricultural holdings / small farms with a size of 1-25 ha to provide for a range of needs in the community.
4.3.2.8 Public Transport
- The areas planned for Taxi ranks must be developed since these locations have been planned to serve as major assemble nodes on a macro basis. At a micro level provision must further be made for taxis at the different decentralised suburban business nodes.
- The South African Rail Commuter Corporation Limited identified a future rail corridor in concept between Welkom
and Virginia. This corporation was also involved in this Structure Planning process that resulted in the conceptual identification of a future rail based public corridor located between Odendaalsrus and Welkom. The conceptual location of this corridor is indicated on the Spatial Development Framework Plan. The location of this corridor is not fixed and further investigations by the South African Rail Commuter Corporation Limited should be done to determine feasibilities and exact location of such a commuter system.

203
4.3.2.9 Cemeteries
- The existing cemeteries at Allanridge, Nyakallong, Welkom, Thabong, Odendaalsrus, Kutlwanong, Bronville, Hennenman and Phomolong are sufficient for this IDP period to satisfy growing needs. Ventersburg, Mmamahabane and Bronville are in the process of addressing the need.
4.3.2.10 Refuse areas and waste disposal
- The refuse areas currently serving Welkom, Thabong, Bronville and Odendaalsrus are sufficient to serve needs for the IDP period. Special attention should be given to the introduction of refuse transfer stations. Investigations should further be done to utilise defunct mining areas for example slimes dams for purposes of refuse areas or waste disposal sites. Due to radiation levels defunct slimes dam areas are restricted for urban development.
5. LAND USE MANAGEMENT PLAN FOR MATJHABENG The Land Use Management Plan ensures that all land and properties in Matjhabeng are used only according to their
permitted land-use or zoning rights. It considers applications for new developments by property owners and developers to
change permitted land uses, zoning rights and their accompanying restrictions, which are in turn specified in a zoning
scheme. This responsibility is exercised in line with the City's commitment to sustainable and equitable development.
Typical land-use or zoning categories in a zoning scheme include:
Residential zones (e.g. single residential dwellings, group housing schemes or blocks of flats)
Open space zones (e.g. public open spaces, parks, sports fields, cemeteries or private open spaces)
Business commercial zones (e.g. shops or office blocks)
Community use facility zones (e.g. schools, clinics or places of worship)
Industrial zones (e.g. factories, motor repair garages or warehouses)
Utility zones (e.g. electricity substations or water treatment plants)
Transport zones (e.g. public roads, railway lines and public transport interchanges)
In addition to the spatial development frameworks and structure plans, zoning schemes and related regulations and policies are
primary tools for land-use and development management.
The new uniform Land Use Management Plan for Matjhabeng will be approved shortly and thus replace the existing land use
management guidelines for the different units in Matjhabeng.

204
CHAPTER NINE (9) FRAMEWORK FOR THE PERFORMANCE MANAGEMENT SYSTEM
1. Introduction
1.1 Strategic Objectives of a Performance Management System
In the local government context, a comprehensive and elaborate system of monitoring performance of municipalities has
been legislated. This system is intended to continuously monitor the performance of municipalities in fulfilling their
developmental mandate. Central to this is the development of key performance indicators as instruments to assess
performance. These indicators help to translate complex socio-economic development challenges into quantifiable and
measurable outputs. They are therefore crucial if a proper assessment is to be done of the impact of government in improving
the quality of life for all.
The Municipal Planning and Performance Management Regulations stipulates that a municipality’s Performance
Management System (PMS) must entail a framework that describes and represents how the municipality's cycle and
processes of performance planning, monitoring, measurement, review, reporting and improvement will be conducted,
organized and managed, including determining the roles of the different role-players.
In line with the said legal requirement this framework is a policy document that will set out the requirements that the
Matjhabeng Municipality’s PMS will need to fulfill, the principles that informed its development and subsequent
implementation, the preferred performance model of the Municipality, the process by which the system will work, the
delegation of responsibilities for different roles in the process and a plan for the implementation of the system.
1.2 The Legislative framework for performance management
The legislative and policy framework for PMS includes the Constitution, The Municipal Systems Act, the Municipal
Finance Management Act, Municipal Planning and Performance Management Regulations, The White Paper on
Local Government and Batho Pele principles. The main regulatory mechanism for PMS is Chapter 6 of the MSA and
the related Municipal Planning and Performance Management Regulations.
The major PMS policy instruments is the 1998 White Paper on Local Government supported by the Batho Pele
principles, which policies was given legal stature through the adoption of the Municipal Systems Act in 2000 (Act 32
of 2000). The said Act requires all municipalities to:
Develop a performance management system
Set targets and monitor and review the performance of the Municipality based on indicators linked to their Integrated
Development Plan (IDP)
Table and publish an annual performance report on performance of the Municipality forming part of its annual report
as per the Municipal Finance Management Act (MFMA).

205
Incorporate and report on a set of general (sometimes also referred to as national) indicators prescribed by the
Minister responsible for local government
Conduct, on a continuous basis, an internal audit of all performance measures
Have their annual performance report audited by the Auditor-General
Involve the community in setting indicators and targets and reviewing municipal performance
These are some of the main elements and requirements of the legislative requirements for the development and
implementation of a performance management system for municipalities. For the ease of reference and for the benefit of
a comprehensive Matjhabeng Municipality Performance Management System Framework, more detailed legislative and
policy guidelines and requirements are included in the framework.
1.2.2 The White Paper on Local Government (1998)
The White Paper on Local Government (1998) suggested that local government should introduce the idea of
performance management systems. The White Paper noted that,
"Involving communities in developing some municipal key performance indicators increases the accountability of the municipality. Some
communities may prioritise the amount of time it takes a municipality to answer a query; others will prioritise the cleanliness of an area
or the provision of water to a certain number of households. Whatever the priorities, by involving communities in setting key
performance indicators and reporting back to communities on performance, accountability is increased, and public trust in the local
government system enhanced" (The White Paper on Local Government, 1998).
1.2.3 Batho Pele (1998)
Similarly, the White Paper on Transforming Public Service Delivery (Batho Pele) puts forward eight principles for good public service:
Consultation:
Citizens should be consulted about the level and quality of public service they receive, and, where possible, should be given a choice about the services which are provided.
Service standards: Citizens should know what standard of service to expect.
Access: All citizens should have equal access to the services to which they are entitled.
Courtesy: Citizens should be treated with courtesy and consideration
Information: Citizens should be given full and accurate information about the public services they are entitled to receive.

206
Openness and transparency: Citizens should know how departments are run, how resources are spent, and who is in charge of particular services.
Redress: If the promised standard of service is not delivered, citizens should be offered an apology, a full explanation and a
speedy and effective remedy; and when complaints are made citizens should receive a sympathetic, positive response.
Value-for-money: Public services should be provided economically and efficiently in order to give citizens the best possible value-for-
money.
"Importantly, the Batho Pele White Paper notes that the development of a service-oriented culture requires the active participation of
the wider community. Municipalities need constant feedback from service-users if they are to improve their operations. Local partners
can be mobilised to assist in building a service culture. For example, local businesses or non-governmental organisations may assist with
funding a helpline, providing information about specific services, identifying service gaps or conducting a customer survey" - The White
Paper on Local Government (1998).
1.2.4 The Municipal Systems Act (2000) The principle requirements of the Municipal Systems Act have already been highlighted. To provide further insights into
the requirements of the Act, the different sections of Chapter 6 (Annexure A) of the MSA will be summarized:
Section 38: Requires municipalities to establish a Performance Management System, promote a performance
management culture and administer its affairs in an economical, effective, efficient and accountable manner. Section 39: Gives Executive Mayor the responsibility for managing the development of a Performance Management
System, as well as powers of delegation of responsibilities and the responsibility of submitting the PMS to Council.
Section 40: Places responsibility on the municipality for the monitoring and review of its PMS.
Section 41: Outlines the core components to be included in the PMS of the municipality, and refers to KPI’s,
targets, measurement mechanisms, steps for improvement and the reporting processes. Section 42: Requires the municipality to establish mechanisms and procedures for community involvement in the
process, in terms of Chapter 4 of the MSA. Section 43: Allows the minister to establish general KPI’s which must be included in the KPI’s of municipalities, to
the extent that these general KPI’s are relevant to the municipality.
Section 44: Requires the municipality to notify stakeholders internally and the general public of its KPI’s and targets.
Section 45: Requires the municipality to conduct an internal audit of its performance as well as an audit by the
auditor general.
Section 46: Requires the municipality to prepare an annual performance report. Section 47: Requires MEC to compile an annual performance report for the municipalities within the province
Section 48: The Minister has to compile an annual report and submit it to parliament, in terms of the performance of
the municipalities in relation to general KPI’s
Section 49: Allows the Minister to make regulations or issue guidelines for the purpose of Chapter 6 of the MSA

207
1.2.5 Municipal Planning and Performance Management Regulations (2001) The Minister responsible for local government published the Municipal Planning and Performance Management
Regulations (2001) in terms of the Municipal Systems Act (Section 49) setting out in detail the requirements for a
municipal PMS. The Regulations also contain the general indicators prescribed by the Minister responsible for local
government
1.2.6 Municipal Finance Management Act (2004) It is also important to note that the Municipal Finance Management Act (MFMA) contains various important provisions
related to municipal performance management. It requires municipalities to annually adopt a Service Delivery and
Budget Implementation Plan (SDBIP) with service delivery targets and performance indicators. Whilst considering and
approving the annual budget the Municipality must also set measurable performance targets for each revenue source
and vote. The Municipality must lastly compile an annual report, which must include a performance report compiled in
terms of the Systems Act. In terms of a circular issued by National Treasury provision is also made for the compilation on
an annual basis of departmental SDBIPs.
2. Performance management and measures at various levels Performance management can be applied to various levels within any organisation. The legislative framework as set out
above provides for performance management at various levels in the municipality including strategic (sometimes
also referred to as municipal, organisational or corporate) level, operational (also referred to as services,
departmental or section/team) level and lastly, individual level.
At strategic level the five-year IDP of the municipality forms the basis for performance management, whilst at operational
level the annual SDBIP forms the basis. The Matjhabeng Municipality will supplement the required SDBIP with
Operational Plans The IDP is a long-term plan and by its nature the performance measures associated with it will
have a long-term focus, measuring whether a municipality is achieving its IDP objectives. A SDBIP (both for the
municipality as a whole and that of a department) is more short-term in nature and the measures set in terms of the
SDBIP, reviewing the progress made with implementing the current budget and achieving annual service delivery
targets.
The measures set for the Matjhabeng Municipality at strategic level is captured in a strategic
(municipal/organisational/corporate) scorecard structured in terms of the preferred performance management
model of the Municipality . The measures at operational level are to be captured in the SDBIP of the Municipality
and the SDBIPs of the various Departments in the Municipality.
By cascading performance measures from strategic to operational level, both the IDP and the SDBIP, forms the link to
individual performance management .This ensures that performance management at the various levels relate to
one another which is a requirement of the Municipal Planning and Performance Regulations. The MFMA
specifically requires that the annual performance agreements of managers must be linked to the SDBIP of a
municipality and the measurable performance objectives approved with the budget.

208
The following diagram indicates the performance management at various levels:
3. Objectives of the Performance Management System
As indicated above the Municipality’s PMS is the primary mechanism to monitor, review and improve the implementation of
it’s IDP and to gauge the progress made in achieving the objectives as set out in the IDP. The objectives for any municipal
performance management system is guided and regulated by the relevant legislation and policy guidelines. The Planning and
Performance Management Regulations informs the objectives to a great extent. The PMS for the Matjhabeng Municipality
includes the following objectives that the system should fulfill:
Meeting IDP Objectives To ensure that the priorities as contained within the IDP are achieved, by measuring the success of meeting these
Effective Community Participation The Performance Management System is to ensure that effective community participation is achieved throughout
the process.
Financial Accountability The system should assist in improving the financial accountability of the key office bearers and officials.
Facilitate increased accountability The performance management system should provide a mechanism for ensuring increased accountability between the local
community, politicians, the Municipal Council and the municipal management team.
Setting Targets
Measurement
IDP
(5 year)
SDBIP
(Operational Plans)
Workplans
Monthly/quarterly
Performance Management
Responsibility Level
Organisational
Departmental
Team/Individual
Performance Management and measurement in the Matjhabeng Municipality

209
Facilitate learning and improvement
The PMS should facilitate learning in order to enable the Municipality to improve delivery.
Provide early warning signals
It is important that the system ensure decision-makers are timeously informed of performance related risks, so that they can
facilitate intervention, if necessary.
Facilitate decision-making
The performance management system should provide appropriate management information that will allow efficient, effective
and informed decision-making, particularly on the allocation of resources.
The functions listed above are not exhaustive, but summarise the intended benefits of the system. These intended functions
should be used to evaluate and review the performance management system on a regular basis (see chapter 9).
4. Principles governing Matjhabeng Municipality PMS The principles that should govern the Matjhabeng Municipal PMS are developed to ensure that the PMS is relevant,
especially in attaining its objectives and legislative requirements. The said principles are the following:
effective utilization of financial and human resources
simplicity so as to facilitate implementation given any current capacity constraints,
politically acceptable to all political role players,
administratively managed in terms of its day-to-day implementation,
implementable within any current resource constraints,
transparency and accountability both in terms of developing and implementing the system,
efficient and sustainable in terms of the ongoing implementation and use of the system,
public participation in terms of granting citizens their constitutional right to participate in the process,
integration of the PMS with the other management processes within the Municipality,
objectivity based on credible information and lastly,
reliability of the information provided on the progress in achieving the objectives as set out in its IDP.
5. Preferred performance management model
A performance management model can be defined as the grouping together of performance indicators, sometimes based
other type of indicator, into logical categories or groups (often called perspectives), as a means to enhance the ability of an
organisation to manage and analyse its performance. As such a model provides a common framework for what aspects of
performance is going to be measured and managed. It further ensures that a balanced set of measures are employed that are

210
not relying on only one facet of performance and therefore not presenting a holistic assessment of the performance of an
organisation.
A number of performance models are available and any of them could be applied by the Municipality. The available models
include the Municipal Scorecard, Balanced Scorecard and the Key Performance Area Model. The Matjhabeng
Municipality has however chosen the Balanced Scorecard. In terms of the said model all indicators are grouped
together into Perspectives within the Strategic Scorecard. These perspectives have its roots in the Balanced
Scorecard Model and have been adapted to best suit the performance model of the municipality. The Strategic
Scorecard has its main focus on the performance of the Municipality as an organization according to the following
perspectives:
Financial sustainability
Effective service delivery
People and social development
Improve customer relations
Good governance
The municipality has Operational Plans in place which are drawn up annually and gives direction to the operations for the
respective departments of the municipality. The operational plans are linked to the SDBIP and also to the IDP objectives. The
operational plans consist of Key Performance Areas with its Key Performance indicators which are linked to the IDP
objectives.
The Operational Plans will inform the Strategic Scorecard and the Individual MSA Section 56 Employees’ performance
agreements are also structured in terms of the perspectives of the Strategic Scorecard. This allows for appropriate linkage
between the strategic or organizational PMS and individual PMS within the municipality.
The following diagram serves as a schematic representation of the Matjhabeng Strategic Model.
•Financial sustainability •Effective service delivery •People & Social development •Improve Customer relations •Good Governance
Matjhabeng Strategic Scorecard
Operational Plans
SDBIP IDP11 IDP
Priorities Departmental /Operational
Level Reporting
Municipal/Strategic Level Reporting
IDP Objectives
Achievement of Municipal Vision and
Mission
MATJHABENG STRATEGIC MODEL
Annual IDP Review Process

211
6. The process of managing performance The annual process of managing performance at strategic (municipal, organisational or corporate) level in the
Municipality involves the steps as set out in the diagram below:
1. Performance
Planning
2. PerformanceMonitoring
3. PerformanceMeasurement
4. Performance
Analysis
5. Performance
Reporting
6. Performance
Review
PERFORMANCEMANAGEMENT
The following table spells out in more detail the role of all relevant roleplayers in each of the above steps:
Stakeholders Performance Planning Measurement and Analysis
Performance Reporting & Reviews
Citizens and Communities
Be consulted on needs Develop the long term vision for the area
Influence the identification of priorities Influence the choice of indicators and setting of targets
Be given the opportunity to review municipal performance and suggest new indicators and targets

212
Stakeholders Performance Planning Measurement and Analysis
Performance Reporting & Reviews
Council Facilitate the development of a long-term vision. (MSA Chapter 5) Develop strategies to achieve vision (MSA Chapter 5) Identify priorities (MSA Chapter 5) Adopt indicators and set targets (Planning and Performance Management Regulations (PPMR)
Review municipal performance bi-annually
Executive Mayoral Committee and the
IDP Steering Committee
Play the leading role in giving strategic direction and developing strategies and policies for the organisation Manage the development of an IDP (MSA Chapter 5) Approve and adopt indicators and set targets (MSA Chapter 6) Communicate the plan to other stakeholders (MSA Chapter 5)
Conduct the major reviews of municipal performance, determining where goals had or had not been met, what the causal reasons were and to adopt response strategies
Municipal Manager + HODs
Assist the Executive Mayoral Committee in providing strategic direction and developing strategies and policies for the organisation Manage the development of the IDP (MSA Chapter 5) Ensure that the plan is integrated Identify and propose indicators and targets (MSA Chapter 6) Communicate the plan to other stakeholders (MSA Chapter 5; PPMR)
Regularly monitor the implementation of the IDP, identifying risks early Ensure that regular monitoring (measurement, analysis and reporting) is happening in the organisation Intervene in performance problems on a daily operational basis (PPMR)
Conduct regular reviews of performance MSA Chapter 5) Ensure that performance reviews at the political level are organised Ensure the availability of information Propose response strategies to the Mayoral Committee

213
Stakeholders Performance Planning Measurement and Analysis
Performance Reporting & Reviews
Directorate/ Departmental
Managers
Develop service plans for integration with other sectors within the strategy of the organization (MFMA)
Measure performance according to agreed indicators, analyse and report regularly .Manage implementation and intervene where necessary Inform decision-makers of risks to service delivery timeously
Conduct reviews of service performance against plan before other reviews
The balance of this chapter looks at each of the steps in more detail and how they will unfold in the process of managing
performance in the Municipality. Although the steps and what follow relates mainly to performance management at strategic
level, the principles and approaches as espoused could also be applied to performance management at operational level.
6.1 Performance Planning
The performance of the Municipality is to be managed in terms of its IDP and the process of compiling an IDP and the annual
review thereof therefore constitutes the process of planning for performance. It should be noted that the last component of
the cycle is that of performance review and the outcome of such a review process must inform the next cycle of IDP
compilation/review by focusing the planning processes on those areas in which the Municipality has under-performed.
The performance Planning step is further specified and rolled out in more detail in terms of the Service Delivery and Budget
Implementation Plan, being a requirement of the Municipal Finance Management Act. The third level of planning for
performance refers to the Operational Plans at Departmental level, as indicated within the Matjhabeng Strategic Model.
6.2 Performance monitoring
Performance monitoring is an ongoing process by which a Manager accountable for a specific indicator as set out in the
strategic scorecard (or a service delivery target contained in an annual SDBIP) continuously monitors current performance
against targets set. These targets will be developed as part of the Operational Plans and is to be linked to the KPI’s that are
set within these Plans. The aim of the monitoring process is to take appropriate and immediate interim (or preliminary) action
where the indication is that a target is not going to be met by the time that the formal process of performance measurement,
analysis, reporting and review is due.
In the instance of the Matjhabeng Municipality the Strategic Scorecard of the Municipality is reported on a quarterly basis to
the Executive Mayor. Performance monitoring requires that in between the said formal cycle of performance measurement
appropriate action be taken should it become evident that a specific performance target is not going to be met. It is therefore
proposed that at least on a monthly basis Managers track performance trends against targets for those indicators that lie
within the area of accountability of their respective Departments as a means to early on identify performance related
problems and take appropriate remedial action.

214
Each Manager delegate to the direct line manager, the responsibility to monitor the performance for his/her sector. Such line
managers are, after all, best placed given their understanding of their sector to monitor on a regular basis whether targets are
being met currently or will be met in future, what the contributing factors are to the level of performance and what interim
remedial action needs to be undertaken. This will also serve to better link organizational performance with
individual/employee performance.
6.3 Performance measurement
Performance measurement refers to the formal process of collecting and capturing performance data to enable reporting to
take place for each key performance indicator and against the target set for such indicator. Given the fact that initially at least
the Municipality will have to rely on a manual process to manage its performance provision has been made in the Strategic
Scorecard for the name of an official responsible for reporting on each indicator (please note that this might not necessarily
be the same official accountable for performance on an indicator).
The said official will, when performance measurement is due, have to collect and collate the necessary performance data or
information and capture the result against the target for the period concerned on the strategic scorecard and report the result
to his/her Manager making use of the said scorecard after completing the next step (see performance analysis below). It
should be noted at this stage that for each of the scorecards of the Municipality two formats exist namely a planning and
reporting format. The planning format is used to plan and capture the performance targets for each indicator whilst the
reporting format is used to capture actual performance against targets and to report to the Executive Mayoral Committee.
6.4 Performance analysis
Performance analysis involves the process of making sense of measurements. It requires interpretation of the
measurements as conducted in terms of the previous step to determine whether targets have been met and exceeded and to
project whether future targets will be met or not. Where targets have not been met performance analysis requires that the
reasons therefore should be examined and corrective action recommended. Where targets have been met or exceeded, the
key factors that resulted in such success should be documented and shared so as to ensure organisational learning.
In practice the aforementioned entails that the Manager responsible for each indicator will have to, after capturing the
performance data against targets on his/her respective Operational Scorecards strategic, analyse the underlying reasons why
a target has/has not been met and capture a summary of his/her findings on the Operational Scorecard. The Manager will
thereafter have to compile a draft recommendation in terms of the corrective action proposed in instances where a target has
not been achieved and also capture this on the strategic scorecard. Provision has been made on the reporting format of the
strategic scorecard to capture both the “reason for deviance” in other words the results of the analysis undertaken) and
the”corrective measures” proposed.
The Strategic Scorecard will then be compiled with the inputs from the respective managers by extracting the information
from their Operational Scorecards and importing and translating it into the five perspectives contained within the Matjhabeng
Strategic Scorecard. The Strategic Scorecard as completed must then be submitted to a formal meeting of the senior
management team for further analysis and consideration of the draft recommendations as captured by the relevant

215
Managers. This level of analysis should examine performance across the organisation in terms of all its priorities with the aim
to reveal and capture whether any broader organisational factors are limiting the ability to meet any performance targets in
addition to those aspects already captured by the relevant Manager.
The analysis of the Strategic Scorecard by senior management should also ensure that quality performance reports are
submitted to Councillors and that adequate response strategies are proposed in cases of poor performance. Only once senior
management has considered the Strategic Scorecard, agreed to the analyses undertaken and captured therein and have
reached consensus on the corrective action as proposed, can the Strategic Scorecard be submitted to the Executive Mayoral
Committee for consideration and review.
6.5 Performance reporting and review 6.4.1 In-year performance reporting and review
The submission of the Strategic Scorecard to the Executive Mayor for consideration and review of the performance of the
Municipality as a whole is the next step in the process. The first such report is a major milestone in the implementation of any
PMS and it marks the beginning of what should become a regular event namely using the performance report as a tool to
review the Municipality’s performance, and subsequently the IDP, and to make important political and management decisions
on how to improve.
As indicated earlier it is recommended that the Strategic Scorecard be submitted to the Executive Mayoral Committee for
consideration and review on a quarterly basis. The reporting should therefore take place in October (for the period July to end
of September - quarter 1 of the financial year), January (for the period October to the end of December - quarter 2), April (for
the period January to the end of March - quarter 3) and July (for the period April to the end of June - quarter 4).
The review in January will coincide with the mid-year performance assessment as per section 72 of the MFMA. The said
section determines that the accounting officer must by 25 January of each year assess the performance of the municipality
and report to the Council on inter alia its service delivery performance during the first half of the financial year and the service
delivery targets and performance indicators as set out in its SDBIP.
Performance review is the process where the leadership of an organisation, after the performance of the organisation have
been measured and reported to it, reviews the results and decided on appropriate action. The Executive Mayor in reviewing
the Strategic Scorecard submitted to it on a quarterly basis will have to ensure that targets committed to in the Scorecard
have been met, where they have not, that satisfactory and sufficient reasons have been provided by senior management and
that the corrective action being proposed is sufficient to address the reasons for poor performance. If satisfied with the
corrective action as proposed these must to be adopted as formal resolutions of Council, minuted and actioned accordingly.
6.4.2 Annual performance reporting and review
On an annual basis a comprehensive report on the performance of the Municipality also needs to be compiled. The
requirements for the compilation, consideration and review of such an annual report are set out in chapter 12 of the MFMA. In
summary it requires that:

216
All municipalities for each financial year compile an annual report
The annual report be tabled within seven months after the end of the financial year
The annual report immediately after it has been tabled be made public and that the local community be invited to
submit representations thereon
The municipal Council consider the annual report within nine months after the end of the financial year and adopt an
oversight report containing the council’s comments on the annual report
The oversight report as adopted be made public
The annual report as tabled and the Council’s oversight report be forwarded to the Auditor-General, the Provincial
Treasury and the department responsible for local government in the Province
The annual report as tabled and the Council’s oversight report are submitted to the Provincial legislature.
The oversight report to be adopted provides the opportunity for full Council to review the performance of the Municipality. The
requirement that the annual report once tabled and the oversight report be made public similarly provides the mechanism for
the general public to review the performance of the Municipality. It is however proposed that in an effort to assist the public in
the process and subject to the availability of funding, a user-friendly citizens’ report be produced in addition to the annual
report for public consumption. The citizens’ report should be a simple, easily readable and attractive document that translates
the annual report for public consumption.
It is also proposed that annually a public campaign be embarked upon to involve the citizens of the Municipality in the review
of municipal performance over and above the legal requirements of the Municipal Systems Act and the MFMA. Such a
campaign could involve all or any combination of the following methodologies:
Various forms of media including radio, newspapers and billboards should be used to convey the annual report.
The public should be invited to submit comments on the annual report via telephone, fax and email.
Public hearings could be held in a variety of locations to obtain input of the annual report.
Making use of existing structures such as ward and/or development committees to disseminate the annual report
and invite comments.
Hosting a number of public meetings and roadshows at which the annual report could be discussed and input
invited.
Producing a special issue of the municipal newsletter in which the annual report is highlighted and the public invited
to comment.
Posting the annual report on the council website and inviting input
The public review process should be concluded by a formal review of the annual report by the IDP Representative Forum of
the Municipality.
Lastly it should be mentioned that the performance report of a municipality is only one element of the annual report and to
ensure that the outcome thereof timeously inform the next cycle of performance planning in terms of an IDP
compilation/review process, it is recommended that the annual performance report be compiled and completed as soon after
the end of a financial year as possible but ideally not later that two months after financial-year end.

217
6.4.3 Summary of various performance reporting requirements
The following table, derived from both the legislative framework for performance management and this PMS framework,
summarises for ease of reference and understanding the various reporting deadlines as it applies to the Municipality:
Report Frequency Submitted for
consideration and/or review to
Remarks
1. Departmental SDBIPs Continuous Manager of Department
See MFMA Circular 13 of
National Treasury for further information
2. Monthly budget statements
Monthly Executive Mayor/Mayor (in
consultation with Exco)
See sections 71 and 54 of the MFMA
3. Departmental scorecards Monthly Mayoral Committee Only if developed separately
from Departmental SDBIPs
4. Strategic (municipal/organisational/ corporate) Scorecard
Quarterly Mayoral Committee This PMS framework (see
section 7.5.1 above)
5. SDBIP mid-year budget and performance assessment
Annually during
January of each year
Executive Mayor/Mayor (in consultation with Exco)
See sections 72 and 54 of the MFMA
6. Performance report Annually Council
See section 46 of the Municipal Systems Act as amended. Said report to form part of the annual report (see 7
below)
7. Annual report Annually Council See chapter 12 of the MFMA
7. The auditing of performance measures

218
7.1 The role of internal audit in terms of performance management
The MFMA requires that the Municipality must establish an internal audit section which service could be outsourced
depending on its resources and specific requirements. Section 45 of the Municipal Systems Act stipulates that the results of
the Municipality’s performance measures must be audited by the said internal audit section as part of the internal auditing
process and annually by the Auditor-General.
The Municipal Planning and Performance management Regulations stipulates that internal audit section must on a
continuous basis audit all performance and the auditing must include an assessment of the following:
(i) The functionality of the municipality’s performance management system.
(ii) Whether the municipality’s performance management system complies with the Act.
(iii) The extent to which the municipality’s performance measurements are reliable in measuring the performance
of municipalities by making use of indicators.
Each of the aforementioned aspects will now be looked at briefly.
Functionality To function could be defined as a proper or expected activity or duty or to perform or operate as expected. This
could also be applied to the operation of any system such a PMS. The internal audit section must therefore on a
regular basis audit whether the PMS of the Municipality is functioning as developed and described in this framework.
Compliance To comply can be defined as to act in the way that someone else has commanded or whished. In this respect it is
clear that the legislature wishes to ensure that the Municipality’s PMS complies strictly with the requirements of the
Systems Act, Regulations and the MFMA. This compliance check would require that the Municipality’s internal audit
unit, at least on an annual basis, verifies that the Municipality’s PMS complies with the said legal requirements.
Reliability To rely could be defined as to trust or depend (upon) with confidence. Reliability in the context of PMS refers to the
extent to which any performance measures reported upon could be seen as being reliable, e.g. if the performance
target was to build 500 houses and it is reported that the target has been met or exceeded, it must be established
whether the information is factually correct or only an estimation or even worse, purposeful misrepresentation.
Undertaking a reliability audit will entail the continuous verification of performance measures and targets reported
upon. This will require that the Municipality sets in place a proper information management system (electronically or
otherwise) so that the internal audit section is able to access information regularly and to verify its correctness.

219
The Municipality’s internal auditors must submit quarterly reports on the audits undertaken to the Municipal Manager and the
Audit Committee.
7.2 Audit Committee The MFMA and the Municipal Planning and Performance Management Regulations require that the municipal
council establish an audit committee consisting of a minimum of three members, where the majority of members
are not employees of the municipality. No Councillor may be a member of an audit committee. Council shall also
appoint a chairperson who is not an employee.
The Regulations gives municipalities the option to establish a separate performance audit committee whereas the
MFMA provides only for a single audit committee. The operation of this audit committee when dealing with
performance management is governed by section 14 (2-3) of the Regulations which require that the audit
committee must:
review the quarterly reports submitted to it by the internal audit unit
review the municipality's PMS and make recommendations in this regard to the Council of the Municipality
at least twice during a financial year submit an audit report to the municipal Council
In order to fulfil their function a performance audit committee may, according to the MFMA and the Regulations,
communicate directly with the council, municipal manager or the internal; and external auditors of the municipality
concerned;
access any municipal records containing information that is needed to perform its duties or exercise its powers;
request any relevant person to attend any of its meetings, and, if necessary, to provide information requested by the
committee; and
investigate any matter it deems necessary for the performance of its duties and the exercise of its powers.
The Municipality has already established an Audit Committee and it is set in terms of the MFMA, Regulations and
this framework. 7.3 Performance Investigations
The Audit Committee should also be able to commission in-depth performance investigations where there is either continued
poor performance, a lack of reliability in the information being provided or on a random ad-hoc basis. The performance
investigations should assess:
The reliability of reported information

220
The extent of performance gaps from targets
The reasons for performance gaps
Corrective action and improvement strategies
While the internal audit section may be used to conduct these investigations, it is preferable that external service providers,
preferably academic institutions, who are experts in the area to be audited, should be used. Clear terms of reference will
need to be adopted by the Council for each such investigation.
8. Matjhabeng Local Municipality’s Strategic Scorecard Summary and Background The Matjhabeng has four sets of priority areas contained in three different documents each representing either priority
issues/strategic objectives. These are:
The IDP Strategic Focus Areas
IDP Municipal Priority Issues
Mayor’s Strategic Planning Lekgotla Issues
Seven National Key Performance Indicators for municipalities
For the purpose of developing the Matjhabeng Balanced Scorecard the above were consolidated in a manner that would
address the following strategic objectives:
Service Delivery and Infrastructure - Water Services
- Electricity
- Solid Waste Management
- Environmental Management
- Roads
- Housing
- Spatial Planning
- Community Facilities
Local Economic Development - Economic Growth
- Poverty Alleviation
- Job Creation
Municipal Financial Viability - Financial Viability
- Grant Expenditure management
Municipal Transformation and Institutional Development - Organizational Design

221
- Employment Equity
- Skills Development
- Integrated Development Planning
- Performance Management System
Good Governance - Public Participation, Accountability and Transparency
- Ward System
- Corporate Governance
- Co-operative governance
The Balanced Scorecard Approach To Performance Management The Strategic Scorecard for Matjhabeng Local Municipality is derived from Matjhabeng’s approved Performance
Management Framework. The following approach was used in developing the Strategic Scorecard for Matjhabeng Local
Municipality:
The four elements/perspectives of Strategic Scorecard were interpreted and their relevance to Matjhabeng LM was
established
Priority areas as found in different strategic documents were identified
Strategic objectives were matched against the four Balanced Scorecard elements to establish alignment
Key Performance Indicators as well as Annual and Quarterly Targets were set.
The National Key Performance Indicators for Municipalities form part of this Balanced Scorecard for Matjhabeng Local
Municipality.
NB THE STRATEGIC SCORECARD BELOW PROVIDES THE FRAMEWORK FOR MANAGING PERFORMANCE IN MATJHABENG LOCAL MUNICIPALITY. THE ACTUAL KPA AND KPI WILL BE FINALISED AFTER THE COMPLETION OF THE REVIEWED ODP

222
STRATEGIC PERSPECTIVES AND HOW THEY ADDRESS VISION AND MISSION
People & Social Development
Are our stakeholders getting the service they want?
Improve customer relations
What is the organization doing to continuously improve in order to meet stakeholders’ expectation?
Financial sustainability
Are the stakeholders receiving the service at a good price?
Good governance
What Are the organizational structures and processes required to meet stakeholder expectations?
Vision and mission

223
STRA

224
GIC SCORE SCORECARD PERSPECTIVES VS FIVE KEY PERFORMANCE AREAS
Mun
icip
al
Stra
tegi
c obj
ectiv
es
Impr
ove
cust
omer
Pe
ople
and
soci
al
deve
lopm
ent
Good
gov
erna
nce
Fina
ncia
l su
stai
nabi
lity
-Welfare Services & Soc. Plan, Climate study
-Environmental Mng
-Upgrade & maint
-Customer relation(CRM)
- Service points
- Incentives schemes
-Maintenance of vehicles, Plant & Equipment
- IGR
- SDBIP monitoring
-IGR
- Public participation (IDP)
- Spatial development
- Job creation
- Business Dev. & investment
promotion (Sector based)
- Poverty alleviation
- Access to finance & information
- Partnership with development & funding agencies
- LED Strategy
- Alignment with FSGDS
- Set up LED component
- Strengthening SCM
- Skills development
- M.I.C.E
- SMME incubation
Service Delivery & Infrastructure
Local
Economic
Development
- Revenue protection
- Correct billing
- Data cleansing
- Financial recovery Plan
-Policy analysis & review
- By-law enforcement
- Policy development & implementation
-By-law enforcement, Traffic Policing, Fire fighting Security)
- Compliance to prescripts
- Grant expenditure & Mngnt
- Revenue protection
- Correct billing
- Financial Recovery Plan
- Credit Control & Debt Mngnt
- Data cleansing
- Customer relations (CRM)
-Consumer education
- CRM
- Targeted fin mngnt training
-Sound financial management & compliance
- Financial Recovery Plan
- Effective governance
- Welfare serv social plan (EAP)
- PMS
Municipal Financial
Viability
Municipal
Transformation & Institutional.
Development
-Compliance auditing
- Performance Auditing
- IGFR
- Compliance auditing
- Performance Auditing
- Performance rewards
- Updating of website
- Org design
- Training and Education
- Employment equity
- Skills development
- Performance rewards
- Promotions
Good
Governance

225
BALANCED SCORECARD PERSPECTIVES VERSUS STRATEGIC OBJECTIVES PEOPLE AND SOCIAL DEVELOPMENT Service Delivery and Infrastructure Strategic Objectives
Key Performance Indicator Annual Target Weight Actual Performance Performance score
Welfare Services & Social Plan
% Compliance to Welfare and Social Plan
10
Climate study % Of customer satisfaction survey tool to determine customer satisfaction levels developed and implemented
10
Upgrade & maintain infrastructure ,Bulk Services.(Electricity ,Water, Waste, Sewer
% Compliance to upgrade and maintenance plan
20
Housing processes Provision of Housing – provision of stands and upgrading of existing structures
60
Local Economic Development Strategic Objectives
Key Performance Indicator Annual Target Weight Actual Performance Performance score
Job creation
- Number of private sector partnership established to exploit job creation -Creation of 800 jobs through the facilitation of strategic projects
20 20
Business Development & investment promotion (Sector based)
Number of sub strategies completed within the LED Strategy
10
Poverty eradication Number of projects to empower and develop communities to eradicate poverty
10
Spatial Development
Revision of integrated development framework to guide Matjhabeng
40

226
regeneration Municipal Financial Viability Strategic Objectives
Key Performance Indicator Annual Target Weight Actual Performance Performance score
Revenue protection
% Increase in revenue 50
Correct billing % Decrease in incorrect bills 20 Data cleansing
Completion of data cleansing of the financial system
10
Financial recovery Plan
Develop strategy/policy in line with National KPI’s and NT fiscal review process
10
Consumer education %Increase in revenue as a result of consumer education
5
Political will Number of Policy finance related policy directives
5

227
Municipal Transformation & Institutional Development Strategic Objectives
Key Performance indicator Annual Target Weight Actual Performance Performance Score
Policy analysis & review
Number of policies analyzed and reviewed
30
By-law enforcement Number of law enforcement notices
40
Policy development & implementation
Number of policies developed Number of policies implemented
10
Inter departmental SLA’s No. of Service Level Agreements completed between Directorates
10
Climate study % Of survey tool developed & implemented
10
Good Governance Strategic Objectives
Key Performance indicator Annual Target Weight Actual Performance Performance Score
By-law enforcement Number of by-law operations to decrease by-law transgressions in Matjhabeng
10
Traffic Policing. Emergency Services Security
- Number of by-law and roadside management transgressions entered into prosecution system. - Number of cases on court roll successfully prosecuted - % Implementation of Emergency Services & Disaster Management Plan % law enforcement documentation finalized within the legal time frame % Decrease on municipal
20 10 10 10 10

228
Strategic Objectives
Key Performance indicator Annual Target Weight Actual Performance Performance Score
property theft
Compliance to prescripts Completion of compliance audits
20
Development & compliance to systems & procedure
Number of systems procedures developed
10
FINANCIAL SUSTAINABILITY Service Delivery and Infrastructure Strategic Objectives
Key Performance indicator Annual Target Weight Actual Performance Performance score
Customer relation(CRM)
Completion and implementation of generic customer relations management policy norms & standards & procedures
30
Service points
Number of service points established
50
Incentives schemes consumers
Incentive Scheme developed 20
Local Economic Development Strategic Objectives
Key Performance indicator Annual Target Weight Actual Performance Performance score
Access to finance & information
Number of people financed & informed through Municipal assistance
50
Partnership with development & funding agencies
Number of partnerships with development & funding agencies
50
Municipal Financial Viability Strategic Objectives
Key Performance indicator Annual Target Weight Actual Performance Performance score

229
Strategic Objectives
Key Performance indicator Annual Target Weight Actual Performance Performance score
Grant expenditure & Management
% Of Capital grants spent to achieve set outcomes
30
Revenue protection -% Of unaccounted for water -% Of unaccounted electricity
10 10
Correct billing
% Reduction in incorrect bills 10
Financial recovery Plan % Contribution to unqualified annual audit report
20
Data cleansing % Implementation of Developed Data Cleansing Programme
20
Municipal Transformation & Institutional Development Strategic Objectives
Key Performance indicator Annual Target Weight Actual Performance Performance score
Sound financial management & compliance
Development of compliance checklist
20
Financial Recovery Plan
% Contribution to unqualified annual audit report
20
PMS implementation % Rollout of performance management system for the first 4 reporting level
40
Role clarification Completion of Functional Organizational Structure
20
Good Governance Strategic Objectives
Key Performance indicator Annual Target Weight Actual Performance Performance Score
Compliance auditing
% Compliance to legislation 50
Performance Auditing
% Compliance to PMS legislation and regulations
20
IGFR
% Completion and implementation of a strategy and plan of action for municipal
10
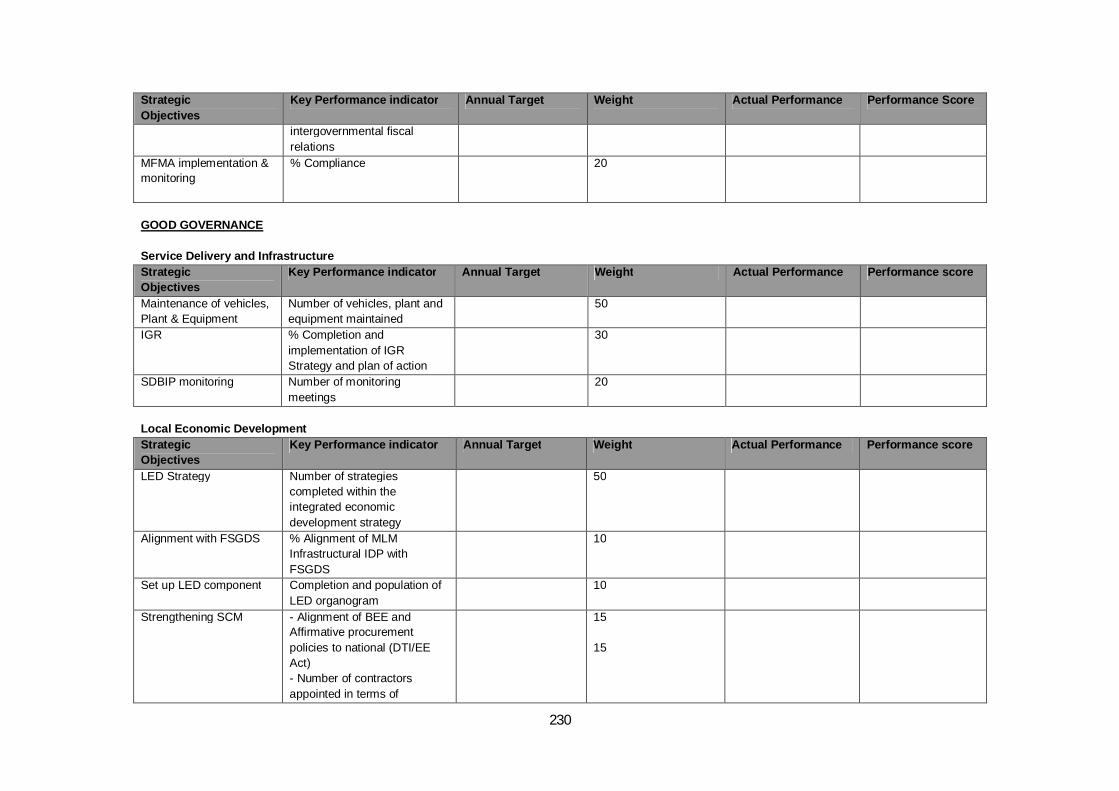
230
Strategic Objectives
Key Performance indicator Annual Target Weight Actual Performance Performance Score
intergovernmental fiscal relations
MFMA implementation & monitoring
% Compliance 20
GOOD GOVERNANCE Service Delivery and Infrastructure Strategic Objectives
Key Performance indicator Annual Target Weight Actual Performance Performance score
Maintenance of vehicles, Plant & Equipment
Number of vehicles, plant and equipment maintained
50
IGR
% Completion and implementation of IGR Strategy and plan of action
30
SDBIP monitoring Number of monitoring meetings
20
Local Economic Development Strategic Objectives
Key Performance indicator Annual Target Weight Actual Performance Performance score
LED Strategy Number of strategies completed within the integrated economic development strategy
50
Alignment with FSGDS % Alignment of MLM Infrastructural IDP with FSGDS
10
Set up LED component Completion and population of LED organogram
10
Strengthening SCM - Alignment of BEE and Affirmative procurement policies to national (DTI/EE Act) - Number of contractors appointed in terms of
15 15

231
Strategic Objectives
Key Performance indicator Annual Target Weight Actual Performance Performance score
emerging contractor development programme
Municipal Financial Viability Strategic Objectives
Key Performance indicator Annual Target Weight Actual Performance Performance score
Financial Recovery Plan Number of employees formally informed about Financial Recovery plan
10
Credit Control & Debt Management
Number of competent staff members employed at Credit Control and Debt Management
30
Data cleansing
% decrease in incorrect data 10
Service points
Number of service points established
20
Incentive for collections Completion and implementation Incentive scheme for collection
20
Customer relations (CRM)
Completion and implementation of generic customer relations management policy norms & standards & procedures
10
Municipal Transformation & Institutional Development Strategic Objectives
Key Performance indicator Annual Target Weight Actual Performance Performance score
Effective governance % Compliance to Legislation as well as Council rules & regulations
30
Welfare services social plan (EAP)
% Compliance to Welfare and Social Plan with regard to EAP
10
PMS % Rollout of performance management system for the first 4 reporting level
30
Policy Dev. & Implement. Number of policies developed 10

232
Strategic Objectives
Key Performance indicator Annual Target Weight Actual Performance Performance score
Number of policies implemented
Skills Development % Compliance to targets in Matjhabeng and Directorates’ skills development plan
20
Good Governance Strategic Objectives
Key Performance indicator Annual Target Weight Actual Performance Performance score
Compliance auditing Number of compliance audits performed
30
Performance Auditing Number of PMS audits performed
30
Performance rewards Number of staff members rewarded for good performance
30
Updating of website Number of updates on MLM website
10
IMPROVE CUSTOMER RELATIONS Service Delivery and Infrastructure Strategic Objectives
Key Performance indicator Annual Target Weight Actual Performance Performance score
IGR % Completion and implementation of IGR Strategy and plan of action
10
Public participation (IDP) Number of IDP public participation meetings on infrastructural issues
50
Spatial development Developed spatial development framework
30
Ward committees training Number of workshops held for ward committees around infrastructural issues
10

233
Local Economic Development Strategic Objectives
Key Performance indicator Annual Target Weight Actual Performance Performance score
Skills development Number of people trained in comprehensive business planning
50
M.I.C.E Number of LED M.I.C.E held 20 SMME incubation Number of SMME’s put into
incubation programme 50
Municipal Financial Viability Strategic Objectives
Key Performance indicator Annual Target Weight Actual Performance Performance score
Consumer education Number of consumers trained in LED initiatives
50
CRM Completion and implementation of generic customer relations management policy norms & standards & procedures
20
Targeted financial management training
Number of financial training workshops
20
Political support Number of policies & directives issued
10
Municipal Transformation and Institutional Development Strategic Objectives
Key Performance indicator Annual Target Weight Actual Performance Performance score
Organizational design % Completion of the Organizational Development Programme
40
Training and Education % Managers trained through Leadership Development Programme
40
Employment equity % Compliance to targets set in the Matjhabeng LM and Directorates’ EE Plan
10
Climate study % Of survey tool developed & 10

234
Strategic Objectives
Key Performance indicator Annual Target Weight Actual Performance Performance score
implemented Good Governance Strategic Objectives
Key Performance indicator Annual Target Weight Actual Performance Performance score
Skills development Completion of executive leadership development programme for senior management
30
Performance rewards Number of staff members rewarded for good performance
30
Promotions Completion & implementation of Promotion Policy
10
Updating of website Number of updates on MLM website
10
Multi- skilling Development & implementation of multi-skilling programme
10
SEVEN NATIONAL KEY PERFORMANCE INDICATORS Key Performance Indicator Annual Target Actual Target Weight Performance score The percentage of households with access to basic level of water, electricity and waste removal
100% Water 70% Electricity 100% Waste removal
10 10 10
The percentage of households earning less than R1100 per month with access to free basic services
90% by June 2007 10
The percentage of a municipality’s capital budget actually spent on capital projects identified for a particular financial year in terms of the
100% 30

235
Key Performance Indicator Annual Target Actual Target Weight Performance score Municipal’s IDP The number of jobs created through the Municipality’s local economic development initiatives including capital projects
800 5
The number of people from the employment equity target group employed in the three highest levels of management in compliance with a municipality’s approved employment equity plan
50% of posts 5
The percentage of a municipality’s budget actually spent on implementing its workplace skills plan
20% 5
Debt recovery = (Total Operating revenue received – Operating Grants)/ Debt service payments due in the financial year. (i.e. interest + redemption). Outstanding service debtors to revenue = Total outstanding debtors to revenue / Annual revenue actually received for services. Cost coverage = All available cash at a particular time + investments/ monthly fixed operating expenditure
5 5 5