IDP 2012 english - UNHCR
70
Changing Realities, Poverty and Displacement in South East Burma/Myanmar The Border Consortium
Transcript of IDP 2012 english - UNHCR

Changing Realities,Poverty and Displacement in South East Burma/Myanmar
The Border Consortium

The Border Consortium
31 October 2012
CHANGING REALITIES, POVERTY AND DISPLACEMENT
IN SOUTH EAST BURMA / MYANMAR
With Field Assessments and Situation Updates by:
Committee for Internally Displaced Karen People Karen Office of Relief and Development
Karenni Social Welfare and Development Centre Mon Relief and Development Committee Shan Relief and Development Committee
The Border Consortium (TBC)12/5 Convent Road, Bangrak, Bangkok, 10500, Thailand [email protected] (www.theborderconsortium.org under construction)
Front cover photos :Community on the margins, Shadaw, 2012, KSWDCKaren National Union and Government of Myanmar ceasefire negotiations, Yangon, 2012, KIC

CONTENTSEXECUTIVE SUMMARY....................................................................................................................... 1
1....METHODOLOGY............................................................................................................................ 51.1 Survey Design, Data Collection and Analysis...................................................................... 61.2 Household Survey Sam ple..................... ............................................................................... 81.3 Limitations................................................................................................................................ 9
2. TRENDS IN SOUTH EAST BURMA / MYANMAR*.................................................................... 112.1 Conflict Transformation and Peace Building......................................................................... 122.2 Economic Liberalisation and the Resource Curse .............................................................. 142.3 Residual Displacement and Tentative Return....................................................................... 162.4 Chronic Poverty and Social C ap ita l...................................................................................... 18
3. STATE AND REGIONAL DYNAMICS........................................................................................... 233.1 Southern Shan State............................................................................................................... 243.2 Karenni / Kayah state ............................................................................................................ 263.3 Northern Karen / Kayin A reas................................................................................................ 283.4 Central Karen / Kayin s ta te ................................................................................................... 303.5 Southern Mon A reas............................................................................................................... 323.6 Tenasserim/Tanintharyi Region ........................................................................................... 34
4. POVERTY PROFILE....................................................................................................................... 374.1 Demographic structure .......................................................................................................... 384.2 Water, Sanitation and Shelter................................................................................................ 404.3 Education and Nutrition Status of Children .......................................................................... 444.4 Agricultural Land and A ssets ................................................................................................. 464.5 Household Income, Expenditures and D eb t......................................................................... 484.6 Food Security ..... ................................................................................................................... 524.7 Livelihood Shocks and Coping Strategies............................................................................ 54
APPENDICES ........................................................................................................................................ 591. Internally Displaced Population Estimates (2012)............................................................... 602. 2012 Survey Framework ........................................................................................................ 613. Acronyms and Place Names ................................................................................................. 64
* ‘Burma’ and ‘Myanmar’ are used interchangeably in this report, as are the corresponding place names for other towns, states and regions.
* The ‘Tatmadaw’ is the national armed forces.
CHANGING REALITIES, POVERTY AND DISPLACEMENT เท South East Burma / Myanmar

MAPSMap 1 : Household Poverty Sample .................................................................................................. 7Map 2 : Contested Areas in South East Burma/Myanmar ................................................................. 13Map 3 : Development Projects in South East Burma/Myanmar......................................................... 15Map 4 : Internally Displaced Persons in South East Burma/Myanmar .............................................. 17Map 5 : Poverty Incidence ................................................................................................................ 19Map 6 : Organisational Reach for Livelihoods Support ..................................................................... 21Map 7 : Southern Shan state ............................................................................................................ 25Map 8 : Karenni/Kayah s ta te ............................................................................................................. 27Map 9 : Northern Karen/Kayin Areas ................................................................................................. 29Map 10: Central Karen/Kayin State .................................................................................................... 31Map 11 : Southern Mon Areas ............................................................................................................. 33Map 12 : Tenasserim/Tanintharyi Region............................................................................................. 35Map 13 : Demographic Dependency ................................................................................................... 39Map 14 : Access to Citizenship............................................................................................................ 41Map 15 : Access to Safe Drinking Water ............................................................................................. 41Map 16 : Access to Sanitary Latrines .................................................................................................. 43Map 17 : Access to Durable Shelter .................................................................................................... 43Map 18 : School Attendance Rates for 5-12 year olds ........................................................................ 45Map 19 : Landlessness......................................................................................................................... 47Map 20 : Access to Cash Income ........................................................................................................ 49Map 21 : Household Expenditures on Food ........................................................................................ 51Map 22 : Prevalence of Household Debt............................................................................................. 51Map 23 : Subsistence Rice Cultivation ................................................................................................ 53Map 24 : Insufficient Rice Stocks......................................................................................................... 53Map 25 : Inadequate Food Consumption ............................................................................................ 55Map 26 : Militarisation and Restrictions on Movement ........................................................................ 57Map 27 : Extreme Coping Strategies for Food Shortages................................................................... 57
CHARTSChart 1 : Poverty Survey Sample by state and Region....................................................................... 8Chart 2 : Poverty Survey Sample by Sex and Religion ....................................................................... 8Chart 3 : Poverty Survey Sample by Ethnicity..................................................................................... 9Chart 4 : Poverty Survey Sample and Aid Beneficiaries in the Previous Year .................................... 9Chart 5 : Rates of Displacement in South East Burma/Myanmar (2003-2012) .................................. 18Chart 6 : Demographic structure in South East Burma/Myanmar....................................................... 38TABLESTable 1 : Key Poverty Indicators in South East Burma/Myanmar........................................................ 19Table 2 : Demographic structure......................................................................................................... 39Table 3 : Identity Verification................................................................................................................. 40Table 4 : Access to Sanitary Latrines .................................................................................................. 42Table 5 : Access to Durable Shelter .................................................................................................... 42Table 6 : School Attendance Rates for 5-12 year olds......................................................................... 45Table 7 : Access to Agricultural Land .................................................................................................. 47Table 8 : Access to Productive Assets................................................................................................. 47Table 9 : Main Sources of Income in Past Month ................................................................................ 49Table 10: Household Livestock Assets ................................................................................................. 49Table 11 : Household Expenditures....................................................................................................... 50Table 12 : Household Indebtedness...................................................................................................... 50Table 13 : Main Sources of R ice............................................................................................................ 52Table 14 : Household Rice Stocks......................................................................................................... 52Table 15 : Mean Food Consumption for Previous W eek....................................................................... 54Table 16 : Food Consumption by Township........................................................................................... 55Table 17 : Main Shocks to Livelihoods in the Previous Six Months....................................................... 56Table 18 : Food Shortages and Coping Strategies in the Previous Month............................................ 58
THE BORDER CONSORTIUM

fitOur government has adopted three steps to realize eternal peace. The first step is to hold the dialogue at state level. เท this level both sides must stop all hostilities, stay only at the agreed areas, not to hold any arms in other places except from those agreed areas, open liaison offices in the mutually agreed places, and fix the venue, time and date for Union level dialogue...
Second step is the Union level. The points to be discussed at this step are to secede from the Union by no means, accept Our Three Main National Causes, cooperate in economic development tasks, cooperate in elimination of narcotic drugs, take part in political process following setting up of political parties, discuss at length with other national races at Hluttaw and amend the constitution, and coordinate existence of only a single armed force in accord with the constitution....
At the third step, agreement will be signed at the Hluttaw comprising all main political players like the government, national race leaders, political parties and political forces and people s representatives... It is required to amend the constitution by common consent so as to address our needs.
President Thein Sein, Parliamentary Address for First Anniversary of the Government Inauguration, Naypitaw, 1 March 2012.
CHANGING REALITIES, POVERTY AND DISPLACEMENT เท South East Burma / Myanmar

RCSS-SSA and GoUM ceasefire negotiations^Chiang Rai, 201 า
Executive Summary

EXECUTIVE SUMMARYSimultaneous and interdependent reforms promoting democratisation, economic liberalisation and conflict transformation present a plethora of opportunities and risks for the people of Myanmar. The prospect of progressing from ceasefire agreements into a substantive process for peace and national reconciliation raises hopes for an end to protracted displacement and chronic poverty. This field survey from South East Myanmar reports encouraging signs forthe future return of displaced persons but sobering indicators about the challenge ahead for poverty alleviation.
After the government dropped demands for ceasefire groups to transform into Border Guard Forces in September 2011, the peace process gained momentum quickly. Preliminary ceasefire agreements have been negotiated with most of the major non-state armed groups to cease hostilities, separate troops, establish liaison offices and continue political dialogue. The President has stressed the importance of an “all-inclusive political process” and building trust on the basis of the “Panglong spirit” in a sequence of ceasefires, followed by economic development and then political dialogue"
However, the non-state armed groups are advocating for dialogue about political and constitutional reform to be convened outside of parliament in a National Convention to rebuild a National Accord prior to the 2015 elections. Ongoing armed conflict in Kachin State has raised questions about the government’s ability to control the National Armed Forces (the Tatmadaw), while communal violence in Rakhine State has highlighted systematic weaknesses in the rule of law and underlying racial discrimination.
Civil society groups have noted that the culture of authoritarianism and elite politics is driving the peace process but that active and broad engagement is essential if it is to be sustainable. After feeling betrayed by the exchange of ceasefire agreements for business concessions during the 1990s, informal peacebuilding processes are striving to ensure that government and armed opposition leaders are held to account.
The most significant impact of ceasefire agreements for local communities in contested areas so far has been a substantial decrease in armed conflict and attacks on civilians. Roving counter-insurgency patrols into remote areas have also decreased which has resulted in some improvement in civilian access to fields and markets. However, skirmishes have not stopped which is due primarily to the lack of troop withdrawals from sensitive areas and the lack of clarity in arrangements for the transport of supplies. There has also not yet been any significant improvement in the protection of human rights, with forced labour, extortion and land confiscation still widespread to accommodate Tatmadaw troops and new investment interests in border areas.
The Border Consortium’s (TBC’s) community-based partners have documented the destruction, forced relocation and abandonment of more than 3,700 villages since 1996, but no further villages were displaced in South East Myanmar between August 2011 and July 2012. While over 10,000 people are estimated to have been forced from their homes in the South East during the past year, this represents a significant decrease from the average rate of 75,000 people displaced each year since 2003.
This survey estimates that in total there remain at least 400,000 internally displaced persons in the rural areas of 36 townships in South East Myanmar. Approximately 37,000 formerly displaced persons attempted to either return to their villages or resettle in surrounding areas between August 2011 and July 2012. However, the sustainability of these movements remains in doubt due to ongoing concerns about physical security and livelihood opportunities.
CHANGING REALITIES, POVERTY AND DISPLACEMENT เท South East Burma / Myanmar

Peace processes and promises of inclusive and people-centered development are a welcome tonic for conflict-affected communities. However, planning for poverty reduction and early recovery initiatives has been impeded by the lack of household vulnerability data disaggregated below the state and regional level. This poverty assessment has been based on interviews with over 4,000 households spread across twenty-one townships. Analysis of standard poverty indicators has been disaggregated to the township level to provide baseline data for South East Myanmar which was not previously available. It is anticipated that this will inform more appropriate and targeted response strategies for social service, relief and development agencies alike.
This survey suggests that 59% of people in the rural communities of South East Myanmar are impoverished. Findings suggest that 47% of households surveyed cannot prove their citizenship status, 73% lack access to safe drinking water, 49% lack access to sanitary latrines and 33% of children between five and twelve years of age are not regularly attending school. A high level of subsistence agriculture is reflected by only 10% of rural households having access to farm machinery and 30% reporting no access to cash income during the previous month. Access to food is poor for more than half of the households in rural areas and only 45% of households have an adequately nutritious diet. Apart from the usual shocks to livelihoods like natural hazards and illness, 16% of households reported that military patrols had restricted access to fields and markets during the previous six months.
Impoverishment is particularly severe in the conflict-affected townships of Kyaukkyi and Shwegyin in Bago Region and Thandaung in Karen state. Food consumption analysis indicates that the diversity, frequency and nutritional value of food consumed by the communities surveyed in these townships was almost universally inadequate. Extreme coping strategies such as reducing food consumption by reverting to rice soup, selling assets and spending entire days without eating were extremely high in Kyaukkyi and Shwegyin.
Social capital has been instrumental in reinforcing community coping strategies and building resilience in the midst of protracted conflict, forced displacement and chronic poverty. The capacity and reach of community-managed assistance has primarily been developed with the support of social service and relief agencies based in Myanmar along the border with Thailand. Preliminary indications that government restrictions on access into conflict-affected areas are being relaxed thus represent a new opportunity to legitimise and add value to these local capacities so that vulnerable communities can break out of the poverty trap.
For agencies working with displaced persons, the primary challenge remains to create conditions which will support sustainable, voluntary and dignified return in safety. This implies informed consent and free choice without any form of coercion, conditions which ensure physical, legal and material security as well as the full restoration of human rights. Likewise, building accountable and responsive systems of local governance to promote access to justice and sustainable livelihoods will be essential to ensuring there is a renewable peace dividend for conflict-affected communities. Indeed, the task of transforming ceasefire agreements into a substantive process for peace and justice has only just begun.
THE BORDER CONSORTIUM

fitThe Six-point Political Program of the Ethnic Nationalities Regardingthe Peace Process
1. To develop a ‘Framework for Political Dialogue’ by organizing consultations amongst ethnic armed revolutionary groups, political parties and civil society including women and youth.
2. To hold consultations between representatives of the Union Government and ethnic armed revolutionary groups, to obtain agreement on a ‘Framework for Political Dialogue’...
3. ...To organize conferences by States and Regions, as well as by ethnic nationalities, in order to consult on the political process.
4. To hold a nationwide ‘Ethnic Nationalities’ Conference’ with representatives from ethnic armed revolutionary groups, political parties, civil society including women and youth, and experts and scholars.
5. To hold a Union Convention based on the Panglong spirit, with agreement by all parties, with equal number of representatives from the ethnic nationalities, democratic forces and the Union of Government.
6. The agreement from the convention shall be signed as ‘The Union Accord on Ethnic Nationalities’.
Ethnic Nationalities Conference statement, 16 September 2012
m CHANGING REALITIES, POVERTY AND DISPLACEMENT เท South East Burma / Myanmar

Methodology

1.1 SURVEY DESIGN, DATA COLLECTION AND ANALYSIS
TBC has been collaborating with ethnic community-based organisations (CBOs) to document the characteristics of internal displacement in South East Myanmar on an annual basis since 2002.1 Apart from assessing the scale of displacement across 36 townships, household poverty assessments have also been conducted in a cumulative total of 21 townships during the past three years.
The current survey framework was designed in 2010 with the participation of CBO partners and in consultation with humanitarian agencies based in Yangon. Relatively minor changes have been incorporated in subsequent years to respond to lessons learnt and the changing context. The framework incorporated a quantitative and spatial survey to assess displacement, militarization and development at the township level as well as a questionnaire to assess household poverty.2 This was supplemented by interviewing and documenting personal testimonies relating to issues of poverty and human rights.
A multi-stage, geographically-based cluster-sampling method has been utilized forthe household poverty survey. Atarget of 200 households in each township was established so that the results could be compared with other townships in Myanmar. Given unreliable baseline population data, each township was divided into geographic quadrants and the survey teams sought to interview 50 households in villages closest to the center of each quarter. Households were randomly selected at the village level, with a maximum cluster of 25 households in one village.
Field staff from participating CBOs were familiarized with the questionnaires and trained in surveying techniques at the beginning of each annual survey cycle. This included sampling and interviewing methods, informed consent protocols, ทาid-upper-arm-circumference (MUAC) measurements and participatory assessments. Data was collected during May and June at the beginning of the wet season in all three years, and staff returned for data entry, verification and analysis to be conducted during July and August.
เท 2012, semi-structured interviews were conducted with key informants from 36 townships to compile estimates of the internally displaced population. The displaced population estimates are generally considered conservative as it has not been possible to include urban areas. The estimates were guided by meeting all of the following criteria, which reflect international standards for identifying internally displaced persons:• Civilians who have been forced to leave or flee from their homes by armed conflict, natural disasters
or human rights abuses.• Civilians who remain in Myanmar and have not crossed an international border.• Civilians who have not been able to return to live in their former village in safety and dignity.• Civilians who have not been able to resettle in another village in safety and with dignity"
Comparative analysis for the household poverty survey has been primarily based on national statistics published by the Ministry of National Planning and Economic Development. The Integrated Household Living Conditions Assessment (IHLCA) conducted interviews with 18,660 households during December- January 2009-10 and May 2010 across all states and regions.3 The Multiple Indicator Cluster Survey (MICS) process included interviews with 29,250 households between October 2009 and March 2010.4 While all sample sizes are statistically significant and discrepancies between questions have been minimised to facilitate comparison, it is acknowledged that sampling methodologies differed and the surveys were conducted at different times of the agricultural calendar
1 See www.tbbc.org/resources/resources.htm#idps (accessed 10/10/12)2 See Appendix 23 IHLCA, 2011, Integrated Household Living Conditions Survey in Myanmar (2009-10): Poverty Profile, Ministry of National Planning
and Economic Development, UNDP and UNICEF, Yangon, http://www.mm.undp.org/ihlca/index.html (accessed 10/10/12)4 MICS, 2011, Myanmar: Multiple Indicator Cluster Survey 2009-10, Ministry of National Planning and Economic development,
Ministry of Health and UNICEF, Yangon, http://www.unicef.org/myanmar/MICS_Myanmar_Report_2009-10.pdf (accessed 10/10/12)
SB CHANGING REALITIES, POVERTY AND DISPLACEMENT เท South East Burma / Myanmar

Map 1: Household Poverty Sample 2010-12
SURVEYED VILLAGES, 2010-2012Township Household Population Village
Bilin 200 963 12Dawei 200 1133 18Hlaingbwe 200 1115 9Hpa-An 200 1320 11Hpruso 200 1162 35Mong Pan 200 784 8Myawaddy 201 1185 122012 SUB-TOTAL 1,401 7,662 105Kawkareik 206 1275 12Kyain Seikgyi 200 1070 13Monghsat 121 653 7Shadaw 200 1206 16Shwegyin 194 1528 15Tanintharyi 200 1067 17Thandaung 200 1159 15Yebyu 151 724 162011 SUB-TOTAL 1,472 8,682 111Hpapun 200 1290 17Hpasawng 200 1289 16Kyaukkyi 200 2089 38Mongton 200 825 6Palaw 200 1280 18Ye 200 1113 122010 SUB-TOTAL 1,200 7,886 107TOTAL 4,073 24,226 323
Map Creation Date: 12 Oct., 2012 Thematic Data: TBC, CIDKP, KORD, KSWDC, SRDC, MRDC Boundaries & Symbols: MIMU, Esri Projection/Datum: UTM Zone 47 N/WGS 1984
Disclaimer: The names and boundaries used here do not imply endorsement by TBC.
THE BORDER CONSORTIUM

1.2 HOUSEHOLD SURVEY SAMPLE
Over 4,000 households representing more than 24,000 individuals from 323 villages in 21 townships spread across 6 states and regions have been interviewed forthis assessment of poverty, as represented in Map 1 and Chart 1. This sample consists of 1,200 households from 6 townships in 2010, 1,472 households from 8 townships in 2011 and 1,401 households from 7 townships in 2012. Results for the respective years should not be disaggregated and utilised to assess trends in South East Myanmar as the surveys were conducted in different townships each year.
Chart 1 : Poverty Survey Sample by state and Region
Shan State (521)
Kayah state (600)
Kayin State (1,408)
Bago Region (394)
Mon State (399)
Tanintharyi (751)
200
194200199
200 200200
602606
2012 (1,401 households)
2011 (1,472 households)
12010 (1,200 houesholds)
351
100 200 300 400
Surveyed households (4,073 in total)
500 600 700
0
0
0
The demographic composition of respondents to the household survey was broadly representative of the general population, although there was an ethnic bias to the Karen. Chart 2 indicates that there was a fair gender balance as well as religious diversity amongst the survey respondents. Government data suggests that, if anything, there is an inverse relationship between female-headed households and poverty.5 However, recognising the inherent bias in categorizing two-parent households as being headed by the male, respondents were not asked to identify a household head in this survey.
Chart 2 : Poverty Survey Sample by Sex and Religion
The prominence of Sgaw Karen respondents is documented in Chart 3 and reflects the enhanced capacity of Karen CBOs to survey triple the number of townships compared to Shan, Karenni and Mon partners. Apart from the six main ethnic groups identified in Chart 3, respondents from the Kayan, Lahu, Burman, PaO, Tavoyan and Monnepwa ethnic groups were also surveyed.
All the participating CBOs deliver cash transfers in South East Myanmar, but the sampling method for the poverty assessment was conducted independently of targeting processes for the distribution of aid. Chart 4 illustrates that only 17% of survey respondents during the past three years had received cash transfers during the previous 12 months, and that none of those surveyed in 2012 had recently been a beneficiary. This reflects positively on the representative nature of the sampling method.
5 IHLCA, 2011, op. cit., page 34
^ CHANGING REALITIES, POVERTY AND DISPLACEMENT เท South East Burma / Myanmar

Chart 3 : Poverty Survey Sample by Ethnicity
Other (10%)
Kayah (6%)
pwo Karen (7%)
Paku (7%)
Mon (8%)
Shan (13%)
Sgaw Karen (49%)
■ 18%
■ 14%
16%14%
2012 I 2011 I 2010
9%
1%
11%ว0/3%3%
0%
16%
18%67%
45%
0% 10% 30% 50% 70%
Chart 4 : Poverty Survey Sample as Aid Beneficiaries in the Previous Year
1.3 LIMITATIONSRestricted access, insecurity, capacity constraints and the lack of credible baseline data have been the main limitations in compiling this survey. Due to a combination of these factors, it was not possible to conduct the survey simultaneously in all townships which would have been preferable. Instead, the surveys were conducted progressively over three years, during the same months each year to minimize seasonal variations. This period included an escalation of conflict related to the Border Guard Forces in 2011 and then the negotiation of ceasefire agreements in 2012. Given the rapidly changing political context there may be some externalities which are not accounted for in the comparative poverty analysis between townships.
The lack of independent population data in conflict affected areas prevented a population-based sampling method, while security constraints and restrictions on access undermined the geographically-based sampling method. เท particular, the villages surveyed in Shan state, Hlaingbwe and Hpa-an did not cover all quadrants of the respective townships, while the geographic distribution of villages in Shadaw has been skewed by forced relocation and landmines.
The lack of credible baseline data is a general limitation that this survey is attempting to address. Government data is only disaggregated to the state and Regional level, which is of limited value in terms of informing poverty alleviation responses. Restrictions on access have meant that pockets of extreme vulnerability are not necessarily taken into account. Further, there has been a culture of data manipulation such that statistics tend to disguise the extent of impoverishment.
The capacity of TBC and CBO partners to design and conduct surveys can also be improved. During data collection, the target sample sizes were not reached in Yebyu and Monghsatdueto time management weaknesses. Some children aged between 6 and 59 months did not accompany the household respondent at the point of survey, and so MUAC surveys were not comprehensively conducted. Similarly, households in Monghsat were only asked which food items had been eaten during the previous week and not the frequency and so food consumption assessments could not be analysed in comparison with other townships.
THE BORDER CONSORTIUM m

fitWhile the country is marching with a new modern system, the Tatmadawwill have to discharge the duties of the state in accord with the 67thAnniversary Armed Forces Day Objectives:
(a) To strictly uphold the objectives namely, non-disintegration of the Union, non-disintegration of national solidarity and perpetuation of sovereignty;
(b) To play the leading role in the national politics by the Tatmadaw with Union spirit, the true patriotism;
(c) To safeguard the constitution, the main duty of the Tatmadaw in building up a modern, developed, new democratic nation;
(d) To build strong, competent, modern, patriotic Tatmadaw to safeguard the independence and sovereignty of the nation.
General Min Aung Hlaing, Commander-in-Chief of Defense Services, Armed Forces Day Speech, Naypitaw, 27 March 2012.
n l CHANGING REALITIES, POVERTY AND DISPLACEMENT เท South East Burma / Myanmar


2.1 CONFLICT TRANSFORMATION AND PEACE BUILDING
“If this peace agreement breaks down, our life will be worse than before. เท our history, we have been cheated by the Burmans many times. We do not trust them, and the Burmans do not trust us. Our ancestors said that when we eat fruit from a fig tree, we should also listen for arrows. We have to be cautious. ”
Karen man, Dawei Township, June 2012, CIDKP focus group discussion
Myanmar’s post-colonial history has been plagued by protracted armed conflict between the constituent ethnic nationalities of the modern nation state. There have been a few windows of opportunity to reconcile the union which have failed, but the government’s peace initiative during the past year has raised hopes that a political solution is still attainable. As the reforms have evolved from the former regime’s road map to disciplined democracy, there have inevitably been doubts about the sincerity of the Tatmadaw. While regional integration with the ASEAN Economic Community in 2015 is also likely to have been a motivating factor, the government has generally negotiated in good faith and the ethnic nationalities have engaged pragmatically to build confidence in the process.
The speed at which the peace process has developed has been surprisingly fast given the protracted legacy of war, oppression and suspicion. When the new government assumed office in March 20111 tensions were rising due to the pressure on ceasefire groups to transform into Border Guard Forces underTatmadaw control. Indeed, long term ceasefire agreements with the Shan state Army-North (SSA-N) and the the Kachin Independence Organisation (KIO) respectively broke down shortly afterwards. However, by September 2011 the government had dropped its insistence on the formation of Border Guard and militia forces and re-affirmed ceasefire agreements with the United Wa state Army (UWSA) and the National Democratic Alliance Army (NDAA-Mongla). These commitments to cease hostilities, establish liaison offices, separate troops and havefurtherdialogue became the blueprint for negotiating initial ceasefire agreements with all the main non-state armed groups apart from the KIO during subsequent months.6
On the first anniversary of the government’s inauguration, the President stressed in a speech to parliament the importance of an “all-inclusive political process” and building trust on the basis of the “Panglong spirit”. A three step process was identified for the realization of peace, which started with state-level dialogue about stopping armed conflict. The second step was characterized as Union level dialogue including the registration of political parties and unification of the national armed forces, as well as cooperation in economic development and the elimination of illicit drugs. Negotiating political agreement and constitutional reform in the parliament was identified as the third step.7
The ethnic nationalities have raised a number of objections to this process. Given their 17 years of experience in a ceasefire during which their efforts at constitutional reform and political participation were systematically blocked, the KIO wants to prioritise political reforms above a military ceasefire. Concerns have also been raised that the political causes of conflict may be superficially treated given the sequencing of ceasefires, then economic development and only political dialogue after the opposition groups have returned to the legal fold and laid down their arms. Non-State armed groups and civil society are also advocating fordialogue about political and constitutional reform to be convened outside of parliament in a National Convention like the Panglong Conference in 1947 to rebuild a National Accord prior to the 2015 elections.8
Civil society groups have also raised concerns that the culture of authoritarianism and elite politics is driving the peace process but that active and broad engagement is essential if it is to be sustainable. After feeling betrayed by the exchange of ceasefire agreements for business concessions during the 1990s, informal peace-building processes have been facilitated amongst local communities to ensure that leaders of both the government and non-state armed groups are held to account. Ratherthan waiting to see what will eventuate, civil society leaders in both government and border areas are informing and consulting local communities and advocating to political leaders in order to promote a popular agenda and legitimacy in the peace process.
6 TNI-BCN, February 2012, “Ending Burma’s Conflict Cycle? Prospects for Ethnic Peace”, Burma Policy Briefing No. 8, http://www.tni.org/briefing/ending-burmas-conflict-cycle?context=70443 (accessed 10/10/12)
7 President Thein Sein, 1 March 2012, Third Regular Session of the Union Parliament, Reprinted in the “New Light of Myanmar”,2 March 2012, page 6, http://www.burmalibrary.org/docs13/NLM2012-03-02.pdf (accessed 10/10/12)
8 Ethnic Nationalities Conference, 16 September 2012, “The Six-point Political Programme of the Ethnic Nationalities Regarding the Peace Process, http://euro-burma.eu/doc/PM_No._28_-_27-09-12.pdf (accessed 10/10/12)
CHANGING REALITIES, POVERTY AND DISPLACEMENT เท South East Burma / Myanmar

Map 2 : Contested Areas in South East Burma/Myanmar
qf'Bengaf
Tatmadaw Troops
Regional Command
Light Infantry Division
^ Military Operational Command
Battalion Headquarters
★ BGF/Militia Battalion HQ
Ceasefire Liaison Offices
ALP (Kyauktaw, Paletwa)
CNF (Tedim, Thantlang, Matupf
KNPP (Loikaw, Shadaw, Hpasawng)
KNU (Kyaukkyi, Myawaddy, Hpayathonesu, Dawei)NMSP (Mawlamyine, Mudon, Thanbuzayat,Ye, Yebyu, HpayatJnonesu, Kyaikmaraw, Zin Kyaik)SSA-S (Kengtung, Taunggyi, Kho Lam, Muse, Tachileik, Monghsat)
Areas of Armed Group Influence
Shan State progress Party/Shan state Army (SSPP/SSA)
Restoration Council of the Shan state (RCSS/SSA)
National Democratic Alliance Army (NDAA)
United Wa state Army (UWSA)
Pa-O National Liberation Organization (PNLO)
Karenni National Progressive Party (KNPP)
Karenni Nationalities People's Liberation Front (KNPLF)
Karenni National Peace & Development Party (KNPDP)
Democratic Karen Buddhist Army (DKBA)
Karen Peace Council (KPC)
New Mon state Party (NMSP)
* Karen National Union (KNU)
Map Creation Date: 12 Oct., 2012Thematic Data: TBC, CIDKP, KORD, KSWDC, SR DC, MR DC Boundaries & Symbols: MIMU, OCHA Projection/Datum: UTM Zone 47 N/WGS 1984
Disclaimer: The names and boundaries used here do not imply endorsement by TBC.
THE BORDER CONSORTIUM
The most significant impact of ceasefire processes in contested areas up until October 2012 has been a substantial decrease in armed conflict and attacks on civilians. However skirmishes have not stopped, which can primarily be attributed to the lack of clarity in arrangements for the transport of supplies and the Tatmadaw’s refusal to withdraw troops from sensitive areas. Roving counter-insurgency patrols into remote areas have also decreased, which has had a commensurate effect on the commission of conflict- related human rights abuses and resulted in some improvement for civilian access to fields and markets. Nonetheless, there has been not been much improvement in the protection of human rights more generally with forced labour, extortion and land confiscation still widespread to accommodate Tatmadaw troops and new business interests in border areas.Moving the process from ceasefires to political dialogue will be a defining challenge forthe peace process. The reformers in government have consolidated their authority to address this challenge through the establishment of Union-level Peacemaking Committees in May 2012 and the Cabinet reshuffle in August 2012. Similarly, the non-state armed groups have clarified a common political vision through establishing a Working Group for Ethnic Coordination and facilitating an Ethnic Nationalities Conference in SeptemberThe ongoing armed conflict in Kachin state, recent communal violence in Rakhine state, as well as the impacts of reforms for democratization and economic liberalisation are all factors which could destabilize the government and derail the peace process. However, perhaps the greatest challenge will be complementing the peace process with enhanced access to justice forthe restoration of human rights. This will be largely dependent on the government’s capacity to control the Tatmadaw, to promote accountability and to end the climate of impunity with which widespread and systematic abuses have been committed in conflict-affected areas. Acknowledging victims and survivors of past abuses will be key for national reconciliation and building mechanisms for the impartial rule of law to prevent future abuses will be essential to sustaining the peace.
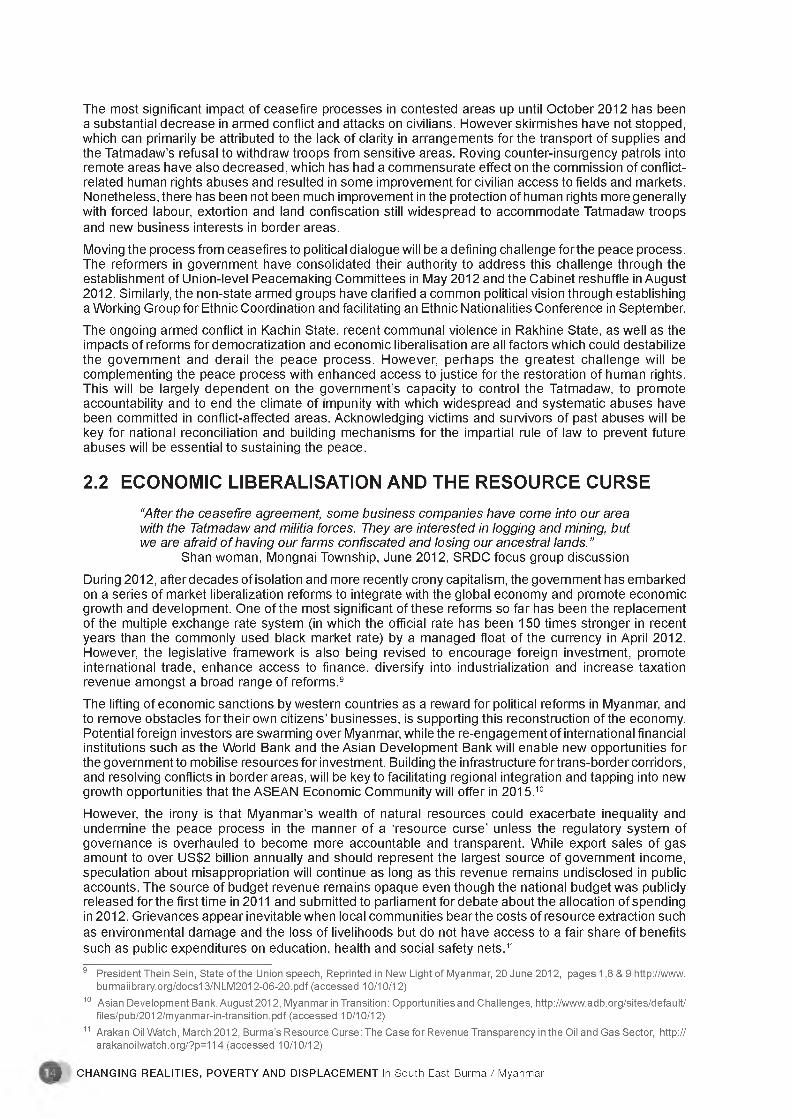
2.2 ECONOMIC LIBERALISATION AND THE RESOURCE CURSE“After the ceasefire agreement, some business companies have come into our area with the Tatmadaw and militia forces. They are interested in logging and mining, but we are afraid o f having our farms confiscated and losing our ancestral lands.”
Shan woman, Mongnai Township, June 2012, SRDC focus group discussion
During 2012, after decades of isolation and more recently crony capitalism, the government has embarked on a series of market liberalization reforms to integrate with the global economy and promote economic growth and development. One of the most significant of these reforms so far has been the replacement of the multiple exchange rate system (in which the official rate has been 150 times stronger in recent years than the commonly used black market rate) by a managed float of the currency in April 2012. However, the legislative framework is also being revised to encourage foreign investment, promote international trade, enhance access to finance, diversify into industrialization and increase taxation revenue amongst a broad range of reforms.9The lifting of economic sanctions by western countries as a reward for political reforms in Myanmar, and to remove obstacles for their own citizens’ businesses, is supporting this reconstruction of the economy. Potential foreign investors are swarming over Myanmar, while the re-engagement of international financial institutions such as the World Bank and the Asian Development Bank will enable new opportunities for the government to mobilise resources for investment. Building the infrastructure fortrans-border corridors, and resolving conflicts in border areas, will be key to facilitating regional integration and tapping into new growth opportunities that the ASEAN Economic Community will offer in 2015.10However, the irony is that Myanmar’s wealth of natural resources could exacerbate inequality and undermine the peace process in the manner of a ‘resource curse’ unless the regulatory system of governance is overhauled to become more accountable and transparent. While export sales of gas amount to over US$2 billion annually and should represent the largest source of government income, speculation about misappropriation will continue as long as this revenue remains undisclosed in public accounts. The source of budget revenue remains opaque even though the national budget was publicly released forthe first time in 2011 and submitted to parliament for debate about the allocation of spending in 2012. Grievances appear inevitable when local communities bearthe costs of resource extraction such as environmental damage and the loss of livelihoods but do not have access to a fair share of benefits such as public expenditures on education, health and social safety nets.11
9 President Thein Sein, state of the Union speech, Reprinted in New Light of Myanmar, 20 June 2012, pages 1,8 & 9 http://www. burmaiibrary.org/docs13/NLM2012-06-20.pdf (accessed 10/10/12)
10 Asian Development Bank, August 2012, Myanmar in Transition: Opportunities and Challenges, http://www.adb.org/sites/default/ files/pub/2012/myanmar-in-transition.pdf (accessed 10/10/12)
11 Arakan Oil Watch, March 2012, Burma’s Resource Curse: The Case for Revenue Transparency in the Oil and Gas Sector, http:// arakanoilwatch.org/?p=114 (accessed 10/10/12)
โฐ CHANGING REALITIES, POVERTY AND DISPLACEMENT เท South East Burma / Myanmar
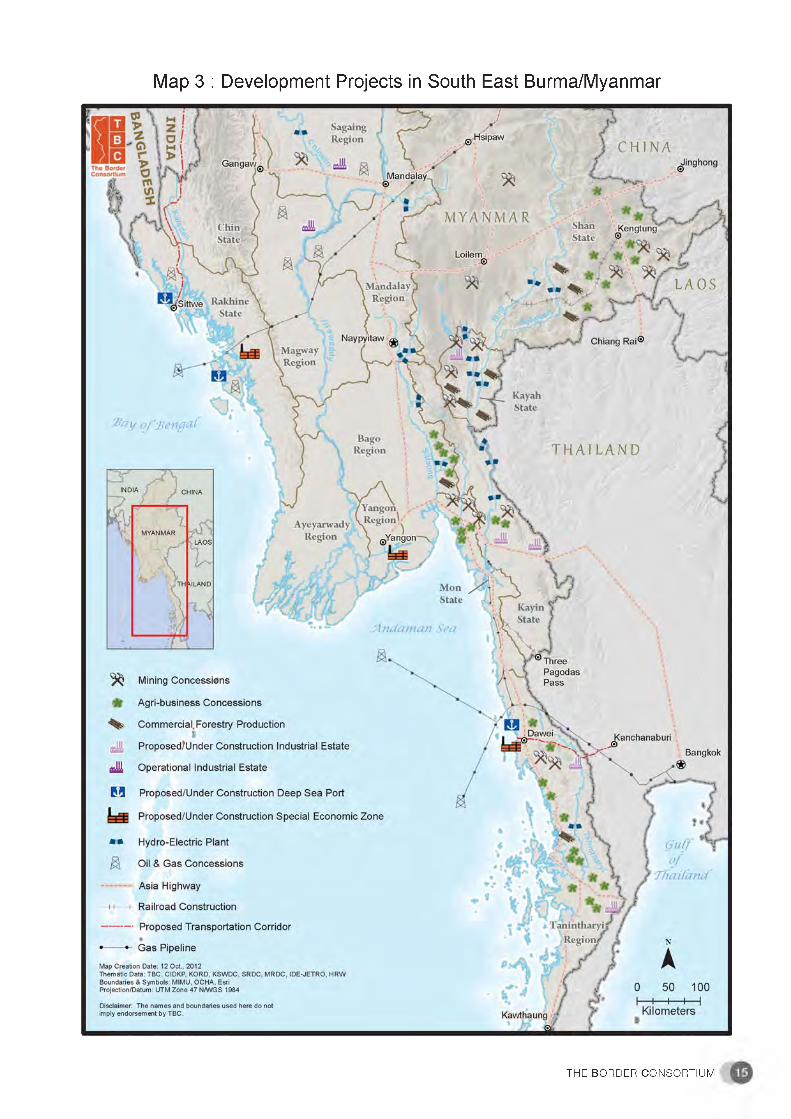
Map 3 : Development Projects in South East Burma/Myanmar
THE BORDER CONSORTIUM

Given the weak regulatory environment, the ethnic nationalities have lobbied the government to place greater emphasis on the implementation of ceasefire agreements, rather than economic development perse, in the peace process. Fears abound that proposals for gas and oil extraction, hydro-electric dams, Special Economic Zones, industrial estates, deep sea ports and other large scale infrastructure projects in ethnic areas may aggravate a new round of tensions and derail the momentum for a negotiated political settlement to armed conflict. While the reforms have broken some of the monopolies and tax breaks previously enjoyed by the military’s economic holding companies, special privileges and access to decision makers will enable the Tatmadaw’s companies to maintain a dominant position in the economy. Suspicions that leaders of non-state armed groups may also benefit from dubious business concessions risk undermining their credibility amongst constituents. The splintering of armed groups would be a severe setback for efforts to promote national reconciliation.12
The human rights implications of development in Myanmar have widely been associated with increased militarization inducing forced labour, property confiscation, forced relocation and extortion. Land-grabbing has come under increased scrutiny during the past year with the passage of two land reform bills, the increased focus on industrialization and improvements in security in ethnic areas. While the 2008 Constitution asserts that all land remains the property of the state and can be nationalized if necessary, legislative reforms have at least recognised that land tenure rights can be sold, traded or mortgaged. However, by failing to recognize customary land user rights and removing size limits for procurement, the reforms have facilitated land grabbing by commercial investors.13
2.3 RESIDUAL DISPLACEMENT AND TENTATIVE RETURN“The village leaders told us to come back because our land would be confiscated by the Tatmadaw otherwise. So I returned and was staying at my cousin’s house when I heard the sound o f a bulldozer from the direction o f my land. I went there straight away and saw all my betel nut trees had already been uprooted. ”
Karen Man, Sukali, Myawaddy Township, May 2012, CIDKP interview.
TBC’s partner agencies have documented the destruction, forced relocation or abandonment of more than 3,700 villages in South East Myanmar since 1996, with some of these field reports having been independently verified by high resolution commercial satellite imagery.14 For decades the forced displacement of communities in contested areas has been a cornerstone of the Tatmadaw’s counterinsurgency strategy, which has aimed to undermine the armed opposition’s access to information, supplies, finance and recruits. Civilians who have not complied with orders to relocate into government controlled areas have been considered sympatheticto the rebels and subsequently targeted forabuse in contravention of international humanitarian law.
Rates of forced displacement in South East Myanmar during the past decade have averaged around 75,000 people per year, although the highest and lowest rates have been recorded during the past two years respectively. The instability associated with orders for non-state armed groups to transform into Border Guard Forces induced an increase in displacement in 2011, while the subsequent negotiation of preliminary ceasefire agreements has resulted in a significant decrease in 2012. Indeed, TBC partners have not documented the destruction, forced relocation or abandonment of any villages between August 2011 and July 2012 and are estimating the displacement of 10,000 people during this period. While this remains a substantial human rights concern, it also represents a marked improvement on previous years. Ongoing displacement has primarily been reported from areas of central Shan state where conflict between the Tatmadaw and the Shan state Army-North (SSA-N) continues despite a preliminary ceasefire agreement, and in Hpapun Township in relation to conflict between the Tatmadaw’s Border Guard Force and the Karen National Union (KNU).
Despite the preliminary ceasefire agreements, at least 400,000 internally displaced persons are estimated to remain in the rural areas of South East Myanmar, as documented in Appendix 1 and represented spatially in Map 4. This represents a decrease of approximately 50,000 people during the pastyearwhich is primarily attributed to the return and resettlement of 37,000 people and the inability to survey 7 townships where 15,000 people were estimated to be internally displaced in 2011. It is also partly due to displacement further into Thailand and more accurate survey estimates due to greater freedom of movement for field staff.
12 International Crisis Group, 27 July 2012, Myanmar: The Politics of Economic Reform, Asia Report No. 2311 http://www.crisisgroup. org/en/regions/asia/south-east-asia/burma-myanmar.aspx
13 Kyaw Kyaw, 25 August 2012, Land Reform Key to Burma’s Future, The Diplomat, http://thediplomat.com/2012/08/25/land-reform- key-to-burmas-future/ (accessed 10/10/12)
14 American Association for the Advancement of Science, 2007, High Resolution Satellite Imagery and the Conflict in Eastern Burma, http://shr.aaas.org/geotech/burma/burma.shtml (accessed 10/10/12)
51 CHANGING REALITIES, POVERTY AND DISPLACEMENT เท South East Burma / Myanmar

Map 4 : Internally Displaced Persons in South East Burma/Myanmar
MONG HSU
ShanState
Map Creation Date: 12 Oct., 2012Thematic Data: TBC, CIDKP, KORD, KSWDC, SRDC, MRDC Boundaries & Symbols: MIMU, OCHA Projection/Datum: UTM Zone 47 N/WGS 1984
Disclaimer: The names and boundaries used here do not imply endorsement by TBC.
States, Regions & Townships
TotalIDPs
(2012)SHAN STATE 125,400Mawkmai 3,300Mongkaung 3,600Laikha 16,500Loilem 1,900Nangsan 6,800Kunhing 7,800Monghsat 31,000Mongton 30,000Mongpan 3,900Kyethi 10,700Langkho 1,900Mongnai 3,000MongHsu 5,000KAYAH STATE 34,600Shadaw 1,140Loikaw 3,220Demoso 9,350Hpruso 5,880Bawlakhe 1,970Hpasawng 8,570Mese 4,470BAGO REGION 44,200Kyaukkyi 33,000Shwegyin 11,200KAY IN STATE 89,150Thandaung 16,000Hpapun 41,000Hlaingbwe 5,000Myawaddy 4,150Kawkareik 2,300Kyain Seikgyi 20,700MON STATE 35,000Ye 35,000TANINTHARYI REGION 71,650Yebyu 23,500Dawei 5,600Thayetchaung 4,100Palaw 14,540Myeik 6,050Tanintharyi 14,640Bokpyin 3,220TOTALS 400,000
Q u (f
T fia ila n c f
^ 0 50 100
Kilometers
THE BORDER CONSORTIUM

Chart 5: Rates of Displacement in South East Myanmar (2003-2012)
เท other regions of Myanmar, estimates for internally displacement caused by armed conflict in Kachin State and northern Shan state range from 65,000 to 100,000 people,15 while 75,000 civilians are currently internally displaced in Rakhine state as a result of communal violence.16 Given smaller pockets of development-induced displacement across the country, the most conservative estimate of internally displaced persons in Myanmar remains well over half a million people.
Approximately 37,000 formerly displaced persons have attempted to either return to former villages or resettle in surrounding areas of South East Myanmar during the past 12 months. This estimate primarily reflects the return and resettlement of 27,000 people who were displaced to the border with Thailand after the 2010 election when a breakaway group from the Democratic Karen Buddhist Army (DKBA) resumed armed resistance in Myawaddy and Kyain Seikkyi Townships. However, the sustainability of these movements remains in doubt due to ongoing concerns about security and livelihood opportunities. เท many cases, only one or two members of a household have gone to assess the situation and cultivate agricultural fields or otherwise attempt to re-establish their livelihood while the others remained in temporary settlements.
The challenge remains to create conditions which will support the sustainability of these initial population movements and facilitate the voluntary return in safety and with dignity of internally displaced persons in Myanmar and refugees from Thailand. Voluntary return incorporates informed consent and free choice without any form of political, physical, psychological or material coercion. Returning in safety implies physical security (including protection from armed conflict and landmines), legal security (including public assurances of non-discrimination and access to justice) and material security (including access to land and support from humanitarian agencies). Returning with dignity relates to the full restoration of human rights including access to citizenship.17
2.4 CHRONIC POVERTY AND SOCIAL CAPITAL
“We have great hopes for peace but we still have doubts about the process. We can’t trust the ceasefire agreement 100%, but only about 50%. If the ceasefire can be sustained, people’s livelihoods will become more stable. There hasn’t been much change in the short period so far, but at least we can say that we are more confident. ”
Karenni Woman, Phruso Township, June 2012, KSWDC interview
Chronic poverty is widespread across Myanmar, with even government figures estimating that a quarter of the population live in poverty and are unable to cover their basic needsT Official statistics suggest that poverty is generally twice as high in rural areas compared to urban areas, and that the highest rates of
15 UN OCHA, 26 July 2012, Kachin Response Plan: March 2012-February 2013 (June Revision), page 5, http://www.themimu. info/docs/Kachin%20Plan_June_20120823.pdf (accessed 10/10/12); Kachin Womens Association of Thailand, October 2012, From Persecution to Deprivation http://www.kachinwomen.com/publications/reports/103-from-persecution-to-deprivation.htmi (accessed 10/10/12)
16 UN OCHA, 5 October 2012, Myanmar: Displacement in Rakhine state, Situation Update No. 9, page 11 http://unic.un.org/imucms/ userfiles/yangon/file/Rakhine%20SitRep%239.pdf (accessed 10/10/12)
17 UNHCR, 1 June 2012, “Framework for Voluntary Repatriation: Refugees from Myanmar in Thailand”, Annex II.
g l CHANGING REALITIES, POVERTY AND DISPLACEMENT เท South East Burma / Myanmar

Table 1: Key Poverty Indicators Map 5: Poverty Incidence
Tow
nshi
p, s
tate
/ R
egio
n
Lack
ac
cess
to
safe
drin
king
wat
er
Lack
ac
cess
to
impr
oved
sa
nita
tion
Lack
ac
cess
to
qual
ity
shel
ter
Inad
equa
te
food
cons
umpt
ion
Debt
ind
uced
by
food
shor
tage
s
Com
posi
te
Pove
rty
Indi
cato
r
Monghsat, Shan (2011) 82% 10% 99% n/a 48% 60%
Mongton, Shan (2010) 20% 8% 59% 13% 25% 25%
Mongpan, S han(2012) 86% 20% 94% 38% 19% 51%
Shadaw Kayah (2011) 79% 21% 83% 62% 31% 55%
Hpruso Kayah (2012) 39% 41% 47% 59% 39% 45%Hpasawng Kayah (2011) 99% 96% 97% 85% 20% 80%
Thandaung Kayin (2011) 99% 90% 73% 98% 65% 85%
Hpapun, Kayin (2010) 96% 86% 96% 67% 38% 77%
Hlaingbwe Kayin (2012) 99% 98% 98% 68% 1% 73%
ร - ท โ 2012, 43% 81% 75% 43% 40% 56%
Myawaddy Kayin (2012) 87% 65% 73% 37% 19% 56%
Kawkareik Kayin (2011) 60% 37% 57% 33% 27% 43%
Kyain Seikgyi Kayin (2011) 84% 34% 55% 46% 24% 49%
Kyaukkyi Bago, (2010) 51% 99% 99% 99% 92% 88%Shwegyin Bago (2011) 98% 88% 99% 94% 56% 87%
ะ , 2012) 52% 77% 83% 42% 44% 60%
YeMon (2010) 58% 11% 81% 37% 32% 44%
Tanintharyi (2011) 65% 9% 72% 74% 52% 54%
Tanintharyi (2012) 67% 4% 74% 17% 23% 37%
PalawTanintharyi (2010) 82% 27% 99% 57% 39% 61%
Tanintharyi Tanintharyi (2012) 77% 3% 90% 33% 26% 46%
Average 73% 49% 80% 55% 36% 59%
THE BORDER CONSORTIUM ®
poverty are found in Chin state, Rakhine state, Tanintharyi Region and Shan state. However, given conflicting results between key indicators, “caution is urged in the interpretation of data on poverty levels and trends”.18
Decades of military rule were characterised by gross economic mismanagement, massive underinvestment in social services and an environment where human rights were abused with impunity. The lack of income and assets has been related to macro-economic instability, low levels of agricultural productivity, fragmentation of agricultural land, a small manufacturing sector, inadequate infrastructure support, and dependence on natural resource-based exports amongst other factors.19 These problems were exacerbated by armed conflict and restrictions on humanitarian access in many border areas.
The poverty assessments conducted by TBC’s community-based partner agencies across 21 townships during the past three years suggest that almost two thirds of households in rural areas in South East Myanmar are unable to meet their basic needs. This estimate is derived from the average findings for five key indicators of the standard of living and well-being. These indicators are access to safe drinking water, improved sanitation, adequate shelter, food security and indebtedness. As documented in Table 1 and Map 5, impoverishment is particularly severe in the conflict-affected areas of Kyaukkyi and Shwegyin Townships in Bago Region and Thandaung Township in Karen state.
President Thein Sein’s government has responded to these challenges by promising inclusive and people- centered development strategies. Eight key sectors have been identified for rural development and poverty alleviation which are the development of agricultural productivity; livestock breeding and fisheries; rural productivity and cottage industries; micro-saving and credit associations; rural cooperatives; rural socio-economy; rural energy and environmental conservation.20 Workshops are being facilitated with participation from the private sector, public servants, civil society and academia to identify regional and sectoral priorities and draft a National Development Plan during the second half of 2012. Although the process remains bureaucratic, the rhetoric regarding poverty alleviation and rural development is nonetheless a welcome change from the previous focus on economic growth.
Given that restrictions on humanitarian access into conflict-affected areas have characterised government policy for decades, remote communities in South East Myanmar have had little choice but to care for their own. Networks of trust, otherwise referred to as social capital, have been instrumental in reinforcing community coping strategies and building resilience in the midst of protracted conflict and chronic poverty. Over the past twenty years, the capacity and reach of community-managed assistance has primarily been developed with the support of social service and relief agencies based in Myanmaralong the border with Thailand. The recent relaxation of government restrictions on access into some conflict-affected areas thus represents a new opportunity to legitimise and add value to this social capital so that vulnerable communities can break out of the poverty trap.
Map 6 highlights how aid agencies based along the border complement the efforts of agencies based in Yangon to reinforce livelihoods. Comparable maps are also available forthe health and education sectors.21 While the border based responses are predominately managed by community-based organisations, this map reflects how livelihood support initiatives from Yangon are generally led by United Nations’ agencies and international non-governmental organisations. As the peace process evolves and opportunities to expand humanitarian access into conflict-affected areas increase, the challenge will be to ensure that international agencies build on the local capacities of these community-managed approaches. Similarly, in the health and education sectors, the challenge is to integrate state administrative systems with the social service agencies of the ethnic nationalities to develop more comprehensive and effective health and education systems.
18 IHLCA, 2011, op. at., page xi19 ADB, 2012, Draft Interim Country Partnership strategy: Myanmar 2012-2014, Poverty Analysis: Summary http://www.adb.org/
sites/default/files/mya-interim-2012-2014-pa.pdf (accessed 10/10/12)20 Daw Win Myint, Deputy Director General, Planning Department, 13 February 2012, “Policies for Growth and Development of
Myanmar” , presentation to the Conference on Development Policy Options for Myanmar, Naypitaw.21 See http://www.tbbc.org/idps/maproom.htm
n l CHANGING REALITIES, POVERTY AND DISPLACEMENT เท South East Burma / Myanmar

Map 6 : Organisational Reach for Livelihoods Support
Myanmar Information Management Unit 3W South East of Myanmar
LivelihoodsBorder and Country Based Organizations Presence by Township
MANDALAY J j 261
CHIN
Kayah state
Map Index TOWNSHIP_NAME Border Based Organization Country Based Organization
019 Lolkaw FBR, KnYO, KSWDC SDI, UNDP, w v020 Demoso FBR, KEG, KSWDC ACF, CARE, Metta021 Hpruso FBR, KEG, KnYO, KSWDC ACF022 Shadaw FBR, KSWDC023 Bawlakhe FBR, KSWDC024 Hpasawng FBR, KSWDC025 Mese
Kayln state
Map Index TOWNSHIP_NAME Border Based Organization Country Based Organization
026 Hpa-An aDKP, FBR, KORD ADRA, UNDP, UNHCR027 Hlaingbwe QDKP, FBR, KORD ADRA, WV028 Hpapun aDKP, FBR, KORD, KWO.TBBC ADRA029 rhandaunggyi aDKP, FBR, KORD Metta, UNHCR030 Myawaddy aDKP, FBR031 Kawkareik aDKP, FBR ADRA032 Kyainseikgyi aDKP, FBR, KWO, MRDC, TBBC
Tanintharyi Region
Map Index TOWNSHIPNAME Border Based Organization Country Based Organization
079 Dawel aDKP, FBR, KWO w v080 Launglon081 Thayetchaung CIDKP.FBR082 Yebyu CIDKP, MRDC083 Myeik FBR084 Kyursu085 Palaw CIDKP.FBR w v086 Tanlrrtharyf CIDKP,FBR UNHCR087 Kawthoung088 Bokpyln CIDKP, FBR UNHCR
Bago (East) Region
Map Index TOWNSHIP_NAME Border Based Organization Country Based Organization
089 Bago090 Thanatpin091 Kawa092 Waw093 Nyaungiebin094 Kyauktaga095 Daik-U096 shwegyin CIDKP, FBR, KORD097 Taungoo098 Yedashe099 Kyaukkyi CIDKP, FBR, KORD100 Phyu101 Oktwin102 Htantabin FBR
Mon State
Map Index TOWNSHIPNAME Border Based Organization
173 Mawlamylne UNHCR174 Kyalkmaraw UNDP175 Chaungzon176 Thanbyuzayat UNHCR, WV177 Mudon178 Ye MRDC, TBBC UNHCR179 Thaton CIDKP UNHCR, wc180 Paung181 Kyalkto UNDP, WC182 Bllln CIDKP, KORD, KWO UNDP, WC
Shan (South) State
Map Index TOWNSHIP_NAME Border Based Organization Country Based Organization
245 Taunggyi Metta, SWISSAJD246 Nyaungshwe DM, MCS, Saetanar, UNDP247 Hopong SRDC Metta, Saetanar, SWIS5AID, UNODC248 Hsihseng FAO, Metta, Saetanar, SW1SSAID249 Kalaw CDN,FAO, Saetanar, UNDP250 Pindaya UNDP251 Ywangan UNDP252 Lawksawk Saetanar253 Pinlaung Metta, Saetanar, UNDP254 Pekon Metta, Saetanar, UNDP255 น)!๒ท UNODC256 Lalhka FBR257 Nansang258 Kunhing FBR259 Kyethl FBR, SRDC260 Mongksung FBR MCS261 Monghsu SRDC262 Langkho FBR263 Mongnai264 Mawkmai Metta265 Mongpan FBR, SRDC, TBBC
Shan (East) state
Map Index TOWNSHIPNAME Border Based Organization Country Based Organization
290 Kengtung SWISSAID, WV291 Mongkhet292 Mongyang293 Mongla294 Monghsat SRDC, TBBC295 Mongplng296 Mongton FBR, SRDC, TBBC297 Tachllelk298 Monghpyak299 Mongyawng
THE BORDER CONSORTIUM

fitThe current government, which came to power through 2010 elections, in accordance with the 2008 Constitution, is carrying out reforms. Though it is said to be building peace with the armed ethnic nationality forces, it is my analysis that the government, in practice, is conducting dialogue with emphasis only on business matters, rather than dialogue for peace with political essence. Moreover, the other fear we find is that, in aiddition to the very weak participation of the Tatmadaw in the peace building process of the government, the acts of Tatmadaw, in some cases, are a hindrance and danger to the peace building process. เท order to be able to put out the fire of ongoing civil war, we view the participation of Tatmadaw, with a correct attitude, is extremely important.
Accordingly, I would like to urge President บ Thein Sein’s government to conduct a transparent and politically meaningful negotiation, if it desires to establish genuine peace with the ethnic nationalities and proceed to a modern, developed, and democratic new state.
SawTamla Baw, President, Karen National Union.Speech on the 62 Anniversary of Karen Martyrs’ Day, 8 August 2012.
CHANGING REALITIES, POVERTY AND DISPLACEMENT เท South East Burma / Myanmar


3.1 SOUTHERN SHAN STATE 22
“There are so many armed groups in this area like the Tatmadaw, บ พ รA, SSA and BGF. There are also some armed groups running drug businesses and skirmishes occur regularly. Ordinary villagers still need to be afraid o f being forced to work as porters and guides or being forced to pay taxes to all o f those armed groups. ”
Shan male, Mongton Township, June 2012, SRDC focus group discussion
A series of ceasefire agreements with various armed groups have raised hopes for peace amongst local communities in Southern Shan state. The peace initiative started in September2011 when the Government withdrew its demand that the United Wa state Army (UWSA) and the National Democratic Alliance Army (NDAA) transform into a Border Guard Force. Renewing the ceasefire agreement diffused the possibility of armed conflict, re-established liaison offices and reporting mechanisms for troop movements and opened the way for political negotiations in the future.
A similar agreement was negotiated between the Government and the Shan state Progress Party/Shan State Army (SSPP/SSA) at the end of January 2012. Tatmadaw offensives targeting SSPP/SSA areas had broken a 22 year old ceasefire in March 2011, and resulted in the displacement of over 30,000 civilians. However, buoyed by the release from detention of their leader General Hso Ten and other leading Shan politicians including Khun Htun Oo, the SSPP/SSA agreed to a truce when the demand to transform into a Border Guard Force under Tatmadaw command was repealed.
The Restoration Council of Shan state/Shan state Army (RCSS/SSA) entered into a series of talks with the Government. Apart from the four basic issues included in the UWSA, NDAA and SSPP/SSA agreements, the RCSS/SSA and the Government also agreed in principle to co-operate on a range of other issues. These include the eradication of illicit drugs, economic development projects, the resettlement of RCSS/ SSA families, prisoner of war release, public consultations, and access to humanitarian assistance, amongst others.
However, the RCSS/SSA and SSPP/SSA agreements appear fragile and have been broken repeatedly in subsequent months. The RCSS/SSA have reported around 30 skirmishes with Tatmadaw forces since a nominal ceasefire was agreed in principle at the beginning of December 2011. Similarly, Tatmadaw offensives continue to target SSPP/SSA bases and indiscriminate heavy artillery attacks as well as counter-insurgency strategies targeting civilians have resulted in significant displacement in Kehsi/Kyethi and Monghsu Townships during the past year. Both RCSS/SSA and SSPP/SSA have reported these violations of the ceasefire agreement to Naypidaw, but the capacity of the Government to exercise authority over the Tatmadaw appears limited.
Livelihood opportunities for ordinary villagers in Shan state remain limited. While there has been some improvement in freedom of movement in RCSS/SSA and UWSA areas, travel to fields and markets continues to be restricted by Tatmadaw operations in SSPP/SSA areas. Forced labourto carry weapons, ammunition and food for remote Tatmadaw and militia camps is an ongoing and widespread imposition. The possibility of peace is also attracting business investors and with them the threat of land confiscation by local militia or authorities.
For internally displaced persons in camps adjacent to the Thailand border, the insecurity has been exacerbated by cuts in food rations due to TBC funding shortages. Villagers attempting to supplement their diet by cultivating crops inadvertently increased tensions in May 2012 as UWSA interpreted this as RCSS/SSA attempting to gain additional territory.
22 Compiled by the Shan Relief and Development Committee
^ CHANGING REALITIES, POVERTY AND DISPLACEMENT เท South East Burma / Myanmar

Map 7 : Southern Shan state
H sipaw
M ongya iTangyan
\CHINA
K ehs i
t
1 Y a tsauk
*
M ong K ung
* * *
J * iLa ikha
* ☆
รTaunggy i
M aw km ai
H s ihseng
ป ฒ &ท ® *
/ ' * * & * • * £ 2 f * i t * * > Wi I ^AjYAH S T ^ ^ & k B a n M a iN a iS o i
/๙ * $ • * * • tv:.' Kilometers
® - I * * « 1
f ไ!!, j * *- Lo ilem *
n N am zarng
• A *
M o n g n a i* £
น * . 1
\ 3
W ie n g H e n g
) J<A Y A H S T A T E
ท * • V I
4^ s i
P angsang ^ 4 ■ ‘ ‘ THAILAND
^ l l l l l f KM ong Hsu A » § / )
^ น ^ 5 < M atm an ■
I t «a t np i % & ? T \M ong N aw ng S T A T E ^ M ong la •
<Jk JVIong P ing *
A f K ho L a m ^ K u n h in g ^ -ft ^ K eng tung
* * ^ ^ ^ y fYANMAR / ' I
^ V / ® 11Monghpyai^ ,M ong K o k ' C0ALMINE J I ^ MINtb
* * ) * * * * «
7 “ f * p r1 <£> " • A . Tach ilek
A เน*®*■ £ . 4 ^ " x ไ ' ๙
C hiang Rai
THAILAND
N
Map Creation Date: 12 Oct., 2012 Thematic Data: TBC, SRDCBoundaries & Symbols: OCHA, Esri, Swiss Hillshade Model Projection/Datum: UTM Zone 47N/WGS 1984
Disclaimer: The names and boundaries used here do not imply endorsement by TBC.
Tatmadaw Regional Command
Tatmadaw Military Operation Command
<j^ Tatmadaw Battalion Headquarters
- j^ BGF/Militia HQ
'^ ' Tatmadaw Outpost
'^ ' BGF/Militia Outpost
H J RCSS/SSA Ceasefire Liaison Office
J ^ Refugee Camp
■A. IDP Camp
Commercial Forestry Production
Hydro-Electric Plant
Mining Concessions
Agri-business Concessions (Rubber)
Railroad Construction Asia Highway Rivers
Roads
International Boundary
/ \ / State/Region Boundary
Armed Group Area of InfluenceRestoration Council of the Shan state/Shan State Army South (RCSS/SSA)
Shan State Progress Party/Shan State Army North (SSPP/SSA)
National Democratic Alliance Army (NDAA)
United Wa state Army (UWSA)
/y // Pa-O National Liberation Organization (PNLO)
Karenni National Progressive Party (KNPP)
Karenni Nationalities People's Liberation Front (KNPLF)
THE BORDER CONSORTIUM ©

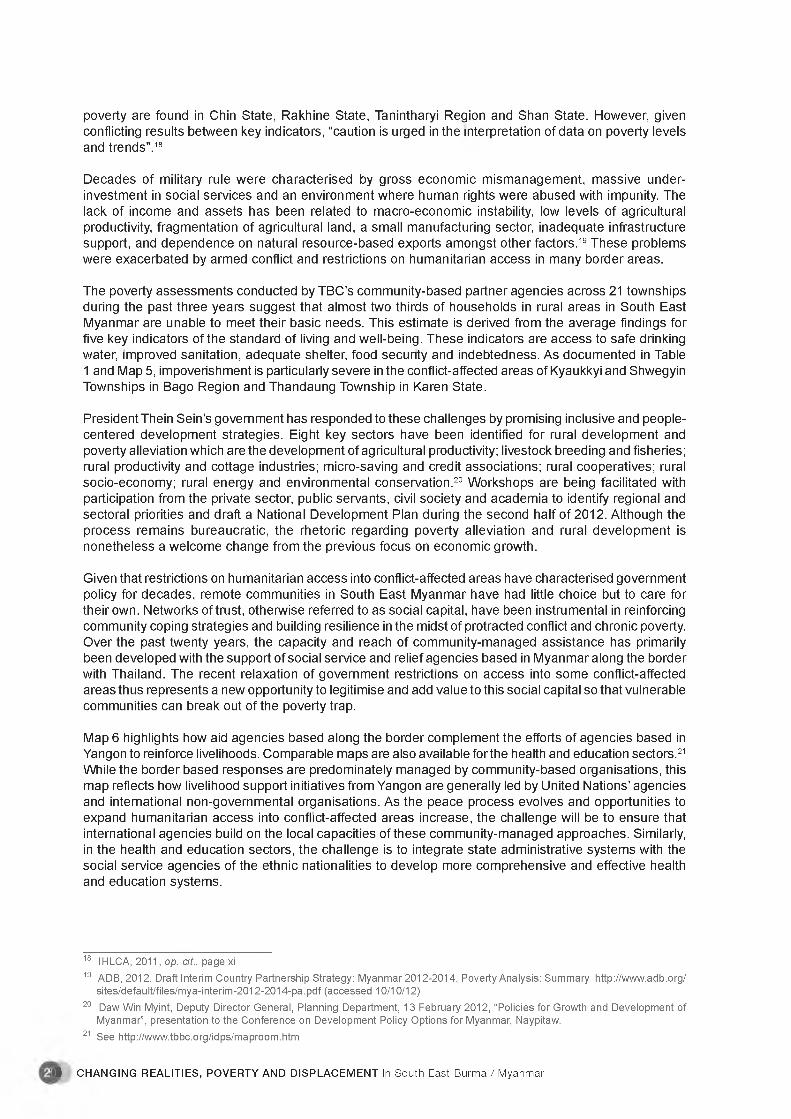
3.2 KARENNII KAYAH STATE 23
“เท the past, the Tatmadaw troops came to collect water, bathe and wash their clothes in our village between 9 in the morning and 4 in the afternoon. But now, they start coming very early in the morning and stay until after dark. Someone has to stay at home all the time to watch our property. We also worry about our daughters getting harassed by them. ”
Karenni woman, Phruso Township, June 2012, KSWDC interview
After establishing a state-level ceasefire agreement in March 2012, the Karenni National Progressive Party (KNPP) submitted a 20 point position paper for the Union government’s consideration. The Union Government agreed in principle to 14 of the points in May, with the remaining contentious issues primarily relating relating to the demarcation and separation of troops and large scale development projects. Nevertheless, local communities as well as other Karenni political parties have welcomed the KNPP engagement เท this peace process. Promises by KNPP that it will not focus on business but rather the well-being of the Karenni people have been appreciated and liaison offices have been opened in Loikaw, Shadaw and Hpasawng.
There remain 14 Tatmadaw battalions permanently based in Kayah state, 6 roving battalions from neighbouring Shan state plus 1 special battalion for the security of Ywa-thit dam. With the cessation of hostilities, these troops have increased the frequency and duration of visits into nearby villages. Security regulations previously required off-duty soldiers remain in the barracks between 4.00pm and 9.00am, but many communities have reported soldiers now staying in villages well into the night. This interaction might help build trust, but the increased troop presence has also increased anxieties.
One of the controversial issues debated during the peace negotiations has been construction of a military training school on more than 3,000 acres which were confiscated by the Tatmadaw in Hpruso Township. Ajoint assessment team was formed with nine representatives from government and two KNPP members to consult with local communities. However, findings reflected the lack of balance in the survey team and were rejected by KNPP, who have proposed to form an independent group for another survey.
Construction of the Ywa Thit hydro-electric dam along the Salween River is another contentious issue that was raised during the ceasefire talks. The Government’s negotiators have reassured that preliminary feasibility assessments will be followed by independent environmental and human rights impact assessments, and that KNPP can observe and inspect every step of the process. However; monitoring attempts by Karenni civil society organisations have subsequently been obstructed. Villagers have expressed concerns that land has already been appropriated to construct housing for engineers and that the Tatmadaw’s LIB#423 has already deployed troops to secure the area.
Restrictions on movement remains a frustration for villagers, with 22 Tatmadaw and police checkpoints still stopping vehicles along the Loikaw-Mawchi car road. Checkpoints at all entrances into towns demand fees from arriving traffic. The Tatmadaw has directly funded the reconstruction of the Taungoo-Mawchi road and started surveying in June 2012. However, this survey is being resisted by KNPP troops who argue that the forced labour and land confiscation associated with the project will represent a greater burden than the potential benefits of trade for villagers in the areas.
The State government had planned to build a cement factory near Loikaw which would result in the confiscation of more than 7,000 acres of civilians’ lands. However, after villagers protested the government committed to moving the cement factory elsewhere, even though the gravel will still be accessed from the original fields. While the threat to livelihoods remains, this is also an indicator that civil society is feeling more empowered and that local government is becoming more accountable.
The government has expanded mining concessions for ceasefire parties beyond Mawchi and into different areas of Kayah state. Since 2010, a business concession with the Kayaw ceasefire group (KNPDP) to mine for antimony in Hoya area of Pruso township has damaged about 50 acres of agricultural lands belonging to local villagers. The Kayan New Land Party (KNLP) and Karenni Nationalities Peoples’ Liberation Front (KNPLF) have also expanded a concession for antimony mining in Loikaw township since 2010 which has resulted in damage to 60 acres of agricultural land.
23 Compiled by the Karenni Social Welfare and Development Center
51 CHANGING REALITIES, POVERTY AND DISPLACEMENT เท South East Burma / Myanmar
Map 8 : Karenni / Kayah state
Pekon
S H A N S T A T E
โ *ANTIMONY *I MINE ft
■<พLoikaw*
£รI
i n nMYANMARฒเLAW PITA
% POWER % STATION
* ★ * 1 Shadaw
☆
☆
☆
☆
☆
Demoso 1t i t
1 / * ★
*
VPruso
☆I
II<0
★ ☆ANTIMONY
MINE
☆ - ^\ BanM aiN ai Soi
A★ c
£ V’jJt # Bawlakhe
tThandaung
.* * * * ★ * *
%
★☆
YWATHITDAM
* £ > A* *
น ★
★ >
V *ฝ *f /
☆'.^/'*X
☆☆•ร!1r
☆
* Iพ * 1 Hpasawng A. ☆ , • yf
Mawchi X☆ a ,
☆☆
☆☆
A % ®*+,w >< \ LEAD MINE
• f:' 1
" V *= = ) 1 %
A^ M aeSurin
★ vV
THAILAND
Kilometers
☆
ร!r
K A Y I N S T A T E
NI---«-----0 'fr ร
K A Y A HS T A T E
* ใ * .^ if.
\ ☆ i
Mese
☆
☆ r/_ 1. - '-— Map Creation Date: 12 Oct., 2012
Thematic Data: TBC, KSWDCBoundaries & Symbols: MIMU, OCHA, Esri, Swiss Hillshade Model Projection/Datum: UTM Zone 47N/WGS 1984
Disclaimer: The names and boundaries used here do not imply endorsement by TBC.
Tatmadaw Military Operation Command
Tatmadaw Battalion Headquarters
BGF/Militia HQ
☆ Tatmadaw Outpost
☆ BGF/Militia Outpost
^ 3 KNPP Ceasefire Liaison Office
Aเพ Refugee Camp
.A I DP Camp
s i
Commercial Forestry Production
Hydro-Electric Plant
Mining Concessions
Proposed Industrial Estate
Rivers
Roads
/ ' \ / International Boundary
/ ' \ / State/Region Boundary
Areas o f Armed Group InfluenceKarenni National Progressive Party (KNPP)
Karenni Nationalities People's Liberation Front (KNPLF)Karenni National Peace &Development Party (KNPDP)Pa-O National Liberation Organization (PNLO)
Karen National Union (KNU)
Restoration Council of the Shan state/ Shan State Army South (RCSS/SSA)
Inle Lake
THE BORDER CONSORTIUM

3.3 NORTHERN KAREN I KAYIN AREAS 24
“Even though the ceasefire talks are ongoing, the Tatmadaw keep sending up more troops and m ilitary rations to our area instead o f withdrawing. This could be a sign of preparations for the next operation. So we villagers also have to be ready to run in different ways instead o f thinking about uniting and building a village. ”
Karen man, Hpapun Township, June 2012, KORD interview
The Karen National Union’s (KNU’s) negotiations with the Government during 2012 have included an agreement in principle to a nation-wide ceasefire and the progressive realisation of peace. A thirteen point preliminary agreement in April covered a range of political, military and human rights issues, while a Draft Code of Conduct for military personnel was also agreed in principle during September. Skirmishes have decreased significantly as a result but the area remains heavily militarised. After decades of conflict there remain significant doubts amongst the civilian population as to whether the rapid reforms will lead to a sustainable peace.
เท the upland areas of northern Karen state and Eastern Bago Region, the ceasefire period has been characterised by the resupply of rations and the redeployment of troops by the Tatmadaw to frontline army camps. This has been facilitated by new reporting mechanisms fortroop movements with the KNU, however it has had the unintended effect of enabling the Tatmadaw to stockpile supplies and reinforce their outposts to be stronger than ever before.
While there have not been any military offensives, skirmishes have continued on a regular basis between KNU and Government troops, including Border Guard Forces. This has primarily been the result of troop movements occurring without prior notice to the other armed group. However, upland villagers are not necessarily privy to any of this information and so remain afraid to leave their huts and travel to their fields whenever there are Tatmadaw troop movements. Apart from the fear of being caught in the crossfire, villagers habitually avoid troops whenever possible to mitigate against the possibility of extortion or the confiscation of food and property.
However, the ceasefire period has generally enabled farmers greater access to their hillside rice fields as there has been a significant decrease in roving troop patrols to search for, and destroy, civilian settlements assumed to be aiding the armed opposition. This has enabled some villagers to move closer to better agricultural land or to cultivate their crops and protect them from pests without having to run away for fear of being detected and alleged to be rebel sympathisers. Travel between lowland markets and the uplands has also become easier as there are less suspicions and interrogations at checkpoints. This has facilitated greater trade and social interaction between communities which have long been divided by conflict.
Neither upland nor lowland villagers have dared to return to live in their original village as the situation is still fragile and trust still needs to be regained. However, many upland villagers have returned to check on their fields and some have constructed small bamboo huts, while keeping their family and main shelter deeper in the forest away from harm. There have even been some household leaders who have returned from the refugee and IDP camps along the Thailand borderto assess the impact of the ceasefire agreement on security conditions in their ancestral homelands.
เท lowland areas where the government’s administration is more established, there has not been any significant change in the frequency or severity of human rights abuses. Villagers are still subject to the usual arbitrary taxes and extortion, while forced labour continues to be used to fortify army camps and repair roads. Whenever Tatmadaw troops need to transport rations by foot to outposts, the surrounding villagers are also expected to contribute their labour. These deprivations and rampant land grabbing by small-scale mining operations have exacerbated the lack of food security and chronic poverty which is the legacy of protracted conflict.
24 Compiled by the Karen Office of Relief and Development
^ CHANGING REALITIES, POVERTY AND DISPLACEMENT เท South East Burma / Myanmar

Map 9 : Northern Karen / Kayin Areas
%☆Than da Ling
* • " * MYACNMAR_ dam \ i fTaungoo % ■พ
* * + V ' : * * ♦ * * .Htantabin
K A Y A H S T A T E
Phyu
Nyaunglebin *
B A G O R E G I O N
* Daik-U
ะ
*-
''
/ L f CHINA
K y MYANMAR
^ * * V A 0 S
*
! / ■ THAILAND
*J k l v f เ ^
((/>SL A
THAILAND
-k ★ *
☆☆
Kyauktaga
%■?
K •7-£r" ■' tl^KYAUKNAGAR
* น. - 1 .★ ☆ ^ ^ ☆ ☆
. * ■ฟ ^ Shwegyin
’ ^ ☆
☆M Ee Tu Hta
☆ 'fr ☆
DAH GWIN DAM
☆
Nr
Kilometers
☆
☆
☆
GOLD M IN E J^
; ®
☆
☆
☆☆
☆
☆
Mae La Oon
A
r T z Tใ0
GOLD MINES ■
☆ (JTN ☆
&★ HAT GY I
DAM * ■
^ Tatmadaw Regional Command
Tatmadaw Battalion Headquarters
BGF/Militia Headquarters
Tatmadaw Outpost
BGF/Militia Outpost
IDP Camp
.A Refugee Camp
1^3 KNU Ceasefire Liaison Office
1= 1 KNPP Ceasefire Liaison Office
i*☆
★A
% Commercial Forestry Production
B A Hydro-Electric Plant
(^ ) Mining Concessions
Agri-business Concessions (Rubber)
River
Roads
/ \ / International Boundary
/ V State/Region Boundary
Areas of Armed Group Influence
Karen National Union (KNU)
Karenni National Progressive Party (KNPP)
Democratic Karen Buddhist Army (DKBA)
Karenni Nationalities People's Liberation Front (KNPLF)
Map Creation Date: 12 Oct., 2012 Thematic Data. TBC, KORD, CIDKPBoundaries & Symbols: Ml MU, OCHA, Esri, Swiss Hillshade Model Projection/Datum: UTM Zone 47NM/GS 1984
Disclaimer: The names and boundaries used here do not imply endorsement by TBC.
THE BORDER CONSORTIUM M S
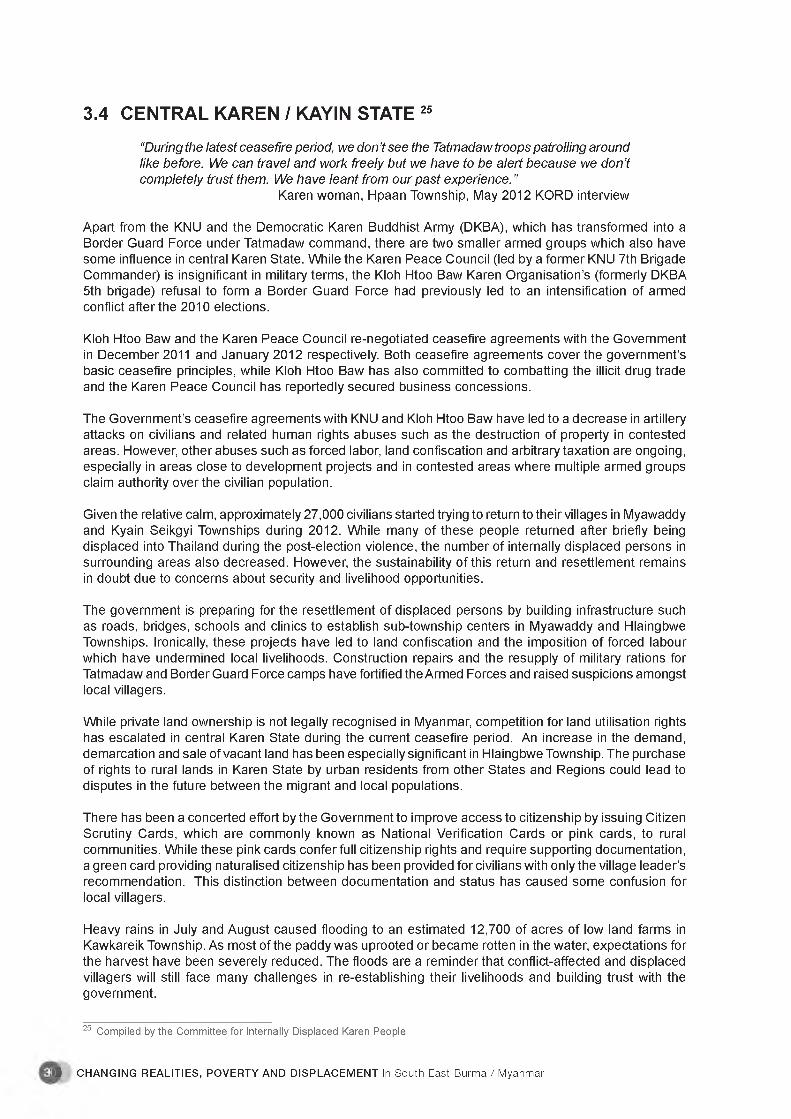
3.4 CENTRAL KAREN I KAYIN STATE 25
“During the latest ceasefire period, we don’t see the Tatmadaw troops patrolling around like before. We can travel and work freely but we have to be alert because we don’t completely trust them. We have leant from our past experience. ”
Karen woman, Hpaan Township, May 2012 KORD interview
Apart from the KNU and the Democratic Karen Buddhist Army (DKBA), which has transformed into a Border Guard Force under Tatmadaw command, there are two smaller armed groups which also have some influence in central Karen state. While the Karen Peace Council (led by a former KNU 7th Brigade Commander) is insignificant in military terms, the Kloh Htoo Baw Karen Organisation’s (formerly DKBA 5th brigade) refusal to form a Border Guard Force had previously led to an intensification of armed conflict after the 2010 elections.
Kloh Htoo Baw and the Karen Peace Council re-negotiated ceasefire agreements with the Government in December 2011 and January 2012 respectively. Both ceasefire agreements cover the government’s basic ceasefire principles, while Kloh Htoo Baw has also committed to combatting the illicit drug trade and the Karen Peace Council has reportedly secured business concessions.
The Government’s ceasefire agreements with KNU and Kloh Htoo Baw have led to a decrease in artillery attacks on civilians and related human rights abuses such as the destruction of property in contested areas. However, other abuses such as forced labor, land confiscation and arbitrary taxation are ongoing, especially in areas close to development projects and in contested areas where multiple armed groups claim authority over the civilian population.
Given the relative calm, approximately 27,000 civilians started trying to return to their villages in Myawaddy and Kyain Seikgyi Townships during 2012. While many of these people returned after briefly being displaced into Thailand during the post-election violence, the number of internally displaced persons in surrounding areas also decreased. However, the sustainability of this return and resettlement remains in doubt due to concerns about security and livelihood opportunities.
The government is preparing forthe resettlement of displaced persons by building infrastructure such as roads, bridges, schools and clinics to establish sub-township centers in Myawaddy and Hlaingbwe Townships. Ironically, these projects have led to land confiscation and the imposition of forced labour which have undermined local livelihoods. Construction repairs and the resupply of military rations for Tatmadaw and Border Guard Force camps have fortified the Armed Forces and raised suspicions amongst local villagers.
While private land ownership is not legally recognised in Myanmar, competition for land utilisation rights has escalated in central Karen state during the current ceasefire period. An increase in the demand, demarcation and sale of vacant land has been especially significant in Hlaingbwe Township. The purchase of rights to rural lands in Karen state by urban residents from other States and Regions could lead to disputes in the future between the migrant and local populations.
There has been a concerted effort by the Government to improve access to citizenship by issuing Citizen Scrutiny Cards, which are commonly known as National Verification Cards or pink cards, to rural communities. While these pink cards confer full citizenship rights and require supporting documentation, a green card providing naturalised citizenship has been provided for civilians with only the village leader’s recommendation. This distinction between documentation and status has caused some confusion for local villagers.
Heavy rains in July and August caused flooding to an estimated 12,700 of acres of low land farms in Kawkareik Township. As most of the paddy was uprooted or became rotten in the water, expectations for the harvest have been severely reduced. The floods are a reminder that conflict-affected and displaced villagers will still face many challenges in re-establishing their livelihoods and building trust with the government.
25 Compiled by the Committee for Internally Displaced Karen People
n l CHANGING REALITIES, POVERTY AND DISPLACEMENT เท South East Burma / M yanm ar

Map 10: Central Karen / Kayin state~ w☆
H * y 4' A GOLD M INES ' ( ( ' V r t l » ’ .
Kamarmaung ( ^ )
i r s f e ' " G O LD M IN E
* ■ BILIN ★ DAM ☆
r ^ G O L D M I N E S ' ( V T ! 1 3 .J . Y$v# ร han Ywar Th it^ A N T IM O N Y
*1 x m« I F m y a n m a r
. Hlaingbwe☆ *
A M aeL aO on
A . Mae Ra M a Luang
Mae La
'A/ R . Hlaingbwe tV
■ * ' * • . ไ * * V^ P a ing kyon .n v
" f t .T h a fc J HpJ 111★ “ f * * \ T H A I L A N D
* V 7 * * * X * » รK A Y I N ^ 1 โ a i ] ?
^ZinKyaik ^ S T A T E Myawaddy
* * *i J . K.yondi e * ★ ★ *1 \ n . เ^ พ kar^k -fcj
I / _ SB Mawlamyine .4 ^A . * 4
, v; L — % i / } AV ~ _ y v ^ Mud๐ท ^ ^ \ ☆ {-£ yU m piem
^ M O N S T A T E * I ☆ . Su Ka^ j
^ ' ^ ^ ' ( ( ' ^ “K ^ รThanbyuzayat
• ท I. ☆
% 1 ’ ^ ain Seikgyi ☆ Kyaikdon \ Kilom eters
* 1 ~ ☆ r t — '— ^ -------☆ 0 f z l o
J l,I*☆
★
Tatmadaw Regional Command ■ A
Tatmadaw Light Infantry Division น •
Tatmadaw Military Operation Command ( ^ )
Tatmadaw Battalion Headquarters
BGF/MilitiaHeadquarters f i i
Tatmadaw Outpost
BGF/Militia
NMSP Ceasefire Liaison Office
KNU Ceasefire Liaison Office
/ \ /
Refugee Camp
Hydro-Electric Plant
Mining Concessions
Agri-business Concessions (Rubber)
Proposed Industrial Estate
River
Roads
International Boundary
State/Region Boundary
Areas o f Armed Group Influence
Karen National Union (KNU)
D em ocratic Karen Buddhist A rm y (D KBA)
New Mon s ta te Party (N M SP)
Karen Peace Council (KPC)
Map Creation Date: 12 Oct., 2012 Thematic Data: TBC, KORD, CIDKPBoundaries & Symbols: MIMU, OCHA, Esri, Swiss Hillshade Model Projection/Datum: UTM Zone 47N/WGS 1984
Disclaimer: The names and boundaries used here do not imply endorsement by TBC.
THE BORDER CONSORTIUM

3.5 SOUTHERN MON AREAS 26
“When the rebel groups arrive at our plantation, we have to pay money or provide food for them. The the Tatmadaw accuse us of being rebel supporters, and order us to work for them or pay a fine as punishment. So we usually run away when we see strangers in our plantation.”
Mon male, Yebyu Township, June 2012, MRDC interview.
The New Mon state Party (NMSP) first signed a ceasefire agreement with the Government in 1994, and tried unsuccessfully to promote constitutional and political reform through the National Convention until 2008. Communications broke down in April 2010 afterthe NMSP refused to transform into a Border Guard Force and forfeit their status as a political party, although the situation did not deteriorate into outright armed conflict. Negotiations during the past year led to the renewal of the ceasefire agreement at the state-level and a commitment from the Government to negotiate ceasefire agreements with all non-state armed groups before the end of 2012 so that inclusive political dialogue can commence at the Union level.
The 1994 ceasefire agreement induced the repatriation of over 10,000 refugees from Thailand into resettlement sites within the heartland of the designated NMSP ceasefire areas. However, in the absence of a political solution and human rights promotion, these refugees became internally displaced persons who could not access international protection from Thailand nor international assistance from Yangon. As abuses in government controlled areas continued, the displaced population in southern Mon ceasefire areas swelled as villagers fled to seek nominal protection by the NMSP. It is not surprising then that the renewal of the ceasefire agreement has not yet had any significant impact on the protection and livelihoods of villages in 2012.
The Tatmadaw has not separated its troops from the ceasefire areas, and is still utilising the existence of a small Mon splinter group as a justification for ongoing incursions into NMSP areas of Ye and Yebyu Townships. เท turn, the fortification of outposts continues to be accompanied with forced labour to repair army barracks and extortion or confiscation of food and property to subsidise troops. Given competing claims for territory, the counter-insurgency rhetoric continues to be the rationale for restricting villagers’ access to fields, plantations and markets even in NMSP ceasefire areas.
Even though the Mon are traditionally low land paddy farmers, the ceasefire areas do not provide sufficient fertile soil and so the majority of rice farmers practice shifting cultivation on hillsides. Some of the more established families have cash crops like cashew nut and betel nut palms, but these require five or six years of investment before any benefits can be accrued. Most families are dependent on seasonal labour on rubber and palm oil plantations for daily wages from businesses based in Moulmein and elsewhere in Mon state.
Isolated and low lying mountains have been designated for the NMSP ceasefire areas, and are also a cause of ongoing vulnerability. เท the wet season, the roads from Ye and Yebyu are virtually impassable and the only access for trade and communications is by boat. Food prices are almost double those in nearby towns as a result, and opportunities for daily wages from casual labour for logging companies is limited to the dry season.
26 Compiled by the Mon Relief and Development Committee
C H AN G IN G R EALITIES , POVERTY AN D D ISP LAC EM EN T เท South East Burma / Myanmar

Map 11 : Southern Mon Areas
vv Kyaikdon
• T☆☆
K A Y I N S T A T E
) M Y A N M A R
B w l< )-!
\ *
h .V
j TV
* /A
'^.'' N u Po
ไ 1
A
** ' J1* ' รYe • ,■^ * ™ ■ ^ E Z rThree Pagodas Pass
0 J b นเ i p*^ $ 4 M O N S T A T E ) BanDonYang
fm l I& L \ * ~ \ L.น-'^ A☆ • ” r ™■ )
Khawzar ^ ^ • ร ^ \ I^
* V a*■ • Yabu ..... T H A I L A N D
Kilom eters
To Yadana Gas Fields
_ fiffll$ J ;T H A R Y I > 1* “ R E G I O N
50
/ \ f Tatmadaw Military Operation Command
•^ ' Tatmadaw Battalion Headquarters
"jV Tatmadaw Outpost
if BGF/Militia
KNU Ceasefire Liaison Office
D NMSP Ceasefire Liaison Office
A . Refugee Camp
.A . I DP Camp
Agri-business Concessions (Palm) Areas of Armed Group Influence
Dawei Proposed Deep Sea Port Karen National Union (KNU)
/ V ' Gas Pipeline New Mon state Party (NMSP)
Democratic Karen Buddhist Army (DKBA)Asia Highway
Proposed Railroad
River
Roads
/ ' \ , / International Boundary
State/Region Boundary
Map Creation Date: 12 Oct., 2012 Thematic Data: TBC, MRDCBoundaries & Symbols: Ml MU, OCHA, Esri, Swiss Hillshade Model Projection/Datum: UTM Zone 47N/WGS 1984
Disclaimer: The names and boundaries used here do not imply endorsement by TBC.
THE BORDER CONSORTIUM

3.6 TENASSERIM I TANINTHARYI REGION 27“The businessmen have more opportunities since the ceasefire agreement, but not our villagers. They come with the Tatmadaw officers and take our land for plantations, but their business does not benefit our villagers. It only makes more problems for us.We worry that the coal mining company will destroy our ancestral lands and poison the river. ”
Karen woman, Dawei Township, June 2012, CIDKP focus group discussion
After the ceasefire agreement was negotiated between the Government and the KNU in January 2012, artillery attacks on civilians in contested areas and military activities to seize control the region essentially stopped. However, the Tatmadaw did not withdraw any troops, nor abandon any outposts along the borderline. Troop rotations and the resupply of military rations to outposts along the borderline has continued.
Villagers have generally welcomed the ceasefire and political reforms. Human rights abuses targeting civilians to undermine the armed opposition, as well as the prevalence of forced labour, have generally decreased. Villagers have more freedom of movement and can travel without asking perm iss ion^ being stopped and questioned by military authorities. Civilians even appearto have more courage in submitting complaints about mismanagement by the administration. However, villagers do not generally trust the Government nor the Tatmadaw, and there is a widespread perception that the ceasefire is just a means for international legitimacy and commercial profit. Over 70,000 villagers remain internally displaced in relocation sites or hiding in remote forests at the end of 2012.
Livelihoods are still being undermined by the Tatmadaw’s confiscation of property and livestock. Land is not only confiscated to subsidise the troops’ rations, but also for sale to private companies connected to former and current high-ranking Tatmadaw authorities. After the ceasefire agreement, and upon the recommendation of relevant Regional authorities, the central government granted huge tracts of land for private rubber and palm plantations as well as logging and mining concessions. Many foreign companies subsequently approached KNU for permission to conduct their business even though social and environmental impact assessments had not been considered.
The business climate is not without risk however. The Ital-Thai Development (ITD) Company’s plan to conduct a preliminary soil survey along the Tanintharyi River from the border in Dawei to Yebyu Township was obstructed by heavy and continuing rain. ITD have also reportedly suspended construction of the railway, oil and gas pipelines and electricity transmission tower along the Trans-Border Corridor due to finance constraints.
However, surveys for the construction of Dawei Deep Sea Port and the Industrial Estate continued in Yebyu Township. There are also plans to establish two more industrial estates in Tanintharyi Region near the border at Teekee/MinThe Mee Kee on ITD’s trans-border corridor link, and at MawTaung on the road to Mergui/Myeik. These industrial estates are attracting investors from multiple sectors, although the broader impacts on the distribution of wealth remain unclear.
From this perspective, questions remain about the links between the Government’s economic growth model and poverty alleviation. Access to basic public goods, such as health, education, electricity and communication remain limited. Regardless of being a resource-rich region, the majority of people เท the region continue to be impoverished.
27 Compiled by the Committee for Internally Displaced Karen People
^ CH AN G IN G R EALITIES , POVERTY AN D D ISP LAC EM EN T เท South East Burma / Myanmar

Map 12: Tenasserim / Tanintharyi Region
THE BORDER CONSORTIUM

f i tWhen I was at the Maela refugee camp in Thailand recently, I met dedicated people who were striving daily to make the lives of the inmates as free from hardship as possible. They spoke of their concern over ‘donor fatigue, ’ which could also translate as ‘compassion fatigue. ’ ‘Donor fatigue’ expresses itself precisely in the reduction of funding. ‘Compassion fatigue’ expresses itself less obviously in the reduction of concern. One is the consequence of the other.
Can we afford to indulge in compassion fatigue? Is the cost of meeting the needs of refugees greater than the cost that would be consequent on turning an indifferent, if not a blind, eye on their suffering? I appeal to donors the world over to fulfil the needs of these people who are in search, often it must seem to them a vain search, of refuge.
Aung San รนน Kyi, 16 June 2012, Nobel Lecture, Oslo.
51 CHANGING REALITIES, POVERTY AND DISPLACEMENT เท South East Burma / M yanm ar

a I Ij. 0.1(1 X^OAOJ

4.1 DEMOGRAPHIC STRUCTURE“I have four adult children but even still we cannot earn enough income because there are no jobs in our area. My eldest daughter went to Thailand last year and we can just survive with the support that she sends. But it is difficult to find work and feed the family.”
Mon woman, Halockhani resettlement site, Kyain Seikgyi, June 2012, MRDC
The relationship between poverty and demography in South East Myanmar has been analysed by exploring the population structure, average household sizes and personal identity documentation. Findings indicate a high proportion of dependents and large household sizes in South East Myanmar, and that almost half of the population cannot prove their citizenship status. All three of these characteristics reflect how demographic pressures increase vulnerability to poverty and restrict capacities to cope with, and recover from, livelihood shocks.
The demographic structure of the population surveyed in South East Myanmar is summarized in Chart 6 and disaggregated to the township level in Table 2. The government’s MICS data indicates that 30.1% of the national population is under 15 years of age, 64.2% are between 15 and 64 years, and 5.7% are aged over 65 years.28 This survey suggests that a significantly higher proportion of children are reliant on a smaller proportion of working age adults in the rural areas of South East Myanmar. 39.3% of the surveyed population are under 15 years of age, 55.7% are aged between 15 and 59 years and 5% are aged over 60 years.
Chart 6 : Demographic structure in South East Burma/Myanmar
The demographic dependency ratio compares the number of household members youngerthan 15 years and older than 59 years of age relative to those between the ages of 15 and 59. A higher ratio thus represents a larger burden on the average household. While the government’s IHLCA data identifies the nation’s rural demographic dependency ratio as 0.56,29 data collected by TBC’s partners in the South East reflects a considerably higher figure of 0.79. Map 13 disaggregates this indicator to the township level and reflects that the social burden of caring foryoung children and the elderly is greatest in Hpasawng. This is consistent with high birth rates in Kayah state more generally.
While females constitute 50.6% of the overall population surveyed in South East Myanmar, this proportion increases to 52.1% in the 15-44 year age group before decreasing to 49.0% of the population aged over 45 years. This reflects how working age men are more likely to be conscripted into an armed force, become a casualty of war, or migrate in search of income to support their families. However, it also suggests women have a lower life expectancy due to the indirect causes of conflict such as malnutrition and the disruption of health care services.
Household size is commonly found to directly correlate with higher poverty levels. Government data suggests an average household size nationally of 5 members, with 6 persons in the average ‘poor’ household and an average of 4.7 persons in ‘non-poor’ households.30 Data collected by TBC’s partners during the past two years indicates an average household size in South East Myanmar of 6 members.
28 MICS, 2011, opcit., page 8
29 IHLCA, 2011, op tit., page 32
30 IHLCA, 2011, op. cit., page 29
g l CHANGING REALITIES, POVERTY AND DISPLACEMENT เท South East Burma / M yanm ar

Table 2: Demographic structure Map 13: Demographic Dependency
Und
er 5
5-14
15-2
9
30-4
4
45-5
9
Ove
r 60
MonghsatMale 13% 27% 20% 16% 18% 5%
Female 12% 28% 15% 22% 18% 5%
MongtonMale 10% 15% 25% 23% 18% 9%
Female 5% 20% 26% 23% 16% 9%
MongpanMale 5% 18% 25% 21% 23% 9%
Female 2% 21% 26% 20% 23% 8%
ShadawMale 18% 29% 21% 14% 16% 2%
Female 18% 30% 21% 20% 11% 2%
HprusoMale 22% 27% 21% 15% 11% 4%
Female 19% 23% 27% 19% 10% 2%
HpasawngMale 18% 33% 15% 17% 13% 3%
Female 19% 32% 20% 20% 6% 3%
ThandaungMale 5% 24% 30% 20% 13% 7%
Female 8% 29% 28% 17% 15% 2%
HpapunMale 17% 30% 24% 13% 10% 6%
Female 18% 26% 23% 18% 9% 6%
HlaingbweMale 14% 24% 20% 18% 16% 8%
Female 15% 26% 23% 17% 10% 9%
Hpa-anMale 12% 31% 25% 16% 12% 3%
Female 15% 25% 25% 20% 10% 5%
MyawaddyMale 15% 25% 29% 15% 13% 4%
Female 12% 25% 31% 15% 13% 5%
KawkareikMale 15% 28% 18% 20% 12% 8%
Female 12% 28% 20% 19% 13% 9%
Kyain
Seikgyi
Male 13% 20% 26% 19% 16% 6%
Female 13% 24% 23% 22% 16% 3%
KyaukkyiMale 11% 22% 23% 22% 18% 4%
Female 10% 24% 21% 20% 17% 7%
ShwegyinMale 13% 19% 22% 22% 19% 5%
Female 11% 18% 25% 23% 17% 6%
BilinMale 14% 32% 23% 16% 11% 5%
Female 10% 30% 22% 18% 14% 5%
YeMale 11% 23% 25% 17% 19% 6%
Female 10% 24% 26% 16% 18% 6%
YebyuMale 13% 25% 22% 17% 20% 3%
Female 13% 29% 30% 21% 7% 1%
DaweiMale 16% 27% 26% 15% 11% 4%
Female 13% 26% 26% 19% 11% 5%
PalawMale 19% 29% 22% 17% 8% 4%
Female 17% 27% 23% 19% 9% 6%
TanintharyiMale 20% 28% 23% 16% 11% 2%
Female 20% 22% 29% 15% 12% 2%
TotalMale 14% 26% 23% 18% 14% 5%
Female 13% 25% 24% 19% 13% 5%
Myanmar
D e m o g ra p h icD e p e n d e n c yR atioThe ratio is calculated in two steps:1. รนทา the population under 15yrs of age and the population over 59yrs of age2. Divide this total by the population over 14yrs and under 60yrs of age
0.5-0.6
0.61-0.75
0.76-0.9
0.91-1
1.01-1,2
N Ki lo m eters 0 • f T Y .;
A I----1----1----r-F|' - V - 't0 50 100 X -
Map Creation date: 12 Oct., 2012 Thematic Data: TBC, CIDKP, KORD, KSWDC, MRDC, SRDC Boundary Data: MIMU Projection/Datum: UTM Zone 47N/W3S84
Disclaimer: The names and boundaries used here do not imply endorsement by TBC
THE BORDER CONSORTIUM

Citizen Scrutiny Cards, which are more commonly known as National Table 3: Identity Verification Registration Cards, are essential for proof of identity and citizenship in Myanmar. The 1982 Citizenship Law establishes that full citizenship is acknowledged by ownership of a pink card, which enables access to the associated rights to vote, movement and access to government services. Blue cards offer associate citizenship and have primarily been accessed by Chinese and Indian migrants. Green cards offer a status of naturalised citizenship and are essentially provided when there is no supporting documentation to substantiate a claim for citizenship other than the village headman’s word. Finally, white cards are temporary registration certificates which are primarily issued to the Rohingya.
While the process for obtaining documentation of citizenship is relatively simple in theory, decades of conflict in South East Myanmar have resulted in almost half of the population not being able to verify their identity. Proof of citizenship appears to vary widely across South East Myanmar, with Map 14 and Table 3 illustrating that some of the communities surveyed recorded almost universal access to citizenship while it was a rare exception in others. The constraints to obtaining a citizenship card appear most widespread in the conflict-affected areas of Karen state and Monghsat Township, which may reflect the reluctance of villagers to travel into towns and a lack of trust and confidence in dealing with authorities. There is also a significant gender dimension as 60% of men have a valid citizenship card, but only 48% of women. This is consistent with the stereotypical division of labour in which women take more responsibilities for domestic chores while men are expected to travel more to search for income.
It should be noted that these surveys were conducted before the Ministry of Immigration and Population launched a citizenship campaign เท Karen state in coordination with the Norwegian Refugee Council (NRC) in June 2012. This initiative aimed to increase access to citizenship by providing a mobile one-stop service for applicants in remote villages to submit claims and be issued with a Citizen Scrutiny Card within the same day. Only pink cards have been issued by this particular mobile service, but confusion remains about the criteria by which citizenship claims are assessed more generally.31
4.2 WATER, SANITATION AND SHELTER“I don’t dare to go back to my original village or to rebuild in a new village yet. เท 2004 when KNU and the Government established a gentlemen ’ร agreement, I started cultivating a hillside paddy field close to the road. But the agreement broke down and I had to run deeper into the forest again. So I don’t know if I can trust the Tatmadaw this time. ”
Karen Man, Hpapun Township, May 2012, KORD focus group discussion
Household access to safe drinking water, hygienic sanitation and durable shelter are basic necessities for good health. The exposure ofwater sources to human faeces and other contaminants directly contributes to the prevalence of diseases such as cholera and typhoid as well as other ailments such as diarrhea. Similarly, susceptibility to illness increases if housing does not provide adequate shelter from the elements. This survey indicates that domestic housing conditions in rural areas of South East Myanmar vary significantly, but that the average standard of living is significantly lower than government surveys suggest.
Safe drinking water can be accessed from protected water sources, such as deep tube wells, stone-lined wells, rain-watertanks and fenced natural springs. Government data about access to safe drinking water varies, with the IHLCA reporting 69% of households have access to protected water sources while the MICS reports 82% of households have access.32 However, this survey included some particularly vulnerable communities and found on average just 27% of families in rural areas of South East Burma access protected water sources.
31 Norwegian Refugee Council, “Operation Moe Pwint 3 in Karen s ta te ” , presentation provided to TBC.
32 IHLCA, 2011, op. cit, page 63, and MICS, 2011, op. cit., page 33.
^ CHANGING REALITIES, POVERTY AND DISPLACEMENT เท South East Burma / M yanm ar
Citi
zens
hip
Hous
e re
gist
ratio
n
No
proo
f
Monghsat 6% 2% 85%
Mongton 94% 2% 7%
Mongpan 92% 20% 0%
Shadaw 98% 98% 1%
Hpruso 93% 75% 3%
Hpasawng 74% 73% 23%
Thandaung 75% 0% 25%
Hpapun 7% 24% 88%
Hlaingbwe 1% 1% 99%
Hpa-an 24% 79% 12%
Myawaddy 41% 23% 56%
Kawkareik 45% 67% 21%
Kyain Seikgyi 13% 45% 42%
Kyaukkyi 12% 4% 73%
Shwegyin 24% 0% 63%
Bilin 35% 60% 21%
Ye 90% 1% 5%
Yebyu 87% 21% 3%
Dawei 90% 78% 2%
Palaw 58% 1% 44%
Tanintharyi 64% 36% 28%
Total 53% 34% 33%

Map 14: Access to Citizenship Map 15: Access to Safe Drinking Water
Myanmar
๘ &Mongpan'-v MongtonjiJJp
Shadaw
Thailand
Map Creation date: 12 Oct., 2012 Thematic Data: TBC, CIDKP, KORD, KSWDC, MRDC, SRDC Boundary Data: MIMU Projection/Datum: UTM Zone 47N/WGS84
Disclaimer: The names and boundaries used here do not imply endorsement by TBC ‘
THE BORDER CONSORTIUM m.

Findings from South East Myanmar about access to safe drinking water are disaggregated by township in Table 1 and Map 15, and reflect a high dependence on rivers, streams, unlined wells and unfenced springs. Field reports suggest that the quality of drinking water may currently be acceptable even if not protected, because villagers commonly utilize bamboo pipes to divert water from upland springs and streams which are relatively unpolluted. However, as mining and logging concessions expand, household water treatment practices to mitigate against water borne diseases will become more important.
Risk of water borne disease is exacerbated for households who do not have access to improved sanitation, which in this rural context refers to wet surface latrines and covered pit latrines (or fly-proof dry latrines). While the government’s IHLCA and MICS data suggest that 79% and 85% respectively of households nationwide have access to sanitary latrines33, TBC’s survey in rural areas of South East Myanmar recorded just 51%. Results for the type of latrine normally utilized by households are disaggregated by township in Table 4 and Map 16 and reflect a wide divergence in conditions.
Hlaingbwe, Hpapun and Thandaung in northern Karen state as well as Hpasawng in southern Kayah state are of particular concern as extremely low levels of access to sanitary latrines correlate with a high dependence on unprotected water sources in these townships. Living conditions are particularly poor in these townships as the communities surveyed are from upland areas that have been targeted by counter-insurgency offensives for decades. Easy access to forest areas and a lack of public health awareness may also perpetuate unsanitary habits.
The construction materials used for roofing and walls are a good proxy indicator of living standards. Durable roofing is identified as mainly consisting of pieces of tin, zinc, corrugated galvanized iron and/or wooden tiles, whereas temporary roofing is characterized by the predominant use of grass orleafthatch, bamboo and / or tarpaulins. Official figures suggest that 32% of poor households have adequate roofing,34 but the surveys TBC and partners have conducted in rural areas of South East Myanmar found these standards for only 16% of households.
Table 5 documents the proportion of households with durable roofing and walls in each of the surveyed townships, while Map 17 averages these responses to represent the distribution of adequate shelter in South East Myanmar. Bamboo, grass and leafing thatch are readily available, which partly explains why they are widely used as a customary construction material. However, insecure and displaced households are also more likely to construct two or three temporary shelters rather than one durable house as a coping strategy for dealing with military offensives targeting civilian settlements.
33 IHLCA, 20111 op. cit., page 66, and MICS, 20111 op. c it, page 35
34 IHLCA, 2011, op. cit., page 62
Table 4: Access to Sanitary Latrines
Wet
sur
face
la
trine
Cov
ered
, dry
Pi
t / f
ly pr
oof
Unc
over
ed
Pit
/ D
irect
P
it
No
Latri
ne
/ No
Pit
Monghsat 14% 76% 8% 2%
Mongton 36% 56% 1% 7%
Mongpan 9% 72% 18% 2%
Shadaw 27% 53% 0% 20%
Hpruso 55% 5% 2% 39%
Hpasawng 1% 3% 1% 97%
Thandaung 4% 6% 1% 89%
Hpapun 12% 2% 9% 78%
Hlaingbwe 2% 0% 0% 98%
Hpa-an 18% 1% 1% 80%
Myawaddy 34% 0% 2% 63%
Kawkareik 55% 8% 5% 33%
Kyain Seikgyi 23% 43% 10% 24%
Kyaukkyi 1% 0% 45% 54%
Shwegyin 2% 10% 78% 10%
Bilin 23% 1% 1% 76%
Ye 54% 35% 1% 11%
Yebyu 70% 21% 0% 9%
Dawei 52% 45% 1% 4%
Palaw 12% 61% 14% 14%
Tanintharyi 10% 87% 3% 1%
Total 24% 27% 10% 40%
Table 5: Access to Durable Shelter
Dura
ble
Roo
fing
(mai
nly
woo
den
tiles
, tin
, zin
c or
co
rruga
ted
iron)
Dura
ble
Wal
ls
(mai
nly
woo
d,
brick
or
sto
ne)
Monghsat 1% 2%
Mongton 34% 52%
Mongpan 1% 11%
Shadaw 17% 17%
Hpruso 65% 41%
Hpasawng 5% 0%
Thandaung 41% 14%
Hpapun 1% 8%
Hlaingbwe 1% 3%
Hpa-an 12% 39%
Myawaddy 19% 36%
Kawkareik 35% 51%
Kyain Seikgyi 29% 61%
Kyaukkyi 0% 1%
Shwegyin 0% 2%
Bilin 3% 37%
Ye 13% 26%
Yebyu 17% 40%
Dawei 22% 31%
Palaw 0% 3%
Tanintharyi 11% 8%
Total 16% 23%
g CHANGING REALITIES, POVERTY AND DISPLACEMENT เท South East Burma / M yanm ar

Map 16: Access to Sanitary Latrines Map 17: Access to Durable Shelter
Myanmar
Map Creation date: 12 Oct., 2012 Thematic Data: TBC, CIDKP, KORD, KSWDC, MRDC, SRDC ๘Boundary Data: MIMU Projection/Datum: UTM Zone 47N/WGS84
Disclaimer: The names and boundaries used here do not imply endorsement by TBC
THE BORDER CONSORTIUM m.

4.3 EDUCATION AND NUTRITION STATUS OF CHILDREN“We do not get any support from outside. To live with dignity as a village in this country we need our land ownership recognised, we need good schooling for our children, a church, and clinic for health care, communications, transportation and electricity.
Karen woman, Dawei Township, June 2012, CIDKP focus group discussion
Educated and well-nourished children are critical to reducing poverty, empowering women, and mitigating against population growth amongst a range of other human development objectives. This survey’s assessment of primary school attendance rates found significantly lower retention rates than government statistics suggest. The findings related to acute malnutrition amongst children are less conclusive with one in five children reported as thin or wasting, although the severity was less than previous surveys have indicated.
Government statistics indicate that 88% of children between 5 and 12 years of age in Myanmar are regularly attending primary or secondary school. National figures suggest at primary school level that the attendance rates of boys and girls are comparable and that figures for the South East are similar as the national average.35 เท contrast, this survey in South East Myanmar found that only 67% of children in this age group are attending school regularly. However this statistic should be treated with caution as, while the sum of children were assessed in 2012, the statistics for 2010 and 2011 are only disagreggated to the household level.
School attendance rates for 5-12 year olds in the South East are disaggregated by township in Table 6 and Map 18. Absenteeism was highest amongst the communities surveyed in Kyaukkyi, Mongpan and Hpasawng. The main reasons identified as causing children to dropout of school included fees and costs (25%), illness (18%), work requirements for income or domestic chores (17%), access or distance (10%) and insecurity (9%). While most of these causes of absenteeism are common reasons in other parts of Myanmar, the prominent proportion of children who are not able to attend school because of insecurity is a problem which is specific to conflict-affected areas. เท this context, absenteeism caused by distance and access constraints would likely be significantly higher if the question focused specifically on attendance at government schools and excluded access to parallel basic education systems administered in ethnic nationality areas.
Acute malnutrition (or wasting) is an indicator of recent nutritional deficiency, as distinct from chronic malnutrition (or stunting) which relates to long-term growth patterns. Government data about children under 5 years of age in Myanmar suggests that 35% are at least moderately stunted for their age and that 8% are at least moderately wasting in comparison to their height.36 An acute malnutrition rate amongst children in South East Myanmar of 6% can be extrapolated frorn these official figures, which represents a poor state of public health according to standard indicators.
While the government’s method of measuring the weight-for-height status of children is the preferred indicator for acute malnutrition, TBC utilised the rapid assessment substitute of ทาid-upper-arm- circumference (MUAC) surveys. This was primarily due to the logistical constraints of carrying measuring equipment across low-intensity conflict in remote areas. Assessments conducted in 2010 and 2011 for this survey were based on previous guidelines for MUAC tests which recommended testing children aged between 12-59 months,37 although the target group was changed in 2012 in accordance with recently revised guidelines to screen children between 6-59 months.38
From a sample population of 2,668 children, TBC partners identified 4% who were moderately or severely wasting which is comparable to the government’s survey findings forthe South East. However, the MUAC tests also recorded a further 17% who are mildly suffering from acute malnutrition. This reflects the findings of community health service providers who had previously reported that 29% of children in the South East are mildly wasting.39 This is of particular concern as the majority of children who die from causes associated with malnutrition are only mildly or moderately malnourished and don’t necessarily display signs of their vulnerability.
35 MICS, 2011, op. cit., pages 105-107
36 MICS, 2011, op. cit., page 15 and 65.
37 The Sphere Project, 2004, Humanitarian Charter and Minimum Standards in Disaster Response, p183.
38 The Sphere Project, 2011, Humanitarian Charter and Minimum Standards in Humanitarian Response, page 221. http://www. spherehandbook.org/ (accessed 10/10/12)
39 Backpack Health W orkers Team, etal, 2010, Diagnosis Critical: Health and Human Rights in Eastern Burma, http://www. backpackteam.org/?page_id=208 (accessed 10/10/12)
CHANGING REALITIES, POVERTY AND DISPLACEMENT เท South East Burma / M yanm ar

Table 6: School Attendance Rates for 5-12 year olds
Map 18: School Attendance Rates for 5-12 year olds
Monghsat 43%
Mongton 63%
Mongpan 39%
Shadaw 64%
Hpruso 77%
Hpasawng 35%
Thandaung 76%
Hpapun 73%
Hlaingbwe 98%
Hpa-an 76%
Myawaddy 88%
Kawkareik 78%
Kyain Seikgyi 90%
Kyaukkyi 10%
Shwegyin 82%
Bilin 81%
Ye 67%
Yebyu 93%
Dawei 92%
Palaw 57%
Tanintharyi 70%
Total 67%
Myanmar
Map Creation date: 12 Oct., 2012 Thematic Data: TBC, CIDKP, KORD, KSWDC, MRDC, SRDC ๘Boundary Data: Ml MU Projection/Datum: UTM Zone 47N/WGS84
Disclaimer: The names and boundaries used here do not imply endorsement by TBC 0 ๙ น*'S&A
THE BORDER CONSORTIUM m.

4.4 AGRICULTURAL LAND AND ASSETS“We should have the right to own land. At the moment, we only have permission to work on the land. We need the government to come and recognise that we are the owners of our land. ”
Karen man, Dawei Township, June 2012, CIDKP focus group discussion
Given Myanmar’s low levels of agricultural productivity and small manufacturing sector, access to farming land and agricultural assets are key factors contributing towards food security and sustainable livelihoods in the rural economy. The results of this household survey suggest that only one third of households in South East Myanmar have access to sufficient land to meet subsistence levels of cultivation. Only one in six households have access to irrigated fields, which indicates the high dependence on shifting cultivation. Low levels of access to draught animals and farm machinery reflect the labour-intensive and subsistence nature of agricultural livelihoods in South East Myanmar.
By the government’s own reckoning, 24% of agricultural households across Myanmar are landless40 and this survey found a similar rate (28%) across South East Myanmar. Given the Constitution’s assertion that all land belongs to the state, landlessness in this context refers to tenure rather than ownership per se. Yet the World Food Program has noted that access to at least two acres of farming land is required for lowland farming households in Myanmar to cultivate enough rice for subsistence needs.41 Only 37% of households in South East Myanmar meet this threshold for self-reliance, which highlights the extent to which agricultural land has been fragmented.
Similarly, only 16% of rural households have access to irrigation which reflects low rates of double-cropping on wet paddy fields and high rates of dependence on shifting cultivation for hillsides and rain-fed cultivation on flatlands. Shifting cultivation is only sustainable if there is enough land to rotate cultivation over a 4-7 year period so that secondary vegetation can regenerate nutrients in the soil prior to the next round of slash and burn’ to prepare fields again.
Table 7 disaggregates data related to access to agricultural land in South East Burma by township, and Map 19 represents the distribution of landless farmers. Hpapun Township recorded the highest rates of landlessness, which is consistent with it also hosting the highest number of internally displaced persons. Population density has particularly increased north of Hpapun town in recent years due to displacement from neighbouring Thandaung and Kyaukkyi Townships, but concurrent militarization has reduced access to agricultural land just as demand has increased.
Only the communities surveyed in Dawei, Hlaingbwe and Hpasawng Townships reported over 60% of the population having access to more than two acres of land' However, access to irrigation is negligible in Dawei and Hpasawng, which reflects the prevalence of long term betel nut, rubber and cardamom orchards and preference for shifting the cultivation of rice. The relatively larger land holdings in Dawei reflects field reports of significant population movements into this township by villagers looking to claim agricultural land during the first half of 2012.
The extent to which constraints on agricultural productivity in South East Myanmar are related to the lack of capital assets is exemplified in Table 8. Overall, only 10% of rural household have access to farm machinery such as mini-tractors and just 16% have access to draught animals. This highlights the reliance on manual labour and simple farming tools such as hoes and machetes to prepare fields for cultivation.
Access to draught animals and farm machinery was most significant in Hpapun and Kawkareik. This possibly reflects the extent to which rural communities have been shielded from attacks on civilian property เท Hpapun and the prominence of lowland fields in Kawkareik. Field reports also suggest that there was widespread forced procurement of mini-tractors in Kawkareik a few years ago.
Apart from agricultural assets, handicraft tools and more specifically looms or backstraps for weaving are common productive assets for households in Shwegyin, Kyaukkyi and Hpapun but virtually nowhere else. This may represent the cultural heritage of the Sgaw Karen and the mobilizing influence of the Karen Women’s Organisation to promote livelihood opportunities for rural women.
40 IHLCA, 2011, op. cit., page 43.
41 WFP, 20111 Food Security Assessment in Northern Rakhine state Myanmar, Yangon, page 7, http://reliefweb.int/sites/reliefweb. int/files/resources/Full_Report_288. pdf (accessed 10/10/12); WFP, 2011a, Food Security Assessment in the Dry Zone Myanmar, Yangon, page 6, http://www.wfp.org/content/myanmar-food-security-assessment-dry-zone-february-2011 (accessed 10/10/12)
CHANGING REALITIES, POVERTY AND DISPLACEMENT เท South East Burma / M yanm ar

Table 7: Access to Agricultural Land
Land
less
Acce
ss
to fie
lds,
but
le
ss
than
2
acre
s
Acce
ss
to Ir
rigat
ion
Monghsat 12% 55% 23%
Mongton 41% 45% 40%
Mongpan 41% 47% 20%
Shadaw 8% 55% 34%
Hpruso 21% 30% 5%
Hpasawng 14% 23% 1%
Thandaung 1% 48% 1%
Hpapun 63% 19% 26%
Hlaingbwe 9% 14% 36%
Hpa-an 31% 43% 5%
Myawaddy 28% 36% 38%
Kawkareik 55% 10% 16%
Kyain Seikgyi 32% 52% 25%
Kyaukkyi 44% 53% 3%
Shwegyin 31% 64% 0%
Bilin 36% 36% 10%
Ye 38% 14% 17%
Yebyu 39% 21% 26%
Dawei 3% 12% 0%
Palaw 18% 21% 0%
Tanintharyi 19% 32% 5%
Total 28% 35% 16%
Table 8: Access to Productive Assets
Farm
M
achi
nery
Sim
ple
Farm
ing
tool
s
Dra
ught
anim
als
Han
dicr
aft
tool
s
Monghsat 8% 90% 7% 1%
Mongton 36% 83% 6% 0%
Mongpan 19% 64% 26% 0%
Shadaw 4% 74% 4% 0%
Hpruso 3% 100% 15% 6%
Hpasawng 1% 99% 17% 0%
Thandaung 5% 99% 1% 0%
Hpapun 40% 81% 49% 56%
Hlaingbwe 2% 82% 23% 0%
Hpa-an 6% 91% 29% 2%
Myawaddy 25% 91% 1% 0%
Kawkareik 35% 99% 26% 0%
Kyain Seikgyi 2% 89% 35% 0%
Kyaukkyi 1% 98% 6% 33%
Shwegyin 1% 99% 1% 48%
Bilin 1% 98% 25% 2%
Ye 14% 68% 3% 0%
Yebyu 5% 87% 5% 0%
Dawei 18% 94% 16% 0%
Palaw 20% 87% 10% 0%
Tanintharyi 3% 74% 22% 0%
Total 10% 88% 16% 7%
Map 19: Landlessness
Myanmar
% o fh o u s e h o ld s w ith no a cce ss to a g ric u ltu ra l land
21 -30%
31 -45%
46-65%
Kilom eters
~r7 ) $■^tooX
Map Creation date: 12 Oct., 2012 Thematic Data: TBC, CIDKP, KORD, KSWDC, MRDC, SRDC Boundary Data: Ml MU Projection/Datum: UTM Zone 47N/WGS84
Disclaimer: The names and boundaries used here do not imply endorsement by TBC
THE BORDER CONSORTIUM m.

4.5 HOUSEHOLD INCOME, EXPENDITURES AND DEBT“We can travel during the night and day now. There is no check point and no interrogations. We can stay overnight in our paddy farms. The Tatmadaw troops have stopped patrolling. We can go to the town freely, and traders can come to our area and sell commodities. So the situation has improved but we don’t know how long it will last like this.”
Karen man, Belin Township, May 2012, KORD interview
Indicators of cash income and expenditures have been supplemented with assessments of livestock assets and debts in orderto summarise the vulnerability and resilience of household economies in South East Myanmar. Around half of average monthly household expenditures are allocated towards food which is relatively low, but more than half of household debt was induced by food shortages which is relatively high. This suggests that subsistence livelihoods are not sufficient to meet consumption needs, but that disposable income levels are too small to supplement food supplies.
Casual labour is the most important source of income as identified by 27% of households and documented in Table 9, which suggests a high rate of vulnerability to seasonal employment. This is comparable with government statistics which indicate the extent of casual labour in rural areas at 21% and increasing.42 30% of households reported having no cash income at all during the previous month while only 17% of households have more reliable sources of income from petty trade and the sale of agricultural crops. A significant proportion of households (16%) reported reliance on collecting forest products such as firewood which is also an indicator of livelihood insecurity.
When disaggregated by township, Map 20 illustrates that access to cash income generation opportunities are most limited in the neighbouring townships of Hpasawng and Thandaung. This is consistent with militarization and restrictions on travel along the Taungoo - Mawchi road and more generally between lowland and upland areas. It may also reflect the greater reliance on subsistence rice cultivation and cardamom orchards which are harvested in August (after the survey was conducted).
เท contrast, communities in Monghsat, Mongton, Yebyu, Shwegyin and Kyaukkyi reported near universal access to cash income which reflects greater integration into the wider market economy. Casual labour was the prime source of income in Monghsat, Mongton and Yebyu, which reflects access to work on sugar cane plantations in the townships of Shan state and rubber, betelnut and lime plantations in Yebyu Township. Communities in Shwegyin and Kyaukkyi reported that collecting forest products was far more important as a source of cash income than anywhere else, which indicates how collecting honey and bamboo for weaving reinforces economic linkages between upland villagers and lowland markets. The sale of livestock was also significant in Tanintharyi, Shadaw and Hpapun however it is unclear whether this is a sustainable source of income or a depletion of assets.
Livestock assets are a common store of wealth in subsistence agrarian economies, but a relatively low proportion (23%) of households reported owning cattle and less still (8%) herd goats. However, 76% of households reported breeding poultry and 60% are breeding pigs which reveals the cultural importance of breeding small animals to share as food at social events such as weddings and funerals.
Table 10 disaggregates household livestock assets by township, from which it becomes evident that the negligible ownership of cattle in Shwegyin, Kyaukkyi, Thandaung and Hpasawng is consistent with high rates of displacement in these townships. เท the face of displacement, cattle are often sold rather than relocated and the cost of purchasing replacements upon arrival at a new location is often prohibitive. High rates of cattle ownership in Hlaingbwe, Shadaw and Kawkareik reflect the prominence of cattle exports from the former township and the importance of cattle for ploughing, farming and transportation in the latter townships.
This survey found that 61% of expenditures by the average household in rural communities of the South East are allocated towards food and health care, which is comparable to the national average. The proportion of household expenditures allocated to food has been considered a proxy indicator of poverty
42 IHLCA, 2011, op. cit., page 37
j j f CHANGING REALITIES, POVERTY AND DISPLACEMENT เท South East Burma / M yanm ar

Table 9: Main Sources of Income in Past Month
Cas
ual
labo
ur
Petty
tr
ade
Agr
icul
tura
l cr
ops
Col
lect
F
ores
t P
rodu
cts
Sale
of liv
esto
ck
No
cash
in
com
e in
pa
st
mon
th
Monghsat 65% 4% 21% 2% 0% 1%
Mongton 59% 18% 8% 9% 1% 1%
Mongpan 37% 8% 29% 15% 2% 3%
Shadaw 51% 6% 1% 18% 12% 13%
Hpruso 25% 3% 11% 14% 7% 37%
Hpasawng 1% 1% 3% 0% 5% 90%
Thandaung 4% 4% 5% 1% 0% 86%
Hpapun 18% 15% 16% 1% 10% 40%
Hlaingbwe 12% 3% 0% 10% 1% 74%
Hpa-an 12% 11% 2% 5% 3% 65%
Myawaddy 10% 14% 0% 25% 7% 41%
Kawkareik 33% 14% 14% 10% 7% 5%
Kyain Seikgyi 20% 19% 7% 4% 4% 43%
Kyaukkyi 8% 0% 0% 91% 0% 1%
Shwegyin 5% 4% 1% 80% 2% 1%
Bilin 38% 7% 3% 7% 3% 37%
Ye 52% 7% 18% 9% 0% 3%
Yebyu 59% 11% 4% 0% 4% 1%
Dawei 13% 19% 12% 9% 9% 35%
Palaw 32% 18% 2% 16% 9% 18%
Tanintharyi 23% 14% 8% 10% 18% 22%
Total 27% 10% 7% 16% 5% 30%
Table 10: Household Livestock Assets
Cat
tle O)ol G
oat
Pou
ltry
Monghsat 6% 68% 1% 81%
Mongton 9% 48% 1% 75%
Mongpan 10% 28% 0% 45%
Shadaw 46% 68% 0% 91%
Hpruso 29% 88% 3% 81%
Hpasawng 3% 84% 34% 80%
Thandaung 1% 48% 3% 75%
Hpapun 17% 91% 21% 83%
Hlaingbwe 58% 86% 26% 67%
Hpa-an 34% 92% 8% 65%
Myawaddy 22% 81% 11% 67%
Kawkareik 44% 32% 7% 70%
Kyain Seikgyi 31% 67% 7% 89%
Kyaukkyi 3% 71% 9% 81%
Shwegyin 1% 48% 8% 92%
Bilin 31% 63% 8% 81%
Ye 16% 15% 2% 47%
Yebyu 21% 30% 0% 93%
Dawei 36% 59% 1% 81%
Palaw 30% 47% 2% 74%
Tanintharyi 36% 64% 22% 87%
Total 23% 60% 8% 76%
Map 20: Access to Cash Income
Myanmar
% o fh o u s e h o ld s
w ith no cash in co m e in th e p a s t m on th
□ 1-5%
] 1 313-22%
35-43%
65-74%
86-90%
Kilom eters
^100;
Map Creation date: 12 Oct., 2012 Thematic Data: TBC, CIDKP, KORD, KSWDC, MRDC, SRDC ๗Boundary Data: Ml MU Projection/Datum: UTM Zone 47N/W3S84
Disclaimer: The names and boundaries used here do not imply endorsement by TBC
THE BORDER CONSORTIUM E g

as the share of food in expenditures is expected to decrease as the consumption of other commodities increases. However, government figures suggest that while there has been a significant reduction in poverty, household expenditures on food are actually increasing amongst the poorest households. It appears that consumption expenditure analysis is not necessarily applicable to subsistence livelihoods which are based around barter exchange.43
Data for household expenditure shares in South East Myanmar, as disaggregated in Table 11 and Map 21, are also not consistent with other poverty indicators. Kyaukkyi, Hlaingbwe and Yebyu recorded the highest burden of food on household expenditure, although there are significant variations in regards to other poverty indicators for these townships. Communities surveyed in Mongpan recorded a significantly lower proportion of household expenditures allocated to food, and given that they also recorded high rates of access to cash during previous month, this may represent greater access to disposable income than elsewhere.
Household debt levels, and more specifically debt induced by food shortages, is another proxy indicator of income poverty. The proportion of households in debt across South East Myanmar is double the reported national average of 30%.44 However, it should be noted that access to credit can smooth consumption patterns during times of stress and stimulate income generation to escape from poverty.
The problem is that household debt in South East Myanmar is primarily fuelled by food shortages. 36% of all households surveyed, or 58% of households in debt, reported that a food shortage was their main reason for borrowing. Investments in agricultural inputs to increase productivity were insignificant in comparison. This suggests that a substantial proportion of households in South East Myanmar are accumulating debt to meet basic needs, which is not sustainable. Debt is primarily being accrued to smooth consumption patterns and as a last resort to avoid the collapse of household economies.
Data about the prevalence and reasons for debt in South East Myanmar is disaggregated to the township level in Table 12 and Map 22. Communities in Kyaukkyi and Thandaung recorded the highest rates of indebtedness due to food shortages, which is consistent with the cumulative effects of prolonged counter-insurgency operations targeting civilian populations as a means of undermining the armed opposition. At the other end of the spectrum, communities เท Yebyu, Mongpan and Dawei reported the most significant borrowing levels in order to finance investments in agricultural or other business investments such as land rent, seed and fertilizer.
43 IHLCA, 2011, op. cit., page 18.
44 IHLCA, 2011, op. cit., page 49
Table 11: Household Expenditures
Food
Heal
th
Car
e
Hou
seho
ld
good
s
Clo
thin
g or
She
lter
Debt
R
epay
men
t
Edu
catio
n
Monghsat 49% 10% 13% 11% 7% 1%
Mongton 40% 13% 24% 6% 9% 6%
Mongpan 21% 11% 20% 17% 7% 7%
Shadaw 36% 15% 18% 17% 4% 9%
Hpruso 36% 12% 17% 10% 10% 4%
Hpasawng 45% 20% 13% 12% 2% 6%
Thandaung 47% 13% 8% 3% 12% 5%
Hpapun 39% 21% 14% 11% 8% 4%
Hlaingbwe 75% 2% 1% 22% 0% 1%
Hpa-an 45% 17% 13% 5% 14% 1%
Myawaddy 44% 20% 9% 2% 0% 12%
Kawkareik 35% 20% 26% 0% 1% 6%
Kyain Seikgyi 33% 10% 12% 2% 6% 5%
Kyaukkyi 80% 5% 0% 0% 9% 1%
Shwegyin 66% 11% 9% 5% 1% 3%
Bilin 45% 14% 12% 8% 9% 1%
Ye 50% 13% 12% 3% 9% 5%
Yebyu 72% 4% 5% 2% 5% 5%
Dawei 41% 23% 8% 1% 2% 14%
Palaw 47% 12% 9% 5% 3% 8%
Tanintharyi 33% 22% 11% 4% 4% 4%
Total 47% 14% 12% 7% 6% 5%
Table 12: Household Indebtedness
Tota
l %
hous
ehol
ds
เท
debt
Hou
seho
ld
debt
du
e to
food
sh
orta
ges
Hou
seho
ld
debt
du
e to
heal
th
care
Hou
seho
ld
debt
due
to
educ
atio
n
Hou
seho
ld
debt
due
to
busi
ness
In
vest
men
ts
Monghsat 52% 48% 2% 0% 2%
Mongton 43% 25% 11% 3% 3%
Mongpan 67% 19% 18% 9% 17%
Shadaw 54% 32% 10% 6% 5%
Hpruso 71% 39% 13% 5% 1%
Hpasawng 39% 20% 14% 4% 1%
Thandaung 74% 65% 5% 5% 0%
Hpapun 62% 38% 17% 3% 2%
Hlaingbwe 3% 1% 1% 1% 0%
Hpa-an 81% 40% 26% 3% 3%
Myawaddy 42% 19% 9% 2% 5%
Kawkareik 60% 27% 14% 2% 3%
Kyain Seikgyi 49% 24% 11% 3% 9%
Kyaukkyi 96% 92% 1% 1% 2%
Shwegyin 65% 56% 8% 2% 0%
Bilin 79% 44% 19% 4% 4%
Ye 77% 32% 34% 1% 4%
Yebyu 86% 52% 14% 2% 18%
Dawei 65% 23% 21% 10% 10%
Palaw 78% 39% 23% 9% 4%
Tanintharyi 55% 28% 19% 3% 3%
Total 62% 36% 14% 4% 4%
n l CHANGING REALITIES, POVERTY AND DISPLACEMENT เท South East Burma / M yanm ar

Map 21: Household Expenditures on Food Map 22: Prevalence of Household Debt
Myanmar
Map Creation date: 12 Oct., 2012 Thematic Data: TBC, CIDKP, KORD, KSWDC, MRDC, SRDC ๘Boundary Data: MIMU Projection/Datum: UTM Zone 47N/W3S84
Disclaimer: The names and boundaries used here do not imply endorsement by TBC
Myanmar
Map Creation date: 12 Oct., 2012 Thematic Data: TBC, CIDKP, KORD, KSWDC, MRDC, SRDC ■๗Boundary Data: MIMU Projection/Datum: UTM Zone 47N/WGS84
Disclaimer: The names and boundaries used here do not imply endorsement by TBC
THE BORDER CONSORTIUM o

4.6 FOOD SECURITY Table 13: Main Sources of Rice
“The Tatmadaw told us they will build a new town and they bulldozed our lands. They cleared the land and uprooted our coconut and betel nut plantations. They built a school in my land saying they will compensate me but the school building is finished and they still haven’t paid me anything. ”
Karen man, Myawaddy, May 2012, CIDKP interview.
Food security encompasses a sufficient availability of food supplies; adequate food access through own production, market mechanisms orothersources; and appropriate utilization of food to meet nutritional requirements. เท South East Myanmar, despite high levels of subsistence cultivation, access to food is poor for more than thalf of households in rural areas. Similarly, food consumption analysis indicates that only 45% of households have an adequately nutritious diet.
Own cultivation is the main source of rice for half of the households surveyed in South East Myanmar, with 35% primarily purchasing their staple food and 11% reverting to borrowing or bartering. The reliability of own cultivation as a source of rice is directly related to access to agricultural land. WFP’s analysis in lowland areas of Myanmar is that at least two acres of land is required to ensure good food access for households whose main source of rice is from their own fields.45 While a greater area is required for shifting cultivation in upland areas, this survey found that 63% of households in South East Myanmar have access to less than two acres of agricultural land (as documented in Section 4.4)
Table 13 disaggregates responses at the township level and Map 23 represents the distribution of households who are primarily self-reliant for rice. The main exceptions to the general trend are in Yebyu, Kawkareik, Thandaung and Kyaukkyi. เท Yebyu and Kawkareik, most households buy rice from markets and it has already been established that on average 72% and 35% of household expenditure is allocated to food respectively. According to WFP classifications for household food access, this dynamic in Yebyu constitutes a medium level of access to food while Kawkareik is categorised as having good access to food. เท Thandaung, a classification for food access relating to the 40% of households who depend on borrowing to acquire rice cannot be determined without knowing whether they will be able to repay debts within two months. Kyaukkyi appears as an anomaly because aid was the main source of rice during the previous month for half the surveyed population.
As this household survey was conducted during May and June, and the wet season rice crop IS harvested around November, subsistence farmers required at least six months of rice stocks in order to be self-reliant until the harvest. Only 10% of households surveyed reported a sufficient availability of rice supplies and 83% have less than 3 months of rice stocks on hand. This is not necessarily an obstacle to food security for the 35% of households who primarily purchase rice. However, it means that more than half of the households are facing rice shortages for at least three months priorto the harvest, unless they can buy, borrow or barter for additional rice.
45 WFP, 2011, op. cit., page 6, and WFP, 2011a, op. cit., page 7.
Own
Ric
e C
rop
Pur
chas
ed
with
C
ash
Borro
wed
/
bart
erin
g
Monghsat 45% 9% 38%
Mongton 58% 35% 5%
Mongpan 56% 28% 10%
Shadaw 58% 29% 13%
Hpruso 45% 50% 4%
Hpasawng 95% 4% 1%
Thandaung 28% 31% 40%
Hpapun 62% 23% 15%
Hlaingbwe 92% 6% 0%
Hpa-an 48% 47% 5%
Myawaddy 63% 32% 2%
Kawkareik 26% 70% 2%
Kyain Seikgyi 68% 25% 5%
Kyaukkyi 9% 3% 37%
Shwegyin 61% 19% 19%
Bilin 44% 48% 6%
Ye 28% 60% 12%
Yebyu 11% 83% 4%
Dawei 47% 51% 0%
Palaw 36% 45% 17%
Tanintharyi 61% 30% 5%
Total 50% 35% 11%
Table 14: Household Rice StocksN
one
1-30
days
1-3
mon
ths
4-6
mon
ths
over
6 m
onth
s
Monghsat 15% 64% 17% 3% 2%
Mongton 1% 40% 43% 7% 10%
Mongpan 4% 16% 35% 31% 14%
Shadaw 2% 28% 45% 20% 6%
Hpruso 8% 41% 21% 16% 15%
Hpasawng 1% 4% 8% 60% 28%
Thandaung 6% 62% 31% 1% 1%
Hpapun 23% 22% 28% 15% 13%
Hlaingbwe 0% 4% 93% 3% 0%
Hpa-an 4% 28% 40% 16% 12%
Myawaddy 1% 26% 53% 16% 5%
Kawkareik 1% 34% 40% 23% 1%
Kyain Seikgyi 4% 26% 41% 10% 19%
Kyaukkyi 20% 32% 48% 1% 1%
Shwegyin 5% 73% 18% 0% 5%
Bilin 2% 25% 45% 15% 14%
Ye 21% 51% 18% 5% 5%
Yebyu 5% 85% 10% 0% 0%
Dawei 0% 32% 26% 16% 27%
Palaw 7% 57% 19% 8% 10%
Tanintharyi 1% 32% 36% 6% 25%
Total 6% 36% 35% 13% 10%
CHANGING REALITIES, POVERTY AND DISPLACEMENT เท South East Burma / M yanm ar

Map 23: Subsistence Rice Cultivation Map 24: Insufficient Rice Stocks
Myanmar
% o fh o u s e h o ld s w ith le ss th a n 3 m o n th s o f
rice s to c k s
เ ^ ^ 13%
เ ^ ^ 51-70%
ไ 71-80%
Map Creation date: 12 Oct., 2012 Thematic Data: TBC, CIDKP, KORD, KSWDC, MRDC, SRDC cdBoundary Data: Ml MU Projection/Datum: UTM Zone 47N/W3S84
Disclaimer: The names and boundaries used here do not imply endorsement by TBC
THE BORDER CONSORTIUM 0

Household rice stocks are disaggregated to the township level in Table 14 and the proportion of households facing at least three months of rice shortages is represented in Map 24. Hpasawng Township, which is a largely subsistence economy with limited utilization of cash, is documented as having the greatest capacity to avoid hunger gaps. The high proportion of households facing rice shortages in Thandaung, Kyaukgyiand Shwegyin is consistent with other food security indicators, whereas similarly high proportions in Monghsat and Yebyu are not considered as significant because of the greater reliance on the purchase and exchange of rice in these townships.
Food consumption analysis was conducted to assess the diversity, frequency and nutritional value of food consumed during the previous week, based on standard guidelines.46 The scores for each household were categorized into groups using the same thresholds as in other parts of Myanmar. The average number of days that each food item was consumed during the previous week is disaggregated by consumption groups in Table 15. A poor diet in South East Myanmar is characterized by daily rice consumption apart from a partial serving one day a week, vegetables four days a week, and fruit once a week. Households with a borderline diet consume rice, vegetables and fruits more regularly, and sources of protein twice a week. Households with an acceptable diet consume a broader diversity of food and significantly more protein.
Table 15: Mean Food Consumption forthe Previous Week
Ric
e
Cer
eals
Root
s / t
uber
s
Pul
ses
Veg
etab
les
Fru
its
Red
Mea
t
Pou
ltry
Egg
s
Fish
Dai
ry
Oil/
fat
Sw
eets
Con
dim
ents
Poor 6.2 1.2 1.1 0.4 4.0 1.3 0.4 0.4 0.3 0.6 0.0 2.3 2.0 6.4
Borderline 7.0 1.8 1.6 1.1 5.7 2.6 1.0 1.1 1.2 1.4 0.8 3.0 2.5 6.8
Acceptable 7.0 2.1 1.8 1.9 6.0 3.3 1.6 1.6 2.0 2.9 2.8 3.9 3.3 6.9
Average (max. 7 days) 6.9 1.9 1.6 1.4 5.7 2.8 1.2 1.1 1.5 2.0 1.7 3.4 2.8 6.8
This survey has identified 45% of households as having acceptable food consumption, 45% with borderline but unacceptable food consumption and 10% with poor food consumption. Although national figures are not available, this level of inadequate food consumption in South East Myanmar appears better than conditions in Southern Chin state, comparable with the nutritional status of households in Northern Rakhine state prior to the recent communal violence, but worse than the situation in the Dry Zone.47
Food consumption patterns are recognised as a proxy indicator for food security. Findings from South East Myanmar are disaggregated by township in Table 16 and the distribution of inadequate diets is represented in Map 25. The utilization of food is most problematic in Thandaung, Kyaukkyi and Shwegyin. This is consistent with the findings relating to access to agricultural land, remaining rice stocks and indebtedness due to food shortages in these townships. Dawei and Mongton recorded the highest rates of acceptable food consumption, which are consistent with relatively high rice stocks, low expenditures on food and low rates of debt caused by food shortages.
4.7 LIVELIHOOD SHOCKS AND COPING STRATEGIES“After the ceasefire talks, the situation in our area has improved. We haven’t hear the sound of artillery shells exploding for many months. But we don’t trust the Tatmadaw because they keep patrolling in our area. เท my opinion, the real peace will come on the day when the Tatmadaw troops withdraw from our area”.
Karen man, Belin Township, May 2012, KORD interview
The severity of exposure to economic shocks, natural hazards and human rights abuses, as well as the capacity of households to cope with the impact of these shocks, directly affects the sustainability of livelihoods. As the peace process evolves, political dialogue and national reconciliation processes will need to be complemented with more accountable systems of local governance to stop human rights abuses and prevent their reoccurrence. Similarly, more responsive social service and aid mechanisms will be required to reinforce coping strategies and provide a peace dividend for conflict-affected communities.
46 WFP, 2008, Food Consumption A na lys is : Calculation and the use o f food consumption score in food security analysis, Technical Guidance Sheet, Rome, http://www.wfp.org/content/technical-guidance-sheet-food-consumption-analysis-calculation-and-use- food-consumption-score-food-s (accessed 10/10/12)
47 WFP, 2011, op. cit.] WFP, 2011a, op. cit:, WFP, 2012, Emergency Food Security Assessment in Southern Chin state, www.wfp. org/content/myanmar-emergency-food-security-assessment-southern-chin-state-march-2012 (accessed 10/10/12)
โฐ CHANGING REALITIES, POVERTY AND DISPLACEMENT เท South East Burma / M yanm ar
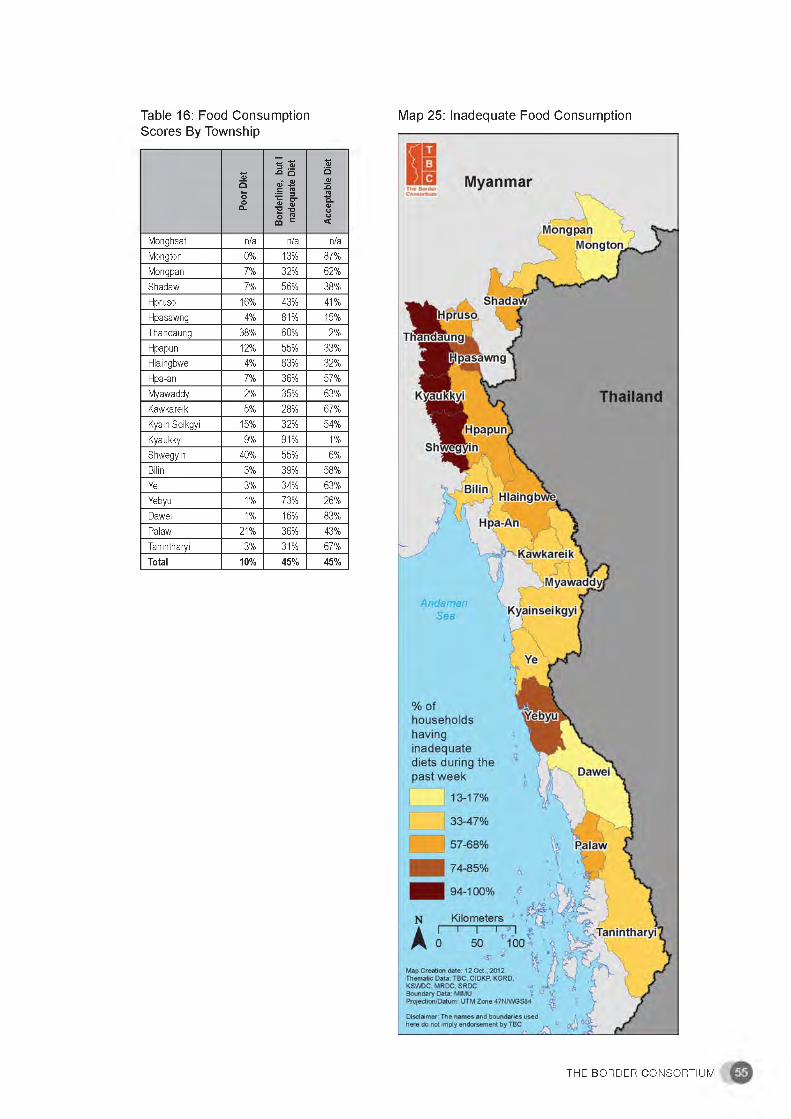
Table 16: Food Consumption Scores By Township
Poor
D
iet
Bor
derli
ne,
but
I na
dequ
ate
Die
t
Acc
epta
ble
Die
t
Monghsat n/a n/a n/a
Mongton 0% 13% 87%
Mongpan 7% 32% 62%
Shadaw 7% 56% 38%
Hpruso 16% 43% 41%
Hpasawng 4% 81% 15%
Thandaung 38% 60% 2%
Hpapun 12% 55% 33%
Hlaingbwe 4% 63% 32%
Hpa-an 7% 36% 57%
Myawaddy 2% 35% 63%
Kawkareik 5% 28% 67%
Kyain Seikgyi 15% 32% 54%
Kyaukkyi 9% 91% 1%
Shwegyin 40% 55% 6%
Bilin 3% 39% 58%
Ye 3% 34% 63%
Yebyu 1% 73% 26%
Dawei 1% 16% 83%
Palaw 21% 36% 43%
Tanintharyi 3% 31% 67%
Total 10% 45% 45%
Map 25: Inadequate Food Consumption
THE BORDER CONSORTIUM

The main shocks to livelihoods experienced by households in South East Myanmarduring the six months prior to the survey are similar to those reported from other regions of the country. Natural hazards (such as floods, unseasonal rains and drought), illness or poor health, damage to crops by pests and rats, and rising commodity prices have been commonly identified as key difficulties. However, whereas low wages and underemployment have been reported as the most prominent problems elsewhere in Myanmar,48 only a small proportion of households in the South East prioritised these concerns.
Conversely, conflict, militarisation and the associated human rights abuses remain significant threats to livelihoods เท South East Myanmar. When asked to prioritise the two main shocks to their livelihoods during the previous six months, 16% of households reported military patrols while forced labour (10%), armed conflict (8%), restrictions on movement (7%) and forced displacement (7%) were also significant coercive factors.
However, there are some caveats that should be noted in regards to this analysis. Firstly, the questionnaire in 2010 combined responses for armed conflict and military patrols. Secondly, household surveys were conducted in 14 of the 21 townships before the preliminary ceasefire agreements were negotiated in 2012. Finally, findings relating to military patrols and restrictions on movement are inter-related as some respondents and enumerators may have interpreted restricted access to fields and markets into the former category and others into the latter.
Table 17 disaggregates the main shocks in South East Myanmar by township, while Map 26 represents the average responses for military patrols and restrictions on movement so as to discount the possibility of double-counting. Military patrols and restrictions on movement have undermined access to livelihood opportunities most in the contested areas of Thandaung, Monghsat, Palaw, Kyaukkyi and Kawkareik. These results correspond with a high prevalence of either forced labour or displacement in all of the above townships except Palaw. Communities in Mongpan highlighted landmines as a particular threat and, while a statistical correlation with military patrols cannot be deduced from the data, it is generally acknowledged there is a direct relationship between the two threats. Natural hazards, which were primarily unseasonal rains, have been particularly disruptive for shifting cultivators in the upland areas of Shadaw, Hlaingbwe, Hpruso, Hpasawng and Thandaung.
Table 17: Main Shocks to Livelihoods in the Previous Six Months
Nat
ural
haz
ards
Pes
ts
dam
aged
cr
ops
Illne
ss
/ po
or
heal
th
Infla
tion
Milit
ary
patr
ols*
Arm
ed
conf
lict*
Res
trict
ions
on
m
ovem
ent
Forc
ed
Labo
ur
Forc
edD
ispl
acem
ent
Land
min
es
Monghsat 0% 5% 3% 0% 54% 10% 0% 24% 50% 0%
Mongton 3% 19% 52% 86% 0% 1% 1% 0% 0%
Mongpan 8% 16% 14% 20% 22% 1% 0% 18% 0% 16%
Shadaw 68% 22% 33% 18% 13% 8% 1% 22% 0% 0%
Hpruso 52% 36% 35% 7% 6% 0% 3% 4% 1% 0%
Hpasawng 56% 17% 13% 84% 20% 22% 1% 0% 4%
Thandaung 50% 1% 4% 0% 56% 0% 34% 28% 7% 0%
Hpapun 14% 56% 19% 2% 0% 3% 4% 0% 1%
Hlaingbwe 59% 20% 10% 2% 1% 0% 0% 0% 0% 0%
Hpa-an 37% 67% 16% 0% 1% 0% 0% 1% 0% 0%
Myawaddy 9% 23% 58% 1% 5% 1% 1% 4% 4% 0%
Kawkareik 1% 1% 8% 0% 46% 33% 1% 0% 20% 0%
Kyain Seikgyi 39% 11% 10% 34% 2% 1% 1% 1% 0% 0%
Kyaukkyi 2% 3% 1% 0% 0% 47% 47% 49% 1%
Shwegyin 46% 35% 11% 3% 3% 3% 18% 21% 22% 0%
Bilin 10% 57% 51% 0% 1% 0% 1% 17% 0% 1%
Ye 1% 6% 43% 23% 28% 18% 3% 0% 3%
Yebyu 2% 1% 8% 70% 9% 5% 3% 25% 5% 0%
Dawei 1% 15% 52% 4% 1% 0% 1% 0% 2% 0%
Palaw 13% 30% 57% 7% 48% 5% 2% 0% 1%
Tanintharyi 17% 27% 30% 2% 38% 14% 0% 8% 1% 0%
Total 24% 23% 26% 17% 16% 8% 7% 10% 7% 1%
48 WFP, 2011, op. cit., page 16, and WFP, 2011a, op. cit., page 21.
^ CHANGING REALITIES, POVERTY AND DISPLACEMENT เท South East Burma / M yanm ar

Map 26: Militarisation & Restrictions on Movement
Map 27: Extreme Coping Strategies for Food Shortages
Myanmar
.M ongpanM on g ton ,,, y
S hadaw
Thailand
Map Creation date: 12 Oct., 2012 Thematic Data: TBC, CIDKP, KORD, KSWDC, MRDC, SRDC Boundary Data: MIMU Projection/Datum: UTM Zone 47N/WGS84
Disclaimer: The names and boundaries used here do not imply endorsement by TBC
Myanmar
Map Creation date: 12 Oct., 2012 Thematic Data: TBC, CIDKP, KORD, KSWDC, MRDC, SRDC <๙Boundary Data: MIMU Projection/Datum: UTM Zone 47N/WGS84
Disclaimer: The names and boundaries used here do not imply endorsement by TBC
THE BORDER CONSORTIUM

These shocks contributed to food shortages for 61% of households during the month prior to being surveyed, which reflects a high and protracted degree of stress on livelihoods in the rural areas of South East Myanmar. Buying cheaper, poorer quality food (29%) and taking out loans to buy food on credit (24%) were reported as the most common household mechanisms for coping with these shocks. The importance of social capital for withstanding shocks to livelihoods is highlighted by 16% of households who relied on family and friends. 16% of households reported reverting to more extreme coping strategies such as reducing daily food consumption by eating rice soup, selling assets and spending entire days without eating.
Communities in Dawei and Hlaingbwe recorded the least food shortages during the previous month, as documented in Table 18. Dawei also recorded an excellent food consumption score, but Hlaingbwe’s dietary diversity was below average which suggests that respondents in Hlaingbwe at least may have misinterpreted the question as focusing on rice supplies. Almost universal food shortages have been reported by households in Monghsat, Shadaw, Kyaukkyi, Shwegyin and Yebyu.
Buying cheaper food and buying food on credit, which are utilized as consumption smoothing practices by a cross-section of society to cope with income gaps, are most prevalent in Yebyu, Shadaw and Mongton. Social capital with family and friends appears most significant for responding to food shortages in the subsistence economy of rural Hpasawng' The distribution of more extreme coping mechanisms, specifically reducing consumption by reverting to rice soup, selling assets and spending entire days without eating, is represented in Map 27. These extreme coping strategies are most prominent amongst the communities surveyed in Kyaukkyi and Shwegyin, but it is also significant to note that 65% of households in Thandaung had accumulated debt in response to food shortages.
Table 18: Food Shortages and Coping Mechanisms in the Previous Month
Food
Sh
orta
ges
เท
Past
M
onth
Skip
ped
entir
e da
ys
with
out
eatin
g
Sold
Ass
ets
Eat
rice
soup
/
redu
ce
cons
umpt
ion
Rely
on
Frie
nds
& R
elat
ives
Purc
hase
fo
od
on
cred
it an
d in
cur
debt
s
Buy
chea
per,
poor
qu
ality
fo
od
Monghsat 100% 2% 1% 6% 3% 20% 50%
Mongton 77% 0% 1% 1% 18% 22% 67%
Mongpan 90% 1% 13% 10% 21% 12% 48%
Shadaw 97% 1% 20% 4% 26% 49% 40%
Hpruso 72% 1% 8% 7% 32% 34% 19%
Hpasawng 94% 3% 12% 1% 94% 27% 24%
Thandaung 75% 0% 0% 0% 0% 65% 9%
Hpapun 62% 0% 4% 2% 16% 23% 6%
Hlaingbwe 3% 1% 0% 0% 0% 1% 2%
Hpa-an 30% 0% 1% 1% 3% 26% 2%
Myawaddy 21% 0% 0% 0% 14% 9% 9%
Kawkareik 39% 0% 0% 0% 12% 19% 28%
Kyain Seikgyi 50% 1% 3% 1% 37% 8% 63%
Kyaukkyi 98% 13% 2% 92% 7% 5% 33%
Shwegyin 98% 3% 0% 54% 1% 0% 92%
Bilin 32% 0% 1% 1% 4% 25% 13%
Ye 68% 0% 5% 0% 9% 49% 22%
Yebyu 97% 0% 5% 1% 3% 48% 66%
Dawei 7% 0% 1% 0% 0% 6% 1%
Palaw 70% 2% 8% 20% 28% 49% 20%
Tanintharyi 44% 0% 17% 6% 13% 22% 10%
Total 61% 1% 5% 10% 16% 24% 29%
g l CHANGING REALITIES, POVERTY AND DISPLACEMENT เท South East Burma / M yanm ar


APPENDIX 1: INTERNALLY DISPLACED POPULATION ESTIMATES (2012)
States, Regions, and Townships
Population displaced in
past 12 months
Population returned or
resettled in past 12 months
Total IDPs
SHAN STATE 6,700 5,000 125,400
Mawkmai 100 0 3,300
Mongkaung 1,300 100 3,600
Laikha 300 500 16,500
Loilem 100 0 1,900
Namzarng 400 0 6,800
Kunhing 500 200 7,800
Monghsat 100 0 31,000
Mongton 100 0 30,000
Mongpan 100 100 3,900
Kyethi 1,400 4,000 10,700
Langkho 100 100 1,900
Mongnai 400 0 3,000
MongHsu 1,800 0 5,000
KAYAH STATE 700 210 34,600
Shadaw 100 160 1,140
Loikaw 100 0 3,220
Demoso 100 0 9,350
Hpruso 50 50 5,880
Bawlakhe 50 0 1,970
Hpasawng 250 0 8,570
Mese 50 0 4,470
BAGO REGION 200 0 44,200
Kyaukkyi 200 0 33,000
Shwegyin 0 0 11,200
KAYIN STATE 1,600 29,470 89,150
Thandaung 200 250 16,000
Hpapun 1,400 0 41,000
Hlaingbwe 0 470 5,000
Myawaddy 0 12,000 4,150
Kawkareik 0 1,550 2,300
Kyain Seikgyi 0 15,200 20,700
MON STATE 200 700 35,000
Ye 200 700 35,000
TANINTHARYI REGION 600 1,620 71,650
Yebyu 400 500 23,500
Dawei 200 300 5,600
Thayetchaung 0 0 4,100
Palaw 0 340 14,540
Myeik 0 480 6,050
Tanintharyi 0 0 14,640
Bokpyin 0 0 3,220
TOTALS 10,000 37,000 400,000
» 1 CHANGING REALITIES, POVERTY AND DISPLACEMENT เท South East Burma / M yanm ar

APPENDIX 2: 2012 SURVEY FRAMEWORK
INTERVIEWS ABOUT DISPLACEMENT, MILITARISATION AND DEVELOPMENT
Township name (on maps o f Burma/Myanmar): ........................................................................................... /Background about key informants : ............................................................................................
1. H o w m any v illa g e s h ave been c o m p le te ly d e s tro ye d , re lo ca te d o r a b a n d o n e d du ring th e p ast 12 m on th s? W h e re
w e re th e s e v illa g e s?
2. H o w m an y pe o p le h ave fled o r been fo rce d to leave th e ir h o m e s and m oved e ls e w h e re due to a rm ed con flic t,
h um an righ ts a b u se s o r na tu ra l d isa s te rs du rin g th e p a s t 12 m on th s?
3. H o w m an y peop le h ave been fo rce d to leave th e ir h om es by a rm e d con flic t, na tu ra l d isa s te rs o r h um an righ ts
a b uses; rem a in in Burm a; and have not been ab le to re tu rn o r rese ttle e ls e w h e re in s a fe ty and w ith d ig n ity?
4. H o w m an y n e w v illa g e s have been e s ta b lish e d fo r d isp la ce d p e rso n s to rese ttle in to d u rin g th e past 12 m on th s?
W h e re a re th e s e v illa g e s?
5. H o w m an y peop le have been ab le to re tu rn to th e ir fo rm e r v illa g e o r rese ttle e ls e w h e re in s a fe ty and w ith d ig n ity
d u rin g th e p ast 12 m on th s?
ธ. W h e re a re th e lo ca tio n s o f T a tm a d a w o u tp o s ts and ba tta lio n h e a d q u a rte rs?
7. W h e re a re B o rd e r G uard F orce b a tta lio n s and T a tm a d a w co n tro lle d m ilitias lo ca ted ?
8. W h e re have n o n -s ta te a rm ed g ro u p s e s ta b lish e d lia ison o ffice s fo r th e p eace p ro ce ss?
9. W h e re do n o n -s ta te a rm e d g ro u p s c la im a u th o rity o v e r th e p o p u la tio n ?
10. W h a t ty p e of, and w h e re are, e c o n o m ic d e v e lo p m e n t p ro je c ts?
HOUSEHOLD POVERTY SURVEY
Fie ld s ta ff’s n am e & o rg a n isa tio n : ...................................................................................................
T o w n s h ip : ...................................................................................................
V i l la g e : ...................................................................................................
“Hello, my name is__________ . I work fo r__________. My organization would like to learn more about how yourhousehold is surviving by asking you some questions. I do not need to know your name, and all o f your specific responses will be kept confidential. You will not be paid for participating in this survey, and there are no promises that you will receive aid in the future. Please be completely honest with your answers. Are you willing to give some time and respond to these questions?"
1. Sex?I I 1. Male แ 2. Female
2. What is your religion?แ I.A n im is t
I I 4. Moslemแ 2. Buddhist
I I 5. None□□ Christian
Other
(Mark one box only)
3. What is your ethnic group?□□□□□
1. Sgaw Karen 4. Kayaw 7. Shan 10. Lahu 13. O ther:..........
แ 2. Pwo Karen I I 5. Paku
แ 8. Palaung I I 11. Mon
□□□□
3. Kayah 6. Kayan 9. Pa-0 12. Burman
(Mark one box only)
Please record the number o f people currently living in your household according to age and sex.(Insert num ber o f people เท a ll re levant boxes)
Age Male FemaleUnder 5 years5 - 1 4 years1 5 - 2 9 years30 - 44 years45 - 59 yearsOver 60 years
How can you prove you are a citizen o f Burma?แ 1. Birth registration documents z\ 3. House registration documents
I I 5. Other (spe c ify )..............................................
(M ark a ll re levant boxes)] 2. Valid Burmese Identity card
I I 4. No proof
Has your household received cash o r food aid from my organization during the past 12 m onths?I I ไ. Yes □ 2. No
THE BORDER CONSORTIUM ( 3

7. What is the main source o f water used by your household fo r drinking? (M ark one box only)แ 1. Protected water source (eg, deep tube wells, stone-lined wells, and fenced natural springs)
I I 2. Unprotected water source (eg, surface water from rivers or ponds, and unlined wells)
8. What are the main construction materials currently used fo r your house’s roofing? (M ark one box only)u 1. Thatch / leaf / bamboo roofing m 2. Tarpaulin roofing m 3. wooden tiled roofingแ 4. T in /Z in c /iro n roofing m 5. No roofing
I I 6. Other (please s p e c ify ).................................
9. What are the main construction materials currently used fo r your house’sแ 1. Thatch / leaf walls m 2. Bamboo walls แ 4. rudimentary wood walls m 5. brick or stone walls
I I 7. Other (please sp e c ify ).........................
10. What type o f latrine does your household normally use? (M ark one box only)u 1. Wet latrine m 2. Covered pit, dry latrine m 3. Uncovered pit, dry latine
I I 4. No latrine m 5. o ther (S pec ify )..................................
11. How many children in your household are aged between 5 and 12 years?.................... (Insert num ber)( If zero, go to Q uestion 12)
11(a) How many o f these children aged 5 to 12 years do not regularly attend s c h o o l? .........(If zero, go to question 12)
11(b) What is the main reason your child / children do not regularly attending school? (M ark one box only)I I 1. illness or handicap E H 2. cannot afford the cost H 3. distance or access constraints m i 4. Insecurity H 5. child required to work m i 6. child not interested in school
I I 7. other (please sp e c ify )............................
12. If children between 6 m onths and 5 years old are present, conduct a MUAC test and record the results.
external walls? (M ark one box only)แ 3. tarpaulin walls
I I 6. No walls
Child #1 Child #2 Child #3 Child #4
MUAC number
13. What kind o f agricultural land does your household use for cultivation? (M ark a ll re levant boxes)u 1. No access to land for farming m i 2. small kitchen garden onlyแ 3. less than 2 acres, with no irrigation m 4. less than 2 acres with irrigationแ 5. between 2 and 5 acres, with no irrigation m 6. between 2 and 5 acres with irrigation
I I 7. over 5 acres, with no irrigation m 8. over 5 acres with irrigation14. Does your household currently own any o f these productive assets? (M ark a ll re levant boxes)
' ' 2. Simple tools (machete, hoe, etc)1. Farm machinery (trology / mini-tractor, etc)3. draught animals (buffalos)5. handicraft tools (weaving loom, backstrap etc)
7. c a r/tru c k
mm□m
4. Motorbike 6. boat
8. Other (please sp e c ify ).
15. How many animals does your fam ily currently own?u 1. buffalo or Ox แ 3. horse or mule
I I 5. goatI I 7. fish, prawn or crab farm
(ind ica te num ber in boxes)2. cow4. pig6. chicken, duck, goose or other poultry8. other (Please specify)....................................
16. What was your household’s main source o f cash income during the past month?u 1. Daily wages (casual labour)แ 3. sale o f agricultural cropsแ 5. petty tradeแ 7. collecting firewood or forest productsm 9. no cash income in past month
] 2. salary jobแ 4. sale o f livestock] 6. fishing / hunting] 8. Aid or remittances
I I 10. Other (please specify)
(M ark one box only)
17. เท the past month, approximately what proportion o f your total expenditures has been on food and other basicneeds? (Iden tify a ll expenditures, then use 10 stones to estim ate propo rtions)
E xpen d itu re s % expensesNo expenditures at all.
Food
Clothing & shelterHousehold goods (soap, kerosene, candles, etc)
Health care / medicine
EducationTransport
Farming / business investmentsDebt Repayment
Other (specify)
Total 100%
^ CHANGING REALITIES, POVERTY AND DISPLACEMENT เท South East Burma / M yanm ar

18. Do you currently have an outstanding debt to repay? (M ark one box only)I I 1 ) Yes (go to Question 23a) IZ Z I 2 ) No (Go to Question 24)
23a. What was the main reason for borrowing?u 1. food แ 3. education
I I 5. housing
(M ark one box only)] 2. health care] 4. invest in agriculture or business
I I 6. Other (please s p e c ify )..............................
19. Where has most o f the rice your household has consumed during the past month come from?แ 1. own rice crop EZI 2. purchased with cashแ 3. borrowed or barter exchange
I I 5. aid from an organization4. gift from family or friends 6. other (Please specify).....
(M ark one box only)
20. How long w ill your current rice stocks last?u 1. No rice stocks remaining
□ 3. one to three months□ 5. over six months
] 2. less than one month I I 4. four to six months
(M ark one box only)
21. During the past week, how many days have each o f these types o f food been eaten in your household?(W rite the num ber o f days each food was eaten)
Food item # days eaten in past 7 daysRiceOther cereals (eg bread / maize / wheat noodles)Roots / tubers (eg potatos)Pulses, beans, lentils, nuts, tofuFish (excluding fish paste)
EggsRed meat (cow, goat, pig)Poultry (chicken, duck)Vegetable oil, fatsMilk, cheese, yoghurtVegetablesFruitsSweets, sugarCondiments (salt, chilli, fish paste)Other (describe)...................................
22. What have been the main d ifficu lties o r shocks to your
u 1. loss o f employment / incomeแ 3. rats / pests damaged cropsแ 5. sicknessแ 7. restrictions on travel to fields or marketsแ 9. landminesแ 11. forced labourแ 13. forced displacement
I I 15. Other (please s p e c ify )..................................
livelihood during the past six months?(p rio ritise no m ore than tw o boxes)
] 2. floods / heavy rains / drought / landslides ] 4. Military patrols ] 6. commodity price increases ] 8. limited availability o f land ] 10. Armed conflict ] 12. Extortion or arbitrary taxation
I I 14. No shocks to livelihoods
23. If a serious crime (like assault or rape) is committed against someone in your household, how would you seek justice?(M ark a ll re levant boxes)
u Report to police u Report to village headman u Report to human rights monitors
I I Other (specify) : ... ........................................................
Report to the Tatmadaw Report to non-state armed groups Not sure
24. How do you know about the location o f landmine fields?แ Verbal warnings from Tatmadaw แ Signs on location from Tatmadaw แ Reports of human or animal casualties
I I Other (specify) : ............................................
(mark all relevant boxes)u verbal warnings from non-state armed groups ] Signs on location from non-state armed groups
I I other villagers warned me
25. If your household has had food shortages during the past month, how has your household coped with food shortages?(M ark a ll re levant boxes)
u 1. No food shortages in past month □ 2. buy cheaper, poor quality foodแ 3. eat rice soup / reduce consumption □ 4. skip entire days without eatingแ 5. support from friends and relatives □ 6. buy food on credit and incur debtsแ 7. sold assets □ 8. received aid from charities
I I 9. migrated in search o f income □ 10. Other (please s p e c ify )..................
Thankyou.
THE BORDER CONSORTIUM ( 3

APPENDIX 3 ะ ACRONYMS AND PLACE NAMES
ASEAN Association of South East Asian NationsBGF Border Guard ForceCBO community-based organisationCIDKP Committee for Internally Displaced Karen PeopleDKBA Democratic Karen Buddhist ArmyGoUM Government of the Union of MyanmarIB Infantry BattalionICRC International Committee of the Red CrossIDP internally displaced personIHLCA Integrated Household Living Conditions AssessmentKIO Kachin Indepdence OrganisationKNLP Kayan New Lands PartyKNPDP Kayaw National Peace and Development PartyKNPLF Karenni Nationalities Peoples Liberation FrontKNPP Karenni National Progressive PartyKNU Karen National UnionKNLA Karen National Liberation ArmyKORD Karen Office of Relief and DevelopmentKPC Karen Peace Council (or KNU/KNLA Peace Council)KSWDC Karenni Social Welfare and Development CentreLIB Light Infantry BattalionLID Light Infantry DivisionMICS Multiple Indicator Cluster SurveyMRDC Mon Relief and Development CommitteeNDAA National Democratic Alliance Army (Mongla)NGO non government organisationNMSP New Mon State PartyOCHA Office for the Coordination of Humanitarian AffairsPNLO PaO National Liberation OrganisationRCSS Restoration Council of Shan StateSHRF Shan Human Rights FoundationSPDC State Peace and Development CouncilSSA-S Shan State Army - SouthSSA-N Shan State Army - NorthSSPP Shan State Progressive PartySRDC Shan Relief and Development CommitteeTBC The Border ConsortiumUNDP United Nations Development ProgramUNICEF United Nations Childrens FundUNGA United Nations General AssemblyUWSA United Wa State ArmyWFP World Food Program
BURMA PLACE NAMES MYANMAR PLACE NAMESIrrawaddy Region Ayeyarwady RegionKarenni State Kayah StateKaren State Kayin StateKyaukgyi KyaukkyiMoulmein MawlamyineMergui MyeikPaan Hpa-anPapun HpapunPasaung HpasawngPegu Region Bago RegionSaiween River Thanlwin RiverSittaung River Sittoung RiverTavoy DaweiTenasserim Region Tanintharyi RegionTaungoo ToungooRangoon Yangon
CHANGING REALITIES, POVERTY AND DISPLACEMENT เท South East Burma / M yanm ar

The Border Consortium (TBC), a non-profit, non-governmental organisation, is an alliance of partners working together w ith displaced and conflict-affected people of South East Burma/Myanmar to address humanitarian needs and to support community driven solutions in pursuit of peace and development.